26
JUAN MIGUEL VELASQUEZ, SENIOR ASSOCIATE PABLO GUARDA, TRANSPORT RESEARCH INTERN RETHINKING THE NEXT GENERATION OF BRT IN CHINA July Webinar BRT Centre of Excellence
| Date post: | 22-Jan-2017 |
| Category: |
Engineering |
| Upload: | brtcoe |
| View: | 189 times |
| Download: | 4 times |

JUAN MIGUEL VELASQUEZ, SENIOR ASSOCIATE PABLO GUARDA, TRANSPORT RESEARCH INTERN
RETHINKING THE NEXT GENERATION OF BRT IN CHINA
July Webinar BRT Centre of Excellence
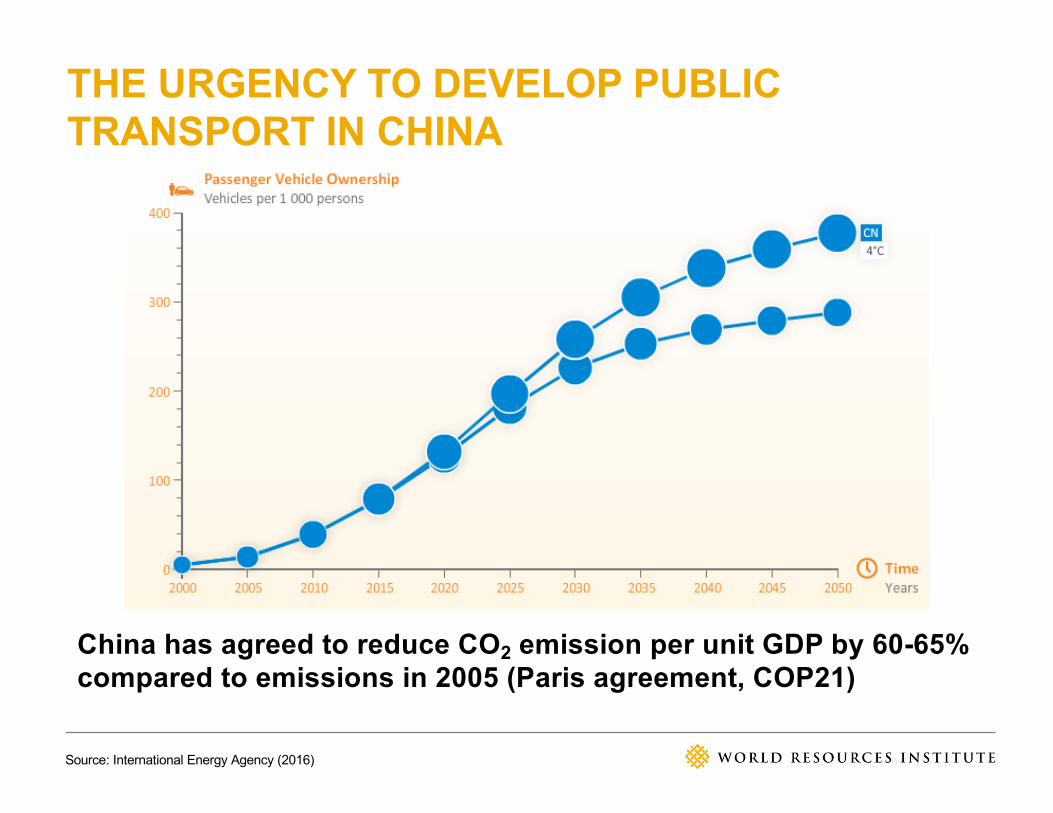
THE URGENCY TO DEVELOP PUBLIC
TRANSPORT IN CHINA
Source: International Energy Agency (2016)
China has agreed to reduce CO2 emission per unit GDP by 60-65%
compared to emissions in 2005 (Paris agreement, COP21)

EXPLOSIVE GROWTH OF BUS RAPID TRANSIT
IN CHINA
“Over the past eight years, China has added BRT lane-kmsat a faster pace than any part of the world” (Cervero, 2013).

… AND THE CHALLENGE OF BRT SERVICE
QUALITY?
CUSTReC (2016)
The main challenge today is not only increasing
the coverage of BRT but also improving service
quality and performance
STUDY OVERVIEW
• Compare design and performance indicatorsbetween Chinese and non-Chinese BRTs.
• Explore the relationship between the designfeatures of BRTs and their performance.
• Identify specific design elements to improve theperformance of Chinese BRTs.

METHODOLOGY
• Step I: Data collection and cleaning
• Step II: Assessment of strengths and opportunitiesof Chinese BRTs
• Step III: Quantification of the impact of BRT designimprovements on BRT performance

STEP I: DATA COLLECTION AND CLEANING
• Unit of analysis: System/Corridor (99 obs.)
• Data sources– BRTData.org– ITDP BRT Standard Editions 2013, 2014
• Representativeness– 21 countries, 59 cities. – More than 1,800 km of BRT
• Performance measurements– Productivity [pax/km], speed, frequency, throughput

ITDP BRT STANDARD
• Categories:
1. BRT Basics: minimal requirements to be qualified as a BRT
2. Service Planning3. Infrastructure4. Stations5. Communications6. Access and Integration7. Point Deductions
• Subcategories (38)
• Ranking: BRT Basic, Bronze, Silver, Gold
• Evaluations made by ITDP experts.

SAMPLE OF COUNTRIES
99 corridors/systems
1,775 kilometres
21countries
59 cities
2013 and2014
STEP II: ASSESSMENT OF STRENGTHS AND
OPPORTUNITIES
• Data: Evaluations of BRT corridors and systems in the ITDP Standard
• Output: Average score difference among the BRT design indicators between the Target and Benchmark groups.
• ANOVA: Assessment of the statistical difference in the average value of the indicators computed for the Target and Benchmark groups.
• Target group: Chinese BRT corridors/systems
• Benchmark group: Non-Chinese BRT corridors/systems

STRENGTHS AND OPPORTUNITIES BY CATEGORY
CHINESE AND NON-CHINESE BRT SYSTEMS
1. StrengthinChineseBRTs:PositiveandSignificantDifference(Blue)2. OpportunitiesinChineseBRTs:NegativeandSignificantDifference(Blue)3. Nodifference:Non-statisticallySignificantDifference(Gray)

STRENGTHS AND OPPORTUNITIES BY SUBCATEGORY
CHINESE AND NON-CHINESE BRT SYSTEMS (I)
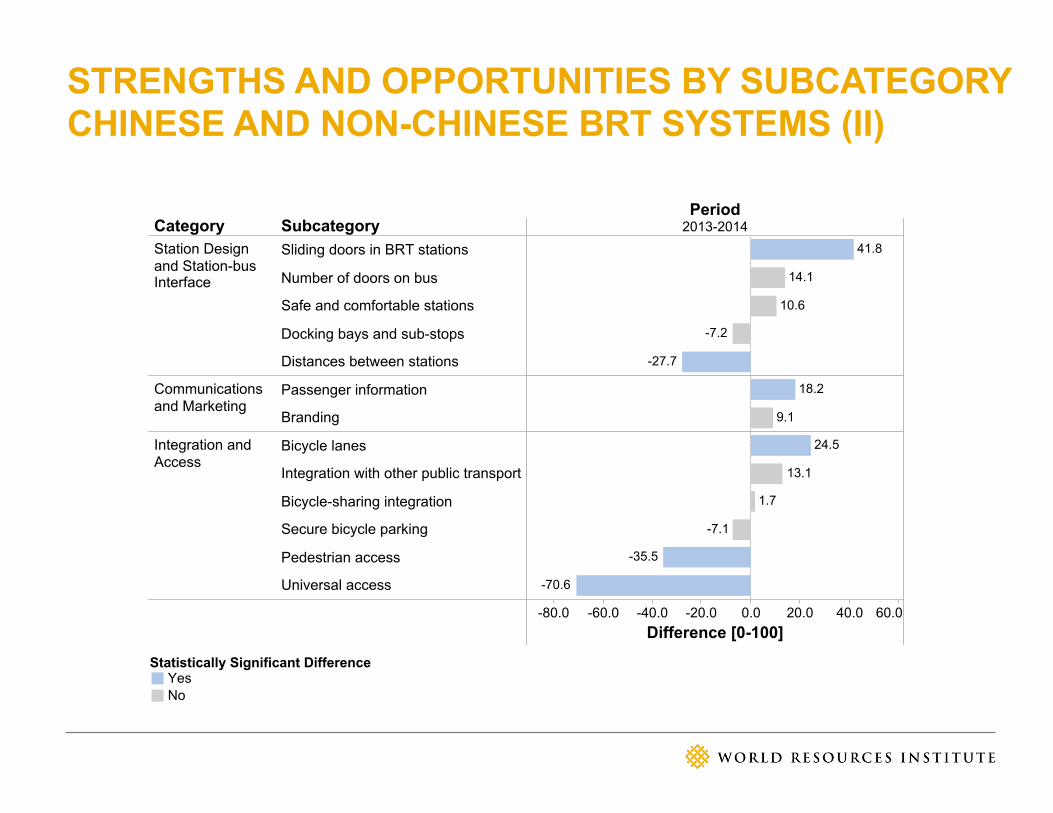
STRENGTHS AND OPPORTUNITIES BY SUBCATEGORY
CHINESE AND NON-CHINESE BRT SYSTEMS (II)
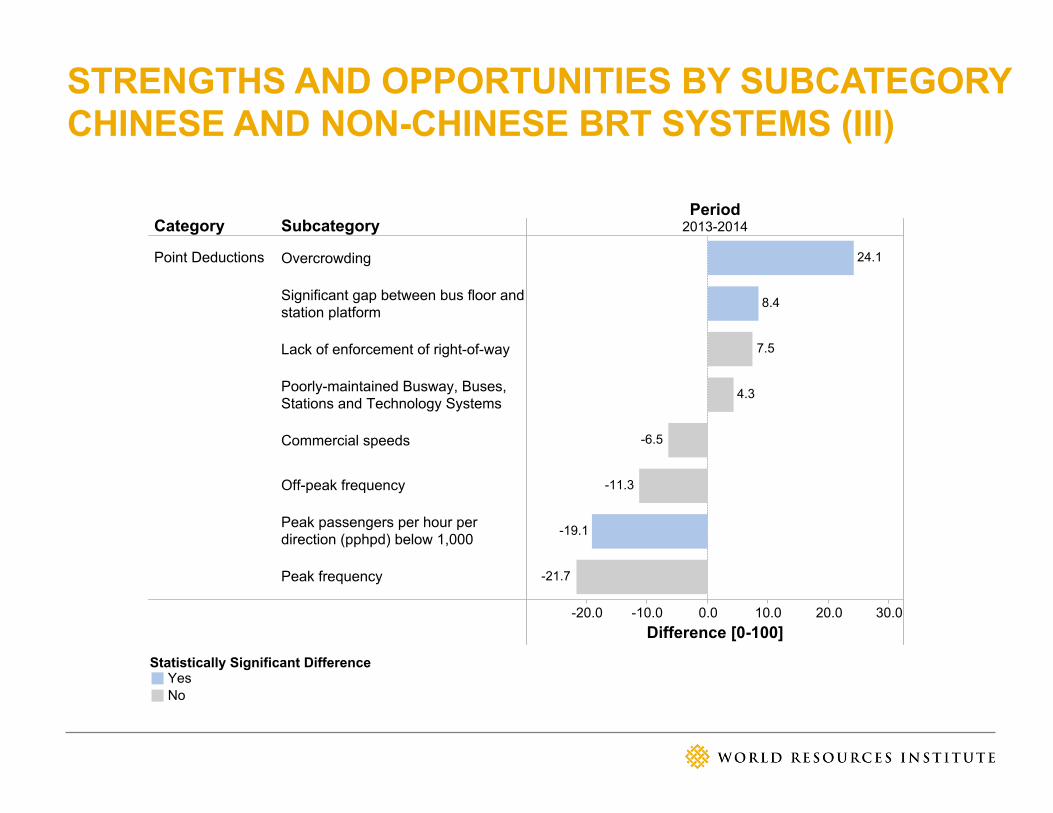
STRENGTHS AND OPPORTUNITIES BY SUBCATEGORY
CHINESE AND NON-CHINESE BRT SYSTEMS (III)
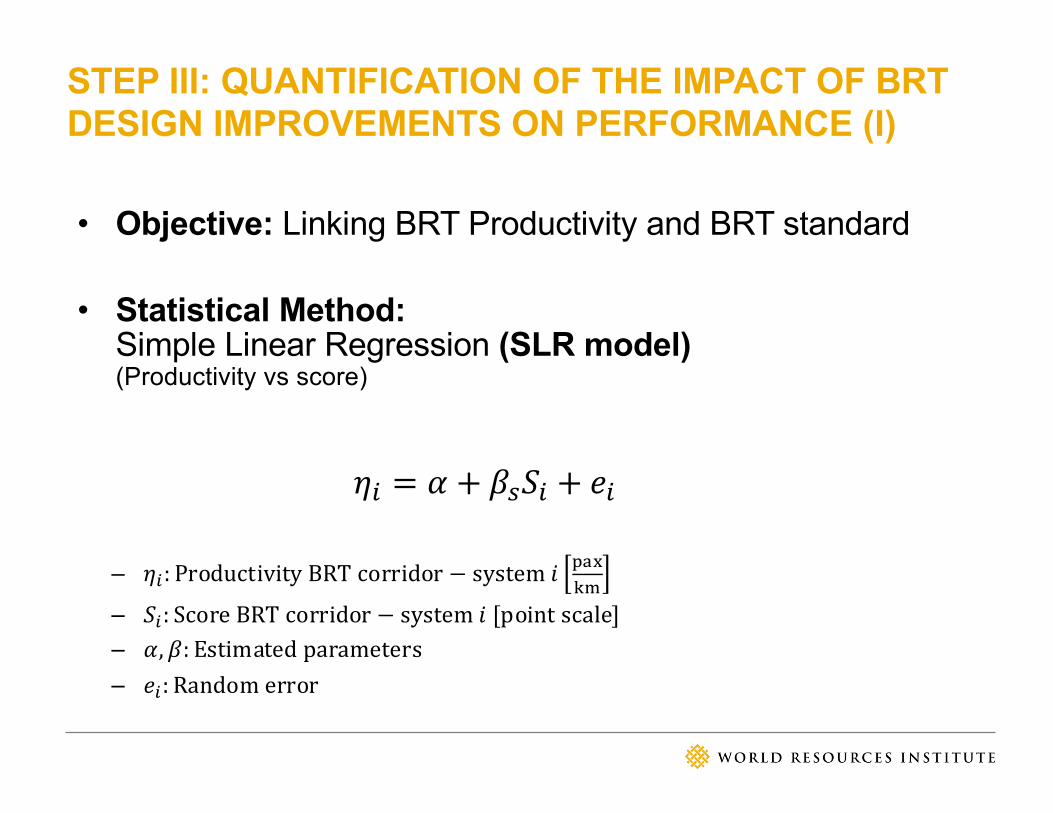
STEP III: QUANTIFICATION OF THE IMPACT OF BRT
DESIGN IMPROVEMENTS ON PERFORMANCE (I)
• Objective: Linking BRT Productivity and BRT standard
• Statistical Method:Simple Linear Regression (SLR model)(Productivity vs score)
!" = $ + &'(" + )"
– !": ProductivityBRTcorridor−system=>?@AB
– (": ScoreBRTcorridor−system=[pointscale]– $, &: Estimatedparameters– )": Randomerror

STEP III: QUANTIFICATION OF THE IMPACT OF BRT
DESIGN IMPROVEMENTS ON PERFORMANCE (II)
• Objective: Linking BRT Productivity and BRT standard
• Statistical Method:
Multiple Linear Regression (MLR model)(Productivity vs score by category)
!" = $L + M &NO(",O
�
O∈R
+ )"
– !": AverageproductivityBRTcorridor−system=>?@AB
– (",O: ScoreBRTcorridor−system=incategoryd[pointscale]– $, &: Estimatedparameters– )": Randomerror
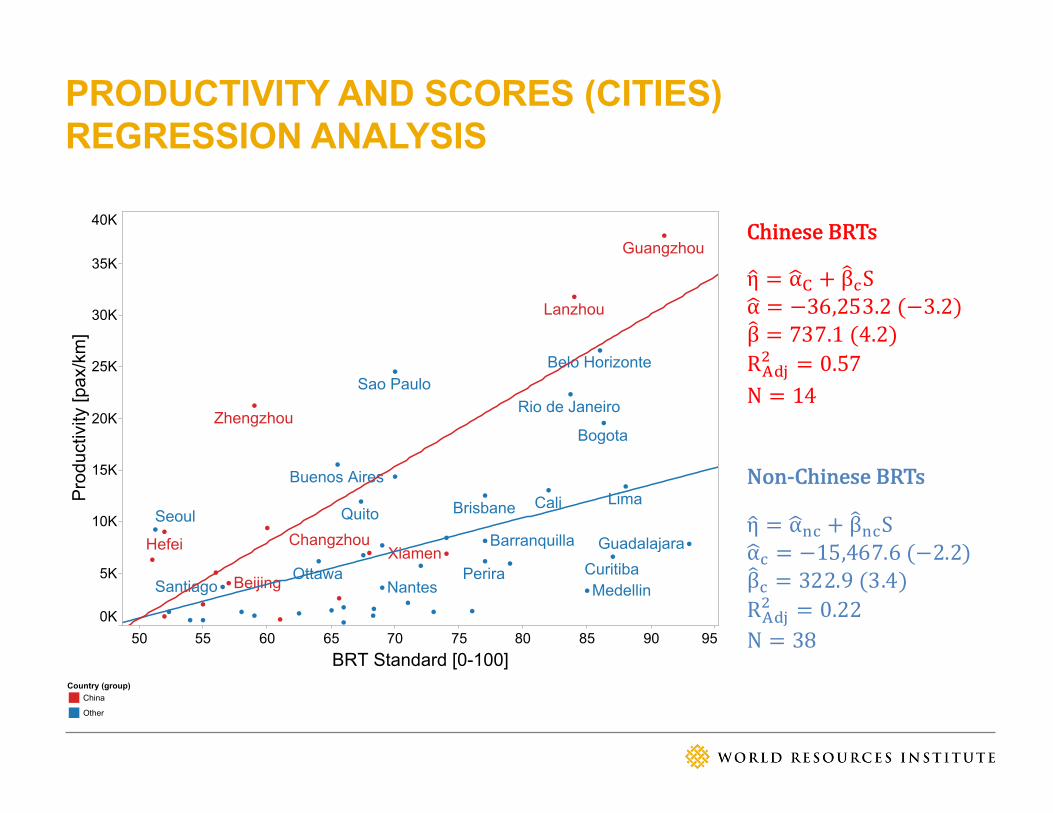
PRODUCTIVITY AND SCORES (CITIES)
REGRESSION ANALYSIS
ChineseBRTs
ηL = αYZ + β\]SαY = −36,253.2(−3.2)β\ = 737.1(4.2)Rhijk = 0.57N = 14
Non-ChineseBRTs
ηL = αYo] + β\o]SαY] = −15,467.6(−2.2)β\] = 322.9(3.4)Rhijk = 0.22N = 38

PRODUCTIVITY AND SCORES (CORRIDOR / SYSTEM)
REGRESSION MODEL RESULTS
Variable (t-test)MLR model SLR model
China No China All China No China All
β\' (Score) - - - 673.2 (4.3) 272.2 (4.4) 328.2 (5.7)
β\r (BRT Basics) 154.5 (0.8) 44.5 (0.6) 35.2 (0.5) - - -
β\k (Service planning) 116.0 (1.1) 207.6 (5.1) 172.2 (4.5) - - -
β\s (Infrastructure) 93.6 (0.9) 88.2 (2.3) 54.0 (1.5) - - -
β\t (Station Design) 189.5 (1.2) -1.3 (0.0) 74.5 (1.5) - - -
β\u (Communications) -57.4 (-0.6) -35.5 (-0.9) -50.2 (-1.5) - - -
β\v (Access & Integration) 283.2 (2.5) 67.3 (1.3) 112.3 (2.9) - - -
β\w (Point Deductions) 277.0 (0.9) -22.5 (-0.2) -25.8 (-0.3) - - -
$ (Intercept) -33,584.8 (-2.7) -16,861.6 (-3.5) -17,372.0 (-4.2) -34,267.2 (-3.4) -10,158.8 (-2.3) -13,789.5 (-3.4)
x 20 72 92 20 72 92
yzijk 0.62 0.39 0.36 0.48 0.21 0.26
The MLR model estimated with data from Chinese BRTs will be
used for our further analysis

AVERAGE IMPACT IN BRT PRODUCTIVITY
BY SUBCATEGORY (STRENGTHS)

AVERAGE IMPACT IN BRT PRODUCTIVITY
BY SUBCATEGORY (OPPORTUNITIES)
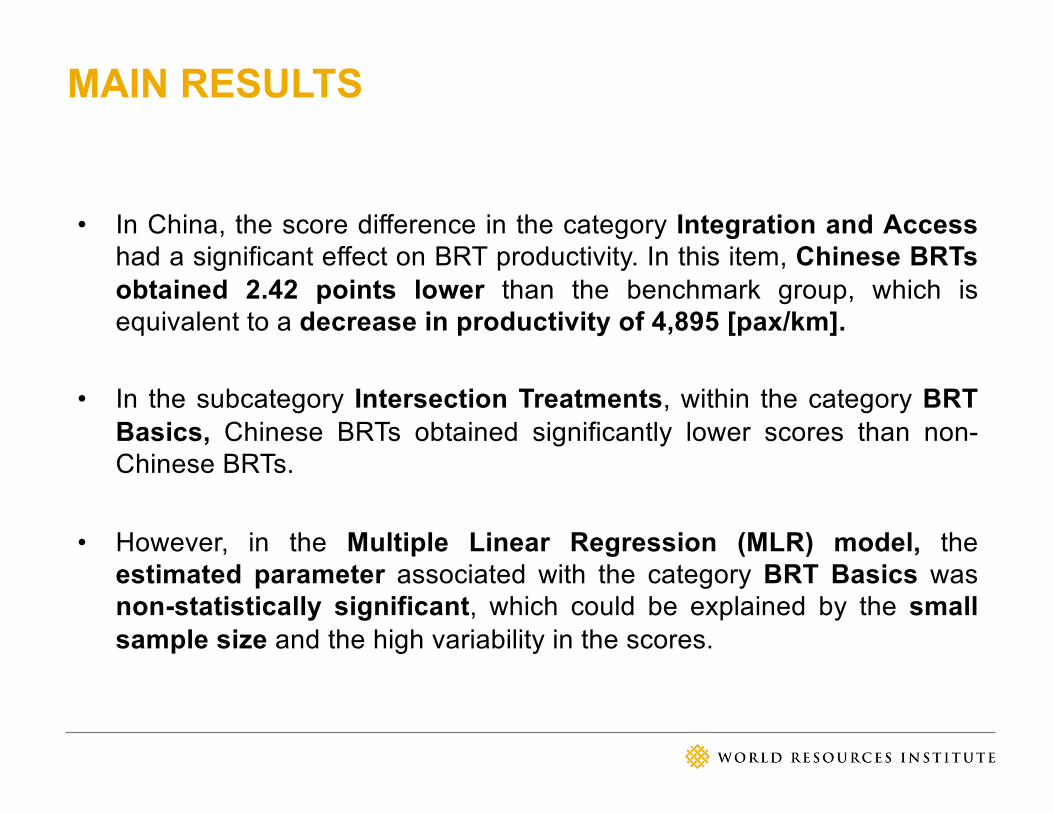
MAIN RESULTS
• In China, the score difference in the category Integration and Access
had a significant effect on BRT productivity. In this item, Chinese BRTs
obtained 2.42 points lower than the benchmark group, which isequivalent to a decrease in productivity of 4,895 [pax/km].
• In the subcategory Intersection Treatments, within the category BRT
Basics, Chinese BRTs obtained significantly lower scores than non-Chinese BRTs.
• However, in the Multiple Linear Regression (MLR) model, theestimated parameter associated with the category BRT Basics wasnon-statistically significant, which could be explained by the small
sample size and the high variability in the scores.

CONCLUSIONS AND POLICY IMPLICATIONS
• This study identifies priorities to improve the standard of
Chinese BRTs based on international practices.
• The use of regression models allows to quantify thedifferences of BRT design quality in terms of BRT
productivity (pax/km).
• This study integrated two large and public datasets(BRTData.org and ITDP Standards) to perform thequantitative analysis.

FURTHER RESEARCH
- Include data from the ITDP Standard, Edition2016 to increase the sample size
- Perform sensitivity analysis
- Implement an online dashboard

ACKNOWLEDGEMENTS
• Bus Rapid Transit Centre of Excellence (BRT-CoE) funded by VREF

WORK CITED
• Cervero, R., 2013. Bus Rapid Transit (BRT): An Efficient and Competitive Mode of PublicTransport, IURD Working Paper 2013-01. http://escholarship.org/uc/item/4sn2f5wc.pdf
• Fjellstrom, K., 2010. Bus Rapid Transit in China. Built Environment 36, 363–374.http://dx.doi.org/10.3141/2193-03.
• Munoz, J.C. and Paget-Seekins, L., 2016. Restructuring Public Transport Through BusRapid Transit: An International and Interdisciplinary Perspective. Policy Press, Bristol,United Kingdom.
• Pucher, J., Peng, Z., Mittal, N., Zhu, Y. and Korattyswaroopam, N., 2007. Urban TransportTrends and Policies in China and India: Impacts of Rapid Economic Growth. TransportReviews 27, 379–410. http://dx.doi.org/10.1080/01441640601089988.
• Schwenk, J.C., 2002. Evaluation guidelines for bus rapid transit demonstration projects (RPRT). Federal Transit Administration (FTA), U.S. Department of Transportation. http://ntl.bts.gov/lib/29000/29200/29273/13831_files/13831.pdf

JUAN MIGUEL VELASQUEZPABLO GUARDA
RETHINKING THE NEXT GENERATION OF BRT IN CHINA
July Webinar BRT Centre of Excellence


