26
REVIEW OF ENVIRONMENTAL MONITORING PROGRAMS DUBBO SEWAGE TREATMENT PLANT, BALLIMORE AND WONGARBON (PINE AVON) PREPARED FOR DUBBO CITY COUNCIL JUNE 2015

REVIEW OF ENVIRONMENTAL MONITORING PROGRAMS
DUBBO SEWAGE TREATMENT PLANT, BALLIMORE AND WONGARBON (PINE AVON)
PREPARED FOR
DUBBO CITY COUNCIL
JUNE 2015

REVIEW OF ENVIRONMENTAL
MONITORING PROGRAMS
DUBBO SEWAGE TREATMENT PLANT, BALLIMORE AND WONGARBON (PINE AVON)
PREPARED FOR:
DUBBO CITY COUNCIL
JUNE 2015
"Type in orange or dubbo and click F3"
POSTAL ADDRESS PO BOX 1963 ORANGE NSW 2800
LOCATION 154 PEISLEY STREET ORANGE NSW 2800
TELEPHONE 02 6393 5000 FACSIMILE 02 6393 5050
EMAIL [email protected] WEB SITE WWW.GEOLYSE.COM

214257_REP_001A.DOCX
Report Title: Review of Environmental Monitoring Programs
Project: Dubbo Sewage Treatment Plant, Ballimore and Wongarbon (Pine Avon)
Client: Dubbo City Council
Report Ref.: 214257_REP_001A.docx
Status: Final
Issued: 9 June 2015
Geolyse Pty Ltd and the authors responsible for the preparation and compilation of this report declare that we do not have, nor expect to have a beneficial interest in the study area of this project and will not benefit from any of the recommendations outlined in this report.
The preparation of this report has been in accordance with the project brief provided by the client and has relied upon the information, data and results provided or collected from the sources and under the conditions outlined in the report.
All data and information contained within this report is prepared for the exclusive use of Dubbo City Council to accompany this report for the land described herein and are not to be used for any other purpose or by any other person or entity. No reliance should be placed on the information contained in this report for any purposes apart from those stated therein.
Geolyse Pty Ltd accepts no responsibility for any loss, damage suffered or inconveniences arising from, any person or entity using the plans or information in this study for purposes other than those stated above.

214257_REP_001A.DOCX
TABLE OF CONTENTS
1.0 INTRODUCTION ........................................................................................ 1
2.0 DUBBO SEWAGE TREATMENT PLANT ................................................. 1
2.1 BACKGROUND .................................................................................................................. 1 2.2 GROUNDWATER MONITORING RESULTS REVIEW ..................................................... 2 2.3 RECOMMENDATIONS....................................................................................................... 7
3.0 BALLIMORE WATER SUPPLY ................................................................. 8
3.1 BACKGROUND .................................................................................................................. 8 3.2 MONITORING RESULTS REVIEW .................................................................................... 9 3.3 RECOMMENDATIONS..................................................................................................... 14
4.0 WONGARBON (PINE AVON) SEWERAGE SCHEME ............................ 15
4.1 BACKGROUND ................................................................................................................ 15 4.2 MONITORING RESULTS REVIEW .................................................................................. 16 4.3 RECOMMENDATIONS..................................................................................................... 20
5.0 SUMMARY ............................................................................................... 20
6.0 REFERENCES ......................................................................................... 22
REVIEW OF ENVIRONMENTAL MONITORING PROGRAMS DUBBO SEWAGE TREATMENT PLANT, BALLIMORE AND WONGARBON (PINE AVON)
DUBBO CITY COUNCIL
PAGE 1 214257_REP_001A.DOCX
1.0 INTRODUCTION
Geolyse has been engaged by Dubbo City Council to conduct a review of the environmental monitoring
programs at the Council owned and operated facilities: Dubbo Sewage Treatment Plant, Ballimore
Water Supply, and Wongarbon (Pine Avon) Sewerage Scheme.
The objective of this environmental monitoring review was to establish the viability of continuing the
existing monitoring programs, and provide recommendations with regards to scope reduction and/or
improvement.
2.0 DUBBO SEWAGE TREATMENT PLANT
2.1 BACKGROUND
The groundwater monitoring network at the Dubbo Sewage Treatment Plant (Dubbo STP) has been
established over a number of years, as a result of groundwater investigations and conditions of consent
which required monitoring of the effluent holding structures. Groundwater monitoring is not a
requirement of Environment Protection Licence 3850 under which Dubbo STP operates.
Initial groundwater monitoring commenced in June 1997 and continued through to June 2000; it
incorporated:
• Eight (8) monitoring piezometers;
• Monthly groundwater levels and salinity measurements; and
• Quarterly groundwater quality sampling and analysis for 15 quality parameters.
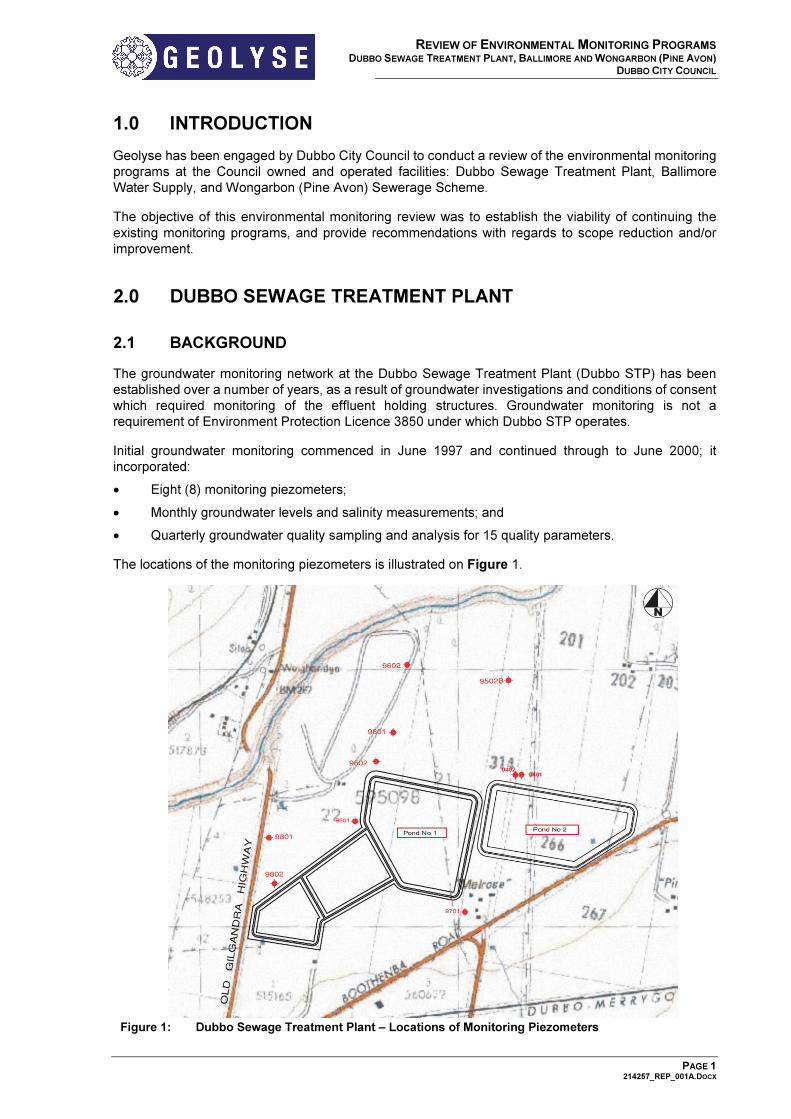
The locations of the monitoring piezometers is illustrated on Figure 1.
Figure 1: Dubbo Sewage Treatment Plant – Locations of Monitoring Piezometers

REVIEW OF ENVIRONMENTAL MONITORING PROGRAMS DUBBO SEWAGE TREATMENT PLANT, BALLIMORE AND WONGARBON (PINE AVON)
DUBBO CITY COUNCIL
PAGE 2 214257_REP_001A.DOCX
The objectives of the initial monitoring program, as required by a condition of consent for the construction of Holding Pond No 1 (Terra Consulting, 2000), were:
• To demonstrate the effectiveness of the storage pond’s [Holding Pond No 1] clay liner; and
• To provide early warning in the event of leakage, allowing remedial measures to be implemented
before off-site impacts occur.
Early monitoring recorded up nitrate and salinity contamination close to the new Holding Pond No 1 and the disused detention ponds. Therefore a secondary objective for the monitoring program was to determine the source of the nitrate and increased salinity in the groundwater.
Monitoring recommenced in August 2001 and in consultation with the Environment Protection Authority, the monitoring program was reduced to quarterly measurement of groundwater levels and a quality indicator suite (pH, electrical conductivity, nitrate, ammonia and total phosphorous). This monitoring program has continued to date, with the latest round conducted in November 2014.
The monitoring network was expanded in August 2004 to include two new monitoring piezometers adjacent to Holding Pond No 2. The current groundwater monitoring network is illustrated in Figure 1 and comprises 10 piezometers in total: 9 piezometers are located on the Dubbo STP site; and one on “Bungaribee” (9502B).
2.2 GROUNDWATER MONITORING RESULTS REVIEW
Geolyse has conducted a review of the monitoring data collected in the period from 2009 to 2014. The review incorporates a qualitative risk assessment against default trigger values for protection of aquatic ecosystems provided in the Australian and New Zealand Environment and Conservation Council (ANZECC) and Agriculture and Resource Management Council of Australia and New Zealand (ARMCANZ) Australian and New Zealand Guidelines for Fresh and Marine Water Quality, 2000. These default trigger values have been selected on the following basis:
• The average discharge rate of the surface water receptor, Talbragar River, is relatively low at 49,181 ML/year (NSW Office of Water, Talbragar River at Elong Elong - Period of Record Daily
Flow Summary Report, accessed April 2015), and as such, aquatic ecosystems (i.e. species composition and abundance) are considered vulnerable to degradation by physical and chemical stressors; and
• There is currently no surface water quality monitoring data for Talbragar River. Accordingly, a conservative inference between the quality of groundwater and surface water has been made.
Two (2) groundwater bores registered for ‘Stock’ purposes are located on the site, and trigger values for these receptors have also been considered in this review. It is noted that default trigger values for the protection of aquatic ecosystems are, in general, considerably more conservative than those for protection of drinking water for humans and livestock.
Where exceedances of trigger values have been identified for a monitoring parameter that may result in impacts to the Talbragar River located approximately 420 m north-west of the holding ponds, a trend analysis has been also conducted, incorporating ‘Mann-Kendall’ statistical analysis. A statistically significant trend (at 95% confidence limit) is one with a ‘p-value’ of less than 0.05.
Hydrogeology
Groundwater is generally present at between 9.0 and 16.0 metres below ground level (mbgl) and flows from east to west across the site, towards Talbragar River. Based on the corrected groundwater elevations recorded at the site being between 255 and 248 metres Australian height datum (mAHD), and the elevation of Talbragar River (between 240 and 260 mAHD, Spatial Information eXchange – NSW Land & Property Information), connectivity between groundwater and Talbragar River is considered likely to be present.
Groundwater flow contours for November 2013 and November 2014 are illustrated on Figure 2 and 3.

REVIEW OF ENVIRONMENTAL MONITORING PROGRAMS DUBBO SEWAGE TREATMENT PLANT, BALLIMORE AND WONGARBON (PINE AVON)
DUBBO CITY COUNCIL
PAGE 3 214257_REP_001A.DOCX
Figure 2: Groundwater Flow Contours, Nov-2013 Figure 3: Groundwater Flow Contours, Nov-2014
pH
pH values for groundwater monitored in all piezometers were recorded to be in the range of 5.97 (0402, November 2010) to 8.86 (9501, November 2014). Default trigger values for pH in ‘slightly disturbed ecosystems’ in NSW upland rivers (i.e. > 150 m altitude), as provided in ANZECC/ARMCANZ (2000), set a lower limit of 6.5 and an upper limit of 8.0. A livestock drinking water guideline range of 6.5 to 8.5 (NSW Department of Primary Industries, Water requirements for sheep and cattle, 2007) has also been considered in this review.
pH values have predominantly been within the ANZECC/ARMCANZ (2000) upper and lower limits, however pH values below the lower limit have been recorded at eastern piezometers 9502B and 0402 with some regularity.
An increase in pH to above the ANZECC/ARMCANZ and NSW DPI upper limit was recorded in piezometer 9501 adjacent to Holding Pond No. 1 in the most recent monitoring round, however no discernible trend could be inferred based on the current data.
Electrical Conductivity
The average electrical conductivity (EC) of groundwater from 2009 to 2014 ranged from 1,003 µS/cm (piezometer 9701) to 8,760 µS/cm (piezometer 9502). The ANZECC/ARMCANZ default trigger value for EC in ‘slightly disturbed ecosystems’ in NSW upland rivers is 350 µS/cm, which was consistently exceeded at all piezometers.
Whilst spatial variability in EC between piezometers has been recorded at the site, a low degree of temporal variability at each piezometer exists, with the coefficient of variation (the ratio of the standard deviation to the mean) calculated to be significantly below 1.0 at all piezometers (ranging from 0.28 at 9502B to 0.02 at 9601) for data collected from 2009 to 2014. Elevated EC has predominantly been recorded at piezometer 9502, however minimal fluctuations have been identified and no evidence of migration has been observed.
Comparison with background (i.e. upstream) EC readings from Talbragar River may be more indicative of potential impacts to aquatic ecosystems resulting from elevated salinity in groundwater, with consideration to the river’s flow rate.
The average EC of groundwater from 2009 to 2014 equates to a ‘total dissolved solids’ (TDS) range of 690 mg/L to 5,936 mg/L. The majority of TDS concentrations were considered suitable for consumption by livestock, with the exception of 9502 which may cause some loss of production in cattle and poultry (ANZECC/ARMCANZ, 2000).
3400 3600 3800 4000 4200 4400
2400
2600
2800
3000
3200
9501
9502
9601
9602
9701
9502B
9801
9802
04010402
250
250.5
251
251.5
252
27-Nov-2013
3400 3600 3800 4000 4200 4400
2400
2600
2800
3000
3200
9501
9502
9601
9602
9701
9502B
9801
9802
04010402
249.5
2
50
250.5
251
251.5
252
252. 5
25-Nov-2014
REVIEW OF ENVIRONMENTAL MONITORING PROGRAMS DUBBO SEWAGE TREATMENT PLANT, BALLIMORE AND WONGARBON (PINE AVON)
DUBBO CITY COUNCIL
PAGE 4 214257_REP_001A.DOCX
Nitrate
Nitrate concentrations in groundwater samples collected from piezometers at the site were reported to range from below the laboratory limit of reporting (LOR, 0.01 mg/L) in 9502B (November 2010) to 18.40 mg/L in 9802 (November 2011). The ANZECC/ARMCANZ default trigger value for nitrate in ‘slightly disturbed ecosystems’ in NSW upland rivers is 0.015 mg/L and was generally exceeded in groundwater samples collected from all piezometers.
The highest concentrations of nitrate in groundwater have been consistently recorded in piezometers 9801 and 9802, at the south-western extent of the investigation area. These impacts have not been delineated to the west, downgradient and towards Talbragar River.
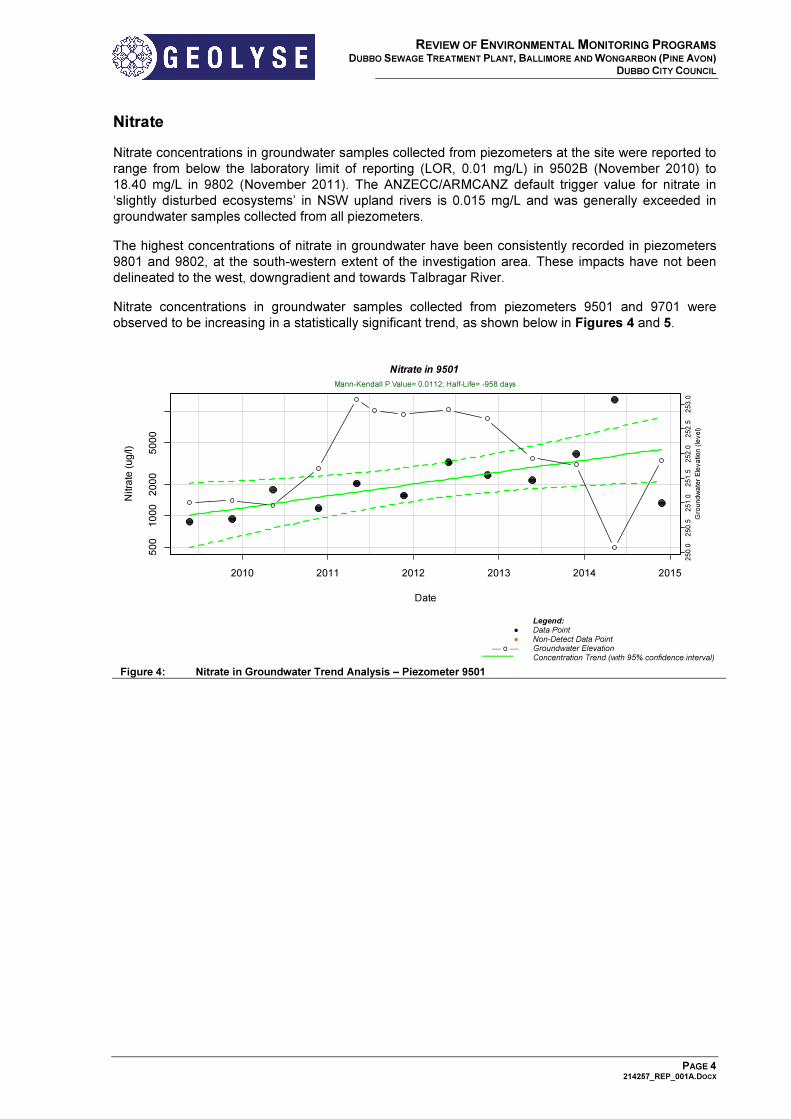
Nitrate concentrations in groundwater samples collected from piezometers 9501 and 9701 were observed to be increasing in a statistically significant trend, as shown below in Figures 4 and 5.
●
●
o
Legend: Data Point Non-Detect Data Point Groundwater Elevation Concentration Trend (with 95% confidence interval)
Figure 4: Nitrate in Groundwater Trend Analysis – Piezometer 9501
Date
Nitra
te (ug/l)
2010 2011 2012 2013 2014 2015
500
1000
2000
5000
Nitrate in 9501
Mann-Kendall P.Value= 0.0112; Half-Life= -958 days
25
0.0
25
0.5
25
1.0
25
1.5
25
2.0
25
2.5
25
3.0
Gro
un
dw
ate
r E
leva
tion
(le
ve
l)
REVIEW OF ENVIRONMENTAL MONITORING PROGRAMS DUBBO SEWAGE TREATMENT PLANT, BALLIMORE AND WONGARBON (PINE AVON)
DUBBO CITY COUNCIL
PAGE 5 214257_REP_001A.DOCX
●
●
o
Legend: Data Point Non-Detect Data Point Groundwater Elevation Concentration Trend (with 95% confidence interval)
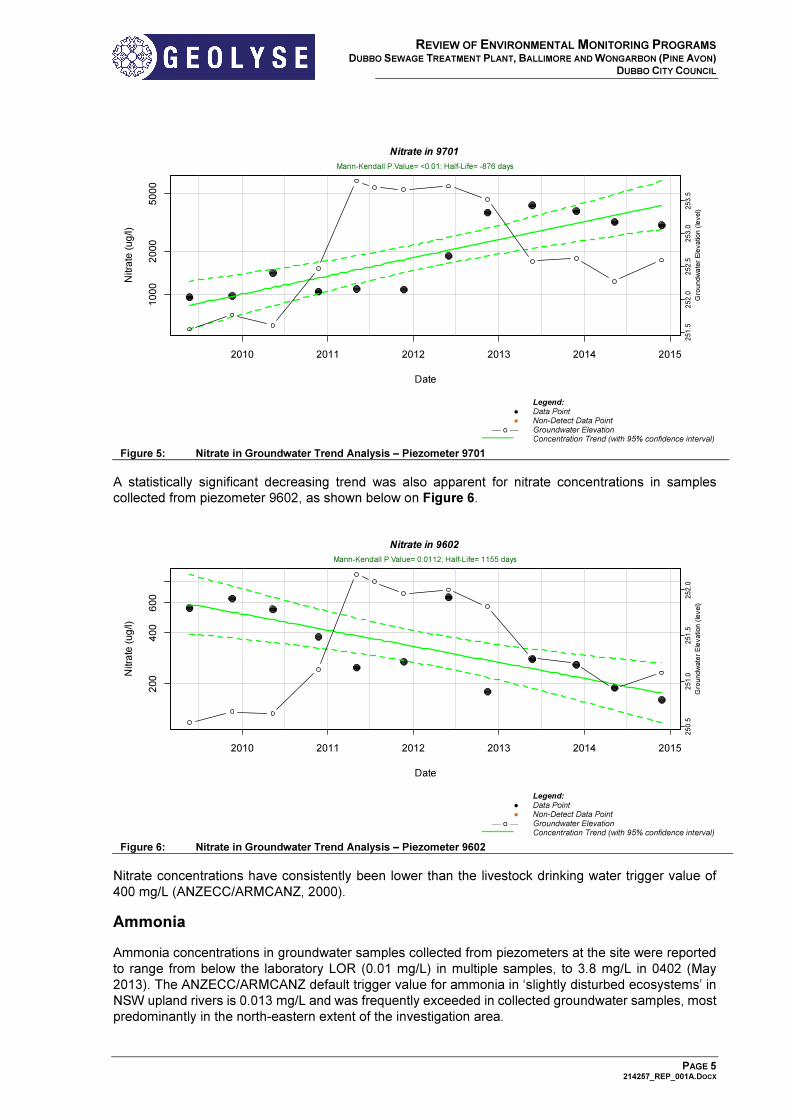
Figure 5: Nitrate in Groundwater Trend Analysis – Piezometer 9701
A statistically significant decreasing trend was also apparent for nitrate concentrations in samples collected from piezometer 9602, as shown below on Figure 6.
●
●
o
Legend: Data Point Non-Detect Data Point Groundwater Elevation Concentration Trend (with 95% confidence interval)
Figure 6: Nitrate in Groundwater Trend Analysis – Piezometer 9602
Nitrate concentrations have consistently been lower than the livestock drinking water trigger value of 400 mg/L (ANZECC/ARMCANZ, 2000).
Ammonia
Ammonia concentrations in groundwater samples collected from piezometers at the site were reported to range from below the laboratory LOR (0.01 mg/L) in multiple samples, to 3.8 mg/L in 0402 (May 2013). The ANZECC/ARMCANZ default trigger value for ammonia in ‘slightly disturbed ecosystems’ in NSW upland rivers is 0.013 mg/L and was frequently exceeded in collected groundwater samples, most predominantly in the north-eastern extent of the investigation area.
Date
Nitra
te (ug/l)
2010 2011 2012 2013 2014 2015
1000
2000
5000
Nitrate in 9701
Mann-Kendall P.Value= <0.01; Half-Life= -876 days
25
1.5
25
2.0
25
2.5
25
3.0
25
3.5
Gro
un
dw
ate
r E
leva
tion
(le
ve
l)
Date
Nitra
te (ug/l)
2010 2011 2012 2013 2014 2015
200
400
600
Nitrate in 9602
Mann-Kendall P.Value= 0.0112; Half-Life= 1155 days
25
0.5
25
1.0
25
1.5
25
2.0
Gro
un
dw
ate
r E
leva
tion
(le
ve
l)

REVIEW OF ENVIRONMENTAL MONITORING PROGRAMS DUBBO SEWAGE TREATMENT PLANT, BALLIMORE AND WONGARBON (PINE AVON)
DUBBO CITY COUNCIL
PAGE 6 214257_REP_001A.DOCX
The highest concentrations of ammonia in groundwater have been consistently recorded in piezometers 0401, 0402 and 9502B, at the north-eastern extent of the investigation area. Based on the calculated groundwater flow direction, these impacts are considered to be attenuating to some degree to the west, downgradient and towards Talbragar River. There is currently no guideline value for ammonia in livestock drinking water, however ammonia groundwater concentration in all piezometers were below the conservative human drinking water aesthetic guideline value of 0.5 mg/L, as listed in the National Health and Medical Research Council (NHMRC) and Natural Resource Management Ministerial Council (NRMMC), National Water Quality Management Strategy – Australian Drinking Water Guidelines, (2011, updated 2015) in the most recent groundwater monitoring round.
Ammonia concentrations in groundwater samples collected from piezometer 0402 were observed to be increasing in a statistically significant trend for the period from 2009 to 2014, as shown below in Figure 7, however it is noted that ammonia concentrations for the two most recent groundwater monitoring events have decreased from the peak concentrations recorded in 2012-2013.
●
●
o
Legend: Data Point Non-Detect Data Point Groundwater Elevation Concentration Trend (with 95% confidence interval)
Figure 7: Ammonia in Groundwater Trend Analysis – Piezometer 0402
Total Phosphorous
Total Phosphorus concentrations in groundwater samples collected from piezometers at the site were reported to range from 0.01 mg/L in 9802 (May 2011), to 13.2 mg/L in 0402 (November 2010). The ANZECC/ARMCANZ default trigger value for total phosphorous in ‘slightly disturbed ecosystems’ in NSW upland rivers is 0.02 mg/L and was generally exceeded in groundwater samples collected from all piezometers. No stock or human health drinking water guidelines are currently available and considered applicable for this review.
The highest concentrations of total phosphorous in groundwater have been consistently recorded in piezometer 0401 at the eastern extent of the investigation area. Based on the calculated groundwater flow direction, these impacts are considered to be attenuating to the west, downgradient and towards Talbragar River.
Whilst no statistically significant trend for total phosphorous concentrations was apparent in any piezometer at the site, all piezometers generally exhibited a decreasing trend. Figures 8 and 9 below shows the generally decreasing total phosphorous concentrations at the site, from 2009 to 2014.
Date
Am
monia
(ug/l)
2010 2011 2012 2013 2014 2015
50
200
1000
5000
Ammonia in 0402
Mann-Kendall P.Value= 0.0441; Half-Life= -534 days
25
1.5
25
2.0
25
2.5
25
3.0
25
3.5
Gro
un
dw
ate
r E
leva
tion
(le
ve
l)

REVIEW OF ENVIRONMENTAL MONITORING PROGRAMS DUBBO SEWAGE TREATMENT PLANT, BALLIMORE AND WONGARBON (PINE AVON)
DUBBO CITY COUNCIL
PAGE 7 214257_REP_001A.DOCX
Figure 8: Total Phosphorous in Groundwater –
Spatial Distribution May-2009
Figure 9: Total Phosphorous in Groundwater –
Spatial Distribution Nov-2014
2.3 RECOMMENDATIONS
The current groundwater monitoring schedule at the Dubbo STP is biannual monitoring (i.e. twice annually) for groundwater elevation, pH, EC, nitrate, ammonia and total phosphorous. Based on the monitoring results for the period from 2009 to 2014, the monitoring schedule may be amended as follows, whilst still meeting the objectives of the monitoring program:
• No reduction in the number of piezometers in the current network is considered warranted, based on existing piezometers:
– showing elevated concentrations and/or statistically significant increasing trends of impacted groundwater (9501, 9502B, 9701, 9801, 9802, 0401, 0402); and/or
– being located proximal to holding ponds (0401, 0402, 9501, 9502, 9701, 9802); and/or
– being in locations downgradient of other piezometers where trigger levels have been exceeded (9601, 9602).
• Continue biannual monitoring of groundwater elevation and physical parameters of pH and EC. This may be monitored real-time in the field using a water quality probe, and no sampling for laboratory analysis of these parameters is considered necessary;
• Biannual monitoring of the Talbragar River at upgradient, midstream and downgradient locations for pH and EC. This may be monitored real-time in the field using a water quality probe, and no sampling for laboratory analysis of these parameters is considered necessary;
• Annual groundwater sampling and analysis of nitrate, ammonia and total phosphorous at all piezometers; and
• Annual surface water sampling of the Talbragar River at upgradient, midstream and downgradient locations, and analysis for nitrate, ammonia and total phosphorous.
Geolyse recommends conducting the above monitoring program for a period of 2 years, consisting of 2 annual and 2 biannual monitoring events. At the conclusion of the monitoring program, an assessment may be undertaken to establish whether groundwater impacted by the Dubbo STP is likely to adversely affect the water quality of Talbragar River.
3200 3400 3600 3800 4000 4200 4400
2400
2600
2800
3000
3200
9501
9502
9601
9602
9701
9502B
9801
9802
04010402
249.4
249.6
24
9.
8 2
50
250.2
250.4
250
. 6
250
.8
251
251.2
251.4
251.6
720
780
110
240
710
250
210
260
10800290
<0401>
Total_Phosphorous : 20-May-2009
0
5
10
25
50
75
100
200
400
800
1500
3000
5000
>5000
ug/l
3200 3400 3600 3800 4000 4200 4400
2400
2600
2800
3000
3200
9501
9502
9601
9602
9701
9502B
9801
9802
04010402
250
250.5
251 251.5
252
450
560
90
120
260
120
100
120
63070
Total_Phosphorous : 25-Nov-2014

REVIEW OF ENVIRONMENTAL MONITORING PROGRAMS DUBBO SEWAGE TREATMENT PLANT, BALLIMORE AND WONGARBON (PINE AVON)
DUBBO CITY COUNCIL
PAGE 8 214257_REP_001A.DOCX
3.0 BALLIMORE WATER SUPPLY
3.1 BACKGROUND
Dubbo City Council has commissioned a reticulated water supply to the village of Ballimore in June
2010. An environmental monitoring plan (Geolyse, 2009) was implemented to monitor the groundwater
and surface water in the village. The purpose of this plan was to identify any potential overloading of the
septic systems and potential environmental impact due to Council’s new reticulated water supply
system.
Overloading may result in environmental impacts through groundwater and surface water pollution,
which has the potential to pose a health risk and impact on the nearby aquatic ecosystem. Further to
the above concerns, Condition No. 4 of the development consent of the Ballimore water supply scheme
required monitoring and contingency measures
Bore depths in the village which appear to be either shallow (approximately 12 m), intermediate (around
30 m) or deep (approximately 60 to 80 m). Groundwater monitoring has been conducted quarterly on a
network of four piezometers which are understood to intercept the shallow aquifer system.
The village of Ballimore lies adjacent to Talbragar River. The surrounding land is predominantly flat, with
slightly undulating topography in some areas. Surface water generated by precipitation over the village
generally drains to the north and into Talbragar River.
Surface water monitoring is undertaken at two locations on the Talbragar River, upstream and
downstream of the village.
The locations of the groundwater monitoring piezometers and surface water monitoring locations is
illustrated on Figure 10.
Figure 10: Ballimore – Groundwater and Surface Water Monitoring Locations

REVIEW OF ENVIRONMENTAL MONITORING PROGRAMS DUBBO SEWAGE TREATMENT PLANT, BALLIMORE AND WONGARBON (PINE AVON)
DUBBO CITY COUNCIL
PAGE 9 214257_REP_001A.DOCX
3.2 MONITORING RESULTS REVIEW
Geolyse has conducted a review of the monitoring data collected in the period from 2009 to 2014. The review incorporates a qualitative risk assessment against default trigger values for protection of aquatic ecosystems provided in ANZECC/ARMCANZ (2000). These default trigger values have been selected on the following basis:
• The average discharge rate of the surface water receptor, Talbragar River, is relatively low at 49,181 ML/year (NSW Office of Water, Talbragar River at Elong Elong - Period of Record Daily
Flow Summary Report, accessed April 2015), and as such, aquatic ecosystems (i.e. species composition and abundance) are considered vulnerable to degradation by physical and chemical stressors; and
• The relationship between groundwater and surface water at the village of Ballimore has not been assessed. The potential for groundwater impacts, where identified, to adversely affect surface water quality has accordingly been considered in a conservative setting;
Five (5) other groundwater bores registered for ‘Stock’, ‘Domestic’ or undesignated purposes are located within the vicinity of the village of Ballimore, and trigger values for these receptors have also been considered in this review. It is noted that default trigger values for the protection of aquatic ecosystems are, in general, considerably more conservative than those for protection of drinking water for humans and livestock.
Where exceedances of trigger values have been identified for a monitoring parameter that may result in impacts to the Talbragar River which is located adjacent to the village of Ballimore, a trend analysis has been also conducted, incorporating ‘Mann-Kendall’ statistical analysis. A statistically significant trend (at 95% confidence limit) is one with a ‘p-value’ of less than 0.05.
Hydrogeology
Groundwater is generally present at between 8.0 and 15.5 mbgl and has generally been recorded as flowing from north to south, or north-east to south-west, towards Talbragar River. Based on the corrected groundwater elevations recorded at the site being between 286 and 294 metres Australian height datum (mAHD), and the elevation of Talbragar River (between 280 and 300 mAHD, Spatial Information
eXchange – NSW Land & Property Information), a degree of connectivity between groundwater and Talbragar River may be present.
The groundwater flow direction does not conclusively indicate discharge into Talbragar River, which transects the investigation area. The Talbragar River may only be acting as a receptor for groundwater from one side of the river (i.e. the northern side), and groundwater south of Talbragar River may continue to the south.
It is noted that the existing network of 4 piezometers covers a large area (perimeter of approximately 2.5 km), and preferential pathways for migration of groundwater are not considered to have been fully characterised.
Interpolation of groundwater flow contours requires a minimum of 4 data points, and accordingly the groundwater flow contours plotted on Figure 11 have incorporated the second-most recent groundwater gauging data from December 2014. The approximate location and alignment of Talbragar River is also shown

REVIEW OF ENVIRONMENTAL MONITORING PROGRAMS DUBBO SEWAGE TREATMENT PLANT, BALLIMORE AND WONGARBON (PINE AVON)
DUBBO CITY COUNCIL
PAGE 10 214257_REP_001A.DOCX
Figure 11: Groundwater Flow Contours, December-2014
pH
pH values for groundwater monitored in all piezometers were recorded to be in the range of 6.35 (BA5, March 2012) to 8.36 (BA5, March 2013). An elevated pH reading of 10.26 was recorded at BA1 in March 2015, however this is considered to be an outlier possibly due to a technical or procedural fault during measurement. The outlier was confirmed by laboratory analysis of pH for BA1 which showed a pH value of 7.57, in line with the historical pH range for BA1. pH values for surface water at both monitoring locations were recorded to be in the range of 6.82 (TRD, August 2010) to 8.39 (TRU, December 2011).
Default trigger values for pH in ‘slightly disturbed ecosystems’ in NSW upland rivers (i.e. > 150 m altitude), as provided in ANZECC/ARMCANZ (2000), set a lower limit of 6.5 and an upper limit of 8.0. A livestock drinking water guideline (NSW DPI, 2007) and human health drinking water guideline (NHMRC/NRMMC, 2011), ranges of 6.5 to 8.5 has also been considered in this review.
pH values have predominantly been within the ANZECC/ARMCANZ (2000) upper and lower limits, with temporary readings marginally outside the guideline range being infrequently recorded.
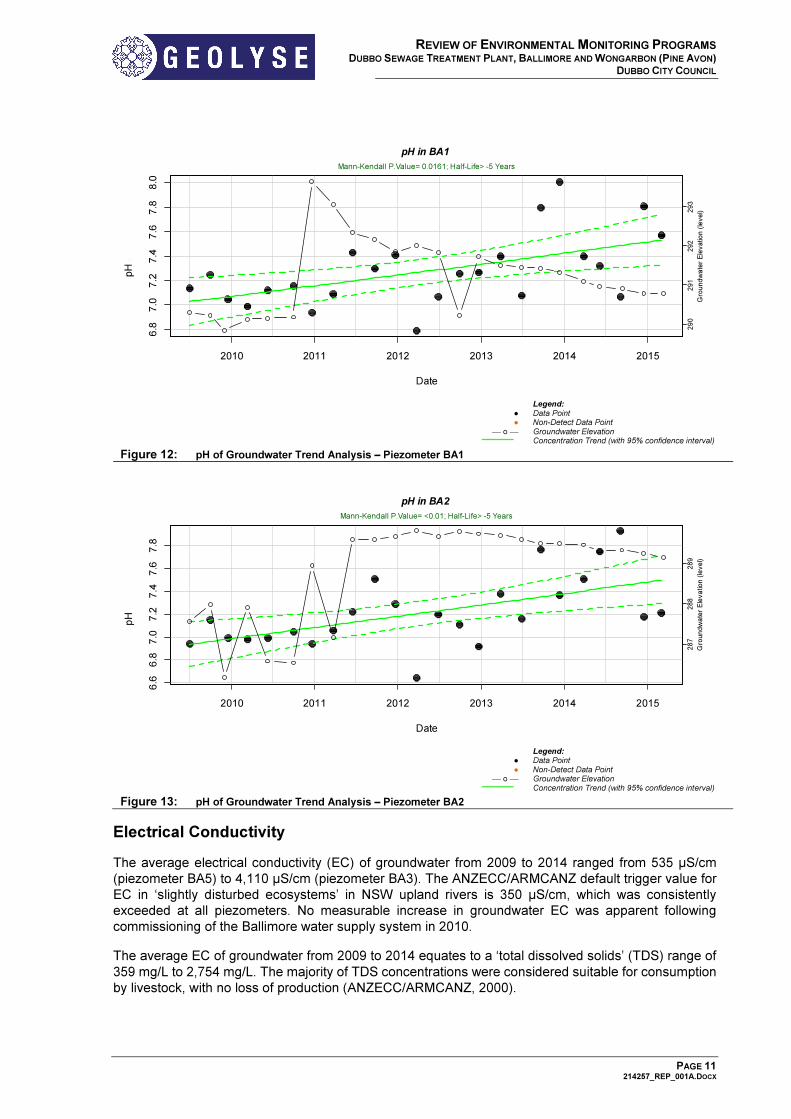
pH in groundwater samples collected from piezometers BA1 and BA2 were observed to be increasing in a statistically significant trend, as shown below in Figures 12 and 13. It is noted that whilst these trends do not predict an imminent exceedance of the upper limit for pH in the short-term, a non-statistically significant trend (p = 0.07) of increasing pH has been recorded at the downstream surface water monitoring location TRD.
678200 678400 678600 678800 679000 679200
6436200
6436400
6436600
6436800
6437000
BA1
BA2
BA3
BA5
289.4
289.6
289.8
290
290.2
16-Dec-2014
REVIEW OF ENVIRONMENTAL MONITORING PROGRAMS DUBBO SEWAGE TREATMENT PLANT, BALLIMORE AND WONGARBON (PINE AVON)
DUBBO CITY COUNCIL
PAGE 11 214257_REP_001A.DOCX
●
●
o
Legend: Data Point Non-Detect Data Point Groundwater Elevation Concentration Trend (with 95% confidence interval)
Figure 12: pH of Groundwater Trend Analysis – Piezometer BA1
●
●
o
Legend: Data Point Non-Detect Data Point Groundwater Elevation Concentration Trend (with 95% confidence interval)
Figure 13: pH of Groundwater Trend Analysis – Piezometer BA2
Electrical Conductivity
The average electrical conductivity (EC) of groundwater from 2009 to 2014 ranged from 535 µS/cm (piezometer BA5) to 4,110 µS/cm (piezometer BA3). The ANZECC/ARMCANZ default trigger value for EC in ‘slightly disturbed ecosystems’ in NSW upland rivers is 350 µS/cm, which was consistently exceeded at all piezometers. No measurable increase in groundwater EC was apparent following commissioning of the Ballimore water supply system in 2010.
The average EC of groundwater from 2009 to 2014 equates to a ‘total dissolved solids’ (TDS) range of 359 mg/L to 2,754 mg/L. The majority of TDS concentrations were considered suitable for consumption by livestock, with no loss of production (ANZECC/ARMCANZ, 2000).
Date
pH
(m
g/l)
2010 2011 2012 2013 2014 2015
6.8
7.0
7.2
7.4
7.6
7.8
8.0
pH in BA1
Mann-Kendall P.Value= 0.0161; Half-Life> -5 Years
29
0291
292
293
Gro
und
wate
r E
lev
atio
n (
lev
el)
Date
pH
(m
g/l)
2010 2011 2012 2013 2014 2015
6.6
6.8
7.0
7.2
7.4
7.6
7.8
pH in BA2
Mann-Kendall P.Value= <0.01; Half-Life> -5 Years
28
72
88
28
9
Gro
un
dw
ate
r E
lev
atio
n (
lev
el)

REVIEW OF ENVIRONMENTAL MONITORING PROGRAMS DUBBO SEWAGE TREATMENT PLANT, BALLIMORE AND WONGARBON (PINE AVON)
DUBBO CITY COUNCIL
PAGE 12 214257_REP_001A.DOCX
The difference in EC readings between upstream and downstream locations of Talbragar River ranged from a decrease of 343 µS/cm (February 2010) to an increase of 240 µS/cm (September 2014), indicating minimal impact to the water quality of Talbragar River, in terms of EC, as the river passes through the village of Ballimore.
Nitrate
Nitrate concentrations in groundwater samples collected from piezometers at Ballimore were reported to range from below the laboratory LOR (0.01 mg/L) to 20.40 mg/L in BA2 (December 2010). The ANZECC/ARMCANZ default trigger value for nitrate in ‘slightly disturbed ecosystems’ in NSW upland rivers is 0.015 mg/L and was significantly exceeded in groundwater samples collected from piezometer BA2 (greater than two orders of magnitude above the trigger value) and intermittently exceeded in groundwater samples collected from piezometers BA1, BA3 and BA5 (generally ranging from below the LOR to within an order of magnitude above the trigger value).
The difference in nitrate concentrations between upstream and downstream locations of Talbragar River ranged from a decrease of 0.50 mg/L (October 2011) to an increase of 0.17 mg/L (December 2010), indicating minimal impact to the water quality of Talbragar River, in terms of nitrate concentrations, as the river passes through the village of Ballimore.
The elevated nitrate concentration in groundwater recorded at piezometer BA2 may be attributable to commissioning of the Ballimore water supply, as nitrate concentrations were observed to increase in the latter part of 2010, along with groundwater levels, as shown below in Figure 14.
●
●
o
Legend: Data Point Non-Detect Data Point Groundwater Elevation Concentration Trend (with 95% confidence interval)
Figure 14: Nitrate in Groundwater Trend Analysis – Piezometer BA2
Nitrate concentrations in groundwater samples collected from piezometer BA1 were observed to be increasing in a statistically significant trend, as shown below in Figure 15.
Date
Nitra
te (
ug
/l)
2010 2011 2012 2013 2014 2015
10
05
00
20
00
10
00
0
Nitrate in BA2
Mann-Kendall P.Value= 0.15; Half-Life= -474 days
287
288
289
Gro
undw
ate
r E
lev
atio
n (
lev
el)

REVIEW OF ENVIRONMENTAL MONITORING PROGRAMS DUBBO SEWAGE TREATMENT PLANT, BALLIMORE AND WONGARBON (PINE AVON)
DUBBO CITY COUNCIL
PAGE 13 214257_REP_001A.DOCX
●
●
o
Legend: Data Point Non-Detect Data Point Groundwater Elevation Concentration Trend (with 95% confidence interval)
Figure 15: Nitrate in Groundwater Trend Analysis – Piezometer BA1
Nitrate concentrations have consistently been lower than the livestock drinking water trigger value of 400 mg/L (ANZECC/ARMCANZ, 2000).
Ammonia
Ammonia concentrations in groundwater samples collected from piezometers at Ballimore were reported to range from below the laboratory LOR (0.01 mg/L) in multiple samples, to 0.28 mg/L in BA2 (June 2010). The ANZECC/ARMCANZ default trigger value for ammonia in ‘slightly disturbed ecosystems’ in NSW upland rivers is 0.013 mg/L and was intermittently exceeded in groundwater samples collected from all piezometers.
The difference in ammonia concentrations between upstream and downstream locations of Talbragar River ranged from a decrease of 0.06 mg/L (December 2011) to an increase of 0.17 mg/L (March 2012). It is noted that the 2012 result is the only recorded occurrence of an increase in ammonia concentration to above the trigger value. Geolyse considers impacts to the water quality of Talbragar River as the river passes through the village of Ballimore, in terms of ammonia concentrations, are minimal in nature.
There is currently no guideline value for ammonia in livestock drinking water, however ammonia groundwater concentration in all piezometers were below the conservative human drinking water aesthetic guideline value of 0.5 mg/L, as listed in the NHMRC/NRMMC, Australian Drinking Water Guidelines, (2011) in the most recent groundwater monitoring round.
Total Phosphorous
Total Phosphorus concentrations in groundwater samples collected from piezometers at the site were reported to range from below the LOR in BA3 (December 2010), to 4.83 mg/L in BA5 (September 2010). The ANZECC/ARMCANZ default trigger value for total phosphorous in ‘slightly disturbed ecosystems’ in NSW upland rivers is 0.02 mg/L and was generally exceeded in groundwater samples collected from all piezometers, most notable in BA5. No stock or human health drinking water guidelines are currently available and considered applicable for this review.
The difference in total phosphorous concentrations between upstream and downstream locations of Talbragar River ranged from a decrease of 2.02 mg/L (March 2012) to an increase of 0.09 mg/L (June and September 2014). It is noted that all recorded upstream and downstream total phosphorous concentrations from 2009 to 2014 have been above the trigger value. Based on the current monitoring data, Geolyse considers there is little evidence to indicate the water quality of Talbragar River as the river passes through the village of Ballimore, is being adversely affected by total phosphorus impacts.
Date
Nitra
te (
ug
/l)
2010 2011 2012 2013 2014 2015
51
05
02
00
10
00
Nitrate in BA1
Mann-Kendall P.Value= <0.01; Half-Life= -926 days
290
291
292
293
Gro
undw
ate
r E
lev
atio
n (
lev
el)

REVIEW OF ENVIRONMENTAL MONITORING PROGRAMS DUBBO SEWAGE TREATMENT PLANT, BALLIMORE AND WONGARBON (PINE AVON)
DUBBO CITY COUNCIL
PAGE 14 214257_REP_001A.DOCX
The highest concentrations of total phosphorous in groundwater have been consistently recorded in piezometer BA5 on Florence Street, located centrally within the investigation area. Based on the calculated groundwater flow direction (subject to the limitations described in the ‘Hydrogeology’ section above, groundwater from BA5 is not considered likely to flow directly to Talbragar River, located approximately 270 m to the north.
No statistically significant trend for total phosphorous concentrations in groundwater was apparent in any piezometer within the Ballimore village.
Faecal Coliforms
Concentrations of faecal coliforms in groundwater samples collected from piezometers at Ballimore were reported to range from below the laboratory LOR of 2 ‘colony forming units’ (CFU)/100 mL in multiple samples, to 6000 CFU/100 mL in BA1 (December 2009). No water quality guidelines for protection of aquatic ecosystems are currently available and considered applicable for this review. Water quality guidelines for drinking water (human), stock watering and recreational use are respectively listed as 1 CFU/100 mL (NHMRC/NRMMC, 2011), 100 CFU/100 mL (ANZECC/ARMCANZ, 2000) and 150 CFU/100 mL (ANZECC/ARMCANZ, 2000).
The difference in faecal coliform concentrations between upstream and downstream locations of Talbragar River ranged from a decrease of 100 CFU/100 mL (February 2010) to an increase of 800 CFU/100 mL (August 2010). The most significant variations in faecal coliform numbers were observed at the inception of the investigation in 2010. Subsequent to this period, the difference in faecal coliform concentrations between upstream and downstream locations ranged from a decrease of 90 CFU/100 mL (June 2014) to an increase of 400 CFU/100 mL (September 2013).
It is noted that faecal coliform concentrations from both upstream and downstream locations in the period from 2011 to 2014 have frequently been recorded above the least conservative recreational use guideline, though no consistent increase in faecal coliform concentrations between upstream and downstream sampling locations (at 95% confidence) was apparent.
Based on the current monitoring data, Geolyse considers the water quality of Talbragar River, is not significantly being adversely affected by faecal coliform impacts as the river passes through the village of Ballimore.
3.3 RECOMMENDATIONS
The current groundwater monitoring schedule at the village of Ballimore is quarterly monitoring for groundwater elevation, pH, EC, nitrate, ammonia, total phosphorous and faecal coliforms. Based on the monitoring results for the period from 2009 to 2014, the monitoring schedule may be amended as follows, whilst still meeting the objectives of the monitoring program:
• No reduction in the number of piezometers in the current network is considered warranted. The hydrogeology could be better understood by installation of additional piezometers, however the existing network meets the minimum requirements for modelling groundwater flow direction;
• Adjust monitoring frequency to a biannual schedule, based on:
– Impacts to groundwater, whilst identified to exceed guideline values for protection of aquatic ecosystems, have not been established to be influencing the water quality of Talbragar River;
– Impacts to surface water, whilst identified to exceed guideline values for protection of aquatic ecosystems, have not been established to vary significantly between upstream and downstream locations of Talbragar River; and
• Monitoring of physical water parameters (pH and EC) may be monitored real-time in the field using a water quality probe. Collection of samples for laboratory analysis of these parameters is not considered necessary.

REVIEW OF ENVIRONMENTAL MONITORING PROGRAMS DUBBO SEWAGE TREATMENT PLANT, BALLIMORE AND WONGARBON (PINE AVON)
DUBBO CITY COUNCIL
PAGE 15 214257_REP_001A.DOCX
Geolyse recommends conducting the above monitoring program for a period of 2 years, consisting of 4 biannual monitoring events. At the conclusion of the monitoring program, a hydrogeological assessment may be undertaken to establish whether elevated impacts identified in groundwater, specifically nitrate concentrations, are likely to result in degradation of the water quality of Talbragar River.
4.0 WONGARBON (PINE AVON) SEWERAGE SCHEME
4.1 BACKGROUND
Dubbo City Council commissioned a new sewerage treatment plant (STP) and reuse scheme in 2009 to service the village of Wongarbon. The Wongarbon Sewerage Scheme, known as ‘Pine Avon’, is located approximately 15 km south-east of Dubbo along the Mitchell Highway. The area surrounding the property to the north, east and south is predominantly rural / residential development.
The Scheme consists of a gravity sewerage collection scheme, an oxidation pond treatment system and effluent irrigation on Pine Avon. The treatment plant has been designed to service 526 equivalent persons (DCC, 2006).
Water quality monitoring has continued on a quarterly basis following commissioning of the STP to assess any changes in groundwater quality or levels and establish whether further investigation is required.
Wongarbon is located approximately 18 km south-east of Dubbo on the Mitchell Highway. The Macquarie River is located approximately 8.5 km to the south-west, and ephemeral tributaries are located within 750 m of the STP. The surrounding land is predominantly flat, with a slightly raised landform to the south of the STP. The surrounding land generally falls away on either side the Mitchell Highway, south-west to Macquarie River, or to the north-east towards the ephemeral Eulomogo Creek, which is located adjacent to the northern boundary of the Wongarbon township.
The current quarterly monitoring schedule includes 7 pairs of shallow / deep piezometers (P1D, P1S, P2D, P2S, P3D, P3S, P4D, P4S, P5D, P5D, MW6d, MW6S, MW7D and MW7S), comprising 14 piezometers in total. Shallow piezometers are understood to have been installed at depths less than 9 mbgl, and deep piezometers are understood to have been installed at depths greater than 12 mbgl. Groundwater samples are not consistently able to be collected at all piezometers due to insufficient water volumes and/or recharge. Groundwater monitoring is no longer undertaken on the piezometers within the Wongarbon township (MW1, MW2, MW3, MW4 and MW5). The location of the groundwater monitoring piezometers is illustrated on Figure 16.

REVIEW OF ENVIRONMENTAL MONITORING PROGRAMS DUBBO SEWAGE TREATMENT PLANT, BALLIMORE AND WONGARBON (PINE AVON)
DUBBO CITY COUNCIL
PAGE 16 214257_REP_001A.DOCX
Figure 16: Wongarbon (Pine Avon) – Groundwater and Surface Water Monitoring Locations
4.2 MONITORING RESULTS REVIEW
Geolyse has conducted a review of the monitoring data collected in the period from 2009 to 2015. The
review incorporates a qualitative risk assessment against human health drinking water guidelines
(NHMRC/NRMMC, 2011) and stock watering guidelines (ANZECC/ARMCANZ, 2000). These guidelines
have been selected on the following basis:
• The closest surface water body, Macquarie River, is approximately 8.5 km to the south-west and
is not considered likely to be a receptor for groundwater impacts at this distance;
• Creeks and/or surface water drainage lines closer to the site than Macquarie River are not
considered to exhibit connectivity with groundwater system(s), as surface water flow in the vicinity
of the site is short-term and only during significant rainfall;
• Groundwater bores within the vicinity of the village of Wongarbon are registered for ‘Stock’,
‘Domestic’ or undesignated purposes, and guidelines for these receptors are considered most
applicable in this review.
Where exceedances of guidelines have been identified for a monitoring parameter that may result in
adverse impacts to water quality for human drinking or stock watering use, a trend analysis has been
also conducted, incorporating ‘Mann-Kendall’ statistical analysis. A statistically significant trend (at 95%
confidence limit) is one with a ‘p-value’ of less than 0.05.
Hydrogeology
Groundwater has been identified to be present in 2 aquifer systems; a shallow aquifer with SWLs ranging
from 1.63 mbgl (P2S, August 2014) to 9.12 mbgl (MW6S, February 2015), and a deep aquifer with SWLs
ranging from 2.67 mbgl (P1D, August 2012) to 11.98 mbgl (MW6D, February 2015). Both aquifers have
generally been recorded as flowing from south to north, however the shallow aquifer flow direction tends
to fluctuate and has been recorded as flowing the west.

REVIEW OF ENVIRONMENTAL MONITORING PROGRAMS DUBBO SEWAGE TREATMENT PLANT, BALLIMORE AND WONGARBON (PINE AVON)
DUBBO CITY COUNCIL
PAGE 17 214257_REP_001A.DOCX
Groundwater flow contours for the deeper aquifer in March 2015 are illustrated on Figure 17.
Figure 17: Groundwater Flow Contours – Deeper Aquifer, March-2014
pH
pH values for groundwater monitored in all piezometers in the period from 2009 to 2015 were recorded to be in the range of 5.84 (P3D, November 2014) to 8.61 (P2D, November 2013).
The livestock drinking water guideline (NSW DPI, 2007) and human health drinking water guideline (NHMRC/NRMMC, 2011), ranges of 6.5 to 8.5 has also been considered in this review.
pH values have predominantly been within the NSW DPI (2007) and NHMRC/NRMMC (2011) upper and lower limits, with temporary readings marginally outside the guideline range being infrequently recorded, predominantly in piezometer P3D which has recorded pH values of less than 6.5 with some regularity, although not since 2012 (with the exception of November 2014).
Electrical Conductivity
Electrical conductivity (EC) of groundwater from 2009 to 2015 ranged from 375 µS/cm (piezometer MW7S in August 2012) to 4,960 µS/cm (piezometer P5S in November 2012) in the shallow aquifer, and from 1,040 µS/cm (piezometer P1D in August 2010) to 13,800 µS/cm (piezometer P2D in April 2014) in the deeper aquifer. The ANZECC/ARMCANZ default trigger value for EC in ‘slightly disturbed ecosystems’ in NSW upland rivers is 350 µS/cm, which was consistently exceeded at all piezometers.
The range of groundwater EC from 2009 to 2015 equates to a ‘total dissolved solids’ (TDS) range of 251 mg/L to 9,246 mg/L. The majority of TDS concentrations in the deeper aquifer were considered to be not suitable for consumption by livestock, (ANZECC/ARMCANZ, 2000). However minimal fluctuations have been identified and no indication of the source of EC impacts being attributable to the Wongarbon STP is evident, as elevated EC impacts have consistently been recorded in background piezometer MW6D, located south of Pine Avon and upgradient of the treatment ponds.
148.738 148.740 148.742 148.744 148.746 148.748 148.750
-32.336
-32.334
-32.332
-32.330
-32.328
-32.326
P1D
P2D
P3D
P5D
MW6D
MW7D
368
370
372
374
376
378
380
02-Nov-2014 to 01-Feb-2015 : Aquifer-Deep

REVIEW OF ENVIRONMENTAL MONITORING PROGRAMS DUBBO SEWAGE TREATMENT PLANT, BALLIMORE AND WONGARBON (PINE AVON)
DUBBO CITY COUNCIL
PAGE 18 214257_REP_001A.DOCX
Nitrate
Nitrate concentrations in groundwater samples collected from piezometers at Wongarbon were reported to range from 0.45 mg/L (piezometer P2S in November 2014) to 14.90 mg/L (piezometer P5S in November 2013) in the shallow aquifer, and from 0.17 mg/L (piezometer P3D in August 2011) to 7.79 mg/L (piezometer P5D in February 2011) in the deeper aquifer. The ANZECC/ARMCANZ default trigger value for nitrate in ‘slightly disturbed ecosystems’ in NSW upland rivers is 0.015 mg/L and was generally exceeded in groundwater samples collected in the monitoring period.
The highest concentrations of nitrate in groundwater have been consistently recorded in piezometers intercepting the upper aquifer, however trends in groundwater nitrate concentrations were not discernible due to the intermittent availability of water for sampling. Nitrate concentrations were relatively lower in the deeper aquifer, but were still considered to be elevated compared to background concentrations observed in groundwater samples collected from background piezometer MW6D, which ranged from 0.27 mg/L to 1.28 mg/L
Nitrate concentrations in groundwater samples collected from piezometer P1D were observed to be increasing in a statistically significant trend, as shown below in Figure 18, however it is noted that nitrate concentrations have been reducing in groundwater at this location since November 2013.
●
●
o
Legend: Data Point Non-Detect Data Point Groundwater Elevation Concentration Trend (with 95% confidence interval)
Figure 18: Nitrate in Groundwater Trend Analysis – Piezometer P1D
Ammonia
Ammonia concentrations in groundwater samples collected from piezometers at the site were reported to range from below the laboratory LOR (0.01 mg/L) in multiple samples to 0.59 mg/L (piezometer MW7S in February 2014) in the shallow aquifer, and from below the laboratory LOR in multiple samples, to 2.17 mg/L (piezometer P3D in August 2009) in the deeper aquifer. The ANZECC/ARMCANZ default trigger value for ammonia in ‘slightly disturbed ecosystems’ in NSW upland rivers is 0.013 mg/L and was frequently exceeded in collected groundwater samples.
The highest concentrations of ammonia in groundwater have been consistently recorded in piezometer P3D. Based on the calculated groundwater flow direction, these impacts are not considered to be delineated. There is currently no guideline value for ammonia in livestock drinking water, however ammonia groundwater concentration in all piezometers were below the conservative human drinking water aesthetic guideline value of 0.5 mg/L, as listed in the NHMRC/NRMMC, National Water Quality Management Strategy – Australian Drinking Water Guidelines, (2011, updated 2015) in the most recent groundwater monitoring round.
Date
Nitra
te (
mg
/l)
2009 2010 2011 2012 2013 2014 2015
23
45
Nitrate in P1D : Aquifer-Deep
Mann-Kendall P.Value= 0.0201; Half-Life> -5 Years
363
364
36
5366
Gro
undw
ate
r E
lev
atio
n (
metr
es
)

REVIEW OF ENVIRONMENTAL MONITORING PROGRAMS DUBBO SEWAGE TREATMENT PLANT, BALLIMORE AND WONGARBON (PINE AVON)
DUBBO CITY COUNCIL
PAGE 19 214257_REP_001A.DOCX
Total Phosphorous
Total Phosphorus concentrations in groundwater samples collected from piezometers at the site were reported to range from below the laboratory LOR (0.01 mg/L) in multiple samples to 8.93 mg/L (piezometer MW7S in February 2014) in the shallow aquifer, and from below the laboratory LOR in multiple samples, to 2.17 mg/L (piezometer P1D in May 2009) in the deeper aquifer. The ANZECC/ARMCANZ default trigger value for total phosphorous in ‘slightly disturbed ecosystems’ in NSW upland rivers is 0.02 mg/L and was generally exceeded in groundwater samples collected from all piezometers. No stock or human health drinking water guidelines are currently available and considered applicable for this review.
The highest concentrations of total phosphorous in groundwater have been consistently recorded in piezometer MW7S. These impacts are not considered to be delineated, however groundwater samples collected from the paired monitoring well intercepting the deeper aquifer (MW7D) recorded significantly lower total phosphorous concentrations over the monitoring period (averaging 2.38 mg/L in MW7S, compared to 0.14 mg/L in MW7D).
Faecal Coliforms
Concentrations of faecal coliforms in groundwater samples collected from piezometers at Wongarbon were reported to range from below the laboratory LOR (2 CFU/100 mL) in multiple samples to 380,000 CFU/100 mL (piezometer MW7S in November 2013) in the shallow aquifer, and from below the laboratory LOR (2 CFU/100 mL) in multiple samples, to 2,700,000 CFU/100 mL (piezometer P3D in August 2009) in the deeper aquifer. No water quality guidelines for protection of aquatic ecosystems are currently available and considered applicable for this review. Water quality guidelines for drinking water (human), stock watering and recreational use are respectively listed as 1 CFU/100 mL (NHMRC / NRMMC, 2011), 100 CFU/100 mL (ANZECC/ARMCANZ, 2000) and 150 CFU/100 mL (ANZECC / ARMCANZ, 2000).
It is noted that faecal coliforms in groundwater have generally been recorded at concentrations between the guideline levels for drinking water (1 CFU/100 mL) and stock watering (100 CFU/100 mL), with the exception of intermittent significant impacts that have not been attributed to any particular operation or activity, as was observed in faecal coliform concentration spikes in August 2009 (P1D, P2D, P3D and P5D), November 2010 (P3D and P5D), November 2013 to May 2014 (MW7S), February 2014 (P3D and MW7D) and February 2015 (P3D).
Heavy Metals, Anions and Cations
The heavy metals aluminium, arsenic, cadmium, chromium, cobalt, copper, lead, manganese, mercury, nickel, selenium and zinc have consistently been recorded at concentrations in groundwater lower than the adopted guidelines Use of Effluent for Irrigation (NSW Department of Environment and Conservation, 2004).
Cation concentrations are assessed by calculating the Sodium Adsorption Ratio (SAR), which is the relative proportion of sodium ions (Na+) to both calcium ions (Ca2+) and magnesium ions (Mg2+), which is indicative of soil permeability and aeration problems when calculated to be above 6 (NSW DEC, 2004). The SAR has been recorded to range from below 2 to above 7. It is noted this is a measurement of the SAR in groundwater, rather than in effluent sourced irrigation, and would be influenced by soil conditions.
Chloride concentrations in groundwater have been recorded to be elevated across the site, with exceedances of the guideline value for irrigation moderately tolerant crops (<700mg/L, ANZECC / ARMCANZ, 2000) frequently being recorded. It is noted this is a measurement of chloride in groundwater, rather than in effluent sourced irrigation, and would be influenced by soil conditions.
Other anions including fluoride and sulphate have consistently been recorded to be lower than adopted livestock watering guideline levels (ANZECC / ARMCANZ, 2000).
Organochlorine pesticides are consistently reported at below the laboratory LOR.

REVIEW OF ENVIRONMENTAL MONITORING PROGRAMS DUBBO SEWAGE TREATMENT PLANT, BALLIMORE AND WONGARBON (PINE AVON)
DUBBO CITY COUNCIL
PAGE 20 214257_REP_001A.DOCX
4.3 RECOMMENDATIONS
The current groundwater monitoring schedule at the Wongarbon Sewerage Scheme is quarterly monitoring for groundwater elevation, pH, EC, nitrate, ammonia, total phosphorous, faecal coliforms, major cations and anions, alkalinity, heavy metals and organochlorine pesticides. Based on the monitoring results for the period from 2009 to 2014, the monitoring schedule may be amended as follows, whilst still meeting the objectives of the monitoring program:
• No reduction in the number of piezometers in the current network is considered warranted. The hydrogeology could be better understood by installation of additional piezometers, however the existing network meets the minimum requirements for modelling groundwater flow direction;
• Impacts to groundwater, whilst identified to exceed guideline values for protection of aquatic ecosystems, are not considered to be influencing the water quality of surface water receptors. The monitoring frequency may be adjusted to a biannual schedule;
• The biannual monitoring should also include a sample of the effluent used for irrigation on Pine Avon;
• Monitoring of physical water parameters (pH and EC) may be monitored real-time in the field using a water quality probe. Collection of samples for laboratory analysis of these parameters is not considered necessary;
• Analysis of major cations (sodium, calcium, magnesium and potassium), major anions (with the exception of chloride), and heavy metals need only be conducted on effluent irrigation samples; and
• Organochlorine (OC) pesticides may be removed from the monitoring schedule.
Geolyse recommends conducting the above monitoring program for the duration of effluent irrigation at Pine Avon.
5.0 SUMMARY
The following table summarises the recommended adjustments in the monitoring schedules for the Dubbo STP, Ballimore and Wongarbon:
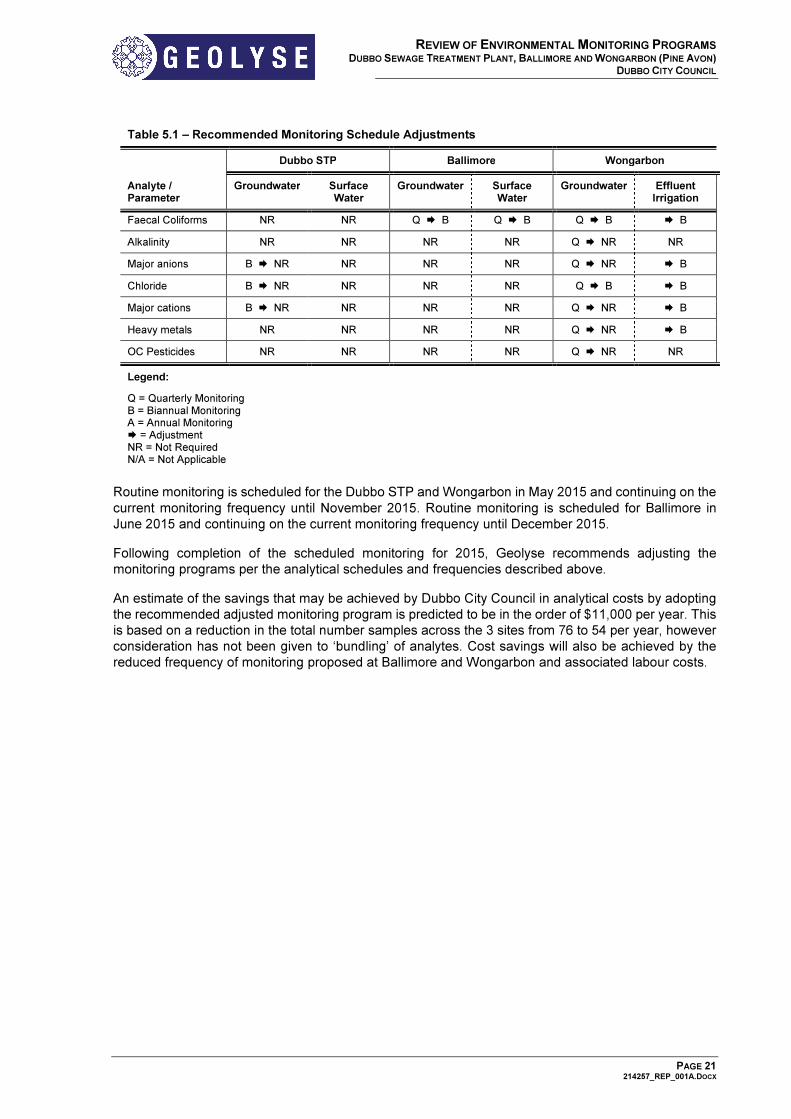
Table 5.1 – Recommended Monitoring Schedule Adjustments
Dubbo STP Ballimore Wongarbon
Analyte / Parameter
Groundwater Surface Water
Groundwater Surface Water
Groundwater Effluent Irrigation
Water Levels B N/A Q � B N/A Q � B N/A
pH (field) B � B Q � B Q � B Q � B � B
pH (lab) B � NR NR Q � NR Q � NR Q � NR NR
EC (field) B � B Q � B Q � B Q � B � B
EC (lab) B � NR NR Q � NR Q � NR Q � NR NR
Nitrate B � A � A Q � B Q � B Q � B � B
TKN B � NR NR NR NR Q � NR NR
Suspended Solids NR NR NR Q � NR NR NR
Ammonia B � A � A Q � B Q � B Q � B � B
Total Phosphorous B � A � A Q � B Q � B Q � B � B
Reactive Phosphorous
NR NR NR NR Q � NR NR
Biochemical Oxygen Demand
B � NR NR NR NR Q � NR NR
REVIEW OF ENVIRONMENTAL MONITORING PROGRAMS DUBBO SEWAGE TREATMENT PLANT, BALLIMORE AND WONGARBON (PINE AVON)
DUBBO CITY COUNCIL
PAGE 21 214257_REP_001A.DOCX
Table 5.1 – Recommended Monitoring Schedule Adjustments
Dubbo STP Ballimore Wongarbon
Analyte / Parameter
Groundwater Surface Water
Groundwater Surface Water
Groundwater Effluent Irrigation
Faecal Coliforms NR NR Q � B Q � B Q � B � B
Alkalinity NR NR NR NR Q � NR NR
Major anions B � NR NR NR NR Q � NR � B
Chloride B � NR NR NR NR Q � B � B
Major cations B � NR NR NR NR Q � NR � B
Heavy metals NR NR NR NR Q � NR � B
OC Pesticides NR NR NR NR Q � NR NR
Legend:
Q = Quarterly Monitoring B = Biannual Monitoring A = Annual Monitoring � = Adjustment NR = Not Required N/A = Not Applicable
Routine monitoring is scheduled for the Dubbo STP and Wongarbon in May 2015 and continuing on the current monitoring frequency until November 2015. Routine monitoring is scheduled for Ballimore in June 2015 and continuing on the current monitoring frequency until December 2015.
Following completion of the scheduled monitoring for 2015, Geolyse recommends adjusting the monitoring programs per the analytical schedules and frequencies described above.
An estimate of the savings that may be achieved by Dubbo City Council in analytical costs by adopting the recommended adjusted monitoring program is predicted to be in the order of $11,000 per year. This is based on a reduction in the total number samples across the 3 sites from 76 to 54 per year, however consideration has not been given to ‘bundling’ of analytes. Cost savings will also be achieved by the reduced frequency of monitoring proposed at Ballimore and Wongarbon and associated labour costs.
REVIEW OF ENVIRONMENTAL MONITORING PROGRAMS DUBBO SEWAGE TREATMENT PLANT, BALLIMORE AND WONGARBON (PINE AVON)
DUBBO CITY COUNCIL
PAGE 22 214257_REP_001A.DOCX
6.0 REFERENCES
Australian and New Zealand Environment and Conservation Council (ANZECC) and Agriculture and Resource Management Council of Australia and New Zealand (ARMCANZ), 2000, Australian and New Zealand Guidelines for Fresh and Marine Water Quality
Dubbo City Council (DCC), 2006, Business Paper – Ordinary Council Meeting 23/10/06. Dubbo City Council, Australia.
Geolyse, 2009, Environmental Monitoring Plan: Ballimore Water Supply, Australia
National Health and Medical Research Council (NHMRC) and Natural Resource Management Ministerial Council (NRMMC), 2011, updated 2015, National Water Quality Management Strategy – Australian Drinking Water Guidelines
NSW Department of Environment and Conservation, 2004, Use of Effluent for Irrigation
NSW Department of Primary Industries, 2007, Water requirements for sheep and cattle
Terra Consulting (NSW) Pty Ltd, 2000, Monitoring summary report, June 1997 to June 2000. Report prepared for Dubbo City Council.


