37
©2013 Software AG. All rights reserved. Roadshow Investor Relations November 2013

©2013 Software AG. All rights reserved.
Roadshow
Investor Relations
November 2013
©2013 Software AG. All rights reserved.
2 |
This presentation contains forward-looking statements based on beliefs
of Software AG management. Such statements reflect current views of
Software AG with respect to future events and results and are subject
to risks and uncertainties. Actual results may vary materially from
those projected here, due to factors including changes in general
economic and business conditions, changes in currency exchange, the
introduction of competing products, lack of market acceptance of new
products, services or technologies and changes in business strategy.
Software AG does not intend or assume any obligation to update these
forward-looking statements.
Safe-Harbor-Statement

©2013 Software AG. All rights reserved.
3 |
Software AG - At a Glance
High performance database
Process Planning,
monitoring and analysis
Middleware to integrate data applications and
digital workflows
Big-data and In-memory technology
~ € 1bn revenue (FY 2012)
~ € 700m revenue (9m 2013)
~ 25% operating EBIT margin (9m 2013)
~ 15% free cash flow margin (9m 2013)
> 5,000 Employees worldwide
~ 1,000 R&D
> € 2bn market cap
66% free float
29% Software AG Foundation
70 Countries
Global customer base: 80% of Fortune 10,000
Technology leader in system integration,
process automation and data management

©2013 Software AG. All rights reserved.
4 |
I n te l l i gent Bus ines s Opera t ions
SOFTWARE AG - Portfolio
©2013 Software AG. All rights reserved.
5 |
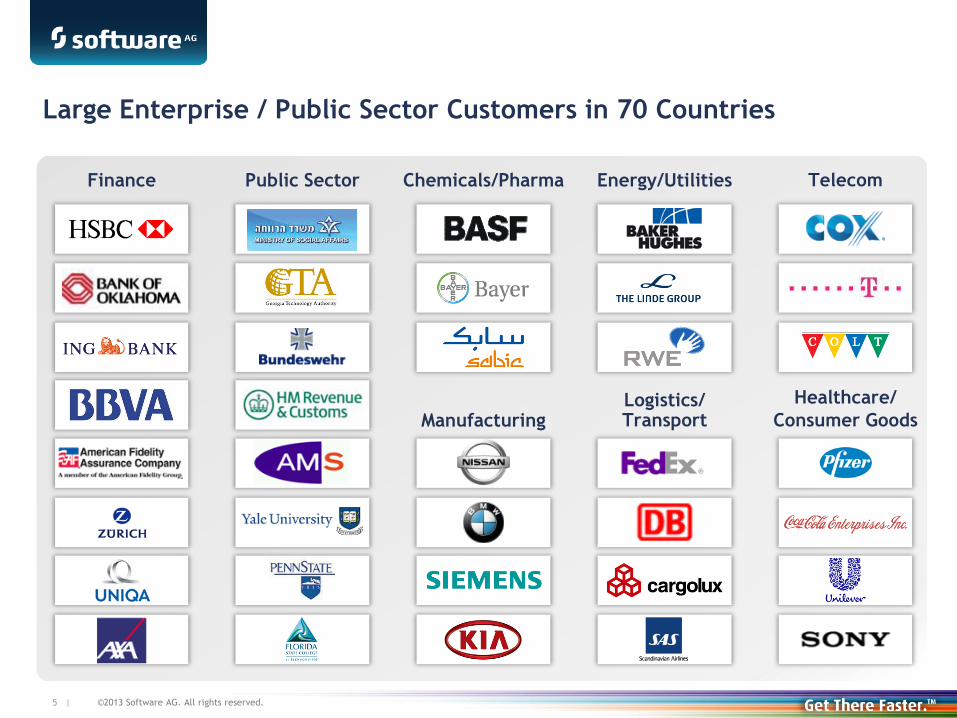
Large Enterprise / Public Sector Customers in 70 Countries
Finance Public Sector Telecom Chemicals/Pharma Energy/Utilities
Manufacturing Logistics/ Transport
Healthcare/
Consumer Goods

©2013 Software AG. All rights reserved.
6 |
Financial Sector
Public Sector
IT
Associ-ations
Services
Manu-facturing
Telcos
Logistics Retail
Other
*Based on product revenue FY 2012
Revenue Split – Well Balanced
20%
20%
EMEA
44%
Asia Pacific
8% Americas
48%
GER 15%
PIIGS < 4%
Product Revenue by Region* Product Revenue by Industry*
©2013 Software AG. All rights reserved.
7 |
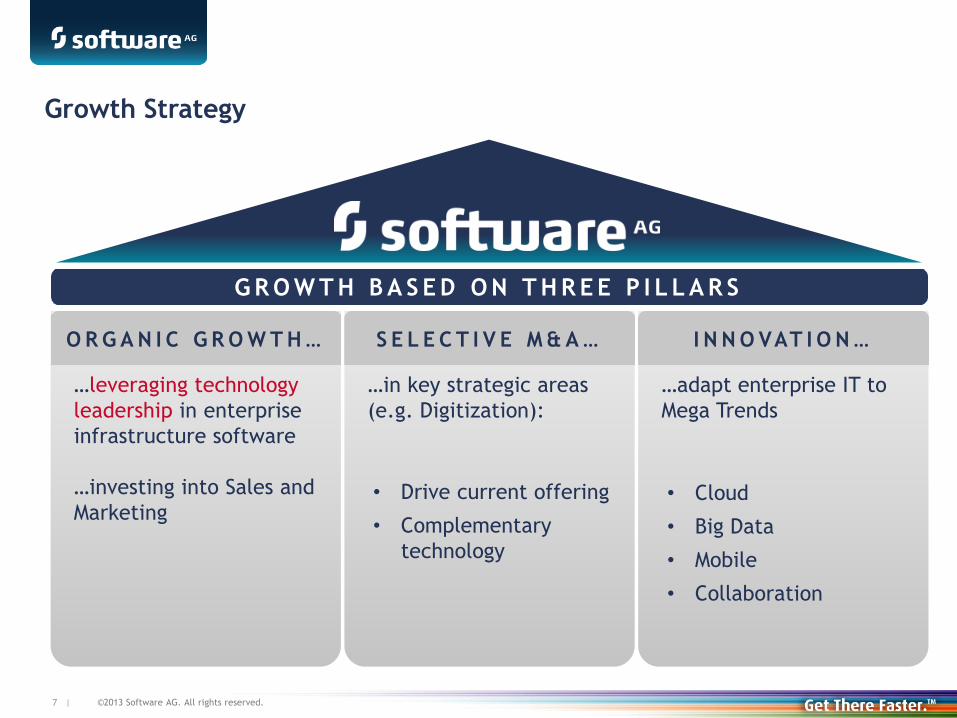
Growth Strategy
G R O W T H B A S E D O N T H R E E P I L L A R S
…leveraging technology
leadership in enterprise
infrastructure software
…investing into Sales and
Marketing
O R G A N I C G R O W T H …
…in key strategic areas
(e.g. Digitization):
S E L E C T I V E M & A …
…adapt enterprise IT to
Mega Trends
I N N O VAT I O N …
• Drive current offering
• Complementary
technology
• Cloud
• Big Data
• Mobile
• Collaboration

©2013 Software AG. All rights reserved.
8 |
Technology Leadership
Gartner’s Magic Quadrant for Application Integration Suites
“Leaders in infrastructure that supports systematic
application integration provide a comprehensive
ESB suite offering as well as the ability to
integrate that offering with other relevant
technologies (including community management,
data integration, SOA and integration governance,
and BPM). This is combined with a strong
commitment to this market, which is expressed
through focused value propositions and go-to-
market strategies (for example, by packaging
platforms and/or by providing integrated product
and service offerings specific for this market).”
Source: Gartner, Inc., Magic Quadrant for On-Premises Application Integration Suites, Jess Thompson, et
al., June 27, 2013
This graphic was published by Gartner, Inc. as part of a larger research document and should be evaluated
in the context of the entire document. The Gartner document is available upon request from Software AG.
Gartner does not endorse any vendor, product or service depicted in its research publications, and does
not advise technology users to select only those vendors with the highest ratings. Gartner research
publications consist of the opinions of Gartner's research organization and should not be construed as
statements of fact. Gartner disclaims all warranties, expressed or implied, with respect to this research,
including any warranties of merchantability or fitness for a particular purpose.

©2013 Software AG. All rights reserved.
9 |
Technology Leadership
Application Integration Suites • • • • • Business Process Analysis Tools • • • Business Process Management Suites • • • Enterprise Architecture Tools • • Governance, Risk and Compliance • • • Integrated IT Portfolio Analysis Apps • Application Services Governance • • Complex Event Processing Platforms • • • Comprehensive Integration Solutions • • • • • EA Management Suites • Elastic Caching Platforms • • • ESB • • • • Integrated SOA Governance • • SOA Service Life-cycle Management •

©2013 Software AG. All rights reserved.
10 |
Acquisitions Support Technology Leadership and Innovation
©2013 Software AG. All rights reserved.
11 |
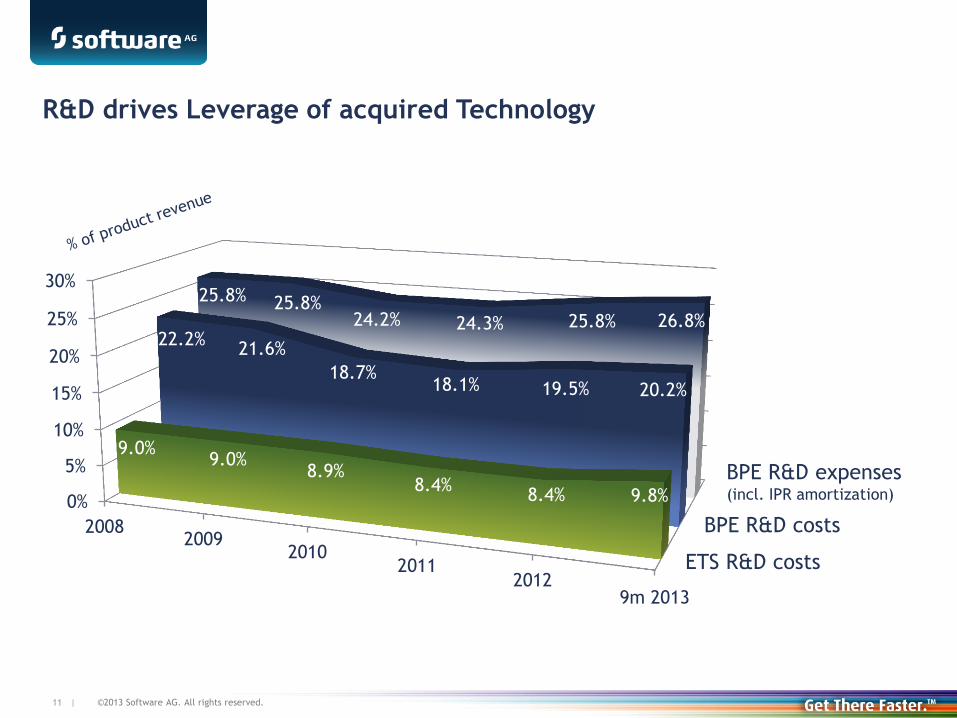
R&D drives Leverage of acquired Technology
BPE R&D expenses (incl. IPR amortization)
BPE R&D costs
ETS R&D costs
0%
5%
10%
15%
20%
25%
30%
20082009
20102011
20129m 2013
9.0% 9.0%
8.9% 8.4%
8.4% 9.8%
22.2% 21.6%
18.7% 18.1% 19.5% 20.2%
25.8% 25.8% 24.2% 24.3% 25.8% 26.8%

©2013 Software AG. All rights reserved.
12 |
Innovation - Big Data
Cloud Events
and SaaS
App Events
Mobile &
Location
Events
Hadoop & Data
Warehouse
Financial
and Trading
Events
$ £ € ¥
Social Media
Events
Low Latency
Universal Messaging
In Memory Data &
Analytics
Real-time Analytics
& Intelligent Action
Real-time Visual
Analytics
System Alerts,
Sensors & Machine
Events
©2013 Software AG. All rights reserved.
13 |
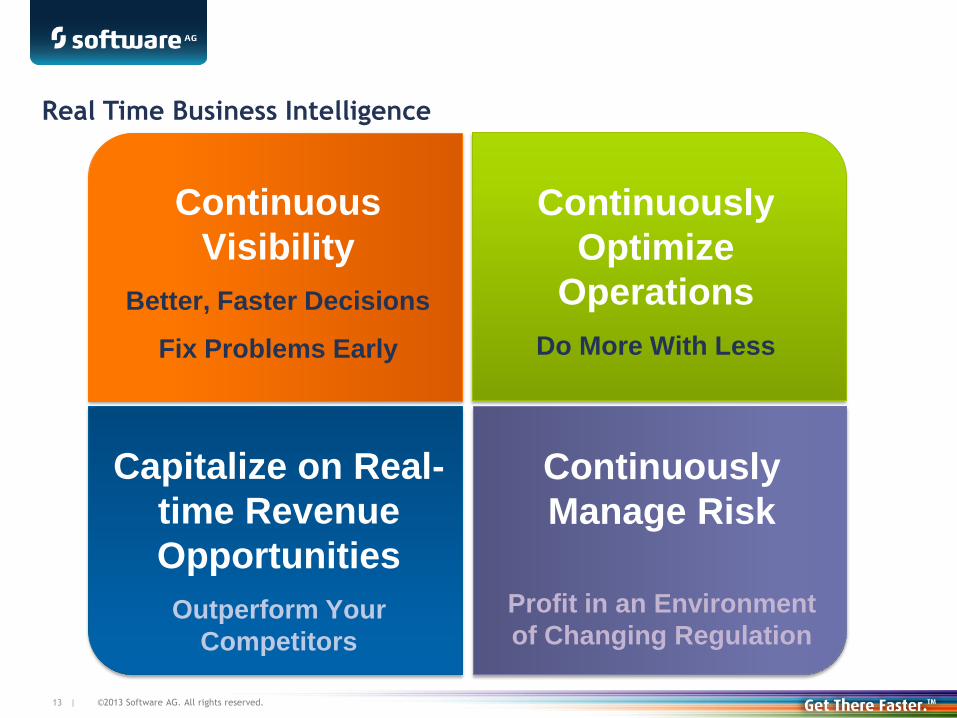
Multi-payments Data
Interoperability
Continuously
Optimize
Operations
Do More With Less
Continuously
Manage Risk
Profit in an Environment
of Changing Regulation
Continuous
Visibility
Better, Faster Decisions
Fix Problems Early
Capitalize on Real-
time Revenue
Opportunities
Outperform Your
Competitors
Real Time Business Intelligence
©2013 Software AG. All rights reserved.
14 |
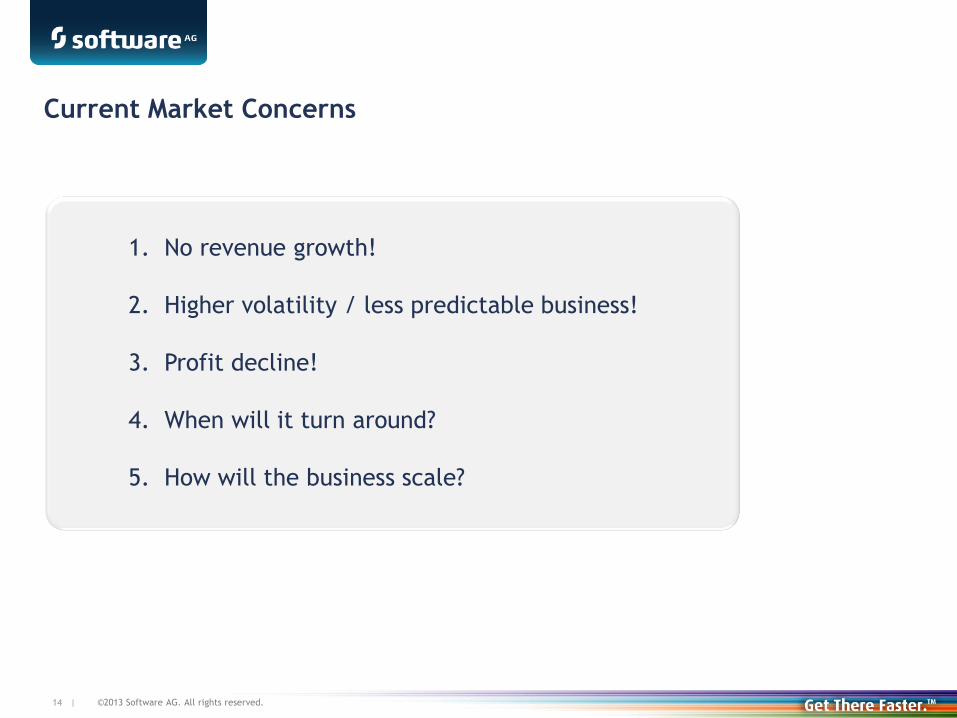
Current Market Concerns
1. No revenue growth!
2. Higher volatility / less predictable business!
3. Profit decline!
4. When will it turn around?
5. How will the business scale?

©2013 Software AG. All rights reserved.
15 |
Revenue Drivers in Transition –
BPE outnumbers ETS / Consulting is in Consolidation
0
100
200
300
400
500
600
700
800
2008 2010 2012 2013e*
(€m)
BPE
Consulting
ETS
39% 46%
54% 60%
539
423
712
335
182
697
* Analyst consensus; own poll

©2013 Software AG. All rights reserved.
16 |
0
20
40
60
80
1 2 3 4 5 6 7 8 9 10 11 12 13 14 15 16 17 18 19 20 21 22 23
New Customers and Bigger Deals grow License Revenue
(€m)
(€m)
In the quarter: volatile
Four quarter rolling: steady growth
40
80
120
160
200
240
1 2 3 4 5 6 7 8 9 10 11 12 13 14 15 16 17 18 19 20 21 22 23
2008 2009 2010 2013 2011 2012
2008 2009 2010 2013 2011 2012

©2013 Software AG. All rights reserved.
17 |
Cost Ratios & Profitability – 9m 2013/2012 (€m)
Total
Revenue
Gross
Profit R&D
Sales & Marketing
9m 2013
9m 2012
479.3
-78.5 -219.3
770.6
701.2
481.1
-74.8
-54.2
11%* 31%*
10%* 24%*
*as % of total revenue
68%*
172.9
135.1
62%*
-181.3
+2.1
-52.5 +6.1
Admin Other
7%*
7%*
38 38
EBIT
(IFRS)

©2013 Software AG. All rights reserved.
18 |
Strengthen Software AG’s Sales Organization - Worldwide
BPE S&M costs
ETS S&M costs
0%
10%
20%
30%
40%
50%
60%
20082009
20102011
20129m 2013
23.0% 21.6%
20.7% 21.3% 20.9% 22.6%
44.9% 42.2%
39.2% 37.1% 39.1%
48.8%
+ 2 0 0 S & M i n
B P E d i v i s i o n
©2013 Software AG. All rights reserved.
19 |
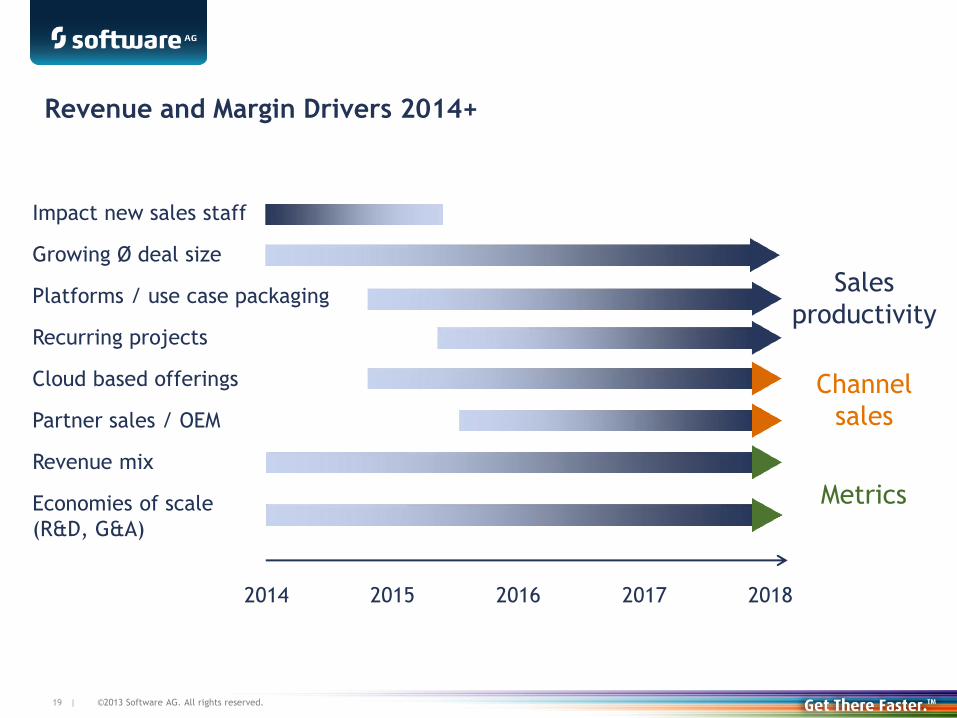
Revenue and Margin Drivers 2014+
2014 2015 2016 2017 2018
Impact new sales staff
Growing Ø deal size
Platforms / use case packaging
Recurring projects
Cloud based offerings
Partner sales / OEM
Revenue mix
Economies of scale
(R&D, G&A)
Metrics
Channel
sales
Sales
productivity

©2013 Software AG. All rights reserved.
20 |
Enterprise Transaction Systems
ETS
• Manage structural
decline (high single
digit % p.a.)
• Manage cost to
maintain segment
result margin > 60%
Business Process Excellence
• Product revenue: growth ca. 15-20% p.a.
(incl. a 50-100% growth from Big Data)
• > 50% contribution to group result
• Expand Big Data offering by Intelligent
Business Operations platform
BPE
• Transform technology
leadership into
market leadership
• Strategic acquisitions
(cash-only; Cloud/
Big Data)
• Develop 3rd product
line
• Increase revenue with
new products (non
ETS) to € 1bn
• Grow EPS in a range
of 10-20% p.a.
Software AG Group
S H A R E O F P R O D U C T R E V E N U E *
Business Targets 2018 (2018, base: 2012)
* According to mid-term business goals
BPE
IT PORTFOLIO
MANAGEMENT
REAL-TIME INTELLIGENCE AND BIG DATA
PROCESS AUTOMATION
AND INTEGRATION
COLLABORATIVE
PROCESS ANALYSIS
DATABASE MANAGEMENT &
APPLICATION MODERNIZATION
©2013 Software AG. All rights reserved.
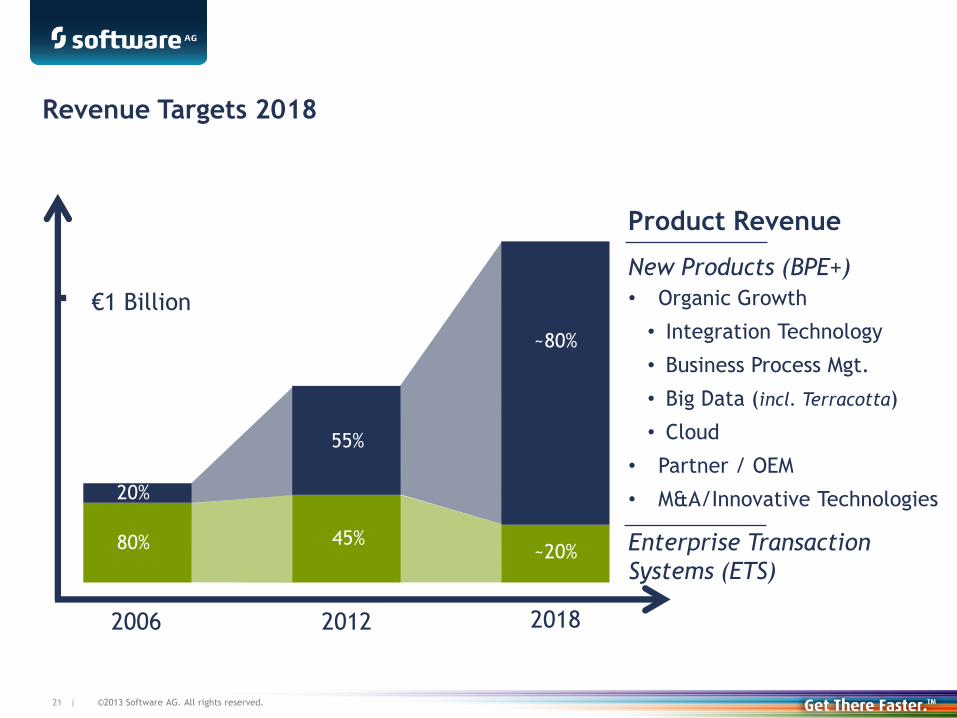
21 |
~80%
Enterprise Transaction
Systems (ETS)
New Products (BPE+)
• Organic Growth
• Integration Technology
• Business Process Mgt.
• Big Data (incl. Terracotta)
• Cloud
• Partner / OEM
• M&A/Innovative Technologies
2012 2018
45%
€1 Billion
20%
80%
2006
55%
~20%
Revenue Targets 2018
Product Revenue

©2013 Software AG. All rights reserved.
22 |
Solid Business Foundation
1. Footprint: Established global software player with blue chip customer base
2. Financials: Strong balance sheet and cash generation
3. Assets: Experienced management team and loyal expert staff
4. USP: Unique technology leadership in IT mega-trends / growth segments
5. Timing: Almost past ramp-up investments for future growth /
margin leverage ahead

©2013 Software AG. All rights reserved.
24 |
Euro 37%
US Dollar 26%
Other 9%
ILS 5%
AUD 5%
ZAR 3%
GBP 5%
CAD 3%
BRL 7%
(in €m; yoy)
Q3
2013
Q3
in %
YTD
2013
YTD
in %
Licenses -4.5 -5% -9.3 -4%
Maintenance -6.3 -6% -11.3 -4%
Consulting &
Other -1.7 -3% -3.2 -2%
Total -12.5 -5% -23.8 -3%
Currency impact on revenue
Currency impact on revenue
Q3 2013 / YTD 2013 (9 months)
37% revenue in Euro
63% revenue in foreign currency
Currency split YTD 2013

©2013 Software AG. All rights reserved.
25 |
Revenue Q3 2013 / YTD 2013 (9 month)
(in €m) Q3
2013
Q3 2012
Δ%
Δ%
acc
YTD
2013
YTD 2012
Δ%
Δ%
acc
Product 175.1 178.3 -2% 4% 501.3 515.3 -3% 1%
Licenses 79.9 80.5 -1% 5% 219.3 221.8 -1% 3%
Maintenance 95.2 97.8 -3% 4% 282.0 293.5 -4% -
Consulting & services 63.2 78.2 -19% -17% 199.0 253.7 -22% -20%
Other 0.2 0.9 - - 0.9 1.6 - -
Total 238.5 257.4 -7% -2% 701.2 770.6 -9% -6%
©2013 Software AG. All rights reserved.
26 |
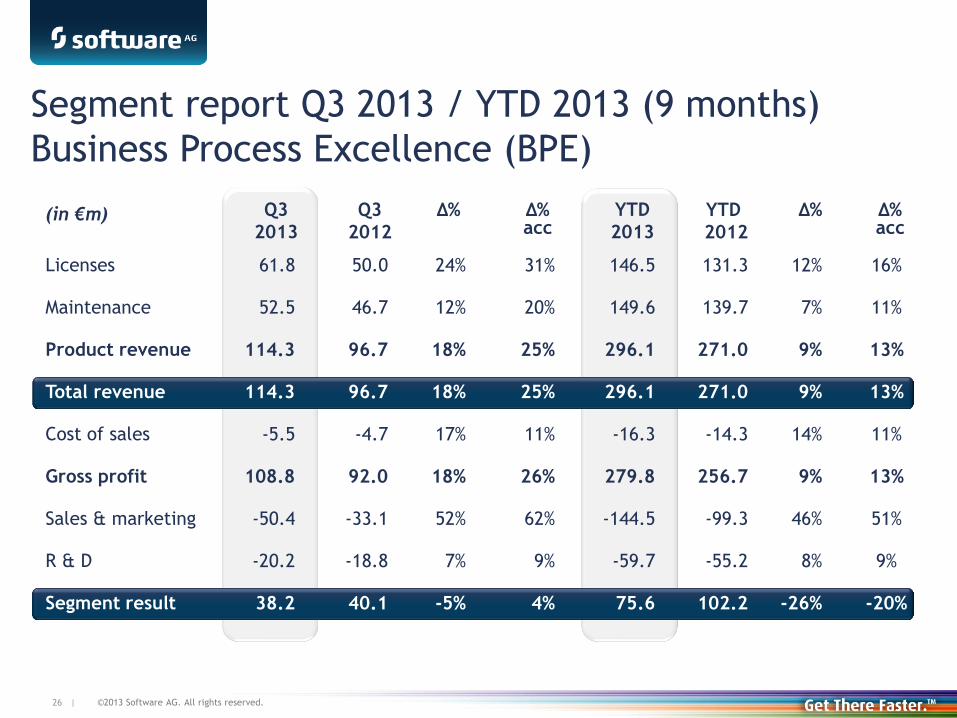
(in €m) Q3
2013
Q3
2012
Δ% Δ% acc
YTD
2013
YTD
2012
Δ% Δ% acc
Licenses 61.8 50.0 24% 31% 146.5 131.3 12% 16%
Maintenance 52.5 46.7 12% 20% 149.6 139.7 7% 11%
Product revenue 114.3 96.7 18% 25% 296.1 271.0 9% 13%
Total revenue 114.3 96.7 18% 25% 296.1 271.0 9% 13%
Cost of sales -5.5 -4.7 17% 11% -16.3 -14.3 14% 11%
Gross profit 108.8 92.0 18% 26% 279.8 256.7 9% 13%
Sales & marketing -50.4 -33.1 52% 62% -144.5 -99.3 46% 51%
R & D -20.2 -18.8 7% 9% -59.7 -55.2 8% 9%
Segment result 38.2 40.1 -5% 4% 75.6 102.2 -26% -20%
Segment report Q3 2013 / YTD 2013 (9 months)
Business Process Excellence (BPE)
©2013 Software AG. All rights reserved.
27 |
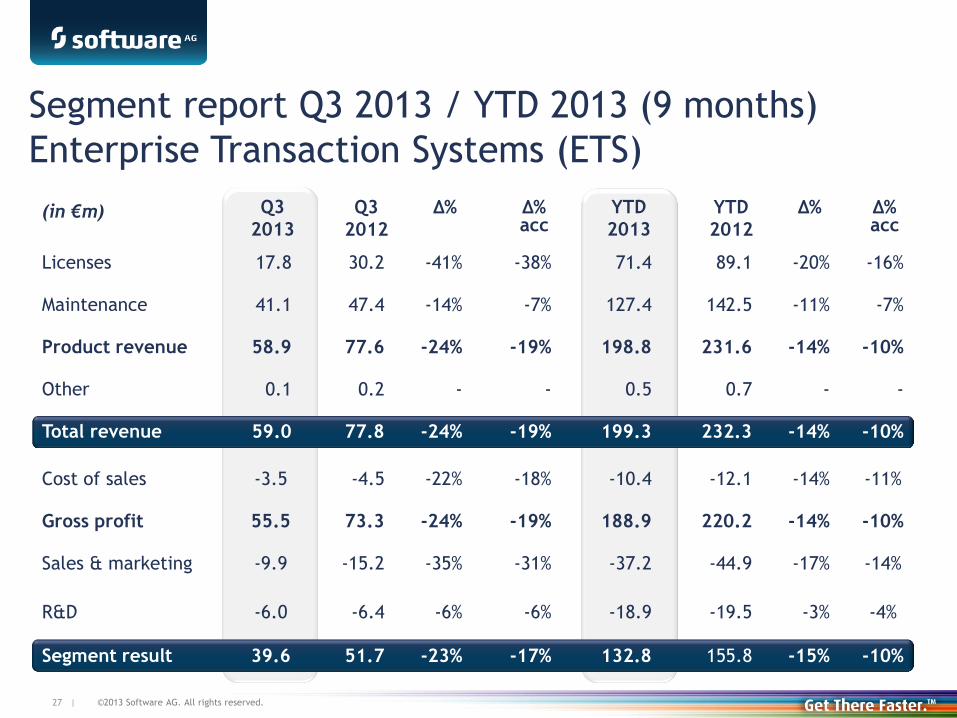
(in €m) Q3
2013
Q3
2012
Δ% Δ% acc
YTD
2013
YTD
2012
Δ% Δ% acc
Licenses 17.8 30.2 -41% -38% 71.4 89.1 -20% -16%
Maintenance 41.1 47.4 -14% -7% 127.4 142.5 -11% -7%
Product revenue 58.9 77.6 -24% -19% 198.8 231.6 -14% -10%
Other 0.1 0.2 - - 0.5 0.7 - -
Total revenue 59.0 77.8 -24% -19% 199.3 232.3 -14% -10%
Cost of sales -3.5 -4.5 -22% -18% -10.4 -12.1 -14% -11%
Gross profit 55.5 73.3 -24% -19% 188.9 220.2 -14% -10%
Sales & marketing -9.9 -15.2 -35% -31% -37.2 -44.9 -17% -14%
R&D -6.0 -6.4 -6% -6% -18.9 -19.5 -3% -4%
Segment result 39.6 51.7 -23% -17% 132.8 155.8 -15% -10%
Segment report Q3 2013 / YTD 2013 (9 months)
Enterprise Transaction Systems (ETS)
©2013 Software AG. All rights reserved.
28 |
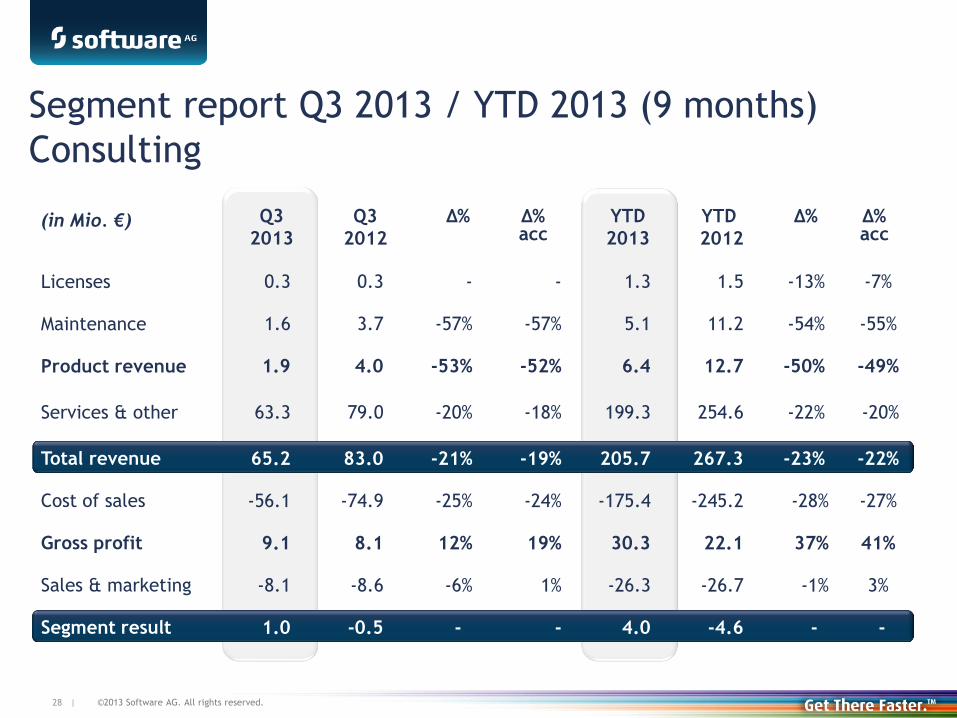
(in Mio. €) Q3
2013
Q3
2012
Δ% Δ% acc
YTD
2013
YTD
2012
Δ% Δ% acc
Licenses 0.3 0.3 - - 1.3 1.5 -13% -7%
Maintenance 1.6 3.7 -57% -57% 5.1 11.2 -54% -55%
Product revenue 1.9 4.0 -53% -52% 6.4 12.7 -50% -49%
Services & other 63.3 79.0 -20% -18% 199.3 254.6 -22% -20%
Total revenue 65.2 83.0 -21% -19% 205.7 267.3 -23% -22%
Cost of sales -56.1 -74.9 -25% -24% -175.4 -245.2 -28% -27%
Gross profit 9.1 8.1 12% 19% 30.3 22.1 37% 41%
Sales & marketing -8.1 -8.6 -6% 1% -26.3 -26.7 -1% 3%
Segment result 1.0 -0.5 - - 4.0 -4.6 - -
Segment report Q3 2013 / YTD 2013 (9 months)
Consulting

©2013 Software AG. All rights reserved.
29 |
44
Results Q3 2013 / YTD 2013 (9 months)
(in €m) Q3
2013
Q3
2012
Δ% Δ% acc
YTD
2013
YTD
2012
Δ% Δ% acc
Total revenue 238.5 257.4 -7% -2% 701.2 770.6 -9% -6%
Cost of sales -72.6 -90.2 -20% -18% -221.9 -289.5 -23% -23%
Gross profit 165.9 167.2 -1% 6% 479.3 481.1 - 4%
Margin in % 69.6% 65.0% 68.4% 62.4%
R & D -26.1 -25.2 4% 6% -78.5 -74.8 5% 6%
Sales & marketing -72.5 -60.4 20% 27% -219.3 -181.3 21% 25%
Administration -17.3 -20.0 -14% -11% -52.5 -54.2 -3% -1%
Other
income/expense -0.9 -0.5 - - 6.1 2.1 - -
EBIT 49.1 61.1 -20% -10% 135.1 172.9 -22% -15%
Margin in % 20.6% 23.7% 22.0% 19.3% 22.4% 20.3%
©2013 Software AG. All rights reserved.
30 |
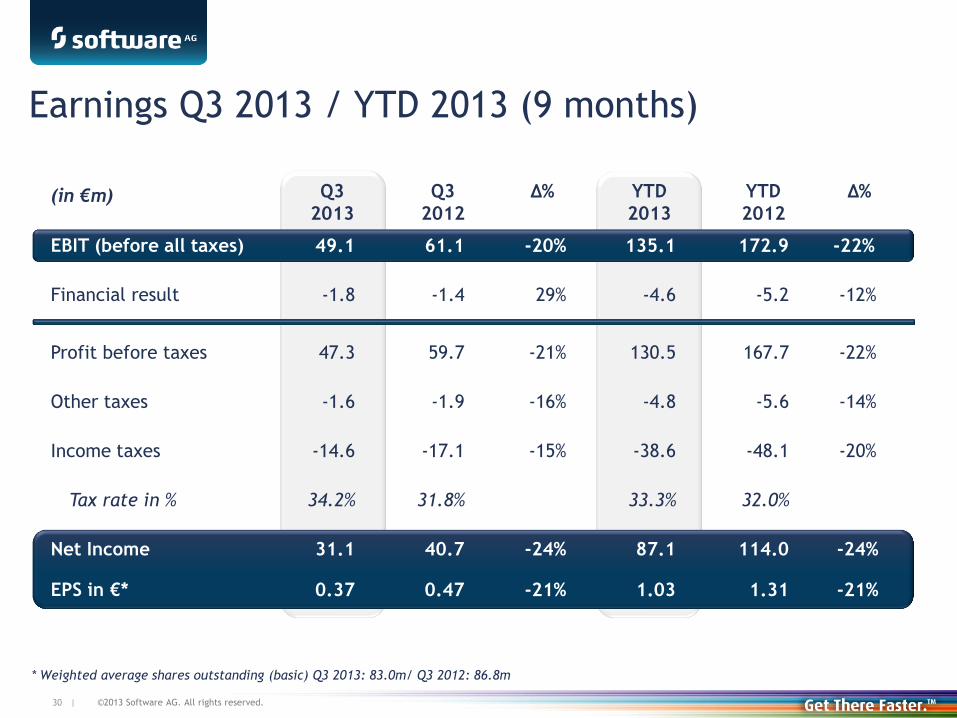
Earnings Q3 2013 / YTD 2013 (9 months)
(in €m) Q3
2013
Q3
2012
Δ% YTD
2013
YTD
2012
Δ%
EBIT (before all taxes) 49.1 61.1 -20% 135.1 172.9 -22%
Financial result -1.8 -1.4 29% -4.6 -5.2 -12%
Profit before taxes 47.3 59.7 -21% 130.5 167.7 -22%
Other taxes -1.6 -1.9 -16% -4.8 -5.6 -14%
Income taxes -14.6 -17.1 -15% -38.6 -48.1 -20%
Tax rate in % 34.2% 31.8% 33.3% 32.0%
Net Income 31.1 40.7 -24% 87.1 114.0 -24%
EPS in €* 0.37 0.47 -21% 1.03 1.31 -21%
* Weighted average shares outstanding (basic) Q3 2013: 83.0m/ Q3 2012: 86.8m

©2013 Software AG. All rights reserved.
31 |
Non-IFRS Earnings Q3 2013 / YTD 2013 (9 months)
* Based on average outstanding shares: Q3 2013: 83.0m / Q3 2012: 86.8m // 9m 2013: 84.2m / 9m 2012: 86.8m
(in €m) Q3
2013
Q3
2012
YTD
2013
YTD
2012
EBIT (before all taxes) 49.1 61.1 135.1 172.9
Share based payment 0.5 2.2 -0.8 4.2
Amortization on acquisition related
intangible assets 11.5 9.7 31.0 28.4
Reduction product revenue
by purchase price allocation 0.9 - 0.9 1.0
Other acquisition impacts 0.3 0.1 1.6 0.6
Restructuring/severances 4.0 0.7 9.2 2.5
EBIT (Non-IFRS) 66.3 73.8 177.0 209.6
in % of revenue (Non-IFRS) 27.7% 28.7% 25.2% 27.2%
Net income (Non-IFRS) 43.0 49.6 114.4 139.7
EPS (Non-IFRS)* 0.52 0.57 1.36 1.61

©2013 Software AG. All rights reserved.
32 |
Cash flow Q3 2013 / YTD 2013 (9 months)
(in €m) Q3
2013
Q3
2012
Δ% YTD
2013
YTD
2012
Δ%
Operating cash flow 36.6 28.7 28% 115.4 133.5 -14%
./. CapEx* -3.3 -4.1 -9.8 -8.0
Free cash flow 33.3 24.6 35% 105.6 125.5 -16%
as % of revenue 14% 9.6% 15.1% 16.3%
Free cash flow per share** 0.40 0.28 43% 1.25 1.45 -14%
* Cash flow from investing activities except acquisitions and except investments in debt instruments
** Based on average outstanding shares: Q3 2013: 83.0m / Q3 2012: 86.8m // 9m 2013: 84.2m / 9m 2012: 86.8m
©2013 Software AG. All rights reserved.
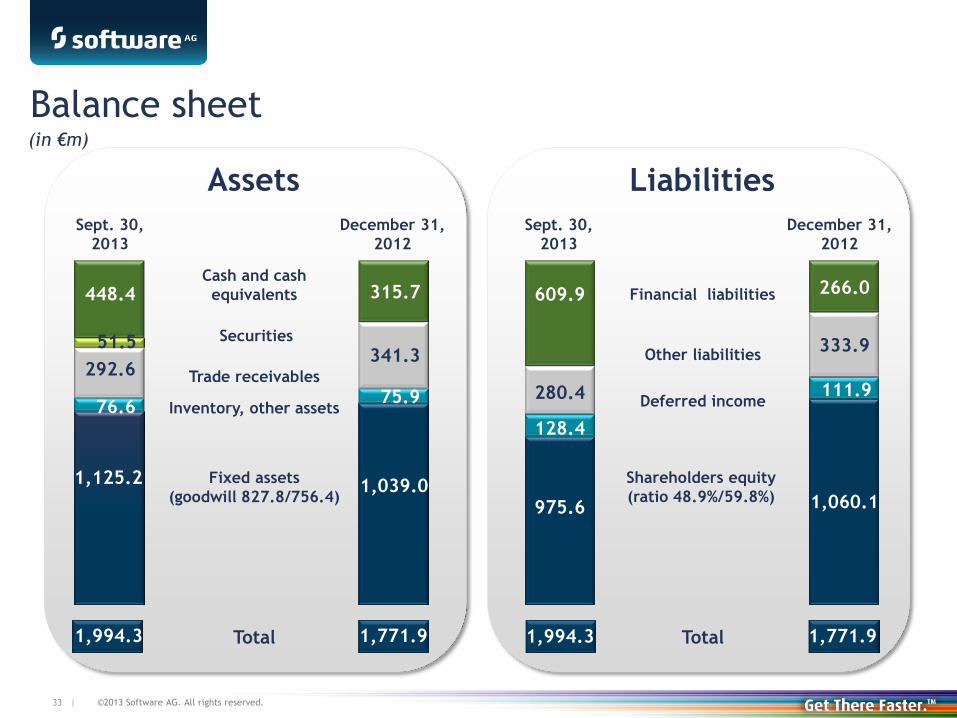
33 |
Sept. 30,
2013
Sept. 30,
2013
1,994.3 1,994.3
448.4
292.6
76.6
1,125.2
609.9
280.4
128.4
975.6
1,771.9
315.7
341.3
75.9
1,039.0
1,771.9
266.0
333.9
111.9
1,060.1
Cash and cash
equivalents
Trade receivables
Inventory, other assets
Fixed assets
(goodwill 827.8/756.4)
Total
Financial liabilities
Other liabilities
Deferred income
Shareholders equity
(ratio 48.9%/59.8%)
Total
Assets Liabilities
Balance sheet (in €m)
December 31,
2012
December 31,
2012
Securities 51.5

©2013 Software AG. All rights reserved.
34 |
Headcount by functional areas* and geography
(in FTE) Sept.30,
2013
June 30,
2013
Δ% qoq
Sept.30,
2012
Δ% yoy
Total 5,356 5,375 - 5 5,436 -1%
Consulting & services 2,375 2,484 -4% 2,715 -13%
R & D 1,005 941 7% 892 13%
Sales & marketing 1,261 1,229 3% 1,084 16%
Administration 715 721 -1% 745 -4%
USA 804 769 5% 739 9%
Germany 1,735 1,777 -2% 1,783 -3%
Rest of world 2,817 2,829 - 2,914 -3%
* According to P+L structure

©2013 Software AG. All rights reserved.
35 |
Non-IFRS Earnings (Q1 – Q3 2013)
*Based on average outstanding shares: Q1 2013: 85.8m / Q1 2012: 86.8 // Q2 2013: 83.8m / Q2 2012: 86.8m //
Q3 2013: 83.0m / Q3 2012: 86.8m
(in €m) Q1
2013
Q1
2012
Q2
2013
Q2
2012
Q3
2013
Q3
2012
EBIT (before all taxes) 41.6 54.8 44.4 57.1 49.1 61.1
Share based payment -0.6 0.7 -0.7 1.3 0.5 2.2
Amortization on acquisition
related intangible assets 9.4 9.2 10.1 9.5 11.5 9.7
Reduction product revenue
by purchase price allocation - 0.6 - 0.4 0.9 -
Other acquisition impacts 0.1 0.2 1.2 0.3 0.3 0.1
Restructuring/severances 1.5 0.4 3.7 1.4 4.0 0.7
EBIT (Non-IFRS) 52.0 65.9 58.7 70.0 66.3 73.8
in % of revenue (Non-IFRS) 23.1% 25.8% 24.7% 27.0% 27.7% 28.7%
Net income (Non-IFRS) 33.2 44.3 38.1 46.0 43.0 49.6
EPS (Non-IFRS)* 0.39 0.51 0.45 0.53 0.52 0.57
Net income (IFRS) 27.2 35.9 28.8 37.5 31.1 40.7

©2013 Software AG. All rights reserved.
36 |
Amortization / depreciation impact 2013ff
(preliminary)
Q3
2013
2.7
8.8
3.2
GJ
2013
GJ
2014ff*
* Estimated
Amortization IDS
(in €m)
Amortization other
Depreciation
10.6
32.2
13.1
10.6
32.4
12.8
©2013 Software AG. All rights reserved.
Follow us on Twitter:
@SoftwareAG_IR
Investor Relations
Uhlandstrasse 12
64297 Darmstadt
Germany
phone: +49 (0) 6151 / 92 1900
fax: +49 (0) 6151 / 9234 1900
softwareag.com
e-mail: [email protected]


