1 PRESS RELEASE 1 MARCH 2017 ROBUST PROFITABLE GROWTH IN 2016: PERFORMANCE POWERS DELIVERY OF LONG TERM VISION Full-year net revenues of Euro 1,871 million, up 17.7% on an organic 1 basis (+12.4% reported) compared to pro- forma 2 net revenues of Euro 1,665 million in 2015. Fourth-quarter net revenues up 19.2% on an organic basis (+11.4% reported), accelerating on the first nine months of the year (+17.1% organic) – Solid full-year organic performance across all business lines: Multi-brand In-Season net revenues up 16.0%, Multi-brand Off-Season net revenues up 19.5%, Gross Merchandise Value of Online Flagship Stores (GMV 3 ) up 23.7% – Positive growth in all key regions in 2016 Full-year adjusted EBITDA 4 of Euro 156 million, +17.0% compared to pro-forma adjusted EBITDA of Euro 133 million in 2015. EBITDA at Euro 143 million, +13.4% compared to pro-forma EBITDA of 126 million in 2015 Full-year adjusted net income 5 of Euro 69 million, +16.0% compared to pro-forma adjusted net income of 60 million in 2015. After Euro 26 million of non-cash amortisation related to the Purchase Price Allocation (“PPA”) 6 net of its related tax effect and 9 million of non-cash costs relating to incentive plans net of their related tax effects, net income at Euro 34 million in 2016. This compares to pro-forma net income of 53 million in 2015, which, as opposed to full-year 2016 net income, was not affected by the PPA-related amortisation Positive net financial position at Euro 105 million compared to Euro 62 million at 31 December 2015 Key Performance Indicators: – 28.8 million average monthly unique visitors, compared with 26.7 7 million in 2015 – 8.4 million orders, compared with 7.1 million in 2015 – Euro 334 AOV (Average Order Value), compared with Euro 352 in 2015, mainly reflecting unfavourable exchange rate movements – 2.9 million active customers, compared with 2.5 million in 2015 1 Organic net revenue growth is calculated at constant exchange rates and at a comparable perimeter by including net revenues of all online stores active at the end of each period, which were also active at the beginning of the same period of the previous year. Reported growth is calculated at current exchange rates and at actual perimeter. 2 In this entire document, pro-forma financials refer to the pro-forma financial statements relating to the financial year ended 31 December 2015, which have been prepared by aggregating the historical data of YOOX GROUP and of THE NET-A-PORTER GROUP Limited and then carrying out adjustments for the purpose of simulating the economic effects of the merger on the operating performance of YOOX NET-A-PORTER GROUP as if such transaction had virtually occurred at the beginning of the 2015 financial year (1 January 2015). For further information on the preparation criteria of pro-forma financials and on the limits concerning the information content thereof, please refer to the information contained in the FY2015 results press release published on the Company’s website at www.ynap.com. 3 Retail value of sales of all the online flagship stores, including the JV online store sales, to final customers, net of returns and customer discounts. Set-up, design and maintenance fees for the online flagship stores, accounted for within “Rest of the World and Not country related”, are excluded. 4 Does not include the non-cash costs relating to existing share-based incentive plans. 5 Excludes both the non-cash costs relating to existing share-based incentive plans, net of their related tax effects, and the non-cash amortisation related to the Purchase Price Allocation arising from the merger of YOOX GROUP and NET-A-PORTER GROUP, net of its related tax effect. 6 The Purchase Price Allocation process relates to the allocation of the identifiable part of the goodwill arising from the merger of YOOX GROUP and NET-A-PORTER GROUP to intangibles assets. 7 FY 2015 monthly unique visitors (“MUV”) have been restated to include the MUV from native apps, previously not tracked, for NET-A-PORTER, MR PORTER and THE OUTNET as well as to account for the change in data source used for YOOX MUV starting from November 2015. Specifically, YOOX MUV for both FY 2015 and FY 2016 are now sourced from Google Analytics, instead of Google Analytics for the website and SiteCatalyst for the mobile site as previously used. Note: For clarity of information, it should be noted that the percentage changes reported in this press release have been calculated using exact figures. It should also be noted that any differences found in some tables are due to rounding of values expressed in millions of Euro.
Transcript
1
PRESS RELEASE
1 MARCH 2017
ROBUST PROFITABLE GROWTH IN 2016: PERFORMANCE POWERS DELIVERY OF LONG TERM VISION
Full-year net revenues of Euro 1,871 million, up 17.7% on an organic1 basis (+12.4% reported) compared to pro-
forma2 net revenues of Euro 1,665 million in 2015. Fourth-quarter net revenues up 19.2% on an organic basis
(+11.4% reported), accelerating on the first nine months of the year (+17.1% organic)
– Solid full-year organic performance across all business lines: Multi-brand In-Season net revenues up 16.0%,
Multi-brand Off-Season net revenues up 19.5%, Gross Merchandise Value of Online Flagship Stores (GMV3)
up 23.7%
– Positive growth in all key regions in 2016
Full-year adjusted EBITDA4 of Euro 156 million, +17.0% compared to pro-forma adjusted EBITDA of Euro 133
million in 2015. EBITDA at Euro 143 million, +13.4% compared to pro-forma EBITDA of 126 million in 2015
Full-year adjusted net income5 of Euro 69 million, +16.0% compared to pro-forma adjusted net income of 60
million in 2015. After Euro 26 million of non-cash amortisation related to the Purchase Price Allocation (“PPA”)6
net of its related tax effect and 9 million of non-cash costs relating to incentive plans net of their related tax
effects, net income at Euro 34 million in 2016. This compares to pro-forma net income of 53 million in 2015,
which, as opposed to full-year 2016 net income, was not affected by the PPA-related amortisation
Positive net financial position at Euro 105 million compared to Euro 62 million at 31 December 2015
Key Performance Indicators:
– 28.8 million average monthly unique visitors, compared with 26.77 million in 2015
– 8.4 million orders, compared with 7.1 million in 2015
– Euro 334 AOV (Average Order Value), compared with Euro 352 in 2015, mainly reflecting unfavourable
exchange rate movements
– 2.9 million active customers, compared with 2.5 million in 2015
1 Organic net revenue growth is calculated at constant exchange rates and at a comparable perimeter by including net revenues of all online stores active at the end of each period, which were also active at the beginning of the same period of the previous year. Reported growth is calculated at current exchange rates and at actual perimeter. 2 In this entire document, pro-forma financials refer to the pro-forma financial statements relating to the financial year ended 31 December 2015, which have been prepared by aggregating the historical data of YOOX GROUP and of THE NET-A-PORTER GROUP Limited and then carrying out adjustments for the purpose of simulating the economic effects of the merger on the operating performance of YOOX NET-A-PORTER GROUP as if such transaction had virtually occurred at the beginning of the 2015 financial year (1 January 2015). For further information on the preparation criteria of pro-forma financials and on the limits concerning the information content thereof, please refer to the information contained in the FY2015 results press release published on the Company’s website at www.ynap.com. 3 Retail value of sales of all the online flagship stores, including the JV online store sales, to final customers, net of returns and customer discounts. Set-up, design and maintenance fees for the online flagship stores, accounted for within “Rest of the World and Not country related”, are excluded. 4 Does not include the non-cash costs relating to existing share-based incentive plans. 5 Excludes both the non-cash costs relating to existing share-based incentive plans, net of their related tax effects, and the non-cash amortisation related to the Purchase Price Allocation arising from the merger of YOOX GROUP and NET-A-PORTER GROUP, net of its related tax effect. 6 The Purchase Price Allocation process relates to the allocation of the identifiable part of the goodwill arising from the merger of YOOX GROUP and NET-A-PORTER GROUP to intangibles assets. 7 FY 2015 monthly unique visitors (“MUV”) have been restated to include the MUV from native apps, previously not tracked, for NET-A-PORTER, MR PORTER and THE OUTNET as well as to account for the change in data source used for YOOX MUV starting from November 2015. Specifically, YOOX MUV for both FY 2015 and FY 2016 are now sourced from Google Analytics, instead of Google Analytics for the website and SiteCatalyst for the mobile site as previously used.
Note: For clarity of information, it should be noted that the percentage changes reported in this press release have been calculated using exact figures. It should also be noted that any differences found in some tables are due to rounding of values expressed in millions of Euro.
Milan, 1 March 2017 - The Board of Directors of YOOX NET-A-PORTER GROUP S.p.A. (MTA: YNAP), the world’s leading online luxury fashion retailer, has today examined and approved the 2016 separate financial statements, which will be submitted for approval at the Shareholders’ Meeting, as well as the consolidated financial statements of YOOX NET-A-PORTER GROUP S.p.A. for the financial year ended 31 December 2016, compared to the same pro-forma financials related to the previous year.
In 2016, YOOX NET-A-PORTER GROUP recorded consolidated net revenues, net of returns and customer discounts, of Euro 1,870.7 million, up 17.7% on an organic basis (+12.4% reported) from pro-forma net revenues of Euro 1,665.0 million in 2015. In the fourth quarter of 2016, consolidated net revenues totalled Euro 538.2 million, up 19.2% on an organic basis (+11.4% reported), marking an acceleration on the first nine months of the year.
2015 CHANGE %
€ million 2016 % PRO-FORMA % REPORTED CONSTANT ORGANIC1
Total YOOX NET-A-PORTER-GROUP 538.2 100.0% 483.3 100.0% +11.4% +15.7% +19.2%
* Relates to Gross Merchandise Value (GMV3) growth at constant exchange rates and at comparable perimeter
In 2016, the Multi-brand In-Season business line, which includes NET-A-PORTER and MR PORTER, recorded consolidated net revenues of Euro 968.6 million, up 16.0% on an organic8 basis. Including the performance of THECORNER and SHOESCRIBE - which accounted for 1.1% of the Group’s net revenues in 2016 - this business line grew 13.0% at constant exchange rates (+8.4% reported) from pro-forma net revenues of Euro 893.3 million in 2015. In the fourth quarter of 2016, consolidated net revenues reached Euro 263.4 million, up 17.6% on an organic basis, an acceleration on the first nine months of the year. This performance reflects the increasingly unique portfolio of the world’s most coveted and prestigious brands as well as highly effective marketing initiatives to the higher-value customer base, rolled-out fully in the last quarter. Including THECORNER and SHOESCRIBE - which were discontinued on 31 August 2016, thus not contributing to the fourth quarter, this business line grew 11.6% at constant exchange rates (+5.7% reported) from Euro 249.3 million in the last quarter of 2015. In 2016, NET-A-PORTER and MR PORTER forged several unprecedented partnerships with leading global luxury brands, thus strengthening their positions as the premier online destinations for women’s luxury fashion and men’s style respectively. Most notably, NET-A-PORTER and MR PORTER became PRADA and IWC Schaffhausen exclusive online-only luxury retail partners: in particular, PRADA’s ready-to-wear was launched on both In-season online stores in July while IWC Schaffhausen debuted in November, thus marking a significant milestone for the Group’s nascent Fine Jewellery and Watches category. Over the course of the year, Tiffany & Co. and Moncler were also added on NET-A-PORTER, while Ermenegildo Zegna and Giorgio Armani were launched on MR PORTER. Numerous exclusive capsule collections were also introduced, including GUCCI for NET-A-PORTER and Moncler Gamme Bleu; most recently, in November 2016, NET-A-PORTER unveiled exclusive gowns curated for the Middle Eastern customer from leading designers including Alexander McQueen and Dolce & Gabbana. In 2016, MR PORTER further enriched its content offering with the introduction of The Daily, which features original daily style and trend updates, as well as a brand-new version of The Style Council, curating luxury lifestyle tips and inspiration from elite influencers. Finally, the introduction of MR PORTER’s Apple TV App was another first for luxury content and commerce, allowing customers to shop from its video content. Excellent results were achieved by PORTER, the Group’s fully shoppable global print fashion magazine launched in February 2014. Its circulation reached over 180,000 copies in 60 countries as at January 2017, with total paid subscriptions 30% ahead of the previous year. Finally, in December 2016 NET-A-PORTER and MR PORTER were named “Luxury Retailer of the Year 2016” by Luxury Daily in recognition of their unmatched brand portfolio, best-in-class customer experience and excellent content.
8 Organic net revenue growth for the In-Season business line is calculated at constant exchange rates and by excluding THE CORNER and SHOESCRIBE (discontinued on 31 August 2016) from the fourth quarter and the twelve months of both 2015 and 2016. Reported growth is calculated at current exchange rates and at actual perimeter.
Overall, as at 31 December 2016, the Multi-brand In-Season business line accounted for 51.8% of the Group’s consolidated net revenues.
In 2016, the Multi-brand Off-Season business line, which includes YOOX and THE OUTNET, recorded consolidated net revenues of Euro 696.8 million, up 19.5% at constant exchange rates (+16.8% reported) from pro-forma net revenues of Euro 596.4 million in 2015. In the fourth quarter of 2016, consolidated net revenues totalled Euro 200.6 million, up 16.4% at constant exchange rates (+14.1% reported) compared with net revenues of Euro 175.7 million in the same period of the previous year. Over the year, YOOX and THE OUTNET made significant headway in the enhancement of their brand offerings. Specifically, YOOX added Burberry Children and, over the last quarter of the year, the shop-in-shops of Polo Ralph Lauren and Montblanc, as well as Disney’s first online fashion store for designer collaborations. THE OUTNET added Tom Ford, Fendi and Etro and expanded its private label offering with the introduction of Iris & Ink first footwear collection. The new release of YOOX was also unveiled in 2016. The new release was redesigned with brand positioning and user-centric shopping experience in mind, leveraging real-time browsing activity and weather data based on geo-localisation, as well as purchase history. THE OUTNET also refreshed its interface, now more mobile-friendly, and launched its first Android native app. Overall, as at 31 December 2016, the Multi-brand Off-Season business line accounted for 37.2% of the Group’s consolidated net revenues.
The Online Flagship Stores business line includes the design, set-up and management of the Online Flagship Stores of some of the leading global luxury fashion brands, ranging from armani.com to chloe.com. In 2016, this business line achieved consolidated net revenues of Euro 205.3 million, up 19.0% at constant exchange rates (+17.1% reported) from pro-forma net revenues of Euro 175.3 million in 2015. Gross merchandise value (“GMV”9) advanced by 23.7% on an organic10 basis (+20.3% reported), with excellent performance of the joint venture with Kering, which benefited from the service and platform enhancements which were implemented during the year to provide customers with a more seamless customer experience across online and offline, and ultimately deliver the next generation of omni-channel engagement. In the fourth quarter of 2016, the Online Flagship Stores registered a strong net revenue acceleration, translating into consolidated net revenues of Euro 74.3 million, up 30.7% at constant exchange rates (+27.4% reported) from net revenues of Euro 58.3 million in the fourth quarter of 2015. Gross merchandise value (“GMV”) was up 34.6% on an organic basis (+27.7% reported). Isabel Marant was the headline addition to the Group’s Online Flagship Stores Brand Partners in 2016. The critically acclaimed brand signed a five-year global agreement with YOOX NET-A-PORTER GROUP for the set up and management of isabelmarant.com, which is due to launch in June 2017.
9 Retail value of sales of all the online flagship stores, including the JV online store sales to final customers, net of returns and customer discounts. Set-up, design and maintenance fees for the online flagship stores, accounted for within “Rest of the World and Not country related”, are excluded. 10 Gross merchandise value organic growth is calculated at constant exchange rates and at comparable perimeter by including gross merchandise value of all Online Flagship Stores active at the end of each period, which were also active at the beginning of the same period of the previous year. Reported growth is calculated at current exchange rates and at actual perimeter.
Meanwhile, the new online flagship stores of Chloé and Alfred Dunhill were launched in Europe, the United States and APAC, including China. In addition, A|X Armani Exchange debuted in North America in July 2016, as an extension of the Group’s existing global partnership with Armani, which was renewed for a further 10 years until 2025. Other important renewals were signed over the course of year. Specifically, the partnerships for valentino.com, REDValentino.com, moncler.com and marni.com were renewed for a further 5 years until 2021. Finally, in line with the Group’s dynamic and profit-driven portfolio management strategy, mono-brand contracts accounting for 0.8% of YOOX NET-A-PORTER GROUP net revenues in 2016 are not being renewed. Overall, as at 31 December 2016, the Online Flagship Stores business line accounted for 11.0% of the Group’s consolidated net revenues.
2015 CHANGE %
€ million 2016 % PRO-FORMA % REPORTED CONSTANT
Italy 124.8 6.7% 110.9 6.7% +12.5% +12.6%
UK 269.9 14.4% 263.9 15.8% +2.3% +15.3%
Europe (excl. Italy and the UK) 488.1 26.1% 439.5 26.4% +11.1% +13.2%
North America 573.9 30.7% 503.1 30.2% +14.1% +14.0%
APAC 302.3 16.2% 242.3 14.6% +24.8% +27.1%
Rest of the World + Not country related 111.7 6.0% 105.3 6.3% +6.0% +16.5%
Total YOOX NET-A-PORTER-GROUP 1,870.7 100.0% 1,665.0 100.0% +12.4% +16.0%
CHANGE %
€ million 4Q 2016 % 4Q 2015 % REPORTED CONSTANT
Italy 37.4 7.0% 35.8 7.4% +4.6% +4.8%
UK 78.2 14.5% 79.6 16.5% -1.7% +16.6%
Europe (excl. Italy and the UK) 134.4 25.0% 121.9 25.2% +10.2% +11.0%
North America 172.9 32.1% 151.0 31.2% +14.5% +13.6%
APAC 88.1 16.4% 66.5 13.8% +32.4% +36.0%
Rest of the World + Not country related 27.2 5.0% 28.4 5.9% -4.3% +10.2%
Total YOOX NET-A-PORTER-GROUP 538.2 100.0% 483.3 100.0% +11.4% +15.7%
YOOX NET-A-PORTER GROUP recorded positive organic growth across all of its key markets in 2016. UK ended 2016 with net revenues of Euro 269.9 million, up 15.3% at constant exchange rates (+2.3% reported). This performance was supported by an improved trend in the final quarter of the year, following softer second and third quarters as a result of Brexit. Specifically, in the fourth quarter of 2016, the UK posted net revenues of Euro 78.2 million, up 16.6% at constant exchange rates (-1.7% reported, penalised by the depreciation of the Euro / Sterling exchange rate), accelerating on the first nine months of the year driven by strong growth in spend among the higher-value customer base. North America, the Group’s no. 1 market, posted net revenues of Euro 573.9 million, up 16.3% on an organic basis (+14.1% reported) from Euro 503.1 million in 2015. In the fourth quarter, North America’s net revenues totalled Euro
6
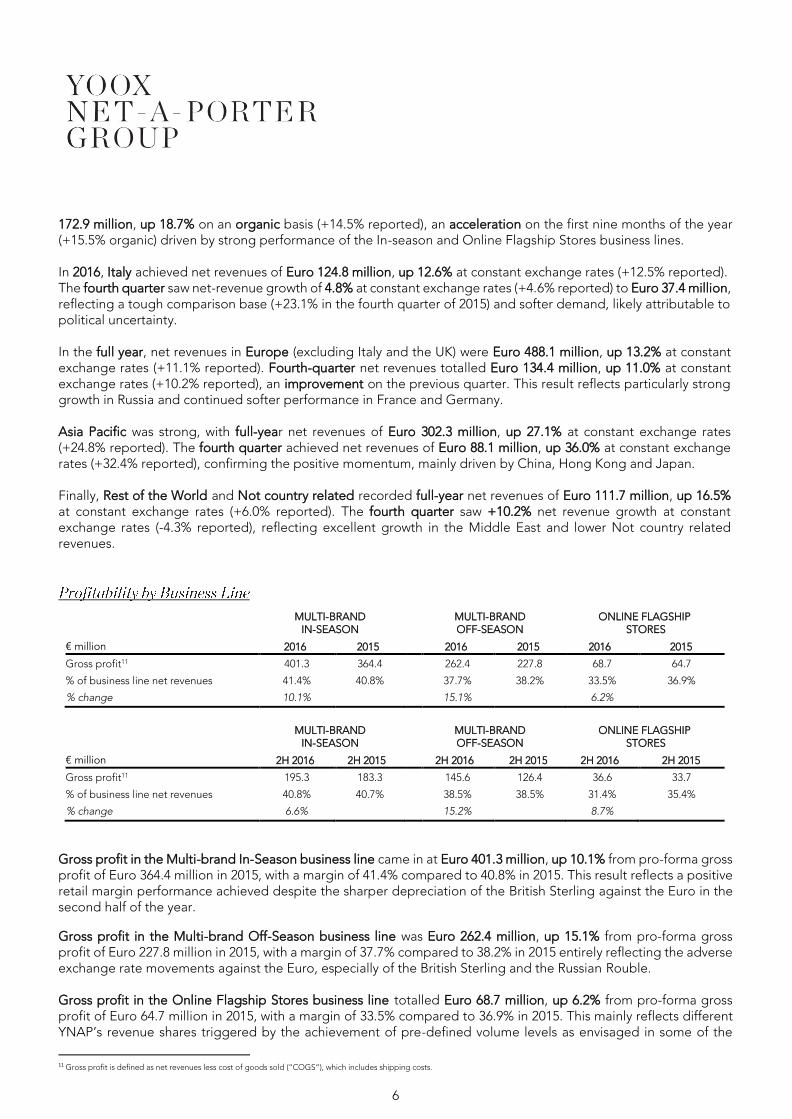
172.9 million, up 18.7% on an organic basis (+14.5% reported), an acceleration on the first nine months of the year (+15.5% organic) driven by strong performance of the In-season and Online Flagship Stores business lines. In 2016, Italy achieved net revenues of Euro 124.8 million, up 12.6% at constant exchange rates (+12.5% reported). The fourth quarter saw net-revenue growth of 4.8% at constant exchange rates (+4.6% reported) to Euro 37.4 million, reflecting a tough comparison base (+23.1% in the fourth quarter of 2015) and softer demand, likely attributable to political uncertainty. In the full year, net revenues in Europe (excluding Italy and the UK) were Euro 488.1 million, up 13.2% at constant exchange rates (+11.1% reported). Fourth-quarter net revenues totalled Euro 134.4 million, up 11.0% at constant exchange rates (+10.2% reported), an improvement on the previous quarter. This result reflects particularly strong growth in Russia and continued softer performance in France and Germany. Asia Pacific was strong, with full-year net revenues of Euro 302.3 million, up 27.1% at constant exchange rates (+24.8% reported). The fourth quarter achieved net revenues of Euro 88.1 million, up 36.0% at constant exchange rates (+32.4% reported), confirming the positive momentum, mainly driven by China, Hong Kong and Japan. Finally, Rest of the World and Not country related recorded full-year net revenues of Euro 111.7 million, up 16.5% at constant exchange rates (+6.0% reported). The fourth quarter saw +10.2% net revenue growth at constant exchange rates (-4.3% reported), reflecting excellent growth in the Middle East and lower Not country related revenues.
MULTI-BRAND
IN-SEASON MULTI-BRAND OFF-SEASON
ONLINE FLAGSHIP STORES
€ million 2016 2015 2016 2015 2016 2015
Gross profit11 401.3 364.4 262.4 227.8 68.7 64.7
% of business line net revenues 41.4% 40.8% 37.7% 38.2% 33.5% 36.9%
% of business line net revenues 40.8% 40.7% 38.5% 38.5% 31.4% 35.4%
% change 6.6% 15.2% 8.7%
Gross profit in the Multi-brand In-Season business line came in at Euro 401.3 million, up 10.1% from pro-forma gross profit of Euro 364.4 million in 2015, with a margin of 41.4% compared to 40.8% in 2015. This result reflects a positive retail margin performance achieved despite the sharper depreciation of the British Sterling against the Euro in the second half of the year.
Gross profit in the Multi-brand Off-Season business line was Euro 262.4 million, up 15.1% from pro-forma gross profit of Euro 227.8 million in 2015, with a margin of 37.7% compared to 38.2% in 2015 entirely reflecting the adverse exchange rate movements against the Euro, especially of the British Sterling and the Russian Rouble. Gross profit in the Online Flagship Stores business line totalled Euro 68.7 million, up 6.2% from pro-forma gross profit of Euro 64.7 million in 2015, with a margin of 33.5% compared to 36.9% in 2015. This mainly reflects different YNAP’s revenue shares triggered by the achievement of pre-defined volume levels as envisaged in some of the
11 Gross profit is defined as net revenues less cost of goods sold (“COGS”), which includes shipping costs.
7
existing contracts.
In 2016, adjusted EBITDA came in at Euro 155.7 million, up 17.0% from pro-forma adjusted EBITDA of Euro 133.1 million in the previous year. The adjusted EBITDA margin improved to 8.3%, compared with 8.0% in 2015. The adjusted EBITDA margin increase is attributable to the operating leverage in fulfillment costs and general expenses, which more than offset the slight decrease in gross margin, entirely attributable to the adverse exchange rate movements against the Euro.
After Euro 12.4 million of non-cash costs relating to share-based incentive plans, EBITDA amounted to Euro 143.4 million compared to pro-forma EBITDA of Euro 126.4 million in the previous year, with a margin at 7.7% in 2016, up from 7.6% in the previous year.
In 2016, adjusted net income amounted to Euro 69.3 million, an increase of 16.0% compared to pro-forma adjusted net income of Euro 59.7 million in 2015, with a margin at 3.7% compared to 3.6% in the previous year. This performance reflected the margin enhancement achieved at the EBITDA level, which was partly offset by higher net financial expenses and a higher tax burden as a percentage of net revenues compared to the previous year.
After Euro 26.3 million of non-cash amortisation related to the Purchase Price Allocation (“PPA”)12 arising from the merger net of its related tax effect and Euro 9.1 million of non-cash costs relating to share-based incentive plans net of their related tax effects, net income stood at Euro 33.9 million in 2016. This compares to pro-forma net income at Euro 53.4 million in 2015, which, as opposed to full-year 2016 net income, was not affected by the PPA-related amortisation.
In 2016, ordinary net working capital amounted to Euro 119.5 million compared to 96.1 million at 31 December 2015. This reflected an increase in inventories, fully funded by higher trade payables, as well as a reduction of other payables, mostly attributable to a timing effect in return payments which affected the 2015 December level.
In 2016, the Group continued to enhance its existing technology and operational capabilities while investing in the convergence to one shared global techno-logistics platform: capital expenditure amounted to Euro 136.9 million, compared to pro-forma capex of 83.7 million in the previous year.
In March 2016, YOOX NET-A-PORTER GROUP signed a long-term strategic partnership with IBM aimed at enhancing the Group’s focus on delivering customer-centric innovation and a step-change in omni-channel capabilities, while expediting and facilitating the post-merger system integration. In particular, the partnership encompasses the implementation of IBM’s best-in-class Order Management System (“OMS”) and core e-commerce platform, which will be carried out leveraging IBM’s full support on site and with direct daily access to its Development Labs in Toronto, Boston and across the world. In addition, as testament to their commitment to developing ground-breaking solutions for online luxury fashion retail, YNAP and IBM also created a Fashion &
12 The Purchase Price Allocation process relates to the allocation of the identifiable part of the goodwill arising from the merger of YOOX GROUP and NET-A-PORTER GROUP to intangibles assets.
8
Luxury Innovation Committee, a think-tank where YNAP and its Brand Partners can contribute ideas and input to IBM for the continuous development of bespoke e-commerce solutions. Similarly, YNAP joined the IBM Customer Advisory Council, a forum for a select group of IBM customers, whose input can directly influence future IBM product development. To this end, in November 2016, in line with schedule, the Group successfully delivered its first key integration milestone in the development of one shared global techno-logistics platform, with the migration of all the former YOOX GROUP’s multi-brand and mono-brand online stores to the new IBM’s OMS. The Group also rolled out existing omni-channel functionalities to more of the Group’s online flagship stores partners and further enhanced its mobile offering, including the launch of the MR PORTER’s Apple TV App and THE OUTNET’s first Android native app. Finally, 2016 saw the former THE NET-A-PORTER GROUP’s warehouse in Hong Kong becoming the Group’s distribution centre for the Asia Pacific region (excluding China and Japan) and the start of construction on the new In-season hub in Italy, expected to become operational in 2018.
As at 31 December 2016, the Group’s net financial position was positive at Euro 104.7 million, compared with 62.1 million at 31 December 2015. The increase in cash reflects the Euro 100 million equity capital raise subscribed for by Alabbar Enterprises in April 2016, Free Cash Flow of Euro -40.1 million at constant exchange rate and Euro -17.5 million of translation adjustment13.
2016
2015 PRO-FORMA
Monthly unique visitors15 (millions) 28.8 26.716
Orders (millions) 8.4 7.1
AOV17 (Euro) 334 352
Active customers18 (millions) 2.9 2.5
In 2016, the average number of monthly unique visitors to YOOX NET-A-PORTER GROUP’s online stores increased to 28.8 million compared with 26.7 million in 2015. The number of orders also grew to 8.4 million, up 18.2% on the previous year, with an Average Order Value (AOV) excluding VAT of Euro 334, compared with Euro 352 in 2015, mainly reflecting unfavourable exchange rate movements. Active customers increased to 2.9 million at 31 December 2016 compared with 2.5 million at 31 December 2015.
13 Translation adjustments refer to the delta FX which arises from converting Ordinary Working Capital, Capital Expenditure and Other into Euro at the exchange rates as at 31 December 2016 and 31 December 2015 14 Key performance indicators refer to the proprietary multi-brand online stores - NET-A-PORTER, MR PORTER, YOOX, THE OUTNET as well as THECORNER and SHOESCRIBE (discontinued on 31 August 2016) - and the Online Flagship Stores “Powered by YOOX NET-A-PORTER GROUP”. Key performance indicators related to the joint venture with Kering and to the jimmychoo.com online flagship store are excluded. 15 Monthly unique visitor is defined as a visitor who opened at least one browser session to visit the online store over the month. The figure reported is calculated as the average of monthly unique visitors for the reporting period. Source: Adobe Analytics for NET-A-PORTER and MR PORTER in 2016 and THE OUTNET; Adobe Analytics and Flurry for NET-A-PORTER and MR PORTER in 2015, Google Analytics for YOOX, THECORNER, SHOESCRIBE and the Online Flagship Stores "Powered by YOOX NET-A-PORTER GROUP". 16 FY 2015 monthly unique visitors (“MUV”) have been restated to include the MUV from native apps, previously not tracked, for NET-A-PORTER, MR PORTER and THE OUTNET as well as to account for the change in data source used for YOOX MUV starting from November 2015. Specifically, YOOX MUV for both FY 2015 and FY 2016 are now sourced from Google Analytics, instead of Google Analytics for the website and SiteCatalyst for the mobile site as previously used. 17 Average Order Value, or AOV, indicates the average value of all orders placed, excluding VAT. 18 Active customer is defined as a customer who placed at least one order during the 12 preceding months. The figure reported is calculated as the sum of the active customers of each online store for the reporting period.
9
At 31 December 2016, YOOX NET-A-PORTER GROUP had 4,128 employees.
In November 2016, YOOX NET-A-PORTER GROUP and Symphony, an entity controlled by Alabbar, partnered in a joint venture to create the Middle East’s undisputed leader for online luxury retail. The joint venture, 60% controlled by YOOX NET-A-PORTER GROUP, will operate in the Gulf Cooperation Council countries (“GCC”) and manage all of the Group’s existing multi-brand online stores in the region as well as, in agreement with the Brands, select existing and future Online Flagship Stores with significant business potential in the Middle East. The joint venture will establish on-the-ground operations to provide the Middle Eastern luxury customer with a fully localised offer, which will allow YOOX NET-A-PORTER GROUP to accelerate its growth in the region. This joint venture strengthened an existing relationship that was forged when Mohamed Alabbar became a strategic shareholder in YOOX NET-A-PORTER GROUP through the subscription of a €100 million capital increase in April 2016.
For further information, please refer to the related press releases, which are available on the Group’s corporate website in the section Investor Relations / Press releases.
The Parent company YOOX NET-A-PORTER GROUP S.p.A. ended 2016 with net revenues, net of returns and customer discounts, of Euro 578.9 million, up 12.6% at constant exchange rates (+11.8% reported) compared to Euro 517.8 million in the previous year. These revenues include amounts relating to the Parent Company’s supply of products to its subsidiaries. In 2016, net income of the Parent company was Euro -43.9 million, compared to Euro -11.4 million in the previous year. This result reflects lower gross margins for the Off-Season and Online Flagship Stores, higher operating costs for the development of one shared global techno-logistics platform across the Group - which has not yet started to generate its related revenues, as well as an increase in D&A. The 2016 YOOX NET-A-PORTER GROUP S.p.A separate financial statements, approved by the Board of Directors, will be submitted for approval at the Shareholders’ Meeting to be convened on 21 April 2017.
10
The start of the year saw key additions to the In-season unique brand portfolio, with the exclusive launch of Alaïa ready-to-wear on NET-A-PORTER in January 2017, thus complementing the Brand’s existing offering of shoes, bags and other accessories, as well as Stella McCartney’s first-ever menswear collection on MR PORTER in February 2017. In addition, following the successful debut of the Tiffany T collection in 2016, Tiffany & Co. and NET-A-PORTER - the only authorized online retail partner for Tiffany & Co. Jewellery - extended the scope of the global collaboration to the Infinity collection and Tiffany & Co Fine Watches, available from January 2017.
In line with the strategy of enriching its product offering, in January 2017 THE OUTNET launched The Activewear Boutique, a dedicated section of the online store featuring an edited selection of high-performance separates, accessories and footwear, all complemented with editorial stories from industry insiders.
YOOX NET-A-PORTER GROUP further deployed its dynamic and profit-driven mono-brand portfolio management strategy.
The Group is further strengthening its omni-channel capabilities for its Brand Partners to allow their end customers to benefit from a seamless online and offline experience. In particular, the Group is laying the foundations for the go-live of the first next generation omni-channel partnership for one of the Group’s Brand Partners and is continuing to roll-out existing innovative omni-channel functionalities to more of the Group’s online flagship stores, including Click from store, Check online in-store availability, Click & collect and Return in store for Moncler. YOOX NET-A-PORTER GROUP S.p.A. and Diesel S.p.A. (part of OTB group) jointly decided to terminate the agreement for the management of the Diesel online store in late March and refocus the collaboration between Diesel and YNAP on YOOX.COM. Diesel.com accounted for approximately 1% of YOOX NET-A-PORTER GROUP net revenues in 2016. The partnership between YOOX NET-A-PORTER GROUP and the OTB group - holding company of many leading brands in the fashion and luxury industry - successfully continues with the management of the online flagship stores for Maison Margiela, Marni, and Just Cavalli until 2020 / 2021.
In January 2017, as scheduled, the Group successfully delivered the convergence towards a common Enterprise Resource Planning software (“ERP”), by migrating the former THE NET-A-PORTER GROUP onto the former YOOX GROUP’s solution. The shared ERP enables easier and more scalable access to back-office systems across the entire Group and will be a key enabler for the omni-stock programme.
YOOX NET-A-PORTER GROUP expects to grow net revenues in line with its 5-Year Plan and achieve an improvement in the adjusted EBITDA margin in 2017: as a leader in the three luxury e-commerce segments in which it operates, the Group is uniquely positioned to support the efforts of the whole luxury industry to harness the potential of digital. In particular, the Multi-brand In-Season business line is anticipated to further enrich its unique brand portfolio: specifically, it will see the launch of new prestige brands and exclusive capsule collections, key developments for the new Fine Jewelry & Watches category and the launch of the MR PORTER private label. In addition, this business line will further enhance its content offering to drive engagement and improve its luxurious service with a specific focus on its higher-value customer base. The Multi-brand Off-Season business line is expected to mainly benefit from the start of THE OUTNET’s international expansion, further brand and product offering enrichment, including the debut of the YOOX’s private label business, as well as continuous service enhancements. Finally, growth in the Online Flagship Stores business line is anticipated to leverage significant advancements in its omni-channel proposition and relevant front-end platform upgrades, including strengthened personalisation and precision marketing capabilities. In addition, this business line will make further progress on business development, including the launch of isabelmarant.com. The Group plans to invest approximately Euro 160 to 170 million in 2017, primarily in technology. In particular, these investments will be dedicated to the roll-out of the new core e-commerce platform for THE OUTNET and select online flagship stores and the completion of the omni-stock programme for the Off-Season business, important milestones for the creation of a shared global techno-logistics platform. YOOX NET-A-PORTER GROUP will also make significant headway in the development of its operations: most notably, the opening of a new office and distribution centre in Dubai, new photo studios and logistics spaces at the Interporto logistics pole in Bologna, as well as the set-up of the In-Season logistics hub in Milan with state-of-the-art automated Order Storage & Retrieval System. Finally, the Group will further enhance its delivery and return proposition to continue setting new service standards for luxury e-commerce.
***
Pursuant to Article 154-bis, paragraph 2 of the Italian Consolidated Law on Finance, Enrico Cavatorta, the Director responsible for preparing the financial statements, certifies that the accounting information contained in this press release corresponds to documentary records and to accounting books and ledger entries.
***
12
The Board of Directors of YOOX NET-A-PORTER GROUP S.p.A. acknowledges the resignations of Gary Saage from
his office as non-executive member of the Board of Directors of the Company effective on 21 April 2017, the date
determined for the Annual Shareholders Meeting for the approval of the financial statements as at 31 December
2016. Such resignations are related to the recent changes of the organizational structure of Richemont. The Board
of Directors thanks Mr. Saage for the precious contribution that he has made over the years.
Gary Saage is not a member of any Board committee nor – based on the information held by the Company to date
- does not hold, either directly and/or indirectly, any ordinary shares of YOOX NET-A-PORTER GROUP S.p.A
The Board of Directors of YOOX NET-A-PORTER GROUP S.p.A. further resolved to call the Shareholders’ Ordinary
Meeting on Friday 21 2017, to resolve upon the Statutory Financial Statements of YOOX NET-A-PORTER GROUP
S.p.A. as at 31 December 2016, on the Remuneration Report pursuant to article 123-ter of D.Lgs. 58/1998, on the
appointment of a new member of the Board of Directors and on the renewal of the authorization for the buyback
and disposal of treasury shares.
For further information please refer to the relevant Directors’ Report on the items on the agenda. The documentation required by applicable laws in relation to the items and proposals on the agenda will be made available to the public, by the legally required deadlines, at the Company’s registered offices at Via Morimondo 17, Milan and at Borsa Italiana S.p.A.. Shareholders may view and obtain copies of the above documentation, which will also be made available, by the legally required deadlines, on the Company’s website www.ynap.com.
A conference call will take place today, Wednesday 1 March 2017, at 17:45 (CET), during which YOOX NET-A-PORTER GROUP’s management will present the Group’s full year results for 2016. If you wish to take part in the conference call, please dial one of the following numbers: from Italy: +39 02 805 88 11
from the UK: +44 121 281 8003
from the US (local number): +1 718 705 8794
from the US (toll-free number): 1 855 265 6959 The presentation may be downloaded before the start of the conference call from the Investor Relations section of the YOOX NET-A-PORTER GROUP website: www.ynap.com/pages/investor-relations/results-centre/presentation/. A recording of the conference call will be available from today, after the end of the call, until Wednesday 15 March 2017 on the following numbers: from Italy: +39 02 724 95
from the UK: +44 121 281 8005
from the US (local number): +1 718 705 8797 Access code: 823#
Adjusted profit before tax22 93.7 77.6 20.7% 42.3 36.5 16.0%
% of consolidated net revenues 5.0% 4.7% 4.3% 4.2%
Taxes (24.4) (17.9) 36.4% (10.0) (8.9) 13.0%
Adjusted net income23 69.3 59.7 16.0% 32.2 27.6 17.0%
% of consolidated net revenues 3.7% 3.6% 3.3% 3.2%
19 Gross profit is earnings before fulfillment costs excluding non-cash costs relating to existing share-based incentive plans (“IPC”), sales and marketing costs excluding IPC, general and administrative expenses excluding IPC, IPC, other operating income and expenses, depreciation and amortisation, non-recurring expenses, income/loss from investment in associates, financial income and expenses and income taxes. Since gross profit is not recognised as an accounting measure under Italian GAAP or the IFRS endorsed by the European Union, its calculation might not be standard, and the measurement criterion adopted by the Group might not be consistent with that adopted by other groups. Accordingly, the resulting figures may not be comparable. 20 Adjusted EBITDA is earnings before ordinary depreciation and amortisation, non-recurring expenses, income/loss from investment in associates, financial income and expenses and income taxes and excludes non-cash costs relating to existing share-based incentive plans (IPC). Since adjusted EBITDA is not recognised as an accounting measure under the IFRS endorsed by the European Union, its calculation might not be standard. Group management uses adjusted EBITDA to monitor and measure the Group ’s performance. The management believes that adjusted EBITDA is an important indicator of operating performance in that it is not affected by the various criteria used to calculate taxes, the amount and characteristics of invested capital and the related amortisation and depreciation methods. The criterion adopted by the Group to calculate adjusted EBITDA might not be consistent with that used by other groups. Accordingly, the resulting figures may not be comparable. 21 Adjusted operating profit is earnings before income/loss from investment in associates, financial income and expenses and income taxes and excludes non-cash costs relating to existing share-based incentive plans (IPC) and the non-cash amortisation related to the Purchase Price Allocation (“PPA”) arising from the merger. Since adjusted operating profit is not recognised as an accounting measure under the IFRS endorsed by the European Union, its calculation might not be standard. The criterion adopted by the Group to calculate adjusted operating profit might not be consistent with that used by other groups. Accordingly, the resulting figures may not be comparable. 22 Adjusted profit before tax is earnings before income taxes and excludes non-cash costs relating to existing share-based incentive plans (IPC) and the non-cash amortisation related to the Purchase Price Allocation (“PPA”) arising from the merger. Since adjusted profit before tax is not recognised as an accounting measure under Italian GAAP or the IFRS endorsed by the European Union, its calculation might not be standard. The criterion adopted by the Group to calculate adjusted profit before tax might not be consistent with that used by other groups. Accordingly, the resulting figures may not be comparable. 23 Adjusted Net Income is defined as the earnings of the period before the non-cash costs relating to existing share-based incentive plans (IPC), net of their related tax effects, and before the non-cash amortisation related to the Purchase Price Allocation (“PPA”) arising from the merger, net of its related tax effect.
16
€ million 2016 2015
PRO-FORMA CHANGE 2H 2016 2H 2015
PRO-FORMA CHANGE
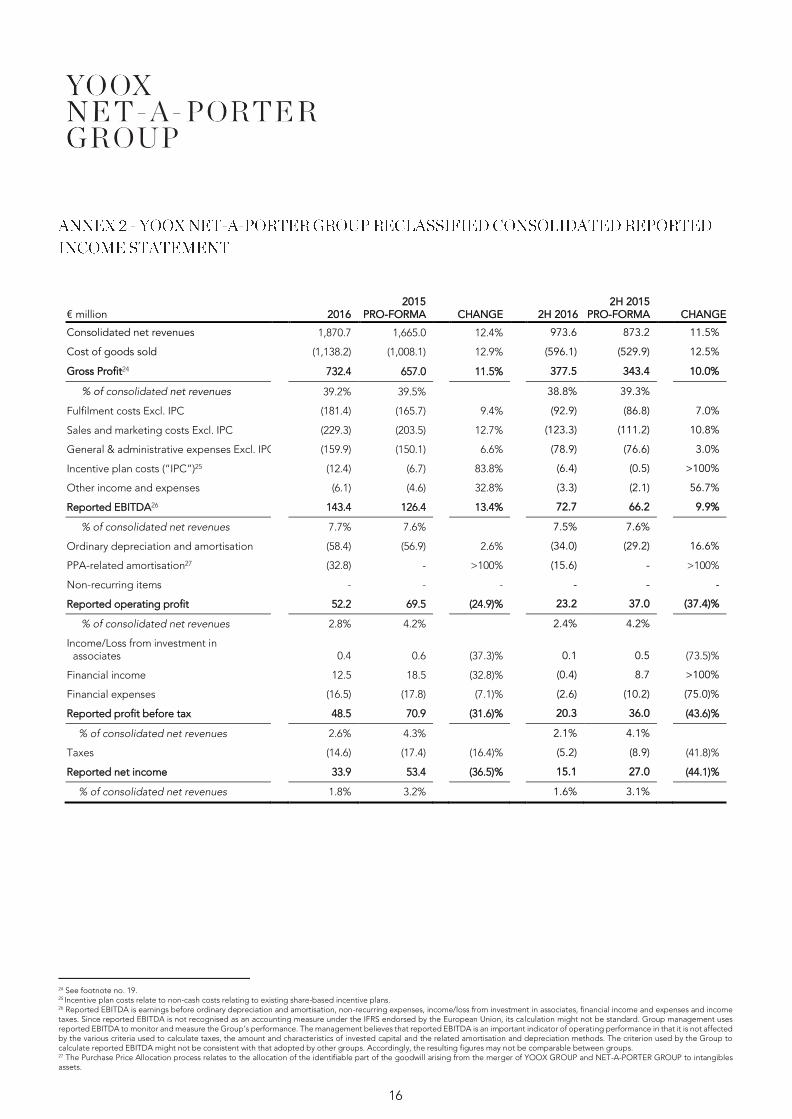
Consolidated net revenues 1,870.7 1,665.0 12.4% 973.6 873.2 11.5%
Cost of goods sold (1,138.2) (1,008.1) 12.9% (596.1) (529.9) 12.5%
Reported profit before tax 48.5 70.9 (31.6)% 20.3 36.0 (43.6)%
% of consolidated net revenues 2.6% 4.3% 2.1% 4.1%
Taxes (14.6) (17.4) (16.4)% (5.2) (8.9) (41.8)%
Reported net income 33.9 53.4 (36.5)% 15.1 27.0 (44.1)%
% of consolidated net revenues 1.8% 3.2% 1.6% 3.1%
24 See footnote no. 19. 25 Incentive plan costs relate to non-cash costs relating to existing share-based incentive plans. 26 Reported EBITDA is earnings before ordinary depreciation and amortisation, non-recurring expenses, income/loss from investment in associates, financial income and expenses and income taxes. Since reported EBITDA is not recognised as an accounting measure under the IFRS endorsed by the European Union, its calculation might not be standard. Group management uses reported EBITDA to monitor and measure the Group’s performance. The management believes that reported EBITDA is an important indicator of operating performance in that it is not affected by the various criteria used to calculate taxes, the amount and characteristics of invested capital and the related amortisation and depreciation methods. The criterion used by the Group to calculate reported EBITDA might not be consistent with that adopted by other groups. Accordingly, the resulting figures may not be comparable between groups. 27 The Purchase Price Allocation process relates to the allocation of the identifiable part of the goodwill arising from the merger of YOOX GROUP and NET-A-PORTER GROUP to intangibles assets.
Net debt / (net financial position)30 (104.7) (62.1) 68.6%
Total sources of financing 1,831.3 1,974.4 (7.2%)
€ million 2016
2015
PRO-FORMA
Adjusted EBITDA 155.7 133.1
Net Financial Income / (Expenses) & Associates (8.8) 1.3
Taxes Paid (24.9) (28.9)
Change in Ordinary Working Capital (23.4) (12.2)
Capital Expenditure (136.9) (83.7)
Other31 (19.2) (4.1)
Translation Adjustment32 17.5 -
Free Cash Flow (at constant FX) (40.1) 5.5
M&A related items - (19.4)
Proceeds from Stock Option Exercise & Capital Increase 100.2 15.6
Translation Adjustment32 (17.5) -
Change in Net Financial Position (at current FX) 42.6 1.7
28 Net working capital is current assets, net of current liabilities, with the exception of cash and cash equivalents, bank loans and borrowings and other financial payables falling due within one year and financial assets and liabilities included under other current assets and liabilities. Net working capital is not recognised as an accounting measure under Italian GAAP or the IFRS endorsed by the European Union. The measurement criterion adopted by the Company might not be consistent with that adopted by other groups. Accordingly, the balance obtained by the Company may not be comparable with the figures obtained by other groups. 29 Net invested capital is the sum of net working capital, non-current assets and non-current liabilities net of non-current financial liabilities. Net invested capital is not recognised as an accounting measure under Italian GAAP or the IFRS endorsed by the European Union. The measurement criterion adopted by the Company might not be consistent with that adopted by other groups. Accordingly, the balance obtained by the Company may not be comparable with the figures obtained by other groups. 30 Net debt (or net financial position) is the sum of cash and cash equivalents, other current financial assets, net of bank loans and borrowings and other financial payables falling due within one year, other current financial liabilities and non-current financial liabilities. Net debt (or net financial position) is not recognised as an accounting measure under Italian GAAP or the IFRS endorsed by the European Union. The measurement criterion adopted by the Company might not be consistent with that adopted by other groups. Accordingly, the balance obtained by the Company may not be comparable with the figures obtained by other groups. Other current financial assets are not governed in detail in CESR's definition of net debt (or net financial position): the Group considers it appropriate to supplement this definition by including receivables from acquirers and logistics operators that have been requested to collect cash on delivery under “other current financial assets”. 31 Other mainly refers to exchange rate impact resulting from the consolidation of foreign subsidiaries and unrealised gain and losses. 32 Translation Adjustment refer to the delta FX which arises from converting Ordinary Working Capital, Capital Expenditure and Other into Euro at the exchange rates as at 31 December 2016 and 31 December 2015.
18
€ million 2016 2015 CHANGE
Net revenues 578.9 517.8 11.8%
Cost of goods sold (445.2) (373.4) 19.2%
Gross profit33 133.7 144.5 (7.5)%
% of net revenues 23.1% 27.9%
Fulfillment costs (48.1) (44.1) 9.0%
Sales and marketing costs (40.9) (32.2) 23.7%
General & administrative expenses (54.8) (28.4) 92.9%
Other income and expenses (6.0) (4.1) 47.1%
Reported EBITDA34 (16.1) 35.7 >100.0%
% of net revenues (2.8)% 6.9%
Depreciation and amortisation (35.7) (29.1) 22.6%
Non-recurring items35 - (18.4) -
Operating profit (51.8) (11.7) >100%
% of net revenues (8.9)% (2.3)%
Income/Loss from investment in associates 0.4 3.2 (88.3)%
Financial income 9.2 4.9 86.9%
Financial expenses (12.7) (10.1) 25.5%
Profit before tax (54.9) (13.8) >100%
% of net revenues (9.5)% (2.7)%
Taxes 11.0 2.4 >100%
Reported net income (43.9) (11.4) >100%
% of net revenues (7.6)% (2.2)%
33 Refer to footnote 19. 34 Refer to footnote 26. 35 Non-recurring items mainly include legal, fiscal, accounting, valuation and strategic advisory consulting fees as well as general administrative costs related to the merger.