37
The Consequences of U.S. Technology Changes for Productivity in Advanced Economies RUHR ECONOMIC PAPERS Steffen Elstner Svetlana Rujin #796

The Consequences of U.S. Technology Changes for Productivity in Advanced Economies
RUHRECONOMIC PAPERS
Steffen Elstner Svetlana Rujin
#796

Imprint
Ruhr Economic Papers
Published by
RWI – Leibniz-Institut für Wirtschaftsforschung Hohenzollernstr. 1-3, 45128 Essen, Germany
Ruhr-Universität Bochum (RUB), Department of Economics Universitätsstr. 150, 44801 Bochum, Germany
Technische Universität Dortmund, Department of Economic and Social Sciences Vogelpothsweg 87, 44227 Dortmund, Germany
Universität Duisburg-Essen, Department of Economics Universitätsstr. 12, 45117 Essen, Germany
Editors
Prof. Dr. Thomas K. Bauer RUB, Department of Economics, Empirical Economics Phone: +49 (0) 234/3 22 83 41, e-mail: [email protected]
Prof. Dr. Wolfgang Leininger Technische Universität Dortmund, Department of Economic and Social Sciences Economics – Microeconomics Phone: +49 (0) 231/7 55-3297, e-mail: [email protected]
Prof. Dr. Volker Clausen University of Duisburg-Essen, Department of Economics International Economics Phone: +49 (0) 201/1 83-3655, e-mail: [email protected]
Prof. Dr. Roland Döhrn, Prof. Dr. Manuel Frondel, Prof. Dr. Jochen Kluve RWI, Phone: +49 (0) 201/81 49-213, e-mail: [email protected]
Editorial Office
Sabine Weiler RWI, Phone: +49 (0) 201/81 49-213, e-mail: [email protected]
Ruhr Economic Papers #796
Responsible Editor: Roland Döhrn
All rights reserved. Essen, Germany, 2019
ISSN 1864-4872 (online) – ISBN 978-3-86788-924-7
The working papers published in the series constitute work in progress circulated to stimulate discussion and critical comments. Views expressed represent exclusively the authors’ own opinions and do not necessarily reflect those of the editors.

Ruhr Economic Papers #796
Steffen Elstner and Svetlana Rujin
The Consequences of U.S. Technology Changes for Productivity in Advanced
Economies

Bibliografische Informationen der Deutschen Nationalbibliothek
The Deutsche Nationalbibliothek lists this publication in the Deutsche National bibliografie; detailed bibliographic data are available on the Internet at http://dnb.dnb.de
RWI is funded by the Federal Government and the federal state of North Rhine-Westphalia.
http://dx.doi.org/10.4419/86788924ISSN 1864-4872 (online)ISBN 978-3-86788-924-7

Steffen Elstner and Svetlana Rujin1
The Consequences of U.S. Technology Changes for Productivity in Advanced Economies
AbstractSince at least the mid-2000’s, many advanced economies have experienced low productivity growth. This development is often related to the declining productivity gains at the technology frontier, which is commonly assumed to be determined by the U.S. We challenge this explanation by studying the effects of changes in U.S. technology on the productivity level in other advanced economies. Overall, we find positive but small spillover effects of U.S. technology shocks. The elasticity of foreign labor productivity with respect to a one percent increase in the U.S. technology level is significantly lower than one for many countries. The recent U.S. productivity slowdown, therefore, had a limited effect on productivity developments in advanced economies. Furthermore, our results suggest that institutional factors are not able to explain cross-country differences in the size of the spillover effects. If any, regulation of the service sector seems to play a role.
JEL Classification: O40, E24, C32, F00
Keywords: Labor productivity; international spillover effects; technology shocks; structural VARs
February 2019
1 Steffen Elstner, RWI; Svetlana Rujin, RUB and RWI. – We thank the participants of the Brown Bag Seminar at RWI, the 28th Annual Meeting of the Midwest Econometrics Group in Madison (Wisconsin), the 6th Annual Conference of the International Association for Applied Econometrics as well as Torsten Schmidt for helpful comments and suggestions. We are grateful to Marcelle Chauvet (University of California Riverside, CA) for discussing our paper at the MEG 2018 meeting. We thank the International Association for Applied Econometrics for supporting this article with a travel grant for the IAAE 2019 Annual Conference and the Board of Directors of the RWI and Christoph M. Schmidt for financial support.– All correspondence to: Svetlana Rujin, RWI, Hohenzollernstr. 1/3, 45128 Essen, Germany, e-mail: [email protected]

Das RWI wird vom Bund und vom Land Nordrhein-Westfalen gefördert.
Leibniz-Institut für Wirtschaftsforschung

1 Introduction
Since at least the mid-2000’s, many advanced economies have experienced low productivity
growth. This development is often related to the declining productivity gains at the technology
frontier, which is commonly assumed to be determined by the U.S. (IMF, 2015). This paper
challenges this explanation and poses the questions (i) whether sizable productivity spillovers
of U.S. technology gains on advanced economies exist, and (ii) whether institutional rigidities
of labor, product, and financial markets in the corresponding economies have a quantitative
importance for shaping these effects?
These research questions are motivated by Keller (2010), who documents that for most
countries, foreign sources of technology are estimated to account for around 90 percent of do-
mestic productivity growth. Furthermore, new technologies originate from a small number of
countries that determine the pattern of worldwide technology transmission. Since the U.S. is
commonly regarded as the world technology frontier, the focus of this paper is on productiv-
ity spillovers of U.S. technology gains on advanced economies. Additionally, we scrutinize the
work of Cette, Fernald, and Mojon (2016), who state that while the U.S. experienced a burst
of innovation related to the use of new technologies at the turn of the millenium, the conti-
nental European economies were falling back relative to the U.S. level at varying rates. In this
context, the authors highlight the role of labor and product market regulations in shaping the
transmission of ideas and innovations across borders.
To provide insights into how technological innovations in the U.S. economy affect labor
productivity in advanced countries, we focus on technology spillovers rather than on technology
diffusion. The latter is a process that spans over decades. Comin, Hobijn, and Rovito (2008)
and Comin and Hobijn (2010) estimate that, on average, the time lags in the diffusion of new
technologies amount to 45 years. In contrast to this, the spillover effects become apparent
in a shorter period of time. Hence, we consider a time horizon for the transmission of U.S.
technology gains of up to 10 years.
The recent slowdown in U.S. productivity growth has become subject of extensive research.
Fernald (2015) finds two structural breaks the mean of U.S. hourly productivity growth in the
post-1973 time period.1 Thus, while the average productivity growth in the period 1995 to
2003 amounted to 2.5 percent, it dropped to 1.0 percent in the period 2004 to 2017. The
corresponding numbers for utilization-adjusted total factor productivity (TFP) growth in the
business sector are 2.0 percent and 0.5 percent, respectively. Existing contributions explain this
phenomenon through the lens of the role of financial frictions (Anzoategui, Comin, Gertler, and
Martinez, 2018), a lack of major innovations (Fernald, 2015; Gordon, 2012), problems regarding
technology diffusion (Andrews, Criscuolo, and Gal, 2015; Decker, Haltiwanger, Jarmin, and
Miranda, 2014), and measurement issues (Byrne, Fernald, and Reinsdorf, 2016; Syverson, 2017;
Kurmann and Sims, 2017). One contribution of our study is, therefore, that we address this
1Using the Bai-Perron test for multiple structural changes in the mean of the quarterly growth rates, Fernald(2015) finds structural breaks in the fourth quarter of 1995 and in the fourth quarter of 2003.
2

issue from an international perspective and provide elasticities that show how strongly the
technology-driven slowdown in U.S. productivity growth affected the productivity figures in
other advanced economies.
To date, much of the literature has focused on international differences in the productivity
levels. Acemoglu and Zilibotti (2001) argue that the technology-skill mismatch can explain a
substantial fraction of the cross-country productivity differences even in the absence of any bar-
riers to technology transfer. Hall and Jones (1999) provide insights into productivity differences
across countries using the aggregate production function approach. The authors document that
while differences in each element of the production function are important—that is, human cap-
ital and physical capital—the so-called productivity residual is the element that plays the key
role.2 Hall and Jones (1999) show that gaps in productivity residuals across countries are
driven by differences in institutions and government policies, which the authors label as social
infrastructure.
Similarly, using the aggregate production function approach, Lagos (2006) shows that
labor market institutions can affect this function in general and the level of measured TFP in
particular. This idea finds support in Dabla-Norris, Guo, Haksar, Kim, Kochhar, Wiseman,
and Zdzienicka (2015) and Cette et al. (2016), who highlight the role of labor and product
market regulations for technology spillovers across borders. Thus, while technology transfer
keeps countries from drifting indefinitely far from each other, institutional barriers generally
push the economies further from the frontier. Structural rigidities in product and labor markets
can affect productivity via various channels. Missing competition could prevent the creation
of ideas and the adoption of new technologies. Furthermore, highly regulated product and
labor markets impede the efficient allocation of resources in the economies. Therefore, it seems
instructive to analyze the relationship between the degree of goods and labor market rigidities
and the size of international productivity spillovers.
However, far less attention has been paid to international productivity spillovers originat-
ing from the U.S. One exception is the work by Rabanal, Rubio-Ramırez, and Tuesta (2011),
who find that the technology processes in the U.S. and other advanced economies converge
slowly over time with important consequences for the volatility of the real exchange rate. Other
empirical studies addressing the international transmission of U.S. technology shocks focus on
the effects on international prices, GDP, private consumption or the trade balance (Corsetti,
Dedola, and Leduc, 2008; Enders and Muller, 2009; Keller, 2010; Miyamoto and Nguyen, 2017).
In our empirical analysis, we study the spillover effects of U.S. technology shocks for
13 advanced economies over the time period 1970 to 2016. To do so, we rely on the direct
utilization-adjusted technology measure for the U.S. proposed by Fernald (2014). In country-
specific vector autoregressive models (VAR), we examine the dynamic effects of changes in this
technology measure on hourly labor productivity in advanced economies. We then use indicators
2Hall and Jones (1999) show that different capital intensities in the two countries of their focus contributed afactor of 1.5 to the income differences, while different levels of educational attainment contributed a factor of3.1. The remaining difference—a factor of 7.7—is captured by the productivity residual.
3

of non-price competitiveness to analyze the relationship between international differences in the
transmission of U.S. technology shocks and institutional rigidities. Finally, we show that other
identification approaches, like those proposed by Galı (1999) and Uhlig (2004), yield similar
results.
The main results of our analysis are as follows: first, we do not find large productivity
spillover effects of U.S. technology shocks. For most countries, these effects are not significantly
different from zero. Furthermore, the elasticity of foreign labor productivity with respect to a
one percent increase in the U.S. technology level is significantly lower than one for many coun-
tries. This picture is robust across all structural VAR (SVAR) specifications and identification
approaches. We stress the importance of this finding as technology (knowledge) has the fea-
ture of non-rivalry (Keller, 2004). In a setting with perfect competition and without structural
rigidities, technological innovations in the U.S. should increase the level of technology in other
countries by the same magnitude after the same time. In sum, these results suggest that there
is an incomplete pass-through of the U.S. technology shocks to other countries. Therefore, the
recent U.S. productivity slowdown had a limited effect on developments in advanced countries.
In contrast to these findings, Rabanal et al. (2011) find a slow, but complete transmission of
the U.S. technological advances to the rest of the world.
Second, though the magnitudes of the U.S. technology spillovers vary across countries,
the differences in international productivity responses are not significant. Also when we use
indicators of non-price competitiveness to cluster countries into groups characterized by high
and low degree of institutional rigidity and contrast the results, we are not able to find significant
cross-country differences regarding the size of the U.S. productivity spillover effects. This result
contradicts the finding in Cette et al. (2016), who stress the importance of labor and product
market regulations in shaping the transmission of new technologies across countries. If any,
regulation of the service sectors seems to play a role.
This paper is organized as follows: Section 2 provides evidence on the U.S. as technology
frontier. Section 3 describes our empirical approach and Section 4 presents our baseline results.
In Section 5 we provide evidence from institutional and macroeconomic characteristics. In
Section 6 we test the sensitivity of our baseline results. Finally, Section 7 concludes the analysis.
2 The U.S. as technology frontier
The focus on international productivity spillovers resulting from U.S. technology gains is
motivated by the fact that the U.S. economy is largely considered as the global technology
frontier (Cette et al., 2016; Growiec, 2012; IMF, 2015). Inklaar and Diewert (2016) corroborate
this statement by providing estimates of internationally comparable TFP levels for several
economies. The authors analyze dispersion in international TFP measures using industry-level
data on real value added over the time period 1995–2011. The main data source is the World
Input-Output Database (Timmer, Dietzenbacher, Los, Stehrer, and De Vries, 2015).
4
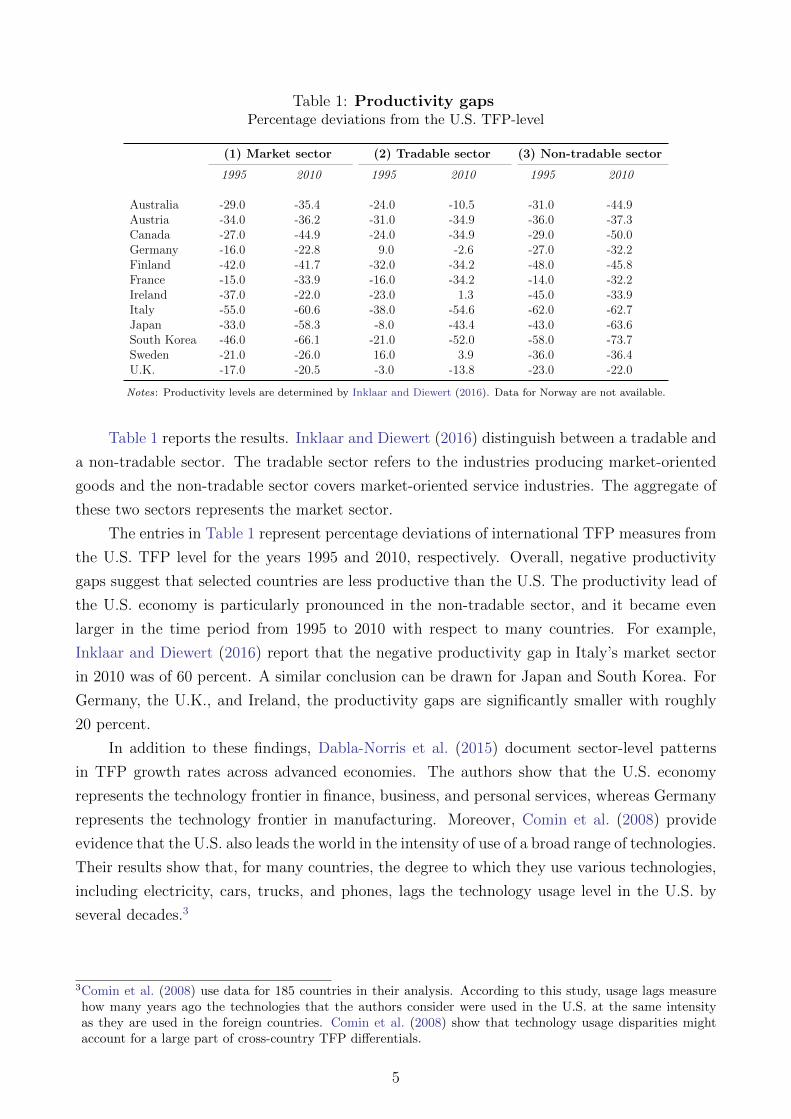
Table 1: Productivity gapsPercentage deviations from the U.S. TFP-level
(1) Market sector (2) Tradable sector (3) Non-tradable sector
1995 2010 1995 2010 1995 2010
Australia -29.0 -35.4 -24.0 -10.5 -31.0 -44.9Austria -34.0 -36.2 -31.0 -34.9 -36.0 -37.3Canada -27.0 -44.9 -24.0 -34.9 -29.0 -50.0Germany -16.0 -22.8 9.0 -2.6 -27.0 -32.2Finland -42.0 -41.7 -32.0 -34.2 -48.0 -45.8France -15.0 -33.9 -16.0 -34.2 -14.0 -32.2Ireland -37.0 -22.0 -23.0 1.3 -45.0 -33.9Italy -55.0 -60.6 -38.0 -54.6 -62.0 -62.7Japan -33.0 -58.3 -8.0 -43.4 -43.0 -63.6South Korea -46.0 -66.1 -21.0 -52.0 -58.0 -73.7Sweden -21.0 -26.0 16.0 3.9 -36.0 -36.4U.K. -17.0 -20.5 -3.0 -13.8 -23.0 -22.0
Notes: Productivity levels are determined by Inklaar and Diewert (2016). Data for Norway are not available.
Table 1 reports the results. Inklaar and Diewert (2016) distinguish between a tradable and
a non-tradable sector. The tradable sector refers to the industries producing market-oriented
goods and the non-tradable sector covers market-oriented service industries. The aggregate of
these two sectors represents the market sector.
The entries in Table 1 represent percentage deviations of international TFP measures from
the U.S. TFP level for the years 1995 and 2010, respectively. Overall, negative productivity
gaps suggest that selected countries are less productive than the U.S. The productivity lead of
the U.S. economy is particularly pronounced in the non-tradable sector, and it became even
larger in the time period from 1995 to 2010 with respect to many countries. For example,
Inklaar and Diewert (2016) report that the negative productivity gap in Italy’s market sector
in 2010 was of 60 percent. A similar conclusion can be drawn for Japan and South Korea. For
Germany, the U.K., and Ireland, the productivity gaps are significantly smaller with roughly
20 percent.
In addition to these findings, Dabla-Norris et al. (2015) document sector-level patterns
in TFP growth rates across advanced economies. The authors show that the U.S. economy
represents the technology frontier in finance, business, and personal services, whereas Germany
represents the technology frontier in manufacturing. Moreover, Comin et al. (2008) provide
evidence that the U.S. also leads the world in the intensity of use of a broad range of technologies.
Their results show that, for many countries, the degree to which they use various technologies,
including electricity, cars, trucks, and phones, lags the technology usage level in the U.S. by
several decades.3
3Comin et al. (2008) use data for 185 countries in their analysis. According to this study, usage lags measurehow many years ago the technologies that the authors consider were used in the U.S. at the same intensityas they are used in the foreign countries. Comin et al. (2008) show that technology usage disparities mightaccount for a large part of cross-country TFP differentials.
5
3 Empirical framework
We determine our baseline results from a SVAR model that relies on a quarterly utilization-
adjusted TFP series for the U.S. business sector (purified TFP) proposed by Fernald (2014).4
We label this SVAR as the Fernald model. Fernald’s quarterly purified TFP series is closely
related to the annual technology measure derived in Basu, Fernald, and Kimball (2006). Using
disaggregate information at the industry-level, Fernald (2014) obtains purified TFP from a
growth-accounting exercise that accounts for varying utilization of capital and labor. Hence,
the Fernald model does not require an explicit control for demand-related movements in the
technology measure, which is an advantage compared to other identification approaches.5
We estimate for each country i at a time a three-variable SVAR that includes: purified
TFP and a measure of capacity utilization for the U.S. computed by Fernald (2014), and real
hourly labor productivity for country i.6 All models include a constant and four lags. All
variables are expressed in log first differences. We use seasonally adjusted quarterly data that
cover 13 advanced economies over the sample period 1970:1–2016:4 unless otherwise indicated.
Determined by the availability of quarterly measures of total hours in the Ohanian-Raffo dataset
(Ohanian and Raffo, 2012), which we require for the computation of hourly labor productivity
for country i, we consider the following countries: Australia, Austria, Canada, Finland, France,
Germany, Ireland, Italy, Japan, Norway, South Korea, Sweden (1974:1–2016:4), and the U.K.
(1971:1–2016:4).7
The estimation of the U.S. productivity spillover effects hinges on three assumptions: first,
we treat each country i as a small economy relative to the U.S., and thus assume that shocks in
these countries have no effect on U.S. variables. Hence, labor productivity for country i is not
included in the equations for the U.S. variables: purified TFP and capacity utilization. Conse-
quently, the VAR is estimated as a subset system of equations using the method of seemingly
unrelated regressions. This assumption guarantees that for each country i the sequence of U.S.
technology shocks is the same.
Second, we assume that labor productivity in country i is affected contemporaneously by
the two U.S. variables. Additionally, changes in U.S. capacity utilization have no contempo-
raneous effect on purified TFP, as this measure is already utilization-adjusted. Consequently,
to estimate the effects of changes in purified TFP on labor productivity for the advanced
economies, the Fernald model uses a recursive VAR ordering with the U.S. technology measure
4Corsetti et al. (2008), Enders and Muller (2009) and Miyamoto and Nguyen (2017) use SVARs to studythe international transmission of technology shocks. In contrast to our study, however, they are particularlyinterested in the effects of technology shocks on GDP, private consumption, trade balance, and the terms oftrade.
5In the robustness section, we check the sensitivity of our baseline results with respect to alternative identificationschemes that include hourly labor productivity. Thus, we employ the long-run identification approach proposedby Galı (1999), the medium-run identification approach proposed by Uhlig (2004), and a Proxy-SVAR modelput forward by Mertens and Ravn (2013, 2014).
6Using a bivariate SVAR framework with purified TFP for the U.S. and hourly labor productivity for countryi does not affect our baseline results.
7We exclude Spain from the analysis due to the much later starting date of the hours series in 1995:1.
6

Table 2: Correlations with the U.S. neutral technology shocks
The U.S. neutral technology shocksFernald model Galı model Uhlig model Proxy-SVAR
The U.S. neutral technology shocks
Fernald model 1.00Galı model 0.76 1.00Uhlig model 0.77 0.99 1.00Proxy-SVAR 0.78 0.98 0.99 1.00
Galı model, aggregate data
G6 -0.05 -0.02 - 0.01 0.01G13 0.02 -0.01 0.00 0.02
Galı model, OECD countries
Austria 0.13 0.08 0.10 0.14Australia 0.14 0.17 0.17 0.18Canada 0.16 0.13 0.12 0.19Germany 0.04 -0.05 -0.04 -0.02Finland 0.08 0.07 0.07 0.09France 0.14 0.08 0.09 0.12Ireland 0.08 0.06 0.06 0.05Italy -0.03 -0.06 -0.05 -0.04Japan -0.06 -0.03 -0.02 -0.01South Korea 0.04 0.08 0.08 0.09Norway 0.04 0.06 0.06 0.05Sweden -0.01 0.00 0.00 0.01U.K. 0.06 0.09 0.09 0.10
Notes: This table reports the correlations of the U.S. neutral technology shocks obtained from different identification schemes with
technology shocks for the two country groupings and 13 countries, respectively. The G6 country group includes: Canada, Germany,
France, Italy, Japan, and the U.K. The G13 country group includes all countries considered in our sample. The identification of
technology shocks is described in Section 3 and Section 6. Technology shocks for the two country groupings and each of the 13
countries are obtained from bivariate SVARs with long-run restrictions that include quarterly series on hourly labor productivity
and total hours worked adjusted for the working-age population. All variables are specified in log first differences and all SVARs
include four lags. Sample period is 1970:1–2016:4. We compute the correlations using GDP-weighted technology shocks for 13
countries. The weights are country-level shares in the nominal GDP for the group of 13 countries. The correlations between the
U.S. technology shocks obtained from the Fernald model and country-specific and aggregate technology shocks from the Uhlig
model (not reported in this table) are equal to those obtained for the Galı model. Data sources: Ohanian and Raffo (2012);
http://andrearaffo.com/araffo/Research.html, Fernald (2014); http://www.johnfernald.net/TFP, Federal Reserve Economic
Data (FRED), and OECD.
ordered first, followed by the U.S. capacity utilization and hourly labor productivity for country
i. We thus apply the Cholesky decomposition to obtain impulse response functions (IRFs) of
labor productivity for country i to a U.S. technology shock.
Our final assumption concerns the measure of U.S. technology shocks. It is plausible
that changes in U.S. purified TFP can capture a U.S.-specific (idiosyncratic) and a global
(common) component. In our baseline calculations, we assume that U.S. technology shocks are
solely driven by the U.S.-specific component. To check the plausibility of this assumption, we
determine correlation coefficients of the U.S. purified TFP series with technology measures for
other countries. Since quarterly measures of purified TFP are not available for other countries,
we need to rely on technology shocks derived from country-level SVARs with hourly labor
7

productivity and total hours worked adjusted for the working-age population.8 For each country
i we identify technology shocks using the long-run identification scheme proposed by Galı (1999)
and the medium-run identification scheme proposed by Uhlig (2004).
Table 2 summarizes the results and shows that the correlation coefficients of U.S. purified
TFP and the country-specific technology shocks determined with long-run identification scheme
are close to zero. Thus, there is no evidence that U.S. purified TFP is affected by foreign
technology shocks. We find almost identical results for the foreign technology shocks determined
with approach proposed by Uhlig (2004).9
4 Results
This section presents our baseline results.10 Since we focus on the long-run effects of
the U.S. technology shocks on foreign labor productivity, we standardize the U.S. technology
shock such that the structural shock induces a one percent increase in purified TFP after 20
quarters.11 Figure 1 illustrates the accumulated IRFs of foreign labor productivity following a
U.S. technology shock for the major six economies: Japan, Germany, the U.K., France, Italy,
and Canada. The 95%-confidence intervals are based on a recursive-design wild bootstrap
procedure proposed by Goncalves and Kilian (2004).
Our first main result is that the long-run U.S. productivity spillover effects are positive
across all countries. We find the largest effects for Italy, France, and Japan. In contrast,
the response of labor productivity in Canada remains subdued throughout the entire horizon.
Miyamoto and Nguyen (2017) report similar results: Canadian labor productivity increases
slightly and not significantly following a positive permanent U.S. technology shock.
Second, the point estimates of the impulse responses at a one- and five-year horizon for all
countries considered in our analysis that are illustrated in Figure 2 imply that the elasticity of
foreign labor productivity with respect to a one percent increase in the U.S. technology level is
significantly lower than one.
For illustration purposes, we add to the figure dotted lines that represent the cross-sectional
averages of the IRFs of labor productivity and the corresponding 95%-confidence intervals.
Particularly, the average 95%-confidence intervals illustrate our result that the elasticity of
foreign labor productivity with respect to a U.S. technology shock is significantly smaller than
one for the majority of countries. This implies that a one percent increase in the U.S. technology
causes an increase in foreign productivity of less than one percent. There is, however, some
indication that the effects become larger over time. Thus, on average across all countries, the
response of foreign labor productivity to a U.S. technology shock is of 0.19 percent at the
one-year horizon and it increases to 0.30 at the five-year horizon. Given these findings, we
8The data are from the Ohanian–Raffo dataset (Ohanian and Raffo, 2012).9The results are not reported in Table 2 and available upon request.10We leave a detailed description of the data definitions and sources to the data appendix.11We also computed the IRFs for a time horizon of 40 quarters. Our baseline statements are unaffected by this
modification.
8

Figure 1: Productivity spillover effects of a U.S. technology shock
Notes: This figure shows the accumulated IRFs of labor productivity to a U.S. technology shock for major advanced economies.
The Fernald model includes purified TFP and capacity utilization for the U.S., followed by labor productivity for the respective
foreign country. We use a Cholesky decomposition to estimate the productivity spillover effects of a U.S. technology shock. All
models are estimated as subset VARs on a country-by-country basis. We standardize the U.S. technology shock such that the
structural shock induces a one percent increase in purified TFP after 20 quarters. All models include four lags and all variables are
expressed in log first differences. We use seasonally adjusted data for the sample period 1970:1–2016:4. Shaded areas represent the
68% and 95%-confidence intervals based on a recursive-design wild bootstrap procedure proposed by Goncalves and Kilian (2004).
Data sources are provided in the data appendix.
conclude that the recent slowdown in the U.S productivity growth had only a limited effect on
the decline in productivity growth in advanced economies.
Rabanal et al. (2011) adopt a cointegration framework to study the transmission of new
technologies across countries. Their study finds that the TFP processes of the U.S. and other
advanced economies (rest of the world) converge perfectly but slowly over time. The presence
of cointegrated TFP shocks, which implies a full absorption of new technologies across countries
independent of their origin, is hard to reconcile with our finding that the long-run elasticity of
9

foreign labor productivity with respect to a one percent increase in the U.S. technology level is
significantly lower than one.12
We stress the importance of this finding, since technology (knowledge) has the feature
of non-rivalry (Keller, 2004). In a setting characterized by perfect competition and without
structural rigidities, innovations in one country should increase the technology level in all other
countries by the same magnitude after same time. Note that in our framework, the one percent
mark provides a lower bound, since we consider labor productivity and not a direct measure
of technology (like purified TFP) for the single countries. In the neoclassical growth model,
positive technology shocks are associated with an increase in capital intensity.
Figure 2: International spillover effects of a U.S. technology shock
Notes: This figure shows the accumulated IRFs of labor productivity (bars) and output (markers) to a U.S. technology shock over
a one- and five-year horizon for 13 advanced economies. Labor productivity and output measures for the selected countries enter
the model as subset variables, each at a time. Dotted lines represent the cross-sectional average IRFs of labor productivity to a
U.S. technology shock and the corresponding 95%-confidence intervals that were originally computed using a recursive-design wild
bootstrap procedure proposed by Goncalves and Kilian (2004). All details concerning the model specification, estimation, and data
sources are provided in Section 3 and notes to Figure 1.
While there are qualitative similarities in the U.S. productivity spillover effects across
countries, we find some cross-country heterogeneity regarding the magnitude of these effects.
However, since the country-specific point estimates lie within the average 95%-confidence in-
tervals denoted by the dotted lines in Figure 2, the point estimates of the impulse responses
are not significantly different across countries. Nonetheless, the point estimates at a five-year
horizon range between around 0.00 percent in South Korea and roughly 0.50 percent in Italy.
In our opinion, these differences warrant some further investigation.
In order to provide a more detailed picture on the transmission mechanism of technology
shocks, we additionally show the responses of GDP to these shocks, which are depicted by
circle markers in Figure 2. After five years, the spillover effects of U.S. technology shocks
12We estimated the Fernald model using variables in log levels and obtained productivity spillover effectssignificantly smaller than one for the majority of countries.
10

on output are larger than those on productivity, which means that U.S. productivity gains
stimulate labor input in many advanced economies. We further find a positive but not perfect
relationship between productivity and output gains across countries.
5 Evidence from institutional characteristics
5.1 Indicators of institutional characteristics
Our baseline results indicate that there is no significant cross-country heterogeneity in the
transmission of the U.S. technology gains. Nonetheless, the point estimates after five years
vary to some degree and these differences allow some further analysis. In the following we,
therefore, scrutinize the statements of Cette et al. (2016) regarding the importance of labor
and product market regulations for the transmission of U.S. technology gains. To do so, we
estimate the productivity spillover effects of a U.S. technology shock for the groups of countries
that have contrasting—that is, flexible or rigid—institutional environments. We thus address
the role of institutional rigidity in shaping our baseline outcomes. For this purpose, we refer
to earlier work by van Ark, O’Mahoney, and Timmer (2008), Bouis, Causa, Demmou, Duval,
and Zdzienicka (2012), Bourles, Cette, Lopez, Mairesse, and Nicoletti (2013), Nicoletti and
Scarpetta (2003), Dabla-Norris et al. (2015), and Cette, Lopez, and Mairesse (2016). These
studies address the role of policies promoting competitive pressures in the transmission of ideas
and innovations across borders, with a particular focus on international differences in labor and
product market institutions. Furthermore, numerous studies find that countries that are more
financially developed or have higher quality of institutions experience larger productivity and
TFP growth (Kose, Prasad, and Terrones, 2009; Bekaert, Harvey, and Lundblad, 2011). Hence,
we use indicators of non-price competitiveness to analyze the role of international institutional
factors in shaping our baseline results.13
Concerning labor market institutions, we are interested in the role of institutional aspects
that influence job and worker flows (that is, (un)employment rigidities), which are regarded
as the most important determinants of labor market adjustments (Gnocchi, Lagerborg, and
Pappa, 2015).14 To this end, we employ the OECD index on the strictness of employment
protection against individual dismissal (based on regular contracts).
To address institutional arrangements that target product and service markets, we use
two indicators. The first indicator defines product market regulation for the total economy and
measures the degree to which policies promote or inhibit competition in the product markets.
The second indicator focuses on regulation in the non-manufacturing sector. It represents the
degree of regulation in seven network sectors (aggregated into one indicator of regulation in
13Definitions, sample periods, and sources of the data are summarized in Table A.1.14Rujin (2019) shows that technology-induced labor market fluctuations are positively associated with the
efficiency and flexibility of the labor market. That is, labor markets characterized by flexible institutionalarrangements (fluid labor markets) are more likely to lay off workers or reduce hours worked per workerfollowing a positive technology shock.
11

energy, transport and communications) and five service sectors (retail distribution, accounting
services, legal services, engineering services, and architectural services). Both indicators are
from the OECD database and described in Koske, Wanner, Bitetti, and Barbiero (2015).
Finally, we study the relatiship between financial openness and international productivity
spillovers of U.S. technology shocks. For this purpose, we use the Chinn-Ito index measuring
a country’s degree of capital account openness, which accounts for regulatory restrictions on
cross-border financial transactions (Chinn and Ito, 2006).
Figure 3: International institutional characteristics
Notes: This figure shows descriptive statistics on international institutional characteristics. The bars represent the country-level
averages of institutional indicators and the highlighted bars correspond to the respective median country. The cross-country
median value of each indicator (excluding the U.S.) is depicted by the dashed line. The OECD indicator reflecting the strictness
of employment protection legislation (EPL) refers to individual and collective dismissals (regular contracts) and covers a time
period from 1985 to 2013. The indicator measuring the product market regulation reflects the degree to which policies promote
or inhibit competition. The OECD indicator of regulation in non-manufacturing sectors measures regulation at the sector level
and covers seven network sectors (telecommunication, electricity, gas, post, rail, air passenger transport, and road freight) and five
services sectors (retail distribution, accounting services, legal services, engineering services, and architectural services). The latter
two indicators are available for the years 1998, 2003, 2008 and 2013. The Chinn-Ito index of financial openness (Chinn and Ito,
2006) measures a country’s degree of capital account openness and covers the time period from 1970 to 2016. See data appendix
for further details and definitions.
Figure 3 depicts descriptive statistics of these institutional characteristics. The bars repre-
sent the time-series averages of the respective institutional indicators for each country. Except
for the financial openness index, high values of an indicator point to a highly regulated labor
12
or product market. Low values signal more flexible market features.15 Based on this average
scores, we compute for each indicator the median value across all countries, excluding the U.S.
The black bars define the median-country for the corresponding institutional characteristic.
The dashed lines depict the median values for each indicator that help to cluster the remaining
countries into ”high” and ”low” regime groups. Consequently, countries displaying an average
value above (below) the corresponding median are classified into high (low) regimes. We include
an equal number of countries in each regime-grouping.16 We also report these results in Table
B.1.
In sum, while labor, product, and service markets in major European economies (Germany,
France, and Italy) are highly regulated, the opposite applies to Anglo-American countries (Aus-
tralia, the U.K., and the U.S.). For Canada we observe that the labor market is quite flexible,
while the product and services markets are highly regulated. The Japanese economy has flexi-
ble labor and product market regulations, whereas competition in the service sectors seems to
be quite difficult. Concerning financial openness, Canada, Germany, Japan, and the U.S. have
by far the most flexible regulatory policies on cross-border financial transactions.
5.2 The role of institutions
To analyze the differences in the size of the country-specific responses of labor productivity
to a U.S. technology shock, we adopt the approach by Calza, Monacelli, and Stracca (2013).
We first estimate our baseline model country-by-country and then compute the average impulse
responses of labor productivity for the two country sub-groups that we defined in the previous
section. We normalize the U.S. technology shock such that the structural shock induces a one
percent increase in purified TFP after 20 quarters. Figure 4 illustrates the mean IRFs along
with the 95%-confidence intervals for the respective country groups.
The computation of mean IRFs obtained from the country-specific SVARs (mean-group
estimator) results in efficiency gains versus SVAR estimates based on standard panel estima-
tion methods, like pooled ordinary least squares or fixed-effect estimation. The estimation of
subset SVARs on a country-by-country basis does not only take into account country-specific
fixed effects, that is the intercepts, but also results in country-specific estimates of the slope
parameters.17
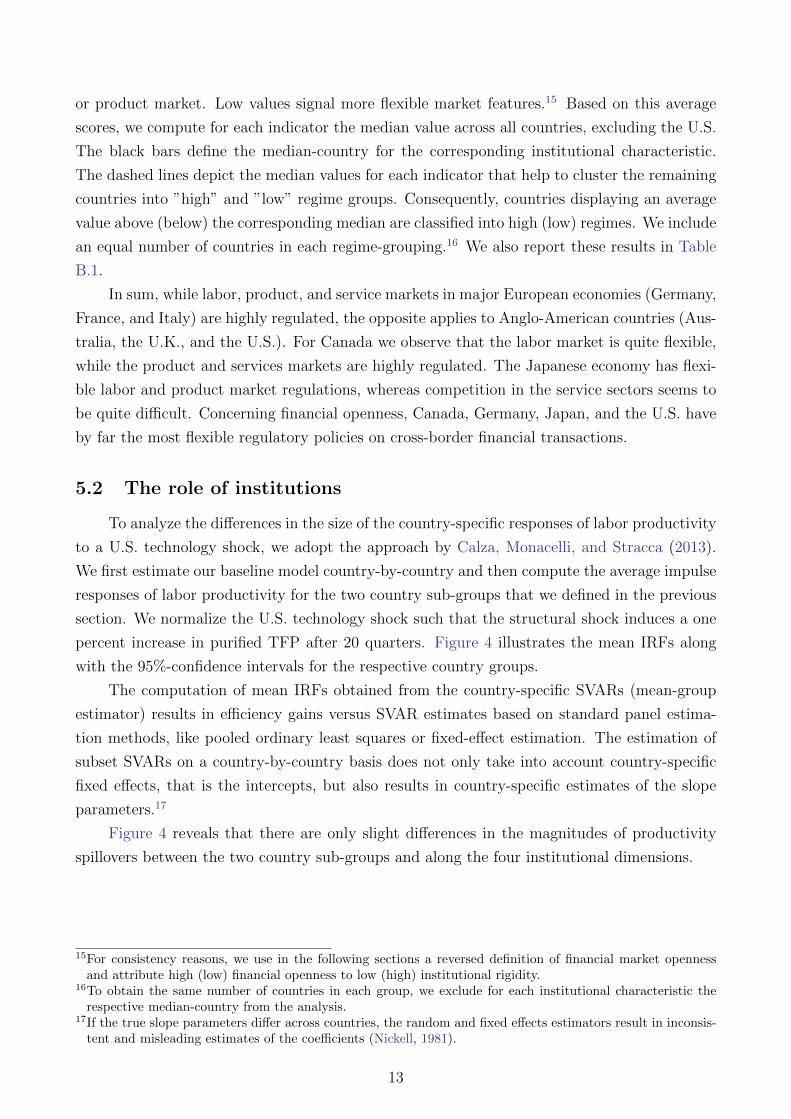
Figure 4 reveals that there are only slight differences in the magnitudes of productivity
spillovers between the two country sub-groups and along the four institutional dimensions.
15For consistency reasons, we use in the following sections a reversed definition of financial market opennessand attribute high (low) financial openness to low (high) institutional rigidity.
16To obtain the same number of countries in each group, we exclude for each institutional characteristic therespective median-country from the analysis.
17If the true slope parameters differ across countries, the random and fixed effects estimators result in inconsis-tent and misleading estimates of the coefficients (Nickell, 1981).
13

Figure 4: Mean impulse responses to a U.S. technology shock
Notes: This figure displays the average impulse responses of labor productivity to a U.S. technology shock, which are computed
over the groups of 6 countries, respectively. The original IRFs were obtained from the estimation of the baseline model on a
country-by-country basis (these results are illustrated in Figure 1 and Figure 2). The classification of countries into ”high” and
”low” regime groupings is done according to their respective institutional characteristics, which can be found in Table B.1. We
use the unit effect normalization of the U.S. technology shock so that a unit increase in the structural shock induces a one percent
increase in the observable U.S. technology measure (purified TFP) after 20 quarters. Shaded areas represent the corresponding
cross-sectional average 68% and 95%-confidence intervals, which were originally computed using a recursive-design wild bootstrap
procedure proposed by Goncalves and Kilian (2004). All details concerning the model estimation, specification, and data sources
are provided in Section 3 and in the notes to Figure 1.
Alternatively, following Gnocchi et al. (2015), we assess the link between productivity
spillovers and institutional characteristics based on Spearman rank correlation coefficients.18
Table 3 reports the results on the Spearman rank correlation coefficients between the one and
five years delayed accumulated IRFs of labor productivity with respect to a U.S. technology
shock for 13 countries and indicators on institutional characteristics.
In sum, evidence from Spearman rank correlations supports our results in Figure 4 and
Section 4. Thus, institutional factors do not seem to be able to explain the cross-country
differences in the size of the spillover effects. This evidence is at odds with the statements
made by Cette et al. (2016).
18The advantage of using Spearman’s correlation is that it is successful in small samples like ours (which includes13 cross-sections), since normality is violated, and it is robust to outliers (Gnocchi et al., 2015).
14

Table 3: Evidence from Spearman correlation coefficients
Institutional characteristics
LagsLabor market Product market Service sector Financial market
rigidity rigidity rigidity rigidity
Baseline IRFs4 -0.34 -0.35 -0.19 -0.0920 0.22 0.15 0.20 0.13
Notes: This table reports the Spearman rank correlation coefficients between the one and five years delayed cumulative IRFs of
labor productivity following a U.S. technology shock for 13 advanced economies and indicators on institutional characteristics,
respectively. We denote the statistical significance of correlation coefficients by asterisks *, **, *** at 10, 5, and 1 percent level,
respectively.
6 Robustness Checks
In this section, we conduct a battery of robustness checks to test the sensitivity of our
baseline results. These checks question the identification of the U.S. technology shocks and
address certain modifications in the empirical model, that is the sample period chosen for the
estimation of the model and the stochastic treatment of variables used in SVARs.
6.1 Identification approach
We check the sensitivity of our baseline results with respect to alternative identification
schemes of U.S. technology shocks, which are obtained from: (i) the long-run identification
approach proposed by Galı (1999), (ii) the medium-run identification approach proposed by
Uhlig (2004), and finally (iii) we use a modified version of a Proxy-SVAR model put forward
by Mertens and Ravn (2013, 2014).
We conduct these robustness checks as Kurmann and Sims (2017) show that the purified
TFP series by Fernald (2014) is subject to measurement errors. For example, the time series was
heavily revised in 2014 due to changes in the estimate of factor utilization. These modifications
led to large and qualitatively important differences in the time series properties among different
vintages of purified TFP. Specifically, Kurmann and Sims (2017) show that the correlation
coefficients between the growth rates of purified TFP vintages published before 2014 and the
later vintages are smaller than 0.6.19
While the models mentioned above employ different identification assumptions to recover
structural shocks, the specification of the VARs is the same across the three models. Hence, we
estimate three-variable VARs with hourly labor productivity and total hours worked (normal-
ized by the U.S. working-age population) for the U.S., and hourly labor productivity for country
i. All variables are specified in log first differences. The VAR models include a constant and
four lags. We exclude labor productivity for country i from the equations for the U.S. variables
and estimate the models as a subset system of equations.
19Furthermore, Kurmann and Sims (2017) show that these revisions led to different results regarding the im-portance of news shocks for the U.S. business cycle.
15
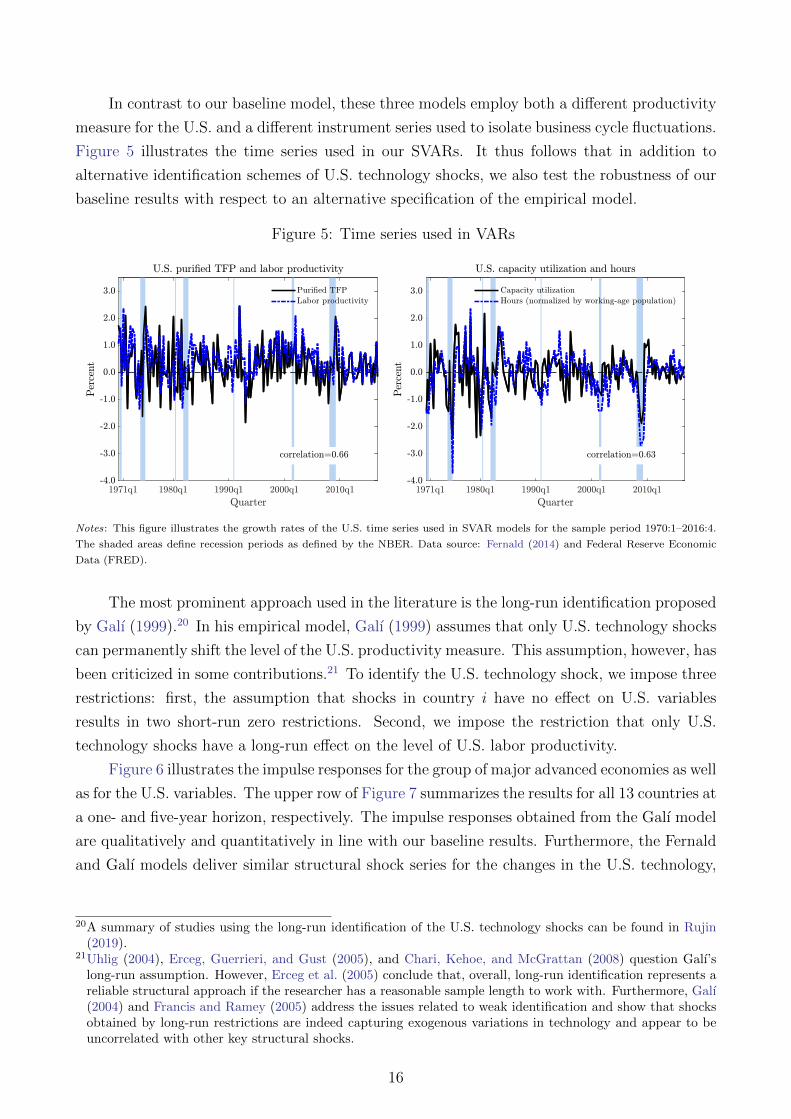
In contrast to our baseline model, these three models employ both a different productivity
measure for the U.S. and a different instrument series used to isolate business cycle fluctuations.
Figure 5 illustrates the time series used in our SVARs. It thus follows that in addition to
alternative identification schemes of U.S. technology shocks, we also test the robustness of our
baseline results with respect to an alternative specification of the empirical model.
Figure 5: Time series used in VARs
Notes: This figure illustrates the growth rates of the U.S. time series used in SVAR models for the sample period 1970:1–2016:4.
The shaded areas define recession periods as defined by the NBER. Data source: Fernald (2014) and Federal Reserve Economic
Data (FRED).
The most prominent approach used in the literature is the long-run identification proposed
by Galı (1999).20 In his empirical model, Galı (1999) assumes that only U.S. technology shocks
can permanently shift the level of the U.S. productivity measure. This assumption, however, has
been criticized in some contributions.21 To identify the U.S. technology shock, we impose three
restrictions: first, the assumption that shocks in country i have no effect on U.S. variables
results in two short-run zero restrictions. Second, we impose the restriction that only U.S.
technology shocks have a long-run effect on the level of U.S. labor productivity.
Figure 6 illustrates the impulse responses for the group of major advanced economies as well
as for the U.S. variables. The upper row of Figure 7 summarizes the results for all 13 countries at
a one- and five-year horizon, respectively. The impulse responses obtained from the Galı model
are qualitatively and quantitatively in line with our baseline results. Furthermore, the Fernald
and Galı models deliver similar structural shock series for the changes in the U.S. technology,
20A summary of studies using the long-run identification of the U.S. technology shocks can be found in Rujin(2019).
21Uhlig (2004), Erceg, Guerrieri, and Gust (2005), and Chari, Kehoe, and McGrattan (2008) question Galı’slong-run assumption. However, Erceg et al. (2005) conclude that, overall, long-run identification represents areliable structural approach if the researcher has a reasonable sample length to work with. Furthermore, Galı(2004) and Francis and Ramey (2005) address the issues related to weak identification and show that shocksobtained by long-run restrictions are indeed capturing exogenous variations in technology and appear to beuncorrelated with other key structural shocks.
16

with a significant correlation coefficient of 0.76.22 However, the results for Japan and South
Korea differ between both approaches. For other countries, our results are robust. We report a
Spearman correlation coefficient of, respectively, 0.59 and 0.32 for the IRF point estimates for
country-specific labor productivity after one and five years. Thus, the relative ranking of the
responses does not change substantially between both approaches. The latter implies that the
results of the previous section remain unaffected by this alternative identification scheme.
Second, to overcome the shortcomings of the long-run identification scheme, we employ
the medium-run identification approach by Uhlig (2004), which maximizes the contribution of
technology shocks to the forecast-error variance of productivity at intermediate horizons. The
use of the medium-run identification is motivated by the assumption that labor productivity
can be shifted in the long-run also by changes in dividend taxation and changes in the social
attitude towards the workplace, and not exclusively by technology shocks. To obtain U.S.
technology shocks, we employ the assumptions by Uhlig (2004) and identify these shocks as
those that maximize the forecast-error variance of labor productivity between three and ten
years.
The results are displayed in Figure 6 and in the upper row of Figure 7. The technology
shocks obtained from the Uhlig model are highly correlated with our baseline U.S. technology
shocks; the correlation coefficient is 0.77. The IRFs obtained from the Uhlig model are very
close to the results obtained from the Fernald model. For the U.S. hours, the magnitude of the
IRF is now closer to the baseline result (see Figure 6). Also the point estimates illustrated in
the upper row of Figure 7 are in line with the baseline results and the Spearman correlation
coefficients are high. Consequently, using the medium-run identification approach proposed by
Uhlig (2004) does not change our baseline statements.
Finally, we estimate a Proxy-SVAR model where we use purified TFP as an instrument to
isolate U.S. technology shocks from U.S. labor productivity. Technology shocks resulting from
this identification approach are defined as the unexpected changes in the U.S. labor productivity
that have the highest correlation with the instrument series, that is, the purified TFP series.
Hence, the correlation of our baseline U.S. technology shocks with the shock series obtained
from the Proxy-SVAR model is high (0.78).
The results illustrated in Figure 6 are very close to the baseline IRFs, with the exception
of Japan where the long-run productivity effect of the U.S. technology shock is close to zero.
The outcomes shown in the upper row of Figure 7 are broadly in line with the baseline results.
However, the Spearman correlation coefficients are now weaker. When we exclude the outlier
countries from the analysis, that is, Japan and South Korea, the Spearman rank correlations
between the baseline results and the results obtained from the alternative identification ap-
proaches discussed above increase significantly. Overall, Table B.2 and Figure B.1 show that
the results in Section 5 remain unaffected by the exclusion of these two countries from the
analysis.
22Ramey (2016) reports a correlation between the two shock series of 0.68, which is based on a sample startingin 1947.
17

Figure 6: Impulse responses to a U.S. technology shock from different models
Notes: This figure shows the accumulated IRFs of labor productivity for the selected countries, the U.S. capacity utilization
and hours following a U.S. technology shock. The Galı model, the Uhlig model, and the Proxy-SVAR include hourly labor
productivity and hours adjusted for the working-age population for the U.S. The Galı and Uhlig models use long-run and medium-
run identification schemes. The Proxy-SVAR uses purified TFP as instrument to identify U.S. technology shocks. U.S. capacity
utilization enters these models as a subset variable. The scale of shocks obtained from these models is normalized to produce a one
percent increase in purified TFP after 20 quarters. We use a subset framework to determine the response of purified TFP.
In sum, the results obtained from the three alternative models support our main con-
clusions related to an overall low elasticity of international labor productivity with respect to
the U.S. technology shocks, as well as heterogeneous productivity spillovers across the major
advanced economies. Furthermore, the Spearman rank correlations between the point esti-
18

Figure 7: Robustness checks of the U.S. productivity spillovers
Notes: This figure shows the accumulated IRFs of labor productivity to a U.S. technology shock over a one- and five-year horizon
for 13 advanced economies. We also report the Spearman rank correlation coefficients between the IRFs of labor productivity for
13 advanced economies obtained from alternative model specifications and identification schemes and baseline results, respectively.
The graphs in the first row illustrate the point estimates obtained from the baseline model (bars) and the markers denote the point
estimates obtained from the Galı model, the Uhlig model, and the Proxy-SVAR. The second row illustrates the results obtained
from the Fernald model that includes detrended labor productivity for foreign countries and the results obtained from the Fernald
model that includes a detrended measure of purified TFP (PTFP). We also show the results obtained from the Fernald model that
uses data for the post-1985 sample period. All models are estimated as subset VARs on a country-by-country basis. We normalize
the size of the U.S. technology shock such that the structural shock induces a one percent increase in purified TFP after 20 quarters.
To determine the response of purified TFP, we use a subset framework. All models include four lags and all variables are expressed
in log first differences.
mates obtained from alternative identification schemes and our baseline results confirm the
consistency of our key outcomes across countries.
6.2 Specification of the empirical model
Next, we test the sensitivity of our baseline results with respect to alternative stochas-
tic transformations of the variables included in the Fernald model. First, we use detrended
growth rates of labor productivity for 13 advanced economies while leaving the U.S. variables
unchanged.23 In the second exercise, we detrend purified TFP to account for breaks in the
mean growth rate of the series. For this purpose, we use the break dates documented in Fer-
23We detrend the growth rates of labor productivity by regressing the respective series on a constant and alinear and quadratic time trend. We use the residuals from these regression equations as our detrended series.
19

nald (2015): 1973:2, 1995:4, and 2003:4. In a final check, we follow Canova, Lopez-Salido, and
Michelacci (2010) and restrict our estimation sample to start in the first quarter of 1985.24
The second row of Figure 7 illustrates the results. Overall, there are no significant differ-
ences between the estimated IRFs obtained from the SVARs that employ detrended productiv-
ity measures and our baseline results. The relative ranking of the responses remains unchanged.
For the IRFs obtained from the models specified with detrended labor productivity for the ad-
vanced economies, we report the Spearman correlation coefficients with our baseline result of
0.92 at a one-year horizon and of 0.84 at a five-year horizon.
For the IRFs obtained from the SVARs with detrended purified TFP, the correlations are
0.65 and 0.58, respectively. Concerning the magnitude of the IRFs, we find lower elasticities of
foreign labor productivity with respect to a one percent increase in U.S. technology compared
with our baseline results.
The results of the robustness check with respect to the later starting date are illustrated
in the second row of Figure 7. In contrast to the previous checks, we find that the later starting
date of our estimation sample affects the relative ranking of the impulse responses compared
with the baseline results; the Spearman correlation coefficient at a five-year horizon is low
(0.10).25 However, our key finding that the elasticity of foreign labor productivity with respect
to a one percent increase in the U.S. technology level is significantly lower than one remains
unaffected. Furthermore, we again find some heterogeneity in the magnitudes of the IRFs
across countries.26
Table 4: Spearman correlation coefficients for the post-1985 sample period
Institutional characteristics
LagsLabor market Product market Service sector Financial market
rigidity rigidity rigidity rigidity
Baseline IRFs4 -0.01 -0.29 -0.54* 0.3820 0.01 -0.41 -0.64** 0.43
Notes: This table reports the Spearman rank correlation coefficients between the one and five years delayed cumulative IRFs of
labor productivity following a U.S. technology shock for 13 advanced economies and indicators on institutional characteristics,
respectively. The results were obtained using the data for the post-1985 sample period. We denote the statistical significance of
correlation coefficients by asterisks *, **, *** at 10, 5, and 1 percent level, respectively.
24This choice is based on the observation documented in, e.g., Summers (2005), that the volatility of aggregateeconomic activity has fallen dramatically in most of the industrialized world in that period, which is reflectedin lower volatility of macroeconomic variables like GDP and inflation. Furthermore, since the fall of theIron Curtain and the progressing integration of China into the world economy, there was an increase in theglobalization trend. This development has led to a rapid expansion of the global trade, which is consideredto be a strong channel for international productivity spillovers (Keller, 2004).
25If we exclude Japan and South Korea from the calculations, the Spearman correlation coefficient increases to0.26
26In an additional robustness check, we extend our SVAR models to include 16 lags and consider the entireestimation sample spanning from 1970:1 to 2016:4. This generous lag length specification is motivated by thewidely documented slow transmission process of new technologies across countries (Smets and Wouters, 2007;Rotemberg, 2003; Rabanal et al., 2011). Therefore, in this robustness check, we allow for delayed effects ofup to four years. The results are illustrated in Figure B.2 in the appendix. Our main results are unaffectedby this lag selection.
20
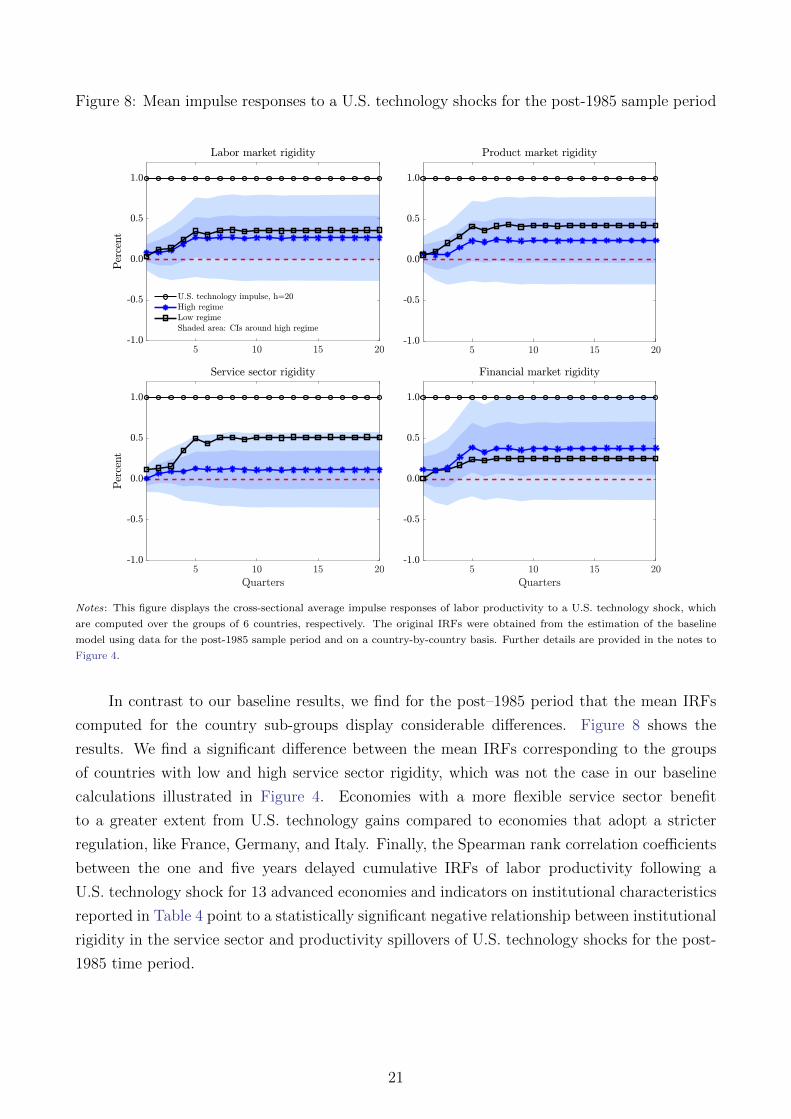
Figure 8: Mean impulse responses to a U.S. technology shocks for the post-1985 sample period
Notes: This figure displays the cross-sectional average impulse responses of labor productivity to a U.S. technology shock, which
are computed over the groups of 6 countries, respectively. The original IRFs were obtained from the estimation of the baseline
model using data for the post-1985 sample period and on a country-by-country basis. Further details are provided in the notes to
Figure 4.
In contrast to our baseline results, we find for the post–1985 period that the mean IRFs
computed for the country sub-groups display considerable differences. Figure 8 shows the
results. We find a significant difference between the mean IRFs corresponding to the groups
of countries with low and high service sector rigidity, which was not the case in our baseline
calculations illustrated in Figure 4. Economies with a more flexible service sector benefit
to a greater extent from U.S. technology gains compared to economies that adopt a stricter
regulation, like France, Germany, and Italy. Finally, the Spearman rank correlation coefficients
between the one and five years delayed cumulative IRFs of labor productivity following a
U.S. technology shock for 13 advanced economies and indicators on institutional characteristics
reported in Table 4 point to a statistically significant negative relationship between institutional
rigidity in the service sector and productivity spillovers of U.S. technology shocks for the post-
1985 time period.
21

7 Conclusions
This study adds to the empirical literature on international technology spillovers. Specifi-
cally, we provide new evidence regarding the size of international productivity spillover effects
originating from the U.S. economy. To do so, we use a direct utilization-adjusted U.S. tech-
nology measure and analyze the dynamic effects of changes in this measure on hourly labor
productivity in 13 advanced economies.
Overall, we do not find large productivity spillover effects of U.S. technology shocks. Specif-
ically, for most countries, these effects are not significantly different from zero. Moreover, the
elasticity of foreign labor productivity with respect to a one percent increase in the U.S. technol-
ogy level is significantly lower than one for many countries. The finding of low spillover effects
is somewhat surprising as technology (knowledge) has the feature of non-rivalry (Keller, 2004).
In our opinion, studying the reasons for this incomplete pass-through of U.S. technology gains
opens an important avenue for future research. Regarding the sources of the marked slowdown
in productivity growth in many advanced economies since the mid-2000’s, we conclude that the
decline in U.S. productivity growth had only a limited role.
Finally, we find no sizeable cross-country heterogeneity regarding the magnitude of the
international U.S. technology spillover effects. Using indicators of non-price competitiveness,
we are not able to explain the cross-country differences in the size of the spillover effects by
institutional factors. This result contradicts the finding in Cette et al. (2016), who stress the
importance of labor and product market regulations in shaping the transmission of ideas and
innovations across countries. If any, regulation of the service sector seems to play a role.
References
Acemoglu, D. and F. Zilibotti (2001). Productivity Differences. The Quarterly Journal of
Economics 116 (2), 563–606.
Andrews, D., C. Criscuolo, and P. N. Gal (2015). Frontier Firms, Technology Diffusion and
Public Policy: Micro Evidence from OECD Countries. OECD Productivity Working Pa-
pers 2, OECD Publishing.
Anzoategui, D., D. Comin, M. Gertler, and J. Martinez (2018). Endogenous Technology Adop-
tion and R&D as Sources of Business Cycle Persistence. AEJ: Macroeconomics forthcoming.
Basu, S., J. Fernald, J. Fisher, and M. Kimball (2013). Sector-Specific Technical Change.
Mimeo.
Basu, S., J. G. Fernald, and M. S. Kimball (2006). Are Technology Improvements Contrac-
tionary? American Economic Review 96 (5), 1418–1448.
Bekaert, G., C. R. Harvey, and C. Lundblad (2011). Financial Openness and Productivity.
World Development 39 (1), 1–19.
22

Bouis, R., O. Causa, L. Demmou, R. Duval, and A. Zdzienicka (2012). The Short-Term Effects
of Structural Reforms: An Empirical Analysis. OECD Economics Department Working
Papers 949, OECD Publishing.
Bourles, R., G. Cette, J. Lopez, J. Mairesse, and G. Nicoletti (2013). Do Product Market
Regulations In Upstream Sectors Curb Productivity Growth? Panel Data Evidence For
OECD Countries. The Review of Economics and Statistics 95 (5), 1750–1768.
Byrne, D. M., J. G. Fernald, and M. B. Reinsdorf (2016). Does the United States Have a
Productivity Slowdown or a Measurement Problem? Brookings Papers on Economic Activ-
ity 2016 (1), 109–182.
Calza, A., T. Monacelli, and L. Stracca (2013). Housing Finance And Monetary Policy. Journal
of the European Economic Association 11, 101–122.
Canova, F., D. Lopez-Salido, and C. Michelacci (2010). The Effects of Technology Shocks on
Hours and Output: A Robustness Analysis. Journal of Applied Econometrics 25 (5), 755–773.
Cette, G., J. Fernald, and B. Mojon (2016). The Pre-Great Recession Slowdown in Productivity.
European Economic Review 88 (C), 3–20.
Cette, G., J. Lopez, and J. Mairesse (2016). Market Regulations, Prices, and Productivity.
American Economic Review 106 (5), 104–108.
Chari, V., P. J. Kehoe, and E. R. McGrattan (2008). Are Structural VARs with Long-
Run Restrictions Useful in Developing Business Cycle Theory? Journal of Monetary Eco-
nomics 55 (8), 1337–1352.
Chinn, M. D. and H. Ito (2006). What Matters for Financial Development? Capital Controls,
Institutions, and Interactions. Journal of Development Economics 81 (1), 163–192.
Comin, D. and B. Hobijn (2010). An Exploration of Technology Diffusion. American Economic
Review 100 (5), 2031–2059.
Comin, D., B. Hobijn, and E. Rovito (2008). Technology Usage Lags. Journal of Economic
Growth 13 (4), 237–256.
Corsetti, G., L. Dedola, and S. Leduc (2008). International Risk Sharing and the Transmission
of Productivity Shocks. The Review of Economic Studies 75 (2), 443–473.
Dabla-Norris, E., S. Guo, V. Haksar, M. Kim, K. Kochhar, K. Wiseman, and A. Zdzienicka
(2015). The New Normal; A Sector-level Perspective on Productivity Trends in Advanced
Economies. IMF Staff Discussion Notes 15/3, International Monetary Fund.
Decker, R., J. Haltiwanger, R. Jarmin, and J. Miranda (2014). The Secular Decline in Business
Dynamism in the US. Unpublished draft, University of Maryland.
23

Enders, Z. and G. J. Muller (2009). On the International Transmission of Technology Shocks.
Journal of International Economics 78 (1), 45–59.
Erceg, C. J., L. Guerrieri, and C. Gust (2005). Can Long-Run Restrictions Identify Technology
Shocks? Journal of the European Economic Association 3 (6), 1237–1278.
Fernald, J. G. (2014). A Quarterly, Utilization-Adjusted Series on Total Factor Productivity.
Working Paper Series 2012-19, Federal Reserve Bank of San Francisco.
Fernald, J. G. (2015). Productivity and Potential Output Before, During, and After the Great
Recession. NBER Macroeconomics Annual 29 (1), 1–51.
Francis, N. and V. A. Ramey (2005). Is the Technology-Driven Real Business Cycle Hypothesis
Dead? Shocks and Aggregate Fluctuations Revisited. Journal of Monetary Economics 52 (8),
1379–1399.
Galı, J. (1999). Technology, Employment, and the Business Cycle: Do Technology Shocks
Explain Aggregate Fluctuations? American Economic Review 89 (1), 249–271.
Galı, J. (2004). On the Role of Technology Shocks as a Source of Business Cycles: Some New
Evidence. Journal of the European Economic Association 2 (2-3), 372–380.
Gnocchi, S., A. Lagerborg, and E. Pappa (2015). Do Labor Market Institutions Matter for
Business Cycles? Journal of Economic Dynamics and Control 51 (C), 299–317.
Goncalves, S. and L. Kilian (2004). Bootstrapping Autoregressions with Conditional Het-
eroskedasticity of Unknown Form. Journal of Econometrics 123 (1), 89–120.
Gordon, R. J. (2012). Is US Economic Growth Over? Faltering Innovation Confronts the Six
Headwinds. Technical report, National Bureau of Economic Research.
Growiec, J. (2012). The World Technology Frontier: What Can We Learn from the US States?
Oxford Bulletin of Economics and Statistics 74 (6), 777–807.
Hall, R. E. and C. I. Jones (1999). Why do Some Countries Produce So Much More Output
Per Worker than Others? The Quarterly Journal of Economics 114 (1), 83–116.
IMF (2015). World Economic Outlook: Uneven Growth: Short-and Long-Term Factors.
Inklaar, R. and W. E. Diewert (2016). Measuring Industry Productivity and Cross-Country
Convergence. Journal of Econometrics 191 (2), 426–433.
Keller, W. (2004). International Technology Diffusion. Journal of Economic Literature 42 (3),
752–782.
24

Keller, W. (2010). International Trade, Foreign Direct Investment, and Technology Spillovers.
In B. H. Hall and N. Rosenberg (Eds.), Handbook of the Economics of Innovation, Volume 2,
Chapter 19. 793 - 829. Elsevier.
Kose, A., E. Prasad, and M. Terrones (2009). Does Openness to International Financial Flows
Raise Productivity Growth? Journal of International Money and Finance 28 (4), 554–580.
Koske, I., I. Wanner, R. Bitetti, and O. Barbiero (2015). The 2013 Update of the OECD’s
Database on Product Market Regulation: Policy Insights for OECD and Non-OECD Coun-
tries. OECD Economics Department Working Papers 1200, OECD Publishing.
Kurmann, A. and E. Sims (2017). Revisions in Utilization-Adjusted TFP and Robust Iden-
tification of News Shocks. NBER Working Papers 23142, National Bureau of Economic
Research.
Lagos, R. (2006). A Model of TFP. Review of Economic Studies 73 (4), 983–1007.
Mertens, K. and M. O. Ravn (2013). The Dynamic Effects of Personal and Corporate Income
Tax Changes in the United States. American Economic Review 103 (4), 1212–1247.
Mertens, K. and M. O. Ravn (2014). A Reconciliation of SVAR and Narrative Estimates of
Tax Multipliers. Journal of Monetary Economics 68 (S), 1–19.
Miyamoto, W. and T. L. Nguyen (2017). Understanding the Cross-Country Effects of U.S.
Technology Shocks. Journal of International Economics 106 (C), 143–164.
Nickell, S. J. (1981). Biases in Dynamic Models with Fixed Effects. Econometrica 49 (6),
1417–1426.
Nicoletti, G. and S. Scarpetta (2003). Regulation, Productivity and Growth: OECD Evidence.
OECD Economics Department Working Papers 347, OECD Publishing.
Ohanian, L. E. and A. Raffo (2012). Aggregate Hours Worked in OECD Countries: New
Measurement and Implications for Business Cycles. Journal of Monetary Economics 59 (1),
40–56.
Rabanal, P., J. F. Rubio-Ramırez, and V. Tuesta (2011). Cointegrated TFP Processes and
International Business Cycles. Journal of Monetary Economics 58 (2), 156–171.
Ramey, V. (2016). Macroeconomic Shocks and Their Propagation, Volume 2A of Handbook of
Macroeconomics, Chapter 2, pp. 71–162. Elsevier.
Rotemberg, J. J. (2003). Stochastic Technical Progress, Smooth Trends, and Nearly Distinct
Business Cycles. American Economic Review 93 (5), 1543–1559.
25
Rujin, S. (2019). What are the effects of technology shocks on international labor markets?
Ruhr Economic Papers 806, RWI - Leibniz-Institut fr Wirtschaftsforschung, Ruhr-University
Bochum, TU Dortmund University, University of Duisburg-Essen.
Smets, F. and R. Wouters (2007). Shocks and Frictions in US Business Cycles: A Bayesian
DSGE Approach. American Economic Review 97 (3), 586–606.
Summers, P. M. (2005). What Caused the Great Moderation?: Some Cross-Country Evidence.
Economic Review (Q III), 5–32.
Syverson, C. (2017). Challenges to Mismeasurement Explanations for the US Productivity
Slowdown. Journal of Economic Perspectives 31 (2), 165–186.
Timmer, M. P., E. Dietzenbacher, B. Los, R. Stehrer, and G. J. De Vries (2015). An Illus-
trated User Guide to the World Input–Output Database: the Case of Global Automotive
Production. Review of International Economics 23 (3), 575–605.
Uhlig, H. (2004). Do Technology Shocks Lead to a Fall in Total Hours Worked? Journal of the
European Economic Association 2 (2-3), 361–371.
van Ark, B., M. O’Mahoney, and M. P. Timmer (2008). The Productivity Gap between Europe
and the United States: Trends and Causes. Journal of Economic Perspectives 22 (1), 25–44.
26

Appendix A Data definitions and sources
Table A.1: Data sources and definitions
Variable Sample Definitions and sources
Fernald (2014), http://www.johnfernald.net/TFP
Utilization-adjusted
quarterly-TFP series for
the U.S. Business Sector
1970:1–2016:4
The data on inputs, including capital, are used to produce
a quarterly series on total factor productivity. In addi-
tion, the dataset implements an adjustment for variations
in factor utilization–labor effort and the workweek of capi-
tal. The utilization adjustment follows Basu et al. (2006).
Utilization of capital and
labor1970:1–2016:4
Based on the approaches developed by Basu et al. (2006)
and Basu, Fernald, Fisher, and Kimball (2013), Fernald
(2014) computes a proxy for variations in factor utilization
– labor effort and the workweek of capital.
Ohanian-Raffo dataset: Ohanian and Raffo (2012), http://andrearaffo.com/araffo/Research.html
Total hours worked
1970:1–2016:4
1971:1–2016:4 (U.K.)
1974:1–2016:4 (SE)
Total hours worked series are obtained as the product of
hours worked per worker and employment.
Population aged 15 to 64 1970:1–2016:4Time series are from national statistical offices and the
OECD-Economic Outlook database.
Real GDP 1970:1–2016:4Time series are from the OECD-Economic Outlook
database.
International institutional characteristics
Strictness of employment
protection, 0 - 6 (strict)
1985–2013
1990–2013 (KR)
The OECD indicator of employment protection is a syn-
thetic indicator of the strictness of regulation on dismissals.
It measures the strictness of employment protection against
individual dismissal (regular contracts) and is expressed on
a scale 0 - 6 (most strict).
Economy-wide product
market regulation, 0 - 6
(strict)
1998–2013
This indicator is form the OECD dataset, which represents
a comprehensive and internationally-comparable set of in-
dicators that measure the degree to which policies promote
or inhibit competition in areas of the product market where
competition is viable. They measure the economy-wide reg-
ulatory and market environments in 1998, 2003, 2008 and
2013. These indicators are consistent across time and coun-
tries and are expressed on a scale from least (0) to most
restrictive (6). For further details see Koske et al. (2015)
27
Table A.1: (Continued)
Variable Sample Definitions and sources
Sector market regulation,
0 - 6 (strict)1998–2013
This indicator is form the OECD dataset, which represents
a comprehensive and internationally-comparable set of indi-
cators on regulation in non-manufacturing sectors (NMR).
These indicators measure regulation at the sector level and
cover seven network sectors (telecommunication, electricity,
gas, post, rail, air passenger transport, and road freight)
and five service sectors (retail distribution, accounting ser-
vices, legal services, engineering services, and architectural
services). The seven indicators of regulation in network
sectors are aggregated into one indicator of regulation in
energy, transport and communications (ETCR). The indi-
cators for the five service sectors are available for the years
1998, 2003, 2008 and 2013. For further details see Koske
et al. (2015)
Chinn-Ito index of finan-
cial openness1970–2016
The index of financial openness was developed by Chinn
and Ito (2006). It measures a countrys degree of capital
account openness by considers regulatory restrictions on
cross-border financial transactions.
Productivity Levels
Country Productivity
Levels1995 and 2010
Inklaar and Diewert (2016) use the translog GDP method-
ology for measuring productivity levels across time and
adapt it to the multilateral context. The new method is
illustrated using an industry level data set and shows pro-
ductivity dispersion across 12 countries between 1995 and
2010.
Real GDP per hour
worked1970–2016
GDP per hour worked in US Dollars, constant prices, and
2010 PPPs from the OECD.
Gaps in real GDP per
hour worked with respect
to the U.S.
1970–2016 Gaps are expressed in percent. Data are from the OECD.
28
Table A.1: (Continued)
Variable Sample Definitions and sources
Federal Reserve Economic Data (FRED), Federal Reserve Bank of St. Louis
Nonfarm Business Sector:
Real Output Per Hour
of All Persons, Index
2009=100, Quarterly, Sea-
sonally Adjusted, U.S.
1970:1–2016:4
U.S. Bureau of Labor Statistics, Nonfarm Business Sector:
Real Output Per Hour of All Persons [OPHNFB], retrieved
from FRED, Federal Reserve Bank of St. Louis; https:
//fred.stlouisfed.org/series/OPHNFB
Nonfarm Business Sector:
Hours of All Persons, In-
dex 2009=100, Quarterly,
Seasonally Adjusted, U.S.
1970:1–2016:4
U.S. Bureau of Labor Statistics, Nonfarm Business Sec-
tor: Hours of All Persons [HOANBS], retrieved from
FRED, Federal Reserve Bank of St. Louis; https://fred.
stlouisfed.org/series/HOANBS
Other variables
Nominal GDP 1970:1–2016:4
Gross domestic product – expenditure approach, in U.S.
dollars, current prices, current PPPs, seasonally adjusted.
Data are from the OECD Quarterly National Accounts.
Notes: All definitions are from the original sources. The data set covers 14 countries: Australia (AU), Austria (AT), Canada (CA),
Finland (FI), France (FR), Germany (DE), Ireland (IE), Italy (IT), Japan (JP), Norway (NO), South Korea (KR), Sweden (SE),
U.K., and the U.S. We exclude Spain from the analysis due to the much later starting date of the hours series which starts in
1995:1.
29

Appendix B Additional tables and figures
Table B.1: Classification of countries according to institutional characteristics
Country Labor market Product market Service sector Financial market
rigidity rigidity rigidity rigidity
Median2.39 1.61 2.08 1.55
(excluding U.S.)
U.S. 0.26 1.56 1.67 2.36
Austria high low high low
Australia low low low high
Canada low high high low
Germany high high high low
Finland median low median median
France high high high high
Ireland low low low high
Italy high high high high
Japan low low high low
South Korea high high low high
Norway low median low high
Sweden high high low low
U.K. low low low low
Notes: This table shows the classification of countries into ”high” and ”low” regimes, based on the respective institutional char-
acteristics. For this purpose, we compute the country-level averages of the respective institutional indicators. Based on these
averages, we compute the median value of each indicator (excluding the U.S.). Consequently, countries displaying an average value
above (below) the corresponding median are classified into high (low) regimes. To obtain the same number of countries in each
regime, we exclude for each institutional characteristic the respective median country. Definitions and sources of the institutional
characteristics considered in this table can be found in the data appendix. For consistency reasons, we reversed the definition of
financial market openness. We thus attribute high (low) financial openness to low (high) institutional rigidity.
Table B.2: Spearman correlation coefficients excluding Japan and South Korea
Institutional characteristics
LagsLabor market Product market Service sector Financial market
rigidity rigidity rigidity rigidity
Baseline IRFs4 -0.25 -0.24 -0.25 0.08
20 0.45 0.50 0.17 0.51
Notes: This table reports the Spearman rank correlation coefficients between the one and five years delayed cumulative IRFs of
labor productivity following a U.S. technology shock for 11 advanced economies, excluding Japan and South Korea, and indicators
on institutional characteristics, respectively.
30
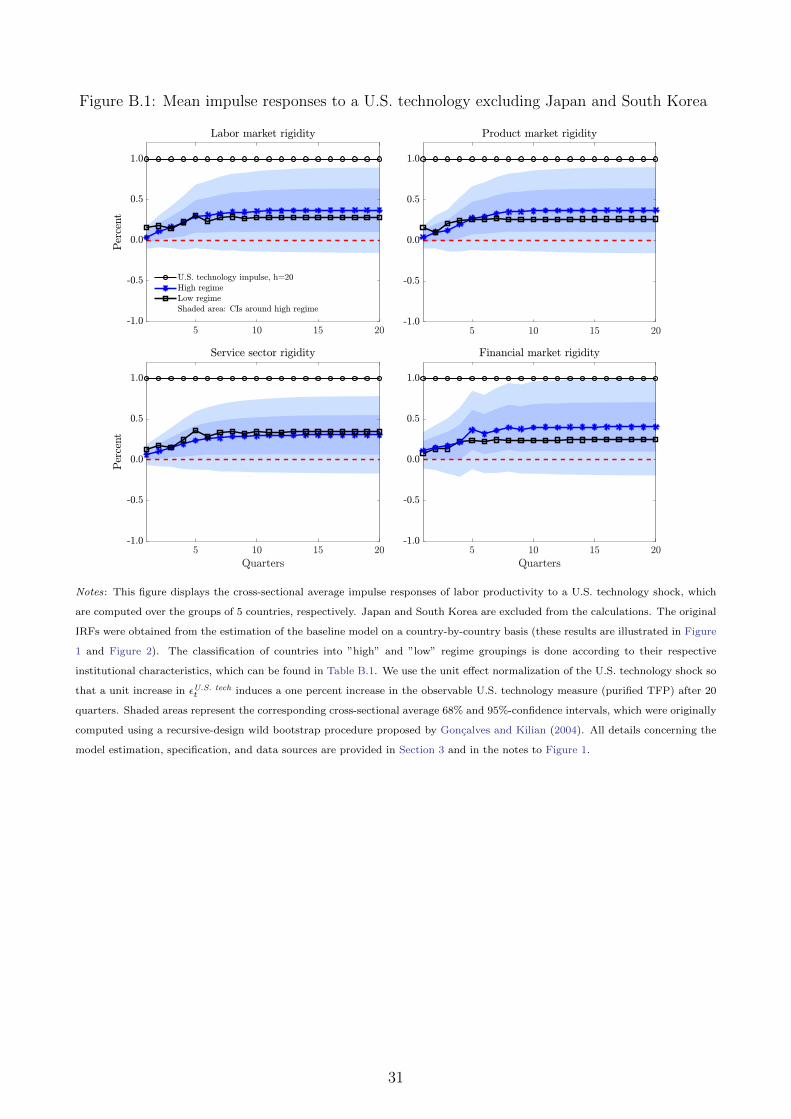
Figure B.1: Mean impulse responses to a U.S. technology excluding Japan and South Korea
Notes: This figure displays the cross-sectional average impulse responses of labor productivity to a U.S. technology shock, which
are computed over the groups of 5 countries, respectively. Japan and South Korea are excluded from the calculations. The original
IRFs were obtained from the estimation of the baseline model on a country-by-country basis (these results are illustrated in Figure
1 and Figure 2). The classification of countries into ”high” and ”low” regime groupings is done according to their respective
institutional characteristics, which can be found in Table B.1. We use the unit effect normalization of the U.S. technology shock so
that a unit increase in εU.S. techt induces a one percent increase in the observable U.S. technology measure (purified TFP) after 20
quarters. Shaded areas represent the corresponding cross-sectional average 68% and 95%-confidence intervals, which were originally
computed using a recursive-design wild bootstrap procedure proposed by Goncalves and Kilian (2004). All details concerning the
model estimation, specification, and data sources are provided in Section 3 and in the notes to Figure 1.
31

Figure B.2: The effects of U.S. technology shocks on labor productivity
Notes: This figure shows the accumulated IRFs of labor productivity to a U.S. technology shock over a one- and five-year horizon
for 13 advanced economies. The markers illustrate the point estimates obtained from the Fernald model that includes 16 lags. We
also report the Spearman rank correlation coefficients between the IRFs of labor productivity for 13 advanced economies obtained
from the Fernald model with 16 lags and baseline results, respectively. All models are estimated as subset VARs on a country-by-
country basis. We use the unit effect normalization of the U.S. technology shock so that a unit increase in εU.S. techt induces a one
percent increase in the observable U.S. technology measure (purified TFP) after 20 quarters. All variables are expressed in log first
differences.
32


![Rwi report 2012[1]](https://static.documents.pub/doc/80x56/54c1981e4a7959746b8b45ed/rwi-report-20121.jpg)


