300
The Best-Run Businesses Run SAP ® 2014 ANNUAL REPORT Run Simple

RUN
SIMPLE
2014 AN
NU
AL R
EPORT
The Best-Run Businesses Run SAP®
2014 ANNUAL REPORT
Run Simple

WHAT WE REPORT
We present our financial, social, and environmental performance in the SAP Integrated Report 2014, which is available at www.sapintegratedreport.com.
This Annual Report 2014 is an extract from the SAP Integrated Report 2014. It comprises all of the information required by accounting and disclosure standards applicable to us.

Key Facts
Performance Summary € millions, unless otherwise stated
2014 2013 Change
in %
Financial key performance indicators
Cloud subscriptions and support (IFRS) 1,087 696 56
Non-IFRS adjustments 14 61 –77
Cloud subscriptions and support (non-IFRS) 1,101 757 45
Software and support (IFRS) 13,767 13,254 4
Non-IFRS adjustments 5 21 –76
Software and support (non-IFRS) 13,773 13,275 4
Software and software-related service revenue (IFRS) 14,855 13,950 6
Non-IFRS adjustments 19 82 –77
Software and software-related service revenue (non-IFRS) 14,874 14,032 6
Total revenue (IFRS) 17,560 16,815 4
Non-IFRS adjustments 19 82 –77
Total revenue (non-IFRS) 17,580 16,897 4
Operating profit (IFRS) 4,331 4,479 –3
Non-IFRS adjustments 1,307 1,003 30
Operating profit (non-IFRS) 5,638 5,482 3
Operating margin (as a percentage, IFRS) 24.7 26.6 –7
Operating margin (as a percentage, non-IFRS) 32.1 32.4 –1
Free cash flow 2,762 3,266 –15
Net liquidity –7,670 –1,467 423
Days' sales outstanding (DSO, in days) 65 62 5
Equity ratio (total equity as a percentage of total assets) 51 59 –14
Operating expenses
Cloud subscriptions and support margin (as a percentage of corresponding revenue)
56 55 2
Software and software-related service margin (as a percentage of corresponding revenue)
81 81 –1
Professional service and other services margin (as a percentage of corresponding revenue)
12 16 –25
Cost of research and development 2,331 2,282 2
Cost of research and development (as a percentage of total revenue) 13 14 –5
Cost of research and development (as a percentage of total operating expenses) 18 15 17
Financial performance measuresWeighted average shares outstanding, basic (in millions) 1,195 1,193 0
Earnings per share, basic (in €) 2.75 2.79 –1
Dividend per share (in €) 1.10 1.00 10
SAP share price2) (in €) 58.26 62.31 –6
Market capitalization2) (in € billions) 71.6 76.5 –6

Performance Summary € millions, unless otherwise stated
2014 2013 Change
in %
Employees and personnel expensesNumber of employees1), 2) 74,406 66,572 12
Number of employees in research and development1), 2) 18,908 17,804 6
Personnel expenses per employee – excluding share-based payments (in € thousands) 111 109 1
Women working at SAP (as a percentage) 31 31 0
Women in management2) (total, as a percentage) 21.3 21.2 0
Employee Engagement Index (as a percentage) 79 77 3
Business Health Culture Index (as a percentage) 70 67 4
Employee retention (as a percentage) 93.5 93.5 0
EnvironmentGreenhouse gas emissions (in kilotons) 500 545 –8
Greenhouse gas emissions per employee1) (in tons) 7.3 8.3 –12
Greenhouse gas emissions per € revenue (in grams) 28.4 32.4 –12
Total energy consumption (in GWh) 920 910 1
Energy consumed per employee1) (in kWh) 13,400 13,900 –4
Data center energy consumed (in GWh) 179 173 3
Data center energy per employee1) (in kWh) NA 2,633 NA
Data center energy per € revenue3) (in kWh) 10 NA NA
Renewable energy sourced (as a percentage) 100 43 133
Customer Customer Net Promoter Score4) (as a percentage) 19.1 12.1 58
1) Full-time equivalents 2) Numbers based on year-end 3) Data center energy consumption normalized against € revenue combines a relative measure of required energy to develop and operate solution in internal and external data center. 4) In addition to our on-premise customers, in 2014, for the first time we included Ariba, SuccessFactors, and Sybase customers in the survey.
Therefore, the 2014 Customer Net Promoter Score is not fully comparable to the prior year’s score.

WHO WE ARE
For more than 40 years, SAP has helped companies of all sizes and in all indus-tries run better. Through our Run Simple approach, we simplify technology and master complexity so customers can consume our software the way they want and ultimately run their businesses more simply. With an extensive global network of customers, partners, and employees around the world, SAP helps the world run better and improve people’s lives. Run Simple is more than our tagline, it is a promise. We realize the promise of Run Simple through our strategy to be “THE cloud company powered by SAP HANA.”

Contents
To Our Stakeholders
Combined Management Report
Consolidated Financial Statements IFRS
Additional Information
555
159269
2

To Our Stakeholders
Letter from the CEOGlobal Managing BoardInvestor RelationsCorporate Governance ReportReport from the Supervisory BoardCompensation ReportResponsibility StatementIndependent Auditor’s Report
Combined Management Report
General Information About This Management ReportOverview of the SAP GroupStrategy and Business Model Products, Research & Development, and ServicesAcquisitionsPartner EcosystemCustomersPerformance Management SystemEmployees and Social PerformanceEnvironmental Performance: Energy and EmissionsFinancial Performance: Review and AnalysisCorporate Governance FundamentalsRisk Management and RisksExpected Developments and OpportunitiesEvents After the Reporting Period
5
610121620305051
55
56
57586268697173828892
114117148157
Consolidated Financial Statements IFRS
Consolidated Income Statements Consolidated Statements of Comprehensive IncomeConsolidated Statements of Financial PositionConsolidated Statements of Changes in EquityConsolidated Statements of Cash FlowsNotes to the Consolidated Financial StatementsManagement’s Annual Report on Internal Control over Financial Reporting in the Consolidated Financial Statements
Additional Information
Five-Year SummaryGlossaryAddressesFinancial and Sustainability PublicationsFinancial CalendarPublication Details
159
160161
162
164
166
167
267
269
270273292293294295
3
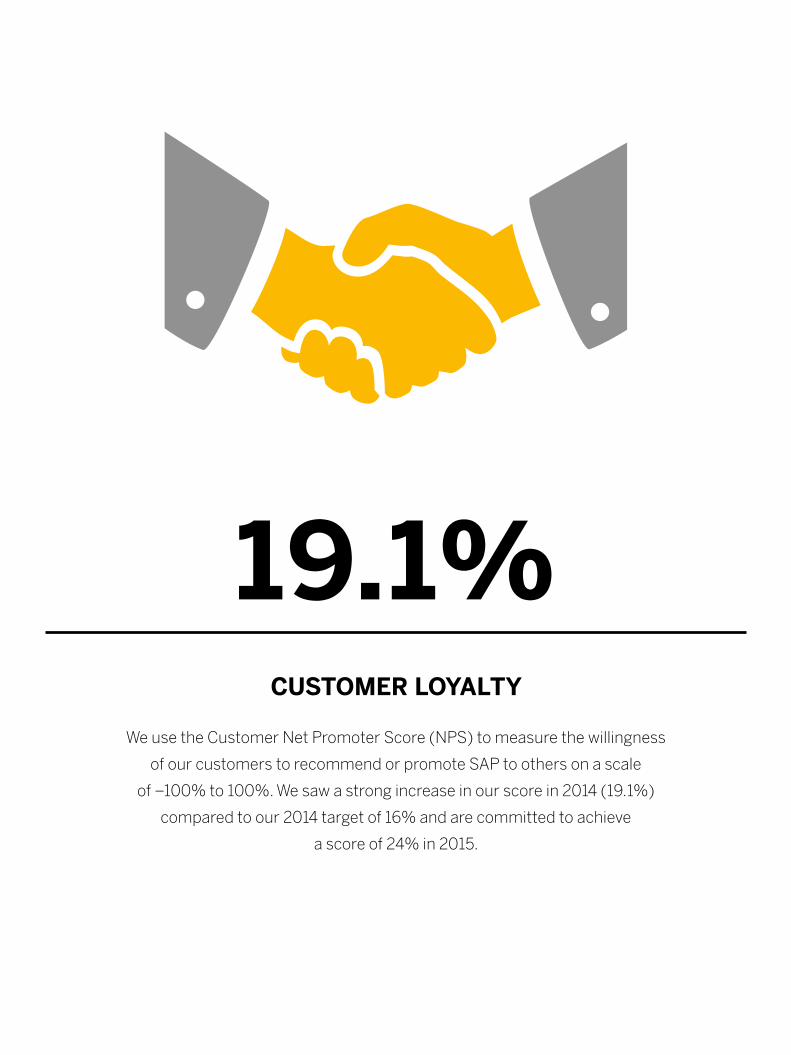
CUSTOMER LOYALTY
We use the Customer Net Promoter Score (NPS) to measure the willingness
of our customers to recommend or promote SAP to others on a scale
of –100% to 100%. We saw a strong increase in our score in 2014 (19.1%)
compared to our 2014 target of 16% and are committed to achieve
a score of 24% in 2015.
19.1%

To Our StakeholdersLetter from the CEOGlobal Managing BoardInvestor RelationsCorporate Governance ReportReport from the Supervisory BoardCompensation ReportResponsibility StatementIndependent Auditor’s Report
56
10121620305051
5

Bill McDermott, CEO
Letter from the CEO
6 To Our Stakeholders

Dear Stakeholders,
In 2014, SAP’s more than 74,400 employees came together and delivered a performance worthy of our enduring vision to help the world run better and improve people’s lives.
We also seized on the most intractable CEO challenge of this generation: complexity. In acknowledging the common enemy facing businesses of all sizes in all industries, we established an audacious new operating principle for ourselves and for the world: Run Simple.
BUSINESS HIGHLIGHTS Against the backdrop of an IT industry in the midst of massive transformation, SAP executed in 2014 with the strength and stability the world has come to expect from a market leader. We delivered €17.6 billion in non-IFRS total revenues and €5.6 billion in non-IFRS operating profit for the full year. This performance is the latest result of our carefully and effectively managed business transformation, driven by the accelerated growth in SAP’s cloud business.
As customer preference shifts toward the software-as-a-service model, SAP’s business results evolve as well. The transition results in less upfront revenue because, unlike perpetual software licenses, cloud subscriptions are recognized over time instead of at the moment of the initial delivery. The cloud business model does have considerable benefits, including increased revenue predictability over the long term.
In 2014, this cloud transition accelerated for SAP. Non-IFRS cloud subscriptions and support revenue was €1.10 billion (compared with €757 million in 2013), an increase of 45%. SAP’s annual total cloud revenue run rate exceeded €1.7 billion. This is even more exciting when considering that only five years ago, SAP’s cloud revenues and registered cloud users were negligible.
Today, SAP is the fastest-growing enterprise cloud company at scale and the largest cloud company in the world by measure of users (70 million). By creating a “green cloud,” we have also tied our environmental strategy to our business strategy. Despite the increase in energy consumption from broader use of our cloud solutions, we were able to reduce our carbon footprint by 8% compared to 2013. And, for the eighth year in a row, we have been ranked the number-one software company in the Dow Jones Sustainability Index.
Other non-financial performance metrics also tell the story of SAP’s successful 2014. Our employee engagement index increased to 79%, again showing that our employees are engaged, supportive of our consistent strategy, and united in high trust. Our customers are not only satisfied, but also see us as a trusted partner for innovation, leading to an increase in customer loyalty, as measured by the Customer Net Promoter Score, to 19.1%.
Overall, our 2014 performance was driven by our people and by an innovations portfolio built around the business challenges and opportunities facing our more than 282,000 customers worldwide.
7Letter from the CEO

THE GREAT SIMPLIFIER: SAP HANA With fast-growing inputs from sources like social media and the Internet of Things, CEOs have made it clear: accessing and analyzing only 1% of their data is a clear manifestation of complexity. Only SAP could take on the challenge of Run Simple, because only we have SAP HANA to manage the Big Data of the enterprise – structured and unstructured. With skyrocketing customer adoption in 2014, we firmly established the leadership position of SAP HANA, with more than 5,800 SAP HANA customers and 1,850 SAP Business Suite powered by SAP HANA customers worldwide.
In 2014, we also unveiled a new breakthrough, SAP Simple Finance, a solution fundamentally redefining what it means to use real-time financial data in successful businesses. Changing the “read, then react” mindset in favor of prediction and simulation, SAP Simple Finance includes functionality and features natively built for the SAP HANA platform, delivering a consumer-grade user experience along with its revolutionary capabilities for finance professionals.
But SAP HANA also proved to be much more than just a transformational business innovation platform in 2014. It is changing everything from sports – SAP Match Insights powered by SAP HANA helped the German National Football Team win the 2014 FIFA World Cup – to healthcare – Heidelberg’s National Center for Tumor Diseases now uses SAP HANA to improve diagnostic and patient treatment capabilities. Whether it’s the Ebola outbreak in West Africa or infant mortality in the United States, SAP HANA is uniting future leaders from the Hasso Plattner Institute and other leading universities with business and political leaders to change the world.
APPLICATIONS IN THE CLOUD BUILT FOR BUSINESS For the CIO to line-of-business executives in HR, procurement, and sales, we knew the cloud would be the pervasive computing theme of this generation. So back in 2010, SAP set out on a series of bold moves to build the broadest cloud portfolio in the technology industry. In 2014, that portfolio grew even stronger. SuccessFactors Employee Central became the fastest-growing core HR management solution in the marketplace. Combined with solutions from Fieldglass, SAP is the only cloud company that helps customers manage their total workforce – including temporary workers, which remains the fastest-growing segment of the labor force.
In addition to engaging the workforce, the CEO agenda in the cloud is also about engaging end-consumers in any channel, on any device. We knew that sales force automation had its place, but that legacy CRM wouldn’t help CEOs build growth strategies for the digital economy. That’s why our SAP solutions for customer engagement and commerce showed aggressive growth in 2014, including SAP hybris Marketing and SAP Cloud for Customer.
The cloud may be accelerating, but for customers the cloud is not a one-size-fits-all option. In 2014, SAP continued to invest in our public and managed cloud offerings, ensuring that customers could choose whether to run applications or entire enterprises in an SAP cloud – public, managed, or hybrid. However the customer chooses to consume our technology, we remain ever-focused on innovating for their specific industry with our four decades-long commitment to security and trust.
8 To Our Stakeholders

THE BUSINESS NETWORK 2014 also saw SAP take a defining step on the road to the next frontier in the cloud: a secure, real-time business network to reinvent commerce between companies. It started in 2012 with Ariba, the network for indirect materials in the enterprise. It expanded in mid-2014 with Fieldglass and contract workforces. At the end of 2014, we successfully completed the acquisition of Concur, the largest software-as-a-service acquisition in history, adding the US$1.2 trillion business travel market to the scope of SAP’s leadership position in the business network.
Concur completes our network vision and enables SAP to help customers reinvent resource management across all major categories of enterprise spend. To defeat complexity, it’s no longer adequate for business processes to end at the walls of an enterprise. Our business network extends those processes between companies, a significant step forward for Run Simple.
THE ROAD AHEAD SAP enjoyed a strong and successful 2014, but we remain restless in our drive to shape the future of enterprise technology. In 2015, for example, we already made the largest product announcement in SAP’s history: SAP S/4HANA, a next-generation business suite built for the digital, networked economy. SAP S/4HANA is designed to drive instant value across lines of business and industries with the ultimate sophistication: simplicity. From a business value perspective, SAP S/4HANA can create unique opportunities to reinvent business models and drive new revenues. From an IT perspective, SAP S/4HANA can create unique opportunities to dramatically simplify the IT landscape and reduce total cost of ownership.
With SAP S/4HANA to revolutionize core business applications, the broadest cloud portfolio across industries and lines of business, and the business network to reinvent commerce between companies, we enter 2015 with the strongest collection of assets in the company’s history.
THIS REPORT We invite all stakeholders to explore our SAP Integrated Report 2014 to learn more about SAP’s business strategy and performance. But we also believe in full transparency, which is why you’ll also find extensive information about our social and environmental performance. It’s no longer enough for great companies to be financially and operationally sound. The 21st century demands purpose-driven companies, keenly aware of the impact we have on our people and our environment. In this spirit, the SAP Integrated Report aims to be a role model. We welcome your interest and your feedback.
SAP, our employees, and our ecosystem are united in dedication to our customers. We see a future where every customer can run real time, run networked, and Run Simple. 2014 kept us on the right path and inspires us to continue leading in 2015 and beyond.
Bill McDermott CEO, SAP SE
9Letter from the CEO

Global Managing Board
Gerhard OswaldMember of the Executive Board Global Service & Support
Michael KleinemeierMember of the Global Managing Board Head of Service & Support
Bernd LeukertMember of the Executive BoardProducts & Innovation
Stefan RiesMember of the Global Managing Board Chief Human Resources Officer
Ingrid-Helen ArnoldMember of the Global Managing Board Chief Information Officer and Head of Cloud Delivery
10 To Our Stakeholders

Bill McDermottCEO and Member of the Executive Board
Robert EnslinMember of the Executive Board President, Global Customer Operations
Luka MucicMember of the Executive Board Chief Financial Officer and Chief Operating Officer
Steve SinghMember of the Global Managing Board CEO, Concur Technologies
11Global Managing Board

Shortly after we published our results for the first quarter on April 17, stock markets again weakened in reaction to the troubles in Russia and Ukraine. The announcement of personnel changes on the Executive Board and the ex-dividend price adjustment after the Annual General Meeting of Shareholders brought our stock down as far as €54.41 on May 22. At the same time, the DAX was moving ahead on expectations that the European Central Bank (ECB) would further ease its monetary policy. After the ECB officially met those expectations, the DAX closed above 10,000 points for the first time ever on June 9. However, at the end of June, the geopolitical trouble spots and weak indicators from the U.S. economy impacted the mood on the markets.
SAP stock rallied when we announced our strong second-quarter results on July 17, reaching €61.12 on July 23. After that date, escalating troubles in Russia and Ukraine, as well as speculation that the interest rates would be raised in the United States negatively impacted sentiment on the stock exchanges. The ECB’s monetary policy boosted the markets again at the end of August. The announcement of the Concur acquisition on September 18 and an overall less favorable market environment at the time led investors to be more cautious.
The downward trend on the stock markets accelerated in October. In this environment, we published our third-quarter earnings on October 20 and lowered our operating profit target for 2014 in light of the rapid growth in our cloud business. That day, SAP stock touched its lowest point for the year, which was €50.90. The next day it rallied to €51.87. Subsequently, the stock markets recovered, not least because the ECB signaled further easing of its monetary policy. The DAX exceeded 10,000 points again and our stock closed the year at €58.26.
In 2014, we continued to engage in a dialog with our investors. Our conversations were highly focused on our growth strategy and our transition to THE cloud company powered by SAP HANA. Investors were keen on understanding how this business transformation was impacting SAP. These discussions also involved our acquisition strategy, because we acquired Concur and Fieldglass to complete our business network.
Indexes Scale New Heights Despite TroublesThe stock markets were volatile in 2014. Geopolitical trouble spots in Russia and the Ukraine as well as some countries in Latin America had a negative influence, as was weak economic growth in the euro area. On the other hand, central bank monetary policies and a fall in the price of oil more than outweighed this impact. As a result, there were record highs for the Dow Jones Industrial Average and the DAX 30.
Having risen each of the previous five years, our stock declined 6.5% in 2014. In contrast, the key blue chip and industry indexes climbed in response to increased liquidity on the financial markets. The DAX 30 and the EURO STOXX 50 index of euro-area blue chips gained 2.7% and 1.2% respectively in 2014. The Dow Jones Industrial Average gained 7.5%; the S&P 500 was up 11.4%; and the S&P North American Technology Software Index increased by 13.1%.
SAP Closes StrongerAfter closing the end of 2013 at €62.31, our stock had already reached €62.55, its highest level for the year, by January 8, 2014. It weakened a little when, on January 21, we published our preliminary 2013 results and outlook for 2014. Soon after that, confidence across the market was undermined by the instability affecting some emerging economies' currencies and by the developing crisis in Russia and Ukraine. During this phase, on March 14, SAP stock slipped to €54.31. Initially, the tension surrounding the situation in Russia and Ukraine did not escalate, and the stock markets rallied again. The recommendation from the Executive Board of an 18% dividend increase provided an extra boost for our stock.
Investor Relations
12 To Our Stakeholders

DIVIDEND PAYOUT OF €1.10 PER SHARE We believe our shareholders should benefit appropriately from the profit the Company made in 2014. Until now, our policy has been to distribute more than 30% of profit after tax in dividend. In recent years, the payout has been greater than 35% of profit after tax. Reflecting this, we are therefore amending our policy, which from now on will be to pay a dividend totaling more than 35% of profit after tax.
The Executive Board and the Supervisory Board will therefore recommend to the Annual General Meeting of Shareholders that the total dividend be increased by 10% to €1.10 per share (2013: €1.00). Based on this recommendation, the overall dividend payout ratio (which means here the total distributed dividend as a percentage of profit) would be 40% (2013: 36%).
SAP Stock in Comparison to DAX 30, Dow Jones EURO STOXX 50 and to S&P North American Technology Software Index December 31, 2013 (= 100%) to January 31, 2015Percent
SAP Share (Xetra) DAX 30 Performance Index (Xetra) S&P North American Technology Software Index Dow Jones EURO STOXX 50
01 02 03 04 05 06 07 08 09 10 11 12 0101 02 03 04 05 06 07 08 09 10 11 12 01
115
110
105
100
95
90
85
SAP-Aktie im Vergleich zu DAX 30, zum Dow Jones EURO STOXX 50 und zum S&P North American Technology Software Index31. Dezember 2013 (= 100 %) bis 31. Januar 2015Prozent
■ SAP-Aktie (Xetra) ■ DAX 30 Performanceindex (Xetra) ■ S&P North American Technology Software Index ■ Dow Jones EURO STOXX 50
115
110
105
100
95
90
85
Key Facts About SAP Stock/SAP ADRs
Listings
Germany Berlin, Frankfurt, Stuttgart
United States (ADR) New York Stock Exchange
IDs and symbols WKN/ISIN 716460/DE0007164600
NYSE (ADRs) 803054204 (CUSIP)
Reuters SAPG.F or .DE
Bloomberg SAP GR
Weight (%) in indexes at 12/31/2014DAX 30 6.63
Prime All Share 5.08
CDAX 5.23
HDAX 5.33
Dow Jones STOXX 50 1.70
Dow Jones EURO STOXX 50 2.79
13Investor Relations

founders and their trusts and holding companies. U.S. institutions remained the largest group of shareholders, holding around 16.2% (January 2014: 18.0%) of the stock in January 2015. Institutions in Ireland and the United Kingdom held about 15.1% (January 2014: 14.9%), followed by Continental European investors outside Germany, who held approximately 14.3% (January 2014: 13.8%) in January 2015. Institutions in Germany held 7.1% (January 2014: 7.6%) and investors from the rest of the world held 2.9% (January 2014: 2.7%) of the stock in January 2015. Private or unidentified investors held 18.7% (January 2014: 17.6%) in January 2015. Also as of January 2015, SAP held 2.7% (January 2014: 2.8%) of the stock in treasury.
CAPITAL STOCK UNCHANGEDSAP’s capital stock on December 31, 2014, was €1,228,504,232 (2013: €1,228,504,232). It is issued as 1, 228,504,232 no-par shares, each with an attribute value of €1 in relation to capital stock.
LARGER FREE FLOATThe proportion of our stock in free float increased again slightly in 2014. Applying the definition accepted on the Frankfurt Stock Exchange, which excludes treasury stock from the free float, at December 31, 2014, the free float stood at 75.7% (December 31, 2013 74.7%). In January 2015, approximately 21.6% (January 2014: 22.5%) of the stock was under the control of three of the
Return on SAP Common Stock – WKN 716460/ISIN DE0007164600Percent, unless otherwise stated
Initial investment €10,000
Date of investment 12/31/2004 12/31/2009 12/31/2013
Period of investment 10 years 5 years 1 year
Value on 12/31/20141) (in €) 20,499 19,208 9,522
Average annual return (%) 7.4 13.9 –4.8Performance comparators
DAX 30 Performance – total return index 8.7 10.5 2.7
REX General Bond – total return index 4.5 4.7 7.1
S&P 500 Composite – total return index 7.5 16.4 13.7
S&P North American Technology Software Index 8.5 16.3 13.9
1) Assuming all dividends were reinvested
Source: Datastream
Return on SAP ADRs – 803054204 (CUSIP)Percent, unless otherwise stated
Initial investment US$10,000
Date of investment 12/31/2004 12/31/2009 12/31/2013
Period of investment 10 years 5 years 1 year
Value on 12/31/20141) (in US$) 17,668 15,931 8,133
Average annual return (%) 5.9 9.8 –18.7Performance comparators
S&P 500 Composite – total return index 7.7 15.5 13.7
1) Assuming all dividends were reinvested
Source: Datastream
14 To Our Stakeholders

COMMUNICATION WITH INVESTORSSAP aims for transparency and openness in a continuous dialog with the financial community. In several hundred one-on-one meetings held, during investor road shows worldwide, in virtual format over Telepresence or video conference, and at investor events, the Investor Relations team answered inquiries from institutional investors and analysts about SAP’s business strategy. We also held telephone conferences and analyst meetings when we published our quarterly results. Investor presentations at our Capital Markets Day in New York City and at the SAPPHIRE NOW conference in Orlando, Florida, in the United States, were key elements of our communication with the financial markets. In addition, SAP engages in regular dialog with socially responsible investors (SRIs), by providing insight into SAP’s environmental, social, and corporate governance policies.
COMPREHENSIVE SERVICE FOR PRIVATE INVESTORSProviding a full service for retail investors is a priority for SAP. Our services for private investors include investor presentations at various retail shareholder events, a shareholder hotline, e-mail contact at [email protected], investor relations information on our public Web site www.sap.com/investor, and a mobile Web site m.sapinvestorrelations.com. We provide a range of information for investors about SAP and SAP stock online, including press releases delivered by e-mail, social media including information provided on the SAP Investor Relations Twitter feed @sapinvestor, the quarterly SAP INVESTOR magazine, which investors can subscribe to free of charge, and a text message service. We also publish an overview of the latest analyst assessments in collaboration with Vara Research. All key events at which members of our Executive Board speak to financial analysts and institutional investors are broadcast live on the Internet, and we post the presentation materials on the investor relations area of our public Web site.
15Investor Relations
Corporate Governance Report
We are a global company with an international shareholder base, so we rely on sound governance. Good corporate governance means managing the Company accountably and transparently to secure long-term value. We believe our shareholders, business partners, employees, and the financial markets reward good corporate governance with the high level of trust they place in our Company.
CORPORATE GOVERNANCE PRINCIPLES AT SAPIn 2014, SAP changed its legal form from a German-style stock corporation to European Company (Societas Europaea, or SE). The conversion reflects both our international outlook and our European roots. Being an SE headquartered in Germany, we are now subject to European and German law for SEs while remaining subject to German stock corporation law. Major characteristics of our governance structure remain in place since the conversion, notably our two-tier board comprising a Super visory Board and an Executive Board, and parity for workforce representatives on the Supervisory Board. Because SAP SE is listed on a German stock exchange, our corporate governance is still based on the German Corporate Governance Code (“Code” in this report). Every year, as required by the German Stock Corporation Act, section 161, the Executive Board and Supervisory Board issue a declaration stating whether SAP has implemented and is following the Code’s recommen- dations, and identifying any recommendations that the Company has not followed – with a full explanation of why it has not done so. Our latest section 161 declaration, published on October 29, 2014, is on the SAP public Web site along with our declarations from previous years and links to the current and previous editions of the Code. As our 2014 declaration shows, we currently follow all but eight of the 105 recommendations and all of the suggestions in the current Code.
Since SAP is also listed in the United States, we comply with the rules that apply to non-U.S. companies listed on the New York Stock Exchange (NYSE). These include the requirements, as they apply to foreign private issuers, of the NYSE Corporate Governance Standards, the U.S. Sarbanes-Oxley Act of 2002, and the U.S. Securities and Exchange Commission (SEC).
CORPORATE GOVERNANCE STATEMENTOn February 18, 2015, the Executive Board published a corporate governance statement for 2014 as required by the German Commercial Code, section 289a. The statement is on the SAP public Web site. It comprises the current declaration pursuant to the German Stock Corporation Act, section 161, certain details of our corporate governance practices, and an account of how the Executive Board and the Supervisory Board work, who serves on which Supervisory Board committees, and how those committees work.
EXECUTIVE BOARDThe Executive Board currently has five members. It is solely responsible for managing the Company. It has a duty to exercise its management powers in the interest of the Company and in pursuit of the sustained growth of corporate value. It discusses and agrees its strategy for the Company with the Supervisory Board, ensures compliance with the requirements of the law throughout the Group, and maintains effective risk management structures and internal risk controls. There is information about each member’s portfolio of responsibilities on the SAP public Web site.
16 To Our Stakeholders

GLOBAL MANAGING BOARDThe Global Managing Board helps the Executive Board with its work. It currently comprises all of the Executive Board and four other global managers who play a part in directing large sections of the business. These additional members are appointed by the Executive Board with the consent of the Supervisory Board. The Global Managing Board has a coordinating function, advises the Executive Board and helps it make decisions, but the Executive Board retains overall responsibility for everything the Company does. Information about each member of the Global Managing Board is available on the SAP public Web site.
SUPERVISORY BOARDThe size and composition of the Supervisory Board are governed not by the German Codetermination Act (which does not apply, because we are a European company) but by the Articles of Incorporation and the Employee Involvement Agreement. Both documents are on the SAP public Web site.
The Supervisory Board has 18 members who, in equal numbers, represent the shareholders and the employees. It appoints, monitors, and advises the Executive Board. The Executive Board involves the Supervisory Board in decisions on matters of fundamental importance for the Company. The Supervisory Board has reserved to itself the approval of certain transactions of fundamental importance, as set out in the Articles of Incorporation and detailed in the Supervisory Board’s list of reserved categories of transactions. The Executive Board regularly provides the Supervisory Board with full and timely reports on all material matters of strategy, business planning, and performance, including any deviations of actual business performance from plan, risks, risk management, and corporate compliance. We provide our shareholders with in-depth information about how the Executive and Supervisory Boards work, how the committees are composed, and how these committees work, in our corporate governance statement. For more information about the joint work of the Executive and Supervisory Boards and about the work of the Supervisory Board and its committees in 2014, see the Report from the Supervisory Board.
COMPOSITION OF THE SUPERVISORY BOARDThe Supervisory Board members as a group possess the knowledge, ability, and expert experience required to properly perform its duties in our global IT company. At least one independent member has financial reporting and auditing expertise. The Supervisory Board has defined the following objectives for its composition:– There should never be fewer than three people from the
international stage on the shareholder representatives’ side of the Supervisory Board.
– No employee, consultant, or director of a significant SAP competitor should be a Supervisory Board member.
– At least five shareholder representatives on the Supervisory Board should be independent members in the meaning of section 5.4.2 of the Code.
– As a general rule, no member of the Supervisory Board should be older than 75 years.
– At least one shareholder representative on the Supervisory Board should be a woman.
We believe the current composition of the Supervisory Board fulfills all of these objectives. There is information about each member, the committees, and who serves on which committee, on the SAP public Web site.
17Corporate Governance Report

CODE OF BUSINESS CONDUCTSAP’s corporate governance includes our Code of Business Conduct for employees and members of the Executive Board. The Code of Business Conduct expresses the high standards that we require from our employees and Executive Board members and sets out the main principles that guide our business conduct toward customers, business partners, and shareholders. We see our Code of Business Conduct as the standard for our dealings involving customers, business partners, vendors, shareholders, and competitors. By following our Code of Business Conduct, we demonstrate a commitment against all forms of unfair competitive practice, corruption, and misrepresentation. Our global compliance organization monitors worldwide compliance with the Code of Business Conduct and other policies applying within the Group. It regularly reviews these internal policies, revises them if necessary, and delivers related employee training.
APPLYING INTERNATIONAL CORPORATE GOVERNANCE STANDARDSSAP is an NYSE-listed company and we are therefore subject to certain U.S. financial legislation (including among others the U.S. Sarbanes-Oxley Act of 2002) and to the applicable SEC and NYSE regulations. Besides implementing the requirements of the U.S. Sarbanes-Oxley Act, section 404, and other U.S. Sarbanes-Oxley Act requirements, including conducting an annual audit of our internal control over financial reporting, we comply with those of the corporate governance standards codified in the NYSE Listed Company Manual, section 303A, which bind foreign private issuers. The section 303A standards that apply to SAP include the requirement to have an audit committee composed of members who are independent in the meaning of the U.S. Sarbanes-Oxley Act, and related reporting requirements. Erhard Schipporeit, the chairperson of the Audit Committee, is an audit committee financial expert in the meaning of the U.S. Sarbanes-Oxley Act.
INDEPENDENCE OF THE SUPERVISORY BOARDWe believe a sufficient degree of independence of our Supervisory Board members is essential for effective and responsible corporate management and control. Our Supervisory Board has a defined objective for its composition regarding the minimum number of independent members on the shareholder representative side, as recommended in the Code, section 5.4.1, paragraph 2. The objective is five such members. At its meeting on October 9, 2014, the Supervisory Board determined that all of its shareholder representative members are independent in the meaning of the Code, section 5.4.2 and that the number of independent members is sufficient in the meaning of that section. The Audit Committee is chaired by Erhard Schipporeit, who for many years was the chief financial officer of a DAX company that is also listed on a U.S. stock exchange and therefore qualifies as an independent financial expert in the meaning of the German Stock Corporation Act, section 100 (5).
DIVERSITY IN THE COMPANYThe Executive Board follows the recommendation in the Code that executive boards should have regard to diversity when appointing people to leadership positions, and in particular to employ appropriate numbers of women in such positions. In support of this, we maintain a diversity policy for leadership appointments. In May 2011, we also set a target to increase the percentage of leadership positions held by women from 18% at the beginning of 2011 to 25% in 2017. It goes without saying that ability is still the primary selection criterion for any position at SAP. Globally, the percentage of leadership positions held by women at the end of 2014 was 21.3%.
Section 5.1.2 of the Code contains the recommendation that supervisory boards should strive for appropriate numbers of women at executive board level as well. The Supervisory Board follows this recommendation and has ruled that when a new member is needed for the Executive Board, applications should be sought from within SAP and from outside, and that the shortlist should comprise 50% women if possible. As reported above, the Supervisory Board has defined objectives to promote diversity in its membership and attain an appropriate number of female members, as envisioned in the second paragraph of section 5.4.1 in the Code.
18 To Our Stakeholders

ANNUAL GENERAL MEETING OF SHAREHOLDERSOur shareholders exercise their rights, such as the rights to put questions to the management and to vote, at the Annual General Meeting of Shareholders. Shareholders and the public are able to watch a live broadcast of the entire Annual General Meeting of Shareholders on the Internet. They can vote their shares at the meeting or instruct a proxy of their choice or one of the proxies provided for that purpose by SAP. Alternatively, they can participate online or vote by mail. The invitation to the Annual General Meeting of Shareholders includes full details and instructions. Every shareholder can access all of the paperwork on the SAP public Web site in good time for the meeting.
TRANSPARENCY, COMMUNICATION, AND SERVICE FOR SHAREHOLDERSOur shareholders can obtain full and timely information about SAP on our public Web site and can access current and historical Company data. Among other information, we post all of our financial reports, all relevant news about the Company’s governing bodies and their corporate governance documentation, information requiring ad hoc (current) disclosure, press releases, and news of directors’ dealings notifiable pursuant to the German Securities Trading Act, section 15a.
FINANCIAL ACCOUNTING, RISK MANAGEMENT, AND INTERNAL CONTROLWe prepare the SAP SE financial statements in accordance with the German Commercial Code and our consolidated financial statements in accordance with IFRS. We prepare a management report, as required by the German Commercial Code, and the SAP Annual Report on Form 20-F in accordance with SEC requirements. The Executive Board is responsible for financial accounting. The Supervisory Board approves the SAP SE financial statements, the consolidated financial statements, and the combined management report. The SAP SE financial statements, the consolidated financial statements, and the combined management report are audited by KPMG AG Wirtschaftsprüfungsgesellschaft, the auditor elected for that purpose by the Annual General Meeting of Shareholders.
In addition to our annual financial statements, we also prepare interim reports for the first, second, and third quarters. Our quarterly reports comply with the German Securities Trading Act and are submitted to the Audit Committee of the Supervisory Board before they are published.
In German stock-corporation and commercial law, there are special requirements for internal risk management that apply to SAP. To meet them, our global risk management system supports risk planning, identification, analysis, handling, and elimination. We maintain standard documentation of all our internal control structures and continually evaluate their effectiveness. As a company listed on the NYSE, we instruct our auditor, KPMG, to conduct an annual audit of our internal control over financial reporting in accordance with the requirements of the U.S. Sarbanes-Oxley Act of 2002, section 404. The audit as at December 31, 2014, confirmed that our internal control is effective. In compliance with the reporting requirements in the German Commercial Code, sections 289 (5) and 315 (2)(5), the combined SAP SE and SAP Group management report contains full information about the principal features of the internal controls and risk management structure applying to SAP’s consolidated financial reporting.
EXECUTIVE BOARD AND SUPERVISORY BOARD SHAREHOLDINGSSection 6.3, sentence 2, in the Code recommends that all directors’ shareholdings be reported in the Corporate Governance Report, broken down by Executive Board and Super visory Board memberships if the entire holdings exceed 1% of the shares issued by the Company. In fulfillment of this recommendation, we refer to the Compensation Report in our Combined Management Report for 2014, which contains the recommended information.
19Corporate Governance Report

Professor Hasso Plattner Chairperson of the Supervisory Board of SAP SE
COOPERATION BETWEEN THE EXECUTIVE AND SUPERVISORY BOARDSWe discharged all of our duties as a Supervisory Board in accordance with the law and the Company’s Articles of Incorporation. We were consulted by the Executive Board throughout the year and kept the global management of the Company under observation and scrutiny for legal compliance, adherence to proper accounting principles, business focus, and reasonableness. We agreed the Company’s strategy with the Executive Board and regularly discussed the Company’s progress toward executing it with the Executive Board. We were directly involved when the Executive Board made any decision of fundamental importance to SAP.
Dear Shareholders,
We are pleased to report that 2014 was another good year for SAP and that the Company forged ahead even faster than expected with its transformation into THE cloud company powered by SAP HANA. This is all the more remarkable because the year was marked by political turmoil and economic challenges in some regions of the world.
The software industry is transitioning from traditional on-premise to cloud solutions. The Supervisory Board supports management’s strategy of positioning SAP in the vanguard of that transition. It has put SAP on the road to mastering today’s and tomorrow’s challenges and opportunities and to delivering more of the good results it achieved in 2014.
Report from the Supervisory Board
20 To Our Stakeholders

We received regular, full, and timely reports, both in writing and from Executive Board members in person. They kept us up to date on the Company’s strategy, plans, business performance, risks, risk management, compliance, and transactions of special significance for SAP. The Executive Board advised us when business deviated from plan or target, and why.
The content and scope of the Executive Board’s reports to us fully met our requirements for them. Whenever we asked for more information than was in the reports, the Executive Board provided it. In particular, the Executive Board came to Supervisory Board meetings for discussion and to answer our questions. We questioned and probed the Executive Board to satisfy ourselves that the information it gave us was plausible.
Section 11 (6) in the Articles of Incorporation lists certain transactions for which management must seek prior approval from the Supervisory Board. When SAP became an SE, the Supervisory Board established a list comprising these transactions and further categories of transactions for which the Executive Board must obtain the Supervisory Board’s consent, in accordance with the German SE Implementation Act, section 19. That list replaced the former list of transactions requiring consent pursuant to the German Stock Corporation Act, section 111 (4). The Supervisory Board carefully considered all transactions in the listed categories and discussed them with the Executive Board, focusing on the benefits, risks, and other effects of each transaction. The Supervisory Board agreed to all transactions for which its consent was sought by the Executive Board.
The Executive Board also kept the chairperson of the Supervisory Board fully informed between meetings of the Supervisory Board and its committees. In particular, the two co-CEOs, and subsequently the sole CEO, met regularly with the chairperson of the Supervisory Board to discuss SAP’s strategy, plans, the Company’s business performance, risks, risk management, compliance, and various other important matters and decisions. The two co-CEOs, and subsequently the sole CEO, informed the Supervisory Board chairperson, without delay, of important events that were significant for assessing SAP’s situation and progress or for the management of SAP.
SUPERVISORY BOARD MEETINGS AND RESOLUTIONSIn 2014, the Supervisory Board of SAP AG held two ordinary and five extraordinary meetings and the Supervisory Board of SAP SE held two ordinary meetings, one inaugural meeting, and two extraordinary meetings at which we deliberated and resolved on all matters of relevance to the Company. We also adopted four resolutions by correspondence vote. It is customary practice at our meetings that the Executive Board withdraws while we deliberate on items that pertain to the Executive Board or require discussion among Supervisory Board members only. We did so at all meetings in 2014 when such items arose. The Supervisory Board discussed the following matters:
CONVERSION OF SAP AG TO A EUROPEAN COMPANYAs in the previous year, we devoted much attention in our deliberations to the matter of converting SAP AG to a European Company (Societas Europaea, SE). It was the subject of three meetings at which members attended in person (“physical meetings”). We were in continuous and detailed consultation with the Executive Board concerning the progress of negotiations with the Special Negotiating Body and adopted resolutions as required in the course of our deliberations. In particular, the conversion was the focus of our ordinary meeting on February 13 and our extraordinary meeting on March 10. Subsequently, together with the Executive Board, we proposed to the Annual General Meeting of Shareholders that the Company be converted to an SE. That proposal was accepted, with 99% of the voted shares in favor. We are confident the SE form of incorporation is right for SAP’s pan-European and international business, and it has allowed us and the representatives of the Company’s European workforce to establish a tailored worker participation model that is set out in the Employee Involvement Agreement.
21Report from the Supervisory Board

APPOINTMENTS AND RETIREMENTSWe had to make several decisions concerning the composition of seats on the Executive Board and we approved appointments to the Global Managing Board in 2014. After Vishal Sikka left the Executive Board, we held extraordinary meetings on May 4 and May 13. At our May 4 meeting, we appointed Robert Enslin and Bernd Leukert to the Executive Board and confirmed the appointment of Ingrid-Helen Arnold and Stefan Ries to the Global Managing Board. We approved the board appointment contracts and compensation for the new Executive Board members and the terms of the board contract termination agreement with Vishal Sikka at our extraordinary meeting on May 21, as recommended by the General and Compensation Committee.
Other matters addressed at meetings in 2014 included:
Meeting in FebruaryAt our meeting on February 13, the Executive Board presented a review of the Company’s business in 2013 and reported on its market standing and other matters. We discussed strategy and execution with the Executive Board. In particular, the Executive Board explained its strategy in the various product fields and its planned simplification measures, which it had defined as core objectives for 2014. Based on its operational plan for 2014, which the Executive Board presented in detail, we discussed in-depth the 2014 budget presented by the Executive Board, including the 2014 capital expenditure budget and liquidity plan, and gave our approval.
We also received and discussed the recommendation of the General and Compensation Committee concerning Executive Board compensation for 2013. Exercising our discretionary powers under the terms of the STI Plan 2013, we determined performance against the defined targets and decided the payouts for Executive Board members. We discussed performance against the annual financial targets for the Medium-Term Incentive (MTI) Plan 2011 and determined the MTI 2011 plan payout. We determined performance for the purposes of the 2013 tranche of the RSU Milestone Plan 2015. We applied a provision in the plan terms to eliminate significant currency effects in 2013. We then turned our attention to Executive Board compensation for 2014. We identified the key performance indicators (KPIs) and set the target numbers for each KPI in the 2014 STI plan and their relative weightings. Conscious of
The conversion became legally effective when SAP SE was entered in the commercial register at the Mannheim Municipal Court in Germany on July 7, 2014, at which time the term of office of the Supervisory Board of SAP AG ended.
ACQUISITIONS IN 2014The Finance and Investment Committee and the Supervisory Board received reports on each relevant acquisition requiring approval during the year and approved each of the transactions that were subject to their consent. The Company’s two most significant acquisitions in 2014 were Fieldglass, Inc. and Concur Technologies, Inc., the latter being the largest in SAP’s history. At our ordinary meeting in March, we explored the proposal to acquire Fieldglass; then, at an extraordinary meeting on March 25, we considered the proposal in-depth. The Executive Board explained to us all aspects of the acquisition, which we discussed exhaustively. We accepted the recommendation of the Finance and Investment Committee to proceed and its associated recommendation for financing the purchase price. At our extraordinary meeting on September 18, in the course of the envisaged acquisition of Concur, the Executive Board reported to us the rationale for that acquisition in detail, the opportunities and risks it presented, and the proposed terms for which it would be made. We discussed all important aspects of the transaction and then accepted the recommendation of the Finance and Investment Committee to acquire Concur and its recommendation concerning the financing. By correspondence vote in October, we approved the Executive Board’s proposed method of refinancing the purchase price loan. In light of these two acquisitions, we made technical amendments to the 2014 and 2015 performance targets in the Long-Term Incentive (LTI) Plan 2015 and to the performance targets in the Short-Term Incentive (STI) Plan 2015, in accordance with the plan terms. The amendments were necessary to eliminate nonrecurring effects of the Fieldglass and Concur acquisitions on the compensation of Executive Board members.
22 To Our Stakeholders

the growing impetus toward becoming a cloud company and wishing to reinforce it in the incentives for Executive Board members, we amended the performance targets for the 2014 and 2015 tranches of the Restricted Share Units (RSU) Milestone Plan 2015 and fixed their exchange rates to forestall any need for currency effect adjustments in the future. We adopted a resolution on Executive Board members’ individual allocation of rights under the RSU Milestone Plan 2015 (2014 tranche). Finally, we assessed the appropriateness of the Executive Board members’ compensation for 2014, and in each case found it to be appropriate in terms of amount, structure, objective criteria, and for each member’s responsibilities and tasks.
Meeting in March to Discuss the Financial StatementsAt our March 20 meeting, we considered the 2013 SAP AG financial statements and consolidated financial statements, the audits conducted by KPMG AG Wirtschaftsprüfungsgesellschaft (KPMG), and the Executive Board’s proposed resolution on the appropriation of SAP AG’s retained earnings for 2013. The Audit Committee reported on all matters for which it is responsible in connection with the 2013 financial statements, particularly on the form and scope of its examination of the documents relating to the financial statements, and recommended that we approve them. The auditor attended the meeting. The auditor reported in detail on the audit and on the results, referring in particular to the six audit focuses that had been agreed between the auditor and the Audit Committee. The auditor also gave us its account of the discussions that had taken place on those matters at the two preceding meetings of the Audit Committee. The auditor discussed the results of the audit with us and answered our questions, and we approved the audit. There were no findings from our own final examination of the 2013 SAP AG financial statements and consolidated financial statements, and we approved them. We examined the Executive Board’s proposal on the appropriation of retained earnings and endorsed it, as recommended by the Audit Committee. We decided on the resolutions we would propose for the agenda of the Annual General Meeting of Shareholders in May 2014. Among them was our recommendation to the shareholders concerning the auditor to elect for 2014; our recommendation followed that of the Audit Committee to us.
At our financial statements meeting, the Executive Board presented its forecast for the first quarter of 2014. The General and Compensation Committee, the Technology and Strategy Committee, the Finance and Investment Committee, the Nomination Committee, and the People and Organization Committee reported to us on all their recent meetings.
SAP SE Supervisory Board Inaugural Meeting in MayWe held our inaugural meeting as the first Supervisory Board of SAP SE on May 21, 2014, after the Annual General Meeting of Shareholders. We elected Hasso Plattner to be our chairperson and Christiane Kuntz-Mayr to be our deputy chairperson. We appointed Bill McDermott, Robert Enslin, Bernd Leukert, Luka Mucic, and Gerhard Oswald to the first Executive Board of SAP SE and set their term of office. We filed our written report on the formation audit conducted in connection with the conversion of SAP to an SE. Other items included adopting the Supervisory Board of SAP SE rules of procedure and its list of the categories of transactions for which the Executive Board must obtain the Supervisory Board’s consent in accordance with the German SE Implementation Act, section 19, setting up the Supervisory Board committees of SAP SE, and electing members to those committees. The Supervisory Board of SAP AG subsisted alongside the Supervisory Board of SAP SE until the former board’s term of office expired, which was when the conversion became legally effective.
Meeting in JulyWe held our first ordinary meeting as the Supervisory Board of SAP SE on July 10. The first item was to approve the nomination of an Executive Board member to be responsible for labor and social affairs. The Executive Board had resolved that Bill McDermott should take on that duty, and we approved its decision.
23Report from the Supervisory Board

The General and Compensation Committee, the Technology and Strategy Committee, and the Finance and Investment Committee reported on their recent meetings.
Work of the Supervisory Board CommitteesThe committees made a key contribution to the work of the Supervisory Board and reported to us on their work. The following committees were in place in 2014 until the Company became SAP SE:− General and Compensation Committee: Hasso Plattner
(chairperson), Panagiotis Bissiritsas, Wilhelm Haarmann, Lars Lamadé, Bernard Liautaud, Margret Klein-Magar
− Audit Committee: Erhard Schipporeit (chairperson), Stefan Schulz, Inga Wiele, Klaus Wucherer
− Finance and Investment Committee: Wilhelm Haarmann (chairperson), Panagiotis Bissiritsas, Hartmut Mehdorn, Kurt Reiner
− Technology and Strategy Committee: Hasso Plattner (chairperson), Stefan Schulz (deputy chairperson), Pekka Ala-Pietilä, Anja Feldmann, Margret Klein-Magar Christiane Kuntz-Mayr, Bernard Liautaud, Kurt Reiner, Inga Wiele, Klaus Wucherer
− People and Organization Committee: Hasso Plattner (chairperson), Anja Feldmann, Wilhelm Haarmann, Christiane Kuntz-Mayr, Lars Lamadé, Hartmut Mehdorn, Mario Rosa-Bian, Stefan Schulz
− Mediation Committee: Hasso Plattner (chairperson), Christiane Kuntz-Mayr, Hartmut Mehdorn, Mario Rosa-Bian
− Nomination Committee: Hasso Plattner (chairperson), Pekka Ala-Pietilä, Bernard Liautaud
− Special Committee: Hasso Plattner (chairperson), Pekka Ala-Pietilä, Wilhelm Haarmann, Margret Klein-Magar, Lars Lamadé, Erhard Schipporeit
The Executive Board then reported to us on business in the second quarter of 2014, its assessment of the first half-year as a whole, and various initiatives forming part of the Company’s Run Simple operating principle. Members of the Executive Board told us about second-quarter growth in cloud and about SAP’s competitive situation. We discussed various strategies with Executive Board and Global Managing Board members for achieving the Company’s objectives and we questioned management about progress on technology development related to SAP HANA. We also considered and approved the terms of the directors’ and officers’ liability insurance policies, which come up for renewal every year.
Meeting in OctoberOur ordinary meeting on October 9 opened with a report from the Executive Board on the state of the business and the preliminary third-quarter results and a discussion of strategic moves planned in light of the changing business.
In agreement with the Executive Board, we then adopted for publication, as every year in October, the annual declaration of implementation of the German Corporate Governance Code (the “Code” in this report) pursuant to the German Stock Corporation Act, section 161. The General and Compensation Committee reported that it had met immediately before our Supervisory Board meeting to verify compliance with the declaration of implementation of the Code. We determined that we have a sufficient number of independent members on the Supervisory Board. Some Supervisory Board members currently have business dealings with SAP or hold a senior position or material equity in companies that currently have business dealings with SAP, or have done so in the course of the year. SAP’s business dealings with these persons or companies are or were at arm’s length. In our view, especially given the limited scope and materiality of those dealings, they do not affect the independence of the Supervisory Board members concerned and do not give rise to any substantial and not merely temporary conflict of interest in the meaning the Code. Responses to the questionnaire designed to evaluate the work of the Supervisory Board had been analyzed and related efficiency measures agreed in October 2013. We now considered the progress of those measures and noted consequent measures.
24 To Our Stakeholders

As the Supervisory Board of SAP SE, we reconstituted the committees at the time of conversion as follows:− General and Compensation Committee: Hasso Plattner
(chairperson), Panagiotis Bissiritsas, Wilhelm Haarmann, Jim Hagemann Snabe, Lars Lamadé, Bernard Liautaud, Margret Klein-Magar, Christiane Kuntz-Mayr
− Audit Committee: Erhard Schipporeit (chairperson), Steffen Leskovar, Stefan Schulz, Klaus Wucherer
− Finance and Investment Committee: Wilhelm Haarmann (chairperson), Panagiotis Bissiritsas, Hartmut Mehdorn, Kurt Reiner, Mario Rosa-Bian, Jim Hagemann Snabe
− Technology and Strategy Committee: Hasso Plattner (chairperson), Stefan Schulz (deputy chairperson), Pekka Ala-Pietilä, Anja Feldmann, Steffen Leskovar, Bernard Liautaud, Margret Klein-Magar, Kurt Reiner
− People and Organization Committee: Hasso Plattner (chairperson), Catherine Bordelon, Anja Feldmann, Wilhelm Haarmann, Christiane Kuntz-Mayr, Lars Lamadé, Hartmut Mehdorn, Mario Rosa-Bian
− Nomination Committee: Hasso Plattner (chairperson), Pekka Ala-Pietilä, Bernard Liautaud
− Special Committee: Hasso Plattner (chairperson), Pekka Ala-Pietilä, Wilhelm Haarmann, Margret Klein-Magar, Lars Lamadé, Erhard Schipporeit
Each of the committees was active in 2014 except the Mediation Committee; a European Company does not require a mediation committee.
For more information about the Supervisory Board committees and their duties, see SAP's Corporate Governance Statement pursuant to the German Commercial Code, section 289a, published on the SAP public Web site at: http://www.sap.com/corporate-en/about/investors/governance/index.html.
In 2014, the committees (before July 7, 2014, the committees of the Supervisory Board of SAP AG; after that date, the committees of the Supervisory Board of SAP SE) discussed the following matters:
− The General and Compensation Committee held six regular meetings, and, outside these meetings, it adopted four resolutions by correspondence. It prepared the Supervisory Board’s resolutions on compensation of the Executive Board and Global Managing Board members. It considered the
report from the capital market compliance officer, which it receives early each year, and it deliberated on the conversion of SAP AG to an SE. When it met in March, the Committee received a report from the corporate governance officer. At its July meeting, it adopted new rules of procedure as a reconstituted committee of the Supervisory Board of SAP SE. When the Committee met in September, the Executive Board reported to it on the tasks and membership of the Global Managing Board in the future. The Committee also considered and recommended resolutions for the Supervisory Board concerning amendments, described above, to the Executive Board members’ compensation packages. At its October meeting, the Committee discussed the Company’s implementation of the Code recommendations and prepared the Supervisory Board’s decisions with respect to the declaration of implementation of the Code and ascertaining the independence of Supervisory Board members.
− The Finance and Investment Committee held four meetings, one of which was a joint meeting with the Technology and Strategy Committee. Outside these meetings it adopted one resolution by correspondence. At its March 10 meeting, management presented outline information about the possible acquisition of Fieldglass, which was under consideration at the time and the Committee received a progress report on the Company’s application for a published credit rating. The Committee discussed the standards for listed-company supervisory board due diligence relating to acquisitions and acquisition financing. The Fieldglass acquisition was also the focus of the Committee’s March 25 meeting. The Executive Board presented full details of the planned purchase, and after an exhaustive examination the Committee decided to recommend to the Supervisory Board that it consent to the acquisition. When it met on September 16, the Committee focused solely on the acquisition of Concur. It received a detailed report from the Executive Board about the strategic backdrop, then thoroughly examined and discussed the proposal within the Committee and made a recommendation
25Report from the Supervisory Board

conclusion that the compliance system was effective. The meeting also deliberated on the Company’s insurance strategy and other risk management matters. The auditor attended all physical meetings and telephone conference meetings of the Audit Committee and reported in depth on its audit work and on its quarterly reviews of selected software agreements.
− The Technology and Strategy Committee held three meetings, one of which was a joint meeting with the Finance and Investment Committee. It discussed the key trends in the software industry for the years to come and SAP’s corporate and product strategies. At the Committee’s March 13 meeting, the Executive Board presented the five most strategic issues and objectives for 2014, which included cloud products for human capital management, the new direction for customer relationship management, and user interface design for SAP Fiori. The Executive Board reported to the Committee on SAP HANA Enterprise Cloud and SAP Business Suite in the cloud. The Committee discussed the Company’s product range on July 9. At that meeting, it considered investment and plans for the future in the various product categories. It was given an overview of security design for SAP’s cloud applications. It also discussed product plans in analytics. As reported in the Finance and Investment Committee section above, the Technology and Strategy Committee held a joint meeting with the Finance and Investment Committee on October 8. For more information, see the Finance and Investment Committee section in this Report from the Supervisory Board.
to the Supervisory Board to approve the Concur acquisition. On October 8, the Finance and Investment Committee held a joint meeting with the Technology and Strategy Committee. Matters discussed together included the competitive environment in which SAP operates, an analysis of the major acquisitions in the past three years, acquisition strategy, execution of the cloud platform strategy, and an overview of developments in the field of analytics. By correspondence vote on October 24, the Finance and Investment Committee resolved to make a recommendation to the Supervisory Board about refinancing the purchase price credit for the Concur acquisition.
− The Audit Committee held four meetings at which members attended in person (“physical meetings”) and four telephone conference meetings. The telephone conference meetings were all ahead of the publication of interim reports for each quarter. At these meetings, the Committee primarily deliberated on the course of business over the quarter concerned, the process by which the quarterly financial reports were prepared, the interim report to be published, and insights gained from the auditor’s quarterly review of selected software agreements. The physical meetings in February and March concentrated on the SAP AG and consolidated financial reports for 2013 and the reporting process, the internal controls for financial reporting, the most important accounting methods, and the audit. At the February meeting, the Committee also discussed the German Financial Reporting Enforcement Panel’s criteria and the internal audit service’s report for the previous year, organization and processes, and audit plan for 2014. At its meeting in March, the Committee did preparatory work on the Supervisory Board’s recommendations to the Annual General Meeting of Shareholders concerning the election of an auditor and the appropriation of retained earnings and discussed the Company’s compliance system. When it met in July, the Committee defined the focus and agreed the fees for the audit with the auditor, dealt with the internal audit service’s work in the first half of the year, and discussed the Company’s internal controls. At its October meeting, the Committee discussed the report from the chief compliance officer and other compliance system matters and came to the
26 To Our Stakeholders

− The Nomination Committee, whose members are all shareholder representatives, held two meetings in 2014. In February, it met to discuss the composition of the Supervisory Board in the future, when SAP AG had been converted to SAP SE. On March 13, it prepared our selection of recommended candidates for the shareholder seats on the Supervisory Board of SAP SE, to be put to the Annual General Meeting of Shareholders, and discussed potential candidates for the Supervisory Board.
− In the past the Special Committee had been tasked with coordinating and managing the Supervisory Board’s outside legal counsel concerned with the investigation and analysis of the facts in connection with the TomorrowNow litigation. We redefined the Committee’s task when, as the Supervisory Board of SAP SE, we reconstituted our committees: It is now tasked with addressing exceptional situations that entail substantial risk, such as major lawsuits. It met only once in 2014, in October, on which occasion it received a report from our retained counsel about the current state of the TomorrowNow litigation.
− The People and Organization Committee held three meetings. In January, it considered the results of the 2013 employee survey, and the Executive Board presented the actions and measures that would be taken in light of those results. In September, the Committee discussed learning and professional development, the approach to learning that SAP was adopting for the future, the deployment of innovative learning methods, and the implementation of people-related projects. On December 16, the Committee met to discuss the Company’s HR strategy and aims for 2014 to 2017. It received progress reports from management on leadership, people sustainability, learning at SAP, and talent recruitment.
Because our committees reported fully to us at all times, the Supervisory Board had all of the information it needed about all of the matters in the ambit of each committee’s allocated work, so we were always able to deliberate on those matters in detail on a well-informed footing.
CORPORATE GOVERNANCEThe corporate governance officer of SAP monitored the Company’s compliance with all recommendations in the German Corporate Governance Code that, in its declaration of implementation of the Code, SAP claims to follow and reported in full to our General and Compensation Committee. Members of the Executive Board and of the Supervisory Board had no conflicts of interest that were required to be disclosed to the Supervisory Board pursuant to sections 4.3.4 and 5.5.2 of the Code. One of our members is a partner in a firm of attorneys that the Company retained for advice; we consented to the engagement of that firm and approved an account for expenses relating to advice that we had authorized from that firm. The member concerned did not take part in the deliberations on these matters or the vote on the related resolution. There were several transactions in 2013 between the Company and a member of the Executive Board; they were consistent with industry standards and were not material. They were approved by the General and Compensation Committee. The Company made no other contracts with members of the Executive Board or Supervisory Board that would have required a resolution of the Supervisory Board.
For more information about Code compliance, see the Executive and Supervisory Boards’ corporate governance report, which is included in this annual report. We closely examined the Executive Board’s corporate governance statement pursuant to the German Commercial Code, section 289a, and we approved the statement with the combined SAP Group and SAP AG management report.
SAP SE AND CONSOLIDATED FINANCIAL REPORTS FOR 2014KPMG audited the SAP SE and consolidated financial reports for 2014. The Annual General Meeting of Shareholders elected KPMG as the SAP SE and SAP Group auditor on May 21, 2014, in accordance with our proposal to that meeting, which in turn, reflected the recommendation of the Audit Committee. Before proposing KPMG to the Annual General Meeting of
27Report from the Supervisory Board

At the meeting of the Audit Committee on March 18, 2015, and at the meeting of the Supervisory Board on March 19, 2015, the Executive Board explained the financial statements and management report of SAP SE and the Group and its proposal concerning the appropriation of retained earnings. Members of the Executive Board answered questions from the Audit Committee and the Supervisory Board. At the Audit Committee meeting, they also explained the SAP Annual Report on Form 20-F.
After the Executive Board had explained them, the Audit Committee and the Supervisory Board reviewed the financial statements and reports in the light of KPMG’s audit reports. The representatives of the auditor who attended presented full reports on the audit and the results of the audit to the Audit Committee and Supervisory Board meetings and explained the audit report. The auditor also reported that it had not found any material weaknesses in the Company’s internal control and risk-management systems for financial reporting. Both the Audit Committee and the Supervisory Board asked detailed questions about the form, scope, and results of the audit. The Audit Committee reported to us on its own review of the financial statements and management report of SAP SE and the Group, its discussions with the Executive Board and with the auditor, and its supervision of the financial reporting process. It confirmed that as part of its supervisory work, it had addressed the effectiveness of the SAP Group internal control, risk management, and internal auditing systems and found them to be effective.
The Committee reported that KPMG had told it no circumstances had arisen during the audit that might give cause for concern about KPMG’s impartiality and had listed the services it had provided that were not part of the audit. The Committee reported to us that it had examined the auditor’s independence, taking the non-audit services it had rendered into consideration, and stated that, in the Committee’s opinion, the auditor possessed the required degree of independence.
Shareholders as auditor for the year, our chairperson and the Audit Committee obtained confirmation from KPMG that circumstances did not exist that might prejudice or raise any doubt concerning its independence as the Company’s auditor. In that connection, KPMG informed us of the volume of other services it provided to the Group in the past year and had been engaged to provide in the year to come. The Supervisory Board has agreed with KPMG that the auditor should report to us and record in the auditor’s report any fact found during the audit that is inconsistent with the declaration given by the Executive Board and us concerning implementation of the German Corporate Governance Code. KPMG examined the SAP SE financial statements prepared in accordance with the German Commercial Code, the consolidated financial statements prepared in accordance with International Financial Reporting Standards (IFRS) as required by the German Commercial Code, section 315a, and the combined SAP Group and SAP SE management report, and certified them without qualification. The auditor thus confirmed that, in its opinion and based on its audit in accordance with the applicable accounting principles, the SAP SE and consolidated financial statements give a true and fair view of the net assets, financial position, and results of operations of SAP SE and the SAP Group. The auditor also confirmed that the combined SAP Group and SAP SE management report is consistent with the corresponding financial statements and as a whole gives a true and fair view of the position of SAP SE and the SAP Group and of foreseeable opportunities and risks. KPMG audited the Company’s system of internal controls over financial reporting and certified without qualification that it complies with the applicable U.S. standards. The auditor states in its opinion that it considers SAP’s internal controls over financial reporting to be effective in all material respects. All Audit Committee and Supervisory Board members received the documents concerning the financial statements mentioned above, the audit reports prepared by KPMG, and the Executive Board’s proposal concerning the appropriation of retained earnings in good time.
On February 12, 2015, the Executive Board finalized the financial reports of SAP SE and the Group for 2014, comprising the SAP SE financial statements, the consolidated financial statements, and the combined management report, for submission to us forthwith.
28 To Our Stakeholders

The Audit Committee and the Supervisory Board satisfied themselves that KPMG had conducted the audit properly. In particular, we concluded that both the audit reports and the audit itself fulfilled the legal requirements. On the basis of the Audit Committee’s report and recommendation, we approved the audit and, since there were no findings from our own examination, we gave our consent to the SAP SE financial statements, the consolidated financial statements, and the combined management report (including the Executive Board’s corporate governance statement pursuant to the German Commercial Code, section 289a). The financial statements and combined management report were thus formally adopted. Our assessment of the situation and operations of the Company and the Group coincides with that of the Executive Board as set out in the combined management report. We considered the proposal presented by the Executive Board concerning the appropriation of retained earnings. We had regard to the requirements of dividends policy, the effects on the liquidity of the Group, and the interests of the shareholders. We also discussed these matters with the auditor. We then accepted and adopted the recommendation of the Audit Committee concerning the appropriation of retained earnings. Finally, we approved this present report.
CHANGES ON THE SUPERVISORY AND EXECUTIVE BOARDS We appointed Bernd Leukert and Robert Enslin to the Executive Board of SAP AG with effect from May 4, 2014. Vishal Sikka’s service on the Executive Board ended on May 4, 2014. Jim Hagemann Snabe’s service on the SAP AG Executive Board ended at the conclusion of the Annual General Meeting of Shareholders on May 21, 2014. Werner Brandt’s service on the Executive Board of SAP AG ended on June 30, 2014. His successor, Luka Mucic, took office on July 1, 2014. All other serving members of the Executive Board of SAP AG were appointed to the Executive Board of SAP SE as part of the process of converting SAP AG to an SE.
The Annual General Meeting of Shareholders of SAP AG elected Hasso Plattner, Pekka Ala-Pietilä, Anja Feldmann, Wilhelm Haarmann, Jim Hagemann Snabe, Bernard Liautaud, Hartmut Mehdorn, Erhard Schipporeit, and Klaus Wucherer as the shareholder representatives on the first Supervisory Board of SAP SE on May 21, 2014. The employee representatives Panagiotis Bissiritsas, Catherine Bordelon, Margret Klein-Magar, Christiane Kuntz-Mayr, Lars Lamadé, Steffen Leskovar, Kurt Reiner, Mario Rosa-Bian, and Stefan Schulz were appointed to the Supervisory Board of SAP SE for a term ending at the conclusion of the 2015 Annual General Meeting of Shareholders, in accordance with the Employee Involvement Agreement. The number of seats on the Supervisory Board thus increased from 16 to 18.
The Supervisory Board thanks the Executive Board and Global Managing Board, the managing directors of the Group companies, and all of the employees for their hard work and dedication in 2014. We would also like to thank our customers and partners. Without them, our Company’s success would not be possible.
For the Supervisory Board
Professor Hasso Plattner(Chairperson)
29Report from the Supervisory Board

Compensation Report 1)
COMPENSATION FOR EXECUTIVE AND SUPERVISORY BOARD MEMBERSThis compensation report outlines the criteria that we applied for the year 2014 to determine compensation for Executive Board and Supervisory Board members, discloses the amount of compensation paid, and describes the compensation systems. It also contains information about share-based payment plans for Executive Board members, shares held by Executive Board and Supervisory Board members, and the directors’ dealings required to be disclosed in accordance with the German Securities Trading Act.
COMPENSATION FOR EXECUTIVE BOARD MEMBERS
Compensation System for 2014The compensation for 2014 for Executive Board members is intended to reflect SAP’s size and global presence as well as our economic and financial standing. The compensation level is internationally competitive to reward committed, successful work in a dynamic business environment.
The Executive Board compensation package is performance-based. It has three elements: – A fixed annual salary element– A variable short-term incentive (STI) element to reward
performance in the plan year– A variable long-term incentive (LTI) element tied to the price
of SAP shares to reward performance over multiple years
The Supervisory Board set a compensation target for the sum of the fixed and the variable elements. It reviews, and if appropriate, revises, this compensation target every year. The review takes into account SAP’s business performance and the compensation paid to board members at comparable companies on the international stage. The amount of variable compensation depends on SAP’s performance against performance targets that the Supervisory Board sets for each plan year. The performance targets are key performance indicator (KPI) values aligned to the SAP budget for the plan year.
The following criteria apply to the elements of Executive Board compensation for 2014:– The fixed annual salary element is paid as a monthly salary.– The variable STI element was determined under the STI 2014
plan. Under this plan, the STI compensation depends on the SAP Group’s performance against the predefined target values for three KPIs: non-IFRS constant currency software and software-related services growth, non-IFRS constant currency operating margin increase, and non-IFRS constant currency new and upsell bookings. In addition, the STI 2014 plan provides for a discretionary element that allows the Supervisory Board, after the end of the fiscal year 2014, to address not only an Executive Board member’s individual performance, but also SAP’s performance in terms of market position, innovative power, customer satisfaction, employee satisfaction, and attractiveness as an employer. Moreover, if there has been any extraordinary and unforeseeable event the Supervisory Board can, at its reasonable discretion, retroactively adjust payouts up or down in the interest of SAP. On February 12, 2015, the Supervisory Board assessed SAP’s performance against the agreed targets and determined the amount of compensation payable under the STI 2014 plan. The STI 2014 plan pays out after the Annual General Meeting of Shareholders in May 2015.
– The variable LTI element was determined under the RSU Milestone Plan 2015. “RSU” stands for “restricted share unit.” This originally four-year plan was established in 2012 and focuses on the SAP share price and on certain objectives derived from our Company strategy for the years through 2015. For each of the four years, the members of the Executive Board are allocated a certain number of RSUs for the respective year based on a budget amount that was granted to each Executive Board member in 2012 already for each of the years 2012 through 2015. The number of RSUs allocated to each member for a given year is his or her target amount (an amount in euros) for that year divided by the SAP share price over a reference period (defined in the RSU Milestone Plan 2015 terms) at the beginning of the respective year.
1) This compensation report is part of the audited management report.
30 To Our Stakeholders

actually receives for that year is revised. In circumstances where the targets for the individual years 2012 to 2014 were not achieved but the 2015 targets are achieved, the outcome of this revision would be that a member would receive as many vested RSUs for 2015 as would make up for any that he or she did not receive in the earlier years by reason of failure to achieve targets. On the other hand, if the Company underachieves against the 2015 objectives, Executive Board members may, in a worst-case scenario, lose all of the vested RSUs allocated to them for 2015.All vested RSUs are subject to a three-year holding period. The holding period commences at the end of the year for which the RSUs were allocated. The amount an RSU eventually pays out depends on the SAP share price at the end of the holding period. A member who leaves the Executive Board before the end of the plan retains his or her vested RSUs for completed plan years but does not retain any allocated but unvested RSUs for the year during which he or she leaves. If a member leaves the Executive Board before the beginning of the subsequent year, no RSUs are finally allocated.Each vested RSU entitles its holder to a (gross) payout corresponding to the price of one SAP share after the end of the three-year holding period. The applicable share price is measured over a reference period defined in the RSU Milestone Plan 2015 terms.For the terms and details of the RSU Milestone Plan 2015, see the Notes to Consolidated Financial Statements section, Note (28). The number of RSUs initially issued to each member of the Executive Board under the RSU Milestone Plan 2015 for 2014 was decided by the Supervisory Board on February 13, 2014. The number of RSUs finally allocated to each member of the Executive Board under the RSU Milestone Plan 2015 for 2014 was decided by the Supervisory Board on February 12, 2015.
The contracts of Executive Board members Bill McDermott and Robert Enslin require that compensation payments are made in U.S. dollars. The contracts include clauses that determine the exchange rates for the translation of euro-denominated compensation into U.S. dollars.
The number of RSUs an Executive Board member actually earns in respect of a given year depends on the Company performance against the objectives for that year (a year is a “performance period” in the plan). The objectives derive from SAP’s strategy for the period to 2015. The plan objectives relate to two KPIs: non-IFRS total revenue and non-IFRS operating profit. The KPI targets have already been set for the entire life of the RSU Milestone Plan 2015 for the years 2012 to 2015. The original terms and conditions of the plan only allowed discretion to adjust those KPIs for predefined extraordinary events. In December 2014, the Supervisory Board adjusted the terms and conditions of the plan to allow more discretion to adjust the KPIs and/or the minimum performance levels embedded in the plan. The plan amendment may only be exercised to preserve the fair and equitable nature of the plan in consideration of business developments that were not foreseeable when the LTI was implemented in 2012. In February 2014, the Supervisory Board modified the RSU Milestone Plan 2015 prospectively for 2014 and 2015 by eliminating the effects of exchange rate fluctuation on the underlying KPI targets. In February 2015, the Supervisory Board modified the RSU Milestone Plan 2015 and reduced the minimum performance level of the financial KPIs defined in the plan from 80% to 60%. In addition, the Supervisory Board also resolved to set new target values for those two financial KPIs for 2015 regarding this plan. After the end of each fiscal year, the Supervisory Board assesses the Company’s performance against the objectives set for that year and determines the number of RSUs to be finally allocated to (and which then vest in) each Executive Board member. No RSUs vest if minimum performance levels predefined for each of the two KPIs are not achieved. There is also a cap: Normally, the quantity of vested RSUs a member can attain in respect of a plan year is capped at 150% of his or her initial RSU allocation for that year.The Company strategy underlying the RSU Milestone Plan 2015 focuses on where SAP aims to be by the end of 2015, so the plan gives greater weight to performance against the KPI targets for 2015 (the final year of the plan) than against the targets for 2012 through 2014. After the end of 2015, the number of vested RSUs a member of the Executive Board
31Compensation Report
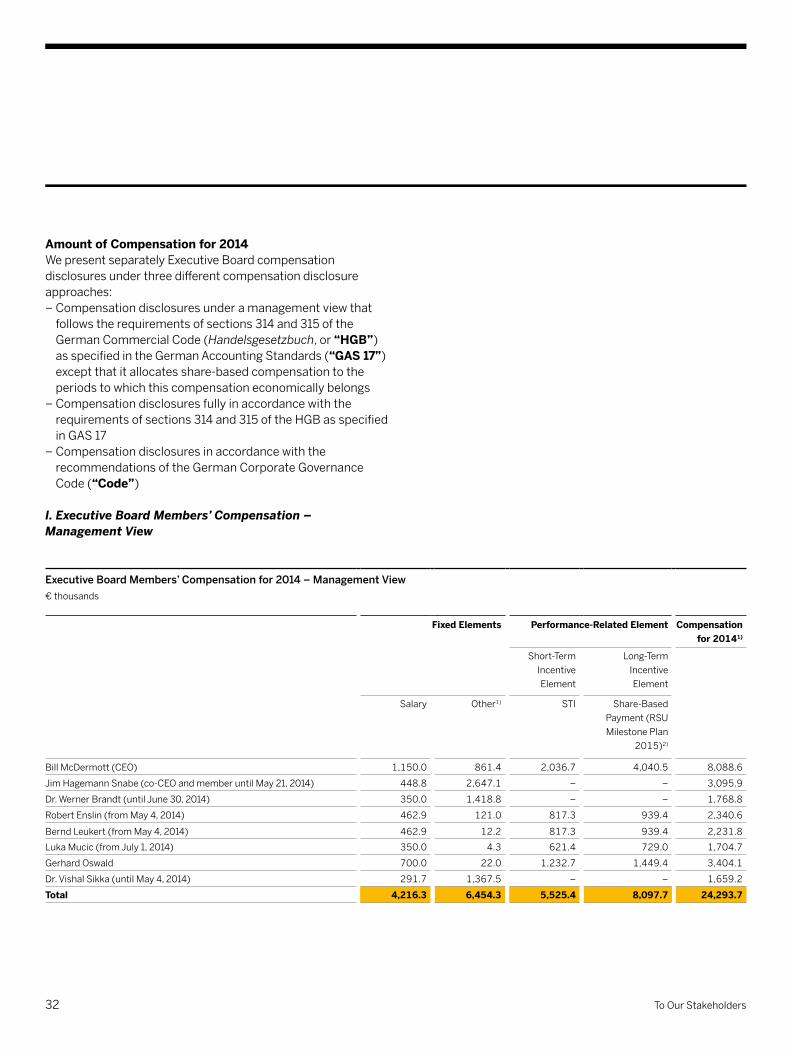
Amount of Compensation for 2014We present separately Executive Board compensation disclosures under three different compensation disclosure approaches:– Compensation disclosures under a management view that
follows the requirements of sections 314 and 315 of the German Commercial Code (Handelsgesetzbuch, or “HGB”) as specified in the German Accounting Standards (“GAS 17”) except that it allocates share-based compensation to the periods to which this compensation economically belongs
– Compensation disclosures fully in accordance with the requirements of sections 314 and 315 of the HGB as specified in GAS 17
– Compensation disclosures in accordance with the recommendations of the German Corporate Governance Code (“Code”)
I. Executive Board Members’ Compensation – Management View
Executive Board Members’ Compensation for 2014 – Management View€ thousands
Fixed Elements Performance-Related Element Compensation for 20141)
Short-Term Incentive Element
Long-Term Incentive Element
Salary Other1) STI Share-Based Payment (RSU Milestone Plan
2015)2)
Bill McDermott (CEO) 1,150.0 861.4 2,036.7 4,040.5 8,088.6
Jim Hagemann Snabe (co-CEO and member until May 21, 2014) 448.8 2,647.1 – – 3,095.9
Dr. Werner Brandt (until June 30, 2014) 350.0 1,418.8 – – 1,768.8
Robert Enslin (from May 4, 2014) 462.9 121.0 817.3 939.4 2,340.6
Bernd Leukert (from May 4, 2014) 462.9 12.2 817.3 939.4 2,231.8
Luka Mucic (from July 1, 2014) 350.0 4.3 621.4 729.0 1,704.7
Gerhard Oswald 700.0 22.0 1,232.7 1,449.4 3,404.1
Dr. Vishal Sikka (until May 4, 2014) 291.7 1,367.5 – – 1,659.2
Total 4,216.3 6,454.3 5,525.4 8,097.7 24,293.7
32 To Our Stakeholders

disclosures above comply with the sections 314 and 315 of HGB as specified in GAS 17.
Jim Hagemann Snabe resigned from the Executive Board with effect from May 21, 2014 (Annual General Meeting of Shareholders). To replace the payout for the RSUs granted to him in 2012 under the RSU Milestone Plan he was paid €6,485,800. Of that amount, the grant value at time of grant amounting to €4,318,400 was already included in his 2012 compensation. The remaining €2,167,400 was included in his 2013 compensation (see below) as it was granted to him in 2013. The RSUs granted to Mr. Snabe in 2013 were converted into a fixed payment of €3,768,300 which was included in 2013 compensation. To compensate for his 2014 RSUs, Mr. Snabe received a prorated payment of €1,700,000 in respect of the period he served in 2014 which is included in 2014 compensation. Both amounts were paid out after the close of the Annual General Meeting of Shareholders in May 2014.
In 2012, the Executive Board members acting at that time already received all grants for the years 2012 to 2015 under the RSU Milestone Plan 2015. The Executive Board members appointed in 2014 received respective grants for the years 2014 and 2015 after their appointment. These grants, which are dependent on recipients’ uninterrupted tenure as Executive Board members in the respective years, are tied to the respective years and thus – from an economic perspective – represent compensation for the Executive Board members in the respective years. Accordingly, the share-based payment amounts in the tables above include in the 2014 and 2013 compensation the grants under the RSU Milestone Plan 2015 for the years 2014 and 2013 respectively although they were already granted in 2012. For the Executive Board members appointed in 2014, the 2014 compensation includes the RSU Milestone Plan 2015 awards granted for 2014 but excludes the awards granted in 2014 for 2015. Except for this allocation of share-based compensation awards to the fiscal years, the
Executive Board Members’ Compensation for 2013 – Management View€ thousands
Fixed Elements Performance-Related Element Compensation for 20131)
Short-Term and Medium-Term Incentive
Elements
Long-Term Incentive Element
Salary Other1) STI MTI 2011 Share-Based Payment (RSU Milestone Plan
2015)2)
Bill McDermott (co-CEO) 1,150.0 1,570.5 1,737.2 1,011.1 4,143.5 9,612.3
Jim Hagemann Snabe (co-CEO) 1,150.0 6,082.9 1,737.2 1,011.1 – 9,981.2
Dr. Werner Brandt 700.0 29.0 1,051.5 611.0 1,486.4 3,877.9
Lars Dalgaard (until May 31, 2013)3) 291.7 203.3 469.1 – – 964.1
Luisa Deplazes Delgado (until June 30, 2013)3) 350.0 26.1 421.0 – – 797.1
Gerhard Oswald 700.0 17.0 1,051.5 611.0 1,486.4 3,865.9
Dr. Vishal Sikka 700.0 383.6 1,051.5 611.0 1,486.4 4,232.5
Total 5,041.7 8,312.4 7,519.0 3,855.2 8,602.7 33,331.0
1) Insurance contributions, benefits in kind, expenses for maintenance of two households, relocation costs (in 2013 only), non-recurring payments, use of aircraft, tax, cash disbursement of short- and long-term incentive elements, and discrete payments arising through application of the fixed exchange-rate clause. The effects from the application of the fixed exchange-rate clause are disclosed under “Other.” The amount for Jim Hagemann Snabe under “Other” (2013 respectively 2014) includes the fixed payments for the 2012 and 2013 RSUs respectively 2014 RSUs according to the description below.
2) Compensation attributable to Executive Board members for the respective year, including the respective year’s plan tranche of LTI 2015 based on the grant value at time of grant.3) Salary and STI for 2013 are pro rata temporis amounts until the end of the respective term. The RSUs allocated for 2013 were forfeited at the end of their contracts.
33Compensation Report
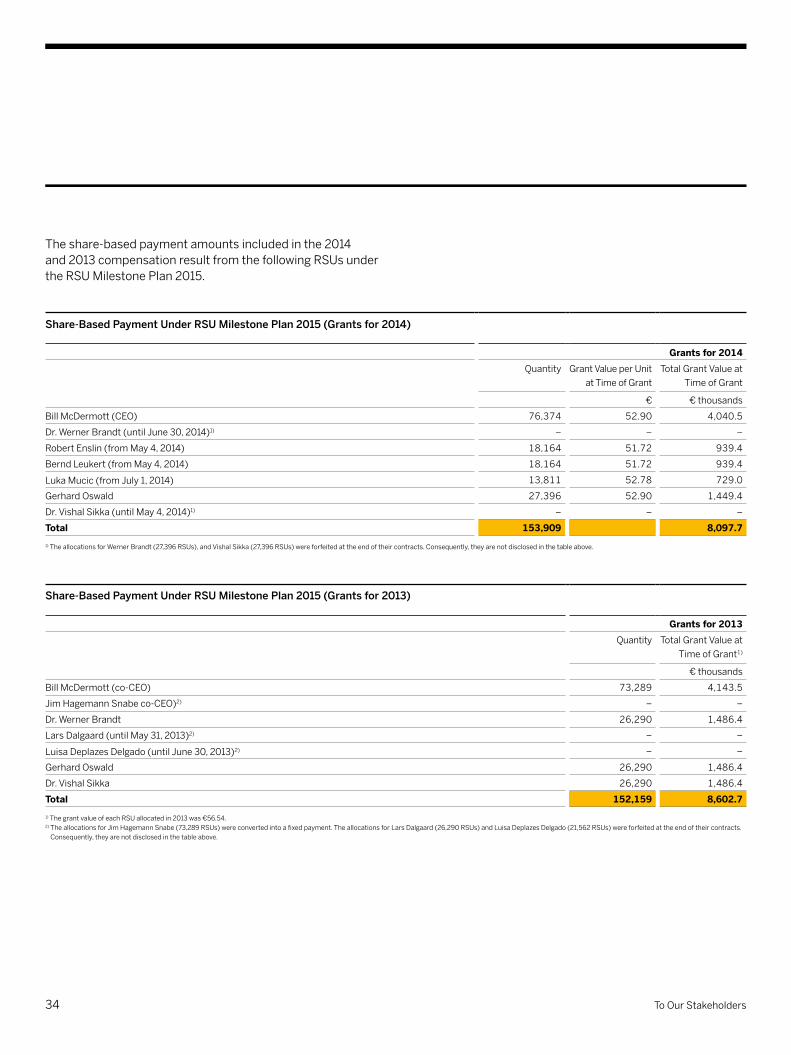
The share-based payment amounts included in the 2014 and 2013 compensation result from the following RSUs under the RSU Milestone Plan 2015.
Share-Based Payment Under RSU Milestone Plan 2015 (Grants for 2014)
Grants for 2014Quantity Grant Value per Unit
at Time of GrantTotal Grant Value at
Time of Grant
€ € thousands
Bill McDermott (CEO) 76,374 52.90 4,040.5
Dr. Werner Brandt (until June 30, 2014)1) – – –
Robert Enslin (from May 4, 2014) 18,164 51.72 939.4
Bernd Leukert (from May 4, 2014) 18,164 51.72 939.4
Luka Mucic (from July 1, 2014) 13,811 52.78 729.0
Gerhard Oswald 27,396 52.90 1,449.4
Dr. Vishal Sikka (until May 4, 2014)1) – – –
Total 153,909 8,097.71) The allocations for Werner Brandt (27,396 RSUs), and Vishal Sikka (27,396 RSUs) were forfeited at the end of their contracts. Consequently, they are not disclosed in the table above.
Share-Based Payment Under RSU Milestone Plan 2015 (Grants for 2013)
Grants for 2013Quantity Total Grant Value at
Time of Grant1)
€ thousands
Bill McDermott (co-CEO) 73,289 4,143.5
Jim Hagemann Snabe co-CEO)2) – –
Dr. Werner Brandt 26,290 1,486.4
Lars Dalgaard (until May 31, 2013)2) – –
Luisa Deplazes Delgado (until June 30, 2013)2) – –
Gerhard Oswald 26,290 1,486.4
Dr. Vishal Sikka 26,290 1,486.4
Total 152,159 8,602.71) The grant value of each RSU allocated in 2013 was €56.54.2) The allocations for Jim Hagemann Snabe (73,289 RSUs) were converted into a fixed payment. The allocations for Lars Dalgaard (26,290 RSUs) and Luisa Deplazes Delgado (21,562 RSUs) were forfeited at the end of their contracts.
Consequently, they are not disclosed in the table above.
34 To Our Stakeholders

Including RSU Milestone Plan 2015 awards for 2014 and 2015 granted in 2013 to Gerhard Oswald (€1,574,800 for each of the two years) upon the extension of his Executive Board contract, the total Executive Board compensation for 2013 calculated as required under section 314 of the German Commercial Code amounts to €24,109,600, thereof: Bill McDermott €5,468,800; Jim Hagemann Snabe €6,212,900; Werner Brandt €2,391,500; Lars Dalgaard €964,100; Luisa Deplazes Delgado €797,100; Gerhard Oswald €5,529,100; and Vishal Sikka €2,746,100.
All amounts as determined under HGB and GAS 17, other than share-based compensation, are identical to the amounts disclosed under the management view above.
III. Executive Board Members’ Compensation According to the CodePursuant to the recommendations of the Code dated June 24, 2014, the value of benefits granted for the year under review as well as the allocation, that is the amounts disbursed for the year under review, are disclosed below based on the reference tables recommended in the Code.
In contrast to the disclosure rules stipulated in the German HGB and GAS 17, the Code includes the service cost according to IAS 19 in the Executive Board compensation and requires the additional disclosure of the target value for the one-year variable compensation and the maximum and minimum compensation amounts achievable for the variable compensation elements. However, due to the payouts under the RSU Milestone Plan 2015 not being capped, there is no disclosure to be made for the maximum variable compensation amount achievable (marked as “NA” in the table below).
II. Executive Board Members’ Compensation According to HGB and GAS 17Under the compensation disclosure rules of the German HGB and GAS 17, share-based compensation awards are to be included in the compensation of the year of grant, even if the awards are tied to future years. Accordingly, and in contrast to, the compensation amounts disclosed under the management view above, the Executive Board compensation amounts determined under HGB and GAS 17 for 2013 and 2014; – Exclude the share-based compensation awards granted to
Executive Board members in 2012 for the years 2013 and 2014 as these were already included in the 2012 compensation
– Include in full the grants for 2014 and 2015 made to Executive Board members appointed in 2014, that is, also including the grant for 2015
Including RSU Milestone Plan 2015 awards for 2014 and 2015 granted in 2014 to Robert Enslin (€1,574,800 for each of the two years), Bernd Leukert (2014: €1,280,000; 2015: €1,574,800), and Luka Mucic (2014: €1,141,000; 2015: €1,574,800) upon their appointment to the Executive Board, the total Executive Board compensation for 2014 calculated as required under section 314 of the German Commercial Code amounts to €23,216,200, thereof: Bill McDermott €4,048,100; Jim Hagemann Snabe €1,395,900; Werner Brandt €1,768,800; Robert Enslin €4,550,800; Bernd Leukert €4,147,200; Luka Mucic €3,691,500; Gerhard Oswald €1,954,700; and Vishal Sikka €1,659,200.
35Compensation Report

German Corporate Governance Code (Benefits Granted in 2013 and 2014)
Benefits granted€ thousands
Bill McDermottCEO
Jim Hagemann SnabeCo-CEO and Member of the
Executive Board (until May 21, 2014)
20141) 2014 (Min) 2014 (Max) 20131) 20142) 2014 (Min) 2014 (Max) 2013Fixed compensation 1,150.0 1,150.0 1,150.0 1,150.0 2,148.8 2,148.8 2,148.8 1,150.0
Fringe benefits3) 861.4 861.4 861.4 1,570.5 228.6 228.6 228.6 147.2
Total 2,011.4 2,011.4 2,011.4 2,720.5 2,377.4 2,377.4 2,377.4 1,297.2One-year variable compensation 1,860.0 0 3,371.3 1,860.0 1,860.0 0 3,371.3 1,860.0
Multi-year variable compensation
LTI HANA – – – – – – – –
RSU Milestone Plan 2015 – – NA – – – NA –
Total 3,871.4 2,011.4 NA 4,580.5 4,237.4 2,377.4 NA 3,157.2Service cost 646.8 646.8 646.8 698.4 117.9 117.9 117.9 282.9
Total 4,518.2 2,658.2 NA 5,278.9 4,355.3 2,495.3 NA 3,440.1
German Corporate Governance Code (Benefits Granted in 2013 and 2014)
Benefits granted€ thousands
Dr. Werner BrandtMember of the Executive Board
(until June 30, 2014)
Robert EnslinMember of the Executive Board
(from May 4, 2014)
20142) 2014 (Min) 2014 (Max) 2013 20141) 2014 (Min) 2014 (Max) 20131)
Fixed compensation 1,138.0 1,138.0 1,138.0 700.0 462.9 462.9 462.9 –
Fringe benefits3) 68.0 68.0 68.0 29.0 121.0 121.0 121.0 –
Total 1,206.0 1,206.0 1,206.0 729.0 583.9 583.9 583.9 –One-year variable compensation 1,125.8 0 2,040.5 2,040.5 746.4 0 1,352.9 –
Multi-year variable compensation
LTI HANA – – – – – – – –
RSU Milestone Plan 2015 – – NA – 939.4 0 NA –
Total 2,331.8 1,206.0 NA 2,769.5 2,269.7 583.9 NA –Service cost 0 0 0 0 148.1 148.1 148.1 –
Total 2,331.8 1,206.0 NA 2,769.5 2,417.8 732.0 NA –
36 To Our Stakeholders

The total Executive Board compensation granted according to the Code amounted to €23,302,200 (2013: €16,280,900).
German Corporate Governance Code (Benefits Granted in 2013 and 2014)
Benefits granted€ thousands
Bernd LeukertMember of the Executive Board
(from May 4, 2014)
Luka MucicMember of the Executive Board
(from July 1, 2014)
2014 2014 (Min) 2014 (Max) 2013 2014 2014 (Min) 2014 (Max) 2013Fixed compensation 462.9 462.9 462.9 – 350.0 350.0 350.0 –
Fringe benefits3) 12.2 12.2 12.2 – 4.3 4.3 4.3 –
Total 475.1 475.1 475.1 – 354.3 354.3 354.3 –One-year variable compensation 746.4 0 1,352.9 – 567.5 0 1,028.6 –
Multi-year variable compensation
LTI HANA – – – – – – – –
RSU Milestone Plan 2015 939.4 0 NA – 729.0 0 NA –
Total 2,160.9 475.1 NA – 1,650.8 354.3 NA –Service cost 0 0 0 – 0 0 0 –
Total 2,160.9 475.1 NA – 1,650.8 354.3 NA –
German Corporate Governance Code (Benefits Granted in 2013 and 2014)
Benefits granted€ thousands
Gerhard OswaldMember of the Executive Board
Dr. Vishal SikkaMember of the Executive Board
(until May 4, 2014)
2014 2014 (Min) 2014 (Max) 2013 20141) 2014 (Min) 2014 (Max) 20131)
Fixed compensation 700.0 700.0 700.0 700.0 291.7 291.7 291.7 700.0
Fringe benefits3) 22.0 22.0 22.0 17.0 92.8 92.8 92.8 383.6
Total 722.0 722.0 722.0 717.0 384.5 384.5 384.5 1,083.6One-year variable compensation 1,125.8 0 2,040.5 1,125.8 1,125.8 0 2,040.5 1,125.8
Multi-year variable compensation
LTI HANA – – – – 1,000.0 0 2,000.0 586.3
RSU Milestone Plan 2015 1,449.4 0 NA – – – NA –
Total 3,297.2 722.0 NA 1,842.8 2,510.3 384.5 NA 2,795.7Service cost 0 0 0 0 59.9 59.9 59.9 153.9
Total 3,297.2 722.0 NA 1,842.8 2,570.2 444.4 NA 2,949.6
1) The value of the fixed and one-year variable elements is subject to a contractual exchange-rate clause applied at the end of the year, so the amounts actually paid may be greater.2) The fixed compensation includes a settlement of the RSU tranche 2014 (Jim Hagemann Snabe: €1,700,000) and a retention bonus (Werner Brandt: €788,000).3) Insurance contributions, benefits in kind, expenses for maintenance of two households, use of aircraft, tax and discrete payments arising through application of the fixed exchange-rate clause.
37Compensation Report

The total Executive Board compensation allocated according to the Code amounted to €32,687,400 (2013: €17,583,100).
END-OF-SERVICE BENEFITS
Regular End-of-Service Undertakings
Retirement Pension PlanThe following retirement pension agreements apply to the individual members of the Executive Board:– Werner Brandt (who retired as of June 30, 2014), Bernd
Leukert, Luka Mucic, and Gerhard Oswald receive a retirement pension when they reach the retirement age of 60 (62 for Board Members appointed after January 1, 2012) and retire from their Executive Board seat, or a disability pension if, before reaching the regular retirement age, they
become subject to occupational disability or permanent incapacity. A surviving dependent’s pension is paid on the death of a former member of the Executive Board. The disability pension is 100% of the vested retirement pension entitlement and is payable until the beneficiary’s 60th birthday, after which it is replaced by a retirement pension. The surviving dependent’s pension is 60% of the retirement pension or vested disability pension entitlement at death. Entitlements are enforceable against SAP SE. Current pension payments are reviewed annually for adjustments and, if applicable, increased according to the surplus in the pension liability insurance. If service is ended before the retirement age of 60 (62 for Board Members appointed after January 1, 2012), pension entitlement is reduced in proportion as the actual length of service stands in relation to the maximum possible length of service.
German Corporate Governance Code (Allocation)
Allocation€ thousands
Bill McDermottCEO
Jim Hagemann SnabeCo-CEO and Member of
the Executive Board (until May 21, 2014)
Dr. Werner BrandtMember of the
Executive Board(until June 30, 2014)
Robert EnslinMember of the
Executive Board(from May 4, 2014)
2014 2013 2014 2013 2014 2013 2014 2013Fixed compensation 1,150.0 1,150.0 2,148.8 1,150.0 1,138.0 700.0 462.9 –
Fringe benefits1) 861.4 1,570.5 228.6 147.2 68.0 29.0 121.0 –
Total 2,011.4 2,720.5 2,377.4 1,297.2 1,206.0 729.0 583.9 –
One-year variable compensation
1,737.2 1,545.7 1,737.2 1,545.7 1,051.5 935.5 – –
Multi-year variable compensation
RSU Milestone Plan 2015
– – 10,254.1 – – – – –
LTI HANA – – – – – – – –
MTI 1,011.1 1,067.6 1,011.1 1,067.6 611.0 645.1 – –
SAP SOP 2010 – – – – – – – –
SAP SOP 2009 378.7 – – – – – – –
Other – – – – – – – –
Total 5,138.4 5,333.8 15,379.8 3,910.5 2,868.5 2,309.6 583.9 –Service cost 646.9 698.4 117.9 282.9 0 0 148.1 –
Total 5,785.3 6,032.2 15,497.7 4,193.4 2,868.5 2,309.6 732.0 –
38 To Our Stakeholders

by further annual contributions because he remains a member of the Executive Board after his 60th birthday until his scheduled retirement on December 31, 2016.Werner Brandt’s rights to retirement pension benefits increased by further contributions after his 60th birthday until he retired from the Executive Board on June 30, 2014.
– Instead of paying for entitlements under the pension plan for Executive Board members, SAP paid an equivalent amount to a third-party pension plan for Jim Hagemann Snabe (2014: €117,900; 2013: €282,900).
– Bill McDermott has rights to future benefits under the portion of the pension plan for SAP America classified as “Non-Qualified Retirement Plan” according to the U.S. Employee Retirement Income Security Act (ERISA). The “Non-Qualified” pension plan of SAP America is a cash balance plan that on retirement provides either monthly pension payments or a
The applied retirement pension plan is contributory. The contribution is 4% of applicable compensation up to the applicable income threshold plus 14% of applicable compen-sation above the applicable income threshold. For this purpose, applicable compensation is 180% of annual base salary. The applicable income threshold is the statutory annual income threshold for the state pension plan in Germany (West), as amended from time to time. Originally, Gerhard Oswald was under a performance-based retirement plan. This plan was discontinued when SAP introduced a contributory retirement pension plan in 2000. His pension benefits are derived from any accrued entitlements on December 31, 1999, under performance-based pension agreements and a salary-linked contribution for the period commencing January 1, 2000. Gerhard Oswald’s rights to retirement pension benefits will increase
German Corporate Governance Code (Allocation)
Allocation€ thousands
Bernd LeukertMember of the
Executive Board(from May 4, 2014)
Luka MucicMember of the
Executive Board(from July 1, 2014)
Gerhard OswaldMember of the
Executive Board
Dr. Vishal SikkaMember of the
Executive Board(until May 4, 2014)
2014 2013 2014 2013 2014 2013 2014 2013Fixed compensation 462.9 – 350.0 – 700.0 700.0 291.7 700.0
Fringe benefits1) 12.2 – 4.3 – 22.0 17.0 92.8 383.0
Total 475.1 – 354.3 – 722.0 717.0 384.5 1,083.0
One-year variable compensation
– – – – 1,051.5 935.5 1,051.5 935.5
Multi-year variable compensation
RSU Milestone Plan 2015
– – – – – – – –
LTI HANA – – – – – – 892.2 –
MTI – – – – 611.0 645.1 611.0 577.9
SAP SOP 2010 – – – – 1,590.9 – – –
SAP SOP 2009 – – – – – – – –
Other – – – – – – – –
Total 475.1 – 354.3 – 3,975.4 2,297.6 2,939.2 2,596.4Service cost 0 – 0 – 0 0 59.9 153.9
Total 475.1 – 354.3 – 3,975.4 2,297.6 2,999.1 2,750.3
1) Insurance contributions, benefits in kind, expenses for maintenance of two households, use of aircraft, tax and discrete payments arising through application of the fixed exchange-rate clause.
39Compensation Report

lump sum. The pension becomes available from the beneficiary’s 65th birthday. Subject to certain conditions, the plan also provides earlier payment or invalidity benefits. The “Non-Qualified” pension plan closed with effect from January 1, 2009. Interest continues to be paid on the earned rights to benefits within this plan.
SAP made contributions to a third-party pension plan for Bill McDermott (2014: €646,800; 2013: €698,400), Robert Enslin (2014: €148,100), and Vishal Sikka (2014: €59,900; 2013: €153,900). SAP’s contributions are based on payments by Bill McDermott, Robert Enslin, and Vishal Sikka into this pension plan.
Total Defined Benefit Obligation (DBO) and the Total Accruals for Pension Obligations to Executive Board Members€ thousands
Bill McDermott(CEO)
Dr. Werner Brandt
(until June 30, 2014)
Bernd Leukert (from May 4,
2014)1)
Luka Mucic (from July 1,
2014)1)
Gerhard Oswald
Total
DBO January 1, 2013 1,075.1 2,041.5 – – 5,716.8 8,833.4
Less plan assets market value January 1, 2013 0 1,348.0 – – 4,194.5 5,542.5
Accrued January 1, 2013 1,075.1 693.5 – – 1,522.3 3,290.9DBO change in 2013 –32.4 96.0 – – 99.7 163.3
Plan assets change in 2013 0 226.2 – – 456.8 683.0
DBO December 31, 2013 1,042.7 2,137.5 – – 5,816.5 8,996.7
Less plan assets market value December 31, 2013 0 1,574.2 – – 4,651.3 6,225.5
Accrued December 31, 2013 1,042.7 563.3 – – 1,165.2 2,771.2DBO change in 2014 169.8 475.1 123.2 102.8 1,404.9 2,275.8
Plan assets change in 2014 0 176.0 94.6 67.8 341.1 679.5
DBO December 31, 2014 1,212.5 2,612.6 123.2 102.8 7,221.4 11,272.5
Less plan assets market value December 31, 2014 0 1,750.2 94.6 67.8 4,992.4 6,905.0
Accrued December 31, 2014 1,212.5 862.4 28.6 35.0 2,229.0 4,367.5
1) The values shown here only reflect the pension entitlements that Bernd Leukert and Luka Mucic will receive from the retirement pension plan for Executive Board members.
40 To Our Stakeholders
present values in the table reflect the discounted present value of the amounts that would be paid in the fictitious scenario in which the Executive Board members leave SAP at the end of their respective current contract terms and their final average contractual compensation prior to their departure equals the compensation in 2014. Actual postcontractual non-compete payments will likely differ from these amounts depending on the time of departure and the compensation levels and target achievements at the time of departure.
Net Present Values of the Postcontractual Non-Compete Abstention Payments€ thousands
Contract Term Expires
Net Present Value of
Postcontractual Non-Compete
Abstention Payment1)
Bill McDermott (CEO) June 30, 2017 3,999.7
Robert Enslin (from May 4, 2014) June 30, 2017 1,157.4
Bernd Leukert (from May 4, 2014) June 30, 2017 1,103.6
Luka Mucic (from July 1, 2014) June 30, 2017 842.9
Gerhard Oswald December 31, 2016 1,689.2
Total 8,792.8
1) For the purpose of this calculation, the following discount rates have been applied: Bill McDermott 0.46% (2013: 1.72%); Robert Enslin 0.46%; Bernd Leukert 0.46%; Luka Mucic 0.46%: Gerhard Oswald 0.38% (2013: 1.54%).
Early End-of-Service Undertakings
Severance PaymentsThe standard contract for all Executive Board members provides that on termination before full term (for example, where the member’s appointment is revoked, where the member becomes occupationally disabled, or in connection with a change of control), SAP SE will pay to the member the outstanding part of the compensation target for the entire remainder of the term, appropriately discounted for early payment. A member has no claim to that payment if he or she has not served SAP as a member of the Executive Board for at least one year or if he or she leaves SAP SE for reasons for which he or she is responsible.
The table below shows the annual pension entitlement of each member of the Executive Board on reaching the scheduled retirement age (60 for Executive Board members initially appointed before 2014 and 62 for Executive Board members initially appointed in 2014) based on entitlements from SAP under performance-based and salary-linked plans vested on December 31, 2014.
Annual Pension Entitlement€ thousands
Vested on December 31,
2014
Vested on December 31,
2013
Bill McDermott (CEO)1) 94.0 88.4
Dr. Werner Brandt (until June 30, 2014) 95.73) 89.82)
Bernd Leukert (from May 4, 2014) 3.5 –
Luka Mucic (from July 1, 2014) 2.6 –
Gerhard Oswald4) 279.4 267.9
1) The rights shown here for Bill McDermott refer solely to rights under the pension plan for SAP America.2) Due to the extension of Werner Brandt's contract beyond his 60th birthday, this value represents the retirement
pension entitlement that he would have received based on the entitlements vested on December 31, 2013.3) This value represents the retirement pension that Werner Brandt receives after his Executive Board contract
expired.4) Due to the extension of Gerhard Oswald's contract beyond June 30, 2014, these values represent the retirement
pension entitlement that he would receive after his current Executive Board contract expires on December 31, 2016, based on the entitlements vested on December 31, 2014 (December 31, 2013).
These are vested entitlements. To the extent that members continue to serve on the Executive Board and that therefore more contributions are made for them in the future, pensions actually payable at the scheduled retirement age will be higher than the amounts shown in the table.
Postcontractual Non-Compete ProvisionsDuring the agreed 12-month postcontractual non-compete period, each Executive Board member receives abstention payments corresponding to 50% of his or her final average contractual compensation as agreed in the respective contract on an individual basis. Any other occupational income generated by the Executive Board member will be deducted from his compensation in accordance with section 74c of the German Commercial Code.
The following table presents the net present values of the postcontractual non-compete abstention payments. The net
41Compensation Report
If an Executive Board member’s appointment to the Executive Board expires or ceases to exist because of, or as a consequence of, change or restructuring, or due to a change of control, SAP SE and each Executive Board member has the right to terminate the employment contract within eight weeks of the occurrence by giving six months’ notice. A change of control is deemed to occur when a third party is required to make a mandatory takeover offer to the shareholders of SAP SE under the German Securities Acquisition and Takeover Act, when SAP SE merges with another company and becomes the subsumed entity, or when a control or profit transfer agreement is concluded with SAP SE as the dependent company. An Executive Board member’s contract can also be terminated before full term if his or her appointment as an Executive Board member of SAP SE is revoked in connection with a change of control.
Postcontractual Non-Compete ProvisionsAbstention compensation for the postcontractual non-compete period as described above is also payable on early contract termination.
Permanent DisabilityIn case of permanent disability, the contract will end at the end of the quarter in which the permanent inability to work was determined. The Executive Board member receives the monthly basic salary for a further 12 months starting from the date the permanent disability is determined.
Payments to Executive Board Members Resigning or Retiring in 2014Vishal Sikka resigned from his position as Executive Board member with effect from May 4, 2014, with the approval of the Supervisory Board. He received the following payments in connection with his retirement with effect from May 31, 2014:– Vishal Sikka received monthly abstention compensation for
a period of 24 months for the postcontractual non-compete period totaling €3,663,400.
– The unforfeitable rights allocated to him under the RSU Milestone Plan 2015 for the tranches 2012 and 2013 with the value of €2,420,800 (2012) and €1,434,500 (2013) remain available to him until their cash settlement in 2016 and 2017.
Werner Brandt retired from his position as Executive Board member upon the end of his current term on June 30, 2014. He received the following payments in connection with his retirement:– For a period of twelve months he receives monthly abstention
compensation for the postcontractual non-compete period totaling €1,841,500.
– The unforfeitable rights allocated to him under the RSU Milestone Plan 2015 for the tranches 2012 and 2013 remain available to him until their cash settlement in 2016 and 2017.
– In 2014 he receives for six months a retirement pension totaling €47,840.
Payments to Former Executive Board MembersIn 2014, we paid pension benefits of €1,425,000 to Executive Board members who had retired before January 1, 2014 (2013: €1,387,000). At the end of the year, the DBO for former Executive Board members was €33,764,000 (2013: €29,181,000). Plan assets of €25,584,000 are available to meet these obligations (2013: €26,015,000).
EXECUTIVE BOARD MEMBERS’ HOLDINGS OF LONG-TERM INCENTIVESMembers of the Executive Board hold or held share-based payment rights throughout the year under the RSU Milestone Plan 2015 and the SAP SOP 2010 (which were granted in previous years). For information about the terms and details of these programs, see the Notes to the Consolidated Financial Statements section, Note (28).
RSU Milestone Plan 2015The table below shows Executive Board members’ holdings, on December 31, 2014, of restricted share units issued to them under the RSU Milestone Plan 2015. The plan is a cash-settled long-term incentive scheme with a payout subsequent to a performance period of one year and an additional holding period of three years. The RSU Milestone Plan 2015 consists of four plan tranches to be issued with respect to the calendar years 2012 through 2015.
42 To Our Stakeholders

The holding of RSUs on December 31, 2014, which were issued and not forfeited in 2014, reflects the number of RSUs multiplied by the 77,89% target achievement. The RSUs allocated in 2012 have a remaining term of 1.08 years; the RSUs allocated in 2013 have a remaining term of 2.08 years; and the RSUs allocated in 2014 have a remaining term of 3.08 years.
RSU Milestone Plan 2015 (2014 Tranche)Quantity of RSUs
Holding on January 1,
2014
Grants in 2014
Performance- Related
Adjustment
Exercised Units
Forfeited Units
Holding on December 31,
2014
Bill McDermott (CEO) 195,562 76,374 –16,886 – – 255,050
Dr. Werner Brandt (until June 30, 2014) 70,151 27,396 – – 27,396 70,151
Gerhard Oswald 70,151 27,396 –6,057 – – 91,490
Dr. Vishal Sikka (until May 4, 2014)1) 70,151 27,396 – 70,151 27,396 –
Robert Enslin (from May 4, 2014) 0 18,164 –4,016 – – 14,148
Bernd Leukert (from May 4, 2014) 0 18,164 –4,016 – – 14,148
Luka Mucic (from July 1, 2014) 0 13,811 –3,054 – – 10,757
Total 406,014 208,701 –34,029 70,151 54,792 455,743
1) According to the termination agreement with Vishal Sikka, the 2012 grants will be paid out after the close of the Annual General Meeting of Shareholders in 2016 based on a fixed share price of €52.96. The 2013 grants will be paid out after the close of the Annual General Meeting of Shareholders in 2017 based on a fixed share price of €58.69.
RSU Milestone Plan 2015 (2013 Tranche)Quantity of RSUs
Holding on January 1,
2013
Grants in 2013
Performance- Related
Adjustment
Exercised Units
Forfeited Units
Holding on December 31,
2013
Bill McDermott (co-CEO) 127,425 73,289 –5,152 – – 195,562
Jim Hagemann Snabe(co-CEO)1) 127,425 73,289 –5,152 195,562 – –
Dr. Werner Brandt 45,709 26,290 –1,848 – – 70,151
Gerhard Oswald 45,709 26,290 –1,848 – – 70,151
Dr. Vishal Sikka 45,709 26,290 –1,848 – – 70,151
Total 391,977 225,448 –15,849 195,562 – 406,014
1) According to the termination agreement with Jim Hagemann Snabe, the 2012 and 2013 grants were paid out after the close of the Annual General Meeting of Shareholders on May 21, 2014, based on a fixed share price of €52.96 for the 2012 grants and €58.69 for the 2013 grants.
43Compensation Report

The holding of RSUs on December 31, 2013, which were issued and not forfeited in 2013, reflects the number of RSUs multiplied by the 92.97% target achievement.
The holding on December 31, 2012, reflects the number of RSUs issued in 2012 multiplied by the 133.55% target achievement.
SAP SOP 2010 The table below shows Executive Board members’ holdings, on December 31, 2014, of virtual share options issued to them under the SAP SOP 2010 since its inception. The strike price for an option is 115% of the base price. The issued options have a term of seven years and can only be exercised on specified dates after the vesting period. The options issued in 2010 were exercisable beginning in September 2014 and the options issued in 2011 are exercisable beginning in June 2015.
RSU Milestone Plan 2015 (2012 Tranche)Quantity of RSUs
Holding on January 1,
2012
Grants in 2012
Performance- Related
Adjustment
Exercised Units
Forfeited Units
Holding on December 31,
2012
Bill McDermott (co-CEO) – 95,414 32,011 – – 127,425
Jim Hagemann Snabe (co-CEO) – 95,414 32,011 – – 127,425
Dr. Werner Brandt – 34,226 11,483 – – 45,709
Gerhard Oswald – 34,226 11,483 – – 45,709
Dr. Vishal Sikka – 34,226 11,483 – – 45,709
Total – 293,506 98,471 – – 391,977
44 To Our Stakeholders

Total Expense for Share-Based PaymentTotal expense for the share-based payment plans of Executive Board members was recognized as follows.
SAP SOP 2010 Virtual Share Options
Year Granted
Holding on January 1, 2014
Strike Price per
Option
Rights Exercised
in 2014
Price on Exercise
Date
Exercisable Rights of
Retired Members of
the Execu-tive Board
Forfeited Rights
Holding on December 31, 2014
Quantity of Options
Remaining Term in
Years
€ Quantity of Options
€ Quantity of Options
Quantity of Options
Quantity of Options
Remaining Term in
Years
Bill McDermott (co-CEO)
2010 135,714 3.69 40.80 – – – – 135,714 2.69
2011 112,426 4.44 48.33 – – – – 112,426 3.44
Jim Hagemann Snabe (co-CEO and member until May 21, 2014)
2010 135,714 3.69 40.80 135,714 60.10 – – – –
2011 112,426 4.44 48.33 – – – – 112,426 3.44
Dr. Werner Brandt (until June 30, 2014)
2010 82,428 3.69 40.80 82,428 60.10 – – – –
2011 68,284 4.44 48.33 – – – – 68,284 3.44
Gerhard Oswald 2010 82,428 3.69 40.80 82,428 60.10 – – – –
2011 68,284 4.44 48.33 – – – – 68,284 3.44
Dr. Vishal Sikka (until May 4, 2014)
2010 82,428 3.69 40.80 82,428 60.10 – – – –
2011 68,284 4.44 48.33 – – – – 68,284 3.44
Total 948,416 382,998 – – 565,418
Total Expense for Share-Based Payment€ thousands
2014 2013
Bill McDermott (co-CEO) 5,063.8 –1,529.7
Jim Hagemann Snabe (co-CEO and member until May 21, 2014)
–201.0 –2,967.0
Dr. Werner Brandt (until June 30, 2014) –330.8 1,042.9
Robert Enslin (from May 4, 2014) 1,833.5 –
Bernd Leukert (from May 4, 2014) 1,759.7 –
Luka Mucic (from July 1, 2014) 1,577.2 –
Gerhard Oswald 1,891.1 –376.0
Dr. Vishal Sikka (until May 4, 2014) –460.7 –376.0
Total 11,132.8 –4,205.8
45Compensation Report

The expense is recognized in accordance with IFRS 2 “Share-Based Payments.” Because the RSU Milestone Plan 2015 tranche for 2015 was allocated at the respective grant date of each Executive Board member, we are required to recognize the respective expense in part in 2014 even though this future tranche depends on the achievement of specific financial targets in future periods. Share-based payment expenses were affected by a decrease in fair values of SOP 2010. Negative expenses also arose out of the lapsing of rights under the RSU Milestone Plan 2015 in connection with the departures from the company of Werner Brandt and Vishal Sikka before the end of the year.
Shareholdings and Transactions of Executive Board MembersNo member of the Executive Board holds more than 1% of the ordinary shares of SAP SE. Members of the Executive Board held a total of 36,426 SAP shares on December 31, 2014 (2013: 30,201 shares).
The table below shows transactions by Executive Board members and persons closely associated with them notified to SAP pursuant to the German Securities Trading Act, section 15a, in 2014.
Transactions in SAP Shares
Transaction Date Transaction Quantity Unit Price
Dr. Werner Brandt (until June 30, 2014) April 17, 2014 Share purchase 950 €56.8290
Robert Enslin (from May 4, 2014) June 6, 2014 Share sale 1,665 €55.1703
July 23, 2014 Purchase of ADRs 875 US$82.4600
October 21, 2014 Purchase of ADRs 1,850 US$65.2900
Gerhard Oswald June 10, 2014 Share purchase 950 €55.6690
October 21, 2014 Share purchase 1,950 €51.3000
Bernd Leukert (from May 4, 2014) August 7, 2014 Share purchase 210 €57.8490
September 5, 2014 Share sale 1,315 €59.7547
October 21, 2014 Share purchase 1,200 €51.3227
Bill McDermott (CEO) August 20, 2014 Purchase of ADRs 2,000 US$76.8200
October 20, 2014 Purchase of ADRs 10,000 US$65.2486
Luka Mucic (from July 1, 2014) October 20, 2014 Share purchase 1,900 €51.5340
46 To Our Stakeholders

The fixed element is €100,000 for the chairperson, €70,000 for a deputy chairperson, and €50,000 for other members. For membership of the Audit Committee, Supervisory Board members receive additional fixed annual remuneration of €15,000, and for membership of any other Supervisory Board committee €10,000, provided that the committee concerned has met in the year. The chairperson of the Audit Committee receives €25,000, and the chairpersons of the other committees receive €20,000. The fixed remuneration is payable after the end of the year.
The variable compensation element is €10,000 for the chairperson, €8,000 for a deputy chairperson, and €6,000 for the other members of the Supervisory Board for each €0.01 by which the dividend distributed per share exceeds €0.40. The variable remuneration is payable after the end of the Annual General Meeting of Shareholders that resolves on the dividend for the relevant year.
However, the aggregate compensation excluding compensation for committee memberships must not exceed €250,000 for the chairperson, €200,000 for a deputy chairperson, and €150,000 for other members of the Supervisory Board.
Any members of the Supervisory Board having served for less than the entire year receive one-twelfth of the annual remuneration for each month of service commenced. This also applies to the increased compensation of the chairperson and the deputy chairperson(s) and to the remuneration for the chairperson and the members of a committee.
Amount of CompensationSubject to the resolution on the appropriation of retained earnings by the Annual General Meeting of Shareholders on May 20, 2015, the compensation paid to Supervisory Board members in respect of 2014 will be as set out in the table below.
EXECUTIVE BOARD: OTHER INFORMATIONWe did not grant any compensation advance or credit to, or enter into any commitment for the benefit of, any member of our Executive Board in 2014 or the previous year.
As far as the law permits, SAP SE and its affiliated companies in Germany and elsewhere indemnify and hold harmless their respective directors and officers against and from the claims of third parties. To this end, we maintain directors’ and officers’ (D&O) group liability insurance. The policy is annual and is renewed from year to year. The insurance covers the personal liability of the insured group for financial loss caused by its managerial acts and omissions. The current D&O policy includes an individual deductible for Executive Board members of SAP SE as required by section 93 (2) of the German Stock Corporation Act.
COMPENSATION FOR SUPERVISORY BOARD MEMBERS
Compensation SystemSupervisory Board members’ compensation is governed by our Articles of Incorporation, section 16. Each member of the Supervisory Board receives, in addition to the reimbursement of his or her expenses, compensation composed of fixed elements and a variable element. The variable element depends on the dividend paid by SAP on its shares.
47Compensation Report

In addition, we reimburse members of the Supervisory Board for their expenses and the value-added tax payable on their compensation.
In total, we received services from members of the Supervisory Board (including services from employee representatives on the Supervisory Board in their capacity as employees of SAP) in the amount of €2,295,000 (2013: €1,503,600). This amount includes fees paid to Linklaters LLP in Frankfurt am Main, Germany (which Supervisory Board member Wilhelm Haarmann is a partner of) of €1,001,700 (2013: €327,500).
LONG-TERM INCENTIVES FOR THE SUPERVISORY BOARDWe do not offer members share options or other share-based payment for their Supervisory Board work. Any share options or other share-based payment received by employee-elected members relate to their position as SAP employees and not to their work on the Supervisory Board.
Supervisory Board Members’ Compensation in 2014€ thousands
2014 2013
Fixed Com-pensation
Compen-sation for
Committee Work
Variable Compen-
sation
Total Fixed Com-pensation
Compen-sation for
Committee Work
Variable Compen-
sation
Total
Prof. Dr. h.c. mult. Hasso Plattner (chairperson)
100.0 100.0 150.0 350.0 100.0 81.7 150.0 331.7
Christiane Kuntz-Mayr (deputy chairperson)
70.0 20.8 130.0 220.8 70.0 10.8 130.0 210.8
Pekka Ala-Pietilä 50.0 30.0 100.0 180.0 50.0 30.0 100.0 180.0
Catherine Bordelon (from July 7, 2014) 25.0 5.0 50.0 80.0 NA NA NA NA
Panagiotis Bissiritsas 50.0 20.0 100.0 170.0 50.0 20.0 100.0 170.0
Prof. Anja Feldmann 50.0 20.0 100.0 170.0 50.0 10.8 100.0 160.8
Prof. Dr. Wilhelm Haarmann 50.0 50.0 100.0 200.0 50.0 40.8 100.0 190.8
Margret Klein-Magar 50.0 30.0 100.0 180.0 50.0 20.0 100.0 170.0
Lars Lamadé 50.0 30.0 100.0 180.0 50.0 20.8 100.0 170.8
Steffen Leskovar (from July 7, 2014) 25.0 12.5 50.0 87.5 NA NA NA NA
Bernard Liautaud 50.0 30.0 100.0 180.0 50.0 30.0 100.0 180.0
Dr. h. c. Hartmut Mehdorn 50.0 20.0 100.0 170.0 50.0 10.8 100.0 160.8
Dr. Kurt Reiner 50.0 20.0 100.0 170.0 50.0 20.0 100.0 170.0
Mario Rosa-Bian 50.0 15.0 100.0 165.0 50.0 9.2 100.0 159.2
Dr. Erhard Schipporeit 50.0 35.0 100.0 185.0 50.0 35.0 100.0 185.0
Stefan Schulz 50.0 30.8 100.0 180.8 50.0 25.8 100.0 175.8
Jim Hagemann Snabe (from July 7, 2014) 25.0 10.0 50.0 85.0 NA NA NA NA
Inga Wiele (until July 6 , 2014) 29.2 14.6 58.3 102.1 50.0 25.0 100.0 175.0
Prof. Dr.-Ing. Dr.-Ing. E. h. Klaus Wucherer 50.0 20.8 100.0 170.8 50.0 25.0 100.0 175.0
Total 924.2 514.5 1,788.3 3,227.0 870.0 415.7 1,680.0 2,965.7
48 To Our Stakeholders

As far as the law permits, we indemnify Supervisory Board members against, and hold them harmless from, claims brought by third parties. To this end, we maintain directors’ and officers’ (D&O) group liability insurance. The current D&O policy does not include an individual deductible for Supervisory Board members as envisaged in the German Corporate Governance Code.
Shareholdings and Transactions of Supervisory Board MembersSupervisory Board chairperson Hasso Plattner and the companies he controlled held 107,442,743 SAP shares on December 31, 2014 (December 31, 2013: 119,300,882 SAP shares), representing 8.746% (2013: 9.711%) of SAP’s share capital. No other member of the Supervisory Board held more
Transactions in SAP Shares
Transaction Date Transaction Quantity Unit Price
Hasso Plattner May 5, 2014 Sale of ADRs 24,100 US$77.9873
Mario Rosa-Bian June 2, 2014 Share sale 118 €56.1100
Hasso Plattner GmbH & Co. Beteiligungs-KG August 29, 2014 Compensation in kind (granting party)
9,567,786 1)
November 21, 2014 Share sale 2) 2)
Sabine Plattner GmbH & Co. Beteiligungs-KG August 29, 2014 Compensation in kind (receiving party)
4,783,893 3)
November 20, 2014 Share sale 4) 4)
1) Compensation in kind of 9,567,786 shares, hypothetical volume of the transaction: €566,412,931.20.2) The notifying party (Hasso Plattner GmbH & Co. Beteiligungs-KG) concluded a contract with a bank acting as commission agent for the monthly sale of SAP shares with a fair value of €20,000,000 per month.
The sale will be carried out at the bank’s own discretion in the stock market or over the counter in the months December 2014 through November 2015.3) Compensation in kind of 4,783,893 shares, hypothetical volume of the transaction: €283,206,465.60.4) The notifying party (Sabine Plattner GmbH & Co. Beteiligungs-KG) concluded a contract with a bank acting as commission agent for the sale of 40,000 SAP shares per month. The sale will be carried out at the bank’s own discretion
in the stock market or over the counter in the months December 2014 through November 2015.
than 1% of the SAP SE share capital at the end of 2014 or of the previous year. Members of the Supervisory Board held a total of 107,467,372 SAP shares on December 31, 2014 (December 31, 2013: 119,316,444 SAP shares).
The table below shows transactions by Supervisory Board members and persons closely associated with them notified to SAP pursuant to the German Securities Trading Act, section 15a, in 2014:
SUPERVISORY BOARD: OTHER INFORMATIONWe did not grant any compensation advance or credit to, or enter into any commitment for the benefit of, any member of our Supervisory Board in 2014 or the previous year.
Hasso Plattner, the chairperson of the Supervisory Board, entered into a consulting contract with SAP after he joined the Supervisory Board in May 2003. The contract does not provide for any compensation. The only cost we incurred under the contract was the reimbursement of expenses.
49Compensation Report

Bill McDermott Robert Enslin
Bernd Leukert Luka Mucic
Gerhard Oswald
Responsibility Statement
To the best of our knowledge, and in accordance with the applicable reporting principles, the consolidated financial statements give a true and fair view of the assets, finances, and operating results of the Group, and the management report of the Group and SAP SE includes a fair review of the development and performance of the business and the position of the Group and SAP SE, together with a description of the material opportunities and risks associated with the expected development of the Group and SAP SE.
Walldorf, February 19, 2015
SAP SEWalldorf, BadenThe Executive Board
50 To Our Stakeholders

TO SAP SE
Report on the Consolidated Financial StatementsWe have audited the accompanying consolidated financial statements of SAP SE, Walldorf (“SAP” or “the Company”), and its subsidiaries, which comprise the consolidated statement of financial position as of December 31, 2014, and the consolidated income statement, the consolidated statement of comprehensive income, the consolidated statement of changes in equity, the consolidated statement of cash flows, and the notes to the consolidated financial statements for the year then ended.
Management’s Responsibility for the Consolidated Financial StatementsManagement is responsible for the preparation of consolidated financial statements. This includes the responsibility that the consolidated financial statements give a true and fair view of the Company’s net assets, financial position, and results of operations in accordance with International Financial Reporting Standards (IFRSs) as adopted by the European Union (“EU”), the supplementary provisions of German law to be applied in accordance with the German Commercial Code (Handels- gesetzbuch, “HGB”), section 315a (1), and IFRSs as issued by the International Accounting Standards Board. Management’s responsibility includes maintaining such internal control as management determines necessary to enable the preparation of consolidated financial statements that are free from material misstatement, whether due to fraud or error.
Auditor’s ResponsibilityOur responsibility is to express an opinion on these consolidated financial statements based on our audit. We conducted our audit in accordance with HGB, section 317, and German generally accepted standards for the audit of consolidated financial statements, promulgated by the Institut der Wirtschaftsprüfer (“IDW”), and in supplementary compliance with International Standards on Auditing and standards of the Public Company Accounting Oversight Board (United States). Those standards require that we comply with ethical requirements and plan and perform the audit to obtain reasonable assurance about whether the consolidated financial statements are free from material misstatement.
An audit involves performing procedures to obtain audit evidence about the amounts and disclosures in the consolidated financial statements. The procedures selected depend on the auditor’s judgment, including the assessment of the risks of material misstatement in the consolidated financial statements, whether due to fraud or error. In making those risk assessments, the auditor considers internal control relevant to the entity’s preparation of the consolidated financial statements that give a true and fair view in order to design audit procedures that are appropriate in the circumstances. An audit also includes evaluating the appropriateness of accounting policies used and the reasonableness of accounting estimates made by management, as well as evaluating the overall presentation of the consolidated financial statements.
We believe that the audit evidence we have obtained is sufficient and appropriate to provide a basis for our audit opinion.
OpinionIn accordance with HGB, section 322 (3) sentence 1, we declare that our audit of the consolidated financial statements has not led to any reservations.
In our opinion, based on our audit, the consolidated financial statements give a true and fair view of the Company’s net assets and financial position as of December 31, 2014; and of its results of operations for the year then ended, in accordance with IFRSs as adopted by the EU, the supplementary provisions of German law to be applied in accordance with HGB, section 315a (1), and IFRSs as issued by the International Accounting Standards Board.
Independent Auditor’s Report
51Independent Auditor's Report

OpinionIn accordance with HGB, section 322 (3) sentence 1, we declare that our audit has not led to any reservations.
In our opinion, based on our audit of the consolidated financial statements and the management report, the management report is consistent with the consolidated financial statements and as a whole, provides a suitable view of the Company’s position and suitably presents the opportunities and risks of future development.
Report on the Effectiveness of Internal Control over Financial Reporting in the Consolidated Financial Statements in accordance with the standards of the Public Company Accounting Oversight Board (United States)We have audited SAP’s internal control over financial reporting in the consolidated financial statements as of December 31, 2014, based on criteria established in Internal Control – Integrated Framework (2013) issued by the Committee of Sponsoring Organizations of the Treadway Commission (COSO).
Management’s Responsibility for Internal ControlManagement is responsible for maintaining effective internal control over financial reporting in the consolidated financial statements, and for the assessment of its effectiveness, as included in the accompanying Management’s Annual Report on Internal Control over Financial Reporting in the Consolidated Financial Statements.
A company’s internal control over financial reporting in the consolidated financial statements is a process designed to provide reasonable assurance regarding the reliability of financial reporting and the preparation of financial statements
Report on the Management ReportWe have audited the accompanying combined management report for SAP Group and SAP SE (“management report”) for the business year ended December 31, 2014. Management’s Responsibility for the Management ReportManagement is responsible for the preparation of the management report in accordance with the provisions of German law to be applied in accordance with HGB, section 315a (1), the German Accounting Standards Nos. 17 and 20 (GAS 17, GAS 20) and the provisions of the IFRS Practice Statement Management Commentary.
Auditor’s ResponsibilityOur responsibility is to express an opinion on this management report based on our audit. We conducted our audit of the management report in accordance with HGB, section 317 (2), and German generally accepted standards for the audit of management reports promulgated by the IDW. Those standards require that we plan and perform the audit of the management report in such a way that we obtain reasonable assurance about whether the management report is consistent with the consolidated financial statements and the findings from our audit of the consolidated financial statements and as a whole provides a suitable understanding of the Company’s position and suitably presents the opportunities and risks of future development.
We believe that the audit evidence we have obtained is sufficient and appropriate to provide a basis for our audit opinion.
52 To Our Stakeholders

for external purposes in accordance with generally accepted accounting principles. A company’s internal control over financial reporting in the consolidated financial statements includes those policies and procedures that (1) pertain to the maintenance of records that, in reasonable detail, accurately and fairly reflect the transactions and dispositions of the assets of the company; (2) provide reasonable assurance that transactions are recorded as necessary to permit preparation of financial statements in accordance with generally accepted accounting principles; and (3) provide reasonable assurance regarding prevention or timely detection of unauthorized acquisition, use, or disposition of the company’s assets that could have a material effect on the financial statements.
Because of its inherent limitations, internal control over financial reporting in the consolidated financial statements may not prevent or detect misstatements. Also, projections of any evaluation of effectiveness to future periods are subject to the risk that controls may become inadequate because of changes in conditions, or that the degree of compliance with the policies or procedures may deteriorate.
Auditor’s ResponsibilityOur responsibility is to express an opinion on SAP’s internal control over financial reporting in the consolidated financial statements based on our audit. We conducted our audit in accordance with the standards of the Public Company Accounting Oversight Board (United States). Those standards require that we plan and perform the audit to obtain reasonable assurance
about whether effective internal control over financial reporting in the consolidated financial statements was maintained in all material respects. Our audit included obtaining an understanding of internal control over financial reporting in the consolidated financial statements, assessing the risk that a material weakness exists, and testing and evaluating the design and operating effectiveness of internal control based on the assessed risk. Our audit also included performing such other procedures as we considered necessary in the circumstances.
We believe that the audit evidence we have obtained is sufficient and appropriate to provide a basis for our audit opinion.
OpinionIn our opinion, SAP maintained, in all material respects, effective internal control over financial reporting in the consolidated financial statements as of December 31, 2014, based on criteria established in Internal Control – Integrated Framework (2013) issued by COSO.
Mannheim, February 19, 2015
KPMG AGWirtschaftsprüfungsgesellschaft
Dr. Gutsche Dr. BöttcherWirtschaftsprüfer Wirtschaftsprüfer
53Independent Auditor's Report
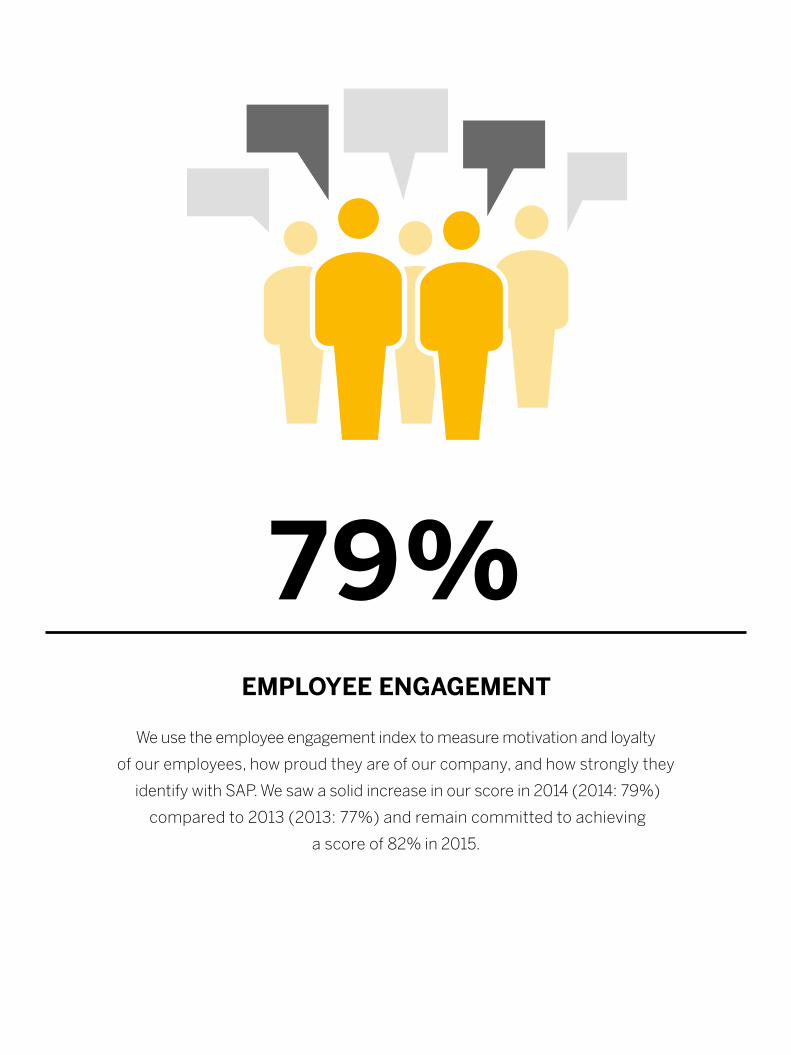
EMPLOYEE ENGAGEMENT
We use the employee engagement index to measure motivation and loyalty
of our employees, how proud they are of our company, and how strongly they
identify with SAP. We saw a solid increase in our score in 2014 (2014: 79%)
compared to 2013 (2013: 77%) and remain committed to achieving
a score of 82% in 2015.
79%

Combined Management ReportGeneral Information About This Management ReportOverview of the SAP GroupStrategy and Business Model Products, Research & Development, and ServicesAcquisitionsPartner EcosystemCustomersPerformance Management SystemEmployees and Social PerformanceEnvironmental Performance: Energy and EmissionsFinancial Performance: Review and AnalysisCorporate Governance FundamentalsRisk Management and RisksExpected Developments and OpportunitiesEvents After the Reporting Period
555657586268697173828892
114117148157
55

made in the Operating Results section, our quantitative and qualitative disclosures about market risk pursuant to the International Financial Reporting Standards (IFRS), namely IFRS 7 and related statements in our Notes to the Consolidated Financial Statements, the Expected Developments and Opportunities section, the Risk Management and Risks section, and other forward-looking information appearing in other parts of this report. To fully consider the factors that could affect our future financial results, both this report and our Annual Report on Form 20-F should be considered, as well as all of our other filings with the Securities and Exchange Commission (SEC). Readers are cautioned not to place undue reliance on these forward-looking statements, which speak only as of the date specified or the date of this report. We undertake no obligation to publicly update or revise any forward-looking statements as a result of new information that we receive about conditions that existed upon issuance of this report, future events, or otherwise unless we are required to do so by law.
This report includes statistical data about the IT industry and global economic trends that comes from information published by sources including International Data Corporation (IDC), a provider of market information and advisory services for the information technology, telecommunications, and consumer technology markets; the European Central Bank (ECB); and the International Monetary Fund (IMF). This type of data represents only the estimates of IDC, ECB, IMF, and other sources of industry data. SAP does not adopt or endorse any of the statistical information provided by sources such as IDC, ECB, IMF, or other similar sources that is contained in this report. In addition, although we believe that data from these sources is generally reliable, this type of data is imprecise. We caution readers not to place undue reliance on this data.
BASIS OF PRESENTATIONThis combined group management report by the SAP Group (collectively, “we,” “us,” “our,” “SAP,” “Group,” or “Company”) and management report of SAP SE has been prepared in accordance with sections 289, 315, and 315a of the German Commercial Code and German Accounting Standards (GAS) No. 17 and 20. The management report is also a management commentary complying with the International Financial Reporting Standards (IFRS) Practice Statement Management Commentary.
All of the information in this report relates to the situation on December 31, 2014, or the fiscal year ended on that date, unless otherwise stated.
The report contains references to additional information in other parts of the SAP Integrated Report that is available online. This additional information is not part of the management report. FORWARD-LOOKING STATEMENTSThis management report contains forward-looking statements and information based on the beliefs of, and assumptions made by, our management using information currently available to them. Any statements contained in this report that are not historical facts are forward-looking statements as defined in the U.S. Private Securities Litigation Reform Act of 1995. We have based these forward-looking statements on our current expectations, assumptions, and projections about future conditions and events. As a result, our forward-looking statements and information are subject to uncertainties and risks, many of which are beyond our control. If one or more of these uncertainties or risks materializes, or if management’s underlying assumptions prove incorrect, our actual results could differ materially from those described in or inferred from our forward-looking statements and information. We describe these risks and uncertainties in the Risk Management and Risks section.
The words “aim,” “anticipate,” “assume,” “believe,” “continue,” “could,” “counting on,” “is confident,” “development,” “estimate,” “expect,” “forecast,” “future trends,” “guidance,” “intend,” “may,” “might,” “outlook,” “plan,” “project,” “predict,” “seek,” “should,” “strategy,” “want,” “will,” “would,” and similar expressions as they relate to us are intended to identify such forward-looking statements. Such statements include, for example, those
General Information About This Management Report
56 Combined Management Report

We derive our revenue from fees charged to our customers for the use of our cloud solutions and for licensing of on-premise software products and solutions. Additional sources of revenue are support, professional services, development, training, and other services.
As of December 31, 2014, SAP SE controlled directly or indirectly a worldwide network of 287 subsidiaries in more than 180 countries to distribute our products, solutions, and services. Distributorship agreements are in place with independent resellers in many countries. For more information, see the Strategy and Business Model section.
Our subsidiaries perform tasks such as sales and marketing, consulting, research and development, cloud delivery, customer support, training, or administration. For a complete list of subsidiaries, associates, and other equity investments, see the Notes to the Consolidated Financial Statements section, Note (35).
Founded in 1972, SAP today is the world’s leader in application and analytics software for enterprises in terms of market share and the market leader in mobile enterprise management. Further, SAP is the enterprise cloud company with the greatest number of users and the fastest-growing major database company. Our continued growth over more than four decades is attributable to relentless innovation, a diverse portfolio, and our ability to anticipate ever-changing customer requirements. With more than 282,000 customers in over 180 countries, the SAP Group includes subsidiaries in all major countries and employs more than 74,400 people.
Our company’s culture puts our customers’ success at the center of everything we do. With Run Simple as our operating principle, we focus on helping our customers master complexity and run their businesses better, which is the most intractable challenge facing business today.
SAP is headquartered in Walldorf, Germany; our legal corporate name is SAP SE. The corporation is listed on the Frankfurt Stock Exchange as well as several regional stock exchanges in Germany and the New York Stock Exchange in the United States. At the end of 2014, our market capitalization was €71.6 billion. SAP is a member of Germany’s DAX, the Dow Jones EURO STOXX 50, and the Dow Jones Sustainability index.
Overview of the SAP Group
57Overview of the SAP Group
Profitability: SAP expects full-year 2015 non-IFRS operating profit to be in a range of €5.6 billion to €5.9 billion at constant currencies (2014: €5.64 billion). We expect non-IFRS operating profit in a range of €6.3 billion to €7.0 billion in 2017 and in a range of €8 billion to €9 billion in 2020.
Customer loyalty: SAP has used Customer Net Promoter Score (NPS) as a key performance indicator to measure customer loyalty since 2012. As we gather experience with the metric and as our business evolves, we expanded our customer base when conducting the 2014 assessment to better reflect our business completely. In addition to our on-premise customers, in 2014, for the first time we included Ariba, SuccessFactors, and Sybase customers in the survey. Therefore, the 2014 Customer NPS score is not fully comparable to the prior year’s score.
In 2014, we achieved a global Customer NPS of 19.1% (2013: 12.1%). This very positive score exceeded our 2014 target of 16%. We aim to achieve a Customer NPS score of 24% in 2015.
Employee engagement: We use the employee engagement index to measure motivation and loyalty of our employees, how proud they are of our company, and how strongly they identify with SAP. We saw a solid increase in our score in 2014 (2014: 79%) compared to 2013 (2013: 77%) and remain committed to achieving a score of 82% in 2015.
OUR VISION AND MISSIONOur vision is to help the world run better and improve people’s lives. Our mission is to help our customers run at their best. To fulfill our mission, we apply our Run Simple operating principle to help customers run their businesses simpler and master complexity, which is the most intractable challenge businesses face today. We do this by delivering technology innovations that we believe address the challenges of today and tomorrow without disrupting our customers’ business operations.
For more than 40 years, we have managed highly advanced, mission-critical business processes that enable entire industries. We continue to deliver sophisticated solutions for 25 industries and 12 lines of business in a simple manner. It is our challenge to do the most sophisticated things for our customers, yet in simple ways.
OUR GOALS FOR SUSTAINED BUSINESS SUCCESSWe have strong ambitions for sustainable business success, both for our company and for our customers. We believe the most important indicators to measure this success comprise both financial and non-financial indicators: growth, profitability, customer loyalty, and employee engagement.
Growth: SAP uses various revenue metrics to measure growth. We expect full-year 2015 non-IFRS cloud subscriptions and support revenue to be in a range of €1.95 billion to €2.05 billion at constant currencies (2014: €1.10 billion). Further, we expect full-year 2015 non-IFRS cloud and software revenue to increase by 8% to 10% at constant currencies (2014: €14.33 billion). Looking beyond 2015, we have updated our 2017 ambition. By 2017, SAP’s rapidly growing cloud subscriptions and support revenue is expected to be close to software license revenue and is expected to exceed software license revenue in 2018. In 2017, we expect non-IFRS cloud subscriptions and support revenue to reach a range of €3.5 billion to €3.6 billion in 2017. Non-IFRS total revenue is expected to reach €21 billion to €22 billion in 2017. Further, we have also introduced high-level 2020 ambitions with 2020 non-IFRS cloud subscriptions and support revenue expected to reach €7.5 billion to €8.0 billion and total revenue is expected to be in a range of €26 billion to €28 billion.
Strategy and Business Model
58 Combined Management Report

We will focus on three key initiatives to deliver on our commitment to Run Simple:
Simplify consumption: We continue to streamline and simplify consumption of our portfolio of products. Our focus will remain on solutions specific to 25 industries and 12 lines of business. We will support our customers with a mix of public cloud, managed cloud, and on-premise capabilities through a world-class platform based on SAP HANA.
Simplify business processes: At the foundation of our innovation and strategy is SAP HANA. With SAP HANA as the common platform, we help our customers dramatically accelerate the speed of their business by radically simplifying their IT stack and enabling smarter and faster business processes.
Simplify user experience: With SAP Fiori we provide a holistic and consistent consumer grade user experience based on modern design principles and across lines of business, tasks, and devices.
We see enormous potential to increase our share of our customers’ overall IT spend. Through simplification, customers can dramatically reduce their expenditures on hardware and services, shift the savings to innovation, transform their businesses, and create positive societal impact.
We aim to better innovate and grow by: – Building simple, yet sophisticated applications by lines of
business and industries that deliver superior customer experience, coverage of end-to-end processes, and insights
– Continuing to invest in SAP HANA as an industry-leading platform for innovation and promoting SAP HANA Cloud Platform as a world-class platform as a service (PaaS)
– Continuing to be the world’s leading business network, connecting businesses, devices, and people to drive unparalleled collaboration and productivity
These four goals affirm our commitment to innovation and sustainability, and help us deliver on our vision and mission.
In addition to primary key performance indicators (KPIs), which directly measure our performance on our four goals, we manage a number of secondary performance indicators, which influence the primary KPIs in a variety of ways. Our integrated report seeks to clarify some of those relationships, for example, the link between our energy consumption and our profitability.
Our main goals are presented with more detail throughout the report.
For more information on our strategic goals, see the Performance Management System; Expected Developments and Opportunities; Customers; and Employees and Social Performance sections.
OUR STRATEGY: THE CLOUD COMPANY POWERED BY SAP HANAAs described above, complexity has become a significant challenge to business. With our history and focus on software innovation, we believe SAP is uniquely positioned to tackle the challenge of complexity for our customers by enabling them to Run Simple. We are realizing the potential of Run Simple through our strategy to become “THE cloud company powered by SAP HANA.” Together, SAP HANA and SAP Cloud powered by SAP HANA equal Run Simple.
SAP HANA simplifies IT landscapes, technology, and business models. By moving most of our applications and analytics to the SAP HANA platform, we are simplifying the solutions we can offer our customers. We further simplify how customers consume our solutions by bringing them onto our cloud – SAP Cloud powered by SAP HANA. The cloud can offer a better user experience while radically simplifying business processes.
59Strategy and Business Model
Playing this role for our customers requires us to deploy several key types of capital. First, we rely on financial capital provided by our investors. But what truly enables our success is the intellectual and social capital of our employees. They are the gateway to our knowledge, expertise, and business relationships. For this reason, engaged, highly skilled, and agile employees are central to our business model and success.
Our direct sales organizations drive most business development. Sales go-to-market strategies are established at the global level, and then adapted and executed by regional subsidiaries. Our customer-facing employees, in close collaboration with sales support and marketing, drive demand, build pipeline, and enhance relationships with customers within our target industries. Our marketing efforts cover large enterprises as well as small and midsize enterprises. We believe our broad portfolio of solutions and services enables us to meet the needs of customers of all sizes and across industries. We will amplify our efforts in the digital channel through additional e-commerce and digitally native offerings that further enable a low-touch or no-touch customer journey.
Our extensive ecosystem provides scalability to meet the demand for SAP innovation and provide customers with a wide selection of third-party competencies. We have developed an independent sales and support force through independent value-added resellers. We have also established partnerships with hardware and software suppliers, systems integrators, and third-party consultants. For more information, see the Partner Ecosystem section.
For example, by enhancing their efficiency, we help customers cope with resource scarcity and reduce their energy usage and emissions. By partnering with our banking customers, we help them bring banking services to the “unbanked,” thereby creating opportunity for people seeking to enter the modern economy. Through software focused on healthcare, education, and public services, we help create a positive social impact by enhancing people’s quality of life. In all of these ways, our solutions are advancing our vision to help the world run better and improve people’s lives.
OUR BUSINESS MODELOur vision and mission also unlock our ability to create positive economic, environmental, and social impact. As we help our customers tackle complexity and run at their best, they contribute to the world’s economies, create jobs, and unleash the potential of their employees. As we help them become more efficient, they can mitigate their environmental footprint. And as we help them run their businesses simpler, they free up space for innovation, creating opportunities for people and communities.
To realize our vision, SAP provides business solutions to customers throughout the world based on our deep expertise in business processes across industries. Through our customers – which represent 98% of the top 100 most valued brands in the world, according to the annual ranking from Interbrand – we can increase our ability to create value.
60 Combined Management Report

We also apply our expertise in business processes across industries to direct our innovations to the world’s greatest challenges, such as the social and environmental strains posed by a rapidly expanding global middle class. Our goal is to create long-term value by providing solutions that not only address the current challenges faced by our customers, but also those of the future. In this way, we see our role moving beyond the creation of new and efficient solutions: We want to fundamentally help change how people use software, conduct business, and live their lives. This objective underscores how SAP can create its greatest impact through the use of our solutions by more than 282,000 customers worldwide.
At SAP and within our ecosystem, we support job creation and economic prosperity through demand for highly qualified workers to develop, sell, implement, and enhance our software for our customers. Our solutions also enable customers to provide greater learning and talent development opportunities for their employees. In addition, SAP solutions, such as those for manufacturing, are designed not only to ensure health and safety during the production process, but also to increase the quality of the resulting consumer products, which impact millions of people throughout the world.
Historically, our sales model was focused on charging a one-time, upfront fee for a perpetual license to our software that was typically installed at the customer site. In addition, the customer usually concluded a maintenance contract that covered support and software updates. As we have seen customer preferences evolve, we are increasingly delivering our solutions in the cloud, which we believe is a simple and efficient software consumption model. Our cloud solutions are offered through a subscription-based software-as-a-service (SaaS) model. Depending on the solutions offered, the customer pays either usage-based or periodic fees to use our software. This software is installed at an SAP or an SAP partner location, and the customer accesses the software over the Internet.
To help companies invest in SAP solutions and the associated services and hardware, the SAP Financing service offers customers payment plans optimized for maximum economic benefit. It can help preserve liquidity, provide an alternative to credit from customers’ existing banking relationships, and balance their budgetary priorities – while giving them the flexibility to choose the best possible solution.
By executing on our strategy, SAP contributes to the creation of holistic, long-term value for society in a number of ways. SAP’s greatest strength in making environmental impact comes through the solutions we deliver. For example, our software enables our customers to have more efficient and sustainable supply chains or provide greater transparency of energy consumption and emissions.
61Strategy and Business Model

SAP HANANothing signifies the changes we are making at SAP – and for our customers – more than SAP HANA. The platform holds the power to simplify both the user experience and the overall IT landscape, creating a smaller data footprint, increased system throughput, and easier data processing and operation. For this reason, we have evolved SAP HANA from a database to a full business platform that will act as the basis for our products going forward.
The SAP HANA platform combines database, data processing, and application platform capabilities in-memory. By providing advanced capabilities – such as predictive text analytics, spatial processing, and data virtualization – on the same architecture, it further simplifies application development and processing across Big Data sources and structures.
To take our capabilities to the next level, we built the open SAP HANA Cloud Platform, which is the embodiment of our SAP Cloud powered by SAP HANA strategy. The cloud platform enables ease and flexibility in building, extending, and integrating business applications – available to all SAP partners, customers, and third-party developers.
Realizing that one size does not fit all, we are providing a bridge for our customers in the transition to the cloud. We also offer to manage mission-critical software such as SAP Business Suite and SAP Business Warehouse as well as custom SAP HANA applications in our cloud data centers.
Our overarching goal is to create the broadest integration offering in the industry where customers can connect SAP and third-party software across heterogeneous environments by leveraging application lifecycle management to reduce IT complexity. Our customers can enhance the power of an
STEERING OUR CUSTOMERS THROUGH UNPRECEDENTED CHANGEThe world is operating in a time of accelerated change that has created new complexity, challenges, and opportunities for both our customers and SAP. Digitalization represents more than a trend but a paradigm shift, one that is shaping whole industries, business models, and sources of competitive advantage.
Software is at the heart of this transformation – for many organizations, it is the new differentiator. We recognize that enterprise software today must do far more than run business processes. It is an enabler for navigating complexity and unlocking innovation. Throughout our history, we have helped our customers manage other major paradigm shifts impacting their business, from the massive expansion of the Internet to globalization. Today, we are supporting their transition to a cloud-based world, as increasingly complex business problems demand simple solutions.
We help customers Run Simple by innovating with the SAP HANA platform as our foundation. This strategy combines ease of use and flexibility with sizeable computing power. Through the capabilities of SAP HANA, we can now enable a real-time enterprise; we can leverage Big Data to achieve deeper insight; and we can empower users through the ease of mobile apps, so that people can access what they need securely and flexibly.
These developments – similar to packaged software in the 1980s and client/server architecture in the 1990s – signal a new wave of innovation at SAP. Wherever they are on their journey, we are helping our customers reinvent how they do business while making the transition seamless and providing a holistic and consistent user experience. As we aim to become “THE cloud company powered by SAP HANA,” we are going far beyond incremental change to achieve radical simplification – enabling our customers to stay ahead of trends, make better decisions faster, and propel innovation.
Products, Research & Development, and Services
62 Combined Management Report
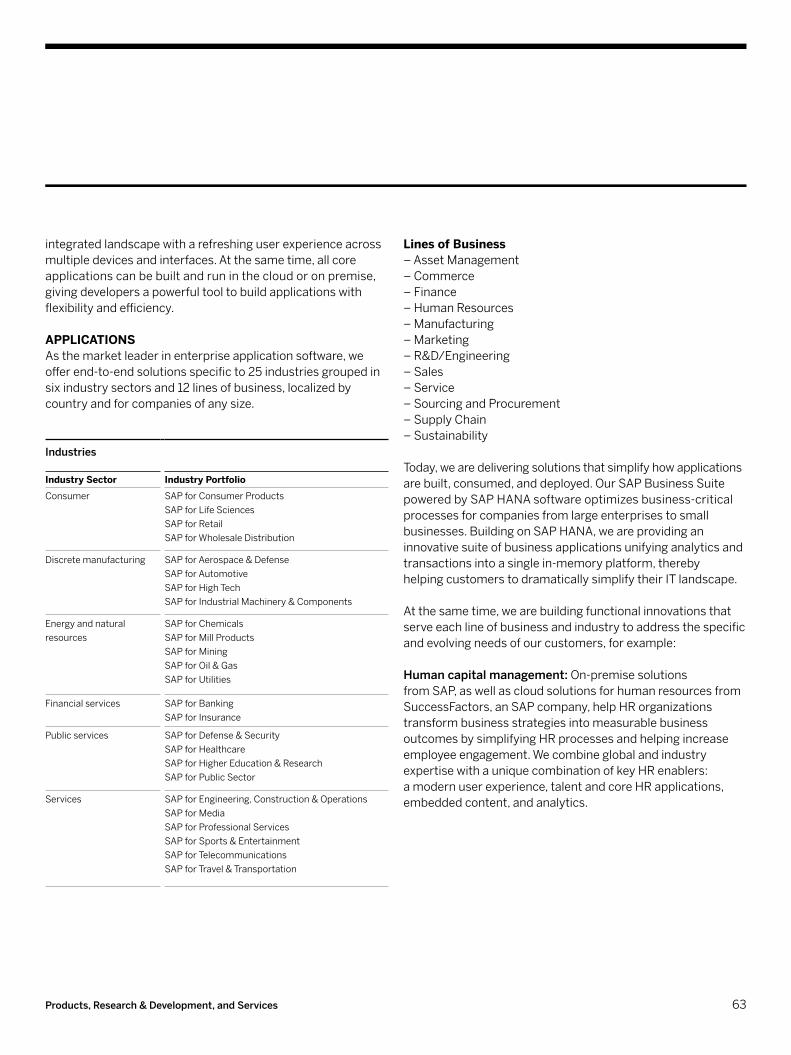
integrated landscape with a refreshing user experience across multiple devices and interfaces. At the same time, all core applications can be built and run in the cloud or on premise, giving developers a powerful tool to build applications with flexibility and efficiency.
APPLICATIONSAs the market leader in enterprise application software, we offer end-to-end solutions specific to 25 industries grouped in six industry sectors and 12 lines of business, localized by country and for companies of any size.
Industries
Industry Sector Industry Portfolio
Consumer SAP for Consumer Products SAP for Life SciencesSAP for RetailSAP for Wholesale Distribution
Discrete manufacturing SAP for Aerospace & DefenseSAP for AutomotiveSAP for High TechSAP for Industrial Machinery & Components
Energy and natural resources
SAP for ChemicalsSAP for Mill Products SAP for MiningSAP for Oil & GasSAP for Utilities
Financial services SAP for BankingSAP for Insurance
Public services SAP for Defense & SecuritySAP for HealthcareSAP for Higher Education & ResearchSAP for Public Sector
Services SAP for Engineering, Construction & OperationsSAP for MediaSAP for Professional ServicesSAP for Sports & EntertainmentSAP for TelecommunicationsSAP for Travel & Transportation
Lines of Business– Asset Management – Commerce– Finance – Human Resources – Manufacturing – Marketing – R&D/Engineering – Sales – Service – Sourcing and Procurement – Supply Chain– Sustainability
Today, we are delivering solutions that simplify how applications are built, consumed, and deployed. Our SAP Business Suite powered by SAP HANA software optimizes business-critical processes for companies from large enterprises to small businesses. Building on SAP HANA, we are providing an innovative suite of business applications unifying analytics and transactions into a single in-memory platform, thereby helping customers to dramatically simplify their IT landscape.
At the same time, we are building functional innovations that serve each line of business and industry to address the specific and evolving needs of our customers, for example:
Human capital management: On-premise solutions from SAP, as well as cloud solutions for human resources from SuccessFactors, an SAP company, help HR organizations transform business strategies into measurable business outcomes by simplifying HR processes and helping increase employee engagement. We combine global and industry expertise with a unique combination of key HR enablers: a modern user experience, talent and core HR applications, embedded content, and analytics.
63Products, Research & Development, and Services

Regardless of how our customers consume our software, we are building applications using the SAP Fiori user experience (UX), which delivers a personalized, responsive, and simple UX. Applying modern and consistent design principles, SAP Fiori is the new face of SAP software. We also offer a portfolio of UX services, including design, rapid deployment, and custom development, to enhance customer engagement.
BUSINESS NETWORKThe cloud has profoundly changed the way people interact, and this impact will only grow as enterprises connect and collaborate in new ways with their global networks of customers and partners. We believe these new networks are transforming how companies do business, and we are helping to lead this wave of innovation.
With our sourcing, procurement, and travel and expense management solutions from SAP; Ariba, an SAP company; Fieldglass; and Concur Technologies, we now run the world’s largest business network, connecting more than 1.7 million companies. SAP internal analysis shows that businesses conduct more than US$700 billion in commerce on the network annually, and it holds the potential to alter the B2B landscape. Procurement leaders can achieve cost savings, integrate sourcing and procurement operations, improve supplier collaboration, and realize purchasing compliance. Combining our innovations and core applications, the network is helping companies interact outside of silos and gain far greater visibility into different parts of their operations.
By digitizing business transactions and facilitating the sharing of information across global value chains, we are providing customers with a greater ability to connect with others and take action. As a result, we are facilitating far more than simple transactions but helping companies tap into information and insights, incorporate them into their business processes, and make better real-time decisions. Customers can easily identify and connect with high-quality suppliers, collaboratively enhance supplier performance, transact seamlessly with intelligent rules, and drive additional savings through dynamic discounting.
Customer engagement and commerce: Solutions from SAP and software from hybris, an SAP company, serving the commerce, marketing, sales, and service lines of business, enable business-to-business (B2B) and business-to-consumer (B2C) companies everywhere to provide real-time, consistent, contextual, and relevant experiences to their customers regardless of channel or device. SAP solutions for customer engagement and commerce are a direct response to the fact that the traditional focus of customer relationship management (mostly sales force automation) is no longer enough to satisfy the demands of a customer-driven market.
Finance: In 2014, we launched the SAP Simple Finance solution to address the critical need for flexibility in the most complex finance processes and IT landscapes. Created through close collaboration with our customers, SAP Simple Finance is a comprehensive solution of finance applications that decreases runtime for financial analysis, delivers instant insight, and is easy to use and consume. Continuing to leverage SAP HANA as a driver of simplicity, we launched SAP S/4HANA (SAP Business Suite 4 SAP HANA) in early 2015, a next-generation and innovative business suite that will redefine business processes and drive business value for our customers. FREEDOM, FLEXIBILITY, AND ELEGANT DESIGNAs our customers adapt to shifting business conditions, we also provide them with the freedom and flexibility of our mobile solutions. These solutions enable companies to better serve customers and provide employees with secure access to important tools and data anywhere, anytime – using their mobile devices. Mobile solutions from SAP allow our customers to:– Innovate rapidly to deliver user-centric capabilities for
employees, consumers, and partners – Lower their total cost of ownership by streamlining
operations and processes– Protect themselves against security risks and challenges
at the device, app, and content levels
64 Combined Management Report

RESEARCH AND DEVELOPMENTFrom the earliest days of SAP, we have worked diligently to stay ahead of trends and develop new solutions to meet the challenges faced by our customers and those they serve. Our research and development (R&D) is a global effort that centers on bringing together the creative ideas and talents of our customers as well as valued partners from industry, technology, the public sector, and academia. Our focus on co-innovation ensures that we keep up with groundbreaking research and ultimately turn it into solutions that create a real-world impact.
In 2014, we made organizational changes to enhance collaboration between our R&D teams, thereby speeding up innovation. Rather than operating independently, research and development is now embedded in our development organization, so that the exploration and execution of ideas are happening side by side, with each informing the other.
Our product development organization is truly global, with the majority of our R&D teams located in 14 SAP Labs locations in 12 countries. Research teams are also based throughout the world and span a network across multiple locations.
We follow a dual and complementary research and innovation approach. First, topic-focused research teams within existing development units drive innovation projects. These teams focus on improving existing products as well as delivering short-term innovation with a time horizon of up to two years.
Our vision for the network extends to managing all of a company’s business expenditures. Therefore, we have moved from a procurement network to a business network to a network of networks that includes all types of parties: suppliers, B2B partners, logistics providers, financial service providers, and individuals, as well as travel agents.
ANALYTICSSAP HANA has increased the efficiency with which our customers can use analytics to drive business decisions. SAP HANA is able to bridge the historical divide between transactions and analytics that had hindered real-time decision making. Now transactions and analytics can be combined into a single in-memory platform, allowing customers to access a “single source of truth” for real-time planning, execution, reporting, and analysis on very large volumes of data.
With the amount of data growing exponentially, our software is helping customers have access to immediate, actionable intelligence, thereby simplifying their business processes. They can retrieve available data in real time. Our analytics offerings deliver outstanding business value by providing insights to better manage every aspect of the enterprise – from integrated planning and metrics monitoring to risk and compliance.
Namely, analytics solutions from SAP comprise:– Enterprise business intelligence: Engaging companies more
fully with information, with solutions that enable users to add new information and see updates in real time
– Agile visualization: Bringing data to life in real time through intuitive visualizations
– Advanced analytics: Combining the power of predictive processing with intuitive modeling and advanced data visualization
65Products, Research & Development, and Services

At the end of 2014, our total full-time equivalent (FTE) count in development work was 18,908 (2013: 17,804). Measured in FTEs, our R&D headcount was 25% of total headcount (2013: 27%). Total R&D expense not only includes our own personnel costs but also the external cost of works and services from the providers and cooperation partners we work with to deliver and enhance our products. We also incur external costs for translating, localizing, and testing products, for obtaining certification for them in different markets, patent attorney services and fees, strategy consulting, and the professional development of our R&D workforce.
Patents As a market leader in enterprise applications, SAP actively seeks intellectual property protection for innovations and proprietary information. Our software innovations continue to strengthen our market position in enterprise solutions and services. Our investment in R&D has resulted in numerous patents. SAP holds a total of more than 6,800 validated patents worldwide. Of these, 916 were granted and validated in 2014.
Second, we established a dedicated central unit that pursues both short-term and long-term strategic innovation. This unit supports projects with a time horizon of two to five years by providing a protected environment for business ideas and focusing on a limited number of new solutions. It also develops the future generation of high-growth opportunities in areas such as the Internet of Things or personalized medicine. With a time horizon of five to eight years, these projects focus on technologies, applications and new business models that do not fit the product portfolio but hold the potential to open up new opportunities, markets, and user groups for SAP.
SAP Innovation Center locations, based in Potsdam and Walldorf, are part of this organization. They combine the creativity and agility of a startup culture with the backbone of a world market leader in enterprise applications. As the future end users of our innovations, our customers and partners are involved during the entire runtime of projects and come from industries and companies of all sizes, from longstanding SAP customers to early stage startups with no current SAP footprint. With a focus on the SAP HANA platform and our cloud and mobile solutions, these innovation centers strive to open up new application areas for SAP software, ranging from personalized cancer therapy to smart services that leverage the connectivity of things with the Internet.
Regardless of the setting, SAP embeds methods such as design thinking into all projects and researches innovative approaches to generate and evaluate applications, technologies, and business ideas.
R&D Investment SAP’s strong commitment to R&D is reflected in our expenditures: In 2014, we increased our R&D expense (IFRS) slightly by €49 million, to €2,331 million (2013: €2,282 million). We spent 13.3% of total revenue on R&D in 2014 (2013: 13.6%). Our non-IFRS R&D expense as a portion of total operating expenses declined slightly from 18.9% to 18.5% year-over-year.
Research and Development (IFRS)€ millions | change since previous year
1,729
+9%
1,935
+12%
2,261
+17%
2,282
+1%
2,331+2%
2010 2011 2012 2013 2014
66 Combined Management Report

Our new SAP ONE Service approach goes far beyond the traditional consulting model. We combine strong engineering skills with experienced program management and the domain capabilities of consulting. In a cloud-based environment, this framework is critical to support our customers in building and running end-to-end solutions for the future, mapping their technology strategy to their business strategy, and prioritizing the steps to migrate to SAP HANA and the cloud.
An important element of our organization is education. Each year, more than 500,000 individuals are trained by SAP Education, making it one of the largest IT training organizations in the world. In 2014, we updated SAP Learning Hub, providing customers with an even easier-to-use, cloud-based platform that allows for flexible, individualized training. Winner of the prestigious Technology Services Industry Association (TSIA) Star Award in the fall of 2014, this platform solution further simplifies the user experience of SAP software.
SAP has been a frontrunner in the adoption of Massive Open Online Courses (MOOCs) for use in an enterprise context. openSAP is SAP’s enterprise MOOC provider delivering 18 courses through the end of 2014 free of charge on topics such as SAP HANA, cloud, user experience, sustainability, and business innovation. openSAP has reached over 500,000 course enrollments with more than 170,000 individual learners.
In addition, the SAP University Alliances program brings SAP to over 2,000 universities in more than 80 countries, and aims to develop highly-qualified graduates with critical skills for the 21st-century workforce. In partnership with SAP’s six University Competence Centers around the world, universities gain access to an ever-expanding range of SAP software and curriculums, enabling faculty to help students better connect business and IT concepts to practice.
While our intellectual property is important to our success, we believe our business as a whole is not dependent on any particular patent.
SERVICE AND SUPPORTMany of our customers are experiencing profound shifts in how they use technology and run their businesses. Our service and support professionals focus on helping them navigate these changes with greater speed, efficiency, and impact. A prime example is our recognition that customers have different needs and goals to innovate and make use of the cloud, while preserving their investment to date. Regardless of their path, we have a broad offering to chart their course. Our teams regularly partner with customers to create a road map, removing obstacles and building a business case for migration. In 2014, we began a significant transformation of our professional consulting service and support teams, bringing them together into one organization called Global Service & Support. Our goal with the SAP ONE Support program is to provide customers with an integrated support experience regardless of whether their landscape is on premise, in the cloud, or a hybrid of the two. Customers also benefit from a simplified experience with SAP with the next generation of premium support engagements.
In addition, SAP ONE Support is designed to enhance SAP Enterprise Support services to simplify the customer experience. This includes a multitude of aspects, such as removing underlying complexity typically associated in managing end-to-end support across hybrid landscapes, helping customers choose how to migrate to the cloud, and driving innovation while building on existing on-premise investments. We simplify customer interactions with us through a single touch point for all services across the entire solution landscape, creating a unified experience across multiple channels as well as expanding opportunities for co-innovation.
67Products, Research & Development, and Services

For more information about our acquisitions, see the Notes to the Consolidated Financial Statements section, Note (4).
VENTURE ACTIVITIESThrough Sapphire Ventures (formerly called SAP Ventures), which comprises our consolidated venture investment funds, SAP supports investments in renowned entrepreneurs worldwide to build industry-leading businesses. Sapphire Ventures has invested in more than 125 companies on five continents for more than 18 years. Some of these companies have been acquired or have become publicly listed companies.
Sapphire Ventures invests in the next generation of global category leaders as well as early-stage venture capital funds in enterprise and consumer technology. Specifically, Sapphire Ventures pursues opportunities in which it can help fuel growth by adding expertise, relationships, geographic reach, and capital. It invests globally with a particular focus on emerging companies in Europe, Israel, and the United States, as well as in Brazil, China, and India.
SAP’s total commitment to Sapphire Ventures is US$1.4 billion for use over the lifetime of its respective funds. Investments through the funds are currently ongoing.
For more information about our consolidated investment funds, see the Notes to the Consolidated Financial Statements section, Note (35).
SAP views acquisitions as strategic investments in people, technologies, and growth. In 2014, SAP focused on acquisitions that would enhance its position as a cloud and business network company and advance its mission of helping customers Run Simple.
NEW ACQUISITIONS– In May, SAP acquired Fieldglass, a leading provider of cloud
solutions for procuring and managing contingent labor and third-party services. Combined with the collaborative, network-based procurement capabilities of Ariba and the human resources expertise of SuccessFactors, the Fieldglass acquisition uniquely positions SAP to deliver a platform for businesses to manage their entire workforce – both temporary and permanent staff.
– In June, SAP acquired SeeWhy, a leading provider of cloud-based behavioral target marketing solutions to help businesses increase customer engagement and drive revenues.
– In December, SAP acquired Concur Technologies. With more than 23,000 customers and 25 million active users in over 150 countries, Concur is the leader in the multibillion dollar travel and expense management field. With the addition of Concur’s corporate travel ecosystem to the Ariba and Fieldglass networks, our business network – the world’s largest – already transacts more than US$700 billion in annual transaction volumes today, according to internal analyses. In addition, this acquisition provides an opportunity for us to power transactions that drive more than US$10 trillion of global spend annually.
Organic growth remains the primary driver of our strategy. We will continue to invest in our own product development and technology innovation, improving the speed, number of projects, and innovations brought to market. We will also continue to acquire targeted, strategic, and “fill-in” technology and software to add to our broad solution offerings and improve coverage in key strategic markets. By doing so, we will strive to best support our customers’ needs for simplified operations.
Acquisitions
68 Combined Management Report

– Developing solutions that complement SAP software: SAP has a vibrant community of partners that develop software on SAP platforms and create complementary products that integrate with our applications. This community is vital in providing our customers with a broad portfolio of industry-specific solutions that allow customers to meet the demands of their markets. At the same time, we maintain strategic relationships with industry-leading technology, software, and services firms. For example, we engage with the partner community in the development of new and simpler products. Our SAP PartnerEdge program for Application Development, with more than 850 active members, enables partners to build complementary solutions on top of our technology platforms – and quickly monetize those solutions. Partners can also embed SAP technology within their offerings under an original equipment manufacturer (OEM) licensing agreement. We work actively with partners to enable new and innovative delivery and go-to-market approaches to support customer needs and preferences. Aside from these formal partnerships, companies within our ecosystem can also certify their integration with SAP technology through the SAP Integration and Certification Center.
– Providing implementation and other services: SAP has strong partnerships with a broad network of IT professional services firms that provide consulting, system integration, hosting, education, and more. These companies are critical to helping our mutual customers simplify the implementation and deployment of SAP solutions. In response to growing customer demand for flexible deployment and purchase options, we work closely with the partner ecosystem to offer innovative cloud-based offerings and services to support different business models.
HELPING PARTNERS RUN SIMPLEWe engage with an extensive partner ecosystem to help customers around the world overcome complexity, create value, innovate, and thrive. Our partners help expand our reach to thousands more companies and millions more users. With more than 12,800 partners at the end of 2014, our partner ecosystem remains an important element in our success and we continue to create innovative ways for partners of all kinds to collaborate with us for mutual success.
Partners operate independently of SAP, yet complement our business in one or more of the following ways:– Reselling SAP software and cloud services: Our partners
help companies of all sizes identify, purchase, and deploy the ideal solutions for their businesses. Our value-added resellers (VARs) and multitier distribution channels offer local market and industry expertise that simplifies the customer's journey to the right solution. We closely align our sales efforts with those of our partners through well-defined rules of engagement that outline each organization’s roles and responsibilities. In most markets, partners are the primary sales channel to address the needs of small and midsize enterprises (SMEs). Our company also sells selected products through our own online channel, SAP Store, which includes complementary solutions developed by our partners. In addition, we resell applicable partner solutions as part of our solution extensions portfolio. These partner-developed solutions are tested, validated, and approved by our development organizations, and supported by SAP.
Partner Ecosystem
69Partner Ecosystem

To help our partner ecosystem Run Simple and achieve its business goals, we provide an extensive array of business support offerings. For example, our flagship partner program, SAP PartnerEdge, offers a tiered engagement model that provides marketing, sales, and technical enablement, as well as education, deal support, and other resources. In addition, we provide selected global partners with dedicated teams that work closely with them to proactively engage in specialized business development and technical initiatives. Many of our partners participate in SAP Community Network, an online community that facilitates networking and information sharing. In addition, many also participate in the SAP Listens program, which surveys partners for feedback and addresses partner issues.
Our partner ecosystem is rapidly embracing our cloud, mobile, and in-memory computing offerings, including SAP HANA, with more than 3,200 partners or startups already building on our platform. This ecosystem remains a key component in our efforts to simplify our customers’ technology landscapes and improve the lives of people everywhere.
70 Combined Management Report

Customers
Our increased NPS reflects our continued commitment to listening to our customers and responding to their needs. Our goal is to best support both their success and the success of SAP. For example, we conducted global in-person and online focus groups with customers to gain additional insights into “business benefits” themes identified through the surveys. These sessions have enabled us to identify the underlying reasons behind issues and focus more precisely on where we need to make improvements.
For more information on the Customer NPS, see the Performance Management System and the Notes to Social Performance Reporting sections of the SAP Integrated Report 2014 online.
STRONG CUSTOMER DEMANDIn 2014, we saw customers embrace our strategy by licensing or subscribing to the full range of the SAP portfolio – from comprehensive solutions for large enterprises to the latest mobile apps.
Some examples by region include the following customers:
AMERICAS REGION– Antofagasta Minerals, a Chilean-based copper mining
group, selected SAP solutions – including SAP HANA and SuccessFactors HR solutions – to manage its operations on a single platform and help support innovation through Big Data analytics as well as cloud and mobile solutions.
– Bombardier Recreational Products, a Canadian-based global leader in motorized recreational vehicles and powersports engines, selected SAP solutions, including SuccessFactors Employee Central, to optimize its HR solutions and delivery.
– The National Hockey League (NHL), composed of 30 member clubs in the United States and Canada, plans to use the power of SAP HANA to create new statistics that increase fan engagement. This content is expected to be served to fans through a variety of online, television, and mobile media channels.
When our customers reduce complexity and Run Simple, they can create more sustainable business models – which, in turn, helps us ensure our own long-term viability. That is why we strive to provide more than just software. We continually engage with our customers at every stage – not only during the sales and implementation phases, but also through the ongoing sharing of best practices and innovations.
One example of this strategy is our Customer Engagement Initiative. This program offers customers early insight into certain aspects of potential future products and product enhancements so they can provide early input and feedback in the development cycle. In addition, it offers customers the opportunity to network on topics of mutual interest. These networking opportunities take place at a variety of global events, including the SAPPHIRE NOW and SAP TechEd conferences, as well as virtual events.
CUSTOMER LOYALTYWe gauge customer loyalty through an annual survey that measures our Customer Net Promoter Score (NPS). Customer loyalty is one of our four enterprise-wide strategic goals, along with growth, profitability, and employee engagement.
SAP has used Customer NPS as a key performance indicator since 2012. As we gather experience with the metric and as our business evolves, we expanded our customer base when conducting the 2014 assessment to better reflect our business completely. In addition to our on-premise customers, in 2014 for the first time we included Ariba, SuccessFactors, and Sybase customers in the survey. Therefore, the 2014 Customer NPS score is not fully comparable to the prior year’s score.
In 2014, we achieved a global Customer NPS of 19.1%. This very positive score exceeded our 2014 target of 16%. We aim to achieve a Customer NPS score of 24% in 2015.
71Customers

– Mitsui Knowledge Industry (MKI), an IT services provider in Japan, selected the SAP HANA Enterprise Cloud service. In addition to its own professional data analysis service, MKI now aims to provide a market forecasting service for various commodities through a highly available and efficient enterprise cloud infrastructure.
EUROPE, MIDDLE EAST, AND AFRICA (EMEA) REGION– The Department of Zakat and Income Tax (DZIT), reporting
to the Ministry of Finance of the Kingdom of Saudi Arabia, selected the SAP Fraud Management analytic application powered by SAP HANA with the goal of reducing fraud exposure. With the help of SAP, DZIT looks to replace manual processes and increase the revenue for the Kingdom of Saudi Arabia.
– The Kenya Electricity Transmission Company has selected the SAP HANA platform for innovation and the SAP Fiori user experience to simplify its user interface. With these solutions, Ketraco expects to increase its capacity to provide a premium customer experience based on real-time data and analysis.
– Spire Healthcare, a provider of private healthcare in the United Kingdom, selected SAP HANA with the aim of improving its patient overall experience.
– Telefónica, an international telecommunications company based in Spain, with more than 120,000 employees selected SuccessFactors HCM Suite as its solution to provide employees with an optimal workplace, demonstrate a commitment to talent, and ensure the best opportunities for professional development.
– Euromaster, a leading integrated tire service and car maintenance network in Europe, chose SAP Business Suite powered by SAP HANA to help handle its finance and supply chain processes. The company hopes to improve efficiency, optimize network coverage and make its business processes more efficient. Euromaster chose SAP software as SAP was the only company offering a concrete industry-specific solution for retail and wholesale using the power of SAP HANA.
– Banco Central de Costa Rica selected SAP ERP, SuccessFactors, and other software to obtain an integrated business platform for all administrative, financial, and accounting functions. The Central Bank of Costa Rica plans to create a centralized and integrated business information warehouse for efficient reporting and decision making.
– Ralph Lauren, one of the world’s most successful fashion brands, has chosen solutions from hybris and Ariba, both SAP companies, to pursue its growth objectives. Ralph Lauren will use hybris solutions to improve the consumer shopping experience through better omnichannel capabilities and Ariba’s global procurement network to reduce costs and enhance service quality.
ASIA PACIFIC JAPAN (APJ) REGION– AGL Corporate Services Pty, one of Australia’s leading
renewable energy companies, recently went live with SAP Fiori apps for purchase order approval and leave request approval. SAP Fiori helps AGL simplify business processes through an improved user interface and external access to workflow tasks.
– Infosys, a global leader in technology, consulting, outsourcing, and next-generation services has gone live with SAP Business Suite powered by SAP HANA. With SAP HANA, Infosys expects to accelerate its financial closing processes and progressively move more and more batch activities into a real-time environment.
– Singapore Health Services, one of the largest healthcare groups in Singapore, has selected Ariba solutions to replace its existing procurement platforms. Singapore Health Services expects to improve collaboration with vendors and standardize purchasing practices across its network.
– Tatung Group, a major computer and electronic home appliance company in Taiwan, has chosen SAP as its strategic partner for co-innovation and simplification of all business processes on SAP HANA. Over a five-year period, Tatung plans to implement multiple SAP solutions to transform its business, simplify operations, and become a leader in the “smart energy” industry.
72 Combined Management Report

Performance Management System
New and upsell bookings: For our cloud activities, we also look at new and upsell bookings. This measure reflects the committed order entry of a given period from new customers and from incremental purchases by existing customers for offerings that generate cloud subscription revenue. Thus, it is an indicator for cloud-related sales success in a period and for secured future cloud subscription revenue. We focus primarily on the average contract value variant of the new and upsell bookings measure that considers annualized amounts for multiyear contracts. Additionally, we monitor the total contract value variant of the new and upsell bookings measure that considers the total committed order entry amounts regardless of the contract durations. There are no comparable IFRS measures for these bookings metrics.
Operating profit (non-IFRS)/operating margin (non-IFRS): We use operating profit (non-IFRS)/operating margin (non-IFRS) and constant currency operating profit (non-IFRS)/operating margin (non-IFRS) to measure our overall operational process efficiency and overall business performance. Operating margin (non-IFRS) is the ratio of our operating profit (non-IFRS) to total revenue (non-IFRS), expressed as a percentage. See below for more information on the IFRS and non-IFRS measures we use.
Measures We Use to Manage Our Non-Operating Financial PerformanceWe use the following measures to manage our non-operating financial performance:
Financial income, net: This measure provides insight especially into the return on liquid assets and capital investments and the cost of borrowed funds. To manage our financial income, net, we focus on cash flow, the composition of our liquid asset and capital investment portfolio, and the average rate of interest at which assets are invested. We also monitor average outstanding borrowings and the associated finance costs.
We use various performance measures to help manage our performance with regard to our primary financial goals, which are growth and profitability, and our primary non-financial goals, which are customer loyalty and employee engagement. We view growth and profitability as indicators for our current performance, while customer loyalty and employee engagement are indicators for our future performance.
MEASURES WE USE TO MANAGE OUR FINANCIAL PERFORMANCE
Measures We Use to Manage Our Operating Financial PerformanceIn 2014, we used the following key measures to manage our operating financial performance:
Cloud subscriptions and support revenue (non-IFRS): This revenue driver comprises the main revenues of our fast-growing cloud business. We generate cloud subscriptions and support revenue (non-IFRS) when we provide software and the respective support for delivery in the cloud. We use the measure cloud subscriptions and support revenue both at actual currency and at constant currency.
Software and software-related service (SSRS) revenue (non-IFRS): We use SSRS revenue (non-IFRS) and constant currency SSRS revenue (non-IFRS) to measure our revenue growth. Our SSRS revenue includes cloud subscriptions and support revenue plus software and related support revenue. Cloud subscriptions and support revenue and software revenue are our key revenue drivers because they tend to affect our other revenue streams. Generally, customers that buy software licenses also enter into maintenance contracts, and these generate recurring software-related service revenue in the form of support revenue after the software sale. Maintenance contracts cover support services and software updates and enhancements. Software revenue as well as cloud subscriptions and support revenue also tend to stimulate service revenue from consulting and training sales.
73Performance Management System

after all expenditures required to maintain or expand our organic business have been paid off. This measure provides management with supplemental information to assess our liquidity needs. We calculate free cash flow as net cash from operating activities minus purchases (other than purchases made in connection with business combinations) of intangible assets and property, plant, and equipment.
MEASURES WE USE TO MANAGE OUR NON-FINANCIAL PERFORMANCEIn 2014, we used the following key measures to manage our non-financial performance in the areas of employee engagement and customer loyalty:
Employee Engagement Index: We use the employee engagement index to measure the motivation and loyalty of our employees, how proud they are of our company, and how strongly they identify with SAP. The index is derived from surveys conducted among our employees. With this measure, we recognize that we can achieve our growth strategy with engaged employees only.
Customer Net Promoter Score (NPS): This score measures the willingness of our customers to recommend or promote SAP to others. It is derived from our customer survey. Conducted each year, this survey identifies, on a scale of 0–10, whether a customer is loyal and likely to recommend SAP to friends or colleagues, is neutral, or is unhappy. We introduced this measure in 2012, as we are convinced that we can achieve our financial goals only when our customers are loyal to, and satisfied with, SAP and our solutions. To derive the Customer NPS, we start with the percentage of “promoters” of SAP – those who give us a score of 9 or 10 on a scale of 0 to 10. We then subtract the percentage of “detractors” – those who give us a score of 0 to 6. The method ignores “passives,” who give us a score of 7 or 8. In addition to our on-premise
Days’ Sales Outstanding (DSO) and Days’ Payables Outstanding (DPO): We manage working capital by controlling the days’ sales outstanding for operating receivables, or DSO (defined as average number of days from the raised invoice to cash receipt from the customer), and the days’ payables outstanding for operating liabilities, or DPO (defined as average number of days from the received invoice to cash payment to the vendor).
Measures We Use to Manage Overall Financial PerformanceWe use the following measures to manage our overall financial performance:
Earnings per share (EPS): EPS measures our overall performance because it captures all operating and non-operating elements of profit as well as income tax expense. It represents the portion of profit after tax allocable to each SAP share outstanding (using the weighted average number of shares outstanding over the reporting period). EPS is influenced not only by our operating and non-operating business, and income taxes but also by the number of shares outstanding. We are authorized by our shareholders to repurchase shares and believe that such repurchases, additional to dividend distributions, are a good means to return value to our shareholders.
Effective tax rate: We define our effective tax rate as the ratio of income tax expense to profit before tax, expressed as a percentage.
Operating, investing, and financing cash flows and free cash flow: Our consolidated statement of cash flows provides insight as to how we generated and used cash and cash equivalents. When used in conjunction with the other primary financial statements, it provides information that helps us evaluate the changes of our net assets, our financial structure (including our liquidity and solvency), and our ability to affect the amounts and timing of cash flows in order to adapt to changing circumstances and opportunities. We use our free cash flow measure to estimate the cash flow remaining
74 Combined Management Report
Our entire network of planning, control, and reporting processes is implemented in integrated planning and information systems, based on SAP software, across all organizational units so that we can conduct the evaluations and analyses needed to make informed decisions.
NON-IFRS FINANCIAL MEASURES CITED IN THIS REPORT As in previous years, we provided our 2014 financial outlook on the basis of certain non-IFRS measures. Therefore, this report contains a non-IFRS based comparison of our actual performance in 2014 against our outlook in the Performance Against Outlook for 2014 (Non-IFRS) section.
Reconciliations of IFRS to Non-IFRS Financial Measures for 2014 and 2013The following table reconciles our IFRS financial measures to the respective and most comparable non-IFRS financial measures of this report for each of 2014 and 2013. Due to rounding, the sum of the numbers presented in this table might not precisely equal the totals we provide.
customers, in 2014 for the first time we included Ariba, SuccessFactors and Sybase customers in the survey. Therefore, the 2014 Customer NPS score is not fully comparable to the prior year’s score.
VALUE-BASED MANAGEMENTOur holistic view of the performance measures described above, together with our associated analyses, comprises the information we use for value-based management. We use planning and control processes to manage the compilation of these key measures and their availability to our decision makers across various management levels.
SAP’s long-term strategic plans are the point of reference for our other planning and controlling processes, including a multiyear plan through 2020. We identify future growth and profitability drivers at a highly aggregated level. This process is intended to identify the best areas in which to target sustained investment. Next, we evaluate our multiyear plans for our support and development functions and break down the customer-facing plans by sales region. Based on our detailed annual plans, we determine the budget for the respective year. We also have processes in place to forecast revenue and profit on a quarterly basis, to quantify whether we expect to realize our strategic goals, and to identify any deviations from plan. We continuously monitor the concerned units in the Group to analyze these developments and define any appropriate actions.
75Performance Management System
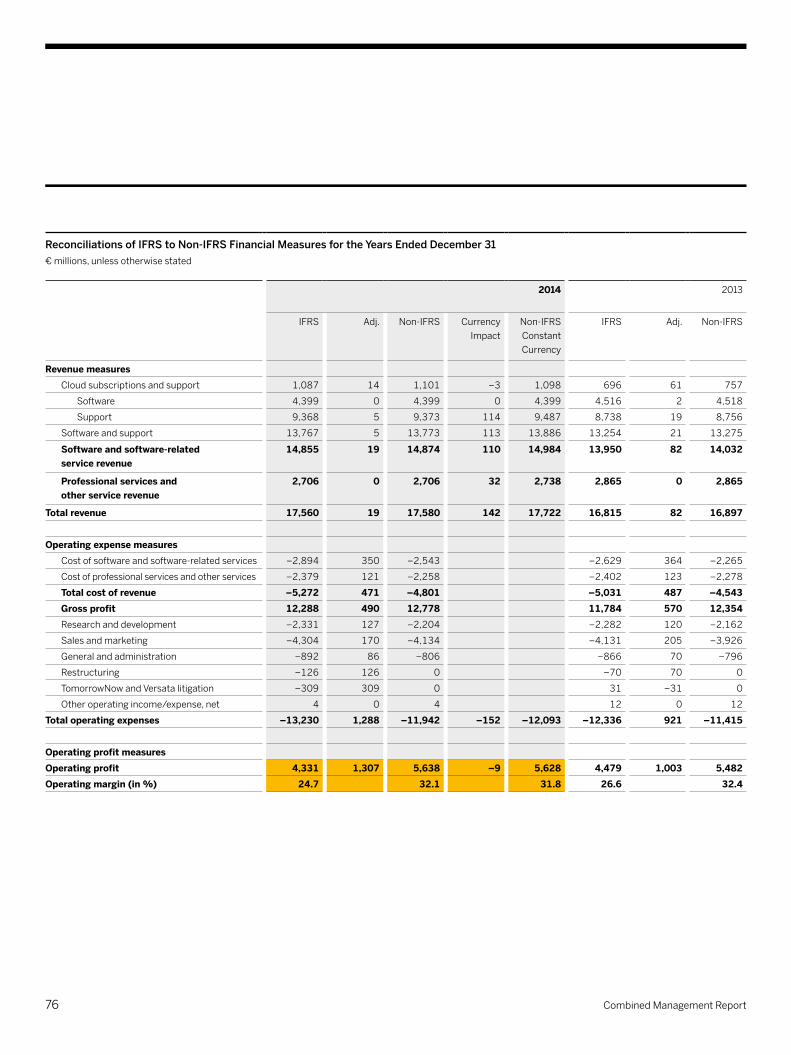
Reconciliations of IFRS to Non-IFRS Financial Measures for the Years Ended December 31€ millions, unless otherwise stated
2014 2013
IFRS Adj. Non-IFRS CurrencyImpact
Non-IFRSConstant Currency
IFRS Adj. Non-IFRS
Revenue measuresCloud subscriptions and support 1,087 14 1,101 –3 1,098 696 61 757
Software 4,399 0 4,399 0 4,399 4,516 2 4,518
Support 9,368 5 9,373 114 9,487 8,738 19 8,756
Software and support 13,767 5 13,773 113 13,886 13,254 21 13,275
Software and software-related service revenue
14,855 19 14,874 110 14,984 13,950 82 14,032
Professional services and other service revenue
2,706 0 2,706 32 2,738 2,865 0 2,865
Total revenue 17,560 19 17,580 142 17,722 16,815 82 16,897
Operating expense measuresCost of software and software-related services –2,894 350 –2,543 –2,629 364 –2,265
Cost of professional services and other services –2,379 121 –2,258 –2,402 123 –2,278
Total cost of revenue –5,272 471 –4,801 –5,031 487 –4,543Gross profit 12,288 490 12,778 11,784 570 12,354Research and development –2,331 127 –2,204 –2,282 120 –2,162
Sales and marketing –4,304 170 –4,134 –4,131 205 –3,926
General and administration –892 86 –806 –866 70 –796
Restructuring –126 126 0 –70 70 0
TomorrowNow and Versata litigation –309 309 0 31 –31 0
Other operating income/expense, net 4 0 4 12 0 12
Total operating expenses –13,230 1,288 –11,942 –152 –12,093 –12,336 921 –11,415
Operating profit measuresOperating profit 4,331 1,307 5,638 –9 5,628 4,479 1,003 5,482Operating margin (in %) 24.7 32.1 31.8 26.6 32.4
76 Combined Management Report

– All forecast and performance reviews with all senior managers globally are based on these non-IFRS measures, rather than the respective IFRS financial measures.
– Both our internal performance targets and the guidance we provided to the capital markets are based on revenue (non-IFRS) and profit (non-IFRS) measures rather than the respective IFRS financial measures.
Our non-IFRS financial measures reflect adjustments based on the items below, as well as adjustments for the related income tax effects.
Revenue (Non-IFRS)Revenue items identified as revenue (non-IFRS) have been adjusted from the respective IFRS financial measures by including the full amount of support revenue, cloud subscriptions and support revenue, and other similarly recurring revenue that we are not permitted to record as revenue under IFRS due to fair value accounting for the contracts in effect at the time of the respective acquisitions.
Under IFRS, we record at fair value the contracts in effect at the time entities were acquired. Consequently, our IFRS support revenue, IFRS cloud subscriptions and support revenue, IFRS software and software-related service revenue, and IFRS total revenue for periods subsequent to acquisitions do not reflect the full amount of revenue that would have been recorded by entities acquired by SAP had they remained stand-alone entities. Adjusting revenue numbers for this revenue impact provides additional insight into the comparability of our ongoing performance across periods.
Operating Expense (Non-IFRS)Operating expense numbers that are identified as operating expenses (non-IFRS) have been adjusted by excluding the following expenses:– Acquisition-related charges
Amortization expense/impairment charges of intangibles acquired in business combinations and certain stand-alone acquisitions of intellectual property (including purchased in-process research and development)
Explanation of Non-IFRS MeasuresWe disclose certain financial measures, such as revenue (non-IFRS), operating expenses (non-IFRS), operating profit (non-IFRS), operating margin (non-IFRS), earnings per share (non-IFRS), deferred revenue (non-IFRS), and calculated cloud billings measures (non-IFRS), as well as constant currency revenue, expense, profit, deferred revenue, and calculated cloud billings measures that are not prepared in accordance with IFRS and are therefore considered non-IFRS financial measures. Our non-IFRS financial measures may not correspond to non-IFRS financial measures that other companies report. The non-IFRS financial measures that we report should only be considered in addition to, and not as substitutes for or superior to, our IFRS financial measures.
We believe that the disclosed supplemental historical and prospective non-IFRS financial information provides useful information to investors because management uses this information, in addition to financial data prepared in accordance with IFRS, to attain a more transparent understanding of our past performance and our anticipated future results or – in the case of calculated cloud billings (non-IFRS) – management uses the measures to anticipate metrics that investors use. We use the revenue (non-IFRS) and profit (non-IFRS) measures consistently in our internal planning and forecasting, reporting and compensation, as well as in our external communications, as follows:– Our management primarily uses these non-IFRS measures
rather than IFRS measures as the basis for making financial, strategic, and operating decisions.
– The variable components of our Executive Board members’ and employees’ remuneration are based on revenue (non-IFRS) and operating profit (non-IFRS) measures rather than the respective IFRS measures.
– The annual budgeting process for all management units is based on revenue (non-IFRS) and operating profit (non-IFRS) numbers rather than the respective IFRS financial measures.
77Performance Management System

Operating Profit (Non-IFRS), Operating Margin (Non-IFRS), and Earnings per Share (Non-IFRS)Operating profit, operating margin, and earnings per share identified as operating profit (non-IFRS), operating margin (non-IFRS), and earnings per share (non-IFRS) have been adjusted from the respective IFRS measures by adjusting for the above-mentioned revenue (non-IFRS) and operating expenses (non-IFRS).
Deferred Cloud Subscriptions and Support Revenue (Non-IFRS) and Calculated Cloud Billings (Non-IFRS)It is common in capital markets to use metrics based on billings to help evaluate the performance of cloud subscription offerings. A common metric of this kind is calculated cloud billings that can be calculated as the total of a period’s cloud subscriptions and support revenue and the respective period’s change in the deferred cloud subscriptions and support revenue balance. To ease the effort of determining this metric, we report the metric’s components as well as a calculation of the metric itself. To allow an alignment of this calculated cloud billings metric with our revenue reporting, we present the calculated cloud billings metric on an IFRS basis (that is, derived from IFRS numbers) as well as on a non-IFRS basis and a non-IFRS at constant currency basis. The calculated cloud billings (non-IFRS) are derived from both:– Our cloud subscriptions and support revenue (non-IFRS),
which is adjusted from the respective IFRS number for the effect of fair value accounting for the contracts in effect at the time of the respective acquisitions as outlined above
– Our deferred cloud subscriptions and support revenue (non-IFRS), which is adjusted from the respective IFRS number accordingly
Constant Currency Information We believe it is important for investors to have information that provides insight into our sales. Revenue measures determined under IFRS provide information that is useful in this regard. However, both sales volume and currency effects impact period-over-period changes in sales revenue. We do not sell
Settlements of pre-existing business relationships in connection with a business combination
Acquisition-related third-party expenses– Expenses from the TomorrowNow litigation (formerly labeled
as discontinued activities) and the Versata litigation cases– Share-based payment expenses– Restructuring expenses
We exclude certain acquisition-related expenses for the purpose of calculating operating profit (non-IFRS), operating margin (non-IFRS), and earnings per share (non-IFRS) when evaluating SAP’s continuing operational performance because these expenses generally cannot be changed or influenced by management after the relevant acquisition other than by disposing of the acquired assets. Since management at levels below the Executive Board does not influence these expenses, we generally do not consider these expenses for the purpose of evaluating the performance of management units. Additionally, these non-IFRS measures have been adjusted from the respective IFRS measures for the results of the share-based payment expenses and restructuring expenses, as well as the TomorrowNow and Versata litigation expenses.
The adjustment for expenses and income from the Versata litigation was introduced in 2014 (for details regarding this litigation refer to our Notes to the Consolidated Financial Statements section, Note (24)). Prior-year amounts have been adjusted to comply with the modified set of non-IFRS adjustments. We exclude expenses and income from the Versata litigation to provide additional insight into the comparability of our ongoing operating performance across periods and to continue the alignment of our non-IFRS measures with our internal performance measures.
78 Combined Management Report

Usefulness of Non-IFRS MeasuresWe believe that our non-IFRS measures are useful to investors for the following reasons:– Our revenue (non-IFRS), expense (non-IFRS), and profit
(non-IFRS) measures provide investors with insight into management’s decision making because management uses these non-IFRS measures to run our business and make financial, strategic, and operating decisions. We include the revenue adjustments outlined above and exclude the expense adjustments outlined above when making decisions to allocate resources. In addition, we use these non-IFRS measures to gain a better understanding of SAP’s operating performance from period to period.
– The non-IFRS measures provide investors with additional information that enables a comparison of year-over-year operating performance by eliminating certain direct effects of acquisitions, share based compensation plans, restructuring plans, and the TomorrowNow and Versata litigation cases.
– Non-IFRS and non-GAAP measures are widely used in the software industry. In many cases, inclusion of our non-IFRS measures may facilitate comparison with our competitors’ corresponding non-IFRS and non-GAAP measures.
– Our deferred cloud subscriptions and support revenue (non-IFRS) and calculated cloud billings (non-IFRS) metrics provide additional insight into amounts that are contracted for and invoiced and that are expected to be recognized in cloud subscriptions and support revenue in the future.
standardized units of products and services, so we cannot provide relevant information on sales volume by providing data on the changes in product and service units sold. To provide additional information that may be useful to investors in breaking down and evaluating changes in sales volume, we present information about our revenue and various values and components relating to operating profit that are adjusted for foreign currency effects.
We calculate constant currency revenue and operating profit measures by translating foreign currencies using the average exchange rates from the comparative period instead of the current period. Constant currency deferred revenue balances are calculated by translating the current period’s opening and closing deferred revenues balances as well as the comparative period’s closing deferred revenue balance using the opening exchange rates of the comparative period. Free Cash FlowThe following table shows our free cash flow measure. We use this measure among others to manage our overall financial performance.
Free Cash Flow€ millions
2014 2013 Change (in %)
Net cash flows from operating activities
3,499 3,832 –9
Purchase of intangible assets and property, plant, and equipment (without acquisitions)
–737 –566 30
Free cash flow 2,762 3,266 –15
79Performance Management System

The revenue adjustment for the fair value accounting of the acquired entities’ contracts and the expense adjustment for acquisition-related charges do not arise from a common conceptual basis. This is because the revenue adjustment aims to improve the comparability of the initial post-acquisition period with future post-acquisition periods, while the expense adjustment aims to improve the comparability between post-acquisition periods and pre-acquisition periods. This should particularly be considered when evaluating our operating profit (non-IFRS) and operating margin (non-IFRS) numbers as these combine our revenue (non-IFRS) and expenses (non-IFRS) despite the absence of a common conceptual basis. Our restructuring charges could result in significant cash outflows. The same applies to our share-based payment expense because most of our share-based payments are settled in cash rather than shares.
The valuation of our cash-settled share-based payments could vary significantly from period to period due to the fluctuation of our share price and other parameters used in the valuation of these plans. In the past, we have issued share-based payment awards to our employees every year and we intend to continue doing so in the future. Thus, our share-based payment expenses are recurring although the amounts usually change from period to period. The deferred cloud subscriptions and support revenue (non-IFRS) and calculated cloud billings (non-IFRS) metrics that we disclose may be impacted significantly by our revenue recognition policies, for example, when fees from components other than cloud subscriptions sold in multiple element arrangements with cloud subscriptions are reallocated to cloud subscriptions and vice versa. Thus, our calculated cloud billings (non-IFRS) metrics for a given period may not be indicative of the amounts that we have actually billed to customers in the respective period.
Limitations of Non-IFRS MeasuresWe believe that our non-IFRS financial measures described above have limitations, including but not limited to, the following:– The eliminated amounts could be material to us.– Without being analyzed in conjunction with the
corresponding IFRS measures, the non-IFRS measures are not indicative of our present and future performance, foremost for the following reasons: While our profit (non-IFRS) numbers reflect the elimination of certain acquisition-related expenses, no eliminations are made for the additional revenue that result from the acquisitions. While we adjust for the fair value accounting of the acquired entities’ recurring revenue contracts, we do not adjust for the fair value accounting of deferred compensation items that result from commissions paid to the acquired company’s sales force and third parties for closing the respective customer contracts. The acquisition-related charges that we eliminate in deriving our profit (non-IFRS) numbers are likely to recur should SAP enter into material business combinations in the future. Similarly, the restructuring expenses that we eliminate in deriving our profit (non-IFRS) numbers are likely to recur should SAP perform restructurings in the future. The acquisition-related amortization expense that we eliminate in deriving our profit (non-IFRS) numbers is a recurring expense that will impact our financial performance in future years.
80 Combined Management Report

We believe that constant currency measures have limitations, particularly as the currency effects that are eliminated constitute a significant element of our revenue and expenses and could materially impact our performance. Therefore, we limit our use of constant currency measures to the analysis of changes in volume as one element of the full change in a financial measure. Additionally, we use different prior period exchange rates for deferred revenue versus revenue items to adjust for currencies. We do not evaluate our results and performance without considering both constant currency measures in revenue (non-IFRS) and operating profit (non-IFRS) measures on the one hand, and changes in revenue, operating expenses, operating profit, or other measures of financial performance prepared in accordance with IFRS on the other. We caution the readers of our financial reports to follow a similar approach by considering constant currency measures only in addition to, and not as a substitute for or superior to, changes in revenue, operating expenses, operating profit, or other measures of financial performance prepared in accordance with IFRS.
Despite these limitations, we believe that the presentation of the non-IFRS measures and the corresponding IFRS measures, together with the relevant reconciliations, provide useful information to management and investors regarding present and future business trends relating to our financial condition and results of operations. We do not evaluate our growth and performance without considering both non-IFRS measures and the comparable IFRS measures. We caution the readers of our financial reports to follow a similar approach by considering our non-IFRS measures only in addition to, and not as a substitute for or superior to, revenue or other measures of our financial performance prepared in accordance with IFRS.
81Performance Management System

We adopted three leadership principles in 2014 that are essential to our continuous growth: ensuring customer success; driving simplicity; and developing amazing talent. These principles are at the core of all of our leadership actions. Each speaks to the need to adapt to changing market demands.
Our customers expect to realize value more quickly and nimbly in the cloud, asking for solutions that navigate greater complexity in simple and sophisticated ways. While they seek agility, we simultaneously have to increase our ability to become more adaptable, comfortable with volatility, uncertainty, complexity, and ambiguity. To drive simplicity, we are fostering a work environment based on trust by letting go of checks and balances, and moving away from a culture of command and control. And finally, to develop amazing talent, leaders are requested to find a balance between business results and people. It is mandatory that leaders actively support employee skill-building to maximize the impact on our success.
We see leadership as a profession. We make leaders accountable, and create a consistent leadership culture across the organization to ensure the engagement with and the advancement of our people. To further enhance accountability and to measure our collective effort to foster a work environment based on trust, we added a question to our annual global employee survey to gauge employees’ trust in our leaders. We measure leadership trust by using the Net Promoter Score (NPS) methodology. Our leadership trust score increased most significantly by 18.3 percentage points up to 46.8%, far exceeding our already ambitious target of 35.0% for 2014. The goal for 2015 is to even further increase the trust in our leadership; we aim for a target of 51.0%. In addition, we made leadership trust one of the key performance indicators for our top leaders at SAP for 2014. Finally, we introduced mandatory leadership training, launching a revamped, roles-based, and interactive curriculum.
OUR PEOPLE ARE OUR DIFFERENTIATORWhile we put our customers in the center of everything we do, we are equally committed to caring about our employees – the drivers behind our success. Our people are our major asset and differentiator. They give us the competitive advantage in the marketplace and are key to helping our customers Run Simple and helping us realize our goal of becoming "THE cloud company powered by SAP HANA.”
Our top priority is fostering a culture that attracts, retains, and develops talented people. We want our people to flourish, be creative, and unfold their full potential. Therefore, it is essential to create an organization that is simple, to develop and retain leaders who care, and to offer continuous learning opportunities in a work environment that embraces diversity and celebrates inclusion.
In 2014, we won a significant number of awards as an employer, among them the “Great Place to Work” in Brazil, France, India, and Turkey; “Top Employer” in Africa and the United Kingdom; and the top spot as “Best Employer” in the IT category in Germany. In addition, SAP America was ranked as a “Top Place to Work” in the U.S. cities of Philadelphia and Atlanta, as well as in the Bay Area in California.
LeadershipAs a cloud company, we must be able to navigate rapid change and chart the simplest possible course through complex problems. The ability not only to stay focused and be both persuasive and decisive but also inspirational and open to feedback has become imperative to our success. To develop those competencies in our leaders is essential; and leadership development is a major undertaking for us at SAP.
Employees and Social Performance
82 Combined Management Report

In 2014, we brought together 220 leaders including senior executives, top talents, Millennials, and expert-level employees from across the company at a leadership summit. We explored ways to grow our business in the cloud, lead with purpose, and cultivate engagement as well as foster trust and simplicity. In the spirit of transparency and leadership accountability, we asked the participants at the end of the summit to identify a personal commitment and concrete follow-up action that were displayed on an online “commitment wall,” accessible to all employees in the organization.
LearningOur learning culture at SAP aims to enable all employees at any level or in any role to learn. We introduced a philosophy of “everyone is a talent,” to focus on maximizing the skills of all our employees. We have adopted a new approach to assessing the individual potential of every person at SAP and have updated our portfolio of development offerings for each level of employee.
We took a number of steps throughout 2014 to ensure that SAP is a best-in-class learning organization. We appointed SAP’s first chief learning officer to create and execute a unified strategy for employee learning. We adopted our Success Map global learning platform, a cloud solution that enables highly personalized “learning on demand.” We streamlined our learning offerings and launched Webinars, produced online courses, and fostered peer interaction. New opportunities include career planning and mentoring workshops, behavioral tests, business simulations, and sponsorship pilots.
As we work to build an agile and heterogeneous workforce to meet future demands and reflect our customer base, we seek to also attract earlier generations of talent to broaden our expertise and balance our experienced employee base that we call “mature talents.” While putting a strong focus on developing our own talents, we also look for new talents externally to complement our current skills. In 2014, we made our recruiting more dynamic, mobile, social media-friendly, and easy to navigate. We launched a new careers site that highlights potential career paths at SAP, catering to different backgrounds, interests, and goals. At the same time, we continued proven methods of recruiting such as opportunities to talk in person and with our presence on university campuses, both important to reach new generations.
Beyond our focus on talent, leadership, and learning, the following four areas help us foster a winning culture that enables us to achieve our goals and create positive impact.
InclusionA diverse and inclusive culture fuels our innovation, helps us connect with customers, and makes us a better, more attractive workplace. We focus on four key areas: – Generational intelligence – Gender intelligence – Differently abled people – Culture and identity
We continue to work toward our goal of increasing the number of women in management from 18% in 2010 to 25% in 2017, a goal common to players in the IT industry. Our overall percentage of women in the workforce stayed constant at 31% from 2013 to 2014, and the percentage of women in management slightly increased to 21.3% in 2014 from 21.2% in 2013, marking the fifth year of growth in this area. Year-over-year, we added another 102 women to our management team. To further support progress, we offer executive sponsorships for women and require that at least one female candidate is included on the short list for leadership and other key executive positions.
83Employees and Social Performance

In 2014, we introduced a Corporate Oncology Program for Employees, which provides personalized analysis of cancer treatment options supported by SAP HANA. This program assesses individual genetic profiles of cancer cells. SAP is the first company to offer this service to its employees. We piloted the program in the United States and Germany and expect to expand it in further locations.
Our Business Health Culture Index (BHCI), based on our People Survey, assesses the degree to which our workplace culture supports people’s well-being, work/life balance, and organizational health. In 2014, we achieved a score of 70%, compared to 67% in 2013. Given the fast pace of change in the IT industry, we have set a goal of maintaining a score of 70% or higher. Based on our internal model and assumptions, we were able to quantify the connectivity between the BHCI and our operating profit. For each percentage point in change of the BHCI, the impact on our operating profit was approximately between €65 million and €75 million in 2014. For more information, see the Integrated Performance Analysis section of the SAP Integrated Report 2014 online.
Social Investments Our corporate social responsibility strategy applies our talent, technology, and strategic partnerships to create long-term, sustainable social impact. This year, we continued to focus on two areas that are critical to both SAP and society: education and entrepreneurship. In 2014, SAP contributed approximately €22 million in cash donations to non-governmental and non-profit organizations. Eleven hundred non-profit organizations received technology donations, including a comprehensive implementation of the SAP Business One solution at Specialisterne, an organization SAP works closely with that secures employment for people with autism, and Emprego Ligado, a social organization that offers an online job marketplace to Brazil’s working class. Our employees volunteered about 188,000 hours in communities in 47 countries, with more than 40% of their time spent devoted to providing their unique talents and abilities (“skills-based volunteering”).
Through our employee networks and other programs, we recognize and support diversity in its many dimensions. For example, in 2014, we released “LGBT Allies: SAP Employee Stories,” a video of SAP employees voicing support for the lesbian, gay, bisexual, and transgender (LGBT) community. This grassroots effort brought people together from different nationalities, backgrounds, and roles. We have also expanded our hiring of people with autism in our Autism at Work initiative, which is now implemented in five countries; we are targeting 1% of the total workforce by 2020.
In 2014, we repeated our annual People Weeks, a two-week opportunity for employees to learn and exchange ideas in in-person sessions, Webinars, and discussion forums. This year’s motto, “Shine Through the Cloud,” was designed to connect colleagues to our cloud strategy. A total of 36 virtual and 600 local sessions were offered in 69 countries.
Work/Life Integration We work to ensure that people at SAP have the ability to manage stress, balance their personal and professional lives, and perform at their best.
To help employees and managers invest in their health and a balanced lifestyle, we continued our global initiatives such as People Weeks, which place a strong focus on health, diversity, and learning. Further, we developed the Employee Health Support Program, which provides a personalized health report and recommendations. Piloted in 2013 in Austria and Ireland, the program has since been rolled out at all SAP locations in Germany and will be offered globally.
84 Combined Management Report

Enhancing EngagementFrom our earliest interactions with potential new employees to the many ways that we develop people at SAP, we are ultimately working to engage everyone in our vision – to help the world run better and improve people’s lives. We know that to win in the marketplace and be successful with our cloud strategy, we must continually expand the boundaries of what is possible, and engagement unlocks exceptional performance.
Indeed, in 2014, we were able to show a correlation between employee engagement and margin, further linking our financial and non-financial performance. For each percentage point our employee engagement index goes up or down, the impact on our operating profit was between €35 million and €45 million. For more information, see the Integrated Performance Analysis section of the SAP Integrated Report 2014 online. Employee engagement remains one of SAP’s four corporate strategic goals, along with growth, profitability, and customer loyalty. In our 2014 “pulse check,” we achieved an overall employee engagement score of 79%, compared to 77% in 2013. We aim at achieving a score of 82% by 2015. Employee satisfaction went up in every single category and in nearly all questionnaire items, including topics addressing the confidence in our strategic direction, in particular.
The scores of our People Survey in 2013 revealed that our employees were committed to execute the refreshed strategy but wanted support to translate the strategic direction into their daily life; subsequently this was selected as the key topic for 2014. We attribute the success in 2014 to our efforts to communicate and to explain the refreshed strategy. This effort will be continued in 2015.
In 2014, we expanded the SAP Social Sabbatical, one of our most successful and strategic programs, designed to cultivate existing talent and create social impact. Each year, we send high-performing employees from around the world to emerging markets, where they collaborate with social enterprises and entrepreneurs on month-long projects to solve a pressing business challenge. Many employees say the experience is life-changing, and they come back as stronger leaders and innovators. Strategic “pro-bono volunteering” is being extended to include local projects and an executive social sabbatical.
We also unveiled an innovative partnership in which SAP helped to create a technology-focused high school in New York City called the Business Technology Early College High School. The public six-year school features a special business and technology curriculum as well as mentoring and internship opportunities with SAP and others within our ecosystem. The school – known as BTECH – is an investment in the next generation as well as our own future, as we help develop a skilled workforce to drive innovation and growth. We plan to support additional schools with similar focus in North America in 2015.
85Employees and Social Performance
Our connectivity analysis revealed that employee retention is positively impacted by employee engagement and in 2014, our employee retention rate worldwide was 93.5%, same as in 2013. After making minor adjustments in the assumptions of our connectivity model, a one percentage point change in employee retention can impact our operating profit by about €40 million to €50 million. The average length of service at SAP worldwide in 2014 was approximately 7.2 years (2013: 6.5 years). While we do not seek a general retention rate of 100%, as some turnover supports innovation, a high retention rate is a priority. As with engagement, we believe that a thriving culture and strong leadership, along with a sense of purpose and opportunities to develop, motivate our top talent to stay at SAP.
HEADCOUNTOn December 31, 2014, we had 74,406 full-time equivalent (FTE) employees worldwide (December 31, 2013: 66,572). This represents an increase in headcount of 7,834 FTEs in comparison to 2013. Of the overall headcount increase in 2014, 5,535 resulted from acquisitions. The average number of employees in 2014 was 68,343 (2013: 65,409).
We define the FTE headcount as the number of people we would employ if we only employed people on full-time employment contracts. Students employed part-time and certain individuals who are employed by SAP but who, for various reasons, are not currently working, are excluded from our figures. Also, temporary employees are not included in the above figures. The number of such temporary employees is not material.
On December 31, 2014, the largest number of SAP employees (45%) were employed in the EMEA region (including 24% in Germany), while 30% were employed in the Americas region (including 21% in the United States) and 26% in the APJ region.
We still see the need to continue our simplification efforts which will be our second focus area for increasing employee engagement in 2015, as our score in this area only improved slightly in 2014. We strongly believe that effective and simple processes and structures are critical to ensure our customer’s and SAP’s success. They not only save time and duplication of effort, but they free up energy for innovation.
In addition to our learning and development opportunities, special initiatives also support engagement. In 2014, we launched the Hasso Plattner Founders’ Award to celebrate the best of who we are and what we do at SAP. More than 2,000 nominations were submitted, with criteria based on transforming problems into opportunities through innovative thinking, reducing complexity, and making bold decisions involving risk-taking and learning from mistakes. Our two winning teams overcame significant technological and organizational challenges to deliver solutions that simplify business problems, focus on the customer, and deliver meaningful value. They showcased the spirit of innovation, entrepreneurialism, and courage that we will maintain as our hallmarks in the years to come.
86 Combined Management Report

Unless otherwise stated, the main driver for the following headcount increases were SAP’s acquisition activities (mainly Concur). Our worldwide headcount in the field of software and software-related services grew 34% to 15,074 FTEs (2013: 11,261). Cloud operations and support accounted for most of the increase. Professional services and other services counted 14,639 FTEs at the end of 2014 – an increase of less than 1% (2013: 14,629). Our R&D headcount saw a year-over-year increase of 6% to 18,908 FTEs (2013: 17,804). This growth stemmed from an increase in headcount in the area of Products & Innovation. Sales and marketing headcount grew by 14% to 17,969 FTEs at the end of the year (2013: 15,824). General and administration headcount rose 10% to 5,023 FTEs at the end of the year (2013: 4,566). Our infrastructure employees numbered 2,794 FTEs – an increase of 12% (2013: 2,488) driven primarily in our investments in IT.
In the Americas region, headcount (FTEs) increased by 2,503, or 13%; in the EMEA region, the increase was 2,347, or 8%; and in the APJ region, it was 2,985, or 19%.
Our personnel expense per employee stayed essentially flat at approximately €115,000 in 2014 (2013: approximately €114,000). The personnel expense per employee is defined as the personnel expense divided by the average number of employees. For more information about employee compensation and a detailed overview of the number of people SAP employed, see the Notes to the Consolidated Financial Statements section, Note (8).
27,700
15,473
12,592
55,765
26,989
14,783
11,741
53,513
29,757
19,123
15,542
64,422
EMEA region Americas region APJ region
33,340
22,071
18,995
74,406
30,993
19,568
16,011
66,572
Number of EmployeesFull-time equivalents
2010 2011 2012 2013 2014
Employees by Functional Area Full-time equivalents
Infrastructure
2,794
General and administration
5,023
Software and software- related services
15,074
Research and development
18,908
Professional services and other services
14,639
Sales and marketing
17,969
87Employees and Social Performance
TOTAL ENERGY CONSUMEDBecause our energy usage drives our emissions, one of the most important measures we look at is our total energy consumed. This includes all energy that SAP generates or purchases to run our facilities, data centers, company cars, and corporate jets. Our total energy consumption increased to 920 gigawatt hours (GWh) in 2014, compared to 910 GWh in 2013.
This increase is due to significant growth in our business. In addition, as software usage shifts to the cloud, we are operating more of our customers’ systems in our data centers, as well as other locations where we are supplementing our servers. This additional cloud operation, along with the accompanying servers and facilities, consumes more energy. At the same time, we believe this shift has the opposite effect for our customers, which can simplify their technology and save energy through our shared infrastructure, reducing the overall IT-related energy consumption through our highly energy-efficient cloud provisioning.
As our business grows, we have maintained the efficiency gains we have made over the past several years. For example, our total corporate car fleet is not consuming more fuel despite the fact that a significant number of company cars have been added, since the average company car has become more fuel-efficient. So, while our car fleet grew by 5%, we had efficiency gains of 3% across the entire fleet. As a result, our total energy consumption decreased slightly to 13,400 kilowatt hours (kWh) per employee in 2014 (2013: 13,900 kWh).
One of the primary ways that we can help both our customers and SAP tackle the challenge of complexity is by increasing efficiency. Simplification and efficiency go hand in hand, and we have worked to enhance both by taking responsibility for our energy usage and carbon emissions including IT-related impact of our customers consuming our cloud offerings.
As we accelerate our shift to the cloud, we have tied our business strategy to our environmental strategy by creating a completely green cloud at SAP, referring to carbon neutrality by purchasing 100% renewable electricity certificates and compensation by offsets. This change – which we implemented in 2014 – does more than mitigate our own impacts. It also means that we can better serve our customers, as we simplify their IT landscape through our cloud offerings and help them increase their own efficiency. Our green cloud strategy is complemented by 100% renewable energy for facilities and electric company cars charged at SAP locations.
The evolution of our green cloud reflects the critical links we see between our environmental and business performance. We bring equal rigor to addressing and measuring both of these areas. In assessing our environmental impact, we focus on energy usage throughout SAP, as well as greenhouse gas emissions across our value chain. Since the beginning of 2008, our energy efficiency measures have generated a cumulative cost avoidance of €310 million, compared to a business-as-usual scenario, with €45 million of that amount created in 2014.
Environmental Performance: Energy and Emissions
88 Combined Management Report

In addition to greater efficiency, we have achieved an overall absolute reduction of 16% since our peak year 2007, when we set our long-term carbon target. This reduction has occurred even as the average number of employees at SAP has increased by almost 32%.
ENVIRONMENTAL INNOVATIONSThe ongoing tension between growth in our business and our goal to reduce our emissions has led us to pursue new approaches. To further decrease our car-related emissions, in 2014, we committed to increase the portion of electric vehicles (or alternatives) in our company car fleet from currently less than 1% to 20% by 2020. This initiative addresses a dilemma that has grown in recent years. Namely, along with our business expansion, the number of SAP employees who are eligible for a company car has increased annually. We aim to ensure that we do not undo our efficiency gains with our growing car fleet.
GREENHOUSE GAS EMISSIONS Our goal is to reduce the net greenhouse gas emissions from our operations to levels of the year 2000 by 2020. This target includes all direct and indirect emissions from running our business (Scopes 1 and 2), as well as a selected subset of other indirect (Scope 3) emissions. We do not include all of our Scope 3 emissions in our target because we chose to focus first on those emissions over which we have control or capability to influence. However, we are increasingly addressing both our upstream and downstream emissions to support a comprehensive carbon strategy for SAP.
Specifically, we are working to reduce our emissions through three primary approaches: increasing our operational efficiency combined with innovative approaches to the way we do things; purchasing high-quality renewable electricity certificates; and investing in high-quality carbon credits.
In addition to our long-term goal for 2020, we have set annual targets. Despite integrating new acquisitions in 2014, our total net emissions decreased to 500 kilotons CO2 (2013: 545 kilotons). This decrease stems primarily from our shift to powering all of our data centers and facilities with 100% renewable electricity. We are effectively compensating the emissions caused by our customers’ systems that have moved into our green cloud. Given the large size of our customers’ footprints and our growth strategy in the cloud, we see significant potential to reduce both our own and our customers’ environmental impact.
Nonetheless, we missed our annual target to reduce our emissions to 440 kilotons. The reason is that our business has continued to grow, and more of our overall emissions are caused by business travel. In other words, our shift to green energy – while critical to our long-term reduction strategy – could not fully compensate for the business travel enabling our growth. At the same time, this shift did enhance our efficiency. Our greenhouse gas emissions decreased from 32.4 grams CO2 per euro of total revenue in 2013 to 28.4 grams CO2 per euro in 2014. Our carbon emissions per employee also decreased by about 12% in 2014.
89Environmental Performance: Energy and Emissions

In 2014, we also began realizing the benefits of another key sustainability initiative, our investment in the Livelihoods Fund, a unique investment fund whose returns consist of high-quality carbon credits. Several years ago, we made an initial investment of €3 million covering a 20-year participation in the fund, which supports the sustainability of agricultural and rural communities worldwide.
Projects of this fund focus on ecosystem restoration, agriculture, agro-forestry, and rural energy. In eastern India, for example, the fund has helped communities plant fruit trees to diversify food sources and address overcultivation of soil. As opposed to a charitable donation, we have made a long-term investment that brings benefits to society, the environment and SAP. In 2014, we received our first carbon credits from the fund, which helped us reduce our carbon footprint by another 11.2 kilotons.
Another important piece of progress in 2014 was the further implementation of ISO 14001 in SAP locations throughout the world. This well accepted environmental management system is now in place in 23 of our locations worldwide, including our SAP North America headquarters in Newtown Square, Pennsylvania, in the United States, as well as in such diverse countries as Austria, Brazil, Canada (Vancouver), the Czech Republic, Germany, Israel, Italy, and South Africa. To act faster and achieve consistency, we have created a template for rolling out to new sites, enabling us to efficiently build a large global network in which different sites interact and share best practices.
In keeping with our existing policy for office buildings and data centers, we continue to power our electric company cars with 100% renewable sources. In Germany, for example, we are incentivizing employees to make the switch by offering a battery subsidy that offsets the cost of using an electric vehicle. We are also developing a management solution that will address “range anxiety,” helping drivers intelligently plan out their trips, their maximum range and the availability of charging stations. We believe that our electric car initiative will play a critical role in helping us achieve our 2020 carbon reduction goal.
Our shift to a green cloud will also bring us closer to our carbon emission goal while extending our reach beyond SAP. In addition to reducing our own emissions, this change enables us to create a far greater impact through our customers. In 2014 alone, the emissions caused by SAP products in use at the sites of our more than 282,000 customers were at least 10 times larger than SAP’s own footprint, meaning they caused more than 6,200 kilotons of CO2. By using 100% renewable energy, we dramatically broaden our sustainability efforts and align them with our cloud strategy. We believe this move not only helps the world run better, but significantly reduces the carbon produced both inside and outside SAP.
90 Combined Management Report

In 2014, renewable energy accounted for 100% of our total electricity, compared with 43% in 2013. While we produce a small amount of renewable energy through solar panels in some locations, we mainly rely on the purchase of Renewable Electricity Certificates (RECs) to increase the renewable electricity in our energy mix. We procure RECs that add value and drive change in the electricity market, adopting a set of key criteria to establish high-quality standards, which were aligned with two NGOs. For example, we will consider renewable electricity from biomass only if it is disconnected from coal or other fossil power plants and if the biomass itself is not related to deforestation. In addition, we require that power plants must be no more than 10 years old, as we aim to foster new innovation and production of renewable energy.
DATA CENTER ENERGYData centers are at the heart of how SAP provides solutions to our customers. The energy consumption in data centers is closely related to technology innovation and customer adoption of our solutions. At the same time, with our energy consumption rising as more of our business moves to the cloud, data centers have become a primary focus of our carbon reduction efforts.
As noted earlier, in 2014 we addressed our data center electricity consumption by shifting entirely to a green cloud at SAP. This means that 100% of our energy usage to provide internal and external computation power now comes from renewable sources. At the same time, we began utilizing external data centers to meet the growing needs of our cloud customers. For this reason, our total data center electricity consumption – at both our internal and external sites – increased from 173 to 179 GWh. To reflect our strategic shift towards a cloud delivery model based on internal and external data centers, we decided to normalize total data center electricity consumption against revenue instead of per SAP employee. On a per million euro basis, this consumption stayed flat at 10.2 megawatt hours (MWh) per million euro revenue between 2013 and 2014.
RENEWABLE ENERGYOur investment in renewable energy plays a critical role in mitigating our environmental impact, helping us better serve our customers and support a more sustainable energy market. We are committed to buying from renewable sources – in 2014 we focused on solar, wind, and hydro. Our shift in 2014 to 100% renewable energy in all of our data centers and facilities is one of our most significant actions to date to make our operations more sustainable.
91Environmental Performance: Energy and Emissions

Economic trends in the Asia Pacific Japan (APJ) region were again mixed. In Japan, economic growth slowed again. In the second and third quarters, Japan’s economy even contracted; the ECB links this development with the increase in consumption tax on April 1, 2014. Japan returned to growth in the last quarter of the year. Year-over-year, economic growth in China decelerated – primarily because of a decline in investments. National and local stimulus programs brought a return to greater stability in the fourth quarter. According to the ECB, the outcome was full-year economic growth in China at a rate in the upper single-digit percentage range.
The IT MarketAccording to U.S. market research firm International Data Corporation (IDC), the global IT market expanded 4.1% in 2014, which is in the lower end of the range IDC expected in its earlier quarterly projections. Drivers were a decrease in production and a decline of average prices for tablets and smartphones in a saturated market, according to IDC. These effects had not been foreseen at the beginning of the year. On the other hand, PC-related sales revenue shrank less than IDC had forecasted in its projections earlier in the year. Indeed, in the advanced economies PC spending rose for the first time since 2010, although it continued to decline in the emerging economies. IDC’s expectations for the software and related services markets remained broadly constant all year. IDC expected that the software market grew 6.1% and the services market grew 3.3% in 2014. According to IDC companies continue to invest in software; increasingly so in solutions for the cloud, mobile, and Big Data. Such investment is targeted at cost reduction, more efficient operation, and optimized hardware utilization.
Each segment of the IT market in the EMEA region expanded less than the global average. IDC states that, in Western Europe, a resurgent PC market (8.2% growth) drove an increase in total IT spending. Nonetheless, overall growth in the IT market in Western Europe market was 1.8% (Germany: 3.6%), which was negatively influenced by political tensions with Russia. The impact of the Ukraine crisis was more noticeable in Central and Eastern Europe, where the IT market nearly stagnated with 0.1% growth (Russia 0.1%). The IT market in Africa and the Middle East grew by a percentage well into double digits.
ECONOMY AND THE MARKET
Global Economic TrendsThe global economy recovered during the course of 2014, although slowly and heterogeneously, according to the European Central Bank (ECB). The ECB reports that progress in some advanced economies was restrained early in the year, gained momentum in the second and third quarters, but then weakened slightly in the fourth quarter. In the emerging economies, in contrast, the ECB says, structural problems and a tight credit environment impeded growth throughout the year. On the other hand, geopolitical crises, such as those in Ukraine and the Middle East, had little impact on the global economy in 2014, according to the ECB.
Year-over-year growth in the Europe, Middle East, and Africa (EMEA) region was significantly slower than the global average. The ECB reports that growth in the euro area lost momentum throughout 2014; it was particularly weak in the fourth quarter given unexpectedly low investment and exports. The ECB estimates that euro-area gross domestic product (GDP) increased 0.8% year-over-year. It notes that overall growth was robust in Central and Eastern Europe in the first half of 2014 but that in some countries growth slowed in the second half of the year. The intensifying conflict in Ukraine, the international sanctions, and falling oil prices all hampered growth in the Russian economy, especially in the second half of the year.
Year-over-year growth in the Americas region was also slower than the global average, the ECB reports. Strong domestic demand underpinned substantial growth in the U.S. economy, especially in the second and third quarters. In contrast, economic growth in Latin America weakened and the disparity between countries’ growth increased in 2014. For example, the ECB reports that the Brazilian economy grew little – indeed, it contracted in the first six months – while experiencing steep inflation. In contrast, the Mexican economy regained traction in 2014 after suffering a marked reversal the previous year, according to the ECB.
Financial Performance: Review and Analysis
92 Combined Management Report

non-IFRS software revenue at constant currencies, while our constant currency non-IFRS support revenue grew 8%. Support revenue is a robust feature of our core business model because a maintenance contract generally continues for as long as the customer uses the software. Our cloud business growth was strong. Non-IFRS cloud subscription and support revenue grew 45% over the year at constant currencies. That growth was 32% even after eliminating the results from the acquired cloud companies.
In the EMEA region, we were again highly successful, attaining 7% growth in non-IFRS software and software-related services revenue at constant currencies, while our performance in the United Kingdom was especially noteworthy. A 57% year-over-year increase in non-IFRS cloud subscription and support revenue at constant currencies is an indication that the cloud business is also of growing importance in the EMEA region.
In the Americas region, we achieved 7% growth in non-IFRS software and software-related services revenue at constant currencies despite the difficulties of weak economic progress, particularly in Latin America. Non-IFRS cloud subscription and support revenue grew 39% in the full year at constant currencies.
In the APJ region, the economic environment remained weak in 2014 and was also reflected in our modest revenue growth. However, our strong growth in cloud and a solid performance in India are worth highlighting. In the APJ region, our non-IFRS software and software-related services revenue grew 7% year-over-year at constant currencies, considerably supported by a 60% increase in constant currency non-IFRS cloud subscription and support revenue.
In 2014, we again demonstrated that we are consistently pursuing our strategy for innovation and growth – and that globally we are able to generate growth that few other IT companies can match.
In the Americas region, IDC estimates the U.S. IT market as relatively stable and calculated growth of 3.8% in 2014. Progress was slowest in the first quarter, similar to what was seen in the U.S. economy. IT demand grew most rapidly for cloud products, and that growth was at the expense of traditional software products. The markets in Latin America grew more slowly than previously. IDC estimates that the IT market in Latin America grew only 6.2% year-over-year (Brazil: 7.1%; Mexico: 2.8%) after double-digit growth in the previous year and despite a projection of 8% growth for 2014 made at the beginning of the year.
The two largest economies in the APJ region, China and Japan, experienced some difficulty in 2014, and in both countries the IT market was affected, IDC reports. In Japan, where IT spending had grown 4.0% in 2013, IDC estimates that it increased only 0.6% in 2014, held back by the weakness of the overall economy. For China, IDC projected 13.3% growth in 2014 at the beginning of the year, but by the end of the year it had trimmed its expectation to 9.8%.
Impact on SAPOnce again, growth in the overall global economy and in the IT industry was relatively slow in 2014, and it became increasingly volatile as the year progressed. This confronted SAP with considerable challenges. However, thanks to our innovation strategy, extended product portfolio, and strong diversification, we once again succeeded in significantly expanding our business and outperformed the overall global economy and IT industry in all regions in 2014 with regards to revenue growth.
Our non-IFRS software and software-related services revenue increased 7% at constant currencies in 2014. Both our core business and our cloud business contributed substantially to the increase. In our core business, non-IFRS software and support revenue increased 5% at constant currencies, although software revenue growth was affected by difficult economic conditions in almost all of the most important emerging economies for us, notably in Latin America, Russia and Ukraine, and Japan. That led to a 3% year-over-year decline in our
93Financial Performance: Review and Analysis

Since this integration and in the entire year 2014, our cloud-related activities were no longer handled by separate components in our Company. Our Executive Board assesses the financial performance of our Company on an integrated basis only. Consequently, SAP had one single operating segment in 2014.
For more information about the changes to our segment reporting, see the Notes to the Consolidated Financial Statements section, Note (29).
PERFORMANCE AGAINST OUTLOOK FOR 2014 (NON-IFRS)Our 2014 operating profit-related internal management goals and published outlook were based on our non-IFRS financial measures. For this reason, in this section we discuss performance against our outlook referring solely to these non-IFRS financial measures. All discussion in the Operating Results (IFRS) section, however, is in terms of measures in accordance with International Financial Reporting Standards as issued by the International Accounting Standards Board (IASB), and the numbers in that section are not explicitly identified as IFRS measures.
Starting in the second quarter of 2014, we additionally adjusted our non-IFRS operating expense by excluding the expenses resulting from the Versata litigation. (For more information about this litigation, see the Notes to the Consolidated Financial Statements section, Note (24)). Prior-year amounts have been adjusted accordingly. We exclude the Versata litigation expenses to provide additional insight into the comparability of our ongoing operating performance across periods and to continue the alignment of our non-IFRS measures with our internal performance measures.
OVERALL FINANCIAL POSITION
Executive Board’s AssessmentSAP delivered strong growth in the cloud. We also showed a solid software and software-related service revenue performance despite the accelerated shift from upfront software revenue to more predictable cloud revenue. The strong cloud growth is driven by a broad cloud portfolio, the largest cloud business network in the world (Ariba, Concur, and Fieldglass), and SAP HANA Cloud Platform. We will continue to invest in the transformation toward a more predictable cloud business model and once again raise our cloud ambition to grow our cloud subscription and support revenue to be, by 2020, about seven times the respective 2014 revenue.
We achieved our operating profit guidance while we significantly expanded our cloud delivery capabilities. We still aim for a strong total revenue growth, both for the near term and for the medium term. At the same time, we want to maintain the high profitability of our business. All in all, SAP remains in good financial shape.
Influence of Accounting Policies on Our Financial PositionFor more information about our accounting policies, see the Notes to the Consolidated Financial Statements section, Note (3).
There are no off-balance sheet financial instruments, such as sale-and-lease-back transactions, asset-backed securities, and liabilities related to structured entities, which are not disclosed in our Consolidated Financial Statements. SEGMENT INFORMATIONIn the first quarter of 2014, we took significant steps to drive forward our strategy and our ambition to become THE cloud company powered by SAP HANA. To execute this strategy, we merged certain areas of the company that performed similar tasks (for example, the on-premise sales forces with the cloud sales force, and the on-premise support units with the cloud support units) to achieve the seamless organization of SAP.
94 Combined Management Report

Despite ongoing economic uncertainty throughout 2014, our new and existing customers continued to show a strong willingness to invest in our solutions. We saw a strong impetus toward growth in the cloud business.
At constant currencies, non-IFRS cloud subscription and support revenue grew from €757 million in 2013 to €1,098 million in 2014. That represents an increase of 45% at constant currencies. The increase includes effects relating to acquisitions not included, or not included in full, in the 2013 amount. These acquisition-related effects account for 13 percentage points in the increase. The increase in our cloud subscription and support revenue led to an increase in our annual cloud revenue run rate to €1,716 million (2013: €1,016 million), with Concur and Fieldglass having together contributed €0.3 billion to the 2014 run rate. In 2014, we began to use the sum of non-IFRS fourth-quarter cloud subscription and support revenue (€360 million) and fourth-quarter non-IFRS cloud-related professional services and other service revenue (€69 million), multiplied by four, to calculate our annual cloud revenue run rate.
Guidance for 2014 (Non-IFRS)At the beginning of 2014, we gave the guidance that our cloud subscription and support revenue (non-IFRS) will increase to between €950 million and €1 billion (2013: €757 million) at constant currencies. For our software and software-related service revenue (non-IFRS) for 2014, we forecasted an increase of between 6% and 8% at constant currencies (2013: €14,032 million). We expected our full-year operating profit (non-IFRS) for 2014 to be between €5.8 billion and €6.0 billion (2013: €5.48 billion) at constant currencies. We anticipated an effective tax rate (IFRS) of between 26.0% and 27.0% (2013: 24.4%) and an effective tax rate (non-IFRS) of between 27.5% and 28.5% (2013: 25.9%).
In April, we confirmed the guidance for 2014 that we had published in January 2014. In July, we increased our outlook for cloud subscription and support revenue (non-IFRS) to between €1,000 million and €1,050 million (2013: €757 million) at constant currencies.
Based on the strong momentum in SAP’s cloud business, we raised our cloud outlook again in October and expected non-IFRS cloud subscriptions and support revenue to be in a range of €1,040 million to €1,070 million at constant currencies (2013: €757 million). With the customer-driven mix shift from upfront to cloud subscription revenue we expected full-year 2014 non-IFRS operating profit to be in a range of €5.6 billion to €5.8 billion (previously €5.8 billion to €6.0 billion) at constant currencies (2013: €5.48 billion). We confirmed our predictions for software and software-related service revenue (non-IFRS at constant currencies) and for the anticipated effective tax rates. Actual Performance in 2014 Compared to Guidance (Non-IFRS)We achieved or exceeded the amended outlook guidance for revenue and operating profit we published in October.
Comparison of Forecast and Results for 2014
Forecast for 2014 Results for 2014
Cloud subscription and support revenue (non-IFRS, at constant currencies)1)
€1,040 million to €1,070 million
€1,098 million
Software and software-related service revenue (non-IFRS, at constant currencies)
+6% to +8% +7%
Operating profit (non-IFRS, at constant currencies)1)
€5.6 billion to €5.8 billion
€5.63 billion
Effective tax rate (IFRS) 26.0% to 27.0% 24.7%
Effective tax rate (non-IFRS) 27.5% to 28.5% 26.1%
1) Revised forecast (October 2014).
95Financial Performance: Review and Analysis
OPERATING RESULTS (IFRS)This section on operating results (IFRS) discusses results only in terms of IFRS measures, so the IFRS numbers are not expressly identified as such.
We acquired Concur Technologies in December 2014, so Concur results are incorporated in our 2014 results only for December. We acquired Fieldglass in May 2014, so Fieldglass results are incorporated in our 2014 results only for May to December. Similarly, because we acquired hybris in August 2013, hybris results are incorporated in our 2013 results only for August to December.
Revenue
Total RevenueTotal revenue increased from €16,815 million in 2013 to €17,560 million in 2014, representing an increase of €746 million, or 4%. This growth reflects a 5% increase from changes in volumes and prices and a 1% decrease from currency effects. The growth in revenue resulted primarily from a €391 million increase in cloud subscription and support revenue and a €631 million rise in support revenue. Consulting revenue declined €147 million and software revenue declined €117 million. Software and software-related service revenue climbed to €14,855 million in 2014, an increase of 6%. Software and software-related service revenue represented 85% of total revenue in 2014 (2013: 83%). Professional services and other service revenue declined 6% from €2,865 million in 2013 to €2,706 million, which was 15% of total revenue, in 2014.
Our non-IFRS software and software-related services revenue grew 7% at constant currencies to €14,984 million (2013: €14,032 million).
Despite adverse economic conditions weighing on business in Russia and Ukraine, our performance in the Europe, Middle East, and Africa (EMEA) region was again sound. Non-IFRS software and software-related service revenue grew 6% (7% at constant currencies) and non-IFRS cloud subscription and support revenue increased 58% (57% at constant currencies) in the EMEA region. In the Americas region, non-IFRS software and software-related service revenue increased 6% (7% at constant currencies), with strong growth in the United States. The economic and political environment in Latin America remained difficult. Our non-IFRS cloud subscription and support revenue increased 39% (39% at constant currencies) in the Americas region. In the Asia Pacific Japan (APJ) region, our non-IFRS software and software-related service revenue increased 4% (7% at constant currencies). Non-IFRS cloud subscription and support revenue increased 59% (60% at constant currencies) in the APJ region.
In 2014, we achieved a non-IFRS operating profit of €5,628 million at constant currencies. Thus, constant currency non-IFRS operating profit was within the range (€5.6 billion to €5.8 billion) we had expected in our updated outlook.
We achieved an effective tax rate (IFRS) of 24.7% and an effective tax rate (non-IFRS) of 26.1%, which is below the outlook of 26.0% to 27.0% (IFRS) and 27.5% to 28.5% (non-IFRS). The reduction mainly results from the regional allocation of income, from tax effects on changes in foreign currency exchange rates, and from taxes for prior years.
96 Combined Management Report

Cloud subscription and support revenue increased from €696 million in 2013 to €1,087 million in 2014.
Deferred cloud subscription and support revenue totaled €690 million on December 31, 2014, an increase of 56% (December 31, 2013: €443 million).
The revenue share from more predictable cloud subscription and support revenue together with support revenue increased to 60% (2013: 56%) of total revenue.
A combination of a challenging macroeconomic and political environment in Russia, Ukraine, and some Latin American markets and the accelerating industry shift to the cloud resulted in a €117 million decline in software revenue. That decline, from €4,516 million in 2013 to €4,399 million in 2014, reflects a 3% decrease from changes in volumes and prices.
For more information about the breakdown of total revenue by region and industry, see the Revenue by Region and Industry section below.
Software and Software-Related Service RevenueSoftware revenue results from the fees earned from selling or licensing software to customers. Revenue from cloud subscriptions and support refers to the income earned from contracts that permit the customer to access specific software solutions hosted by SAP during the term of its contract with SAP. Support revenue represents fees earned from providing technical support services and unspecified software upgrades, updates, and enhancements to customers.
EMEA region Americas region APJ region
10
4
0
14
13
5
0
18
82
161
27
270
277
709
101
1,087
176
457
64
696
Cloud Subscriptions and Support Revenue by Region (based on customer location)€ millions
2010 2011 2012 2013 2014
EMEA region Americas region APJ region
4,883
3,427
1,484
9,794
5,529
3,958
1,832
11,319
6,125
4,789
2,250
13,165
7,028
5,489
2,337
14,855
6,616
5,097
2,237
13,950
Software and Software-Related Service Revenue by Region (based on customer location)€ millions
2010 2011 2012 2013 2014
97Financial Performance: Review and Analysis

Our customer base continued to expand in 2014. Based on the number of contracts concluded, 12% of the orders we received for software in 2014 were from new customers (2013: 16%). The total value of software orders received declined 3% year-over-year. The total number of contracts signed for new software decreased 3% to 54,120 (2013: 55,909 contracts), while the average order value increased by 1%. Of all our software orders received in 2014, 22% were attributed to deals worth more than €5 million (2013: 24%), while 44% were attributed to deals worth less than €1 million (2013: 44%).
Our stable customer base, continued investment in software by customers throughout 2014 and the previous year, and the continued success of our premium support offerings resulted in an increase in support revenue from €8,738 million in 2013 to €9,368 million in 2014. The SAP Enterprise Support services offering was the largest contributor to our support revenue. The €631 million, or 7%, growth in support revenue reflects a 9% increase from changes in volumes and prices and a 1% decrease from currency effects. This growth is primarily attributable to SAP Product Support for Large Enterprises, SAP Enterprise Support, and our premium offerings. The acceptance rate for SAP Enterprise Support among new customers remained high at 98% in 2014.
Software and support revenue rose €514 million, or 4%, from €13,254 million in 2013 to €13,767 million in 2014. This growth breaks down into a 5% increase from changes in volumes and prices and a 1% decrease from currency effects.
Software and software-related service revenue grew from €13,950 million in 2013 to €14,855 million in 2014, an increase of 6%. This reflects a 7% increase from changes in volumes and prices and a 1% decrease from currency effects.
Professional Services and Other Service RevenueProfessional services and other service revenue consists primarily of consulting and other service revenue. We generate most of our consulting revenue from the implementation of our software products. Other service revenue consists mainly of revenue from messaging services and of training revenue from educational services supplied to customers and partners on the use of our software products and related subjects.
Professional services and other service revenue decreased €159 million, or 6%, from €2,865 million in 2013 to €2,706 million in 2014. This decline reflects a 4% decrease from changes in volumes and prices and a 1% decrease from currency effects.
Customers' cautious buying behavior toward large services projects led to a decline in consulting revenue from €2,242 million in 2013 to €2,095 million in 2014, a decrease of €147 million, or 7%. This decline reflects a 5% decrease from changes in volumes and prices and a 1% decrease from currency effects. Consulting revenue contributed 77% of the total professional services and other service revenue (2013: 78%). Consulting revenue contributed 12% of total revenue in 2014 (2013: 13%).
Revenue from other services decreased €12 million, or 2%, to €611 million in 2014 (2013: €623 million). This reflects a 1% decrease from changes in volumes and prices and a 1% decrease from currency changes.
98 Combined Management Report

EMEA RegionIn 2014, the EMEA region generated €8,383 million in revenue, which was 48% of total revenue (2013: €7,975; 47%). This represents a year-over-year increase of 5%. Revenue in Germany increased 2% to €2,570 million in 2014 (2013: €2,513 million). Germany contributed 31% (2013: 32%) of all EMEA region revenue. The remaining revenue in the EMEA region was primarily generated in France, Italy, the Netherlands, Russia, Switzerland, and the United Kingdom. Software and software-related service revenue generated in the EMEA region in 2014 totaled €7,028 million (2013: €6,616 million). Software and software-related service revenue represented 84% of all revenue in the region in 2014 (2013: 83%). Cloud subscription revenue rose 58% to €277 million in 2014 (2013: €176 million). This growth reflects a 57% increase from changes in volumes and prices and a 1% increase from currency effects. Software and support revenue rose 5% to €6,751 million in 2014 (2013: €6,440 million). This growth reflects a 6% increase from changes in volumes and prices and a 1% decrease from currency effects.
Americas RegionIn 2014, 37% of our total revenue was generated in the Americas region (2013: 37%). Total revenue in the Americas region increased 4% to €6,489 million; revenue generated in the United States increased 9% to €4,898 million. This growth reflects an 8% increase from changes in volumes and prices and a 1% increase from currency effects. The United States contributed 75% (2013: 72%) of all revenue generated in the Americas region. In the remaining countries of the Americas region, revenue declined 9% to €1,591 million. This reflects a 5% decrease from changes in volumes and prices and a 4% decrease from currency effects. This revenue was principally generated in Brazil, Canada, and Mexico. Software and software-related service revenue generated in the Americas region in 2014 totaled €5,489 million (2013: €5,097 million). Software and software-related service revenue represented 85% of all revenue in the Americas region in 2014 (2013: 82%). Cloud subscription revenue rose by 55% to €709 million in 2014 (2013: €457 million); currency effects were 0%. Software and support revenue rose 3% to €4,780 million in 2014 (2013: €4,641 million). This growth reflects a 3% increase from changes in volumes and prices; currency effects were 0%.
Revenue by Region and Industry Revenue by RegionWe break our operations down into three regions: the Europe, Middle East, and Africa (EMEA) region, the Americas region, and the Asia Pacific Japan (APJ) region. We allocate revenue amounts to each region based on where the customer is located. For more information about revenue by geographic region, see the Notes to the Consolidated Financial Statements section, Note (29).
EMEA region Americas region APJ region
6,263
4,435
1,766
12,464
6,991
5,091
2,151
14,233
7,512
6,060
2,650
16,223
8,383
6,489
2,688
17,560
7,975
6,233
2,606
16,815
Total Revenue by Region (based on customer location)€ millions
2010 2011 2012 2013 2014
99Financial Performance: Review and Analysis

In 2014 we achieved above-average growth in the following industry sectors, measured by changes in total revenue: Services (€2,824 million, at a growth rate of 7%); Consumer (€4,045 million, at a growth rate of 7%); Public Services (€1,786 million, at a growth rate of 6%); and Financial Services (€1,697 million, at a growth rate of 4%). Revenue from the other industry sectors: Energy and Natural Resources (€4,158 million, at a growth rate of 2%); and Discrete Manufacturing (€3,051 million, at a growth rate of 2%). Operating Profit and Operating MarginIn 2014, SAP continued to invest in innovation and made substantial advances in the cloud business. In addition and among other influences, negative currency effects and the difficult economic situation in Latin America and Russia affected our profitability. As a result, our operating profit in 2014 was €4,331 million, a little less than in the previous year (2013: €4,479 million).
In 2014, our operating expenses increased €894 million or 7% to €13,230 million (2013: €12,336 million). The increase relates primarily to an expense in connection with the TomorrowNow and Versata litigation, restructuring costs, continuing investment in our sales organization, and a rise in personnel and infrastructure costs, especially for our cloud business.
APJ RegionIn 2014, 15% (2013: 15%) of our total revenue was generated in the APJ region, with the strongest revenue growth being achieved in Australia. Total revenue in the APJ region increased 3% to €2,688 million. In Japan, revenue decreased 5% to €600 million. Revenue from Japan was 22% (2013: 24%) of all revenue generated in the APJ region. The decline in revenue from Japan was attributable to a 2% increase from changes in volumes and prices and a 7% decrease from currency effects. In the remaining countries of the APJ region, revenue increased 6%. Revenue in the remaining countries of the APJ region was generated primarily in Australia, China, and India. Software and software-related service revenue in the APJ region totaled €2,337 million in 2014 (2013: €2,237 million). That was 87% of all revenue from the region (2013: 86%). Cloud subscription revenue grew 59% to €101 million in 2014 (2013: €64 million). This growth reflects a 60% increase from changes in volumes and prices and a 1% decrease from currency effects. Software and support revenue increased 3% to €2,236 million in 2014 (2013: €2,173 million). This increase reflects a 5% increase from changes in volumes and prices and a 2% decrease from currency effects.
Revenue by IndustryWe allocate our customers to one of our industries at the outset of an initial arrangement. All subsequent revenue from a particular customer is recorded under that industry sector.
Revenue by Industry € millions
Public Services
1,786 Consumer
4,045
Services
2,824
Financial Services
1,697
Energy and Natural
4,158
Discrete Manufacturing
3,051
100 Combined Management Report

Those negative effects on operating profit were in part offset by the reduced cost of share-based compensation programs totaling €290 million (2013: €327 million) resulting from the declining year-over-year performance of the stock and by savings in general administration costs.
The overall result of these effects on operating profit was a 2.0 percentage point narrowing of our operating margin in 2014 to 24.7% (2013: 26.6%).
Changes to the individual elements in our cost of revenue were as follows:
Cost of Software and Software-Related ServicesCost of software and software-related services consists primarily of customer support costs, cost of developing custom solutions that address customers’ specific business requirements, costs for deploying and operating cloud solutions, amortization expenses relating to intangibles, and license fees and commissions paid to third parties for databases and the other complementary third-party products sublicensed by us to our customers.
In 2014, the cost of software and software-related services increased 10% to €2,894 million (2013: €2,629 million).
Significant costs included an additional €180 million to extend our cloud business, especially outside the United States, with an associated increase in the expense of delivering and operating cloud applications, and a €112 million rise in the cost of providing customer support. They both represent investments that contributed to revenue growth. Our margin on cloud subscriptions and support widened 0.9 percentage points to 55.8% (2013: 54.8%). This improvement in margin was achieved primarily through strong growth in our cloud subscription and support revenue and despite the increased expense we incurred to extend our cloud infrastructure. At the same time, the license fees we pay to third parties decreased by €49 million.
The effect of acquisition-related expenses, which were €562 million (2013: €555 million), of restructuring expenses, which were €126 million (2013: €70 million), and of a €309 million expense relating to the TomorrowNow and Versata litigation weighed more heavily on operating profit than in the previous year. Continuing investment in sales activities around the world and in the cloud also affected operating profit. Our employee headcount (measured in full-time equivalents, or FTEs) increased 7,834 year-over-year. Acquisitions accounted for more than 5,500 of the added FTEs.
Operating Profit€ millions | change since previous year
2,591
+0%
4,884
+89%
4,041
–17%
4,479
+11%
4,331–3%
2010 2011 2012 2013 2014
Operating MarginPercent | change since previous year
20.8
–3.5 Pp
34.3
+13.5 Pp
24.9
–9.4 Pp
26.6
+1.7 Pp
24.7–2.0 Pp
2010 2011 2012 2013 2014
101Financial Performance: Review and Analysis
Sales and Marketing ExpenseSales and marketing expense consists mainly of personnel costs, direct sales costs, and the cost of marketing our products and services.
Our sales and marketing expense rose 4% from €4,131 million in 2013 to €4,304 million in 2014. The increase was mainly the result of greater personnel costs as we expanded our global sales force and of the reallocation and re-tasking of employees to sales-related work. By increasing our sales force we accelerated our revenue growth. The ratio of sales and marketing expense to total revenue, expressed as a percentage, decreased slightly to 24.5% year-over-year (2013: 24.6%) because costs grew less rapidly than revenue.
General and Administration ExpenseOur general and administration expense consists mainly of personnel costs to support our finance and administration functions.
General and administration expense increased 3% from €866 million in 2013 to €892 million in 2014. That this increase was modest compared to the growth in our revenue is primarily the result of careful cost management. The ratio of general and administration expense to total revenue was unchanged in 2014 at 5% (2013: 5%).
Financial Income, NetFinancial income, net, changed to –€25 million (2013: –€66 million). Our finance income was €127 million (2013: €115 million) and our finance costs were €152 million (2013: €181 million).
The gross margin on our software and software-related services, defined as software and software-related services profit as a percentage of software and software-related services revenue, remained constant year-over-year at 81% in 2014 (2013: 81%).
Cost of Professional Services and Other ServicesCost of professional services and other services consists primarily of the cost of consulting and training personnel and the cost of bought-in third-party consulting and training resources. This item also includes sales and marketing expenses for our professional services and other services resulting from sales and marketing efforts where those efforts cannot be clearly distinguished from providing the professional services and other services.
Our consulting business is being greatly affected as we trend away from classic software licensing and consulting revenue toward more subscription revenue from cloud solutions. As a result, both our professional and other services revenue and our professional and other services expense decreased. We reduced costs for professional and other services 1% from €2,402 million in 2013 to €2,379 million in 2014. Our gross margin on professional and other services, defined as professional and other services profit as a percentage of professional and other services revenue, narrowed to 12% (2013: 16%).
Research and Development ExpenseOur research and development (R&D) expense consists primarily of the personnel cost of our R&D employees, costs incurred for independent contractors we retain to assist in our R&D activities, and amortization of the computer hardware and software we use for our R&D activities.
Although our personnel costs grew because of the 6% increase in our headcount by the end of the year, our R&D expense increased only 2% to €2,331 million in 2014 from €2,282 million in 2013. R&D expense as a percentage of total revenue was slightly less year-over-year at 13.3% (2013: 13.6%). For more information, see the Products, Research & Development, and Services section.
102 Combined Management Report

DividendWe believe our shareholders should benefit appropriately from the profit the Company made in 2014. Until now, our policy has been to distribute more than 30% of profit after tax in dividend. In practice however, the payout has been greater than 35% of profit after tax in all recent years. We are therefore amending our policy, which from now on will be to pay a dividend totaling more than 35% of profit after tax.
The Executive Board and the Supervisory Board will therefore recommend to the Annual General Meeting of Shareholders that the total dividend be increased by 10% to €1.10 per share (2013: €1.00). Based on this recommendation, the overall dividend payout ratio (which here means total distributed dividend as a percentage of profit) would be 40% (2013: 36%).
If the shareholders approve this recommendation and if treasury shares remain at the 2014 closing level, the total amount distributed in dividends would be €1,315 million. The actual amount distributed may be different from this total because the number of shares held in treasury may change before the Annual General Meeting of Shareholders. Transactions related to share-based payments could also change the amount of common stock. In 2014, we distributed €1,194 million in dividends from our 2013 profit. In 2014 and 2013, we did not repurchase any SAP treasury shares.
Finance income mainly consists of interest income from loans, financial assets (cash, cash equivalents, and current investments) and income of derivatives. This increase is attributable to a higher average liquidity and slightly higher interest rates than in 2013.
Finance costs mainly consist of interest expense on financial liabilities (€93 million in 2014 compared to €131 million in 2013). The decrease year-over-year is mainly due to positive effects from interest rate derivatives and due to lower average indebtedness. For more information about these financing instruments, see the Notes to the Consolidated Financial Statements section, Note (18b).
Income TaxOur effective tax rate increased slightly to 24.7% in 2014 (2013: 24.4%). For more information, see the Notes to the Consolidated Financial Statements section, Note (11).
Profit After Tax and Earnings per ShareProfit after tax remained almost constant year over year at €3,280 million in 2014 (2013: €3,325 million).
Basic earnings per share decreased slightly to €2.75 (2013: €2.79). The number of shares outstanding increased to 1,195 million in 2014 (2013: 1,193 million).
Profit After Tax € millions | change since previous year
1,813
+4%
3,437
+90%
2,803
–18%
3,325
+19%
3,280–1%
2010 2011 2012 2013 2014
Earnings per Share € | change since previous year
1.52
+3%
2.89
+90%
2.35
–19%
2.79
+18%
2.75–2%
2010 2011 2012 2013 2014
103Financial Performance: Review and Analysis

risks are collected in our treasury guideline document, which applies globally to all companies in the Group. For more information about the management of each financial risk and about our risk exposure, see the Notes to the Consolidated Financial Statements section, Notes (25) to (27).
Liquidity ManagementOur primary source of cash, cash equivalents, and current investments is funds generated from our business operations. Over the past several years, our principal use of cash has been to support operations and our capital expenditure requirements resulting from our growth, to quickly repay financial debt, to acquire businesses, to pay dividends on our shares, and to buy back SAP shares on the open market. On December 31, 2014, our cash, cash equivalents, and current investments were primarily held in euros and U.S. dollars. We generally invest only in the financial assets of issuers or funds with a minimum credit rating of BBB, and pursue a policy of cautious investment characterized by wide portfolio diversification with a variety of counterparties, predominantly short-term investments, and standard investment instruments. We rarely invest in the financial assets of issuers with a credit rating lower than BBB, and such investments were not material in 2014.
We believe that our liquid assets combined with our undrawn credit facilities are sufficient to meet our present operating needs and, together with expected cash flows from operations, will support debt repayments and our currently planned capital expenditure requirements over the near term and medium term. It may also be necessary to enter into financing transactions when additional funds are required that cannot be wholly sourced from free cash flow (for example, to finance large acquisitions).
In 2011, in addition to the regular dividend of €0.75 per share, we rewarded our shareholders with a special dividend of €0.35 per share to celebrate our 40th anniversary. FINANCES (IFRS) Overview
Global Financial ManagementWe use global centralized financial management to control liquid assets and monitor exposure to interest rates and currencies. The primary aim of our financial management is to maintain liquidity in the Group at a level that is adequate to meet our obligations. Most SAP companies have their liquidity managed centrally by the Group, so that liquid assets across the Group can be consolidated, monitored, and invested in accordance with Group policy. High levels of liquid assets help keep SAP flexible, sound, and independent. In addition, various credit facilities are currently available for additional liquidity, if required. For more information about these facilities, see the Credit Facilities section.
We manage credit, liquidity, interest rate, equity price, and foreign exchange rate risks on a Group-wide basis. We use selected derivatives exclusively for this purpose and not for speculation, which is defined as entering into a derivative instrument for which we do not have a corresponding underlying transaction. The rules for the use of derivatives and other rules and processes concerning the management of financial
Dividend per Share€ | change since previous year
0.60
+20%
1.10
+83%
0.85
–23%
1.00
+18%
1.10+10%
2010 2011 2012 2013 2014
104 Combined Management Report

After undergoing an external credit rating process, on September 19, 2014, SAP SE was assigned a first-time long-term issuer credit rating of “A2” by Moody’s and “A” by Standard & Poor’s, both with the outlook “Stable.”
Our general intention is to remain in a position to return excess liquidity to our shareholders by distributing annual dividends and potentially repurchasing shares. The amount of future dividends and the extent of future repurchases of shares will be balanced with our effort to continue to maintain an adequate liquidity position.
In 2014, we took out a two-tranche bank loan of €4,270 million in total and issued a three-tranche Eurobond of €2,750 million in total with maturities of four to 12 years to finance the acquisition of Concur. In addition a €500 million short-term bank loan was taken for the acquisition of Fieldglass and was repaid in the same year. We also repaid a €500 million Eurobond and the last tranche of the promissory notes amounting to €86 million. Thus, the ratio of total financial debt to total equity and liabilities increased by 13 percentage points to 29% at the end of 2014 (16% as at December 31, 2013).
To expand our business, we have made acquisitions of businesses, products, and technologies. Depending on our future cash position and future market conditions, we might issue additional debt instruments to fund acquisitions, maintain financial flexibility, and limit repayment risk. Therefore, we continuously monitor funding options available in the capital markets and trends in the availability of funds, as well as the cost of such funding. In recent years we were able to repay additional debt within a short period of time due to our persistently strong free cash flow. For more information about the financial debt, see the Cash Flows and Liquidity section.
Capital Structure ManagementThe primary objective of our capital structure management is to maintain a strong financial profile for investor, creditor, and customer confidence, and to support the growth of our business. We seek to maintain a capital structure that will allow us to cover our funding requirements through the capital markets at reasonable conditions, and in doing so, ensure a high level of independence, confidence, and financial flexibility.
Capital Structure
2014 2013 Change (in %)
€ millions % of Total equity and liabilities
€ millions % of Total equity and liabilities
Equity 19,598 51 16,048 59 22
Current liabilities 8,544 22 6,347 23 35
Non-current liabilities 10,366 27 4,695 17 121
Liabilities 18,909 49 11,043 41 71
Total equity and liabilities 38,507 100 27,091 100 42
105Financial Performance: Review and Analysis

Group liquidity consists of cash and cash equivalents (for example, cash at banks, money market funds, and time deposits with original maturity of three months or less) and current investments (for example, investments with original maturities of greater than three months and remaining maturities of less than one year) as reported in our Consolidated Financial Statements.
Net liquidity is Group liquidity less total financial debt as defined above.
The increase in Group liquidity compared to 2013 was mainly financing activities in issuing bonds. They were partly offset by cash outflows for acquisitions (such as Concur and Fieldglass), dividend payments, and loan repayments.
For information about the impact of cash, cash equivalents, current investments, and our financial liabilities on our income statements, see the analysis of our financial income, net, in the Operating Results (IFRS) section.
Total financial debt consists of current and non-current bank loans, bonds and private placements. For more information about our financial debt, see the Notes to the Consolidated Financial Statements section, Note (18).
As part of our financing activities, in 2015, the Company intends to repay a €550 million Eurobond as well as a US$300 million U.S. private placement tranche when they mature. Furthermore, we are planning to repay a substantial portion of our outstanding bank loans.
Total liabilities on December 31, 2014, mainly comprised financial liabilities of €11,542 million (of which €8,980 million are non-current). Financial liabilities on December 31, 2014, consisted largely of financial debt, which included amounts in euros (€8,799 million) and U.S. dollars (€2,276 million). On December 31, 2014, approximately 70% of financial debt was held at variable interest rates, partially swapped from fixed into variable using interest rate swaps. Total liabilities on December 31, 2014, also comprised non-financial liabilities. Most of these non-financial liabilities result from employee-related obligations.
For more information about financial and non-financial liabilities, see the Notes to the Consolidated Financial Statements section, Note (18). CASH FLOWS AND LIQUIDITYGroup liquidity on December 31, 2014, primarily comprised amounts in euros and U.S. dollars. Current investments are included in other financial assets in the statement of financial position. Financial debts are included within financial liabilities in the statement of financial position.
Group Liquidity of the SAP Group€ millions
2014 2013 Change
Cash and cash equivalents 3,328 2,748 580
Current investments 95 93 2
Group liquidity 3,423 2,841 582Current financial debt –2,157 –586 –1,571
Net liquidity 1 1,266 2,255 –989Non-current financial debt –8,936 –3,722 –5,214
Net liquidity 2 –7,670 –1,467 –6,203
106 Combined Management Report

sales outstanding (DSO) for receivables, defined as the average number of days from the raised invoice to cash receipt from the customer, increased three days to 65 days (2013: 62 days).
Cash outflows from investment activities increased significantly to €7,240 million in 2014 (2013: €1,781 million). The increase resulted principally from the Concur, Fieldglass, and SeeWhy acquisitions. For more information about current and planned capital expenditures, see the Assets and Investment Goals sections.
Net cash inflows from financing activities were €4,298 million in 2014, compared to net cash outflows of €1,589 million in 2013. Cash inflows in 2014 were the result of issuing a €2,750 bond and drawing two tranches (of €1,270 million and €3,000 million) of a loan. Cash outflows arose chiefly from repayments of borrowings (€1,086 million) and the repayment of convertible bonds that we assumed in connection with our acquisition of Concur (US$1,160 million). The 2013 cash outflows had resulted chiefly from dividends paid and the repayment of a €600 million bond.
Analysis of Consolidated Statements of Cash Flow
Net cash provided by operating activities decreased 9% year-over-year to €3,499 million in 2014 (2013: €3,832 million). Payments in connection with the TomorrowNow and Versata litigation had a €555 million negative effect on net cash provided by operating activities. A €61 million increase to €1,356 million in our income tax payments also negatively affected net cash provided by operating activities. In 2014, days’
Analysis of Consolidated Statements of Cash Flow€ millions
2014 2013 Change (in %)
Net cash flows from operating activities
3,499 3,832 –9
Net cash flows from investing activities
–7,240 –1,781 >100
Net cash flows from financing activities
4,298 –1,589 >100
Group Liquidity Development € millions
Group Liquidity
12/31/2013
2,841
Operating Cash Flow
Capital Expenditure
Acquisitions Dividends Paid
Proceeds from Borrowings
Repayments of Borrowings
Other Group Liquidity
12/31/2014
3,423
+3,499–2,062 +45
–737
–6,472–1,194
+7,503
107Financial Performance: Review and Analysis
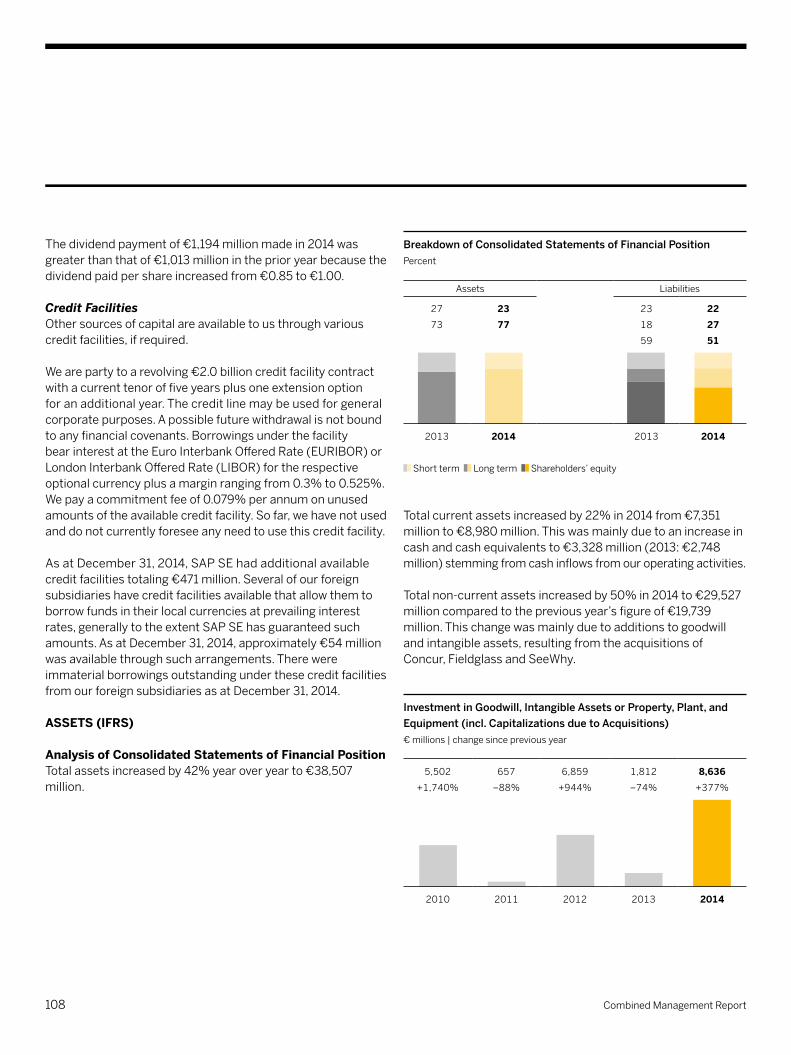
Total current assets increased by 22% in 2014 from €7,351 million to €8,980 million. This was mainly due to an increase in cash and cash equivalents to €3,328 million (2013: €2,748 million) stemming from cash inflows from our operating activities.
Total non-current assets increased by 50% in 2014 to €29,527 million compared to the previous year’s figure of €19,739 million. This change was mainly due to additions to goodwill and intangible assets, resulting from the acquisitions of Concur, Fieldglass and SeeWhy.
The dividend payment of €1,194 million made in 2014 was greater than that of €1,013 million in the prior year because the dividend paid per share increased from €0.85 to €1.00.
Credit FacilitiesOther sources of capital are available to us through various credit facilities, if required.
We are party to a revolving €2.0 billion credit facility contract with a current tenor of five years plus one extension option for an additional year. The credit line may be used for general corporate purposes. A possible future withdrawal is not bound to any financial covenants. Borrowings under the facility bear interest at the Euro Interbank Offered Rate (EURIBOR) or London Interbank Offered Rate (LIBOR) for the respective optional currency plus a margin ranging from 0.3% to 0.525%. We pay a commitment fee of 0.079% per annum on unused amounts of the available credit facility. So far, we have not used and do not currently foresee any need to use this credit facility.
As at December 31, 2014, SAP SE had additional available credit facilities totaling €471 million. Several of our foreign subsidiaries have credit facilities available that allow them to borrow funds in their local currencies at prevailing interest rates, generally to the extent SAP SE has guaranteed such amounts. As at December 31, 2014, approximately €54 million was available through such arrangements. There were immaterial borrowings outstanding under these credit facilities from our foreign subsidiaries as at December 31, 2014.
ASSETS (IFRS)
Analysis of Consolidated Statements of Financial PositionTotal assets increased by 42% year over year to €38,507 million.
Breakdown of Consolidated Statements of Financial PositionPercent
Assets Liabilities
27
73
2377
23
18
59
222751
2013 2014 2013 2014
Short term Long term Shareholders’ equity
Investment in Goodwill, Intangible Assets or Property, Plant, and Equipment (incl. Capitalizations due to Acquisitions)€ millions | change since previous year
5,502
+1,740%
657
–88%
6,859
+944%
1,812
–74%
8,636+377%
2010 2011 2012 2013 2014
108 Combined Management Report
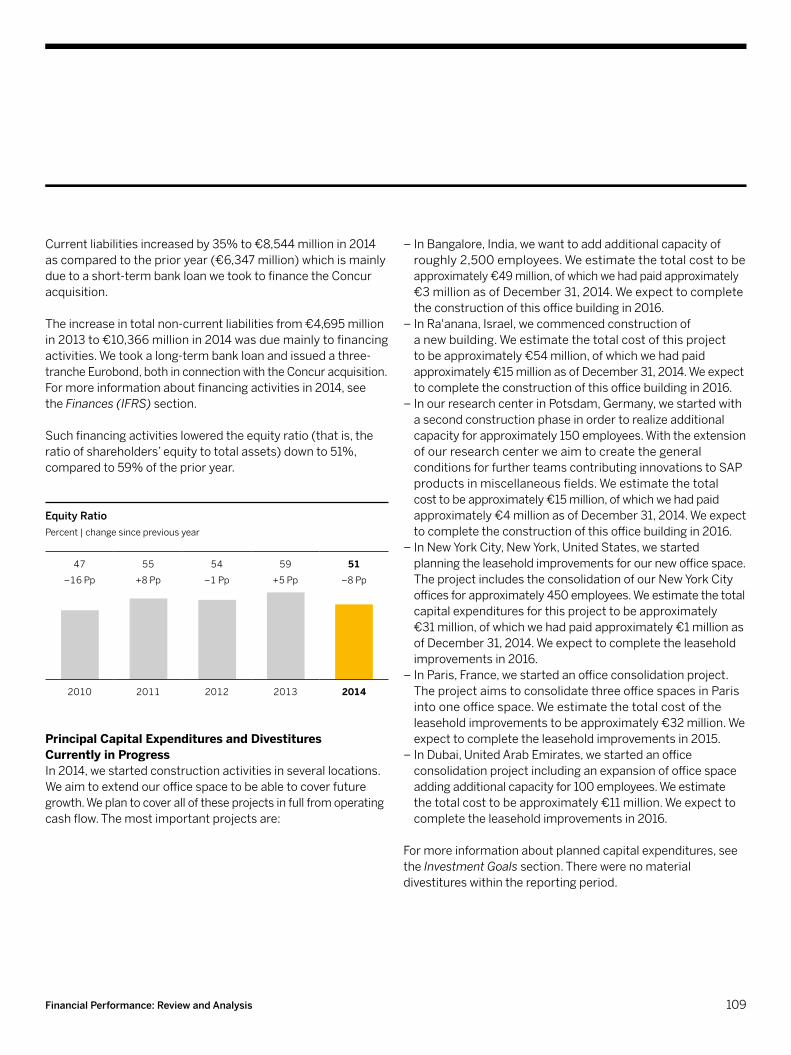
– In Bangalore, India, we want to add additional capacity of roughly 2,500 employees. We estimate the total cost to be approximately €49 million, of which we had paid approximately €3 million as of December 31, 2014. We expect to complete the construction of this office building in 2016.
– In Ra'anana, Israel, we commenced construction of a new building. We estimate the total cost of this project to be approximately €54 million, of which we had paid approximately €15 million as of December 31, 2014. We expect to complete the construction of this office building in 2016.
– In our research center in Potsdam, Germany, we started with a second construction phase in order to realize additional capacity for approximately 150 employees. With the extension of our research center we aim to create the general conditions for further teams contributing innovations to SAP products in miscellaneous fields. We estimate the total cost to be approximately €15 million, of which we had paid approximately €4 million as of December 31, 2014. We expect to complete the construction of this office building in 2016.
– In New York City, New York, United States, we started planning the leasehold improvements for our new office space. The project includes the consolidation of our New York City offices for approximately 450 employees. We estimate the total capital expenditures for this project to be approximately €31 million, of which we had paid approximately €1 million as of December 31, 2014. We expect to complete the leasehold improvements in 2016.
– In Paris, France, we started an office consolidation project. The project aims to consolidate three office spaces in Paris into one office space. We estimate the total cost of the leasehold improvements to be approximately €32 million. We expect to complete the leasehold improvements in 2015.
– In Dubai, United Arab Emirates, we started an office consolidation project including an expansion of office space adding additional capacity for 100 employees. We estimate the total cost to be approximately €11 million. We expect to complete the leasehold improvements in 2016.
For more information about planned capital expenditures, see the Investment Goals section. There were no material divestitures within the reporting period.
Current liabilities increased by 35% to €8,544 million in 2014 as compared to the prior year (€6,347 million) which is mainly due to a short-term bank loan we took to finance the Concur acquisition.
The increase in total non-current liabilities from €4,695 million in 2013 to €10,366 million in 2014 was due mainly to financing activities. We took a long-term bank loan and issued a three-tranche Eurobond, both in connection with the Concur acquisition. For more information about financing activities in 2014, see the Finances (IFRS) section.
Such financing activities lowered the equity ratio (that is, the ratio of shareholders’ equity to total assets) down to 51%, compared to 59% of the prior year.
Principal Capital Expenditures and Divestitures Currently in Progress In 2014, we started construction activities in several locations. We aim to extend our office space to be able to cover future growth. We plan to cover all of these projects in full from operating cash flow. The most important projects are:
Equity RatioPercent | change since previous year
47
–16 Pp
55
+8 Pp
54
–1 Pp
59
+5 Pp
51–8 Pp
2010 2011 2012 2013 2014
109Financial Performance: Review and Analysis

Our customer capital continued to grow in 2014. We gained more than 28,500 new customers in various market segments and strengthened our existing customer relationships. To help us improve insight into our customers’ view of SAP, in 2012 we began measuring our Customer Net Promoter Score (NPS), a metric that gives a more complete picture of customer loyalty as it answers the question of how likely our customers would be to recommend SAP. For more information about our new customers and NPS, see the Customers section.
Employee-related activities increased the value of our employee base and our own software. For more information, see the Employees and Social Performance section and the Products, Research & Development, and Services section. We also increased the value of our partner ecosystem by continuing to develop sales and development partnerships.
REPORT ON THE ECONOMIC POSITION OF SAP SESAP SE is headquartered in Walldorf, Germany, and is the parent company of the SAP Group, which comprises 288 companies. SAP SE is the Group holding company and employs most of the Group’s Germany-based development and service and support personnel.
As the owner of the intellectual property in most SAP software, SAP SE derives its revenue mainly from software license fees paid by its subsidiaries for the right to market SAP solutions.
The SAP SE annual financial statements are prepared in accordance with the reporting standards in the German Commercial Code and the German Stock Corporation Act. The full SAP SE annual financial report and unqualified audit report are submitted to the operator of the Elektronischer Bundesanzeiger (Online German Federal Gazette) for publication and inclusion in the Unternehmensregister (German Business Register). It is available from SAP SE on request.
COMPETITIVE INTANGIBLESThe resources that are the basis for our current as well as future success do not appear on the Consolidated Statements of Financial Position. This is apparent from a comparison of the market capitalization of SAP SE (based on all outstanding shares), which was €71.6 billion at the end of 2014 (2013: €76.5 billion), with the book value of our equity on the Consolidated Statements of Financial Position, which was €19.6 billion (2013: €16.0 billion). This means that the market capitalization of our equity is more than three times higher than the book value. The difference is mainly due to certain internally generated intangible resources that the applicable accounting standards do not allow to be recorded (at all or at fair value) on the Consolidated Statements of Financial Position. They include customer capital (our customer base and customer relations), employees and their knowledge and skills, our ecosystem of partners, software we developed ourselves, our ability to innovate, the brands we have built up – in particular, the SAP brand itself – and our organization. On December 31, 2014, SAP ranked fourth of the most valuable companies in Germany in terms of market capitalization based on all outstanding shares. According to the Interbrand “Best Global Brands” annual survey, SAP ranked again the 25th most valued brand in the world (2013: 25th). Against other German brands, the SAP brand ranks third behind Mercedes-Benz and BMW, and 9th globally against other IT brands. Interbrand determined our brand value as US$17.3 billion, an increase of 4% compared to the previous year (2013: US$16.7 billion).
The results of our current and past investment in research and development are also a significant element in our competitive intangibles.
110 Combined Management Report

administration staff employed by SAP SE, increased 6% to €1,476 million (2013: €1,390 million) primarily because headcount increased over the year. Other operating expenses increased 23% to €2,697 million (2013: €2,197 million). This increase is mainly attributable to litigation settlement payments in the amount of €267 million and higher currency losses which increased €122 million compared to the previous year. The effect was partly offset by decreased costs for third-party services and impairments of trade receivables. SAP SE operating income decreased 15% to €2,135 million (2013: €2,514 million), primarily due to an increase in other operating expenses.
Finance income was €921 million (2013: €825 million), an increase of €96 million compared with the previous year. The increase is due to a €148 million increase in income from securities classified as financial assets, a €78 million increase in investment income, and an €8 million increase in net interest income. These were in part offset by a decrease of €125 million in income from profit transfer agreements and an increase of €13 million in write-downs of financial assets.
SAP SE income from ordinary activities, which is the sum of operating profit and finance income, decreased €283 million to €3,056 million (2013: €3,339 million). Income tax decreased 10% to €749 million (2013: €834 million). After deducting taxes, the resultant net income is €2,307 million (2013: €2,505 million), a decrease of €198 million year-over-year.
IncomeThe income statement uses the nature of expense method and presents amounts in millions of euros.
The total revenue of SAP SE in 2014 was €8,957 million (2013: €8,413 million), an increase of 6%. Product revenue increased €383 million to €6,926 million (2013: €6,543 million). As in previous years, product revenue was primarily generated from license fees paid by subsidiaries of SAP SE. The increase in SAP SE revenue in 2014 was therefore principally the result of the increase in software and software-related service revenue achieved by the SAP Group.
Other operating income decreased €171 million to €722 million (2013: €893 million). The year-over-year decrease is due primarily to a decline in gains from currency effects. SAP SE cost of services and materials increased 7% to €3,099 million (2013: €2,896 million). SAP SE cost of services and materials comprises third-party services, including those provided by SAP subsidiaries. SAP SE personnel expenses, mainly the labor cost of the developers, service and support employees, and
SAP SE Income Statement – German Commercial Code (Short Version)€ millions
2014 2013
Total revenue 8,957 8,413Other operating income 722 893
Cost of services and materials –3,099 –2,896
Personnel expenses –1,476 –1,390
Depreciation and amortization –272 –309
Other operating expenses –2,697 –2,197
Operating profit 2,135 2,514Finance income 921 825Income from ordinary activities 3,056 3,339Income taxes –749 –834
Net income 2,307 2,505
111Financial Performance: Review and Analysis

SAP SE shareholders’ equity rose 11% to €12,494 million (2013: €11,295 million). Against outflows of €1,194 million associated with the payment of the 2013 dividend, there was a €2,307 million increase in net income and an inflow of €85 million from the issuance of shares to service the share-based payments of employees. The equity ratio (that is, the ratio of shareholders’ equity to total assets) decreased from 51% in 2013 to 41% in 2014.
Provisions decreased €101 million to €1,102 million (2013: €1,203 million). While the other provisions increased €12 million to €674 million, the reserves for tax decreased €113 million to €426 million (2013: €539 million).
Other liabilities increased €7,019 million to €16,568 million (2013: €9,549 million). This increase is mainly attributable to higher financing liabilities for the acquisition of Concur and Fieldglass in the amount of €6,433 million in 2014. Liabilities to affiliated companies increased €599 million, primarily due to increased cash contributions by subsidiaries through SAP SE’s centralized management of finance and liquidity.
Cash flow from operating activities decreased €118 million to €2,869 million in 2014 (2013: €2,987 million), largely caused by a decrease in net income. This decrease was partly offset by the abovementioned cash contributions by subsidiaries through SAP SE’s centralized management of finance and liquidity.
Assets and Financial PositionIn 2014, SAP SE total assets closed at €30,169 million (2013: €22,055 million).
Financial assets increased €8,096 million compared with the previous year to €24,953 million (2013: €16,857 million), due mainly to the increase in contributions to subsidiaries for the acquisitions of Concur and Fieldglass. Short-term assets stood at €3,741 million (2013: €3,743 million), a year-over-year decrease of €2 million, reflecting a €191 million increase in accounts receivable and €193 million decrease in liquid assets.
SAP SE Balance Sheet – German Commercial Code (Short Version)€ millions
12/31/2014 12/31/2013
AssetsIntangible assets 232 289
Property, plant, and equipment 994 965
Financial assets 24,953 16,857
Fixed assets 26,179 18,111Inventories 2 2
Accounts receivable 3,048 2,857
Liquid assets 691 884
Short-term assets 3,741 3,743
Prepaid expenses and deferred charges
146 113
Deferred taxes 70 63Surplus arising from offsetting 33 25Total assets 30,169 22,055
Equity and liabilitiesShareholders' equity 12,494 11,295
Provisions 1,102 1,203
Other liabilities 16,568 9,549
Deferred income 5 8
Total shareholders' equity and liabilities
30,169 22,055
112 Combined Management Report

At the close of the year, SAP SE held €691 million in short-term liquid assets (2013: €834 million), a year-over-year decrease of €143 million.
Opportunities and RisksSAP SE is subject to materially the same opportunities and risks as the SAP Group. For more information, see the Risk Management and Risks as well as the Expected Developments and Opportunities sections.
SAP SE used net cash flows from investing activities of €8,302 million in 2014 (2013: €485 million), a year-over-year increase of €7,817 million, notably for contributions to the capital of SAP America, Inc. in connection with the acquisition of Concur and Fieldglass and €266 million for property, plant, and equipment. They were in part offset by inflows of €73 million from sales of property, plant and equipment and financial assets, additonally long-term investments of SAP SE generated cash inflows of €50 million.
Net cash flows from financing activities were €5,290 million in 2014 compared to a cash outflow of €1,975 million in 2013. Inflows of €7,520 million were mainly attributable to the issued new bonds and the additional loans for the abovementioned acquisitions, and €54 million inflows were generated from the reissuance of treasury shares for share-based payments. SAP SE outflows included the dividend of €1,194 million (2013: €1,013 million) and repayments of financial liabilities of €1,090 million.
SAP SE Cash Flow Statement – German Commercial Code (Short Version)Mio. €
2014 2013
Net cash flows from operating activities
2,869 2,987
Net cash flows from investing activities
–8,302 –485
Net cash flows from financing activities
5,290 –1,975
Net decrease/increase in cash and cash equivalents
–143 527
Cash and cash equivalents at the beginning of the year
834 307
Cash and cash equivalents at the end of the year
691 834
113Financial Performance: Review and Analysis

With effect from the closing of the Annual General Meeting of Shareholders on May 21, 2014, Jim Hagemann Snabe resigned from his position as co-CEO of SAP AG and was elected to the Supervisory Board of SAP SE.
Effective July 1, 2014, Luka Mucic succeeded Werner Brandt as chief financial officer, when the latter retired, as planned, from the Executive Board.
INFORMATION CONCERNING TAKEOVERSInformation required under the German Commercial Code, sections 289 (4) and 315 (4), with explanatory report.– Composition of share capital: For information about the
composition of SAP SE’s share capital as of December 31, 2014, see the Notes to the Consolidated Financial Statements section, Note 21. Each share entitles the bearer to one vote. American depositary receipts (ADRs) representing our shares are listed on the New York Stock Exchange in the United States. ADRs are certificates representing non-U.S. shares and are traded on U.S. stock exchanges instead of the underlying shares. One SAP ADR corresponds to one SAP share.
– Restrictions applying to share voting rights or transfers: SAP shares are not subject to transfer restrictions except the lock-in period under the SAP Share Matching Plan (SMP), described below. SAP held 33,274,852 treasury shares as at December 31, 2014. Treasury shares do not entitle us to any rights, and therefore not to any voting rights or dividend. Shares issued in 2014 under the employee SMP are subject to contractual transfer restrictions for a three-year lock-in period unless the plan member’s employment with SAP is ended during that period. Until that lock-in period has expired, the participating employees are not ordinarily allowed to dispose of the shares they have acquired under the plan. We are not aware of any other restrictions applying to share voting rights or to share transfers.
– Shareholdings that exceed 10% of the voting rights: We are not aware of any direct or indirect SAP SE shareholdings that exceed 10% of the voting rights.
CORPORATE GOVERNANCE STATEMENTThe German Commercial Code, section 289a, requires that as a listed company, SAP SE publish a corporate governance statement either as part of its management report or on its Web site. The Executive Board of SAP SE filed the corporate governance statement on February 18, 2015, and published it on the SAP public Web site at www.sap.com/corporate-en/investors/governance.
For more information about the corporate governance of SAP, see the Corporate Governance Report section.
CONVERSION TO A EUROPEAN COMPANYAt the Annual General Meeting of Shareholders on May 21, 2014, SAP shareholders approved the conversion of the Company’s legal form to a European Company (Societas Europaea, SE). The conversion became effective when it was entered in the commercial register on July 7, 2014. Since this date, the Company’s legal form is SAP SE.
CHANGES IN MANAGEMENTBob Calderoni, president of Ariba, an SAP company, and a member of our Global Managing Board, left SAP on January 15, 2014.
On May 4, 2014, the Supervisory Board appointed Robert Enslin and Bernd Leukert to the Executive Board, with immediate effect. Robert Enslin continues to be responsible for our global customer operations. Bernd Leukert assumed responsibility for the entire development organization for products and innovation from Vishal Sikka who resigned from the Executive Board for personal reasons and left the Company on May 4, 2014.
In addition, the Supervisory Board of SAP SE endorsed the appointment of Ingrid-Helen Arnold and Stefan Ries to our Global Managing Board, with a view to further strengthening the next generation of SAP executives.
Corporate Governance Fundamentals
114 Combined Management Report

59, and the German Stock Corporation Act, section 179, an amendment of the Articles of Incorporation requires a resolution of the General Meeting of Shareholders with a majority of at least three-quarters of the valid votes cast. For any amendments of the Articles of Incorporation which require a simple majority for stock corporations established under German law, however, the simple majority of the valid votes cast is sufficient if at least half of the subscribed capital is represented or, in the absence of such quorum, the majority prescribed by law (that is, two thirds of the votes cast, pursuant to article 59 of the SE Regulation) is sufficient. Section 11 (2) of the Articles of Incorporation authorizes the Supervisory Board to amend the Articles of Incorporation where such amendments only concern the wording.
– Powers of the Executive Board to issue and repurchase shares: The Annual General Meeting of Shareholders on May 25, 2011, granted powers to the Executive Board, subject to the consent of the Supervisory Board, to issue convertible and warrant-linked bonds and to grant conversion and option rights in respect of SAP SE shares representing a total attributable portion of the share capital of not more than €100 million secured by a corresponding amount of contingent capital. These powers will expire on May 24, 2016. The Executive Board is also authorized until June 7, 2015, to increase the share capital by not more than €250 million by issuing new shares against contributions in cash and to increase the share capital by not more than €250 million by issuing new shares against contributions in cash or in kind. For more details about the different tranches of authorized capital and the aforementioned contingent capital, see the Articles of Incorporation, section 4. The Annual General Meeting of Shareholders on June 4, 2013, granted a power to the Executive Board in accordance with the German Stock Corporation Act, section 71 (1)(8), to buy back for treasury on or before June 3, 2018, SAP SE shares attributable in total to not more than €120 million of the share capital. The power is subject to the proviso that the shares repurchased, together with any shares that were previously acquired and are still held by SAP in treasury and any other shares controlled by SAP, must not in total exceed 10% of SAP’s share capital. Executive Board powers, such as those described to issue and repurchase stock and to grant rights of conversion and subscription to shares of SAP, are widely followed common practice among German companies like SAP. They give the Executive Board the flexibility it needs,
– Shares with special rights conferring powers of control: No SAP shareholder has special rights conferring powers of control.
– Type of control over voting rights applying to employee shareholders who do not directly exercise their control rights: As with other shareholders, employee holders of SAP shares exercise their control rights in accordance with the law and the Articles of Incorporation. In votes on the formal approval of their acts at the Annual General Meeting of Shareholders, employee representatives on the Supervisory Board – as all other members of the Supervisory Board – are prohibited from exercising the voting rights associated with their shares.
– Legal requirements and provisions in the Articles of Incorporation concerning the appointment and dismissal of members of the Executive Board and amendment to the Articles of Incorporation: Conditions for the appointment and dismissal of members of the Executive Board and amendment to the Articles of Incorporation reflect the relevant provisions of applicable European and German law, including Council Regulation (EC) No. 2157/2001 on the Statute for a European Company (the “SE Regulation”) and the German Stock Corporation Act. Under the Articles of Incorporation, the Executive Board consists of at least two members who are appointed for a period of not more than five years by the Supervisory Board in accordance with the SE Regulation, articles 39 and 46. The number of members of the Executive Board is decided by the Supervisory Board. Executive Board members may be reappointed for, or their term of office extended by, a maximum of five years. Simple majority of the Supervisory Board membership is required for Executive Board appointments. In the event of a tie, the chairperson of the Supervisory Board has the casting vote. The Supervisory Board can appoint a chairperson of the Executive Board and one or more deputy chairpersons from among the members of the Executive Board. The Supervisory Board can revoke appointments to the Executive Board in accordance with the SE Regulation, article 9, and the German Stock Corporation Act, section 84, if compelling reasons exist, such as gross negligence on the part of the Executive Board member. If the Executive Board is short of a required member, one may be appointed in urgent cases by a court in accordance with the SE Regulation, article 9, and the German Stock Corporation Act, section 85. In accordance with the SE Regulation, article
115Corporate Governance Fundamentals

in fiscal year 2014. In 2012, SAP set up a Debt Issuance Program under which a first tranche of Eurobonds in the amount of €1.3 billion was issued. In 2013, a new €4 billion Debt Issuance Program was set up under which no bonds were issued until December 31, 2013. In 2014, SAP renewed our Debt Issuance Program that now amounts to €6 billion. In November 2014, three tranches of Eurobonds in the total amount of €2.75 billion were issued under the Debt Issuance Program. For more information about these bonds, see the Notes to the Consolidated Financial Statements section, Note (18b). Under the terms agreed with the buyers, we are required to notify the buyers of any change of control without delay. If there is a change of control and SAP is consequently assigned a lower credit rating within a defined period, buyers are entitled to demand repayment.
Under the terms of our U.S. private placements totaling US$2.65 billion, we are required to offer lenders repayment of outstanding debt if there is a change of control and SAP is consequently assigned a lower credit rating within a defined period. For more information about these private placements, see the Notes to the Consolidated Financial Statements section, Note (18b). Lenders would have at least 30 days to accept the offer.
We have entered into relationships with other companies to jointly develop and market new software products. These relationships are governed by development and marketing agreements with the respective companies. Some of the agreements include provisions that, in the event of a change of control over one of the parties, give the other party a right to consent to the assignment of the agreement or to terminate it.
– Agreements to compensate members of the Executive Board or the employees in the event of a takeover bid: Agreements have been concluded with the members of the Executive Board concerning compensation in the event of a change of control. These agreements, which are customary in Germany and elsewhere, are described in the Compensation Report, which is an integral part of this management report. We have no analogous compensation agreements with other employees.
in particular, the options to use SAP shares as consideration in equity investments, raise funds on the financial markets at short notice on favorable terms, or return value to shareholders during the course of the year. To service the SMP, which is an employee stock plan we established in 2010, the Executive Board is authorized, subject to Supervisory Board consent, to issue to participants of the plan new shares until June 7, 2015. This authorized capital has been used for plan tranches in 2010, 2011, and 2012 (but not in 2013 and 2014), and on December 31, 2014, it empowered the Company to issue new shares representing a total attributable portion of the share capital of not more than €29,609,256.
– Material agreements with provisions that take effect in the event of a change of control following a takeover bid: SAP SE has concluded the following material agreements with provisions that take effect in the event of a change of control, whether following a takeover bid or otherwise: The terms of SAP’s syndicated €2 billion revolving credit facility include a change-of-control clause. For more information about this syndicated credit facility, see the Notes to the Consolidated Financial Statements section, Note (26). This clause obliges SAP SE to notify the banks in case of a change of control. If, on receiving the notification, banks that represent at least two-thirds of the credit volume so require, the banks have the right to cancel the credit facility and demand complete repayment of the outstanding debt. If no continuation agreement is reached, the credit facility would end and the obligation to repay would become effective at an ascertainable time. In agreements between SAP SE and various banks for bilateral credit facilities that totaled €471 million as at December 31, 2014, we have agreed customary material adverse change clauses permitting the banks to terminate if events occur that are materially averse to the economic standing of SAP SE, which may possibly also include a change of control. We believe that in view of our current liquidity situation, termination of these credit facilities would not have a material adverse effect, at least in the near term.
SAP issued two bonds in 2010, each in two tranches of different tenures, totaling €2.2 billion, of which one matured
116 Combined Management Report

Our risk management system is based on five pillars, comprising a dedicated risk management policy and a standardized risk management methodology followed by a global risk management organization. The internal control system comprises the internal control and risk management system for financial reporting (ICRMFR) that also covers the broader business environment. In 2014, we continued to implement continuous control monitoring and continuous auditing in selected areas. Using the Committee of Sponsoring Organizations of the Treadway Commission (COSO) framework 2013, we define and cover internal controls all along the value chain on a process and subprocess level to assure that sound business objectives are set in line with the organization’s strategic, operational, financial, and compliance goals. In addition, we have a governance model in place across risk management and the internal control system to ensure both systems are effective, as well as a central software solution to store, maintain, and report all risk-relevant information.
Risk Management Policy and FrameworkThe risk management policy issued by our Executive Board governs how we handle risk in line with the Company’s risk appetite and defines a methodology that is applied uniformly across all parts of the Group. The policy stipulates who is responsible for conducting risk management activities and defines reporting and monitoring structures. In 2014, as part of our regular review, we updated and rolled out the mandatory policy to all employees with a dedicated acknowledgement process. Our global corporate audit function conducts regular audits to assess the effectiveness of our risk management system. Every year, SAP’s external auditor assesses if SAP SE’s early risk identification system is adequate to identify risks that may endanger our ability to continue as a going concern. SAP’s enterprise risk management follows COSO II (integrated framework for enterprise risk management) and covers risks in the areas of strategy, operational business, financial reporting, and compliance. As of today, the risk management system analyzes risks and only assesses or analyzes opportunities where deemed appropriate.
OUR RISK MANAGEMENT
Internal Control and Risk Management SystemAs a global company, SAP is exposed to a wide variety of risks across our range of business operations. As a consequence, the Executive Board has put comprehensive risk management and internal control structures into place that enable SAP to identify and analyze risks early on and take appropriate action. Our risk management and internal control system is designed to identify potential events that could negatively impact the Company and to provide reasonable assurance regarding the achievement of the Company objectives, specifically our ability to achieve our financial, operational, or strategic goals as planned.
This system comprises multiple control mechanisms and is an important element of the corporate decision-making process; it is therefore implemented as an integral part of SAP’s business processes across the entire Group. Ensuring that our global risk management efforts are effective and enable us to aggregate risks and report on them transparently, we have adopted an integrated risk management and internal control approach.
Because we are publicly listed in both Germany and the United States, we are subject to both German and U.S. regulatory requirements that relate to risk management and internal controls over financial reporting, such as provisions in the German Stock Corporation Act, section 91 (2), and the U.S. Sarbanes-Oxley Act (SOX) of 2002, section 404. Our Executive Board has established an early warning system (risk management system) to ensure compliance with applicable regulations and for the effective management of risks.
Risk Management and Risks
117Risk Management and Risks

The period for analyzing our risks is at least the used forecast period. The period for analyzing our risks that could be possible threats to the Group’s ability to continue as a going concern, is eight rolling quarters.
Based on the likelihood that a risk will occur as well as the impact the risk would have on SAP’s reputation, business, financial position, profit, and cash flow leads us to classify the risks as “high,” “medium,” or “low.”
Risk Management Methodology and ReportingThe following sections describe the key elements of the risk management process as part of the SAP risk management policy: risk planning, identification, analysis, response, and monitoring.
Risk planning and risk identification for both internal and external risks are conducted in cooperation between risk managers and the business units or subsidiaries across the Group. We use various techniques to identify risks. For example, we have identified risk indicators and developed a comprehensive risk catalog that includes risk mitigation strategies for known product and project risks. Risk identification takes place at various levels of our organization to ensure that common risk trends are identified and end-to-end risk management across organizational borders is enabled. We apply both qualitative and quantitative risk analysis as well as other risk analysis methods such as sensitivity analyses and simulation techniques.
To determine which risks pose the highest threat to the viability of the SAP Group, we classify them as “high,” “medium,” or “low” based on the likelihood that a risk will occur within the assessment horizon as well as the impact the risk would have on SAP’s business objectives if it were realized. The scales for measuring these two indicators are given in the following tables.
In this framework, we define a remote risk as one that will occur only under exceptional circumstances and a near certain risk as one that can be expected to occur within the specified time horizon.
Probability/Likelihood of Occurrence Description1% to 19% Remote
20% to 39% Unlikely
40% to 59% Likely
60% to 79% Highly Likely
80% to 99% Near Certainty
Impact Level Impact DefinitionInsignificant Negligible negative impact on business, financial position,
profit, and cash flows
Minor Limited negative impact on business, financial position, profit, and cash flows
Moderate Some potential negative impact on business, financial position, profit, and cash flows
Major Considerable negative impact on business, financial position, profit, and cash flows
Business-Critical Detrimental negative impact on business, financial position, profit, and cash flows
118 Combined Management Report

All identified and relevant risks are reported at the local, regional, and global levels in accordance with our risk management policy. At local, regional, and global levels, we have established executive risk councils that regularly discuss risks and countermeasures and that monitor the success of risk mitigation. In addition, the Executive Board is informed quarterly about individual risks based on clearly defined reporting criteria. Newly identified or existing significant risks that are above a defined threshold or with a potential significant impact are also reported to the chairperson of the Supervisory Board and to the chairperson of the Audit Committee of the Supervisory Board. This includes any potential going concern risks.
We also have a process in place that analyzes those risks with respect to potential effects on liquidity, excessive indebtedness, and insolvency, which could be possible threats to the Group’s ability to continue as a going concern.
Risk Management OrganizationOur risk management organization ensures the coverage of the functions of risk management governance, strategic, operational, financial, and compliance risk management. The Global Governance, Risk & Compliance (GRC) organization comprises a group-wide governance function, which includes
Risk analysis is followed by risk response and risk monitoring. Our risk managers work in close cooperation with the business owners, ensuring that effective strategies are implemented to address risks. Risks may be reduced by taking active steps based on risk approval. Business owners are responsible for continuously monitoring the risks and the effectiveness of mitigation strategies, with support from the respective risk managers. To provide greater risk transparency and enable appropriate decision making for business owners, we have established a risk delegation of authority (RDOA) for relevant parts of the organization as deemed appropriate. RDOA is a risk management decision-making hierarchy that helps business owners gain timely insight into projects and processes with the greatest risk, so they are better able to review the relevant information, understand the risk profile and associated mitigation strategies, and determine if their approval is warranted. Depending on the exposure, approval is required at different levels of the Company, up to and including the Executive Board.
Probability
80–99% L M H H H
60–79% L M M H H
40–59% L L M M H
20–39% L L L M M
1–19% L L L L M
Insignificant Minor Moderate Major Business-Critical
ImpactH = High riskM = Medium riskL = Low risk
119Risk Management and Risks

Risk managers are responsible for supporting and monitoring the implementation of risk management across the Group that is both effective and compliant with regulatory requirements and SAP’s global risk management policy. Based on SAP’s risk management policy, all risks and risk-related matters have to be reported to the Global GRC organization.
The head of Global GRC, together with other key functions (for example Global Controlling or Treasury), is responsible for SAP’s internal control and risk management program, and provides regular updates to the Audit Committee of the Supervisory Board. The overall risk profile of the Group is consolidated by the head of Global GRC, who reports to the Group CFO.
Internal Control and Risk Management System for Financial ReportingThe purpose of a company’s system of internal control over financial reporting is to ensure with sufficient certainty that its financial reporting is reliable and in compliance with applicable generally accepted accounting principles. Because of the inherent limitations of internal control over financial reporting, it may not prevent or bring to light all potential misstatements in our financial statements.
SAP’s internal control and risk management system for financial reporting (ICRMSFR) is based on our Group-wide risk management methodology. The ICRMSFR includes organizational, control, and monitoring structures designed to ensure that data and information concerning our business are collected, compiled, and analyzed in accordance with applicable laws and properly reflected in the IFRS Consolidated Financial Statements.
Our ICRMSFR also includes policies, procedures, and measures designed to ensure compliance of SAP’s financial reports with applicable law and standards. We analyze new statutes, standards, and other pronouncements concerning IFRS accounting and its impact on the ICRMSFR. Failure to adhere to them would present a substantial risk to the compliance of our financial reporting. Finally, the ICRMSFR has both preventive and detective controls, including, for example, automated and non-automated reconciliations, segregated duties with two-person responsibility, authorization concepts in our software systems, and monitoring.
regular maintenance and implementation of our risk management policy. The uniform process model comprises all essential elements of risk management: risk planning, risk identification, risk analysis, risk response, and risk monitoring. This function is also responsible for standardized risk reporting to risk committees at different levels of the Company, including the Executive Board as well as the chairpersons of the Supervisory Board and the Audit Committee.
Our strategic risk management function resides within Global Controlling and is responsible for enabling early identification and mitigation of risks that could threaten the successful execution of SAP’s strategic priorities and targets. It also supports the successful execution of our corporate strategy by creating transparency regarding risks that could threaten commercial interests or intangible assets such as corporate or product reputation and brand image.
Operational and financial risk management is uniformly implemented at SAP. GRC risk managers independent of the business are assigned to each of SAP’s important business units and business activities and to selected strategic initiatives. All GRC risk managers, together with assigned risk contacts in the business units, continuously identify and assess risks associated with material business operations using a uniform approach and monitor the implementation and effectiveness of the measures chosen to mitigate risks. Further financial risk management activities are performed by our Global Treasury function.
During the merger and acquisition and post-merger integration phase newly acquired companies are subject to risk management performed by SAP’s Corporate Development function. Furthermore, as long as they are not integrated, existing risk management structures are maintained within the acquired companies.
120 Combined Management Report

Its assessment of the effectiveness of the ICRMSFR related to our IFRS consolidated financial statements was that on December 31, 2014, the Group has an effective internal control system over financial reporting.
Risk Management and Internal Control GovernanceOur Executive Board is responsible for ensuring the effectiveness of the risk management and internal control system. The effectiveness of both systems and their implementation in the different Executive Board areas is monitored by each board member. We regularly provide a status on the risk management and the internal control system to the Audit Committee. Key risks are reported quarterly to the chairman of the Supervisory Board and in the Audit Committee. The Audit Committee of the Supervisory Board regularly monitors the effectiveness of SAP’s risk management and internal control system. In this regard, they requested the Corporate Audit department to regularly audit various aspects of the risk management system and its effectiveness. Additional reassurance will be obtained through the external audit of the effectiveness of our internal control system over financial reporting and the internal warning system.
Software Solution DeployedWe use our own risk management software (SAP solution for GRC) to effectively support the governance process. Risk managers record and address identified risks using our risk management software to create transparency across all known risks that exist in the Group, as well as to facilitate risk management and the associated risk reporting. This information is available to managers through a mobile app as well as regularly issued reports, and is consolidated and aggregated for the quarterly risk report to the Executive Board. The solution also supports the risk-based approach of SAP’s internal control and risk management system for financial reporting (ICRMSFR).
Our Corporate Financial Reporting department codifies all accounting policies in the Group Accounting and Global Revenue Recognition Guidelines. These policies and the corporate closing schedule together define the closing process. Under this closing process, all SAP legal entities prepare, partly supported by centralized and outsourced services, their financial statements for consolidation by our Corporate Financial Reporting department. The Corporate Financial Reporting department and other corporate departments assist the local subsidiaries’ efforts to comply with Group accounting policies and monitor their work. Our corporate audit function and Corporate Financial Reporting department conduct financial statement audits of SAP subsidiaries.
The Corporate Financial Reporting department conducts all of SAP’s financial consolidation. We have outsourced some work, such as valuing projected benefit obligations and share-based payment obligations, and purchase price allocations in the context of asset acquisitions and business combinations. We have also outsourced the preparation of the local statutory financial statements of most of our subsidiaries. The employees who work on SAP’s financial reporting receive training in the policies and processes.
A committee proposes the results of the assessment on the ICRMSFR effectiveness with respect to our IFRS consolidated financial statements as at December 31 each year to the Group CFO based on an analysis of the design and operating effectiveness of our respective internal controls over financial reporting. The committee meets regularly to set the annual scope for the test of effectiveness, to evaluate any possible weaknesses in the controls, and to determine measures to address them adequately. During its own meetings, the Audit Committee of the Supervisory Board regularly scrutinizes the resulting assessments of the effectiveness of the internal controls with respect to the IFRS consolidated financial statements.
121Risk Management and Risks

These events could reduce the demand for SAP software and services, and lead to:– Delays in purchases, decreased deal size, or cancelations of
proposed investments– Potential lawsuits from customers due to denied provision of
service as a result of sanctioned party lists or export control issues
– Higher credit barriers for customers, reducing their ability to finance software purchases
– Increased number of bankruptcies among customers, business partners, and key suppliers
– Increased default risk, which may lead to significant impairment charges in the future
– Market disruption from aggressive competitive behavior, acquisitions, or business practices
– Increased price competition and demand for cheaper products and services
Any one or more of these might reduce our ability to sell and deliver our software and services which could have an adverse effect on our business, financial position, profit, and cash flows.
SAP has established measures and conducted scenario analyses to address and mitigate the described risks and adverse effects to the extent possible. We offer our customers standard software and product packages that are fast and easy to install, as well as financially attractive financing, software licensing, and subscription models. Furthermore, we continue to apply cost discipline internally and have a conservative financial planning policy. Additionally, SAP is continuously reshaping our organizational structure and processes to increase efficiency.
We estimate the probability of occurrence of this risk to be likely. Therefore, we cannot completely exclude the possibility that it will have a business-critical impact on our business, financial position, profit, and cash flows. This could exacerbate the other risks we describe in this report or cause a negative deviation from our revenue and operating profit target. We classify this risk as a high risk.
RISK FACTORSThe following sections outline risk factors that we identify and track using our risk management software (SAP solutions for GRC). They are presented below at a more aggregated level as compared to their use in internal controlling, but are broken down by the same risk categories we use in our internal risk management system reporting structure.
SAP SE is the parent company of the SAP Group. Consequently, the risks described below also apply – directly or indirectly – to SAP SE.
Economic, Political, Social, and Regulatory Risk
Uncertainty in the global economy, financial markets, or political conditions could have a negative impact on our business, financial position, profit, and cash flows, and put pressure on our operating profit.
Our business is influenced by multiple risk factors that are both difficult to predict and beyond our influence and control. These factors include global economic and business conditions and fluctuations in national currencies. Other examples are political developments and general regulations, as well as budgetary constraints or shifts in spending priorities of national governments.
Macroeconomic developments, such as a global economic crisis, chronic fiscal imbalances and slowing economic conditions in emerging markets, might decrease the ability and willingness of our customers to invest in our solutions or might lead to delays in purchasing. In addition, changes in the euro rates for particular currencies might have an adverse effect on business activities with local customers and partners. Furthermore, political instabilities in regions such as the Middle East and Africa, crisis situations (such as in Ukraine), natural disasters, and pandemic diseases (such as Ebola) contribute to economic and political uncertainty.
122 Combined Management Report
As we expand further into new countries and markets, these risks could intensify. The application of these laws and regulations to our business is sometimes unclear, subject to change over time, and sometimes may conflict between different jurisdictions. Additionally these laws and governments’ approach to enforcement, as well as our products and services, are continuing to change and evolve. Compliance with these types of regulation may involve significant costs or require changes in products or business practices. Non-compliance could result in penalties being imposed on us or orders that we stop the alleged noncompliant activity. One or more of these factors could have an adverse effect on our operations globally or in one or more countries or regions, which could have an adverse effect on our business, financial position, profit, and cash flows.
We address these risks with various measures depending on the circumstances, including, for example, a strong legal and compliance office presence in the main countries, maintaining an effective Data Protection and Privacy Office and associated policy, receiving guidance from external economics consultants, law firms, tax advisors, and authorities in the concerned countries, and taking legal actions.
Although we estimate the probability of occurrence of this risk to be unlikely, we cannot completely exclude the possibility that this risk could have a major impact on our business, financial position, profit, and cash flows, or cause a negative deviation from our revenue and operating profit target. We classify this risk as a medium risk.
Social and political instability caused by state-based conflicts, terrorist attacks, civil unrest, war, or international hostilities, as well as pandemic disease outbreaks or natural disasters, may disrupt SAP’s business operations.
Terrorist attacks and other acts of violence or war, civil and political unrest (such as in the Middle East, in Ukraine, Israel, Syria, Libya, and in other parts of Africa), natural disasters (such as hurricanes, flooding, or similar events) or pandemic diseases (such as Ebola) could have a significant adverse effect on the related economy or beyond. Such an event could lead, for example, to the loss of a significant number of our
Our international business activities expose us to numerous and sometimes even conflicting regulatory requirements, and to risks that could harm our business, financial position, profit, and cash flows.
We are a global company and currently market our products and services in more than 180 countries and territories in the Americas (including Latin America and North America); Asia Pacific Japan (APJ); China, Hong Kong, Taiwan and Macau (Greater China); Europe, Middle East, and Africa (EMEA); and Middle and Eastern Europe (MEE) regions. Our business in these countries is subject to numerous risks inherent in international business operations. Among others, these risks include:– Conflict and overlap among tax regimes– Possible tax constraints impeding business operations in
certain countries– Expenses associated with the localization of our products
and compliance with local regulatory requirements– Discriminatory or conflicting fiscal policies– Operational difficulties in countries with a high corruption
perceptions index– Protectionist trade policies and regulations for import and
export– Works councils, labor unions, and immigration laws in
different countries– Data protection and privacy in regard to access by
government authorities to customer, partner, or employee data
– Difficulties enforcing intellectual property and contractual rights in certain jurisdictions
– Country-specific software certification requirements
123Risk Management and Risks
Market Risks
Our established customers might not buy additional software solutions, subscribe to our cloud offerings, renew maintenance agreements, purchase additional professional services, or they might switch to other products or service offerings (including competitive products).
In 2014, we offered a wide range of support services including SAP MaxAttention, SAP Enterprise Support, and SAP Product Support for Large Enterprises. We continue to depend materially on the success of our support portfolio and on our ability to deliver high-quality services. Traditionally, our large installed customer base generates additional new software, maintenance, consulting, and training revenue. Despite the high quality and service level of our transformed and expanded service offering in the area of premium engagements, we may be unable to meet customer expectations. Existing customers might cancel or not renew their maintenance contracts, decide not to buy additional products and services, not subscribe to our cloud offerings, or accept alternative offerings from other vendors. In addition, the increasing volume in our cloud business as well as the conversion of traditional on-premise licenses to cloud subscription licenses could have a potential negative impact on our software and maintenance revenue streams. This could have an adverse effect on our on-premise software and maintenance business, financial position, profit, and cash flows.
Working closely with SAP user groups, we continuously demonstrate the business value and the benefits of our solution, service and support portfolio in terms of innovation, quality, and high service level as well as through customer references and success stories. Additionally, we continuously monitor the performance and the perceived value of our services and the satisfaction of our customers. We implement mitigating steps where required.
employees, or to the disruption or disablement of operations at our locations, and could affect our ability to provide business services and maintain effective business operations. Furthermore, this could have a significant adverse effect on our partners as well as our customers and their investment decisions, which could have an adverse effect on our reputation, business, financial position, profit, and cash flows.
Our mitigation measures have been designed and implemented to minimize such adverse effects. To ensure continuous operations of all critical business processes, we have been implementing and operating a worldwide business continuity management and crisis management system. To enable effective response and minimize possible losses in case of crisis situations, we have installed local crisis management teams at our main locations, supplemented by regional crisis management teams for the Americas (including Latin America and North America), APJ, and EMEA regions, and a global crisis management team.
To protect our key IT infrastructure (especially our data centers), critical business systems, and processes from material adverse effects in crisis situations, disaster recovery and business continuity plans have been developed that include implementation of data redundancies and daily data backup strategies. To verify and improve our approach, our Global IT organization has been certified to the internationally recognized ISO 22301:2013 (Business Continuity Management) standard. In addition, our corporate headquarters, which includes certain critical business functions, is located in the German state of Baden-Württemberg. This area has historically been free of natural disasters.
With regard to the increased relevance of current and anticipated political crisis situations and acts of violence as well as pandemic diseases impacting SAP’s business, we believe that the increased likelihood of this risk materializing is unlikely; however, we cannot exclude the possibility of such a risk occurring and having a business-critical impact on our reputation, business, financial position, profit, and cash flows, or causing a negative deviation from our revenue and operating profit target. We classify this risk as a medium risk.
124 Combined Management Report

If organizations do not perceive the benefits of cloud computing, the market for cloud business might not develop further, or it may develop more slowly than we expect, either of which could have an adverse effect on our business, financial position, profit, reputation and cash flows.
Among measures to communicate the business value of our cloud solutions to the market, we invest significantly in infrastructure and processes that ensure secure operations of our cloud solutions including the adaption of cloud service delivery to local and/or specific market requirements (such as local or regional data centers) and the compliance with all local legal regulations regarding data protection and privacy as well as data security.
Although we estimate the probability of occurrence of this risk to be unlikely, we cannot completely exclude the possibility that this risk could have a business-critical impact on our reputation, business, financial position, profit, and cash flows, or cause a negative deviation from our revenue and operating profit target. We classify the risk as a medium risk.
Our market share and profit could decline due to increased competition, market consolidation and technological innovation, and new business models in the software industry.
The software industry continues to evolve rapidly and is currently undergoing a significant shift due to innovations in the areas of mobile, Big Data, connectivity, the Internet of Things, digital, cloud computing, and social media. While smaller innovative companies tend to create new markets continuously, large traditional IT vendors tend to enter such markets mostly through acquisitions. SAP faces increased competition in its business environment from traditional as well as new competitors. This could result in increased price pressure, cost increases, and loss of market share, which could have an adverse effect on our business, financial position, profit, and cash flows.
With regard to our increasing volume in cloud business as well as the conversion of traditional on-premise licenses to cloud subscription licenses we estimate the increased probability of this risk materializing to be unlikely. However, we cannot completely exclude the possibility that it could have a business-critical impact on our business, financial position, profit, and cash flows, or cause a negative deviation from our revenue and operating profit target. Overall, we classify this risk as medium risk.
The success of our cloud computing strategy depends on market perception and an increasing market adoption of our cloud solutions and managed cloud services. Insufficient adoption of our solutions and services could lead to a loss of SAP’s position as a leading cloud company.
The market for cloud computing is increasing and shows strong growth relative to the market for our on-premise solutions. To offer a broad cloud service portfolio and generate the associated business value for our customers, we have acquired cloud computing companies such as SuccessFactors, Ariba, Fieldglass and Concur. Due to ongoing contracts and previous substantial investments to integrate traditional on-premise enterprise software into their businesses, customers and partners might be reluctant or unwilling to migrate to the cloud.
Other factors that could affect the market acceptance of cloud solutions include:– Concerns with entrusting a third party to store and manage
critical employee or company confidential data– Customer concerns about security capabilities and reliability– Customer concerns about the ability to scale operations for
large enterprise customers– The level of configurability or customizability of the software– Missing integration scenarios between on-premise products
and cloud-to-cloud solutions– Failure in secure and successful delivery of cloud services
by any cloud service provider could have a negative impact on customer trust in cloud solutions
– Strategic alliances amongst our competitors in the cloud area could lead to significantly increased competition in the market
125Risk Management and Risks

Business Strategy Risks
Demand for our new solutions may not develop as planned and our strategy on new business models and flexible consumption models may not be successful.
Our software business consists of new software licenses, software license updates, and support and maintenance fees, as well as of cloud subscriptions. Our customers are looking to take advantage of technological breakthroughs from SAP without compromising their previous IT investments. However, the introduction of new SAP solutions, technologies, and business models as well as delivery and consumption models is subject to uncertainties as to whether customers will be able to perceive the additional value and realize the expected benefits. There is an increased risk that such uncertainties may lead customers to wait for reference customers first, which might result in a lower level of adoption of our new solutions, technologies, business models and flexible consumption models, or no adoption at all. This could have an adverse effect on our business, financial position, profit, and cash flows.
To mitigate this risk, SAP is balancing the distribution of our strategic investments by evolving and protecting our core businesses and simultaneously developing new solutions, technologies, and business models for markets, such as analytics, applications, and database and technology. Furthermore, we continuously demonstrate the benefits of our solution and service portfolio through customer references and success stories as well as the provision of support excellence to ensure customer satisfaction with and after the implementation of our solution.
We estimate the probability of occurrence of this risk to be remote, but cannot completely exclude the possibility that this risk could have a business-critical impact on our business, financial position, profit, and cash flows, or cause a negative deviation from our revenue and operating profit target. We classify this risk as a medium risk.
Additionally, customers could change their buying behavior by accelerating their acceptance of cloud solutions to reduce their investments which might have a temporary adverse effect on our operating results. Furthermore, the trend in the market to invest more in cloud solutions might lead to an increased risk of the potential loss of existing on-premise customers. It may also have a temporary adverse effect on our revenue due to an increased number of conversions from on-premise licenses to cloud subscriptions from existing SAP customers in our installed base.
We believe we will be able to protect our leadership in the market if we continue to execute successfully on our customer-centric innovation strategy, which is driven by a mix of organic growth, targeted acquisitions, and attractive cloud solution offerings. To compete successfully in the market, we continuously enhance our global processes and adjust our organizational structures.
Although we estimate the probability of occurrence of this risk to be unlikely, we cannot completely exclude the possibility that this risk could have a major impact on our business, financial position, profit, and cash flows, or cause a negative deviation from our revenue and operating profit target. We classify this risk as a medium risk.
126 Combined Management Report

If our customers do not renew their subscriptions, renew on less favorable terms, or fail to purchase additional modules or users, our revenue and billings may decline, and we may not realize significantly improved operating results from our customer base. This could have an adverse effect on our business, financial position, profit, and cash flows.
We share our overall long-term cloud strategy and our integration road map with our customers and continuously implement improvements that enhance our cloud solutions including instant provisioning, a consumer-grade user experience, and a fast time to value, among others. To continuously improve our services, we closely monitor any issue and work together with customers to perform a root-cause analysis and provide a solution. Furthermore, we are adapting cloud service delivery to local and/or specific market requirements (such as local or regional data centers) and in accordance with legal and regulatory requirements.
Although we estimate the probability of occurrence of this risk to be remote, we cannot completely exclude the possibility that this risk could have an increased business-critical impact on our business, financial position, profit, and cash flows, or cause a negative deviation from our revenue and operating profit target. We classify this risk as a medium risk.
If we are unable to scale and enhance an effective partner ecosystem, increased revenue already included in our forecast might be endangered.
An open and vibrant partner ecosystem is a fundamental pillar of our success and growth strategy. We have entered into partnership agreements that drive co-innovation on our platforms, profitably expand all our routes-to-market to optimize market coverage, and provide high-quality services capacity in all market segments. Partners play a key role in driving market adoption of our entire solutions portfolio, by co-innovating on our platforms, embedding our technology, and reselling and/or implementing our software.
We recognize cloud subscription and support revenue over the term of the respective service periods, and our business depends substantially on customers renewing their agreements and purchasing additional modules or user licenses from us. Although any downturns or upturns in cloud sales may not be immediately reflected in our operating results, any decline in our customer renewals would harm the future operating results of the cloud business.
We recognize cloud subscription and support revenue over the respective service provision, which typically range from one to three years with some up to five years. As a result, most of the respective revenue recognized in a given period originates from agreements entered into in earlier periods. Consequently, a shortfall in demand for our cloud portfolio in any period may not significantly impact our cloud subscription and support revenue for that quarter, but could have an adverse effect on targeted cloud subscription and support revenue in future periods.
To maintain or improve our operating results in the cloud business, it is important that our customers renew their agreements with us when the initial contract term expires and purchase additional modules or additional users. Our customers have no obligation to renew their subscriptions after the initial subscription period, and we cannot assure that customers will renew subscriptions at the same or at a higher level of service, or at all.
Our customers’ renewal rates may decline or fluctuate as a result of a number of factors, including their satisfaction or dissatisfaction with our cloud solution and services portfolio, the integration capabilities of our cloud solutions into their existing solution environment (including hybrid solutions combining both cloud and on-premise solutions), our customer support, concerns on stable, efficient and secure cloud operations and in compliance with legal and regulatory requirements, our pricing, the prices of competing products or services, mergers and acquisitions affecting our customer base, the effects of global economic conditions, or reductions in our customers’ spending levels.
127Risk Management and Risks

Although we consider this risk to be unlikely in view of our partner strategy, we cannot exclude the possibility that this risk could have a major impact on our reputation, business, financial position, profit, and cash flows, or cause a negative deviation from our revenue and operating profit target if it were to materialize. We classify this risk as a medium risk.
Human Capital Risks
If we do not effectively manage our geographically dispersed workforce, we may not be able to run our business efficiently and successfully.
Our success is dependent on appropriate alignment of our internal and external workforce planning processes and our location strategy with our general strategy. It is critical that we manage our internationally dispersed workforce effectively, taking short and long-term workforce and skill requirements into consideration. This applies to the management of our internal as well as our external workforce. Changes in headcount and infrastructure needs could result in a mismatch between our expenses and revenue. Failure to manage our geographically dispersed workforce effectively could hinder our ability to run our business efficiently and successfully and could have an adverse effect on our business, financial position, profit, and cash flows.
If partners consider our products or services model less strategic and/or financially less attractive compared to our competition or if SAP fails to establish a network of qualified partners that meet our quality requirements and the requirements of our customers, then, among other things, partners might not:– Develop a sufficient number of new solutions and content on
our platforms– Provide high-quality products and services to our customers– Drive growth of references by creating customer use cases
and demo systems – Sufficiently embed our solutions to profitably drive product
adoption, especially with new innovations such as SAP HANA– Enable and train sufficient resources to promote sell and
support to scale into targeted markets– Comply with applicable laws and regulations, resulting in
delayed, disrupted, or terminated sales and services – Transform their business model in accordance with the
transformation of SAP’s business model in a timely manner– Renew their existing agreements with us or enter into new
agreements on terms acceptable to us or at all
If one or more of these risks materialize, this may have an adverse effect on the demand for our products and services. As a result we may not be able to scale our business to compete successfully with other software vendors, which could have an adverse effect on our reputation, business, financial position, profit, and cash flows.
SAP continues to invest in long-term, mutually beneficial relationships and agreements with partners. We continue to develop and enhance a wide range of partner programs to retain existing and attract new partners of all types. We offer training opportunities to a wide range of resources for our partners and additionally provide demo solutions to enable partners to lead business value discussions on cloud and on-premise with customers. A thorough certification process for third-party solutions has been designed and established to ensure consistent high-quality and seamless integration.
128 Combined Management Report

leave SAP and ready successors or adequate replacements are not available, we may not be able to manage our operations effectively, which could have an adverse effect on our reputation, business, financial position, profit, and cash flows. Furthermore, we may not be able to develop, sell, or implement successful new solutions and services as planned. This is particularly true as we continue to introduce new and innovative technology offerings and expand our business in emerging markets. The lack of appropriate or inadequately executed benefit and compensation programs could limit SAP’s ability to attract or retain qualified employees and lead to financial losses. In addition, we might not be able to achieve our internal gender diversity objectives to increase the number of women in management from 18% in 2010 to 25% by 2017. These increased risks notwithstanding, we continue to believe our leading market position, employer brand, and extended benefit programs will enable us to hire top talent internationally with the potential to contribute to SAP’s growing business success in the future. We address the risk of an adverse effect on our business operations from a failure to recruit the employees we need or from the loss of leaders and employees by seeking to build employee and leadership strengths through a range of targeted professional development, mentoring, and coaching programs, a gender diversity program, and a special focus on accelerated high-potential employee development that aims to develop talent as well as leadership talent, in particular. A strong focus on succession planning for leadership and key positions seeks for sustainable leadership and to safeguard the business from disruption caused by staff turnover.
We are focusing on mitigating this risk through a range of activities including transformation of the business, succession management; workforce planning (which aims to achieve diversity and the right mix of talent and to take account of demographic changes); outsourcing; external short-term staffing; employer branding; career management (such as offering opportunities for short-term assignments and opportunities to improve skills, competencies, and qualifications); and extended benefit programs – for example, a performance-oriented remuneration system, an employer-financed pension plan in certain countries, and long-term incentive plans.
We estimate this risk to be a remote possibility, but we cannot underestimate its potential to have a major impact on our business, financial position, profit, and cash flows, or cause a negative deviation from our revenue and operating profit target. We classify this risk as a low risk.
If we are unable to attract, develop, and retain leaders and employees with specialized knowledge and technology skills, or are unable to achieve internal diversity and inclusion objectives, we might not be able to manage our operations effectively and successfully, or develop successful new solutions and services.
Our highly qualified workforce is the foundation for our continued success. In certain regions and specific technology and solution areas, we continue to set very high growth targets, specifically in countries and regions such as Africa, China, and Latin America. In the execution of SAP’s strategic priorities, we depend on highly skilled and specialized personnel and leaders, both male and female. Successful maintenance and expansion of our highly skilled and specialized workforce in the area of cloud is a key success factor for our transition to become the leading cloud company. The availability of such personnel is limited and as a result competition in our industry is intense and could expose us to claims by other companies seeking to prevent their employees from working for a competitor. If we are unable to identify, attract, develop, motivate, adequately compensate, and retain well-qualified and engaged personnel, or if existing highly skilled and specialized personnel
129Risk Management and Risks

It is difficult to assess the precise potential risk, because there is a wide variety of complex legal and regulatory requirements that apply, and therefore an equally wide variety of potential non-compliance scenarios exist.
However, we continuously monitor new and increased regulatory requirements, updated or new enforcement trends, and publicly available information on compliance issues in the computer software industry, the emerging markets where we invest our resources, and in the business environment in general to cope with an increase in regulation enforcement efforts of certain countries or state-driven protectionism. Based on this information and any other available sources, we continuously update and refresh our compliance programs to achieve the most effective approach possible and to ensure that our employees understand and comply with the SAP Code of Business Conduct. This process is coordinated by our Global Compliance Office, a team of dedicated resources that are tasked with managing our policy-related compliance measures. Our chief compliance officer coordinates policy implementation, training, and enforcement efforts throughout SAP. Those efforts are monitored and tracked to allow trending and risk analysis and to ensure consistent policy application throughout the SAP Group. Despite our comprehensive compliance programs and established internal controls, intentional efforts of individuals to circumvent controls or engage in fraud for personal gains cannot always be prevented.
With regard to the increase of regulation enforcement efforts we have already experienced and continue to expect as well as state-driven protectionism we estimate the increased likelihood of this risk to be unlikely. We cannot completely exclude the possibility that this risk could have a major impact on our reputation, business, financial position, profit, and cash flows, or cause a negative deviation from our revenue and operating profit target. We classify this risk as a medium risk.
Non-compliance with applicable data protection and privacy laws or failure to adequately meet the requirements of SAP’s customers with respect to our products and services could lead to civil liabilities and fines, as well as loss of customers and damage to SAP’s reputation.
Although the risks related to failure to attract, develop, and retain talent could materialize, we believe that this is unlikely and that the impact on our reputation, business, financial position, profit, and cash flows, or potential negative deviation from our revenue and operating profit target would be major. We classify this risk as a medium risk.
Organizational and Governance-Related Risks
Laws and regulatory requirements in Germany, the United States, and elsewhere have become much more stringent.
As a European company domiciled in Germany with securities listed in Germany and the United States, we are subject to European, German, U.S., and other governance-related regulatory requirements. Changes in laws and regulations and related interpretations, including changes in accounting standards and taxation requirements, and increased enforcement actions and penalties may alter the business environment in which we operate. Regulatory requirements have become significantly more stringent in recent years, and some legislation, such as the anticorruption legislation in Germany, the U.S. Foreign Corrupt Practices Act, the UK Bribery Act, and other local laws prohibiting corrupt payments by employees, vendors, distributors, or agents, is being applied more rigorously. Emerging markets are a significant focus of our international growth strategy. The nature of these markets presents a number of inherent risks. A failure by us to comply with applicable laws and regulations, or any related allegations of wrongdoing against us, whether merited or not, could have an adverse effect on our business, financial position, profit, cash flows and reputation.
130 Combined Management Report

We estimate this risk to be unlikely, but cannot rule out the possibility of it having a business-critical impact on our business, financial position, profit, and cash flows, causing damage to our reputation, or causing a negative deviation from our revenue and operating profit target. We classify this risk as a medium risk.
Failure to respond to meet customer, partner, or other stakeholder expectations or generally accepted standards on climate change, energy constraints, and our social investment strategy could negatively impact SAP’s business, results of operations, and reputation.
Energy and emissions management are an integral component of our holistic management of social, environmental, and economic risks and opportunities. We have identified risks in these major areas:– Our solutions and green IT– Our own operations – energy management and other
environmental issues such as carbon management, water use, and waste
Because our customers, employees, and investors expect a reliable energy and carbon strategy, we have reemphasized our previously communicated targets, especially our 2020 target for greenhouse gas emissions. In addition, our customers might no longer recognize SAP for its environmental leadership and might buy other vendors’ products and services. Consequently, we could fail to achieve our revenue target. If we do not meet stakeholder expectations in the areas identified, our rating in sustainable investment indices might decrease, which could have an adverse effect on our reputation, business, financial position, profit, and cash flows.
In recent years, SAP has shown that it is possible to take a proactive position on social and environmental issues while delivering robust financial growth. As a result, we received great recognition for our sustainability efforts. As a proof point for SAP’s sustainability performance, we continue to be listed in the most prominent and recognized sustainability indices, such as the Dow Jones Sustainability Indices and the CDP
As a global software and service provider, SAP is required to comply with the laws in the locations where SAP does business. SAP and its subsidiaries are facing a surge of data protection and privacy laws and regulations around the world, with further changes to be expected in the future, for example, by the European Data Protection Regulation proposed by the European Commission. These laws and regulations amend and supplement existing requirements regarding the processing of personal data that SAP and SAP customers must fulfill and which we must consequently address with our products and services, including cloud delivery. Failure to comply with applicable laws or to adequately address privacy concerns of customers, even if unfounded, could lead to investigations by supervisory authorities, civil liability, fines, (in the future, potentially calculated based on the Company’s annual revenue), loss of customers, damage to our reputation, and could have an adverse effect on our business, financial position, profit, and cash flows. To mitigate these risks, SAP actively monitors changes to laws and regulations so we can take adequate measures and certify our existing standards and policies on an ongoing basis. We have implemented a wide range of measures to protect data controlled by SAP and our customers from unauthorized access and processing, as well as from accidental loss or destruction. This includes, among others, a continuous enhancement of our data center operations worldwide, also taking into account local and/or sector specific market and legal requirements. We have implemented a certified data protection management system in areas critical to data protection, such as support, HR, global services, marketing, products and innovation, and custom development, whereby implementation is audited internally and externally by the British Standard Institutions on an annual basis. Furthermore, customers are provided with security certifications (such as ISO 27001), security white papers, and reports from our independent auditors and certification bodies.
131Risk Management and Risks

To help prevent this, we instituted a comprehensive compliance management system (CMS), which is based on the three pillars of prevention, detection, and reaction. Our CMS program comprises several educational, counseling, control, and investigative instruments. The objective is to minimize and mitigate the risk of unethical behavior, whether intentional or negligent.
The SAP Code of Business Conduct is mandatory and applies to every employee. It provides legal compliance guidance on how to avoid unethical behavior and solve dilemma situations. On a yearly basis, the SAP Code of Business Conduct is re-confirmed by SAP’s workforce (except where disallowed by local legal regulations). We also rolled out and enforce various additional compliance policies aimed at managing third parties and preventing misuse of third-party payments for illegal purposes; ensuring controls around travel, entertainment, gift, and expense policies; and pushing out a commitment to business with integrity through our partner and vendor ecosystems.
These efforts are flanked by continuous education including e-learning and classroom training to target audiences as identified by compliance risk assessment. The overall CMS approach by SAP is continuously monitored internally and externally, and adapted accordingly, if needed.
Although we estimate the probability of occurrence of intentional or negligent major unethical conduct to be remote, we cannot exclude the possibility that this risk could materialize. In that event, this risk could have a major impact on our reputation, business, financial position, profit, and cash flows and could cause a negative deviation from our operating profit target. We classify this risk as a low risk.
Climate Performance and Disclosure Leadership Indices. As we did not meet our greenhouse gas emissions target of 440 kilotons for 2014 we might fail to meet expectations regarding our energy and emission performance.
However, we believe that the risk of failing to meet expectations regarding our energy and emission strategy is unlikely to occur and that if the risk were to occur, it would only have a moderate impact on our reputation, business, financial position, profit, and cash flows, as well as on the achievement of our revenue and operating profit target. We classify this risk as a low risk.
Unethical behavior and non-compliance with our integrity standards due to intentional and fraudulent behavior of employees could seriously harm our business, financial position, profit, and reputation.
SAP's leadership position in the global market is founded on the long-term and sustainable trust of our stakeholders worldwide. Our heritage is one of corporate transparency, open communication with financial markets, and adherence to recognized standards of business integrity. The SAP Code of Business Conduct, adopted by the Executive Board on January 29, 2003, put into words the already existing guidelines and expectations for the business behavior practiced at SAP.
However, we may encounter unethical behavior and non-compliance with our integrity standards due to intentional and fraudulent behavior of individual employees, possibly in collusion with external third parties. In addition to intentional behavior, problems could also arise due to negligence in the adherence to rules and regulations. Unethical behavior and misconduct attributable to SAP could not only lead to criminal charges, fines, and claims by injured parties, but also to financial loss, and severe reputational damage. This could have an adverse effect on our business, financial position, profit, and cash flows.
132 Combined Management Report

Financial Risks
Our sales are subject to quarterly fluctuations and our sales forecasts may not be accurate.
Our revenue and operating results can vary and have varied in the past, sometimes substantially, from quarter to quarter. Our revenue in general, and in particular our software revenue, is difficult to forecast for a number of reasons, including:– The relatively long sales cycles for our products– The large size, complexity, and extended timing of individual
license transactions– The introduction of new licensing and deployment models
such as cloud subscription models– The timing of the introduction of new products or product
enhancements by SAP or our competitors– Changes in customer budgets– Decreased software sales that could have an adverse effect
on related maintenance and services revenue– The timing, size, and length of customers’ services projects– Deployment models that require the recognition of revenue
over an extended period of time– Adoption of and conversion to new business models leading
to changed or delayed payment terms– Seasonality of a customer’s technology purchases– Limited visibility during the ongoing integration of acquired
companies into their ability to accurately predict their sales pipelines and the likelihood that the projected pipeline will convert favorably into sales
– Other general economic, social, environmental, and market conditions, such as the global economic crisis and the current difficulties for countries with large debt
Since many of our customers make their IT purchasing decisions near the end of calendar quarters, and with a significant percentage of those decisions being made during our fourth quarter, even a small delay in purchasing decisions
Communication and Information Risks
Our controls and efforts to prevent the unauthorized disclosure of confidential information might not always be effective.
Confidential or strictly confidential information and internal information that is related to topics such as our strategy, new technologies, mergers and acquisitions, unpublished financial results, or personal data, could be prematurely or inadvertently disclosed and subsequently lead to misperception in the market. This could require us to notify multiple regulatory agencies and, where appropriate, the data owner, which could result in a loss of reputation for SAP. For example, leaked information during a merger or acquisition deal could cause the loss of our deal target, or our share price could decline in case of prematurely published financial results. This could have an adverse effect on our market position and lead to fines and penalties. In addition, this could have an adverse effect on our business, financial position, profit, and cash flows.
We take a wide range of actions to prevent unauthorized disclosure of information, including procedural and organizational measures. These measures include mandatory security awareness training for all employees, standards for safe internal and external communication, and technical security features in our IT hardware and communication channels, such as mandatory encryption of sensitive data.
Although we estimate the likelihood of occurrence of this risk to be remote, we cannot completely exclude the possibility that this risk could have a business-critical impact on our reputation, business, financial position, profit, and cash flows, or cause a negative deviation from our operating profit target. We classify this risk as a medium risk.
133Risk Management and Risks
External factors could impact our liquidity and increase the default risk associated with, and the valuation of, our financial assets.
Macroeconomic factors such as an economic downturn could have an adverse effect on our future liquidity. We use a globally centralized financial management to control financial risk, such as liquidity, exchange rate, interest rate, counterparty, and equity price risks. The primary aim is to maintain liquidity in the SAP Group at a level that is adequate to meet our obligations at any time. Our total Group liquidity is supported by our strong operating cash flows, of which a large part is recurring, and by credit facilities on which we can draw if necessary. However, adverse macroeconomic factors could increase the default risk associated with the investment of our total Group liquidity including possible liquidity shortages limiting SAP’s ability to repay financial debt. This could have an impact on the value of our financial assets, which could have an adverse effect on our business, financial position, profit, and cash flows.
SAP’s investment policy with regard to total Group liquidity is set out in our internal treasury guideline document, which is a collection of uniform rules that apply globally to all companies in the SAP Group. Among its stipulations, it requires that with limited exceptions we invest only in assets and funds rated BBB flat or better. The weighted average rating of the investments of our total Group liquidity is in the range A to A–. We continue to pursue a policy of cautious investment characterized by wide portfolio diversification with a variety of counterparties, predominantly short-term investments, and standard investment instruments.
Although we estimate the probability of occurrence of this risk to be remote, there can be no assurance that the prescribed measures will be successful or that uncertainty in global economic conditions could not have a business-critical impact on our business, financial position, profit, cash flows, or operating profit target. We classify this risk as a medium risk.
for our on-premise software could have an adverse effect on our revenue results for a given year. Our dependence on large transactions has decreased in recent years with a trend towards an increased number of transactions coupled with a decrease in deal size. However, the loss or delay of one or a few large opportunities, which are still characteristic of the large enterprise segment, could have an adverse effect on our business, financial position, profit, and cash flows.
We use a “pipeline” system to forecast sales and trends in our business. Pipeline analysis informs and guides our business planning, budgeting, and forecasting, but pipeline estimates do not necessarily consistently correlate to revenue in a particular quarter, potentially due to one or more of the reasons outlined above. The reliability of our plans, budgets, and forecasts may therefore be compromised. Because our operating expenses are based upon anticipated revenue levels and a high percentage of our expenses are relatively fixed in the near term, any shortfall in anticipated revenue or delay in revenue recognition could result in significant variations in our operating results from quarter to quarter or year to year. Continued deterioration in global economic conditions would make it increasingly difficult for us to accurately forecast demand for our products and services, and could cause our revenue, operating results, and cash flows to fall short of our expectations and public forecasts. This could have an adverse effect on our stock price. To the extent any future expenditure fails to generate the anticipated increase in revenue, our quarterly or annual operating results may be subject to an adverse effect and may vary significantly compared to preceding or subsequent periods.
Although we estimate the probability of occurrence of this risk to be unlikely, we cannot completely exclude the possibility that this risk could have a moderate impact on our business, financial position, profit, and cash flows, or cause a negative deviation from our revenue and operating profit target. We classify this risk as a low risk.
134 Combined Management Report

Although we estimate the probability of occurrence of the risk to be unlikely, we cannot completely exclude the possibility of a major impact. We classify this risk as a medium risk.
Because we conduct operations throughout the world, our business, financial position, profit, and cash flows may be affected by currency and interest rate fluctuations.
Our SAP Group-wide management reporting and our external financial reporting are both in euros. Nevertheless, a significant portion of our business is conducted in currencies other than the euro. Approximately 71% of our revenue in 2014 was attributable to operations outside the euro area and was translated into euros. Consequently, period-over-period changes in the euro rates for particular currencies can significantly affect our reported revenue and income. In general, appreciation of the euro relative to another currency has an adverse effect while depreciation of the euro relative to another currency has a positive effect. Variable interest balance-sheet items are also subject to changes in interest rates. Such changes may have an adverse effect on our business, financial position, profit and cash flows or cause an adverse deviation from our revenue and operating profit target.
We continuously monitor our exposure to currency fluctuation risks based on balance-sheet items and expected cash flows, and pursue an SAP Group-wide foreign exchange risk management strategy using, for example, derivative financial instruments as appropriate. With regard to our financial debt, we have a very balanced maturity profile and mixture of fixed and floating interest rate arrangements in place.
We believe that the likelihood of this risk of significant currency and interest rate fluctuations affecting our reported revenue and income materializing is remote and that if the risk were to occur, its impact on our business, financial position, profit, and cash flows could be major, or cause a negative deviation from our revenue and operating profit target. We classify this risk as a low risk.
Management’s use of estimates could negatively affect our business, financial position, profit, and cash flows.
To comply with IFRS, management is required to make numerous judgments, estimates, and assumptions (among others for our major patent disputes) that affect the reported financial figures. The facts and circumstances, as well as assumptions on which management bases these estimates and judgments and management’s judgment regarding the facts and circumstances, may change from time to time and this could result in significant changes in the estimates and judgments and consequently in the reported financials. Such changes could have an adverse effect on our business, financial position, profit and cash flows.
We have a number of control procedures in place to make sure that our estimates and judgments are adequate. For example, we apply two-person verification to significant estimating.
Although we estimate the probability of occurrence of the risk to be unlikely, we cannot completely exclude the possibility of a moderate impact on our business, financial position, profit, and cash flows, or a negative deviation from our revenue and operating profit target. We classify this risk as a low risk.
Current and future accounting pronouncements and other financial reporting standards, especially but not only concerning revenue recognition, may negatively impact the financial results we present.
We regularly monitor our compliance with applicable financial reporting standards and review new pronouncements and drafts thereof that are relevant to us. As a result of new standards, changes to existing standards (including the new IFRS 15 on revenue from contracts with customers that we will likely need to adopt in 2017), and changes in their interpretation, we might be required to change our accounting policies, particularly concerning revenue recognition, to alter our operational policies so that they reflect new or amended financial reporting standards, or to restate our published financial statements. Such changes may have an adverse effect on our reputation, business, financial position, and profit, or cause an adverse deviation from our revenue and operating profit target.
135Risk Management and Risks

recommended best practices may occur during the course of a project. These scenarios have a direct impact on the project resource model and on securing adequate internal personnel or consultants in a timely manner and could therefore prove challenging.
As a result of these and other risks, SAP and/or some of our customers have incurred significant implementation costs in connection with the purchase and installation of SAP software products. Some customers’ implementations have taken longer than planned. We cannot guarantee that we can reduce or eliminate protracted installation or significant third-party consulting costs, that trained consultants will be readily available, that our costs will not exceed the fees agreed in fixed-price contracts, or that customers will be satisfied with the implementation of our software and solutions. Unsuccessful, lengthy, or costly customer implementation and integration projects could result in claims from customers, harm SAP’s reputation, and could have an adverse effect on our business, financial position, profit, and cash flows.
Our customers continue to follow project approaches to optimize their IT solutions in a non-disruptive manner. Our projects also include risk management processes that are integrated into SAP project management methods intended to safeguard implementations with coordinated risk and quality management programs. In our opinion, we make adequate financial planning provisions for the remaining individual risks.
We estimate the probability of occurrence of this risk to be unlikely, but we cannot completely exclude the possibility that this risk could have a major negative impact on our reputation, business, financial position, profit, and cash flows, or cause a negative deviation from our revenue and operating profit target. We classify this risk as a medium risk.
For more information about risks arising from financial instruments, including our currency and interest-rate risks and our related hedging activity, see the Notes to the Consolidated Financial Statements section, Notes (25) to (26).
The cost of using derivative instruments to hedge share-based payments may exceed the benefits of hedging them.
We use derivative instruments to reduce the impact of our share-based payments on our income statement and to limit future expense associated with those plans. We decide on a case-by-case basis whether and to what extent we should hedge this risk. The expense of hedging the share-based payments could exceed the benefit achieved by hedging them. On the other hand, a decision to leave the plans materially unhedged could prove disadvantageous. This could have an adverse effect on our business, financial position, profit and cash flows or cause an adverse deviation from our revenue and operating profit target.
We believe that the likelihood of this risk materializing is remote and that if the risk were to occur, its potential impact on our business, financial position, profit, cash flows, and operating profit target would be minor. We classify this risk as a low risk.
Project Risks
Implementation of SAP software often involves a significant commitment of resources by our customers and is subject to a number of significant risks over which we often have no control.
A core element of our business is the successful implementation of software solutions to enable our customers to make their business a best-run business. The implementation of SAP software is led by SAP, by partners, by customers, or by a combination thereof. Depending on various factors, such as the complexity of solutions, the customer’s implementation, integration and migration needs, or the resources required, SAP faces a number of different risks. For example, functional requirement changes, delays in timeline, or deviation from
136 Combined Management Report

We cannot completely exclude the possibility of a negative impact on our customers’ and partners’ or our own operations globally or in one or more countries or regions. We estimate the probability of occurrence of the risk of severe customer and SAP damages to be unlikely. If such an occurrence happens, it could have a business-critical impact on our reputation, business, financial position, profit, and cash flows as well as on the achievement of our revenue and operating profit target. We classify this risk as a medium risk.
Undetected defects in the introduction of new products and product enhancements could increase our costs, and reduce customer demand.
To achieve market acceptance and high customer satisfaction, our new products and product enhancements often require long development and testing periods. Development work and market introduction are subject to risks. For example, products might not completely meet our stringent high-quality standards, including security standards, might not fulfill market needs or customer expectations, or might not comply with local standards and requirements. Furthermore, this risk also exists with respect to acquired companies’ technologies and products where we might not be able to manage these as quickly and successfully as expected. Therefore, market launches, entering new markets, or the introduction of new innovations could be delayed or not be successful.
In addition, new products, including third-party technologies we have licensed and open source software components we use in those products, could contain undetected defects or they might not be mature enough from the customer’s point of view for business-critical solutions. The detection and correction of any defects especially after shipment could be expensive and time-consuming and we might not be able to meet the expectations of customers regarding time and quality in the defect resolution process. In some circumstances, we might not be in a position to rectify such defects or entirely meet the expectations of customers, specifically as we are
Product and Technology Risks
Undetected security vulnerabilities shipped and deployed within our software products might cause damage to SAP and our customers, and partners.
Customer systems or systems operated by SAP itself to provide services could potentially be compromised by vulnerabilities if they are exploited by hackers. This could lead to theft, destruction, or abuse of data, or systems could be rendered unusable (for example, due to distributed denial of service attacks). The detection of security vulnerabilities in our software, our customers’ systems, or SAP systems used in the provision of services, especially in case of exploitation, could prevent us from meeting our contractual obligations and subsequently might lead to customer claims and reputational damage, which might have an adverse effect on our business, financial position, profit, and cash flows.
SAP has implemented a software security development lifecycle as a mandatory integral part of our software development process. We systematically use methods to develop secure software in all development phases starting early in the design phase. This includes industry best practices such as automated security source code scans, mandatory security training for all developers, and solid testing and validation of our products, patches, and services before shipment.
SAP has a software security response process in place to rapidly react to detected vulnerabilities and provide fixes. We have also improved the roll-out procedures for security-relevant notes, patches, and service packs to ensure easy and fast consumption on the customer side.
137Risk Management and Risks

We counter these risks using a broad range of techniques, including project management, project monitoring, product standards and governance, rigid and regular quality assurance measures certified to ISO 9001:2008, and program risk assessments during product development as well as market introduction phases. In addition, direct customer feedback is considered in the market release decision process. Delivering high-quality software products is a priority and part of our core business. Our strong investment and permanent efforts lead to a generally high level of quality of our products, which is made transparent in the defined quality perception and support index and confirmed by our constantly high customer satisfaction ratings as measured by customer quality perception reporting.
With regard to the increased volume of open source software components used in our products as well as in the products of our acquired companies, we believe that the increased likelihood of this risk materializing is unlikely. We cannot completely exclude the possibility that this risk, if it were to occur, could have a business-critical impact on our reputation, business, financial position, profit, and cash flows, or cause a negative deviation from our revenue and operating profit target. We classify this risk as a medium risk.
Changes in our rights to use software and technologies we license from third parties, which are an integral part of SAP’s products, could slow down time to market and influence our license pricing and therefore the competitiveness with other software vendors. Furthermore, it could diminish our software’s functional capabilities and therefore could jeopardize the stability of our solution portfolio offering.
expanding our product portfolio into additional markets. As a result, we might be faced with customer claims for cash refunds, damages, replacement software, or other concessions. The risk of defects and their adverse consequences could increase as we seek to introduce a variety of new software products simultaneously at a higher innovation rate. Significant undetected defects or delays in introducing new products or product enhancements could affect market acceptance of SAP software products and could have an adverse effect on our reputation, business, financial position, profit, and cash flows.
The use of existing SAP software products by customers in business-critical solutions and processes and the relative complexity and technical interdependency of our software products create a risk that customers or third parties may pursue warranty, performance, or other claims against us for actual or alleged defects in SAP software products, in our provision of services, or in our application hosting services. We have in the past been, and may in the future be, subject to warranty, performance, or other similar claims.
Although our contracts generally contain provisions designed to limit our exposure due to actual or alleged defects in SAP software products or in our provision of services, these provisions may not cover every eventuality or be effective under the applicable law. Regardless of its merits, any claim could entail substantial expense and require the devotion of significant time and attention by key management personnel. Publicity surrounding such claims could affect our reputation and the demand for our software.
138 Combined Management Report

We might not be successful in bringing new business models, solutions, solution enhancements, and/or services to market before our competitors. We may also face increasing competition from open source software initiatives in which competitors may provide software and intellectual property free and/or under terms and conditions unfavorable for SAP. In addition, we might not be able to generate enough revenue to offset the significant research and development costs we incur to deliver technological innovations or to offset the required infrastructure costs to deliver our solutions and services as part of our new business models. Moreover, we might not anticipate and develop technological improvements or succeed in adapting our products, services, processes, and business models to technological change, changing regulatory requirements, emerging industry standards, and changing requirements of our customers and partners. Finally, we might not succeed in producing high-quality products, enhancements, and releases in a timely and cost-effective manner to compete with products, solutions, and other technologies offered by our competitors, which could have an adverse effect on our reputation, business, financial position, profit, and cash flows.
We will continue to align our organization, processes, products, delivery model, and services to changing markets and customer and partner demands. We invent new technology and new solutions such as the next-generation suite SAP S/4HANA or adopt the latest technology if there is a clear business opportunity for SAP and if it provides value to our customers. To ensure that we remain competitive in the future, we still conduct wide-ranging market and technology analyses and research projects, often in close cooperation with our customers and partners. We strive for strategic acquisitions with the potential to drive innovation and contribute to achieving our growth target.
The numerous third-party technologies we have licensed and certain open source software components we use have become an integral part of our product portfolio. We depend on those technologies for the functionality of our software or cloud services. Changes to, or the loss of, third-party licenses as well as open source licenses being construed could significantly increase the cost of these licenses and significantly reduce software functionality and/or usability of SAP’s software products. As a result, we might incur additional development or license costs to ensure the continued functionality of our products, which could have an adverse effect on our business, financial position, profit, and cash flows. This risk increases with each acquisition of a company or a company’s intellectual property assets that had been subject to third-party technology licensing, open source software, and product standards less rigorous than our own.
We strive to execute appropriate due diligence and contract management processes and to continuously monitor development projects through our product implementation lifecycle process and monitoring as part of our cloud deployment.
We believe that the probability of occurrence of this risk is likely and we cannot exclude the possibility of a major impact on our business, financial position, profit, and cash flows, or the possibility of a negative deviation from our revenue and operating profit target. We classify this risk as a medium risk.
If we are unable to keep up with rapid technological innovations, new business models, and changing market expectations, we might not be able to compete effectively.
Our future success depends upon our ability to keep pace with technological and process innovations and new business models, as well as our ability to develop new products and services, enhance and expand our existing products and services portfolio, and integrate products and services we obtain through acquisitions. To be successful, we are required to shift our products and our go-to-market approach to a cloud-based delivery model to satisfy changing customer demand.
139Risk Management and Risks
We believe that we will be able to deliver additional business value with minimum disruption to our customers if we can successfully drive the integration and convergence of our technology platform offerings as well as acquired technologies, enable our current product portfolio for SAP HANA, develop new solutions based on SAP HANA, and offer comprehensive cloud-based services. We enable and encourage partners to leverage SAP technology by providing guidance about business opportunities, architecture, and technology, as well as a comprehensive certification program designed to ensure that third-party solutions are of consistently high quality.
We believe that the increased likelihood of this risk materializing is unlikely, due to products that have been or will be developed together with acquired companies. If this risk were to occur, its impact on our reputation, business, financial position, profit, cash flows, and revenue and operating profit target would be business-critical. We classify this risk as a medium risk. Our cloud offerings might be subject to a security attack, become unavailable, or fail to perform properly.
The software used in our cloud portfolio is inherently complex and any defects in product functionality, system stability, or data center operations that cause interruptions in the availability of our application portfolio could result in the following:– Lost or delayed market acceptance and sales– Breach of warranty or other contract breach or
misrepresentation claims– Sales credits or refunds to our customers or partners– Loss of customers and/or partners– Diversion of development and customer service resources– Breach of data protection and privacy laws and regulations– Customers considering competitive cloud offerings
We believe that the likelihood of this risk materializing is remote; however, we cannot exclude the business-critical impact this risk would have on our reputation, business, financial position, profit, and cash flows, or the potential negative deviation from our revenue and operating profit target if it were to materialize. We classify this risk as a medium risk.
Our technology and/or product strategy may not be successful or our customers and partners might not adopt our technology platforms and other innovations accordingly.
We offer customers a broad portfolio of products, solutions, and services. Our technology strategy centers on SAP HANA as a real-time in-memory computing platform for analytics and applications. The success of our technology strategy depends on the convergence of SAP HANA with our mobile, cloud, and SAP NetWeaver platform. It also depends on the delivery of SAP solutions based on the SAP HANA platform as well as the success of our new framework to meet changing customer expectations regarding end-to-end user experience. Our technology strategy also relies on our ability to maintain a dynamic network of partner organizations developing their own business applications using our technology platforms.
We might not be successful in integrating our platforms, enabling the complete product portfolio, harmonizing our user interface design and technology, integrating acquired technologies, or bringing new solutions based on the SAP HANA platform to the market as fast as expected. In addition, we may not be able to compete effectively in the area of managed cloud services. As a result, our partner organizations and customers might not adopt the SAP HANA platform or our managed cloud services quickly enough or they might consider competitive solutions. This could have an adverse effect on our reputation, business, financial position, profit, and cash flows.
140 Combined Management Report

In addition, our insurance coverage might not cover claims against us for loss or security breach of data or other indirect or consequential damages. Moreover, defending a suit, regardless of its merit, could be costly and time-consuming. In addition to potential liability, if we experience interruptions in the availability of our cloud applications, our reputation could be harmed and we could lose customers.
Our mitigation measures have been designed and implemented to minimize such adverse effects. We continuously invest in protecting the integrity and security of our products and services as well as internal and external data that is managed within our data centers. We are consolidating and harmonizing our data centers and our data protection measures, including implementing SAP Enterprise Threat Detection software, our own cybersecurity tool based on SAP HANA as well as network access control enforcement, to run a homogeneous landscape that supports the complex infrastructure, application, and security requirements so that we can deliver the required service level for cloud solutions.
Although we estimate the probability of occurrence of this risk to be unlikely, we cannot completely exclude the possibility that any disruption of our cloud operations could result in a business-critical impact on our reputation, business, financial position, profit, cash flows, and revenue and operating profit target. We classify this risk as a medium risk.
Operational Risks
Third parties have claimed, and might claim in the future, that we infringe their intellectual property rights, which could lead to damages being awarded against us and limit our ability to use certain technologies in the future.
The costs incurred in correcting any defects or errors might be substantial and could have an adverse effect on our reputation, business, financial position, profit, and cash flows. Because of the large amount of data that we collect and manage, it is possible that hardware failures, defects in our software, or errors in our systems could result in data loss or corruption, or cause the information that we collect to be incomplete or contain inaccuracies that our customers regard as significant. Furthermore, the availability of our cloud applications could be interrupted by a number of factors, including customers’ inability to access the Internet, the failure of our network or software systems due to human or other error, security breaches, or variability in user traffic for our cloud applications. Additionally, any loss of the right to use hardware purchased or leased from third parties could result in delays in our ability to provide our cloud applications until equivalent technology is either developed by us or, if available, identified. Furthermore, our cooperation with partners in the area of cloud includes the co-location of data centers that might expose SAP to additional risks in the area of security and data protection, as well as the potential for breached service-level agreements by partners.
We have administrative, technical, and physical security measures in place as well as contracts that require third-party data centers to have appropriate security and data protection and privacy measures in place. In this context, customers might demand to only use specific and/or local data centers. However, if these security measures are breached as a result of third-party action, employee error or malfeasance, or otherwise, and if, as a result, someone obtains unauthorized access to our customers' data, which may include personally identifiable information regarding users, our reputation could be damaged, our business may suffer, local data protection and privacy laws or regulations might be breached, and we could incur significant liability.
141Risk Management and Risks
The software industry is making increasing use of open source software in its development work on solutions. We also integrate certain open source software components from third parties into our software. Open source licenses may require that the software code in those components or the software into which they are integrated be freely accessible under open source terms. Third-party claims may require us to make freely accessible under open source terms one of our products or non-SAP software upon which we depend.
SAP continues to expand its participation in standards organizations and increase the use of such standards in its products. Participation in standards organizations might require the licensing of SAP’s intellectual property to contributors to the standard and to all standards implementers, including competitors, on a non-discriminatory basis in accordance with licensing terms defined by standards organizations. Within the software-related standards field, there is a trend toward expanding the scope of licensing obligations and narrowing an intellectual property owner’s right to revoke a license if sued by a licensee. In certain situations, limitations on SAP’s rights to revoke a license could reduce SAP’s ability to assert a patent infringement claim against a third party. Assertion of patents inadvertently licensed through standards could expose SAP to third-party claims.
Our Global Compliance Office is responsible for constantly assessing and managing risks associated with third-party intellectual property. It works closely with our Global GRC organization. The Global Compliance Office investigates the way we handle intellectual property, sets internal policies, and monitors compliance with these policies.
We believe that we will increasingly be subject to intellectual property infringement claims as the number of products in our industry segment grows, as we acquire companies with increased use of third-party code including open source code, as we expand into new industry segments with our products, resulting in greater overlap in the functional scope of products, and as non-practicing entities that do not design, manufacture, or distribute products increasingly assert intellectual property infringement claims.
Any claims, with or without merit, and negotiations or litigation relating to such claims, could preclude us from utilizing certain technologies in our products, be time-consuming, result in costly litigation, and require us to pay damages to third parties, stop selling or reconfigure our products and, under certain circumstances, pay fines and indemnify our customers, which could have an adverse effect on our business, financial profile, profit, cash flows, and reputation. They could also require us to enter into royalty and licensing arrangements on terms that are not favorable to us, cause product shipment delays, subject our products to injunctions, require a complete or partial redesign of products, result in delays to our customers’ investment decisions, and damage our reputation.
Software includes many components or modules that provide different features and perform different functions. Some of these features or functions may be subject to third-party intellectual property rights. The rights of another party could encompass technical aspects that are similar to one or more technologies in one or more of our products. Intellectual property rights of third parties could preclude us from using certain technologies in our products or require us to enter into royalty and licensing arrangements on unfavorable or expensive terms.
142 Combined Management Report

For more information and more detailed discussion relating to certain of these legal proceedings, see the Notes to the Consolidated Financial Statements, Note (24).
We might not acquire and integrate companies effectively or successfully and our strategic alliances might not be successful.
To expand our business, we have in the past made acquisitions of businesses, products, and technologies. Such acquisitions have increased in size and in strategic importance for SAP, and we expect to continue to make acquisitions in the future. Management’s negotiation of potential acquisitions and alliances and integration of acquired businesses, products, or technologies demands time, focus, and resources of management and of the workforce. Acquisitions of companies, businesses, and technology expose us to unpredictable operational difficulties, expenditures, and increased risks. These risks include, among others:– The selection of the wrong integration model for the acquired
company– The failure to integrate the acquired business and its different
business and licensing models– Failure to successfully integrate acquired technologies or
solutions into SAP’s solution portfolio and strategy in a timely and profitable manner
– The failure to integrate the acquired company’s operations across SAP’s different cultures, languages, and local protocols, all within the constraints of applicable local laws
– The failure to meet the needs of the acquired company’s customers and partners in the combined company
– The diversion of management’s time and attention from daily operations
– The loss of key personnel of the acquired business
We consider the probability of this risk materializing to be likely, and that any claims concerning intellectual property rights of third parties, open source requirements, or certain standards could have a business-critical impact on our business, financial position, profit, cash flows and reputation, as well as on the achievement of our revenue and operating profit target, and could also exacerbate the other risks we describe in this report. We classify this risk as a high risk.
We are named as a defendant in various legal proceedings for alleged intellectual property infringements. For more information and a more detailed discussion relating to certain of these legal proceedings, see the Notes to the Consolidated Financial Statements, Note (24).
Claims and lawsuits against us could have an adverse effect on our business, financial position, profit, cash flows, and reputation.
Claims and lawsuits are brought against us, including claims and lawsuits involving businesses we have acquired. Adverse outcomes to some or all of the claims and lawsuits pending against us might result in the award of significant damages or injunctive relief against us that could hinder our ability to conduct our business and could have an adverse effect on our reputation, business, financial position, profit, and cash flows.
The outcome of litigation and other claims or lawsuits is intrinsically uncertain. Management’s view of the litigation may also change in the future. Actual outcomes of litigation and other claims or lawsuits could differ from the assessments made by management in prior periods which are the basis for the lawsuit-related provisions we set up according to the IFRS.
We consider the probability of occurrence of this risk to be likely, and cannot exclude its business-critical impact on our reputation, business, financial position, profit, cash flows, and revenue and operating profit target if it were to materialize. We classify this risk as a high risk.
143Risk Management and Risks
We counter these acquisition-related risks with many different methodological and organizational measures. These include technical, operational, financial, and legal due diligence on the company or assets to be acquired and a holistic evaluation of material transaction and integration risks. The methods we use depend on the integration scenario. Our integration planning is detailed and standardized, and carried out by a dedicated integration team. We therefore believe we have minimized this risk.
Although we estimate this risk to be unlikely, we cannot completely exclude the possibility that this risk could have a business-critical impact on our business, financial position, profit, cash flows, and revenue and operating profit target. We classify this risk as a medium risk.
We may not be able to obtain adequate title to, or licenses in, or to enforce, intellectual property.
Protecting and defending our intellectual property is crucial to our success. We use a variety of means to identify and monitor potential risks and to protect our intellectual property. These include applying for patents, registering trademarks and other marks and copyrights, implementing measures to stop copyright and trademark infringement, entering into licensing, confidentiality, and non-disclosure agreements, and deploying protection technology. Despite our efforts, we might not be able to prevent third parties from obtaining, using, or selling without authorization what we regard as our proprietary technology and information. All of these measures afford only limited protection, and our proprietary rights could be challenged, invalidated, held unenforceable, or otherwise affected. Some intellectual property might be vulnerable
– Material unknown liabilities and contingent liabilities of acquired companies, including legal, tax, accounting intellectual property, or other significant liabilities that may not be detected through the due diligence process
– Legal and regulatory constraints (such as contract obligations, privacy frameworks and agreements)
– Difficulties in implementing, restoring, or maintaining internal controls, procedures, and policies
– Practices or policies of the acquired company that may be incompatible with our compliance requirements
– An adverse effect on relationships with existing customers, partners, or third-party providers of technology or products
– Difficulties in integrating the acquired company’s accounting, HR, and other administrative systems and coordination of the acquired company’s research and development (R&D), sales, and marketing functions
– Debt incurrence or significant cash expenditures– Constraints in enforcing acquired companies’ compliance
with existing SAP security standards in a timely manner– Difficulties in customer implementation projects combining
technologies and solutions from both SAP and the acquired company
In addition, acquired businesses might not perform as anticipated, resulting in charges for the impairment of goodwill and other intangible assets on our statements of financial position. Such charges may have an adverse effect on our business, financial position, profit, and cash flows. We have entered into, and expect to continue to enter into, alliance arrangements for a variety of purposes, including the development of new products and services. There can be no assurance that any such products or services will be successfully developed or that we will not incur significant unanticipated liabilities in connection with such arrangements. We may not be successful in overcoming these risks and we may therefore not benefit as anticipated from acquisitions or alliances.
144 Combined Management Report

We estimate the probability of this risk occurring as likely, and that it could have a business-critical impact on our reputation, business, financial position, profit, cash flows, and revenue and operating profit target. We classify this risk as a high risk.
SAP’s business strategy focuses on certain business models that are highly dependent on a working cyberspace. A cybersecurity breach could have an adverse effect on our customers, our reputation, and our business.
The key cybersecurity risks currently applicable to SAP include state-driven economic espionage as well as competitor-driven industrial espionage, and criminal activities including, but not limited to, cyber-attacks and “ mega breaches” against on-premise software, hosted, and cloud services. This might result in, for example, leakage of confidential information and intellectual property, defective products, production downtimes, supply shortages, and compromised data (including personal data). A failure of our cybersecurity measures could expose our business operations and service delivery to the described risks, for example, virtual attack, disruption, damage, and/or unauthorized access. Additionally, we could be subject to recovery costs, for example, as well as significant contractual and legal claims by customers, partners, authorities, and third-party service providers for damages against us, which could have an adverse effect on our reputation, business, financial position, profit, and cash flows.
to disclosure or misappropriation by employees, partners, or other third parties. Third parties might independently develop technologies that are substantially equivalent or superior to our technology. Finally, third parties might reverse-engineer or otherwise obtain and use technology and information that we regard as proprietary. Accordingly, we might not be able to protect our proprietary rights against unauthorized third-party copying or utilization, which could have an adverse effect on our competitive and financial positions, and result in reduced sales. Any legal action we bring to enforce our proprietary rights could also involve enforcement against a partner or other third party, which may have an adverse effect on our ability, and our customers’ ability, to use that partner’s or other third parties’ products. In addition, the laws and courts of certain countries may not offer effective means to enforce our intellectual property rights. This could have an adverse effect on our reputation, business, financial position, profit, and cash flows.
We rely on a combination of the protections provided by applicable statutory and common law rights, including trade secret, copyright, patent, and trademark laws, license and non-disclosure agreements, and technical measures to establish and protect our proprietary rights in our products. We have established various internal programs, such as internal policies, processes, and monitoring, to assess and manage the risks associated with standards organizations, open source, and third-party intellectual property.
We may be dependent in the aggregate on technology that we license from third parties that is embedded in our products or that we resell to our customers. We have licensed and will continue to license numerous third-party software products that we incorporate into and/or distribute with our existing products. We endeavor to protect ourselves in the respective agreements by obtaining certain rights in case such agreements are terminated. We are party to certain patent cross-license agreements with third parties.
145Risk Management and Risks

To minimize these risks, we have implemented several technical and organizational measures designed to safeguard our information, IT and facility infrastructure, and other assets. These measures include, for example, physical access control systems at facilities, multilevel access controls, closed-circuit television surveillance, and security personnel in all critical areas. Access to information and information systems is controlled using authorization concepts. Managers and employees are regularly sensitized to the issues and given mandatory security and compliance training. We keep these measures under continuous review to meet current threats.
Although we estimate the probability of occurrence of this risk to be unlikely, we cannot completely exclude the possibility that any misuse, theft, or breach of security could have a moderate impact on our business, financial position, profit, and cash flows as well as on our revenue and operating profit target. We classify this risk as a low risk.
Our insurance coverage might not be sufficient and uninsured losses may occur.
We maintain insurance coverage to protect us against a broad range of risks, at levels we believe are appropriate and consistent with current industry practice. Our objective is to exclude or minimize risk of financial loss at reasonable cost. However, we may incur losses that may be beyond the limits, or outside the scope, of coverage of our insurance and that may limit or prevent indemnification under our insurance policies. In addition, we might not be able to maintain adequate insurance coverage on commercially reasonable terms in the future. Further, certain categories of risks are currently not insurable at reasonable cost, which could have an adverse effect on our business, financial position, profit, and cash flows. Finally, there can be no assurance of the financial ability of the insurance companies to meet their claim payment obligations.
To address the increasing cybersecurity threats, SAP is continuously adapting and modifying its security procedures. We have multiple security measures in place, such as technical IT security measures, identity and access management, and mandatory security and compliance trainings. In addition, our security governance model clearly defines security management accountabilities for all security areas regarding product security and corporate security, which enables us to respond quickly to identified cybersecurity risks.
Although we still consider the occurrence of this risk to be unlikely, we cannot completely exclude the possibility that this risk could have a business-critical impact on our business, financial position, profit, cash flows, and reputation as well as revenue and operating profit target. We classify this risk as a medium risk.
We may not be able to protect our critical information and assets or to safeguard our business operations against disruption.
SAP is highly dependent on the exchange of a wide range of information across our global operations and on the availability of our infrastructure. With regard to our physical environment, we face several key security risks such as industrial and/or economic espionage, serious and organized crime, and other illegal activities, as well as violent extremism and terrorism. We might be endangered by threats including, but not limited to, social engineering, misuse, or theft of information or assets, or damage to assets by trespassers in our facilities or by people who have gained unauthorized physical access to our facilities, systems, or information. These could have an adverse effect on our business, financial profile, profit, and cash flows.
146 Combined Management Report

We believe that the likelihood of this risk materializing is remote and that if the risk were to occur, its potential impact on our business, financial position, profit, cash flows, and operating profit target would be minor. We classify this risk as a low risk.
Consolidated Risk ProfileSAP consolidates and aggregates all risks reported by the different business units and functions following our risk management policy, monitored by an SAP Group-wide risk management governance function.
Compared to previous years, in 2014 we recognized only minor changes in the percentages of all individual risks categorized as “high” or “medium” in our risk-level matrix. At the end of the year, the number of risks categorized as “high” accounted for 11% (2013: 12%) of all identified risks, while the risks categorized as “medium” accounted for 46% (2013: 39%) of all identified risks.
In our view, considering their likelihood of occurrence and impact level, the risks described in our aggregated risk report do not individually or cumulatively threaten our ability to continue as a going concern. Management remains confident that the SAP Group’s earnings strength forms a solid basis for our future business development and provides the necessary resource to pursue the opportunities available to the SAP Group. Because of our strong position in the market, our technological leadership, our highly motivated employees, and our structured processes for early risk identification, we are confident that we can continue to successfully counter the challenges arising from the risks in our risk profile in 2015.
In view of the scope of our insurance coverage and our selection of insurers, and because we keep our insurance programs under constant review, we believe that the likelihood of this risk materializing is remote.
However, we cannot exclude the possibility of a business-critical impact on our business, financial position, profit, cash flows, and operating profit target if the risk were to occur. We classify this risk as a medium risk.
We could incur significant losses in connection with venture capital investments.
Through Sapphire Ventures (formerly SAP Ventures), our consolidated venture investment funds, we plan to continue investing in new and promising technology businesses. Many such investments initially generate net losses and require additional expenditures from their investors. Changes to planned business operations have, in the past affected, and may in the future affect, the performance of companies in which Sapphire Ventures holds investments, and that could have an adverse effect on the value of our investments in Sapphire Ventures, which could have an adverse effect on our business, financial position, profit, and cash flows. Furthermore, tax deductibility of capital losses and impairment in connection with equity securities are often restricted and could therefore have an adverse effect on our effective tax rate.
To address this risk, Sapphire Ventures diversifies its portfolio and manages our investments actively. In addition, our venture capital activities have a limited scope.
147Risk Management and Risks

Growth prospects remain mixed in the Asia-Pacific-Japan (APJ) region for the coming years, according to the ECB. In light of encouraging signs from housing and industrial output, the ECB expects positive numbers from Japan in 2015. It estimates that in 2015, the Chinese economy will grow slightly slower than in 2014. Consumer spending and trade are expected to make the largest contributions to growth in China.
IT MARKET: THE OUTLOOK FOR 2015Expansion of the worldwide IT market year-over-year will slow slightly to 3.7% (software: 6.5%) in 2015, according to International Data Corporation (IDC), a market research firm based in the United States. It believes that across the advanced, emerging, and developing economies, there will be stable demand for IT in the coming years. However, it expects prices to come under increasing pressure as
FUTURE TRENDS IN THE GLOBAL ECONOMYThe European Central Bank (ECB) forecasts that global economic activity will continue to regain strength gradually but that the recovery will remain modest. Economic prospects for the various countries and regions are becoming increasingly mixed: The ECB believes key advanced economies should do well in the years to come; while structural problems will grow more severe and credit will become tighter in the emerging economies. Developments in current geopolitical flashpoints, for example in the Middle East and Ukraine, could also be a crucial factor, the ECB says.
In the Europe, Middle-East, and Africa (EMEA) region, economic growth may be slower than the worldwide average in 2015. Notably, growth in the euro area may remain weak. In the euro area, the ECB now expects annual growth of a little more than 1% in 2015 and 2016, which is a downward correction of its earlier forecasts. However, the ECB believes various monetary interventions could bear fruit in 2015, encouraging company investment. The ECB projects relatively robust growth in Central and Eastern Europe, rooted in a gradual increase in domestic demand. On the other hand, it expects export trade will be hampered by the geopolitical tensions between Russia and Ukraine.
Growth may also be slower than the global average in the Americas region in 2015, says the ECB. The ECB predicts strong economic growth in the United States in the future. Better conditions on the labor and housing markets and continuing easier finance should have a positive influence. However, the ECB believes that in Latin America growth will stay on a low level as commodity prices continue to fall and production costs increase. Clear differences in countries’ performance may remain. The ECB observes constraining factors in Brazil in particular, whereas it notes that in Mexico growth may accelerate in years to come as a result of that country’s far-reaching structural reforms.
Expected Developments and Opportunities
Economic Trends – Year-Over-Year GDP GrowthPercent
2013e 2014p 2015p
World 3.3 3.3 3.5Advanced economies 1.3 1.8 2.4
Developing and emerging economies 4.7 4.4 4.3
Europe, the Middle East, and Africa (EMEA)
Euro area –0.5 0.8 1.2
Germany 0.2 1.5 1.3
Central and Eastern Europe 2.8 2.7 2.9
Middle East and North Africa 2.2 2.8 3.3
Sub-Saharan Africa 5.2 4.8 4.9
AmericasUnited States 2.2 2.4 3.6
Canada 2.0 2.4 2.3
Central and South America, Caribbean
2.8 1.2 1.3
Asia-Pacific-Japan (APJ)Japan 1.6 0.1 0.6
Asian developing economies 6.6 6.5 6.4
China 7.8 7.4 6.8
e = estimate; p = projectionSource: International Monetary Fund (IMF), World Economic Outlook Update January 2015, Cross Currents, as of January 20, 2015, p. 3
148 Combined Management Report

IMPACT ON SAPSAP expects to outperform the global economy and the IT industry again in 2015 in terms of revenue growth. The last years of growth momentum underscore our leadership in the transformation of the industry.
In 2014, we delivered on our Run Simple strategy to help our customers transform their businesses. SAP's strong growth is driven by the SAP HANA platform, the broadest cloud portfolio, and the largest business network in the world. SAP powers the clear path to growth for businesses in the 21st century: run real time, run networked, Run Simple. We will continue to push
competing segments, such as cloud offerings and classic software products, react to one another. In IDC’s view, moreover, the future expansion of the IT market depends on the resilience of the global economy in the face of many risk factors, for example the Ebola epidemic, the activities of Islamic State in the Middle East, the troubles in Ukraine, and the political tension in Southeast Asia.
In the EMEA region, IDC expects overall IT market growth to decelerate to 3.0% in 2015. Nonetheless, it predicts growth in the software and services segments of 5.3% and 3.3% respectively; both higher than in 2014. According to IDC, IT spending in Western Europe will possibly grow 1.2% in 2015 – considerably more slowly than in 2014. The German IT market may grow only slightly more quickly than that, at 1.5%. In Central and Eastern Europe, IT spending growth could again increase, to 7.1% (Russia: 5.9%) in 2015, but in the Middle East and Africa it might slow to single-digit growth of 8.6%, IDC says.
In the Americas region, IDC projects that in 2015 the IT market will continue to expand at 3.9% – a similar rate to that in 2014. It forecasts 7.3% growth in the software segment, as in 2014, and 2.7% growth in the services segment, somewhat slower than in 2014. IDC forecasts that IT spending may grow 3.5% in the United States and 5.7% in Latin America (Brazil: 3.2%; Mexico 6.3%) in 2015. Expansion of overall IT spending in the APJ region may be sustained at 4.4% in 2015, according to IDC. That could include accelerated growth of 6.2% in the software segment. IDC expects IT market growth to slow by 0.2% in Japan and 4.4% in China in 2015.
Trends in the IT Market – Increased IT Spending Year-Over-Year Percent
2013e 2014p 2015p
WorldTotal IT 4.6 4.1 3.7
Hardware 4.9 3.8 2.8
Packaged software 7.4 6.1 6.5
Applications 7.3 6.0 6.2
IT services 2.6 3.3 3.5
Europe, Middle East, and Africa (EMEA)
Total IT 3.1 3.6 3.0
Packaged software 4.5 4.1 5.2
Applications 4.5 4.2 5.0
IT services 1.5 2.6 3.3
AmericasTotal IT 5.2 4.3 3.9
Packaged software 8.9 7.3 7.3
Applications 8.9 7.1 7.0
IT services 2.8 3.1 2.7
Asia-Pacific-Japan (APJ)Total IT 5.7 4.4 4.4
Packaged software 8.2 5.8 6.2
Applications 7.8 6.0 5.9
IT services 4.3 5.5 5.8
e = estimate, p = projectionSource: IDC Worldwide Black Book Q3 2014 Update
149Expected Developments and Opportunities

revenues from premium support services were classified as support revenues. Simultaneously with this change, we are simplifying and clarifying the labeling of several line items in our income statement. This includes renaming the previous revenue subtotal labeled software and support (which included premium support revenues) to software licenses and support (which no longer includes premium support revenues). The previous revenue subtotal labeled software and software-related service revenue is renamed cloud and software and accordingly no longer includes premium support revenue, which is now reclassified under the new services revenue line item. The two revenue line items, cloud subscriptions and support and total revenue are not affected by any of these changes and remain unaltered.
Our outlook for 2015 and beyond as outlined below is based on this modified income statement.
Revenue and Operating Profit OutlookWe are providing the following outlook for the full year 2015:– SAP expects full-year 2015 non-IFRS cloud subscriptions and
support revenue to be in a range of €1.95 billion to €2.05 billion at constant currencies (2014: €1.10 billion). The upper end of this range represents a growth rate of 86% at constant currencies. Concur and Fieldglass are expected to contribute approximately 50 percentage points to this growth.
– SAP expects full-year 2015 non-IFRS cloud and software revenue to increase by 8% to 10% at constant currencies (2014: €14.33 billion).
– SAP expects full-year 2015 non-IFRS operating profit to be in a range of €5.6 billion to €5.9 billion at constant currencies (2014: €5.64 billion).
relentlessly toward a much more predictable business model, in parallel we will further expand our core business and at the same time we will continue to expand our operating profit.
We are well-positioned and therefore confident we can achieve our medium-term targets for 2017 and 2020, assuming that the economic environment and IT industry develop as currently forecasted. Balanced in terms of regions as well as industries, we are well-positioned with our product offering to offset smaller individual fluctuations in the global economy and IT market.
The significantly more volatile market environment challenges also SAP to reach its ambitious targets. Our market and the demands of our customers are changing rapidly. We anticipated these changes early and positioned ourselves strategically. A comparison of our business outlook with forecasts for the global economy and IT industry shows that we can be successful even in a tough economic environment and will further strengthen our position as the market leader of enterprise application software.
We plan to continue to invest in countries in which we expect significant growth. Such countries include Brazil, China, India, Russia, as well as countries in the Middle East and Africa. We therefore expect to see further future growth potential not only regionally but also with our broad product offering helping us reach our ambitious 2015 outlook targets and medium-term aspirations for 2017 and 2020.
OPERATIONAL TARGETS FOR 2015 (NON-IFRS)
Changes to Income Statement StructureAs outlined in the Service and Support section in this report, we have started to combine several of our services under our SAP ONE Service approach. In aligning our financial reporting with this change, starting in 2015, we are combining the revenue from premium support services with the revenue from professional services and other services in a new services revenue line item in our income statement. Until 2014,
150 Combined Management Report

Goals for Liquidity and FinanceOn December 31, 2014, we had a negative net liquidity. We believe that our liquid assets combined with our undrawn credit facilities are sufficient to meet our present operating financing needs also in 2015 and, together with expected cash flows from operations, will support debt repayments and our currently planned capital expenditure requirements over the near term and medium term. We intend to repay a US$300 million U.S. private placement and a €550 million Eurobond when they mature in October and November 2015, respectively. Furthermore, we are planning to repay a substantial amount of our outstanding bank loans and refinance another part through the debt capital markets. By the time of this report, we have no concrete plans for future share buybacks.
Investment GoalsOur planned capital expenditures for 2015 and 2016, other than from business combinations, mainly comprise the construction activities described in the section Assets (IFRS) section of this report. We expect investments from these activities of approximately €170 million during the next two years. These investments can be covered in full by operating cash flow.
Proposed DividendUntil now, our policy has been to distribute more than 30% of profit after tax in dividend. In practice however, the payout has been greater than 35% of profit after tax in all recent years. We are therefore amending our policy, which from now on will be to pay a dividend totaling more than 35% of profit after tax.
Premises on Which Our Outlook Is BasedIn preparing our outlook guidance, we have taken into account all events known to us at the time we prepared this report that could influence SAP’s business going forward.
While our full-year 2015 business outlook is at constant currencies, actual currency reported figures are expected to continue to be impacted by currency exchange rate fluctuations. If exchange rates remain at the December 2014 closing rates for the rest of the year 2015, the Company expects the non-IFRS cloud and software revenue growth rate to experience a currency benefit of approximately two percentage points and the non-IFRS operating profit growth rate at actual currencies to experience a currency benefit of approximately one percentage point for the full-year 2015.
We expect that non-IFRS total revenue will continue to depend largely on the revenue from cloud and software. However, the revenue growth we expect from this is below the outlook provided for non-IFRS cloud subscriptions and support revenue.
The following table shows the estimates of the items that represent the differences between our non-IFRS financial measures and our IFRS financial measures.
In 2014, we incurred an expense of €309 million in connection with the TomorrowNow und Versata lawsuits. Versata and SAP have entered into a patent license and settlement agreement in Q3 2014.
The company expects a full-year 2015 effective tax rate (IFRS) of 25.0% to 26.0% (2014: 24.7%) and an effective tax rate (non-IFRS) of 26.5% to 27.5% (2014: 26.1%).
Non-IFRS Measures€ millions
Estimated Amounts for 2015
Actual Amounts for 2014
Revenue adjustments < 20 19
Share-based payment expenses 520 to 560 290
Acquisition-related charges 670 to 720 562
Restructuring 150 to 250 126
151Expected Developments and Opportunities

The outlook projections for the SAP Group in respect of liquidity, finance, investment, and dividend are equally applicable to SAP SE.
Among the assumptions underlying this outlook are those presented above concerning the economy and our expectations for the performance of the SAP Group. MEDIUM-TERM PROSPECTSIn this section, all discussion of the medium-term prospects is based exclusively on non-IFRS measures.
SAP expects to grow its more predictable revenue business while steadily increasing operating profit. Our strategic objectives are focused primarily on the following financial and non-financial objectives: growth, profitability, customer loyalty, and employee engagement.
Looking beyond 2015, SAP updated its ambition for 2017. We continue to expect fast growth in our cloud business, with cloud subscriptions and support revenue reaching a range between €3.5 billion to €3.6 billion in 2017. Total revenue is expected to reach €21 billion to €22 billion and operating profit is expected to be between €6.3 billion and €7.0 billion in 2017.
The changes to the 2017 goals reflect the impact of the Concur acquisition and anticipated faster customer adoption of SAP’s managed cloud offering. SAP also anticipates that its fast-growing cloud business along with growth in support revenue will drive a higher share of more predictable revenue, with the total of cloud subscriptions and support revenue and software support revenue reaching 65% to 70% of total revenue in 2017 (2014: 57%).
Among the premises on which this outlook is based are those presented concerning economic development and the assumption that there will be no effects from a major acquisition.
OUTLOOK FOR SAP SEThe primary source of revenue for SAP SE is the license fees it charges subsidiaries for the right to market and maintain SAP software solutions. Consequently, the performance of SAP SE in operating terms is closely tied to the cloud and software revenue of the SAP Group.
We expect SAP SE product revenue to increase at constant currencies generally in line with the 8% to 10% constant-currency rise in non-IFRS cloud and software revenue anticipated for the SAP Group in 2015.
Negative effects totaling €267 million from non-recurring payments relating to the settlement of lawsuits impacted SAP SE's operating income in 2014. Also, in 2015 there will be a positive non-recurring effect of €266 million from the realization of unrecognized gains from forward currency contracts. Consequently, we expect an unusually steep rise in operating income in 2015, provided the SAP Group achieves its targets and there are no non-recurring negative effects.
Provided the SAP Group continues to hit its revenue and profit targets, we expect SAP SE to sustain revenue and operating income growth into the medium term.
We believe SAP SE, the parent company of the SAP Group, will receive investment income in the form of profit transfers and dividends again in the future. The growth we expect from the SAP Group should have a positive effect on SAP SE investment income.
152 Combined Management Report

NON-FINANCIAL GOALS 2015In addition to our financial goals, we also focus on two non-financial targets: customer loyalty and employee engagement.
We believe it is essential that our employees are engaged, drive our success, and support our strategy. Therefore, we remain committed to increasing our employee engagement index score to 82% by 2015 (2014: 79%).
Further, our customers’ satisfaction with the solutions we offer is very important to us. We want our customers to not only be satisfied, but also see us as a trusted partner for innovation. We measure this customer loyalty metric using the Customer Net Promoter Score (NPS). For 2015, we aim to achieve a combined (on-premise and cloud) NPS score of 24%.
Our financial and non-financial goals affirm our commitment to innovation and sustainability, and will help us deliver on our vision to help the world run better and improve people’s lives. Our mission is to help our customers run at their best. To fulfill our mission, we apply our Run Simple operating principle to help our customers run their businesses better and master complexity, which is the most intractable challenge businesses face today. We do this by delivering technology innovations that we believe address the challenges of today and tomorrow without disrupting our customers’ business operations.
By 2017, SAP’s rapidly growing cloud subscriptions and support revenue is expected to be close to software license revenue – and is expected to exceed software licenses revenue in 2018. At that time, SAP expects to reach a scale in its cloud business that will clear the way for accelerated operating profit expansion.
SAP also has high-level ambitions for 2020, with 2020 cloud subscriptions and support revenue expected to reach €7.5 billion to €8.0 billion. Total revenue is expected to be between €26 billion and €28 billion and operating profit is expected to be in a range of €8 billion to €9 billion in 2020. We expect the share of more predictable revenue to grow further, with the total of cloud subscriptions and support revenue and software support revenue reaching between 70% and 75% of total revenue in 2020. To realize the expected increase in operating profit, until 2020 SAP aims to grow gross profit from cloud subscriptions and support (defined as the difference between cloud subscription and support revenue and the respective cost of revenue) by a compound annual growth rate of approximately 40% on the 2014 figure. This growth is expected to result in a cloud subscription and support gross margin; in other words, the gross margin derived from the cloud subscription and support gross profit that is approximately 9 percentage points higher in 2020 than in 2014 (2014: 64%). In the same period, our target is to grow gross profit from software licenses and support by a compound annual growth rate of approximately 3%, leading to an improvement in the software licenses and support gross margin of approximately 2 percentage points (2014: 86%).
SAP anticipates that the gross margins of the various cloud business models will continue to differ significantly in the long term. While the gross margin from public cloud subscriptions and from the business network are both expected to reach approximately 80% long term, we anticipate that in the long-term, gross margin on managed cloud offerings will be about 40%. In addition, based on subscription bookings, we expect, once our cloud business has achieved a mature state, approximately 80% of the cloud subscription business will be generated from existing contracts and their renewals (2014: approximately 60%) and approximately 20% from new business (2014: approximately 40%).
153Expected Developments and Opportunities

OPPORTUNITIESMarket dynamics are shifting rapidly as the advantages of in-memory technologies are becoming more evident and customers are significantly adopting cloud applications with the objective of reducing complexity and simplify business operations. Additionally, customers are increasingly reaping benefits from digital business networks.
Our customers rely on SAP as the trusted partner in their business transformation, not only toward providing in-memory technology, standardized cloud applications, and access to business networks, but also toward driving new business outcomes and enabling business model innovations. To meet these expectations, we must grow consistently and accelerate the pace of our own business transformation by exploiting new opportunities.
We have established a framework for opportunity management by evaluating and analyzing four key areas: current markets, competitive landscapes, external scenarios, and technological trends. Additionally, we have delved into customer and product segmentation, growth drivers, and industry-specific success factors. Based on these combined insights, our Executive Board defines winning market strategies. Our shareholder value relies heavily upon a fine balance of risk mitigation and value-driven opportunities. Therefore, our strong governance model ensures that decisions are based on return, investment required, and risk mitigation. We rely on the talent and resources within SAP and our entire ecosystem.
As far as opportunities are likely to occur, we have incorporated them into our business plans, our outlook for 2015, and our medium-term prospects outlined in this report. Therefore, the following section focuses on future trends or events that might result in an uplift of our outlook and medium-term prospects, if they develop better than we have anticipated in our forecasts.
SAP SE is the parent company of the SAP Group and earns most of its revenue from software license fees, subscriptions fees, and dividends paid by affiliates. Consequently, the opportunities described below also apply – directly or indirectly – to SAP SE.
Opportunities from Economic ConditionsEconomic conditions have a clear influence on our business, financial position, profit, and cash flows. Should the global economy experience a more sustained growth than is reflected in our plans today, our revenue and profit may exceed our current outlook and medium-term prospects.
In our current plans, we have assumed a continued or recovering growth in emerging markets (Africa, Brazil, China, India, Middle East, and Russia). These markets are prime opportunities both for our established enterprise applications and for new offerings. They offer opportunity for sustainable double-digit growth rates. At the same time, they show a higher degree of short-term volatility influenced by geopolitical disturbances (for example, government policy shifts or disease).
We continue to acknowledge the growing demand for prudent management of resources and new business models, both for our customers and for ourselves. SAP will continue to leverage the technological capabilities to solve even more complex problems of humanity (for example, in innovations for the healthcare sector, the utility industry, the labor market, and others.).
For more information about future trends in the global economy, the IT market outlook, and the potential influence on SAP, see the Expected Developments and Opportunities section.
154 Combined Management Report
significantly. For example, the acquisition of Concur significantly strengthens the value proposition of a business network from SAP by addressing one of the most important enterprise spend categories – travel expenses. Furthermore, SAP seeks to establish new business models and leverage our expanding ecosystem of partners to achieve scale and maximize opportunities.
Our strong assets in applications and analytics, as well as database and technology, continue to offer solid multiyear growth opportunities as we bring innovative technologies with simplified consumption to our installed base and continue to add net-new customers. Unexpected portfolio growth may positively impact our revenue, profit, and cash flows and result in exceeding our stated outlook and medium-term prospects. Specifically, the SAP HANA platform and our cloud offerings, including simplified solutions, could create even more demand than is reflected in our stated outlook and medium-term prospects.
For more information about future opportunities for SAP, see the Strategy and Business Model and Expected Developments and Opportunities sections.
Opportunities from Our Partner EcosystemSAP continues to grow and develop a global partner ecosystem. To increase market coverage, we want to enhance our portfolio and spur innovation with the specified objective of increasing the partner revenue contribution to SAP’s overall revenue target. In addition to strengthening our core, we will leverage our entire ecosystem to drive adoption of SAP HANA and cloud solutions. This includes strategic partnerships across all areas: third-party software vendors, systems integrators, service providers, and infrastructure providers. As
Opportunities from Research and Development TractionOur continued growth through innovation is based on our ability to leverage R&D resources effectively. We continue to improve our development processes through design thinking and lean methodologies. We are accelerating innovation cycles especially in the area of cloud applications and engaging more closely with our customers to ensure accuracy and success.
While speed is a key strength, we also focus on ease of adoption and providing compelling returns. This allows our customers to easily consume technologies and software applications with immediate benefits for their businesses. If we make innovations available faster than currently anticipated, or if customers adopt the innovations faster than currently expected, for example, shifting faster to managed clouds for ERP, or cloud-based finance solutions, this could positively impact our revenue, profit, and cash flows and result in exceeding our stated outlook and medium-term prospects.
For more information about future opportunities in research and development for SAP, see the Products, Research & Development, and Services as well as the Expected Developments and Opportunities sections.
Opportunities from Our Strategy for Profitable GrowthSAP strives to generate profitable growth across our portfolio of products, solutions, and services to keep or improve its market position. We will continue to expand our addressable market to US$350 billion in 2020, compared to US$110 billion in 2010.
We see opportunities in growing product and market areas, such as in-memory computing, cloud, mobile, business networks, digital marketing, social media, Big Data, the Internet of Things, and predictive analytics. In addition to organic developments and tuck-in acquisitions, large strategic acquisitions in particular may boost our revenue and profits
155Expected Developments and Opportunities

Our outlook and medium-term prospects are based on certain assumptions regarding employee productivity and engagement. If the actual employee productivity exceeds these assumptions, it could positively impact our revenue, profit, and cash flows and result in exceeding our stated medium-term prospects.
For more information about future opportunities from our employees, see the Employees and Social Performance section.
Opportunities from Our Customer EngagementSAP goes to market by region, customer segments, line of business, and industry. We evolve and invest in our go-to-market coverage model to effectively sell industry-specific solutions while increasing our engagement with customers. We focus on the dynamic and fast-changing landscape each industry faces as technology evolves.
We offer unique services that significantly drive a return on investment, and continue to actively look at new opportunities to increase the value we deliver to our customers. Our outlook and medium-term prospects are based on certain assumptions regarding the success of our go-to-market approaches. If the actual go-to-market success exceeds these assumptions, this could positively impact our revenue, profit, and cash flows, and result in exceeding our stated medium-term prospects.
a result, we are creating an ever-stronger setup, where SAP, along with our customers and partners, co-innovate and develop new innovative solutions on top of SAP HANA. Should the business of our partners develop better than currently expected, our indirect sales (partner revenue) could grow stronger than reflected in our outlook and medium-term prospects. This may positively impact our revenue, profit, and cash flows, and result in exceeding our stated medium-term prospects.
For more information about opportunities arising from our partner ecosystem, see the Partner Ecosystem and Expected Developments and Opportunities sections.
Opportunities from Our EmployeesOur employees drive our innovation, are the value to our customers, and consistently promote our growth and profitability. In 2014, we increased the number of full-time employees accompanied with balanced job restructurings to drive SAP’s simplification and growth. We anticipate improvements in employee productivity as a result of our continued endeavors in design-thinking principles. As described in the Employees and Social Performance section, we constantly invest in our talents to increase engagement, collaboration, social innovation, and health.
To ensure continuous innovation and sustained business success, we need to continuously tap into the global talent pool and bring the best and brightest talent to SAP. To do so, we will further strengthen our brand perception in the market and optimize our recruiting experience to emphasize our focus on helping the world run better and improving people’s lives. Furthermore, we will maximize mobile channels and innovative talent strategies to tap into new talent pools.
156 Combined Management Report
The Supervisory Board of SAP SE nominated Steve Singh, CEO of Concur, to the Global Managing Board with effect from January 1, 2015. He is responsible for our business network strategy and activities.
Additionally, the Supervisory Board nominated Michael Kleinemeier to the Global Managing Board. Together with Gerhard Oswald and Ingrid-Helen Arnold, he is responsible for the Global Service & Support board area with effect from January 1, 2015.
Events After the Reporting Period
157Events After the Reporting Period

GROWTH
We use Non-IFRS total revenue to measure the growth of our company. We saw
a solid increase in this revenue measure in 2014 (€17.58 billion) compared
to 2013 (€16.90 billion) and expect to reach a range of €21 billion to €22 billion in
2017 and a range of €26 billion to €28 billion in 2020.
€17.58B

Consolidated Financial Statements IFRS159
160 ConsolidatedIncomeStatements161 ConsolidatedStatementsofComprehensiveIncome162 ConsolidatedStatementsofFinancialPosition164 ConsolidatedStatementsofChangesinEquity166 ConsolidatedStatementsofCashFlows
167 NotestotheConsolidatedFinancialStatements
167 (1)GeneralInformationaboutConsolidatedFinancialStatements167 (2)ScopeofConsolidation168 (3)SummaryofSignificantAccountingPolicies183 (4)BusinessCombinations185 (5)Revenue186 (6)CostofSoftwareandSoftware-RelatedServices186 (7)Restructuring186 (8)EmployeeBenefitsExpenseandHeadcount188 (9)OtherNon-OperatingIncome/Expense,Net189 (10)FinancialIncome,Net189 (11)IncomeTax192 (12)EarningsperShare193 (13)OtherFinancialAssets194 (14)TradeandOtherReceivables195 (15)OtherNon-FinancialAssets196 (16)GoodwillandIntangibleAssets199 (17)Property,Plant,andEquipment199 (18)TradeandOtherPayables,FinancialLiabilities,andOtherNon-FinancialLiabilities203 (19)Provisions210 (20)DeferredIncome210 (21)TotalEquity212 (22)AdditionalCapitalDisclosures214 (23)OtherFinancialCommitments215 (24)LitigationandClaims220 (25)FinancialRiskFactors223 (26)FinancialRiskManagement230 (27)AdditionalFairValueDisclosuresonFinancialInstruments239 (28)Share-BasedPayments247 (29)SegmentandGeographicInformation250 (30)BoardofDirectors254 (31)RelatedPartyTransactions255 (32)PrincipalAccountantFeesandServices256 (33)GermanCodeofCorporateGovernance256 (34)EventsAftertheReportingPeriod257 (35)Subsidiaries,Associates,andOtherEquityInvestments
267 Management’sAnnualReportonInternalControloverFinancialReportingintheConsolidatedFinancialStatements
159

Consolidated Financial Statements IFRS
Consolidated Income Statements of SAP Group for the Years Ended December 31,€millions,unlessotherwisestated
Notes 2014 2013 2012
Cloudsubscriptionsandsupport 1,087 696 270
Software 4,399 4,516 4,658
Support 9,368 8,738 8,237
Softwareandsupport 13,767 13,254 12,895
Software and software-related service revenue 14,855 13,950 13,165Professional services and other service revenue 2,706 2,865 3,058
Total revenue (5) 17,560 16,815 16,223
Costofsoftwareandsoftware-relatedservices (6) –2,894 –2,629 –2,553
Costofprofessionalservicesandotherservices –2,379 –2,402 –2,520
Total cost of revenue –5,272 –5,031 –5,073Gross profit 12,288 11,784 11,149Researchanddevelopment –2,331 –2,282 –2,261
Salesandmarketing –4,304 –4,131 –3,912
Generalandadministration –892 –866 –949
Restructuring (7) –126 –70 –8
TomorrowNowandVersatalitigation (24) –309 31 –2
Otheroperatingincome/expense,net 4 12 23
Total operating expenses –13,230 –12,336 –12,181Operating profit 4,331 4,479 4,041
Other non-operating income/expense, net (9) 49 –17 –173Financeincome 127 115 103
Financecosts –152 –181 –175
Financial income, net (10) –25 –66 –72Profit before tax 4,355 4,396 3,796
IncometaxTomorrowNowandVersatalitigation 86 –8 0
Otherincometaxexpense –1,161 –1,063 –993
Incometaxexpense (11) –1,075 –1,071 –993
Profit after tax 3,280 3,325 2,803attributabletoownersofparent 3,280 3,326 2,803
attributabletonon-controllinginterests 0 –1 0
Earnings per share, basic (in €) (12) 2.75 2.79 2.35Earnings per share, diluted (in €) (12) 2.74 2.78 2.35
TheaccompanyingNotesareanintegralpartoftheseConsolidatedFinancialStatements.
160 Consolidated Financial Statements IFRS

Consolidated Statements of Comprehensive Income of SAP Group for the Years Ended December 31,€millions
Notes 2014 2013 2012
Profit after tax 3,280 3,325 2,803Itemsthatwillnotbereclassifiedtoprofitorloss
Remeasurementsondefinedbenefitpensionplans (19) –30 16 –12
Incometaxrelatingtoitemsthatwillnotbereclassified (11) 7 –3 4
Other comprehensive income after tax for items that will not be reclassified to profit or loss
–23 13 –8
Itemsthatwillbereclassifiedsubsequentlytoprofitorloss (21)
Exchangedifferences 1,165 –576 –214
Available-for-salefinancialassets (27) 128 60 13
Cashflowhedges (26) –38 0 63
Incometaxrelatingtoitemsthatwillbereclassified (11) 31 –8 –20
Other comprehensive income after tax for items that will be reclassified to profit or loss
1,286 –524 –157
Other comprehensive income net of tax 1,263 –511 –165Total comprehensive income 4,543 2,814 2,638
attributabletoownersofparent 4,543 2,815 2,638
attributabletonon-controllinginterests 0 –1 0
TheaccompanyingNotesareanintegralpartoftheseConsolidatedFinancialStatements.
161Consolidated Statements of Comprehensive Income

Consolidated Statements of Financial Position of SAP Group as at December 31,€millions
Notes 2014 2013
Cashandcashequivalents 3,328 2,748
Otherfinancialassets (13) 678 251
Tradeandotherreceivables (14) 4,330 3,864
Othernon-financialassets (15) 431 346
Taxassets 214 142
Total current assets 8,980 7,351Goodwill (16) 20,945 13,690
Intangibleassets (16) 4,608 2,954
Property,plant,andequipment (17) 2,102 1,820
Otherfinancialassets (13) 1,021 607
Tradeandotherreceivables (14) 100 98
Othernon-financialassets (15) 164 107
Taxassets 231 172
Deferredtaxassets (11) 355 292
Total non-current assets 29,527 19,739Total assets 38,507 27,091
162 Consolidated Financial Statements IFRS

Notes 2014 2013
Tradeandotherpayables (18) 1,007 850
Taxliabilities 339 433
Financialliabilities (18) 2,561 748
Othernon-financialliabilities (18) 2,807 2,562
ProvisionTomorrowNowandVersatalitigation (24) 1 223
Otherprovisions 149 123
Provisions (19) 150 346
Deferredincome (20) 1,681 1,408
Total current liabilities 8,544 6,347Tradeandotherpayables (18) 55 45
Taxliabilities 371 319
Financialliabilities (18) 8,980 3,758
Othernon-financialliabilities (18) 219 257
Provisions (19) 149 132
Deferredtaxliabilities (11) 513 110
Deferredincome (20) 78 74
Total non-current liabilities 10,366 4,695Total liabilities 18,909 11,043
Issuedcapital 1,229 1,229
Sharepremium 614 551
Retainedearnings 18,317 16,258
Othercomponentsofequity 568 –718
Treasuryshares –1,224 –1,280
Equity attributable to owners of parent 19,504 16,040
Non-controlling interests 94 8Total equity (21) 19,598 16,048
Total equity and liabilities 38,507 27,091
TheaccompanyingNotesareanintegralpartoftheseConsolidatedFinancialStatements.
163Consolidated Statements of Financial Position

Consolidated Statements of Changes in Equity of SAP Group as at December 31,€millions
EquityAttributabletoOwnersofParent EquityAttributabletoOwnersofParent Non-ControllingInterests TotalEquity
IssuedCapital SharePremium RetainedEarnings
OtherComponentsofEquity OtherComponentsofEquity TreasuryShares Total
ExchangeDifferences Available-for-SaleFinancialAssets
CashFlowHedges
Notereference (21) (21) (21) StatementofComprehensiveIncome StatementofComprehensiveIncome (21) (4)
January 1, 2012 1,228 419 12,448 –19 9 –27 –1,377 12,681 8 12,689Profitaftertax 2,803 2,803 2,803Othercomprehensiveincome –8 –217 13 47 –165 –165
Comprehensive income 2,795 –217 13 47 2,638 2,638Share-basedpayments 41 41 41Dividends –1,310 –1,310 –1,310
Issuanceofsharesundershare-basedpayments
1 14 15 15
Purchaseoftreasuryshares –53 –53 –53
Reissuanceoftreasurysharesundershare-basedpayments
18 93 111 111
Otherchanges 2 2 2December 31, 2012 1,229 492 13,934 –236 22 20 –1,337 14,125 8 14,133
Profitaftertax 3,326 3,326 –1 3,325Othercomprehensiveincome 13 –584 60 0 –511 –511
Comprehensive income 3,339 –584 60 0 2,815 –1 2,814Share-basedpayments 30 30 30Dividends –1,013 –1,013 –1,013
Reissuanceoftreasurysharesundershare-basedpayments
29 57 86 86
December 31, 2013 1,229 551 16,258 –820 82 20 –1,280 16,040 8 16,048Profitaftertax 3,280 3,280 0 3,280Othercomprehensiveincome –23 1,186 128 –28 1,263 1,263
Comprehensive income 3,257 1,186 128 –28 4,543 0 4,543Share-basedpayments 34 34 34Dividends –1,194 –1,194 –1,194
Reissuanceoftreasurysharesundershare-basedpayments
29 56 85 85
Additionsfrombusinesscombinations 0 86 86Otherchanges –4 –4 0 –4December 31, 2014 1,229 614 18,317 366 210 –8 –1,224 19,504 94 19,598TheaccompanyingNotesareanintegralpartoftheseConsolidatedFinancialStatements.
164 Consolidated Financial Statements IFRS

Consolidated Statements of Changes in Equity of SAP Group as at December 31,€millions
EquityAttributabletoOwnersofParent EquityAttributabletoOwnersofParent Non-ControllingInterests TotalEquity
IssuedCapital SharePremium RetainedEarnings
OtherComponentsofEquity OtherComponentsofEquity TreasuryShares Total
ExchangeDifferences Available-for-SaleFinancialAssets
CashFlowHedges
Notereference (21) (21) (21) StatementofComprehensiveIncome StatementofComprehensiveIncome (21) (4)
January 1, 2012 1,228 419 12,448 –19 9 –27 –1,377 12,681 8 12,689Profitaftertax 2,803 2,803 2,803Othercomprehensiveincome –8 –217 13 47 –165 –165
Comprehensive income 2,795 –217 13 47 2,638 2,638Share-basedpayments 41 41 41Dividends –1,310 –1,310 –1,310
Issuanceofsharesundershare-basedpayments
1 14 15 15
Purchaseoftreasuryshares –53 –53 –53
Reissuanceoftreasurysharesundershare-basedpayments
18 93 111 111
Otherchanges 2 2 2December 31, 2012 1,229 492 13,934 –236 22 20 –1,337 14,125 8 14,133
Profitaftertax 3,326 3,326 –1 3,325Othercomprehensiveincome 13 –584 60 0 –511 –511
Comprehensive income 3,339 –584 60 0 2,815 –1 2,814Share-basedpayments 30 30 30Dividends –1,013 –1,013 –1,013
Reissuanceoftreasurysharesundershare-basedpayments
29 57 86 86
December 31, 2013 1,229 551 16,258 –820 82 20 –1,280 16,040 8 16,048Profitaftertax 3,280 3,280 0 3,280Othercomprehensiveincome –23 1,186 128 –28 1,263 1,263
Comprehensive income 3,257 1,186 128 –28 4,543 0 4,543Share-basedpayments 34 34 34Dividends –1,194 –1,194 –1,194
Reissuanceoftreasurysharesundershare-basedpayments
29 56 85 85
Additionsfrombusinesscombinations 0 86 86Otherchanges –4 –4 0 –4December 31, 2014 1,229 614 18,317 366 210 –8 –1,224 19,504 94 19,598TheaccompanyingNotesareanintegralpartoftheseConsolidatedFinancialStatements.
165Consolidated Statements of Changes in Equity
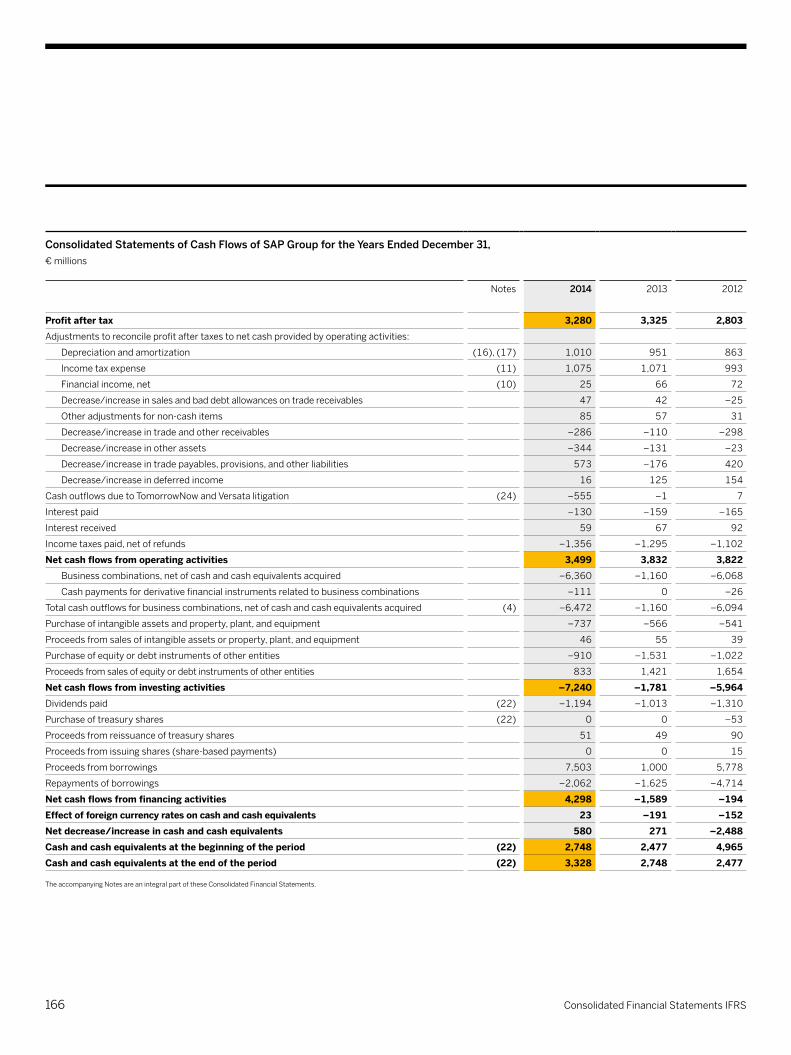
Consolidated Statements of Cash Flows of SAP Group for the Years Ended December 31, €millions
Notes 2014 2013 2012
Profit after tax 3,280 3,325 2,803Adjustmentstoreconcileprofitaftertaxestonetcashprovidedbyoperatingactivities:
Depreciationandamortization (16),(17) 1,010 951 863
Incometaxexpense (11) 1,075 1,071 993
Financialincome,net (10) 25 66 72
Decrease/increaseinsalesandbaddebtallowancesontradereceivables 47 42 –25
Otheradjustmentsfornon-cashitems 85 57 31
Decrease/increaseintradeandotherreceivables –286 –110 –298
Decrease/increaseinotherassets –344 –131 –23
Decrease/increaseintradepayables,provisions,andotherliabilities 573 –176 420
Decrease/increaseindeferredincome 16 125 154
CashoutflowsduetoTomorrowNowandVersatalitigation (24) –555 –1 7
Interestpaid –130 –159 –165
Interestreceived 59 67 92
Incometaxespaid,netofrefunds –1,356 –1,295 –1,102
Net cash flows from operating activities 3,499 3,832 3,822Businesscombinations,netofcashandcashequivalentsacquired –6,360 –1,160 –6,068
Cashpaymentsforderivativefinancialinstrumentsrelatedtobusinesscombinations –111 0 –26
Totalcashoutflowsforbusinesscombinations,netofcashandcashequivalentsacquired (4) –6,472 –1,160 –6,094
Purchaseofintangibleassetsandproperty,plant,andequipment –737 –566 –541
Proceedsfromsalesofintangibleassetsorproperty,plant,andequipment 46 55 39
Purchaseofequityordebtinstrumentsofotherentities –910 –1,531 –1,022
Proceedsfromsalesofequityordebtinstrumentsofotherentities 833 1,421 1,654
Net cash flows from investing activities –7,240 –1,781 –5,964Dividendspaid (22) –1,194 –1,013 –1,310
Purchaseoftreasuryshares (22) 0 0 –53
Proceedsfromreissuanceoftreasuryshares 51 49 90
Proceedsfromissuingshares(share-basedpayments) 0 0 15
Proceedsfromborrowings 7,503 1,000 5,778
Repaymentsofborrowings –2,062 –1,625 –4,714
Net cash flows from financing activities 4,298 –1,589 –194Effect of foreign currency rates on cash and cash equivalents 23 –191 –152Net decrease/increase in cash and cash equivalents 580 271 –2,488Cash and cash equivalents at the beginning of the period (22) 2,748 2,477 4,965Cash and cash equivalents at the end of the period (22) 3,328 2,748 2,477
TheaccompanyingNotesareanintegralpartoftheseConsolidatedFinancialStatements.
166 Consolidated Financial Statements IFRS

(1) GENERAL INFORMATION ABOUT CONSOLIDATED FINANCIAL STATEMENTSTheaccompanyingConsolidatedFinancialStatementsofSAPSEanditssubsidiaries(collectively,“we,”“us,”“our,”“SAP,”“Group,”and“Company”)havebeenpreparedinaccordancewithInternationalFinancialReportingStandards(IFRS).
WehaveappliedallstandardsandinterpretationsthatwereeffectiveonandendorsedbytheEuropeanUnion(EU)asatDecember31,2014.TherewerenostandardsorinterpretationsimpactingourConsolidatedFinancialStatementsfortheyearsendedDecember31,2014,2013,and2012,thatwereeffectivebutnotyetendorsed.ThereforeourConsolidatedFinancialStatementscomplywithbothIFRSasissuedbytheInternationalAccountingStandardsBoard(IASB)andwithIFRSasendorsedbytheEU.
WitheffectfromJuly7,2014,SAPAGwasconvertedtoaEuropeanCompany(SocietasEuropaea,SE),andsincethisdate,thatcompany’slegalnameisSAPSE.
OurExecutiveBoardapprovedtheConsolidatedFinancialStatementsonFebruary19,2015,forsubmissiontoourSupervisoryBoard.
AllamountsincludedintheConsolidatedFinancialStatementsarereportedinmillionsofeuros(€millions)exceptwhereotherwisestated.Duetorounding,numberspresentedthroughoutthisdocumentmaynotadduppreciselytothetotalsweprovideandpercentagesmaynotpreciselyreflecttheabsolutefigures.
(2) SCOPE OF CONSOLIDATIONThefollowingtablesummarizesthechangesinthenumberofentitiesincludedintheConsolidatedFinancialStatements.
Entities Consolidated in the Financial Statements
German Foreign Total
December 31, 2012 22 245 267Additions 1 24 25
Disposals –1 –19 –20
December 31, 2013 22 250 272Additions 2 56 58
Disposals –2 –41 –43
December 31, 2014 22 265 287
Theadditionsrelatetolegalentitiesaddedinconnectionwithacquisitionsandfoundations.Thedisposalsareduetomergersandliquidationsoflegalentities.
Notes to the Consolidated Financial Statements
167Notes to the Consolidated Financial Statements

Additionally,wehavechangedtheclassificationoftheexpensesresultingfromtheVersatalitigationinourconsolidatedincomestatementsfromcostofsoftwareandsoftware-relatedservicestotheTomorrowNowlitigationlineitemandrenamedthislineitemtoTomorrowNowandVersatalitigation.Prior-yearamountshavebeenadjustedaccordingly(2013:€31million,2012:–€2million).Webelievethatthisreclassificationhelpsthecomparabilityofourongoingoperatingperformanceacrossperiods.Formoreinformationaboutthislitigation,seeNote(24).
Wehavereclassifiedourprovisionsforshare-basedpaymentsfromotherprovisionstoothernon-financialliabilities.Prioryearamounts(December31,2013:€445million)havebeenreclassifiedaccordingly.Webelievethataclassificationasothernon-financialliabilitiesreflectsthesubstanceofthisparticularliabilitymoreappropriatelythanaclassificationunderotherprovisions.
Startingfrom2014,wepresentcashpaymentsforderivativefinancialinstrumentsrelatedtobusinesscombinationsseparatelyinourconsolidatedstatementofcashflows.Prioryearamounts(2013:€0million;2012:€26million)havebeenreclassifiedaccordingly.Thisreclassificationimprovesthetransparencyofthecashflowsforbusinesscombinations.
Business Combinations and GoodwillWedecideonatransaction-by-transactionbasiswhethertomeasurethenon-controllinginterestintheacquireeatfairvalueorattheproportionateshareoftheacquiree’sidentifiablenetassets.Acquisition-relatedcostsareaccountedasexpenseintheperiodsinwhichthecostsareincurredandtheservicesarereceived,withtheexpensebeingclassifiedasgeneralandadministrationexpense.
(3) SUMMARY OF SIGNIFICANT ACCOUNTING POLICIES(3a) Bases of MeasurementTheConsolidatedFinancialStatementshavebeenpreparedonthehistoricalcostbasisexceptforthefollowing:–Derivativefinancialinstruments,available-for-salefinancialassets,andliabilitiesforcash-settledshare-basedpaymentsaremeasuredatfairvalue.
–Monetaryassetsandliabilitiesdenominatedinforeigncurrenciesaretranslatedatperiod-endexchangerates.
–Post-employmentbenefitsaremeasuredaccordingtoIAS19(EmployeeBenefits)asdescribedinNote(19a).
Whereapplicable,informationaboutthemethodsandassumptionsusedindeterminingtherespectivemeasurementbasesisdisclosedintheNotesspecifictothatassetorliability.
(3b) Relevant Accounting PoliciesReclassificationsWehavemodifiedtherevenuesectionofourconsolidatedincomestatementtoemphasizethecombinationofourcloudbusinessandourcoreon-premisebusiness.Withthismodification,onlytheorderandsubtotalswerechanged;thecontentoflineitemsremainedunchanged.Softwareandsoftware-relatedservicerevenuenowstartswiththelineitemcloudsubscriptionsandsupportandisfollowedbylineitemssoftwareandsupportofouron-premiseactivities.Thesoftwareandcloudsubscriptionssubtotalwasdeletedandanewsumforsoftwareandsupportwasadded.Comparativeamountsforpriorperiodspresentedhavebeenreclassifiedaccordinglytoconformtothecurrentpresentation.
168 Consolidated Financial Statements IFRS
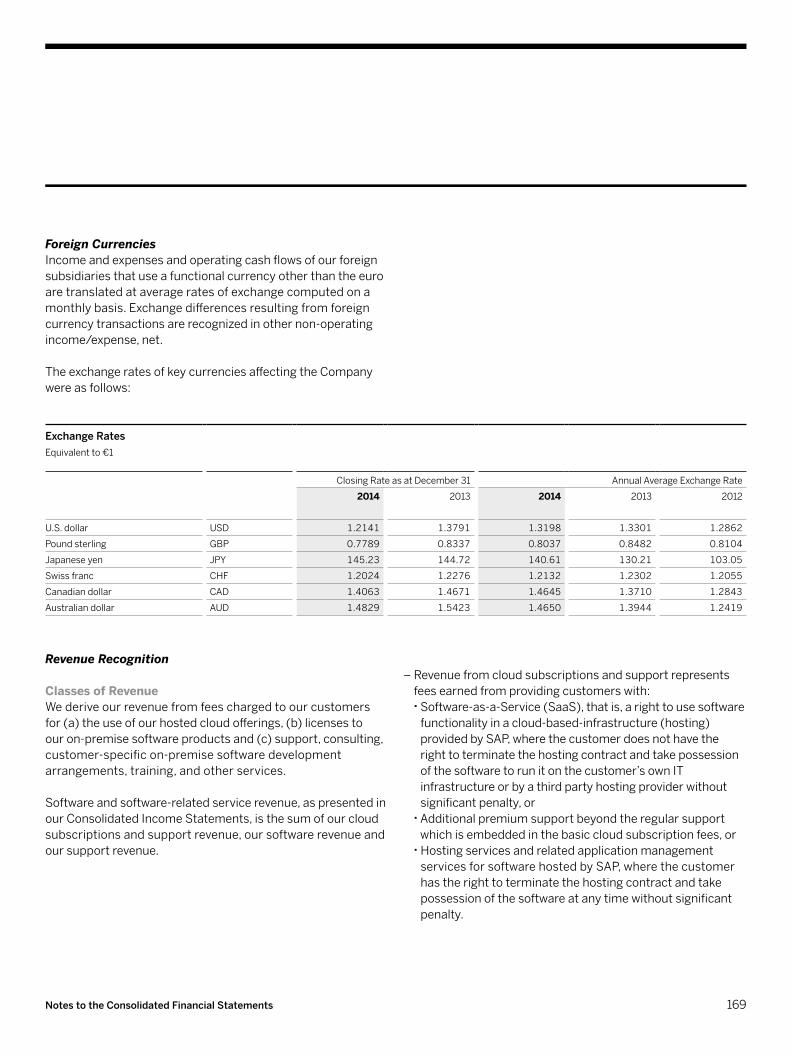
Foreign CurrenciesIncomeandexpensesandoperatingcashflowsofourforeignsubsidiariesthatuseafunctionalcurrencyotherthantheeuroaretranslatedataverageratesofexchangecomputedonamonthlybasis.Exchangedifferencesresultingfromforeigncurrencytransactionsarerecognizedinothernon-operatingincome/expense,net.
TheexchangeratesofkeycurrenciesaffectingtheCompanywereasfollows:
Exchange RatesEquivalentto€1
ClosingRateasatDecember31 AnnualAverageExchangeRate
2014 2013 2014 2013 2012
U.S.dollar USD 1.2141 1.3791 1.3198 1.3301 1.2862
Poundsterling GBP 0.7789 0.8337 0.8037 0.8482 0.8104
Japaneseyen JPY 145.23 144.72 140.61 130.21 103.05
Swissfranc CHF 1.2024 1.2276 1.2132 1.2302 1.2055
Canadiandollar CAD 1.4063 1.4671 1.4645 1.3710 1.2843
Australiandollar AUD 1.4829 1.5423 1.4650 1.3944 1.2419
Revenue Recognition
Classes of RevenueWederiveourrevenuefromfeeschargedtoourcustomersfor(a)theuseofourhostedcloudofferings,(b)licensestoouron-premisesoftwareproductsand(c)support,consulting,customer-specificon-premisesoftwaredevelopmentarrangements,training,andotherservices.
Softwareandsoftware-relatedservicerevenue,aspresentedinourConsolidatedIncomeStatements,isthesumofourcloudsubscriptionsandsupportrevenue,oursoftwarerevenueandoursupportrevenue.
–Revenuefromcloudsubscriptionsandsupportrepresentsfeesearnedfromprovidingcustomerswith:Software-as-a-Service(SaaS),thatis,arighttousesoftwarefunctionalityinacloud-based-infrastructure(hosting)providedbySAP,wherethecustomerdoesnothavetherighttoterminatethehostingcontractandtakepossessionofthesoftwaretorunitonthecustomer’sownITinfrastructureorbyathirdpartyhostingproviderwithoutsignificantpenalty,orAdditionalpremiumsupportbeyondtheregularsupportwhichisembeddedinthebasiccloudsubscriptionfees,orHostingservicesandrelatedapplicationmanagementservicesforsoftwarehostedbySAP,wherethecustomerhastherighttoterminatethehostingcontractandtakepossessionofthesoftwareatanytimewithoutsignificantpenalty.
169Notes to the Consolidated Financial Statements
Timing of Revenue RecognitionWedonotstartrecognizingrevenuefromcustomerarrangementsbeforeevidenceofanarrangementexistsandtheamountofrevenueandassociatedcostscanbemeasuredreliably,andcollectionoftherelatedreceivableisprobable.If,foranyofourproductorserviceofferings,wedetermineattheoutsetofanarrangementthattheamountofrevenuecannotbemeasuredreliably,weconcludethattheinflowofeconomicbenefitsassociatedwiththetransactionisnotprobable,andwedeferrevenuerecognitionuntilthearrangementfeebecomesdueandpayablebythecustomer.If,attheoutsetofanarrangement,wedeterminethatcollectabilityisnotprobable,weconcludethattheinflowofeconomicbenefitsassociatedwiththetransactionisnotprobable,andwedeferrevenuerecognitionuntiltheearlierofwhencollectabilitybecomesprobableorpaymentisreceived.Ifacustomerisspecificallyidentifiedasabaddebtor,westoprecognizingrevenuefromthecustomerexcepttotheextentofthefeesthathavealreadybeencollected.
Cloudsubscriptionandsupportrevenueisrecognizedastheservicesareperformed.Whereaperiodicalfixedfeeisagreedfortherighttocontinuouslyaccessanduseacloudofferingforacertainterm,thefeeisrecognizedratablyoverthetermcoveredbythefixedfee.Feesthatarebasedonactualtransactionvolumesarerecognizedasthetransactionsoccur.
Revenuefromthesaleofperpetuallicensesofourstandardon-premisesoftwareproductsisrecognizedupondeliveryofthesoftware,thatis,whenthecustomerhasaccesstothesoftware.Occasionally,welicenseon-premisesoftwareforaspecifiedperiodoftime.Revenuefromshort-termtime-basedlicenses,whichusuallyincludesupportservicesduringthelicenseperiod,isrecognizedratablyoverthelicenseterm.Revenuefrommulti-yeartime-basedlicensesthatincludesupportservices,whetherseparatelypricedornot,isrecognizedratablyoverthelicensetermunlessasubstantivesupportservicerenewalrateexists;ifthisisthecase,theamountallocatedtothedeliveredsoftwareisrecognizedassoftwarerevenuebasedontheresidualmethodoncethebasiccriteriadescribedabovehavebeenmet.
–Softwarerevenuerepresentsfeesearnedfromthesaleorlicenseofsoftwaretocustomersforuseonthecustomer’spremises,inotherwords,wherethecustomerhastherighttotakepossessionofthesoftwareforinstallationonthecustomer’spremises(on-premisesoftware).Softwarerevenueincludesrevenuefromboth,thesaleofourstandardsoftwareproductsandcustomer-specificon-premisesoftwaredevelopmentagreements.
–Supportrevenuerepresentsfeesearnedfromprovidingcustomerswithunspecifiedfuturesoftwareupdates,upgrades,andenhancements,andtechnicalproductsupportservicesforon-premisesoftwareproducts.Wedonotsellseparatelytechnicalproductsupportorunspecifiedsoftwareupgrades,updates,andenhancements.Accordingly,wedonotdistinguishwithinsoftwareandsoftware-relatedservicerevenueorwithincostofsoftwareandsoftware-relatedservicestheamountsattributabletotechnicalsupportservicesandunspecifiedsoftwareupgrades,updates,andenhancements.
ProfessionalservicesandotherservicerevenueaspresentedinourConsolidatedIncomeStatementsisthesumofourconsultingrevenueandotherservicerevenue.–Revenuefromconsultingcontractsprimarilyrepresentsfeesearnedfromprovidingcustomerswithconsultingserviceswhichprimarilyrelatetotheinstallationandconfigurationofourcloudsubscriptionsandon-premisesoftwareproducts.
–Revenuefromotherservicesmainlyrepresentsfeesearnedfromprovidingcustomerswithtrainingservices,andmessagingservices(primarilytransmissionofelectronictextmessagesfromonemobilephoneprovidertoanother).
Weaccountforout-of-pocketexpensesinvoicedbySAPandreimbursedbycustomersascloudsubscriptionandsupport,support,consulting,orotherservicerevenue,dependingonthenatureoftheserviceforwhichtheout-of-pocketexpenseswereincurred.
170 Consolidated Financial Statements IFRS

Werecognizesupportrevenuebasedonourperformanceunderthesupportarrangements.Underourmajorsupportservices,ourperformanceobligationistostandreadytoprovidetechnicalproductsupportandtoprovideunspecifiedupdates,upgradesandenhancementsonawhen-and-if-availablebasis.Forthesesupportservices,werecognizerevenueratablyoverthetermofthesupportarrangement.
Werecognizeprofessionalservicesandotherservicerevenueastheservicesarerendered.Usually,ourconsultingcontractsdonotinvolvesignificantproduction,modification,orcustomizationofsoftwareandtherelatedrevenueisrecognizedastheservicesareprovidedusingthepercentage-of-completionmethodofaccounting.Formessagingservices,wemeasuretheprogressofservicerenderingbasedonthenumberofmessagessuccessfullyprocessedanddeliveredexceptforfixed-pricemessagingarrangements,forwhichrevenueisrecognizedratablyoverthecontractualtermofthearrangement.
Measurement of RevenueRevenueisrecognizednetofreturnsandallowances,tradediscounts,andvolumerebates.
Ourcontributionstoresellersthatallowourresellerstoexecutequalifiedandapprovedmarketingactivitiesarerecognizedasanoffsettorevenue,unlessweobtainaseparateidentifiablebenefitforthecontributionandthefairvalueofthatbenefitisreasonablyestimable.
Multiple-Element ArrangementsWecombinetwoormorecustomercontractswiththesamecustomerandaccountforthecontractsasasinglecontractifthecontractsarenegotiatedasapackageorotherwiselinked.Thus,themajorityofourcontractsthatcontaincloudofferingsoron-premisesoftwarealsoincludeothergoodsorservices(multiple-elementarrangements).
Ingeneral,ouron-premisesoftwarelicenseagreementsdonotincludeacceptance-testingprovisions.Ifanarrangementallowsforcustomeracceptance-testingofthesoftware,wedeferrevenueuntiltheearlierofcustomeracceptanceorwhentheacceptancerightlapses.
Weusuallyrecognizerevenuefromon-premisesoftwarearrangementsinvolvingresellersonevidenceofsell-throughbytheresellertotheend-customer,becausetheinflowoftheeconomicbenefitsassociatedwiththearrangementstousisnotprobablebeforesell-throughhasoccurred.
Softwarerevenuefromcustomer-specificon-premisesoftwaredevelopmentagreementsthatqualifyforrevenuerecognitionbyreferencetothestageofcompletionofthecontractactivityisrecognizedusingthepercentage-of-completionmethodbasedoncontractcostsincurredtodateasapercentageoftotalestimatedcontractcostsrequiredtocompletethedevelopmentwork.
On-premisesoftwaresubscriptioncontractscombinesoftwareandsupportserviceelements,asunderthesecontractsthecustomerisprovidedwithcurrentsoftwareproducts,rightstoreceiveunspecifiedfuturesoftwareproducts,andrightstoproductsupportduringtheon-premisesoftwaresubscriptionterm.Typically,customerspayaperiodicfeeforadefinedsubscriptionterm,andwerecognizesuchfeesratablyoverthetermofthearrangementbeginningwiththedeliveryofthefirstproduct.Revenuefromon-premisesoftwaresubscriptioncontractsisallocatedtothesoftwarerevenueandsupportrevenuelineitemsinourConsolidatedIncomeStatements.
On-premisesoftwarerentalcontractsalsocombinesoftwareandsupportserviceelements.Undersuchcontracts,thecustomerisprovidedwithcurrentsoftwareproductsandproductsupport,butnotwiththerighttoreceiveunspecifiedfuturesoftwareproducts.Customerstypicallypayaperiodicfeeovertherentalterm.Werecognizefeesfromsoftwarerentalcontractsratablyoverthetermofthearrangement.RevenuefromrentalcontractsisallocatedtothesoftwarerevenueandsupportrevenuelineitemsinourConsolidatedIncomeStatements.
171Notes to the Consolidated Financial Statements
–Wederivethecompany-specificobjectiveevidenceoffairvalueforourrenewablesupportservicesfromtherateschargedtorenewthesupportservicesannuallyafteraninitialperiod.Suchrenewalratesgenerallyrepresentafixedpercentageofthediscountedsoftwarelicensefeechargedtothecustomer.Themajorityofourcustomersrenewtheirannualsupportservicecontractsattheserates.
–Company-specificobjectiveevidenceoffairvaluecangenerallynotbeestablishedforourcloudsubscriptions.ESPfortheseofferingsisdeterminedbasedontheratesagreedwiththeindividualcustomerstoapplyifandwhenthesubscriptionarrangementrenews.WedetermineESPbyconsideringmultiplefactorswhichinclude,butarenotlimitedto,thefollowing:i)substantiverenewalratescontainedwithinanarrangementforcloudsubscriptiondeliverables;andii)grossmarginobjectivesandinternalcostsforservices.
–Forouron-premisesoftwareofferingscompany-specificobjectiveevidenceoffairvaluecangenerallynotbeestablishedandrepresentativestand-alonesellingpricesarenotdiscerniblefrompasttransactions.Wethereforeapplytheresidualmethodtomultiple-elementarrangementsthatincludeon-premisesoftware.Underthismethod,thetransactionfeeisallocatedtoallundeliveredelementsintheamountoftheirrespectivefairvaluesandtheremainingamountofthearrangementfeeisallocatedtothedeliveredelement.WiththispolicywehaveconsideredtheguidanceprovidedbyFASBASCSubtopic985-605(SoftwareRevenueRecognition),whereapplicable,asauthorizedbyIAS8(AccountingPolicies,ChangesinAccountingEstimatesandErrors).
Weaccountforthedifferentgoodsandservicespromisedunderourcustomercontractsasseparateunitsofaccount(distinctdeliverables)unless:–Thecontractinvolvessignificantproduction,modification,orcustomizationofthecloudsubscriptionoron-premisesoftwareand
–Theservicesarenotavailablefromthird-partyvendorsandarethereforedeemedessentialtothecloudsubscriptionoron-premisesoftware.
Goodsandservicesthatdonotqualifyasdistinctdeliverablesarecombinedintooneunitofaccount(combineddeliverables).
Theportionofthetransactionfeeallocatedtoonedistinctdeliverableisrecognizedinrevenueseparatelyunderthepoliciesapplicabletotherespectivedeliverable.Forcombineddeliverablesconsistingofcloudofferingsoron-premisesoftwareandotherservicestheallocatedportionofthetransactionfeeisrecognizedusingthepercentage-of-completionmethod,asoutlinedabove,oroverthecloudsubscriptionterm,ifapplicable,dependingonwhichservicetermislonger.
Weallocatethetotaltransactionfeeofacustomercontracttothedistinctdeliverablesunderthecontractbasedontheirfairvalues.Theallocationisdonerelativetothedistinctdeliverables’individualfairvaluesunlesstheresidualmethodisappliedasoutlinedbelow.Fairvalueisdeterminedbycompany-specificobjectiveevidenceoffairvaluewhichisthepricechargedconsistentlywhenthatelementissoldseparatelyor,forelementsnotyetsoldseparately,thepriceestablishedbyourmanagementifitisprobablethatthepricewillnotchangebeforetheelementissoldseparately.Wherecompany-specificobjectiveevidenceoffairvalueandthird-partyevidenceofsellingpricecannotbeestablishedduetolackingstand-alonesalesorlackingpricingconsistency,wedeterminethefairvalueofadistinctdeliverablebyestimatingitsstand-alonesellingprice.Company-specificobjectiveevidenceoffairvalueandestimatedstand-alonesellingprices(ESP)forourmajorproductsandservicesisdeterminedasfollows:
172 Consolidated Financial Statements IFRS

Wehavedeterminedthattheconditionsforrecognizinginternallygeneratedintangibleassetsfromoursoftwaredevelopmentactivitiesarenotmetuntilshortlybeforetheproductsareavailableforsale.Developmentcostsincurredaftertherecognitioncriteriaaremethavenotbeenmaterial.Consequently,researchanddevelopmentcostsareexpensedasincurred.
Sales and Marketing Salesandmarketingincludescostsincurredforthesellingandmarketingactivitiesrelatedtooursoftwaresolutions,software-relatedserviceportfolio,andcloudbusiness.
General and AdministrationGeneralandadministrationincludescostsrelatedtofinanceandadministrativefunctions,humanresources,andgeneralmanagementaslongastheyarenotdirectlyattributabletooneoftheotheroperatingexpenselineitems.
Accounting for Uncertainties in Income TaxesWerecognizecurrentanddeferredtaxliabilitiesorassetsforuncertaintiesinincometaxesaccordingtoIAS12basedonourbestestimateofthemostlikelyamountifitisprobablethatwewillhavetopaytheamountto,orrecovertheamountfrom,thetaxauthorities,assumingthatthetaxauthoritieswillexaminetheamountsreportedtothemandhavefullknowledgeofallrelevantinformation.
Share-Based PaymentsShare-basedpaymentscovercash-settledandequity-settledawardsissuedtoouremployees.Therespectiveexpensesarerecognizedasemployeebenefitsexpensesandclassifiedinourconsolidatedincomestatementsaccordingtotheactivitiesthattheemployeesowningtheawardsperform.
Wegrantouremployeesdiscountsoncertainshare-basedpayments.Sincethosediscountsarenotdependentonfutureservicestobeprovidedbyouremployees,thediscountisrecognizedasanexpensewhentherightsaregranted.
WeconsiderFASBASC985-605inouraccountingforoptionsthatentitlethecustomertopurchase,inthefuture,additionalon-premisesoftware.Weallocaterevenuetofutureincrementaldiscountswhenevercustomersaregrantedamaterialright,thatis,therighttolicenseadditionalon-premisesoftwareatahigherdiscountthantheonegivenwithintheinitialsoftwarelicensearrangement,ortopurchaseorrenewservicesatratesbelowthefairvaluesestablishedfortheseservices.Wealsoconsiderwhetherfuturepurchaseoptionsincludedinarrangementsforcloudsubscriptiondeliverablesconstituteamaterialright.Cost of Software and Software-Related ServicesCostofsoftwareandsoftware-relatedservicesincludesthecostincurredinproducingthegoodsandprovidingtheservicesthatgeneratesoftwareandsoftware-relatedservicerevenue.Consequently,thislineitemincludesprimarilyemployeeexpensesrelatingtotheseservices,amortizationofacquiredintangibles,feesforthird-partylicenses,shippingandramp-upcost.
Cost of Professional Services and Other ServicesCostofprofessionalservicesandotherservicesincludesthecostincurredinprovidingtheservicesthatgenerateprofessionalserviceandotherservicerevenueincludingmessagingrevenues.Theitemalsoincludessalesandmarketingexpensesrelatedtoourprofessionalservicesandotherservicesthatresultfromsalesandmarketingeffortsthatcannotbeclearlyseparatedfromprovidingtheservices.
Research and DevelopmentResearchanddevelopmentincludesthecostsincurredbyactivitiesrelatedtothedevelopmentofsoftwaresolutions(newproducts,updates,andenhancements)includingresourceandhardwarecostsforthedevelopmentsystems.
173Notes to the Consolidated Financial Statements

financialassetsthatarenotassignedtoloansandreceivablesorfinancialassetsatfairvaluethroughprofitorloss,impairmentlossesdirectlyreduceanasset’scarryingamount,whileimpairmentsonloansandreceivablesarerecordedusingallowanceaccounts.Suchallowanceaccountsarealwayspresentedtogetherwiththeaccountscontainingtheasset’scostinotherfinancialassets.Accountbalancesarechargedoffagainsttherespectiveallowanceafterallcollectioneffortshavebeenexhaustedandthelikelihoodofrecoveryisconsideredremote.
Income/expensesandgains/lossesonfinancialassetsconsistofimpairmentlossesandreversals,interestincomeandexpenses,dividends,andgainsandlossesfromthedisposalofsuchassets.
Derivatives
Derivatives Not Designated as Hedging InstrumentsManytransactionsconstituteeconomichedges,andthereforecontributeeffectivelytothesecuringoffinancialrisksbutdonotqualifyforhedgeaccountingunderIAS39.Tohedgecurrencyrisksinherentinforeign-currencydenominatedandrecognizedmonetaryassetsandliabilities,wedonotdesignateourheld-for-tradingderivativefinancialinstrumentsasaccountinghedges,becausetheprofitsandlossesfromtheunderlyingtransactionsarerecognizedinprofitorlossinthesameperiodsastheprofitsorlossesfromthederivatives.Inaddition,weoccasionallyhavecontractswhichcontainforeigncurrencyembeddedderivativestobeaccountedforseparately.
Wherewehedgeourexposuretocash-settledawards,changesinthefairvalueoftherespectivehedginginstrumentsarealsorecognizedasemployeebenefitsexpensesinprofitorloss.Thefairvaluesforhedginginstrumentsarebasedonmarketdatareflectingcurrentmarketexpectations.
Formoreinformationaboutourshare-basedpayments,seeNote(28).
Financial AssetsOurfinancialassetscomprisecashandcashequivalents(highlyliquidinvestmentswithoriginalmaturitiesofthreemonthsorless),loansandreceivables,acquiredequityanddebtinvestments,andderivativefinancialinstruments(derivatives)withpositivefairvalues.Theyareclassifiedasloansandreceivables,available-for-salefinancialassets,andfinancialassetsatfairvaluethroughprofitorlossincludingonlythosethatareheldfortrading,aswedonotdesignatefinancialassetsatfairvaluethroughprofitorloss.
Regularwaypurchasesandsalesoffinancialassetsarerecordedatthetradedate.
Allfinancialassetsnotaccountedforatfairvaluethroughprofitorlossareassessedforimpairmentateachreportingdateorifwebecomeawareofobjectiveevidenceofimpairmentasaresultofoneormoreeventsthatindicatethatthecarryingamountoftheassetmaynotberecoverable.Objectiveevidenceincludesbutisnotlimitedtoasignificantorprolongeddeclineofthefairvaluebelowitscarryingamount,ahighprobabilityofinsolvency,oramaterialbreachofcontractbytheissuersuchasasignificantdelayorashortfallinpaymentsdue.Impairmentlossesintheamountofthedifferencebetweenanasset’scarryingamountandthepresentvalueoftheexpectedfuturecashflowsorcurrentfairvalue,respectively,arerecognizedinFinancialincome,net.Foravailable-for-salefinancialassetswhicharenon-derivative
174 Consolidated Financial Statements IFRS

thehedginginstrument,thechangesinthedesignatedcomponentsofthehedginginstrumentwilloffsettheimpactoffluctuationsoftheunderlyinghedgeditems.
Themethodofretrospectivelytestingeffectivenessdependsonthetypeofthehedgeasdescribedfurtherbelow:
a)CashFlowHedgeRetrospectively,effectivenessistestedonacumulativebasisapplyingthedollaroffsetmethodbyusingthehypotheticalderivativemethod.Underthisapproach,thechangeinfairvalueofaconstructedhypotheticalderivativewithtermsreflectingtherelevanttermsofthehedgeditemiscomparedtothechangeinthefairvalueofthehedginginstrumentemployingitsrelevantterms.Thehedgeisdeemedhighlyeffectiveiftheresultsarewithintherange80%to125%.
b)FairValueHedgeRetrospectively,effectivenessistestedusingstatisticalmethodsintheformofaregressionanalysisbywhichthevalidityandextentoftherelationshipbetweenthechangeinvalueofthehedgeditemsastheindependentandthefairvaluechangeofthederivativesasthedependentvariableisdetermined.Thehedgeisdeemedhighlyeffectiveifthedeterminationcoefficientbetweenthehedgeditemsandthehedginginstrumentsexceeds0.8andtheslopecoefficientlieswithinarangeof–0.8to–1.25.
Trade and Other ReceivablesTradereceivablesarerecordedatinvoicedamountslesssalesallowancesandallowancesfordoubtfulaccounts.Werecordtheseallowancesbasedonaspecificreviewofallsignificantoutstandinginvoices.Whenanalyzingtherecoverabilityofourtradereceivables,weconsiderthefollowingfactors:
Derivatives Designated as Hedging Instruments WeusederivativestohedgeforeigncurrencyriskorinterestrateriskanddesignatethemascashfloworfairvaluehedgesiftheyqualifyforhedgeaccountingunderIAS39.Theaccountingforchangesinfairvalueofthehedginginstrumentdependsonthetypeofthehedgeandtheeffectivenessofthehedgingrelationship.Formoreinformationaboutourhedges,seeNote(25).
a)CashFlowHedgeIngeneral,weapplycashflowhedgeaccountingtotheforeigncurrencyriskofhighlyprobableforecastedtransactionsandinterestrateriskonvariableratefinancialliabilities.
Withregardtoforeigncurrencyrisk,hedgeaccountingrelatestothespotpriceandtheintrinsicvaluesofthederivativesdesignatedandqualifyingascashflowhedges,whilegainsandlossesontheinterestelementandonthosetimevaluesexcludedfromthehedgingrelationshipaswellastheineffectiveportionofgainsorlossesarerecognizedinprofitorloss.
b)FairValueHedgeWeapplyfairvaluehedgeaccountingforhedgingcertainofourfixedratefinancialliabilities.
Valuation and Testing of EffectivenessTheeffectivenessofthehedgingrelationshipistestedprospectivelyandretrospectively.Prospectively,weapplythecriticaltermsmatchforourforeigncurrencyhedgesascurrencies,maturities,andtheamountsareidenticalfortheforecastedtransactionsandthespotelementoftheforwardexchangeratecontractorintrinsicvalueofthecurrencyoptions,respectively.Forinterestrateswaps,wealsoapplythecriticaltermsmatchasthenotionalamounts,currencies,maturities,basisofthevariablelegsorfixedlegs,respectively,resetdates,andthedatesoftheinterestandprincipalpaymentsareidenticalforthedebtinstrumentandthecorrespondinginterestrateswaps.Therefore,overthelifeof
175Notes to the Consolidated Financial Statements
Intangible AssetsWeclassifyintangibleassetsaccordingtotheirnatureanduseinouroperation.Softwareanddatabaselicensesconsistprimarilyoftechnologyforinternaluse,whereasacquiredtechnologyconsistsprimarilyofpurchasedsoftwaretobeincorporatedintoourproductofferingsandin-processresearchanddevelopment.Customerrelationshipandotherintangiblesconsistprimarilyofcustomercontractsandacquiredtrademarklicenses.
Allourpurchasedintangibleassetsotherthangoodwillhavefiniteusefullives.Theyareinitiallymeasuredatacquisitioncostandsubsequentlyamortizedeitherbasedonexpectedusageoronastraight-linebasisovertheirestimatedusefullivesrangingfromtwoto20years.
Amortizationforacquiredin-processresearchanddevelopmentprojectassetsstartswhentheprojectsarecompleteandthedevelopedsoftwareistakentothemarket.Wetypicallyamortizetheseintangiblesoverfivetosevenyears.
Amortizationexpensesofintangibleassetsareclassifiedascostofsoftwareandsoftware-relatedservices,costofprofessionalservicesandotherservices,researchanddevelopment,salesandmarketing,andgeneralandadministrationdependingontheiruse.
Property, Plant, and EquipmentProperty,plant,andequipmentarecarriedatacquisitioncostplusthefairvalueofrelatedassetretirementcostsifanyandifreasonablyestimable,andlessaccumulateddepreciation.Interestincurredduringtheconstructionofqualifyingassetsiscapitalizedandamortizedovertherelatedassets’estimatedusefullives.
–First,weconsiderthefinancialsolvencyofspecificcustomersandrecordanallowanceforspecificcustomerbalanceswhenwebelieveitisprobablethatwewillnotcollecttheamountdueaccordingtothecontractualtermsofthearrangement.
–Second,weevaluatehomogenousportfoliosoftradereceivablesaccordingtotheirdefaultriskprimarilybasedontheageofthereceivableandhistoricallossexperience,butalsotakingintoconsiderationgeneralmarketfactorsthatmightimpactourtradereceivableportfolio.Werecordageneralbaddebtallowancetorecordimpairmentlossesforaportfoliooftradereceivableswhenwebelievethattheageofthereceivablesindicatesthatitisprobablethatalosshasoccurredandwewillnotcollectsomeoralloftheamountsdue.
Accountbalancesarewrittenoff,thatis,chargedoffagainsttheallowanceafterallcollectioneffortshavebeenexhaustedandthelikelihoodofrecoveryisconsideredremote.
InourConsolidatedIncomeStatements,expensesfromrecordingbaddebtallowancesforaportfoliooftradereceivablesareclassifiedasotheroperatingincome,net,whereasexpensesfromrecordingbaddebtallowancesforspecificcustomerbalancesareclassifiedascostofsoftwareandsoftware-relatedservicesorcostofprofessionalservicesandotherservices,dependingonthetransactionfromwhichtherespectivetradereceivableresults.Salesallowancesarerecordedasanoffsettotherespectiverevenueitem.
Includedintradereceivablesareunbilledreceivablesrelatedtofixed-feeandtime-and-materialconsultingarrangementsforcontractworkperformedtodate.
Other Non-Financial AssetsOthernon-financialassetsarerecordedatamortizedcost.Wecapitalizesalescommissions(directandincrementalcostsincurredwhenobtainingacontractareconsideredtobecontractcost)relatedtocloudandsubscriptiondealsaspartofourcapitalizedcontractcost.Thoseassetsareamortizedoverthenon-cancelablecontracttermtomatchthemwiththerespectiverevenuestream.
176 Consolidated Financial Statements IFRS

Expensesandgains/lossesonfinancialliabilitiesconsistofinterestexpense,andgainsandlossesfromthedisposalofsuchliabilities.Interestexpenseisrecognizedbasedontheeffectiveinterestmethod.
Post-Employment BenefitsThediscountratesusedinmeasuringourpost-employmentbenefitassetsandliabilitiesarederivedfromratesavailableonhigh-qualitycorporatebondsandgovernmentbondsforwhichthetimingandamountsofpaymentsmatchthetimingandtheamountsofourprojectedpensionpayments.TheassumptionsusedtocalculatepensionliabilitiesandcostsaredisclosedinNote(19a).Netinterestexpenseandotherexpensesrelatedtodefinedbenefitplansarerecognizedinemployeeexpenses.
Sinceourdomesticdefinedbenefitpensionplansprimarilyconsistofanemployee-financedpost-retirementplanthatisfullyfinancedwithqualifyinginsurancepolicies,currentservicecostmaybecomeacreditasaresultofadjustingthedefinedbenefitliability’scarryingamounttothefairvalueofthequalifyingplanassets.Suchadjustmentsarerecordedinservicecost.
Deferred IncomeDeferredincomeisrecognizedascloudsubscriptionandsupportrevenue,softwarerevenue,supportrevenue,consultingrevenue,orotherservicerevenue,dependingonthereasonsforthedeferral,oncethebasicapplicablerevenuerecognitioncriteriahavebeenmet.Thesecriteriaaremet,forexample,whentheservicesareperformedorwhenthediscountsthatrelatetoamaterialrightgrantedinapurchaseoptionareapplied.
Property,plant,andequipmentaredepreciatedovertheirexpectedusefullives,generallyusingthestraight-linemethod.
Useful Lives of Property, Plant, and Equipment
Buildings 25to50years
Leaseholdimprovements Basedontheleasecontract
Informationtechnologyequipment 3to5years
Officefurniture 4to20years
Automobiles 4to5years
Impairment of Goodwill and Non-Current AssetsTherecoverableamountofgoodwillisestimatedeachyearatthesametime.ThegoodwillimpairmenttestisperformedatthelevelofouroperatingsegmentsincetherearenolowerlevelsinSAPatwhichgoodwillismonitoredforinternalmanagementpurposes.
Impairmentlossesarepresentedinotheroperatingincome/expense,netinprofitorloss.
Liabilities
Financial LiabilitiesFinancialliabilitiesincludetradeandotherpayables,bankloans,issuedbonds,privateplacementsandotherfinancialliabilitieswhichcomprisederivativeandnon-derivativefinancialliabilities.Theyareclassifiedasfinancialliabilitiesatamortizedcostandatfairvaluethroughprofitorloss.Thelatterincludeonlythosefinancialliabilitiesthatareheldfortrading,aswedonotdesignatefinancialliabilitiesatfairvaluethroughprofitorloss.
177Notes to the Consolidated Financial Statements
Revenue RecognitionAsdescribedintheRevenueRecognitionsectionofNote(3b),wedonotrecognizerevenuebeforetheamountofrevenuecanbemeasuredreliably,andcollectionoftherelatedreceivableisprobable.Thedeterminationofwhethertheamountofrevenuecanbemeasuredreliablyorwhetherthefeesarecollectibleisinherentlyjudgmentalasitrequiresestimatesastowhetherandtowhatextentsubsequentconcessionsmaybegrantedtocustomersandwhetherthecustomerisexpectedtopaythecontractualfees.Thetimingandamountofrevenuerecognitioncanvarydependingonwhatassessmentshavebeenmade.
Theapplicationofthepercentage-of-completionmethodrequiresustomakeestimatesabouttotalrevenue,totalcosttocompletetheproject,andthestageofcompletion.Theassumptions,estimates,anduncertaintiesinherentindeterminingthestageofcompletionaffectthetimingandamountsofrevenuerecognized.Ifwedonothaveasufficientbasistomeasuretheprogressofcompletionortoestimatethetotalcontractrevenueandcosts,revenuerecognitionislimitedtotheamountofcontractcostsincurred.Thedeterminationofwhetherasufficientbasistomeasuretheprogressofcompletionexistsisjudgmental.Changesinestimatesofprogresstowardscompletionandofcontractrevenueandcontractcostsareaccountedforascumulativecatch-upadjustmentstothereportedrevenuefortheapplicablecontract.
(3c) Management Judgments and Sources of Estimation UncertaintyThepreparationoftheConsolidatedFinancialStatementsinconformitywithIFRSrequiresmanagementtomakejudgments,estimates,andassumptionsthataffecttheapplicationofaccountingpoliciesandthereportedamountsofassets,liabilities,revenues,andexpenses,aswellasdisclosureofcontingentassetsandliabilities.
Webaseourjudgments,estimates,andassumptionsonhistoricalandforecastinformation,aswellasregionalandindustryeconomicconditionsinwhichweorourcustomersoperate,changestowhichcouldadverselyaffectourestimates.Althoughwebelievewehavemadereasonableestimatesabouttheultimateresolutionoftheunderlyinguncertainties,noassurancecanbegiventhatthefinaloutcomeofthesematterswillbeconsistentwithwhatisreflectedinourassets,liabilities,revenues,andexpenses.Actualresultscoulddifferfromoriginalestimates.
Theaccountingpoliciesthatmostfrequentlyrequireustomakejudgments,estimates,andassumptions,andthereforearecriticaltounderstandingourresultsofoperations,includethefollowing:–Revenuerecognition–Valuationoftradereceivables–Accountingforshare-basedpayments–Accountingforincometax–Accountingforbusinesscombinations–Subsequentaccountingforotherintangibles–Determinationofoperatingsegments–Accountingforlegalcontingencies–Recognitionofinternallygeneratedintangibleassetsfromdevelopment
OurmanagementperiodicallydiscussesthesecriticalaccountingpolicieswiththeAuditCommitteeoftheSupervisoryBoard.
178 Consolidated Financial Statements IFRS

Additionally,ourrevenueforon-premisesoftwarecontractswouldbesignificantlydifferentifweappliedarevenueallocationpolicyotherthantheresidualmethod.
Valuation of Trade ReceivablesAsdescribedintheTradeandOtherReceivablessectioninNote(3b),weaccountforimpairmentsoftradereceivablesbyrecordingsalesallowancesandallowancesfordoubtfulaccountsonanindividualreceivablebasisandonaportfoliobasis.Theassessmentofwhetherareceivableiscollectibleisinherentlyjudgmentalandrequirestheuseofassumptionsaboutcustomerdefaultsthatcouldchangesignificantly.Judgmentisrequiredwhenweevaluateavailableinformationaboutaparticularcustomer’sfinancialsituationtodeterminewhetheritisprobablethatacreditlosswilloccurandtheamountofsuchlossisreasonablyestimableandthusanallowanceforthatspecificaccountisnecessary.Basingthegeneralallowancefortheremainingreceivablesonourhistoricallossexperience,too,ishighlyjudgmental,ashistorymaynotbeindicativeoffuturedevelopment.Changesinourestimatesabouttheallowancefordoubtfulaccountscouldmateriallyimpactthereportedassetsandexpensesinourfinancialstatements,andourprofitcouldbeadverselyaffectedifactualcreditlossesexceedourestimates.
Intheaccountingforourmultiple-elementarrangementswehavetodeterminethefollowing:–Whichcontractswiththesamecustomeraretobeaccountedforasonesinglecontract
–Whichdeliverablesunderonecontractaredistinctandthustobeaccountedforseparately
–Howtoallocatethetotalarrangementfeetothedistinctdeliverablesofonecontract
Thedeterminationofwhetherdifferentcontractswiththesamecustomeraretobeaccountedforasonecontractishighlyjudgmental,asitrequiresustoevaluatewhetherthecontractsarenegotiatedtogetherorlinkedinanyotherway.Thetimingandamountofrevenuerecognitioncanvarydependingonwhethertwocontractsareaccountedforseparatelyorasonesinglecontract.
Underamultiple-elementarrangementincludingacloudsubscription,oron-premisesoftware,andotherdeliverables,wedonotaccountforthecloudsubscription,oron-premisesoftware,andtheotherdeliverablesseparatelyifoneoftheotherdeliverables(suchasconsultingservices)isdeemedtobeessentialtothefunctionalityofthecloudsubscription,oron-premisesoftware.Thedeterminationwhetheranundeliveredelementisessentialtothefunctionalityofthedeliveredelementrequirestheuseofjudgment.Thetimingandamountofrevenuerecognitioncanvarydependingonhowthatjudgmentisexercised,becauserevenuemayberecognizedoveralongerserviceterm.
Intheareaofallocatingthetransactionfeetothedifferentdeliverablesundertherespectivecustomercontractjudgmentisrequiredinthedeterminationofanappropriatefairvaluemeasurementwhichmayimpactthetimingandamountofrevenuerecognizeddependingonthefollowing:–Whetheranappropriatemeasurementoffairvaluecanbedemonstratedforundeliveredelements.
–Theapproachesusedtoestablishfairvalue.
179Notes to the Consolidated Financial Statements

interpretationthereof.Suchjudgmentcanhaveamaterialeffectonourincometaxexpense,incometaxprovision,andprofitaftertax.
Thecarryingamountofadeferredtaxassetisreviewedattheendofeachreportingperiodandisreducedtotheextentthatitisnolongerprobablethatsufficienttaxableprofitwillbeavailabletoallowthebenefitofpartorallofthedeferredtaxassetstobeutilized.Thisassessmentrequiresmanagementjudgment,estimates,andassumptions.Inevaluatingourabilitytoutilizeourdeferredtaxassets,weconsiderallavailablepositiveandnegativeevidence,includingthelevelofhistoricaltaxableincomeandprojectionsforfuturetaxableincomeovertheperiodsinwhichthedeferredtaxassetsarerecoverable.Ourjudgmentregardingfuturetaxableincomeisbasedonexpectationsofmarketconditionsandotherfactsandcircumstances.Anyadversechangetotheunderlyingfactsorourestimatesandassumptionscouldrequireustoreducethecarryingamountofournetdeferredtaxassets.
Formoreinformationaboutourincometax,seeNote(11).
Accounting for Business CombinationsInouraccountingforbusinesscombinations,judgmentisrequiredindeterminingwhetheranintangibleassetisidentifiable,andshouldberecordedseparatelyfromgoodwill.Additionally,estimatingtheacquisitiondatefairvaluesoftheidentifiableassetsacquiredandliabilitiesassumedinvolvesconsiderablemanagementjudgment.Thenecessarymeasurementsarebasedoninformationavailableattheacquisitiondateandarebasedonexpectationsandassumptionsthathavebeendeemedreasonablebymanagement.Thesejudgments,estimates,andassumptionscanmateriallyaffectourfinancialpositionandprofitforseveralreasons,amongwhicharethefollowing:
Accounting for Share-Based PaymentsWeusecertainassumptionsinestimatingthefairvaluesforourshare-basedpayments,includingexpectedfuturesharepricevolatilityandexpectedoptionlife(whichrepresentsourestimateoftheaverageamountoftimeremaininguntiltheoptionsareexercisedorexpireunexercised).Inaddition,thefinalpayoutfortheseplansalsodependsonoursharepriceattherespectiveexercisedates.Alltheseassumptionsmaysignificantlyimpactthefairvaluedeterminationandthustheamountandtimingofourshare-basedpaymentexpense.
Forthepurposeofdeterminingtheestimatedfairvalueofourstockoptions,webelieveexpectedvolatilityisthemostsensitiveassumption.Regardingfuturepayoutundertheplans,thepriceofSAP’sshareswillbethemostrelevantfactor.ThefairvaluesoftheRestrictedShareUnits(RSUs)grantedunderourEmployeeParticipationPlan(EPP)andLong-TermIncentivePlan(LTI)2015dependonSAP’ssharepricedirectlyaftertheannouncementofthepreliminaryfourthquarterandfull-yearresultsforthelastfinancialyearoftherespectiveperformanceperiodundertheEPP(three-yearholdingperiodundertheLTI2015),andthusmaybesignificantlyaboveorbelowthebudgetedamounts.Changesinthesefactorscouldsignificantlyaffecttheestimatedfairvaluesascalculatedbytheoption-pricingmodel,andthefuturepayout.Formoreinformationabouttheseplans,seeNote(28).
Accounting for Income TaxWeconductoperationsandearnincomeinnumerousforeigncountriesandaresubjecttochangingtaxlawsinmultiplejurisdictionswithinthecountriesinwhichweoperate.Ourordinarybusinessactivitiesalsoincludetransactionswheretheultimatetaxoutcomeisuncertain,suchasthoseinvolvingrevenuesharingandcostreimbursementarrangementsbetweenSAPGroupentities.Inaddition,theamountofincometaxwepayisgenerallysubjecttoongoingauditsbydomesticandforeigntaxauthorities.Asaresult,judgmentisnecessaryindeterminingourworldwideincometaxprovisions.Wehavemadereasonableestimatesabouttheultimateresolutionofourtaxuncertaintiesbasedoncurrenttaxlawsandour
180 Consolidated Financial Statements IFRS

Inmakingimpairmentassessmentsforourintangibleassets,theoutcomeofthesetestsishighlydependentonmanagement’slatestestimatesandassumptionsregardingfuturecashflowprojectionsandeconomicrisks,whicharecomplexandrequiresignificantjudgmentandassumptionsaboutfuturedevelopments.Theycanbeaffectedbyavarietyoffactors,includingchangesinourbusinessstrategy,ourinternalforecasts,andanestimateofourweightedaveragecostofcapital.Duetothesefactors,actualcashflowsandvaluescouldvarysignificantlyfromtheforecastedfuturecashflowsandrelatedvaluesderivedusingthediscountedcashflowmethod.Althoughwebelievetheassumptionsandestimateswehavemadeinthepasthavebeenreasonableandappropriate,differentassumptionsandestimatescouldmateriallyaffectourfinancialpositionandprofit.
Determination of Operating SegmentsSignificantjudgmentwasinvolvedinthedeterminationthatSAP’sstructure,afterthereorganizationin2014,doesnotincludeunitsthatmeetthedefinitionofanoperatingsegmentandthatconsequentlySAPonlyhasasingleoperatingsegment.
Accounting for Legal ContingenciesAsdescribedinNote(24),wearecurrentlyinvolvedinvariousclaimsandlegalproceedings.Wereviewthestatusofeachsignificantmatternotlessfrequentlythaneachquarterandassessourpotentialfinancialandbusinessexposuresrelatedtosuchmatters.Significantjudgmentisrequiredinthedeterminationofwhetheraprovisionistoberecordedandwhattheappropriateamountforsuchprovisionshouldbe.Notably,judgmentisrequiredinthefollowing:–Determiningwhetheranobligationexists–Determiningtheprobabilityofoutflowofeconomicbenefits–Determiningwhethertheamountofanobligationisreliablyestimable
–Estimatingtheamountoftheexpenditurerequiredtosettlethepresentobligation
–Fairvaluesassignedtoassetssubjecttodepreciationandamortizationaffecttheamountsofdepreciationandamortizationtoberecordedinoperatingprofitintheperiodsfollowingtheacquisition.
–Subsequentnegativechangesintheestimatedfairvaluesofassetsmayresultinadditionalexpensefromimpairmentcharges.
–Subsequentchangesintheestimatedfairvaluesofliabilitiesandprovisionsmayresultinadditionalexpense(ifincreasingtheestimatedfairvalue)oradditionalincome(ifdecreasingtheestimatedfairvalue).
Subsequent Accounting for Other IntangiblesAsdescribedintheIntangibleAssetssectioninNote(3b),allourintangibleassetsotherthangoodwillhavefiniteusefullives.Consequently,thedepreciableamountoftheintangibleassetsisamortizedonasystematicbasisovertheirusefullives.Judgmentisrequiredindeterminingthefollowing:–Theusefullifeofanintangibleasset,asthisdeterminationisbasedonourestimatesregardingtheperiodoverwhichtheintangibleassetisexpectedtoproduceeconomicbenefitstous.
–Theamortizationmethod,asIFRSrequiresthestraight-linemethodtobeusedunlesswecanreliablydeterminethepatterninwhichtheasset’sfutureeconomicbenefitsareexpectedtobeconsumedbyus.
Boththeamortizationperiodandtheamortizationmethodhaveanimpactontheamortizationexpensethatisrecordedineachperiod.
181Notes to the Consolidated Financial Statements

(3d) New Accounting Standards Adopted in the Current PeriodNonewaccountingstandardsadoptedin2014hadamaterialimpactonourConsolidatedFinancialStatements.
(3e) New Accounting Standards Not Yet AdoptedThestandardsandinterpretations(relevanttotheGroup)thatareissued,butnotyeteffective,uptothedateofissuanceoftheGroup’sfinancialstatementsaredisclosedbelow.TheGroupintendstoadoptthesestandards,ifapplicable,whentheybecomeeffective:–OnMay12,2014,theIASBpublishedamendmentstoIAS16(Property,PlantandEquipment)andIAS38(IntangibleAssets).TheamendmentsbecomemandatoryfortheGroup’s2016ConsolidatedFinancialStatementsandclarifythat–ingeneral–theuseofrevenue-basedmethodstocalculatethedepreciation/amortizationisnotappropriate(thispresumption,however,canberebuttedincertainlimitedcircumstancesforintangibles).WehavenotyetcompletedthedeterminationoftheimpactonourConsolidatedFinancialStatements.
–OnMay28,2014,theIASBissuedIFRS15(RevenuefromContractswithCustomers).Thestandardbecomeseffectiveinfiscalyear2017withearlierapplicationpermitted.WeareintheearlystageofananalysisoftheimpactofthestandardonourConsolidatedFinancialStatements.Thisimpactcouldbematerial,inparticularintheareasofallocatingrevenuetothedifferentperformanceobligationsunderonecontractandthetimingofrevenuerecognition.Thestandardforeseesdifferentalternativeapproachesfortheadoptionofthenewguidance.Wehavenotyettakenadecisionwhichofthesealternativesweintendtoapply.
–OnJuly24,2014,theIASBissuedthefourthandfinalversionofIFRS9(FinancialInstruments),whichwillbeapplicableinfiscalyear2018.Thenewguidanceisexpectedtomainlyimpacttheclassificationandmeasurementoffinancialassetsandwillresultinadditionaldisclosures.WehavenotyetcompletedthedeterminationoftheimpactonourConsolidatedFinancialStatements.
Duetouncertaintiesrelatingtothesematters,provisionsarebasedonthebestinformationavailableatthetime.
Attheendofeachreportingperiod,wereassessthepotentialobligationsrelatedtoourpendingclaimsandlitigationandadjustourrespectiveprovisionstoreflectthecurrentbestestimate.Inaddition,wemonitorandevaluatenewinformationthatwereceiveaftertheendoftherespectivereportingperiodbutbeforetheConsolidatedFinancialStatementsareauthorizedforissuetodeterminewhetherthisprovidesadditionalinformationregardingconditionsthatexistedattheendofthereportingperiod.Suchrevisionstoourestimatesofthepotentialobligationscouldhaveamaterialimpactonourfinancialpositionandprofit.Forfurtherinformationaboutlegalcontingencies,seeNotes(19b)and(24).
Recognition of Internally Generated Intangible Assets from DevelopmentWebelievethatdeterminingwhetherinternallygeneratedintangibleassetsfromdevelopmentaretoberecognizedasintangibleassetsrequiressignificantjudgment,particularlyinthefollowingareas:–Determiningwhetheractivitiesshouldbeconsideredresearchactivitiesordevelopmentactivities.
–Determiningwhethertheconditionsforrecognizinganintangibleassetaremetrequiresassumptionsaboutfuturemarketconditions,customerdemandandotherdevelopments.
–Theterm“technicalfeasibility”isnotdefinedinIFRS,andthereforedeterminingwhetherthecompletionofanassetistechnicallyfeasiblerequiresjudgmentandacompany-specificapproach.
–Determiningthefutureabilitytouseorselltheintangibleassetarisingfromthedevelopmentandthedeterminationoftheprobabilityoffuturebenefitsfromsaleoruse.
–Determiningwhetheracostisdirectlyorindirectlyattributabletoanintangibleassetandwhetheracostisnecessaryforcompletingadevelopment.
182 Consolidated Financial Statements IFRS
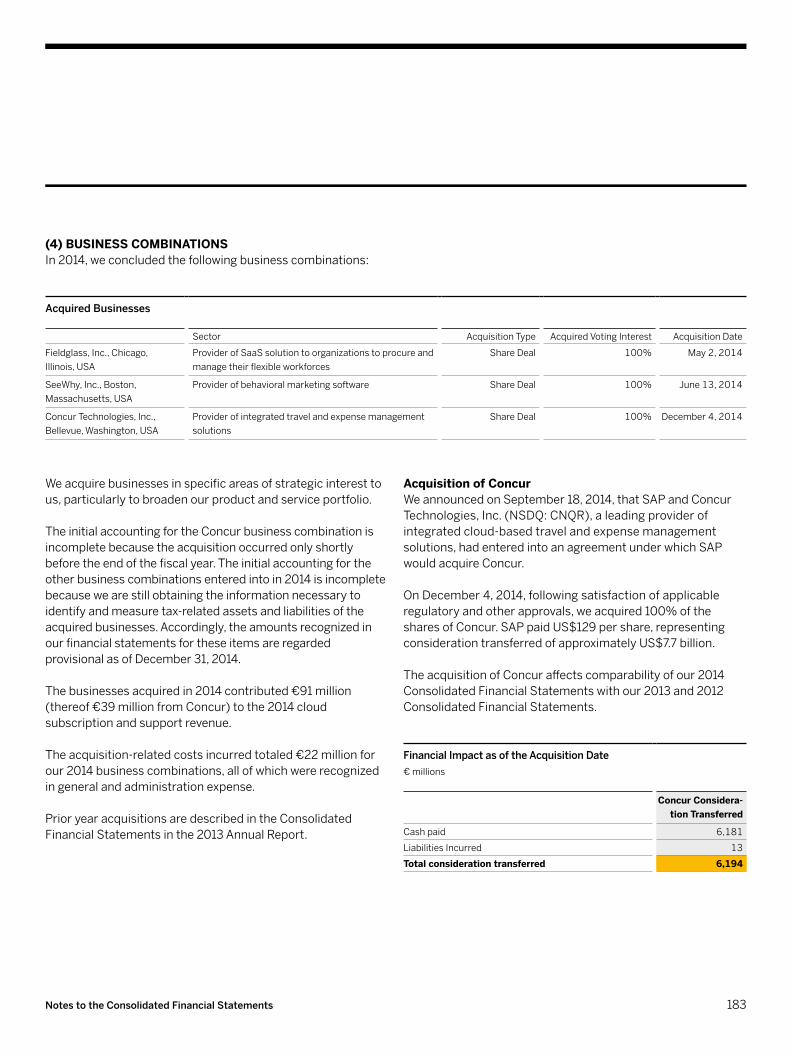
Acquisition of ConcurWeannouncedonSeptember18,2014,thatSAPandConcurTechnologies,Inc.(NSDQ:CNQR),aleadingproviderofintegratedcloud-basedtravelandexpensemanagementsolutions,hadenteredintoanagreementunderwhichSAPwouldacquireConcur.
OnDecember4,2014,followingsatisfactionofapplicableregulatoryandotherapprovals,weacquired100%ofthesharesofConcur.SAPpaidUS$129pershare,representingconsiderationtransferredofapproximatelyUS$7.7billion.
TheacquisitionofConcuraffectscomparabilityofour2014ConsolidatedFinancialStatementswithour2013and2012ConsolidatedFinancialStatements.
Financial Impact as of the Acquisition Date€millions
Concur Considera-tion Transferred
Cashpaid 6,181
LiabilitiesIncurred 13
Total consideration transferred 6,194
(4) BUSINESS COMBINATIONSIn2014,weconcludedthefollowingbusinesscombinations:
Acquired Businesses
Sector AcquisitionType AcquiredVotingInterest AcquisitionDate
Fieldglass,Inc.,Chicago,Illinois,USA
ProviderofSaaSsolutiontoorganizationstoprocureandmanagetheirflexibleworkforces
ShareDeal 100% May2,2014
SeeWhy,Inc.,Boston,Massachusetts,USA
Providerofbehavioralmarketingsoftware ShareDeal 100% June13,2014
ConcurTechnologies,Inc.,Bellevue,Washington,USA
Providerofintegratedtravelandexpensemanagementsolutions
ShareDeal 100% December4,2014
Weacquirebusinessesinspecificareasofstrategicinteresttous,particularlytobroadenourproductandserviceportfolio.
TheinitialaccountingfortheConcurbusinesscombinationisincompletebecausetheacquisitionoccurredonlyshortlybeforetheendofthefiscalyear.Theinitialaccountingfortheotherbusinesscombinationsenteredintoin2014isincompletebecausewearestillobtainingtheinformationnecessarytoidentifyandmeasuretax-relatedassetsandliabilitiesoftheacquiredbusinesses.Accordingly,theamountsrecognizedinourfinancialstatementsfortheseitemsareregardedprovisionalasofDecember31,2014.
Thebusinessesacquiredin2014contributed€91million(thereof€39millionfromConcur)tothe2014cloudsubscriptionandsupportrevenue.
Theacquisition-relatedcostsincurredtotaled€22millionforour2014businesscombinations,allofwhichwererecognizedingeneralandadministrationexpense.
PrioryearacquisitionsaredescribedintheConsolidatedFinancialStatementsinthe2013AnnualReport.
183Notes to the Consolidated Financial Statements

Ingeneral,thegoodwillarisingfromtheacquisitionsconsistslargelyofthesynergiesandtheknow-howandtechnicalskillsoftheacquiredbusinesses’workforces.
BycombiningConcur’ssolutionswithSAPproductsweexpecttoenableourcustomerstodriveoperatingefficiencies,collaboration,andreal-timedatasharingacrossallmajorspendcategories.Concurgoodwillisattributedtoexpectedsynergiesfromtheacquisition,particularlyinthefollowingareas:–Cross-sellingopportunitiestoexistingSAPcustomersacrossallregionsusingSAP’ssalesorganization
–CombiningConcurproductsandSAPproductstodeliveraworld-classemployeeexperience
–ImprovedprofitabilityinConcursalesandoperations
Valuation of Trade Receivables Acquired€millions
Concur Trade Receivables
Grosscarryingamount 129
Allowancefordoubtfulaccounts 5
Fair value of receivables 124
ThefollowingtablesummarizesthevaluesofidentifiableassetsacquiredandliabilitiesassumedinconnectionwiththeacquisitionofConcur,asoftheacquisitiondate.
Recognized Amounts of Identifiable Assets Acquired and Liabilities Assumed€millions
Concur Contribution
Cashandcashequivalents 552
Otherfinancialassets 107
Tradeandotherreceivables 124
Othernon-financialassets 86
Property,plant,andequipment 37
Intangibleassets 1,702
Thereofacquiredtechnology 442
Thereofcustomerrelationshipandotherintangibles 1,247
Customerrelationship 1,201
Otherintangibleassets 46
Thereofsoftwareanddatabaselicenses 13
Total identifiable assets 2,608Tradepayables 64
Financialliabilities 1,133
Currentanddeferredtaxliabilities 441
Provisionsandothernon-financialliabilities 40
Deferredincome 58
Total identifiable liabilities 1,736Total identifiable net assets 872Acquired non-controlling interests at fair value 86Goodwill 5,408Total consideration transferred 6,194
184 Consolidated Financial Statements IFRS

(5) REVENUE
Fordetailedinformationaboutourrevenuerecognitionpolicies,seeNote(3).
Professionalservicesandotherservicerevenuecomprisesthefollowing:
Professional Services and Other Service Revenue€millions
2014 2013 2012
Consulting 2,095 2,242 2,442
Otherservices 611 623 616
Professional services and other service
2,706 2,865 3,058
Theitemincludesprofessionalservicesandotherservicerevenuerelatedtoourcloudofferingsof€222millionin2014(2013:€170million,2012:€92million).
Forrevenueinformationbygeographicregion,seeNote(29).
Revenuefromconstruction-typecontracts(contractrevenue)ismainlyincludedinsoftwarerevenueandconsultingrevenuedependingonthetypeofproject.In2014,contractrevenueof€285millionwasrecognizedforallourconstructionprojects
Impact of the Business Combination on Our Financial StatementsTheamountsofrevenueandprofitorlossoftheConcurbusinessacquiredin2014sincetheacquisitiondateincludedintheconsolidatedincomestatementsforthereportingperiodareasfollows:
Impact on SAP’s Financials€millions
2014 as Reported
ContributionofConcur
Revenue 17,560 45
Profitaftertax 3,280 –9
HadConcurbeenconsolidatedasofJanuary1,2014,ourestimatedproformarevenueforthereportingperiodwouldhavebeen€18,040million,andproformaprofitaftertaxwouldhavebeen€3,146million.
TheseamountswerecalculatedafterapplyingtheCompany’saccountingpoliciesandafteradjustingtheresultsforConcurtoreflectmaterialeffectsfrom,forexample:–Additionaldepreciationandamortizationthatwouldhavebeenchargedassumingthefairvalueadjustmenttoproperty,plant,andequipmentandintangibleassetshadbeenappliedfromJanuary1,2014
–Theimpactoffairvalueadjustmentsondeferredrevenueonafull-yearbasis
–Theborrowingcostsonthefundinglevelsanddebt/equitypositionoftheCompanyafterthebusinesscombination
–Employeebenefits,suchasshare-basedcompensation–Capitalizationofsalescommissions–Transactionexpensesincurredaspartoftheacquisition–Relatedtaxeffects
Theseproformanumbershavebeenpreparedforcomparativepurposesonly.Theproformarevenueandprofitnumbersarenotnecessarilyindicativeeitheroftheresultsofoperationsthatwouldhaveactuallyoccurredhadtheacquisitionbeenineffectatthebeginningoftherespectiveperiodsoroffutureresults.
185Notes to the Consolidated Financial Statements

Forfurtherinformationonourrestructuringplans,seeNote(19b).
Ifnotpresentedseparately,theseexpenseswouldbreakdownasfollows:
Restructuring Expenses by Functional Area€millions
2014 2013 2012
Costofsoftwareandsoftware-relatedservices
9 12 0
Costofprofessionalservicesandotherservices
24 14 7
Researchanddevelopment 24 0 0
Salesandmarketing 41 29 1
Generalandadministration 28 15 0
Restructuring expenses 126 70 8
(8) EMPLOYEE BENEFITS EXPENSE AND HEADCOUNT
Employee Benefits Expense Employeebenefitsexpensecomprisesthefollowing:
Employee Benefits Expense€millions
2014 2013 2012
Salaries 6,319 5,997 5,726
Socialsecurityexpense 916 857 777
Share-basedpaymentexpense 290 327 522
Pensionexpense 211 212 190
Employee-relatedrestructuringexpense
119 57 6
Terminationbenefitsoutsideofrestructuringplans
22 39 65
Employee benefits expense 7,877 7,489 7,286
(2013:€261million,2012:€241million).ThestatusofourconstructionprojectsinprogressattheendofthereportingperiodaccountedforunderIAS11(ConstructionContracts)wasasfollows:
Construction Projects in Progress€millions
2014 2013 2012
Aggregatecostrecognized(multi-year)
201 221 255
Recognizedresult(+profit/–loss;multi-year)
92 87 2
Advancepaymentsreceived 7 26 3
Grossamountsduefromcustomers
0 3 7
Grossamountsduetocustomers 24 38 19
Lossprovisions 6 3 34
(6) COST OF SOFTWARE AND SOFTWARE-RELATED SERVICESTheitemincludescostofcloudsubscriptionsandsupportrevenueof€481millionin2014(2013:€314million,2012:€199million).
(7) RESTRUCTURINGRestructuringexpenseswereasfollows:
Restructuring Expenses€millions
2014 2013 2012
Employee-relatedrestructuringexpenses
119 57 6
Facility-relatedrestructuringexpenses
7 13 2
Restructuring expenses 126 70 8
186 Consolidated Financial Statements IFRS

PensionexpenseincludestheamountsrecordedforourdefinedbenefitanddefinedcontributionplansasdescribedinNote(19a).Expensesforlocalstatepensionplansareincludedinsocialsecurityexpense.
Number of EmployeesOnDecember31,2014,thebreakdownofourfull-timeequivalentemployeenumbersbyfunctioninSAPandbyregionwasasfollows:
Number of EmployeesFull-timeequivalents
December 31, 2014 December31,2013 December31,2012
EMEA 1) Americas AsiaPacificJapan
Total EMEA 1) Americas AsiaPacificJapan
Total EMEA 1) Americas AsiaPacificJapan
Total
Softwareandsoftware-relatedservices
5,953 3,983 5,138 15,074 4,859 2,861 3,541 11,261 4,559 2,628 3,364 10,551
Professionalservicesandotherservices
7,291 4,304 3,044 14,639 7,177 4,406 3,047 14,629 7,020 4,399 2,840 14,259
Researchanddevelopment 9,049 3,974 5,885 18,908 8,806 3,630 5,367 17,804 8,952 3,672 5,388 18,012
Salesandmarketing 7,069 7,288 3,611 17,969 6,346 6,437 3,041 15,824 5,697 6,220 2,982 14,899
Generalandadministration 2,436 1,643 944 5,023 2,424 1,445 697 4,566 2,243 1,383 660 4,286
Infrastructure 1,542 879 373 2,794 1,380 790 318 2,488 1,286 821 308 2,415
SAP Group (December 31) 33,340 22,071 18,995 74,406 30,993 19,568 16,011 66,572 29,757 19,123 15,542 64,422
Thereofacquisitions 814 2,890 1,831 5,535 511 571 29 1,111 791 2,987 1,038 4,816
SAP Group (months' end average) 31,821 19,797 16,725 68,343 30,238 19,418 15,752 65,409 29,009 17,619 14,506 61,134
1) Europe,MiddleEast,Africa
187Notes to the Consolidated Financial Statements

Allocation of Share-Based Payment Expense Theallocationofexpenseforshare-basedpayments,netoftheeffectsfromhedgingtheseinstruments,tothevariousoperatingexpenseitemsisasfollows:
Share-Based Payments€millions
2014 2013 2012
Costofsoftwareandsoftware-relatedservices 33 40 42
Costofprofessionalservicesandotherservices 48 61 104
Researchanddevelopment 71 90 125
Salesandmarketing 76 96 123
Generalandadministration 62 40 127
Share-based payments 290 327 522Thereofcash-settledshare-basedpayments 193 240 450
Thereofequity-settledshare-basedpayments 96 87 72
Formoreinformationaboutourshare-basedpayments,seeNote(28).
(9) OTHER NON-OPERATING INCOME/EXPENSE, NETOthernon-operatingincome/expense,netwasasfollows:
Other Non-Operating Income/Expense, Net €millions
2014 2013 2012
Foreigncurrencyexchangegain/loss,net 71 4 –154
Thereoffromfinancialassets/liabilitiesatfairvaluethroughprofitorloss 83 –75 –102
Thereoffromloansandreceivables –219 184 –32
Thereoffromfinancialliabilitiesatamortizedcost 226 –105 –20
Thereoffromnon-financialassets/liabilities –13 0 2
Miscellaneousothernon-operatingincome 3 1 4
Miscellaneousothernon-operatingexpense –25 –22 –23
Other non-operating income/expense, net 49 –17 –173
188 Consolidated Financial Statements IFRS
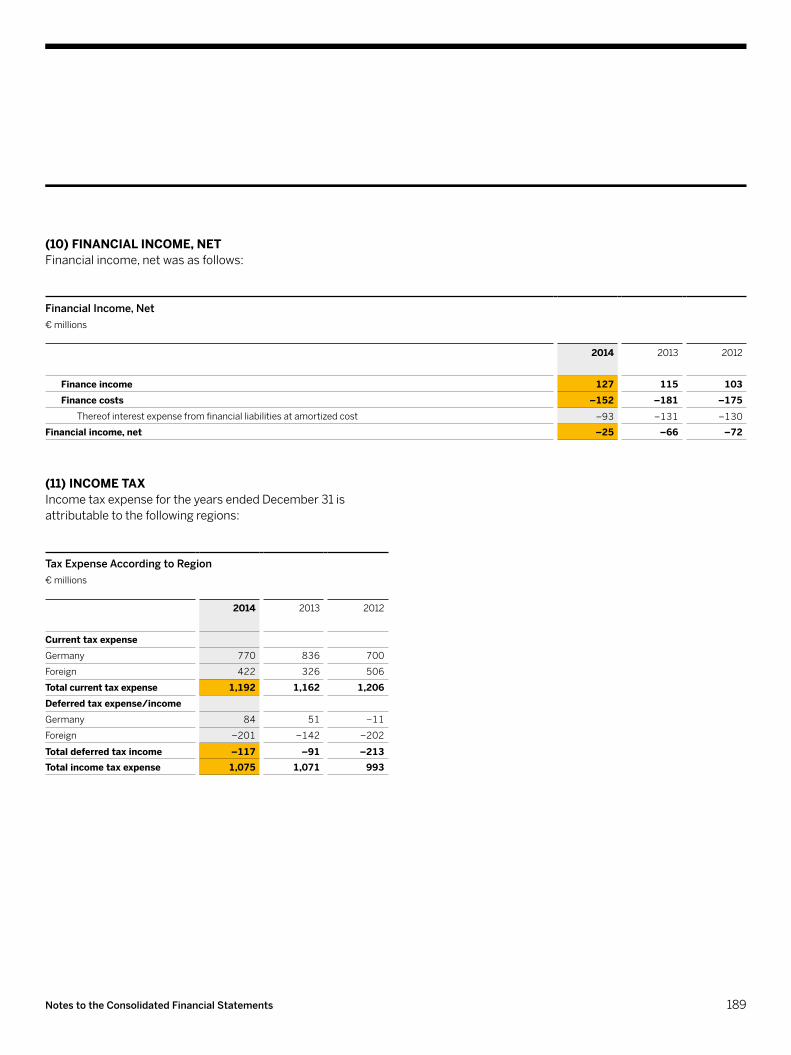
(10) FINANCIAL INCOME, NETFinancialincome,netwasasfollows:
Financial Income, Net€millions
2014 2013 2012
Finance income 127 115 103Finance costs –152 –181 –175
Thereofinterestexpensefromfinancialliabilitiesatamortizedcost –93 –131 –130
Financial income, net –25 –66 –72
(11) INCOME TAXIncometaxexpensefortheyearsendedDecember31isattributabletothefollowingregions:
Tax Expense According to Region€millions
2014 2013 2012
Current tax expenseGermany 770 836 700
Foreign 422 326 506
Total current tax expense 1,192 1,162 1,206Deferred tax expense/incomeGermany 84 51 –11
Foreign –201 –142 –202
Total deferred tax income –117 –91 –213Total income tax expense 1,075 1,071 993
189Notes to the Consolidated Financial Statements

IncometaxexpensefortheyearsendedDecember31comprisedthefollowingcomponents:
Major Components of Tax Expense€millions
2014 2013 2012
Current tax expense/incomeTaxexpenseforcurrentyear 1,168 1,249 1,173
Taxesforprioryears 24 –87 33
Total current tax expense 1,192 1,162 1,206Deferred tax expense/income
Originationandreversaloftemporarydifferences
–126 –168 –266
Unusedtaxlosses,researchanddevelopmenttaxcreditsandforeigntaxcredits
9 77 53
Total deferred tax income –117 –91 –213Total income tax expense 1,075 1,071 993
ProfitbeforetaxfortheyearsendedDecember31consistedofthefollowing:
Profit Before Tax €millions
2014 2013 2012
Germany 3,338 3,126 2,460
Foreign 1,017 1,270 1,336
Total 4,355 4,396 3,796
ThefollowingtablereconcilestheexpectedincometaxexpensecomputedbyapplyingourcombinedGermantaxrateof26.43%(2013:26.41%;2012:26.47%)totheactualincometaxexpense.Our2014combinedGermantaxrateincludesacorporateincometaxrateof15.00%(2013:15.00%;2012:15.00%),plusasolidaritysurchargeof5.5%(2013:5.5%;2012:5.5%)thereon,andtradetaxesof10.60%(2013:10.58%;2012:10.64%).
Relationship Between Tax Expense and Profit Before Tax€millions,unlessotherwisestated
2014 2013 2012
Profit before tax 4,355 4,396 3,796
Taxexpenseatapplicabletaxrateof26.43%(2013:26.41%;2012:26.47%)
1,151 1,161 1,005
Taxeffectof:
Foreigntaxrates –117 –116 –114
Non-deductibleexpenses 63 158 111
Taxexemptincome –86 –146 –169
Withholdingtaxes 111 87 71
Researchanddevelopmentandforeigntaxcredits
–41 –41 –29
Prior-yeartaxes –10 –113 15
Reassessmentofdeferredtaxassets,researchanddevelopmenttaxcredits,andforeigntaxcredits
41 60 31
Other –37 21 72
Total income tax expense 1,075 1,071 993Effective tax rate in % 24.7 24.4 26.2
190 Consolidated Financial Statements IFRS

DeferredtaxassetsandliabilitiesonagrossbasisasatDecember31areattributabletothefollowingitems:
Recognized Deferred Tax Assets and Liabilities€millions
2014 2013
Deferred tax assetsIntangibleassets 104 87
Property,plant,andequipment 18 18
Otherfinancialassets 12 7
Tradeandotherreceivables 53 48
Pensionprovisions 87 78
Share-basedpayments 107 105
Otherprovisionsandobligations 403 303
Deferredincome 75 42
Carryforwardsofunusedtaxlosses 707 521
Researchanddevelopmentandforeigntaxcredits 85 65
Other 172 149
Total deferred tax assets 1,823 1,423Deferred tax liabilitiesIntangibleassets 1,218 693
Property,plant,andequipment 53 52
Otherfinancialassets 494 330
Tradeandotherreceivables 69 32
Pensionprovisions 4 6
Share-basedpayments 3 1
Otherprovisionsandobligations 120 107
Deferredincome 11 6
Other 9 14
Total deferred tax liabilities 1,981 1,241Total deferred tax assets/liabilities, net –158 182
Thedeferredtaxassetsanddeferredtaxliabilities,especiallyonintangibleassets,netoperatinglosscarryforwards,andotherfinancialassets,increasedmainlybecauseofourbusinesscombinationsin2014.
DeferredtaxassetshavenotbeenrecognizedinrespectofthefollowingitemsfortheyearsendedDecember31:
Items Not Resulting in a Deferred Tax Asset€millions
2014 2013 2012
Unused tax lossesNotexpiring 140 68 49
Expiringinthefollowingyear 62 43 6
Expiringafterthefollowingyear 908 525 517
Total unused tax losses 1,110 636 572Deductible temporary differences
96 178 202
Unused research and develop-ment and foreign tax credits
Notexpiring 32 25 32
Expiringinthefollowingyear 0 1 0
Expiringafterthefollowingyear 22 1 36
Total unused tax credits 54 27 68
€567million(2013:€421million;2012:€367million)oftheunusedtaxlossesrelatetoU.S.statetaxlosscarryforwards.
Currentincometaxpaymentswerereducedby€71millionin2014(2013:€0million;2012:€4million)duetotheTomorrowNowandVersatalitigation.
Wehavenotrecognizedadeferredtaxliabilityonapproximately€8.87billion(2013:€7.07billion)forundistributedprofitsofoursubsidiaries,becauseweareinapositiontocontrolthetimingofthereversalofthetemporarydifferenceanditisprobablethatsuchdifferenceswillnotreverseintheforeseeablefuture.
191Notes to the Consolidated Financial Statements

Theproposeddividendpaymentof€1.10persharefortheyearendedDecember31,2014,willnothaveanyeffectsontheincometaxofSAPSE.
TotalincometaxincludingtheitemschargedorcrediteddirectlytosharepremiumandothercomprehensiveincomefortheyearsendedDecember31consistsofthefollowing:
Total Income Tax€millions
2014 2013 2012
Incometaxrecordedinprofit 1,075 1,071 993
Incometaxrecordedinsharepremium
–3 –5 –4
Incometaxrecordedinothercomprehensiveincomethatwillnotbereclassifiedtoprofitandloss
Remeasurementsondefinedbenefitpensionplans
–7 3 –4
Incometaxrecordedinothercomprehensiveincomethatwillbereclassifiedtoprofitandloss
Cashflowhedges –10 0 17
Exchangedifferences –21 8 3
Total 1,034 1,077 1,005
Wearesubjecttoongoingtaxauditsbydomesticandforeigntaxauthorities.Currently,wearemainlyindisputewiththeGermanandtheBraziliantaxauthorities.TheGermandisputeisinrespectofintercompanyfinancingmatterswhiletheBraziliandisputeisinrespectoflicensefeedeductibility.Inbothcases,weexpectthatwewillneedtoinitiatelitigationtoprevail.Forbothofthesematters,wehavenotrecordedaprovisionaswebelievethatthetaxauthorities’claimshavenomeritandthatnoadjustmentiswarranted.If,contrarytoourview,thetaxauthoritiesweretoprevailintheirargumentsbeforethecourt,wewouldexpecttohaveanadditionaltaxexpense(includingrelatedinterestexpensesandpenalties)ofapproximately€871millionintotal.
(12) EARNINGS PER SHARE
Restrictedshares(thebonussharesintheShareMatchingPlandiscussedinNote(28)below)grantedtoemployeesunderourshare-basedpaymentsareincludedinthedilutedearningspersharecalculationstotheextenttheyhaveadilutiveeffect.
EarningspersharefortheyearsendedDecember31wascalculatedasfollows:
Earnings per Share €millions,unlessotherwisestated
2014 2013 2012
ProfitattributabletoequityholdersofSAPSE
3,280 3,326 2,803
Issuedordinaryshares1) 1,229 1,229 1,229
Effectoftreasuryshares1) –34 –35 –37
Weightedaveragesharesoutstanding,basic1)
1,195 1,193 1,192
Dilutiveeffectofshare-basedpayments1)
3 2 1
Weightedaveragesharesoutstanding,diluted1)
1,197 1,195 1,193
Earnings per share, basic, attributable to equity holders of SAP SE (in €)
2.75 2.79 2.35
Earnings per share, diluted, attributable to equity holders of SAP SE (in €)
2.74 2.78 2.35
1) Numberofsharesinmillions
192 Consolidated Financial Statements IFRS

(13) OTHER FINANCIAL ASSETSOtherfinancialassetsasatDecember31wereasfollows:
Other Financial Assets€millions
2014 2013
Current Non-Current Total Current Non-Current Total
Loansandotherfinancialreceivables 173 286 459 90 243 333
Debtinvestments 40 0 40 38 0 38
Equityinvestments 1 596 597 0 322 322
Available-for-salefinancialassets 41 596 637 38 322 360
Derivatives 464 90 554 123 6 129
Investmentsinassociates 0 49 49 0 36 36
Total 678 1,021 1,699 251 607 858
Loans and Other Financial ReceivablesLoansandotherfinancialreceivablesmainlyconsistoftimedeposits,investmentsinpensionassetsforwhichthecorrespondingliabilityisincludedinemployee-relatedobligations(seeNote(19b)),otherreceivables,andloanstoemployeesandthirdparties.ThemajorityofourloansandotherfinancialreceivablesareconcentratedintheUnitedStates.
AsatDecember31,2014,therewerenoloansandotherfinancialreceivablespastduebutnotimpaired.Wehavenoindicationsofimpairmentsofloansandotherfinancialreceivablesthatarenotpastdueandnotimpairedasatthereportingdate.Forgeneralinformationonfinancialriskandthenatureofrisk,seeNote(25).
Available-for-Sale Financial AssetsOuravailable-for-salefinancialassetsconsistofdebtinvestmentsinbondsoffinancialandnon-financialcorporationsandmunicipalitiesandequityinvestmentsinlistedandunlistedsecurities.
Theseavailable-for-salefinancialassetsaredenominatedinthefollowingcurrencies:
Currencies of Available-for-Sale Financial Assets€millions
2014 2013
Euros 77 51
U.S.dollars 542 305
Other 18 4
Total 637 360
Formoreinformationonfairvaluemeasurementwithregardtoourequityinvestments,seeNote(27).
DerivativesDetailedinformationaboutourderivativefinancialinstrumentsispresentedinNote(26).
193Notes to the Consolidated Financial Statements

(14) TRADE AND OTHER RECEIVABLESTradeandotherreceivablesasatDecember31wereasfollows:
Trade and Other Receivables€millions
2014 2013
Current Non-Current Total Current Non-Current Total
Tradereceivables,net 4,241 1 4,242 3,801 14 3,815
Otherreceivables 89 99 188 63 84 147
Total 4,330 100 4,430 3,864 98 3,962
ThecarryingamountsofourtradereceivablesasatDecember31areasfollows:
Carrying Amounts of Trade Receivables€millions
2014 2013
Grosscarryingamount 4,428 3,953
Salesallowanceschargedtorevenue –134 –96
Allowancefordoubtfulaccountschargedtoexpense
–52 –42
Carrying amount trade receivables, net
4,242 3,815
Thechangesintheallowancefordoubtfulaccountschargedtoexpensewereimmaterialinallperiodspresented.
194 Consolidated Financial Statements IFRS

TheagingoftradereceivablesasatDecember31was:
Aging of Trade Receivables€millions
2014 2013
Notpastdueandnotindividuallyimpaired 3,349 3,054
Past due but not individually impairedPastdue1–30days 345 330
Pastdue31–120days 339 258
Pastdue121–365days 118 120
Pastdueover365days 16 13
Total past due but not individually impaired 818 721Individuallyimpaired,netofallowances 75 40
Carrying amount of trade receivables, net 4,242 3,815
Formoreinformationaboutfinancialriskandhowwemanageit,seeNotes(25)and(26).
(15) OTHER NON-FINANCIAL ASSETS
Other Non-Financial Assets€millions
2014 2013
Current Non-Current Total Current Non-Current Total
Prepaidexpenses 207 66 273 179 57 236
Othertaxassets 101 0 101 92 0 92
Capitalizedcontractcost 90 99 188 55 50 105
Miscellaneousotherassets 33 0 33 20 0 20
Total 431 164 595 346 107 453
Prepaidexpensesprimarilyconsistofprepaymentsforoperatingleases,supportservices,andsoftwareroyalties.
195Notes to the Consolidated Financial Statements

(16) GOODWILL AND INTANGIBLE ASSETS
Goodwill and Intangible Assets€millions
Goodwill SoftwareandDatabaseLicenses
AcquiredTechnology/IPRD
CustomerRelationshipandOtherIntangibles
Total
Historical costJanuary1,2013 13,288 533 1,778 3,054 18,653
Foreigncurrencyexchangedifferences –345 –2 –40 –95 –482
Additionsfrombusinesscombinations 842 2 192 182 1,218
Otheradditions 0 43 0 0 43
Retirements/disposals 0 –18 –1 –105 –124
December 31, 2013 13,785 558 1,929 3,036 19,308Foreigncurrencyexchangedifferences 1,247 15 160 297 1,719
Additionsfrombusinesscombinations 6,012 16 540 1,312 7,880
Otheradditions 0 86 0 2 88
Retirements/disposals 0 –4 –42 –3 –49
December 31, 2014 21,044 671 2,587 4,644 28,946
Accumulated amortizationJanuary1,2013 96 335 843 953 2,227
Foreigncurrencyexchangedifferences –1 –2 –20 –22 –45
Additionsamortization 0 51 249 303 603
Retirements/disposals 0 –17 –1 –105 –123
December 31, 2013 95 367 1,071 1,129 2,662Foreigncurrencyexchangedifferences 4 7 73 81 165
Additionsamortization 0 78 255 282 615
Retirements/disposals 0 –4 –42 –3 –49
December 31, 2014 99 448 1,357 1,489 3,393
Carrying amountDecember 31, 2013 13,690 191 858 1,907 16,646December 31, 2014 20,945 223 1,230 3,155 25,553
196 Consolidated Financial Statements IFRS

Theadditions,otherthanfrombusinesscombinations,tosoftwareanddatabaselicensesin2014and2013wereindividuallyacquiredfromthirdpartiesandincludecross-licenseagreementsandpatents.
Wecarrythefollowingsignificantintangibleassets:
Significant Intangible Assets€millions,unlessotherwisestated
Carrying Amount RemainingUsefulLife(inyears)
2014 2013
BusinessObjects–Customerrelationships:Maintenance 126 150 7to10
Sybase–Acquiredtechnologies 149 225 1to2
Sybase–Customerrelationships:Maintenance 418 466 8
SuccessFactors–Acquiredtechnologies 184 206 5
SuccessFactors–Customerrelationships:Subscription 402 383 12
Ariba–Acquiredtechnologies 166 186 6
Ariba–Customerrelationships 516 480 11to13
hybris–Acquiredtechnologies 128 159 6
hybris–Customerrelationships 136 137 3to13
Fieldglass–Acquiredtechnologies 96 0 8
Concur–Acquiredtechnologies 445 0 7
Concur–Customerrelationships 1,233 0 16to20
Total significant intangible assets 3,999 2,392
197Notes to the Consolidated Financial Statements

Goodwill Impairment TestingSAPhadasingleoperatingsegmentin2014(in2013,wehadfour).
Single SegmentWedeterminedtherecoverableamountforoursinglesegmentbasedonfairvaluelesscostsofdisposalusingmarketcapitalizationderivedfrompublicquotationsofSAPstock.WebelievethatnoreasonablyforeseeablechangeinthepriceofSAPstockwouldcausethecarryingamountofoursingleoperatingsegmenttoexceeditsrecoverableamount.
Unallocated GoodwillTheunallocatedgoodwillof€5,533millionrelatestotheacquisitionofConcur.SincetheConcuracquisitionwasexecutedveryclosetoDecember31,2014,theimpactoftheacquisitiononoursegmentstructurehadnotyetbeendecidedatyear-end2014andanimpairmenttestonthisgoodwillhadnotbeencarriedout.Wethereforeconsideredwhethertherewerefactorsthatcouldindicatesignsofimpairment,includingpreliminarybusinessplansoftheacquiredbusiness.Inourview,thecalculationsthatwerebasedontradingandtransactionmultiplesofbenchmarkcompaniescomparabletothebusinessforthisrecentacquisitionrepresentthebestestimateoffairvalue.Thedatagatheredforthebenchmarkcompanieswasobtainedfrompubliclyavailableinformation.Analysisofthesefactorsdidnotrevealanyindicationsofimpairment.Formoreinformationabouttheacquisition,seeNote(4).
198 Consolidated Financial Statements IFRS

(17) PROPERTY, PLANT, AND EQUIPMENT
Property, Plant, and Equipment€millions
LandandBuildings OtherProperty,Plant,andEquipment
AdvancePaymentsandConstructionin
Progress
Total
December31,2013 903 873 44 1,820
December 31, 2014 1,010 1,050 42 2,102
Totaladditions(otherthanfrombusinesscombinations)amountingto€629million(2013:€545million)relateprimarilytothereplacementandpurchaseofcomputerhardwareandvehiclesacquiredinthenormalcourseofbusinessandinvestmentsindatacenters.
(18) TRADE AND OTHER PAYABLES, FINANCIAL LIABILITIES, AND OTHER NON-FINANCIAL LIABILITIES(18a) Trade and Other PayablesTradeandotherpayablesasatDecember31wereasfollows:
Trade and Other Payables€millions
2014 2013
Current Non-Current Total Current Non-Current Total
Tradepayables 756 0 756 640 0 640
Advancepaymentsreceived 112 0 112 80 0 80
Miscellaneousotherliabilities 138 55 193 130 45 175
Trade and other payables 1,007 55 1,061 850 45 895
Miscellaneousotherliabilitiesincludemainlydeferralamountsforfreerentperiodsandliabilitiesrelatedtogovernmentgrants.
199Notes to the Consolidated Financial Statements

(18b) Financial LiabilitiesFinancialliabilitiesasatDecember31wereasfollows:
Financial Liabilities€millions
2014 2013
NominalVolume CarryingAmount NominalVolume CarryingAmount
Current Non-Current
Current Non-Current
Total Current Non-Current
Current Non-Current
Total
Bonds 631 4,000 630 3,998 4,628 500 1,800 500 1,791 2,291
Privateplacementtransactions
247 1,936 247 1,948 2,195 86 1,922 86 1,891 1,977
Bankloans 1,279 3,000 1,277 2,985 4,261 0 0 0 0 0
Financial debt 2,157 8,936 2,154 8,931 11,085 586 3,722 586 3,682 4,268Derivatives NA NA 287 46 333 NA NA 97 72 169
Otherfinancialliabilities
NA NA 120 4 124 NA NA 65 4 69
Financial liabilities 2,561 8,980 11,542 748 3,758 4,506
Financialliabilitiesareunsecured,exceptfortheretentionoftitleandsimilarrightscustomaryinourindustry.Effectiveinterestratesonourfinancialdebt(includingtheeffectsfrominterestrateswaps)were1.77%in2014,2.48%in2013,and2.87%in2012.
Forananalysisofthecontractualcashflowsofourfinancialliabilitiesbasedonmaturity,seeNote(25).Forinformationontheriskassociatedwithourfinancialliabilities,seeNote(26).Forinformationonfairvalues,seeNote(27).
200 Consolidated Financial Statements IFRS

BondsAsatDecember31,wehadoutstandingbondswiththefollowingterms:
Bonds
Maturity IssuePrice CouponRate EffectiveInterestRate
NominalVolume(inrespective
currencyinmillions)
Carrying Amount on 12/31/2014 (in € millions)
CarryingAmounton12/31/2013(in€millions)
Eurobond1–2010 2014 99.755% 2.50%(fix) 2.64% €500 0 500
Eurobond2–2010 2017 99.780% 3.50%(fix) 3.58% €500 490 499
Eurobond5–2012 2015 99.791% 1.00%(fix) 1.17% €550 549 547
Eurobond6–2012 2019 99.307% 2.125%(fix) 2.27% €750 778 745
Eurobond7–2014 2018 100.000% 0.381%(var.) 0.43% €750 748 0
Eurobond8–2014 2023 99.478% 1.125%(fix) 1.24% €1,000 992 0
Eurobond9–2014 2027 99.284% 1.75%(fix) 1.86% €1,000 990 0
Eurobonds 4,547 2,291Otherbonds US$98 81 0
Bonds 4,628 2,291
SinceSeptember2012,wehaveusedadebtissuanceprogramtoissuebondsinanumberoftranchesindifferentcurrencies.Currently,thisprogramhasatotalvolumeof€6billion.InNovember2012andinNovember2014,weissuedbondsundertheprogramasshowninthetableabove.Atthereportingdate,avolumeof€1.95billion(2013:€4billion)isavailablefornewbondissuances.
AllourEurobondsarelistedfortradingontheLuxembourgStockExchange.
OurotherbondswereoriginallyissuedbyConcurin2010and2013.ThemajorityofthesenotesweresettledshortlyaftertheacquisitionofConcurandtheremainderofUS$98millionisexpectedtobesettledinthefirstquarter2015.
201Notes to the Consolidated Financial Statements

Private Placement TransactionsOurprivateplacementtransactionshavethefollowingterms:
Private Placements
Maturity CouponRate EffectiveInterestRate
NominalVolume(inrespective
currencyinmillions)
Carrying Amount on 12/31/2014 (in € millions)
CarryingAmounton12/31/2013(in€millions)
Germanpromissorynote
Tranche3–2009 2014 4.92%(fix) 4.98% €86 0 86
U.S.privateplacements
Tranche1–2010 2015 2.34%(fix) 2.40% US$300 247 216
Tranche2–2010 2017 2.95%(fix) 3.03% US$200 161 145
Tranche3–2011 2016 2.77%(fix) 2.82% US$600 494 434
Tranche4–2011 2018 3.43%(fix) 3.50% US$150 121 108
Tranche5–2012 2017 2.13%(fix) 2.16% US$242.5 197 175
Tranche6–2012 2020 2.82%(fix) 2.86% US$290 238 206
Tranche7–2012 2022 3.18%(fix) 3.22% US$444.5 372 313
Tranche8–2012 2024 3.33%(fix) 3.37% US$323 277 225
Tranche9–2012 2027 3.53%(fix) 3.57% US$100 88 69
Private placements 2,195 1,977
TheU.S.privateplacementnoteswereissuedbyoneofoursubsidiariesthathastheU.S.dollarasitsfunctionalcurrency. Bank LoansAsatDecember31,wehadoutstandingbankloanswiththefollowingterms:
Bank Loans
Maturity CouponRate EffectiveInterestRate
NominalVolume(inrespective
currencyinmillions)
Carrying Amount on 12/31/2014 (in € millions)
CarryingAmounton12/31/2013(in€millions)
Concurtermloan–FacilityA 2015 0.272%(var.) 1.64% €1,270 1,268 0
Concurtermloan–FacilityB 2017 0.532%(var.) 0.98% €3,000 2,984 0
Otherloans INR637 9 0
Bank loans 4,261 0
202 Consolidated Financial Statements IFRS
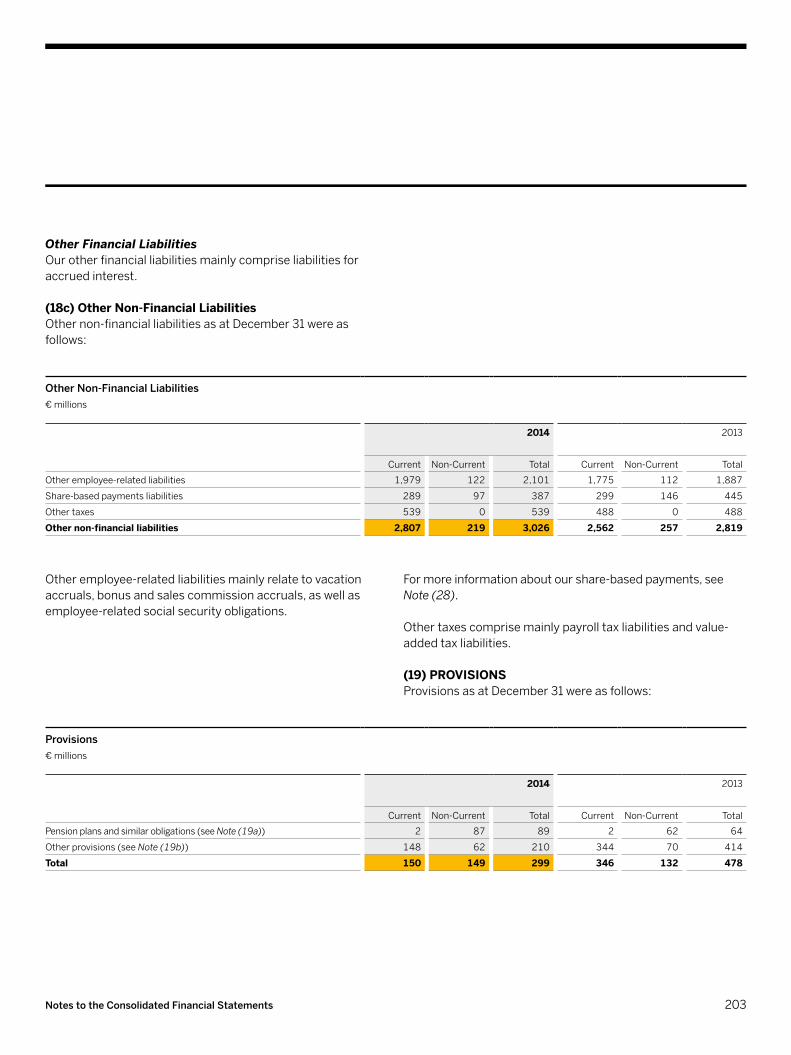
Other Financial LiabilitiesOurotherfinancialliabilitiesmainlycompriseliabilitiesforaccruedinterest.
(18c) Other Non-Financial LiabilitiesOthernon-financialliabilitiesasatDecember31wereasfollows:
Other Non-Financial Liabilities€millions
2014 2013
Current Non-Current Total Current Non-Current Total
Otheremployee-relatedliabilities 1,979 122 2,101 1,775 112 1,887
Share-basedpaymentsliabilities 289 97 387 299 146 445
Othertaxes 539 0 539 488 0 488
Other non-financial liabilities 2,807 219 3,026 2,562 257 2,819
Otheremployee-relatedliabilitiesmainlyrelatetovacationaccruals,bonusandsalescommissionaccruals,aswellasemployee-relatedsocialsecurityobligations.
Formoreinformationaboutourshare-basedpayments,seeNote(28).
Othertaxescomprisemainlypayrolltaxliabilitiesandvalue-addedtaxliabilities.
(19) PROVISIONSProvisionsasatDecember31wereasfollows:
Provisions€millions
2014 2013
Current Non-Current Total Current Non-Current Total
Pensionplansandsimilarobligations(seeNote(19a)) 2 87 89 2 62 64
Otherprovisions(seeNote(19b)) 148 62 210 344 70 414
Total 150 149 299 346 132 478
203Notes to the Consolidated Financial Statements

(19a) Pension Plans and Similar Obligations
Defined Benefit PlansThemeasurementdatesforourdomesticandforeignbenefitplansareDecember31.
Thefollowingtableshowsthepresentvalueofthenatureofthebenefitsprovidedbythedefinedbenefitobligations:
Nature of the Benefits €millions
DomesticPlans ForeignPlans OtherPost-EmploymentPlans
Total
2014 2013 2014 2013 2014 2013 2014 2013
Presentvalueofdefinedbenefitobligation
Benefits based on final salaryAnnuity 18 14 0 2 0 0 18 16
Lumpsum 0 0 6 5 37 25 43 30
Benefits not based on final salaryAnnuity 48 40 234 189 0 1 282 230
Lumpsum 714 574 36 35 9 8 759 617
Total 780 628 276 231 46 34 1,102 893
204 Consolidated Financial Statements IFRS

Presentvalueofthedefinedbenefitobligations(DBOs)andthefairvalueoftheplanassetswithareconciliationofthefundedstatustonetamountsasatDecember31wereasfollows:
Present Value of the DBO and the Fair Value of the Plan Assets €millions
DomesticPlans ForeignPlans OtherPost-EmploymentPlans
Total
2014 2013 2014 2013 2014 2013 2014 2013
Present value of the DBO 780 628 276 231 46 34 1,102 893 Thereoffullyorpartiallyfundedplans 780 628 239 196 26 20 1,045 844
Thereofunfundedplans 0 0 37 35 20 14 57 49
Fair value of the plan assets 767 623 234 201 13 11 1,014 835Net defined benefit liability (asset) 13 5 43 30 33 23 89 58
AmountsrecognizedintheConsolidatedStatementofFinancialPosition:
Non-currentotherfinancialassets 0 0 0 6 0 0 0 6
Currentprovisions 0 0 –2 –2 0 0 –2 –2
Non-currentprovisions –13 –5 –41 –34 –33 –23 –87 –62
Total –13 –5 –43 –30 –33 –23 –89 –58
Thefollowingweightedaverageassumptionswereusedfortheactuarialvaluationofourdomesticandforeignpensionliabilitiesaswellasotherpost-employmentbenefitobligationsasattherespectivemeasurementdate:
Actuarial AssumptionsPercent
DomesticPlans ForeignPlans OtherPost-EmploymentPlans
2014 2013 2012 2014 2013 2012 2014 2013 2012
Discountrate 2.2 3.6 3.3 1.1 2.1 1.9 4.2 5.2 4.8
Futuresalaryincreases 2.5 2.5 2.5 1.7 1.7 1.8 3.8 4.7 4.2
Futurepensionincreases 2.0 2.0 2.0 0.0 0.0 0.0 0.0 0.0 0.0
Employeeturnover 2.0 2.0 2.0 10.1 9.9 9.5 1.3 2.5 2.3
Inflation 0.0 0.0 0.0 1.3 1.3 1.3 1.3 1.1 1.1
205Notes to the Consolidated Financial Statements
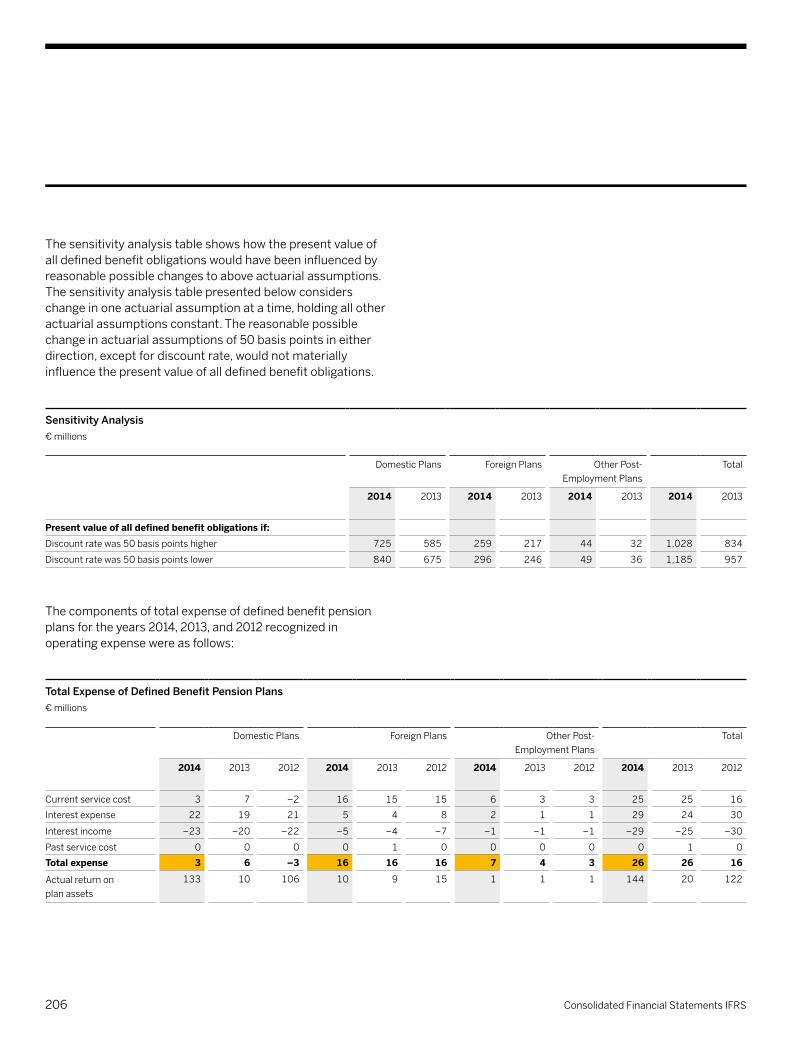
Thesensitivityanalysistableshowshowthepresentvalueofalldefinedbenefitobligationswouldhavebeeninfluencedbyreasonablepossiblechangestoaboveactuarialassumptions.Thesensitivityanalysistablepresentedbelowconsiderschangeinoneactuarialassumptionatatime,holdingallotheractuarialassumptionsconstant.Thereasonablepossiblechangeinactuarialassumptionsof50basispointsineitherdirection,exceptfordiscountrate,wouldnotmateriallyinfluencethepresentvalueofalldefinedbenefitobligations.
Sensitivity Analysis€millions
DomesticPlans ForeignPlans OtherPost-EmploymentPlans
Total
2014 2013 2014 2013 2014 2013 2014 2013
Present value of all defined benefit obligations if:Discountratewas50basispointshigher 725 585 259 217 44 32 1,028 834
Discountratewas50basispointslower 840 675 296 246 49 36 1,185 957
Thecomponentsoftotalexpenseofdefinedbenefitpensionplansfortheyears2014,2013,and2012recognizedinoperatingexpensewereasfollows:
Total Expense of Defined Benefit Pension Plans€millions
DomesticPlans ForeignPlans OtherPost-EmploymentPlans
Total
2014 2013 2012 2014 2013 2012 2014 2013 2012 2014 2013 2012
Currentservicecost 3 7 –2 16 15 15 6 3 3 25 25 16
Interestexpense 22 19 21 5 4 8 2 1 1 29 24 30
Interestincome –23 –20 –22 –5 –4 –7 –1 –1 –1 –29 –25 –30
Pastservicecost 0 0 0 0 1 0 0 0 0 0 1 0
Total expense 3 6 –3 16 16 16 7 4 3 26 26 16
Actualreturnonplanassets
133 10 106 10 9 15 1 1 1 144 20 122
206 Consolidated Financial Statements IFRS

Ourinvestmentstrategyondomesticbenefitplansistoinvestallcontributionsinstableinsurancepolicies.
Ourinvestmentstrategiesforforeignbenefitplansvaryaccordingtotheconditionsinthecountryinwhichtherespectivebenefitplansaresituated.Generally,along-terminvestmenthorizonhasbeenadoptedforallmajorforeignbenefitplans.Althoughourpolicyistoinvestinarisk-diversifiedportfolioconsistingofamixofassets,boththe
definedbenefitobligationandplanassetscanfluctuateovertimewhichexposestheGrouptoactuarialandmarket(investment)risks.Dependingonthestatutoryrequirementsineachcountry,itmightbenecessarytoreducetheunderfundingbyadditionofliquidassets.Tominimizetheseactuarialandmarketfluctuations,SAPreviewsrelevantfinancialfactorsforappropriatenessandreasonablenessandmakesmodificationstoeliminatecertaineffectswhenconsiderednecessary. OurplanassetallocationasatDecember31,2014,andDecember31,2013,wasasfollows:
Plan Asset Allocation€millions
2014 2013
QuotedinanActiveMarket
NotQuotedinanActiveMarket
QuotedinanActiveMarket
NotQuotedinanActiveMarket
Asset categoryEquityinvestments 75 0 48 0
Corporatebonds 60 0 65 0
Governmentbonds 1 0 0 0
Realestate 31 0 33 0
Insurancepolicies 0 780 0 632
Cashandcashequivalents 41 0 34 0
Others 27 0 23 0
Total 234 780 203 632
207Notes to the Consolidated Financial Statements

Ourexpectedcontributionin2015toourdomesticandforeigndefinedbenefitpensionplansisimmaterial.Theweighteddurationofourdefinedbenefitplansamountedto14yearsasatDecember31,2014,and15yearsasatDecember31,2013.
Thetablebelowpresentsthematurityanalysisofthebenefitpayments:
Maturity Analysis€millions
DomesticPlans ForeignPlans OtherPost-EmploymentPlans
2014 2013 2014 2013 2014 2013
Lessthanayear 10 8 23 20 2 1
Between1–2years 17 9 40 36 2 2
Between2–5years 56 58 58 53 6 5
Over5years 983 989 195 205 17 64
Total 1,066 1,064 316 314 27 72
Defined Contribution Plans/State PlansWealsomaintaindomesticandforeigndefinedcontributionplans.Amountscontributedbyusundersuchplansarebasedonapercentageoftheemployees’salariesortheamountofcontributionsmadebyemployees.Furthermore,inGermanyandsomeothercountrieswemakecontributionstopublicpensionplansthatareoperatedbynationalorlocalgovernmentorasimilarinstitution.Theexpensesofdefinedcontributionplansandstateplansfortheyears2014,2013,and2012,wereasfollows:
Total Expense of Defined Contribution Plans and State Plans€millions
2014 2013 2012
Definedcontributionplans 188 182 173
Stateplans 360 316 296
Total expense 548 498 469
208 Consolidated Financial Statements IFRS

(19b) Other ProvisionsChangesinotherprovisionsoverthereportingyearwereasfollows:
Other Provisions€millions
1/1/2014 Addition Accretion Utilization Release CurrencyImpact
12/31/2014
Employee-relatedprovisions 52 70 5 –74 –7 1 47
Customer-relatedprovisions 36 115 0 –113 –2 2 39
TomorrowNowandVersatalitigation 223 331 0 –555 –23 25 1
Otherintellectualproperty-relatedlitigation 12 2 0 –3 –1 1 11
Intellectualproperty-relatedprovisions 235 333 0 –558 –24 26 12
Restructuringprovisions 33 137 0 –102 –11 2 59
Onerouscontractprovisions(otherthanfromcustomercontracts)
33 0 2 –11 –2 2 24
Otherprovisions 24 7 0 –2 –1 1 29
Total other provisions 414 662 7 –859 –47 34 210Thereofcurrent 344 148
Thereofnon-current 70 62
Intellectualproperty-relatedprovisionsrelatetolitigationmatters.Customer-relatedprovisionsrelateprimarilytodisputeswithindividualcustomers.Theexpensefromcustomer-relatedprovisionswasalmostcompletelyoffsetbyinsuranceproceeds.BothclassesofprovisionaredescribedinNote(24).
In2014,weestablishedarestructuringplantoexecuteanumberoforganizationalchangestriggeredbyournewcloudandsimplificationstrategy.Restructuringprovisionsprimarilyincludepersonnelcostswhichresultfromseverancepaymentsforemployeeterminationsandcontractterminationcosts,includingthoserelatingtotheterminationofleasecontracts.
Prioryearrestructuringprovisionsrelatetorestructuringactivitiesincurredinconnectionwiththeorganizationalchangesinsalesandgo-to-marketintheEMEAandNorthAmericaregionsaswellastheintegrationofSybaseemployeesintoourglobalfinanceandadministrationorganizationandtheintegrationofthebusinessactivitiesofCrossgate.Formoredetails,seeNote(7).Thecashoutflowsassociatedwithemployee-relatedrestructuringcostsaresubstantiallyshort-terminnature.Thetimingofthecashflowsassociatedwithfacility-relatedprovisionsisdependentontheremainingtermoftheassociatedlease.
209Notes to the Consolidated Financial Statements

(20) DEFERRED INCOMEDeferredincomeconsistsmainlyofprepaymentsmadebyourcustomersforcloudsubscriptions,supportservicesandconsultingservices;feesfrommultipleelementarrangementsallocatedtoundeliveredelements;andamountsrecordedinpurchaseaccountingatfairvalueforobligationstoperformunderacquiredsupportcontractsinconnectionwithacquisitions.
AsatDecember31,2014,currentdeferredincomeincludedatotalof€690millionindeferredrevenue(December31,2013:€443million),whichinthefuturewillberecognizedasrevenuefromcloudsubscriptionsandsupport.
(21) TOTAL EQUITY
Issued CapitalAsatDecember31,2014,SAPSEhadissued1,228,504,232no-parvaluebearershares(December31,2013:1,228,504,232)withacalculatednominalvalueof€1pershare.UponconversionoftheCompanyintoanSE,allsharesofSAPAGbecamesharesofSAPSE.Allthesharesissuedarefullypaid.Thefollowingtableshowsthechangesinthenumberandthevalueofissuedsharesandtreasurysharesinmillions.
Change in Issued Capital and Treasury Shares
NumberofSharesinMillions Valuein€Millions
IssuedCapital TreasuryShares IssuedCapital TreasuryShares
January 1, 2012 1,228 –38 1,228 –1,377Issuingsharesundershare-basedpayments 1 0 1 0
Purchaseoftreasuryshares 0 –1 0 –53
Reissuanceoftreasurysharesundershare-basedpayments 0 2 0 93
December 31, 2012 1,229 –37 1,229 –1,337Reissuanceoftreasurysharesundershare-basedpayments 0 2 0 57
December 31, 2013 1,229 –35 1,229 –1,280Reissuanceoftreasurysharesundershare-basedpayments 0 2 0 56
December 31, 2014 1,229 –33 1,229 –1,224
Authorized SharesTheArticlesofIncorporationauthorizetheExecutiveBoardtoincreasetheissuedcapital:–Uptoatotalamountof€250millionbyissuingnewno-parvaluebearersharesagainstcontributionsincashuntilJune7,2015(AuthorizedCapitalI).Theissuanceissubjecttothestatutorysubscriptionrightsofexistingshareholders.
–Uptoatotalamountof€250millionbyissuingnewno-parvaluebearersharesagainstcontributionsincashorinkinduntilJune7,2015(AuthorizedCapitalII).SubjecttotheconsentoftheSupervisoryBoard,theExecutiveBoardisauthorizedtoexcludetheshareholders’statutorysubscriptionrightsincertaincases.
210 Consolidated Financial Statements IFRS

–Uptoatotalamountofapproximately€30millionbyissuingnewno-parvaluebearersharesagainstcontributionsincashorinkinduntilJune7,2015(AuthorizedCapitalIII).ThenewsharesmayonlybeusedtograntsharestoemployeesofSAPSEanditssubsidiaries(employeeshares).Theshareholders’subscriptionrightsareexcluded.
Contingent SharesSAPSE’ssharecapitalissubjecttoacontingentcapitalincreasewhichmaybeeffectedonlytotheextentthatthe
holdersorcreditorsofconvertiblebondsorstockoptionsissuedorguaranteedbySAPSEoranyofitsdirectlyorindirectlycontrolledsubsidiariesundercertainshare-basedpaymentsexercisetheirconversionorsubscriptionrights,andnoothermethodsforservicingtheserightsareused.AsatDecember31,2014,€100million,representing100millionshares,wasstillavailableforissuance(2013:€100million).
Other Comprehensive IncomeThecomponentofothercomprehensiveincomebeforetaxthatwillbereclassifiedtoprofitorlossinthefutureincludesthefollowingitems:
Items Recognized in Other Comprehensive Income That will be Reclassified to Profit or Loss Before Tax€millions
2014 2013 2012
Gains (losses) on exchange differences 1,165 –576 –214Gains(losses)onremeasuringavailable-for-salefinancialassets 130 79 33
Reclassificationadjustmentsonavailable-for-salefinancialassets –2 –19 –20
Available-for-sale financial assets 128 60 13Gains(losses)oncash-flowhedges –41 78 21
Reclassificationadjustmentsoncash-flowhedges 3 –78 42
Cash-flow hedges –38 0 63
Treasury Shares ByresolutionofSAPSE’sGeneralMeetingofShareholdersheldonJune4,2013,theauthorizationgrantedbytheGeneralMeetingofShareholdersofJune8,2010,regardingtheacquisitionoftreasuryshareswasrevokedtotheextentithadnotbeenexercisedatthattime,andreplacedbyanewauthorizationoftheExecutiveBoardofSAPSEtoacquire,onorbeforeJune3,2018,sharesofSAPSErepresentingaprorataamountofcapitalstockofupto€120millioninaggregate,providedthatthesharespurchasedundertheauthorization,togetherwithanyothersharesintheCompanypreviously
acquiredandheldby,orattributableto,SAPSEdonotaccountformorethan10%ofSAPSE’sissuedsharecapital.Althoughtreasurysharesarelegallyconsideredoutstanding,therearenodividendorvotingrightsassociatedwithsharesheldintreasury.Wemayredeemorresellsharesheldintreasury,orwemayusetreasurysharesforthepurposeofservicingoptionorconversionrightsundertheCompany’sshare-basedpaymentplans.Also,wemayusesharesheldintreasuryasconsiderationinconnectionwithmergerswith,oracquisitionsof,othercompanies.
211Notes to the Consolidated Financial Statements

(22) ADDITIONAL CAPITAL DISCLOSURES
Capital Structure ManagementTheprimaryobjectiveofourcapitalstructuremanagementistomaintainastrongfinancialprofileforinvestor,creditor,andcustomerconfidence,andtosupportthegrowthofourbusiness.Weseektomaintainacapitalstructurethatwillallowustocoverourfundingrequirementsthroughthecapitalmarketsatreasonableconditions,andinsodoing,ensureahighlevelofindependence,confidence,andfinancialflexibility.
Afterundergoinganexternalcreditratingprocess,onSeptember19,2014,SAPSEwasassignedafirst-timelong-termissuercreditratingof“A2”byMoody’sand“A”byStandard&Poor’s,bothwithoutlook“Stable”.
Capital Structure
2014 2013 Changein%
€millions %ofTotalequityand
liabilities
€millions %ofTotalequityand
liabilities
Equity 19,598 51 16,048 59 22
Currentliabilities 8,544 22 6,347 23 35
Non-currentliabilities 10,366 27 4,695 17 121
Liabilities 18,909 49 11,043 41 71
Total equity and liabilities 38,507 100 27,091 100 42
DividendsThetotaldividendavailablefordistributiontoSAPSEshareholdersisbasedontheprofitsofSAPSEasreportedinitsstatutoryfinancialstatementspreparedundertheaccountingrulesintheGermanCommercialCode(Handelsgesetzbuch).FortheyearendedDecember31,2014,theExecutiveBoardintendstoproposethatadividendof€1.10pershare(thatis,anestimatedtotaldividendof€1,315million),bepaidfromtheprofitsofSAPSE.Dividendspersharefor2013and2012were€1.00and€0.85respectivelyandwerepaidinthesucceedingyear.
In2014,wetookoutatwo-tranchebankloanof€4,270millionintotalandissuedathree-trancheEurobondof€2,750millionintotalwithmaturitiesoffourtotwelveyearstofinancetheacquisitionofConcur.Inaddition,wetooka€500millionshort-termbankloanfortheacquisitionofFieldglassand
repaiditinthesameyear.Wealsorepaida€500millionEurobondandthelasttrancheofthepromissorynotesamountingto€86million.Thus,theratiooftotalfinancialdebttototalequityandliabilitiesincreasedby13percentagepointsto29%attheendof2014(16%asatDecember31,2013).
212 Consolidated Financial Statements IFRS

Totalfinancialdebtconsistsofcurrentandnon-currentbankloans,bondsandprivateplacements.Formoreinformationaboutourfinancialdebt,seeNote(18).
Aspartofourfinancingactivities,theCompanyintendstorepaya€550millionEurobondaswellasaUS$300millionU.S.privateplacementtranchewhentheymaturein2015.
Furthermore,weareplanningtorepayasubstantialportionofouroutstandingbankloans.Wewillconsiderissuingnewdebt,suchasbondsorU.S.privateplacements,torefinanceexistingbankloansortocoveradditionalcapitalneeds.
Whilewecontinuouslymonitortheratiospresentedinandbelowthetableabove,ourmainfocusisonthemanagementofournetliquiditypositionasoutlinedinthefollowingtable:
Group Liquidity of SAP Group€millions
2014 2013 Change
Cashandcashequivalents 3,328 2,748 580
Currentinvestments 95 93 2
Group liquidity 3,423 2,841 582Currentfinancialdebt –2,157 –586 –1,571
Net liquidity 1 1,266 2,255 –989Non-currentfinancialdebt –8,936 –3,722 –5,214
Net liquidity 2 –7,670 –1,467 –6,203
Distribution PolicyOurgeneralintentionistoremaininapositiontoreturnexcessliquiditytoourshareholdersbydistributingannualdividendsandpotentiallyrepurchasingshares.Theamountoffuturedividendsandtheextentoffuturerepurchasesofshareswillbebalancedwithourefforttomaintainanadequateliquidityposition.
In2014,wedistributed€1,194millionindividendsfromour2013profit(comparedto€1,013millionin2013and€1,310millionin2012relatedto2012and2011profit,respectively),representing€1.00pershare.Asidefromthedistributeddividend,in2012wealsoreturned€53milliontoourshareholdersbyrepurchasingourownshares.
Asaresultofourequity-settledshare-basedpaymentstransactions(asdescribedinNote(28))wehavecommitmentstograntSAPsharestoemployees.Weintendtomeetthesecommitmentsbyreissuingtreasurysharesorissuingordinaryshares.Formoreinformationaboutcontingentcapital,seeNote(21).
213Notes to the Consolidated Financial Statements

Ouroperatingleasesrelateprimarilytotheleaseofofficespace,hardware,andvehicles,withremainingnon-cancelableleasetermsbetweenlessthanoneand34years.Onalimitedscale,theoperatingleasecontractsincludeescalationclauses(based,forexample,ontheconsumerpriceindex)andrenewaloptions.Thecontractualobligationsforacquisitionofproperty,plant,andequipmentandintangibleassetsrelateprimarilytotheconstructionofnewandexistingfacilitiesandtothepurchaseofhardware,software,patents,officeequipment,andvehicles.Theremainingobligationsrelatemainlytomarketing,consulting,maintenance,licenseagreements,andotherthird-partyagreements.Historically,themajorityofsuchpurchaseobligationshavebeenrealized.
SAPinvestsandholdsinterestsinotherentities.AsofDecember31,2014,totalcommitmentstosuchequityinvestmentsamountedto€123million(2013:€62million)ofwhich€46millionhadbeendrawn(2013:€28million).Byinvestinginsuchequityinvestments,weareexposedtotherisksinherentinthebusinesssegmentsinwhichthesefundschoosetoinvestcontributedfunds.Ourmaximumexposuretolossistheamountinvestedplusunavoidablefuturecapitalcontributions.
CommitmentsasatDecember31,2014,wereasfollows:
Other Financial Commitments€millions
OperatingLeases PurchaseObligations
CapitalContributionCommitments
Due2015 262 479 77
Due2016–2019 729 318 0
Duethereafter 341 62 0
Total 1,332 859 77
Ourrentalandoperatingleaseexpenseswere€291million,€273million,and€277millionfortheyears2014,2013,and2012,respectively.
(23) OTHER FINANCIAL COMMITMENTS
Other Financial CommitmentsOurotherfinancialcommitmentsasatDecember31,2014,and2013,wereasfollows:
Other Financial Commitments€millions
2014 2013
Operating leases 1,332 1,204Contractualobligationsforacquisitionofproperty,plant,andequipmentandintangibleassets
111 80
Otherpurchaseobligations 748 390
Purchase obligations 859 470Capital contribution commitments 77 34
Total 2,268 1,708
214 Consolidated Financial Statements IFRS
(24) LITIGATION AND CLAIMSWearesubjecttoavarietyofclaimsandlawsuitsthatarisefromtimetotimeintheordinarycourseofourbusiness,includingproceedingsandclaimsthatrelatetocompanieswehaveacquired,claimsthatrelatetocustomersdemandingindemnificationforproceedingsinitiatedagainstthembasedontheiruseofSAPsoftware,andclaimsthatrelatetocustomers’beingdissatisfiedwiththeproductsandservicesthatwehavedeliveredtothem.Wewillcontinuetovigorouslydefendagainstallclaimsandlawsuitsagainstus.WecurrentlybelievethatresolvingtheclaimsandlawsuitspendingasofDecember31,2014,willneitherindividuallynorintheaggregatehaveamaterialadverseeffectonourbusiness,financialposition,profit,orcashflows.Consequently,theprovisionsrecordedfortheseclaimsandlawsuitsasofDecember31,2014,areneitherindividuallynorinaggregatematerialtoSAP.
However,theoutcomeoflitigationandclaimsisintrinsicallysubjecttoconsiderableuncertainty.Management’sviewofthelitigationmayalsochangeinthefuture.Actualoutcomesoflitigationandclaimsmaydifferfromtheassessmentsmadebymanagementinpriorperiods,whichcouldresultinamaterialimpactonourbusiness,financialposition,profit,cashflows,orreputation.Mostofthelawsuitsandclaimsareofaveryindividualnatureandclaimsareeithernotquantifiedbytheclaimantsorclaimamountsquantifiedare,basedonhistoricalevidence,notexpectedtobeagoodproxyfortheexpenditurethatwouldberequiredtosettlethecaseconcerned.Thespecificsofthejurisdictionswheremostoftheclaimsarelocatedfurtherimpairthepredictabilityoftheoutcomeofthecases.Therefore,itisnotpracticabletoreliablyestimatethefinancialeffectthattheselawsuitsandclaimswouldhaveifSAPweretoincurexpenditureforthesecases.
Amongtheclaimsandlawsuitsarethefollowingclasses:
Intellectual Property-related Litigation and ClaimsIntellectualproperty-relatedlitigationandclaimscomprisecasesinwhichthirdpartieshavethreatenedorinitiatedlitigationclaimingthatSAPviolatesoneormoreintellectualpropertyrightsthattheypossess.Suchintellectualpropertyrightsmayincludepatents,copyrights,andothersimilarrights.
Thecarryingamountoftheprovisionsrecordedforintellectualproperty-relatedlitigationandclaimsandthechangeinthecarryingamountinthereportingperiodaredisclosedinNote(19b).Theexpectedtimingofanyresultingoutflowsofeconomicbenefitsfromtheselawsuitsandclaimsisuncertainandnotestimableasitdependsgenerallyonthedurationofthelegalproceedingsandsettlementnegotiationsrequiredtoresolvethem.Uncertaintiesabouttheamountsresultprimarilyfromtheunpredictabilityoftheoutcomesoflegaldisputesinseveraljurisdictions.Formoreinformation,seeNote(3c).
Contingentliabilitiesexistfromintellectualproperty-relatedlitigationandclaimsforwhichnoprovisionhasbeenrecognized.Generally,itisnotpracticabletoestimatethefinancialimpactofthesecontingentliabilitiesduetotheuncertaintiesaroundthelitigationandclaims,asoutlinedabove.Thetotalamountsclaimedbyplaintiffsinthoseintellectualproperty-relatedlawsuitsorclaimsinwhichaclaimhasbeenquantifiedwerenotmaterialtousasofDecember31,2014and2013.Basedonourpastexperience,mostoftheintellectualproperty-relatedlitigationandclaimstendtobeeitherdismissedincourtorsettledoutofcourtforamountssignificantlybelowtheoriginallyclaimedamountsandnotmaterialtoourconsolidatedfinancialstatements.Onlyafewcases(specificallytheTomorrowNowandtheVersatalitigation)ultimatelyresultedinasignificantcashoutflow,asdescribedbelow.
215Notes to the Consolidated Financial Statements

Individualcasesofintellectualproperty-relatedlitigationandclaimscomprise:
InMarch2007,UnitedStates-basedOracleCorporationandcertainofitssubsidiaries(Oracle)institutedlegalproceedingsintheUnitedStatesagainstTomorrowNow,Inc.,itsparentcompanySAPAmerica,Inc.,andSAPAmerica’sparentcompanySAPSE(SAP).Oraclefiledseveralamendedcomplaintsbetween2007and2009.Asamended,thelawsuitallegescopyrightinfringement,violationsoftheFederalComputerFraudandAbuseActandtheCaliforniaComputerDataAccessandFraudAct,unfaircompetition,intentionalandnegligentinterferencewithprospectiveeconomicadvantage,andcivilconspiracy.ThelawsuitallegesthatSAPunlawfullycopiedandmisappropriatedproprietary,copyrightedsoftwareproductsandotherconfidentialmaterialsdevelopedbyOracletoserviceitsowncustomers.Thelawsuitsoughtinjunctivereliefandmonetarydamages,includingpunitivedamages,allegedbyOracletobeinthebillionsofU.S.dollars.ThetrialwasheldinNovember2010.Priortotrial,SAPSE,SAPAmericaandTomorrowNowstipulatedtoliabilityforcertainclaimsandSAPagreedtopayOracleUS$120millionforattorneys’fees.Afterthetrial,thejuryreturnedadamagesverdictofUS$1.3billion.Thejudgment,whichwasissuedonFebruary3,2011,additionallyprovidedforprejudgmentinterestofUS$15million.Thejudgmentamountwasalsosubjecttopost-judgmentinterest,whichaccruesfromthetimejudgmentwasentered.
Thejurybaseditsverdictonthetheoryofahypotheticallicense,thatis,thevalueofwhatTomorrowNowwouldhavepaidifithadnegotiatedwithOraclealicenseforthecopyrightsinfringedbyTomorrowNow.Beforeandduringthecourseofthetrial,variousdamagesamountshadbeenpresentedbythepartiestothelitigation.Theyincludedthefollowing:
a)Beforethetrial,OraclehadrequesteddamagesinexcessofUS$3.5billionbasedonalleged“savedacquisitioncosts,”thecourtdismissedthatdamageclaimbasedonapretrialmotion,butOraclehadtherighttoappealthatdismissal.
b)Duringthetrial,Oracle’sdamagesexpertspresentedanamountofUS$408millionbasedonlostprofitsanddisgorgementofinfringer’sprofit.
c)Duringthetrial,membersofOraclemanagementpresented,aspartoftheirtestimonies,amountsofuptoUS$5billion.Oracle’sdamagesexpertpresentedadamagesestimateof“atleast”US$1.655billionunderahypotheticallicensetheory.Oracle’scounselaskedthejurytoaward“somewherebetweenUS$1.65andUS$3billion.”
d)Duringthetrial,thedamagesexpertforTomorrowNowandSAPpresentedanamountofUS$28millionbasedonlostprofitsandinfringer’sprofitsor,alternatively,US$40.6millionbasedonahypotheticallicensetheory.CounselforSAPandTomorrowNowaskedthejurytoawardUS$28million.
Webelievedbothbeforeandduringthetrialandcontinuetobelievethatthehypotheticallicensetheoryisnotanappropriatebasisforcalculatingthedamages.Instead,webelievethatdamagesshouldbebasedonlostprofitsandinfringer’sprofits.Assuch,SAPfiledpost-trialmotionsaskingthejudgetooverturnthejudgment.Ahearingonthepost-trialmotionswasheldinJuly2011.OnSeptember1,2011,thetrialjudgeissuedanorderwhichsetasidethejuryverdictandvacatedthatpartofthejudgmentawardingUS$1.3billionindamages.ThetrialjudgealsogaveOraclethechoiceofacceptingreduceddamagesofUS$272millionorhavinganewtrialbasedonlostprofitsandinfringer'sprofits.Oraclefiledamotionseekinganearlyappealfromtherulingvacatingthejury'sdamagesaward,whichwasdeniedbythejudge.Consequently,Oracleelectedtoproceedwithanewtrial.Inlieuofanewtrial,thepartiesstipulatedtoajudgmentofUS$306millionwhileeachpreservingallrightsforappeal.Bothpartiesfiledrespectivenoticesofappeal;ultimately,
216 Consolidated Financial Statements IFRS
SAPdidnotpursueanappeal,andinsteaddefendedthedistrictcourt'sjudgment.Onappeal,Oraclesoughtthreeformsofrelief:(1)reinstatementoftheNovember2010US$1.3billionverdict;(2)asafirstalternative,anewtrialatwhichOraclemayagainseekhypotheticallicensedamages(basedinpartonevidenceofallegedsaveddevelopmentcosts)plusSAP'sallegedinfringer'sprofitswithoutanydeductionofexpenses(Oracledidnotputanumberonitsclaimfortherequestednewtrial);and(3)asasecondalternative,increaseoftheremittitur(alternativetonewtrial)toUS$408.7million(versustheUS$272millionOraclehadpreviouslyrejected).ThehearingwasheldonMay13,2014.OnAugust29,2014,theappealscourtissueditsdecisionaffirmingthedistrictcourt'sjudgmentandrejectingOracle'srequesttoreinstatetheNovember2010juryverdictorallowittoseekhypotheticallicensedamagesatanynewtrial.Theappealscourtdidorderanincreaseintheremittitur(asanalternativetonewtrial)toUS$356.7million,asopposedtotheUS$408.7millionOraclerequested.Inmid-November,2014,Oraclemadeitselectiontoaccepttheremittitur.OnNovember14,2014,thetrialjudgeenteredfinaljudgmentandthecivilcasewasclosed.PaymenttoOracleofUS$359millionwasmadeonNovember25,2014.
InApril2007,UnitedStates-basedVersataSoftware,Inc.(formerlyTrilogySoftware,Inc.)(Versata)institutedlegalproceedingsintheUnitedStatesDistrictCourtfortheEasternDistrictofTexasagainstSAP.VersataallegedthatSAP’sproductsinfringeoneormoreoftheclaimsineachoffivepatentsheldbyVersata.Initscomplaint,Versatasoughtunspecifiedmonetarydamagesandpermanentinjunctiverelief.ThefirsttrialwasheldinAugust2009.ThejuryreturnedaverdictinfavorofVersataandawardedVersataUS$138.6millionforpastdamages.InJanuary2011,thecourtvacatedthejury’sdamagesawardandorderedanewtrialon
damages.TheretrialwasheldinMay2011.ThejuryreturnedaverdictinfavorofVersataandawardedVersataUS$345millionforpastdamages.InSeptember2011,thejudgedeniedSAP’spost-trialmotionswiththeexceptionofreducingthedamagesverdictbyUS$16milliontoapproximatelyUS$329million.ThejudgealsoorderedapproximatelyUS$60millioninpre-judgmentinterest.Additionally,thejudgegrantedVersata’srequestforabroadinjunctionwhichprohibitsSAPfrom1)sellingproductsintheUnitedStateswiththeinfringingfunctionality,2)providingmaintenancetooracceptingmaintenancerevenuefromexistingcustomersintheUnitedStatesuntilsuchcustomersdisabletheinfringingfunctionalityandverifysuchdisablement,and3)licensingadditionaluserstoexistingcustomersintheUnitedStatesuntilsuchcustomersdisabletheinfringingfunctionalityandverifysuchdisablement.Finally,thejudgestayedtheinjunctionpendingtheoutcomeofanappeal.
BothpartiesappealedtotheU.S.CourtofAppealsfortheFederalCircuit.TheappealhearingoccurredinFebruary2013andadecisionwasissuedonMay1,2013.Thethree-judgepanelruledinVersata’sfavoroninfringementanddamages,leavingbothfullyintact.ThepastdamagesverdictstoodatapproximatelyUS$390million.Regardingtheinjunction,thecourtruledthattheinjunctionwastoobroad,statingthatSAPshouldbeabletoprovidemaintenanceoradditionalseatsforpriorcustomersoftheinfringingproducts,solongasthemaintenanceortheadditionalseatdoesnotinvolve,orallowaccessto,the“enjoinedcapability”whereenjoinedcapabilityisdefinedasthecapabilitytoexecuteapricingprocedureusinghierarchicalaccessofcustomerandproductdata.SAPfiledapetitionseekingrehearingbythethree-judgepanelthatissuedthisdecisionand/orbytheentireappealscourt.TheappealscourtrequestedthatVersatarespondtoSAP’spetitionnolaterthanJuly29,2013.InAugust2013,theappealscourtdeniedSAP’srequestforrehearingandissueditsmandatepassingjurisdictiontothedistrictcourt.
217Notes to the Consolidated Financial Statements

Separately,SAPfiledapetitionwiththeUnitedStatesPatentandTrademarkOffice(USPTO)challengingthevalidityoftheassertedVersatapatent.InJanuary2013,theUSPTOgrantedSAP’srequesttoreconsiderthevalidityofVersata’spatentandinstitutedtherelevantprocedure(transitionalpostgrantreview).AdecisionwasissuedinJune2013renderingallchal-lengedpatentclaims(includingallthepatentclaimsSAPwasfoundtohaveinfringed)unpatentable.VersatafiledwiththeUSPTOarequestseekingreconsiderationofthedecisiononsixdifferentgrounds.TheUSPTOinvitedSAPtofileanoppositionrespondingtotwoofthesixgrounds.OnSeptember13,2013,theUSPTOdeniedVersata’srequestforreconsideration.InNovember,2013,VersatasoughtappealscourtreviewoftheUSPTOdecision.ThehearingonappealoccurredonDecember3,2014.Adecisiononappealisexpectedin2015.
InJune2013,followingthedeterminationofunpatentability,SAPfiledarequestwiththeappealscourttostaythelitigationpendingreviewoftheUSPTOdecision.ThatrequestwasdeniedinearlyJuly2013.
InDecember2013,SAPfiledwiththeUnitedStatesSupremeCourtapetitionforawritofcertioraritoreviewthedecisionsoftheappealscourt.ThatpetitionwasdeniedinJanuary2014.Immediatelythereafter,VersatarequestedthattheDistrictCourtdismissitsremainingclaimsforinjunctiveandequitablerelief.TheDistrictCourtgrantedthatrequestanddeemedthepreviouslyenteredjudgmentfinal.Onthatsameday,SAPrequestedthattheDistrictCourtvacatethejudgmentorstaythelitigation,basedontheUSPTOdecisiondeclaringVersata’spatentclaimsunpatentable.VersatarequestedanorderrequiringSAPtopaythejudgment.InApril2014,theDistrictCourtdeniedSAP’smotiontovacatethejudgmentorstaythelitigation.SAPfiledanappealseekingreviewofthatdistrictcourtdecision.OnmotionbyVersata,theappealscourtdismissedSAP’sappealinJune2014.OnJune30,2014,SAP
filedamotionwiththeappealscourttostayissuanceofitsmandate.Thatmotionwasdenied.SAPsubsequentlyrequestedfromtheU.S.SupremeCourtatemporarystayforthepurposeoftheCourtconsideringapetitionforawritofcertiorari.Thatrequestwasdenied.Versata’srequestforanorderrequiringSAPtopaythejudgmentremainedundecidedattheDistrictCourt.InAugust2014,VersataandSAPenteredintoaPatentLicenseandSettlementAgreement(the“Agreement”)tosettletheexistingpatentlitigationbetweenthecompanies.UnderthetermsoftheAgreement,VersatawilllicensetoSAPcertainpatentsinexchangeforaone-timecashpaymentandapotentialadditionalcontingentpayment.TheAgreementalsoprovidesforgeneralreleases,indemnificationforitsviolation,anddismissestheexistinglitigationwithprejudice.
InFebruary2010,UnitedStates-basedTecSec,Inc.(TecSec)institutedlegalproceedingsintheUnitedStatesagainstSAP(includingitssubsidiarySybase),IBM,andmanyotherdefendants.TecSecallegedthatSAP’sandSybase’sproductsinfringeoneormoreoftheclaimsinfivepatentsheldbyTecSec.Initscomplaint,TecSecseeksunspecifiedmonetarydamagesandpermanentinjunctiverelief.Thetrialhasnotyetbeenscheduled.ThelegalproceedingswerestayedagainstalldefendantspendingadecisionfromtheU.S.SupremeCourtonSAP’sandotherdefendants’requestforreview.SupremeCourtreviewwasdeclinedinJune2014.Thelawsuithasresumedatthedistrictcourtbutonlywithrespecttoonedefendant.ThelawsuitagainstSAPandSybaseremainsstayed.
218 Consolidated Financial Statements IFRS

InApril2010,SAPinstitutedlegalproceedings(aDeclaratoryJudgmentaction)intheUnitedStatesagainstWellogix,Inc.andWellogixTechnologyLicensing,LLC(Wellogix).ThelawsuitseeksadeclaratoryjudgmentthatfivepatentsownedbyWellogixareinvalidand/ornotinfringedbySAP.Thetrialhasnotyetbeenscheduled.ThelegalproceedingshavebeenstayedpendingtheoutcomeofsixreexaminationsfiledwiththeUSPTO.InSeptember2013,theUSPTOissuedadecisiononfourofthesixreexaminations,invalidatingeveryclaimofeachofthefourpatents.SAPisawaitingadecisiononthetworemainingreexaminationrequests.InresponsetoSAP’spatentDeclaratoryJudgmentaction,Wellogixhasre-assertedtradesecretmisappropriationclaimsagainstSAP(whichhadpreviouslybeenraisedandabandoned).ThecourtgrantedSAP’smotionforanearlydispositivedecisiononthetradesecretclaims,butWellogixhasaskedthecourttoreconsideritsdecisionandweareawaitingthecourt’sdecisiononthereconsiderationmotion.
InAugust2007,UnitedStates-basedelcommerce.com,Inc.(elcommerce)institutedlegalproceedingsintheUnitedStatesagainstSAP.elcommerceallegedthatSAP’sproductsinfringeoneormoreoftheclaimsinonepatentheldbyelcommerce.Initscomplaint,elcommercesoughtunspecifiedmonetarydamagesandpermanentinjunctiverelief.ThecourtinEastTexasgrantedSAP’srequesttotransferthelitigationfromEastTexastoPennsylvania.SubsequenttotheMarkmanrulingbythecourt,thepartiesagreedtotheentryoffinaljudgmentregardingnon-infringementbySAPofthemethodclaimsofthepatentandinvalidityofthesystemclaims.elcommercehasappealedthecourt’sMarkmanruling.ThehearingfortheappealwasheldinMay2012.SAPalsofiledareexaminationrequestwiththeUSPTOtoinvalidateelcommerce’spatent.OnSeptember23,2013,theUSPTOissuedadecisioninvalidatingthepatent.elcommercesoughtrehearingfromtheUSPTO,butthatrequestwasdeniedinMarch,2014.TheFederalCircuitappealscourtalsoissuedadecisioninFebruary,2014,confirmingthatSAPdidnotinfringesomeclaimsoftheelcommercepatent,butreversingthedistrictcourt’sdecision
ofinvalidityofthepatent.SAPhasaskedtheFederalCircuitcourttoreconsideritsinvaliditydecision.InJune2014,elcommerceandSAPjointlymovedtodismisstheappealontheFederalCircuitcourt.Thelegaldisputeisthusclosed.
Customer-related Litigation and Claims Customer-relatedlitigationandclaimsincludecasesinwhichweindemnifyourcustomersagainstliabilitiesarisingfromaclaimthatourproductsinfringeathirdparty’spatent,copyright,tradesecret,orotherproprietaryrights.Occasionally,consultingorsoftwareimplementationprojectsresultindisputeswithcustomers.Wherecustomersaredissatisfiedwiththeproductsandservicesthatwehavedeliveredtotheminroutineconsultingcontractsordevelopmentarrangements,wemaygrantfunctionsorperformanceguarantees.
Thecarryingamountoftheprovisionsrecordedforcustomer-relatedlitigationandclaimsandthedevelopmentofthecarryingamountinthereportingperiodaredisclosedinNote(19b).Theexpectedtimingoramountsofanyresultingoutflowsofeconomicbenefitsfromtheselawsuitsandclaimsisuncertainandnotestimableastheygenerallydependonthedurationofthelegalproceedingsandsettlementnegotiationsrequiredtoresolvethelitigationandclaimsandtheunpredictabilityoftheoutcomesoflegaldisputesinseveraljurisdictions.Formoreinformation,seeNote(3c).
Contingentliabilitiesexistfromcustomer-relatedlitigationandclaimsforwhichnoprovisionhasbeenrecognized.Generally,itisnotpracticabletoestimatethefinancialimpactofthesecontingentliabilitiesduetotheuncertaintiesaroundtheselawsuitsandclaimsoutlinedabove.
219Notes to the Consolidated Financial Statements
Non-Income Tax-related Litigation and ClaimsWearesubjecttoongoingauditsbydomesticandforeigntaxauthorities.AlongwithmanyothercompaniesoperatinginBrazil,weareinvolvedinvariousproceedingswithBrazilianauthoritiesregardingassessmentsandlitigationmattersonnon-incometaxesonintercompanyroyaltypaymentsandintercompanyservices.Thetotalpotentialamountrelatedtothesemattersforallapplicableyearsisapproximately€95million.Wehavenotrecordedaprovisionforthesematters,aswebelievethatwewillprevail.
Formoreinformationaboutincometax-relatedlitigationrisks,seeNote(11).(25) FINANCIAL RISK FACTORSWeareexposedtovariousfinancialrisks,suchasmarketrisks(includingforeigncurrencyexchangeraterisk,interestraterisk,andequitypricerisk),creditrisk,andliquidityrisk.
Market Risk
a) Foreign Currency Exchange Rate RiskAsagloballyactiveenterprise,wearesubjecttorisksassociatedwithfluctuationsinforeigncurrencieswithregardtoourordinaryoperations.SincetheGroup’sentitiesmainlyconducttheiroperatingbusinessintheirownfunctionalcurrencies,ourriskofexchangeratefluctuationsfromongoingordinaryoperationsisnotconsideredsignificant.However,occasionallywegenerateforeigncurrency-denominatedreceivables,payables,andothermonetaryitemsbytransactinginacurrencyotherthanthefunctionalcurrency.Tomitigatetheextentoftheassociatedforeigncurrencyexchangeraterisk,themajorityofthesetransactionsarehedgedasdescribedinNote(26).
Inrarecircumstances,transactinginacurrencyotherthanthefunctionalcurrencyalsoleadstoembeddedforeigncurrencyderivativesbeingseparatedandmeasuredatfairvaluethroughprofitorloss.
Inaddition,theIntellectualProperty(IP)holdersintheSAPGroupareexposedtorisksassociatedwithforecastedintercompanycashflowsinforeigncurrencies.ThesecashflowsariseoutofroyaltypaymentsfromsubsidiariestotherespectiveIPholder.Theroyaltiesarelinkedtothesubsidiaries’externalrevenue.ThisarrangementleadstoaconcentrationoftheforeigncurrencyexchangerateriskwiththeIPholders,astheroyaltiesaremostlydenominatedinthesubsidiaries’localcurrencies,whilethefunctionalcurrencyoftheIPholderswiththehighestroyaltyvolumeistheeuro.Thehighestforeigncurrencyexchangerateexposureofthiskindrelatestothecurrenciesofsubsidiarieswithsignificantoperations,forexampletheU.S.dollar,thepoundsterling,theJapaneseyen,theSwissfranc,theBrazilianreal,andtheAustraliandollar.
Generally,wearenotexposedtoanysignificantforeigncurrencyexchangerateriskwithregardtoourinvestingandfinancingactivities,assuchactivitiesarenormallyconductedinthefunctionalcurrencyoftheinvestingorborrowingentity.However,wewereexposedtoacashflowriskfromtheconsiderationtobepaidinU.S.dollarsfortheacquisitionofConcurandFieldglassin2014andhybrisin2013asthefundswereprovidedthroughourfreecashandacquisitiontermloans,bothmostlygeneratedineuros.Formoreinformation,seeNote(26).
b) Interest Rate RiskWeareexposedtointerestrateriskasaresultofourinvestingandfinancingactivitiesmainlyineurosandU.S.dollars.
220 Consolidated Financial Statements IFRS

AsatDecember31,2014,ourliquiditywasmainlyinvestedintimedepositswithfixedyields,andmoneymarketinstrumentswithvariableyields,heldascashequivalentsandcurrentandnon-currentinvestments.Sincemostofthefixedyieldtimedepositsheldatyear-endhaveshortmaturities,theydonotexposeustoasubstantialfairvalueinterestraterisk.However,weareexposedtoacashflowriskfromourcashheldatbanksspreadacrosstheworldandthevariableyieldmoneymarketfunds,mainlyheldintheUnitedStatesandGermany.
AsatDecember31,2014,wewereexposedtoaninterestrateriskfromourfinancingactivities(formoreinformationabouttheindividualinstruments,seeNote(18b))as€3.8billionofourissuedbondsandalltheU.S.privateplacementnotespayfixedinterestleadingtoafairvalueriskwhileourtermloanstotaling€4.3billionanda€750million-bondgiverisetoacash-flowrisk,astheinterestpaymentsarebasedontheprevailingEURIBORrates.
c) Equity Price RiskWeareexposedtosuchequitypriceriskwithregardtoourinvestmentsinlistedequitysecurities(2014:€209million;2013:€83million)andourshare-basedpayments(fortheexposurefromtheseplans,seeNote(28)).
Credit RiskToreducethecreditriskininvestments,wearrangedtoreceiverightstocollateralforcertaininvestingactivitiesinthefullamountoftheinvestmentvolume,whichwewouldbeallowedtomakeuseofonlyinthecaseofdefaultofthecounterpartytotheinvestment.Intheabsenceofothersignificantagreementstoreduceourcreditriskexposure,thetotalamountsrecognizedascashandcashequivalents,currentinvestments,loansandotherfinancialreceivables,andderivativefinancialassetsrepresentourmaximumexposuretocreditrisks,exceptfortheagreementsmentionedabove.
Liquidity RiskAmaturityanalysisthatprovidestheremainingcontractualmaturitiesofallourfinancialliabilitiesheldatDecember31,2014,isshowninthetablebelow.Financialliabilitiesshowninthetablebelowforwhichrepaymentcanberequestedbythecontractpartneratanytimeareassignedtotheearliestpossibleperiod.VariableinterestpaymentswerecalculatedusingthelastrelevantinterestratefixedasatDecember31,2014.Aswegenerallysettleourderivativecontractsgross,weshowthepayandreceivelegsseparatelyforallourcurrencyandinterestratederivatives,whetherornotthefairvalueofthederivativeisnegative,exceptforthederivativeforwardcontractsenteredintoinconnectionwiththeacquisitionofConcur,wherewebuyandsellUS$8.5billionbecauseweplantosettlethosenet.Thecashoutflowsforthecurrencyderivativesaretranslatedusingtheapplicableforwardrate.
ThecashflowsforunrecognizedbutcontractuallyagreedfinancialcommitmentsareshowninNote(23).
221Notes to the Consolidated Financial Statements

Contractual Maturities of Financial Liabilities and Financial Assets€millions
CarryingAmount
ContractualCashFlows
12/31/2014 2015 2016 2017 2018 2019 Thereafter
Non-derivative financial liabilitiesTradepayables –756 –756 0 0 0 0 0
Financialliabilities –11,209 –2,377 –625 –3,976 –958 –827 –3,262
Total of non-derivative financial liabilities –11,964 –3,133 –625 –3,976 –958 –827 –3,262
Derivative financial liabilities and assetsDerivative financial liabilities
Currencyderivativesnotdesignatedashedginginstruments –310
Cashoutflows –4,110 –9 –9 –9 –9 –8
Cashinflows 3,836 0 0 0 0 0
Currencyderivativesdesignatedashedginginstruments –22
Cashoutflows –487 0 0 0 0 0
Cashinflows 464 0 0 0 0 0
Interest-ratederivativesdesignatedashedginginstruments –1
Cashoutflows –7 –10 –12 –2 0 0
Cashinflows 9 9 9 1 0 0
Total of derivative financial liabilities –333 –295 –10 –12 –10 –9 –8Derivative financial assets
Currencyderivativesnotdesignatedashedginginstruments 411
Cashoutflows –1,236 0 0 0 0 0
Cashinflows 1,656 0 0 0 0 0
Currencyderivativesdesignatedashedginginstruments 10
Cashoutflows –162 0 0 0 0 0
Cashinflows 163 0 0 0 0 0
Interest-ratederivativesdesignatedashedginginstruments 77
Cashoutflows –34 –40 –48 –39 –43 –123
Cashinflows 62 63 63 44 44 99
Total of derivative financial assets 498 449 23 15 5 1 –24Total of derivative financial liabilities and assets 165 154 13 3 –5 –8 –32
222 Consolidated Financial Statements IFRS

Contractual Maturities of Financial Liabilities and Financial Assets€millions
CarryingAmount
ContractualCashFlows
12/31/2013 2014 2015 2016 2017 2018 Thereafter
Non-derivative financial liabilitiesTradepayables –640 –640 0 0 0 0 0
Financialliabilities –4,336 –731 –863 –513 –891 –153 –1,730
Total of non-derivative financial liabilities –4,976 –1,371 –863 –513 –891 –153 –1,730
Derivative financial liabilities and assetsDerivative financial liabilities
Currencyderivativesnotdesignatedashedginginstruments –144
Cashoutflows –1,975 –9 –9 –8 –8 –15
Cashinflows 1,885 0 0 0 0 0
Currencyderivativesdesignatedashedginginstruments –3
Cashoutflows –178 0 0 0 0 0
Cashinflows 174 0 0 0 0 0
Interest-ratederivativesdesignatedashedginginstruments –23
Cashoutflows –12 –17 –27 –39 –37 –192
Cashinflows 30 35 35 35 28 123
Total of derivative financial liabilities –170 –76 9 –1 –12 –17 –84Derivative financial assets
Currencyderivativesnotdesignatedashedginginstruments 26
Cashoutflows –2,544 0 0 0 0 0
Cashinflows 2,569 0 0 0 0 0
Currencyderivativesdesignatedashedginginstruments 30
Cashoutflows –391 0 0 0 0 0
Cashinflows 419 0 0 0 0 0
Interest-ratederivativesdesignatedashedginginstruments 5
Cashoutflows –12 –25 –29 –36 –21 –24
Cashinflows 19 33 33 33 16 16
Total of derivative financial assets 61 60 8 4 –3 –5 –8Total of derivative financial liabilities and assets –109 –16 17 3 –15 –22 –92
(26) FINANCIAL RISK MANAGEMENTWemanagemarketrisks(includingforeigncurrencyexchangeraterisk,interestraterisk,andequitypricerisk),creditrisk,andliquidityriskonaGroup-widebasisthroughourglobaltreasurydepartment.Ourriskmanagementandhedgingstrategyissetbyourtreasuryguidelineandotherinternal
guidelines,andissubjecttocontinuousinternalriskanalysis.Derivativefinancialinstrumentsareonlypurchasedtoreducerisksandnotforspeculation,whichisdefinedasenteringintoderivativeinstrumentswithoutacorrespondingunderlyingtransaction.
223Notes to the Consolidated Financial Statements

Inthefollowingsectionsweprovidedetailsonthemanagementofeachrespectivefinancialriskandourrelatedriskexposure.Inthesensitivityanalysesthatshowtheeffectsofhypotheticalchangesofrelevantriskvariablesonprofitorothercomprehensiveincome,wedeterminetheperiodiceffectsbyrelatingthehypotheticalchangesintheriskvariablestothebalanceoffinancialinstrumentsatthereportingdate.
Foreign Currency Exchange Rate Risk ManagementWecontinuallymonitorourexposuretocurrencyfluctuationrisksbasedonmonetaryitemsandforecastedtransactionsandpursueaGroup-widestrategytomanageforeigncurrencyexchangeraterisk,usingderivativefinancialinstruments,primarilyforeignexchangeforwardcontracts,asappropriate,withtheprimaryaimofreducingprofitorlossvolatility.
Currency Hedges Not Designated as Hedging InstrumentsTheforeignexchangeforwardcontractsweenterintotooffsetexposurerelatingtoforeign-currencydenominatedmonetaryassetsandliabilitiesarenotdesignatedasbeinginahedgeaccountingrelationship,becausetherealizedcurrencygainsandlossesfromtheunderlyingitemsarerecognizedinprofitorlossinthesameperiodsasthegainsandlossesfromthederivatives.
Currencyhedgesnotdesignatedashedginginstrumentsalsoincludeforeigncurrencyderivativesembeddedinnon-derivativehostcontractsthatareseparatedandaccountedforasderivativesaccordingtotherequirementsofIAS39.
Inaddition,during2014weheldforeignexchangeforwardcontractsandforeigncurrencyoptionstohedgethecashflowriskfromtheconsiderationpaidinU.S.dollarsfortheacquisitionofConcur.
Currency Hedges Designated as Hedging Instruments (Cash Flow Hedges)Weenterintoderivativefinancialinstruments,primarilyforeignexchangeforwardcontracts,tohedgesignificantforecastedcashflows(royalties)fromforeignsubsidiariesdenominatedinforeigncurrencieswithadefinedsetofhedgeratiosandahedgehorizonofupto12months.Specifically,weexcludetheinterestcomponentandonlydesignatethespotrateoftheforeignexchangeforwardcontractsasthehedginginstrumenttooffsetanticipatedcashflowsrelatingtothesubsidiarieswithsignificantoperations,includingtheUnitedStates,theUnitedKingdom,Japan,Switzerland,Brazil,andAustralia.Wegenerallyuseforeignexchangederivativesthathavematuritiesof12monthsorless,whichmayberolledovertoprovidecontinuouscoverageuntiltheapplicableroyaltiesarereceived.
In2014,netlossestotaling€30million(2013:netgainsof€57million;2012:netgainsof€17million)resultingfromthechangeinthecomponentofthederivativesdesignatedashedginginstrumentswererecordedinothercomprehensiveincome.
FortheyearsendedDecember31,2014and2013,nopreviouslyhighlyprobabletransactiondesignatedasahedgediteminaforeigncurrencycashflowhedgerelationshipceasedtobeprobable.Therefore,wedidnotdiscontinueanyofourcashflowhedgerelationships.Also,weidentifiednoineffectivenessinallyearsreported.In2014,wereclassifiednetlossesof€2million(2013:netgainsof€57million;2012:netlossesof€24million)fromothercomprehensiveincometoprofitorlossduetothehedgeditemsaffectingincome.Generally,thecashflowsofthehedgedforecastedtransactionsareexpectedtooccurandtoberecognizedinprofitorlossmonthlywithinatimeframeof12monthsfromthedateofthestatementoffinancialposition.Itisestimatedthat€8millionofthenetlossesrecognizedinothercomprehensiveincomein2014willbereclassifiedfromothercomprehensiveincometoprofitorlossin2015.
224 Consolidated Financial Statements IFRS

Foreign Currency Exchange Rate ExposureInlinewithourinternalriskreportingprocess,weusethecashflow-at-riskmethodtoquantifyourriskpositionswithregardtoourforecastedintercompanytransactionsandvalue-at-riskforourforeign-currencydenominatedfinancialinstruments.Inordernottoprovidetwodifferentmethodologies,wehaveoptedtodiscloseourriskexposurebasedonasensitivityanalysisconsideringthefollowing:–SincetheSAPGroup’sentitiesgenerallyoperateintheirfunctionalcurrencies,themajorityofournon-derivativemonetaryfinancialinstruments,suchascashandcashequivalents,tradereceivables,tradepayables,loanstoemployeesandthirdparties,bankliabilities,andotherfinancialliabilities,aredenominatedintherespectiveentities’functionalcurrency.Thus,aforeigncurrencyexchangerateriskinthesetransactionsisnearlynon-existent.Inexceptionalcasesandlimitedeconomicenvironments,operatingandfinancingtransactionsaredenominatedincurrenciesotherthanthefunctionalcurrency,leadingtoaforeigncurrencyexchangerateriskfortherelatedmonetaryinstruments.Wherewehedgeagainstcurrencyimpactsoncashflows,theseforeigncurrency-denominatedfinancialinstrumentsareeconomicallyconvertedintothefunctionalcurrencybytheuseofforwardexchangecontractsoroptions.Therefore,fluctuationsinforeigncurrencyexchangeratesneitherhaveasignificantimpactonprofitnoronothercomprehensive
incomewithregardtoournon-derivativemonetaryfinancialinstruments.
–Incomeorexpensesrecordedinconnectionwiththenon-derivativemonetaryfinancialinstrumentsdiscussedabovearemainlyrecognizedintherelevantentity’sfunctionalcurrency.Therefore,fluctuationsinforeigncurrencyexchangeratesneitherhaveasignificantimpactonprofitnoronothercomprehensiveincomeinthisregard.
–Ourfree-standingderivativesdesignedforhedgingforeigncurrencyexchangeraterisksalmostcompletelybalancethechangesinthefairvaluesofthehedgeditemattributabletoexchangeratemovementsintheConsolidatedIncomeStatementsinthesameperiod.Asaconsequence,thehedgeditemsandthehedginginstrumentsarenotexposedtoforeigncurrencyexchangeraterisks,andtherebyhavenoeffectonprofit.
Consequently,weareonlyexposedtosignificantforeigncurrencyexchangeratefluctuationswithregardto:–Derivativesheldwithinadesignatedcashflowhedgerelationship(excludingtheinterestelement,whichisnotpartoftheassignedcashflowhedgerelationships)
–Foreigncurrencyembeddedderivatives.
Aswedonothaveasignificantexposuretowardasinglecurrency,wediscloseoursensitivitytoourmajorforeigncurrencies(describedinNote(25))intotal.
Foreign Currency Sensitivity€millions
EffectsonOtherNon-OperatingExpense,Net
EffectsonOtherComprehensiveIncome
2014 2013 2012 2014 2013 2012
Derivativesheldwithinadesignatedcashflowhedgerelationship
Allmajorcurrencies–10% 74 57 60
Allmajorcurrencies+10% –74 –57 –60
Embeddedderivatives
Allcurrencies–10% 32 35 41
Swissfranc+20%/othercurrencies+10%(2013,2012:allcurrencies+10%)
–62 –35 –41
225Notes to the Consolidated Financial Statements

OurforeigncurrencyexposureasatDecember31(andifyear-endexposureisnotrepresentative,alsoouraverage/high/lowexposure)wasasfollows:
Foreign Currency Exposure €billions
2014 2013
Year-endexposuretowardsallourmajorcurrencies 1.0 0.9
Averageexposure 2.7 1.0
Highestexposure 7.7 1.1
Lowestexposure 1.0 0.9
During2014,oursensitivitytoforeigncurrencyexchangeratefluctuationsincreasedcomparedtotheyearendedDecember31,2013mainlyduetothehedgingtransactionsfortheacquisitionofConcur.However,duetoourhedgingstrategy,thiscomparativelyhighexposurewasonlyone-sided;therewasnosubstantialdownsiderisk.
Interest Rate Risk ManagementTheaimofourinterestrateriskmanagementistoreduceprofitorlossvolatilityandoptimizeourinterestresultbycreatingabalancedstructureoffixedandvariablecashflows.Wethereforemanageinterestraterisksbyaddinginterestrate-relatedderivativeinstrumentstoagivenportfolioofinvestmentsanddebtfinancing.
AsatDecember31,2014,acashflowinterestrateriskexistedwithregardtoourcashatbanksof€1.8billion,ourinvestingactivitiesinmoneymarketinstrumentswithvariableyieldsintheamountof€633millionandourvariableratefinancingtransactionsof€5.03billion.Afairvalueinterestrateriskarisesfromthefixedyieldtimedepositsaswellasthefixedratefinancingtransactionsheldatamortizedcost.
55%(2013:100%)ofourtotalinterest-bearingfinancialliabilitiesoutstandingasatDecember31,2014,hadafixedinterestratewhereas29%(2013:40%)ofourinterest-bearingcash,cashequivalents,timedeposits,andavailable-for-salefinancialassetshadafixedinterestrate.Derivatives Designated as Hedging Instruments (Fair Value Hedges)Themajorityofourinvestmentsarebasedonvariableratesand/orshortmaturitieswhilemostofourfinancingtransactionsarebasedonfixedratesandlongmaturities.Tomatchtheinterestrateriskfromourfinancingtransactionstoourinvestmentsweusereceiverinterestrateswapstoconvertcertainofourfixedratefinancialliabilitiestofloatingandbythismeanssecurethefairvalueoftheswappedfinancingtransactions.Thedesiredfix-floatingmixofournetdebtissetbytheTreasuryCommittee.Includinginterestrateswaps,30%(2013:44%)ofourtotalinterest-bearingfinancialliabilitiesoutstandingasatDecember31,2014,hadafixedinterestrate.
Noneofthefairvalueadjustmentfromthereceiverswaps,thebasisadjustmentontheunderlyinghedgeditemsheldinfairvaluehedgerelationships,andthedifferencebetweenthetworecognizedinfinancialincome,netismaterialinanyoftheyearspresented.
Interest Rate ExposureAsensitivityanalysisisprovidedtoshowtheimpactofourinterestrateriskexposureonprofitorlossandequityinaccordancewithIFRS7,consideringthefollowing:–Changesininterestratesonlyaffecttheaccountingfornon-derivativefixedratefinancialinstrumentsiftheyarerecognizedatfairvalue.Therefore,suchinterestratechangesdonotchangethecarryingamountsofournon-derivativefixedratefinancialliabilitiesasweaccountforthematamortizedcost.Investmentsinfixedratefinancialassetsclassifiedasavailable-for-salewerenotmaterialateachyear-endreported.Thus,wedonotconsideranyfixedrateinstrumentsintheequity-relatedsensitivitycalculation.
226 Consolidated Financial Statements IFRS

thebondsandprivateplacementsashedgeditems.However,changesinmarketinterestratesaffecttheamountofinterestpaymentsfromtheinterestrateswap.Asaconsequence,theyareincludedintheprofit-relatedsensitivitycalculation.
Duetotheunevendevelopmentexpectationsofinterestrates,webaseoursensitivityanalysesonayieldcurveupwardshiftof+100/+50basispointsfortheU.S.dollar/euroarea(2013,2012:+100bps)andayieldcurvedownwardshiftof–50basispointsforboththeU.S.dollar/euroarea(2013,2012:–20bps).–If,onDecember31,2014,2013,and2012,interestrateshadbeenhigher/lowerasdescribedabove,thiswouldnothavehadamaterialeffectonfinancialincome,netforourvariableinterestrateinvestmentsandwouldhavehadthefollowingeffectsonfinancialincome,net:
Interest-Rate Sensitivity€millions
EffectsonFinancialIncome,Net
2014 2013 2012
Derivativesheldwithinadesignatedfairvaluehedgerelationship
Interestrates+100bpsinU.S.dollararea/+50bpsineuroarea(2013,2012:+100bpsinU.S.dollar/euroarea)
–116 –24 0
Interestrates–50bpsinU.S.dollar/euroarea(2013,2012:–20bpsinU.S.dollar/euroarea)
70 5 0
Variableratefinancing
Interestrates+50bpsineuroarea –65 0 0
Interestrates–50bpsineuroarea 65 0 0
–Incomeorexpensesrecordedinconnectionwithnon-derivativefinancialinstrumentswithvariableinterestratesaresubjecttointerestrateriskiftheyarenothedgeditemsinaneffectivehedgerelationship.Thus,wetakeintoconsiderationinterestratechangesrelatingtoourvariableratefinancingandourinvestmentsinmoneymarketinstrumentsintheprofit-relatedsensitivitycalculation.
–Thedesignationofinterestratereceiverswapsinafairvaluehedgerelationshipleadstointerestratechangesaffectingfinancialincome,net.Thefairvaluemovementsrelatedtotheinterestrateswapsarenotreflectedinthesensitivitycalculation,astheyoffsetthefixedinterestratepaymentsfor
227Notes to the Consolidated Financial Statements

OurinterestrateexposureasatDecember31(andifyear-endexposureisnotrepresentative,alsoouraverage/high/lowexposure)wasasfollows:
Interest-Rate Risk Exposure€billion
2014 2013
Year-End Average High Low Year-End Average High Low
Fairvalueinterest-raterisk
Frominvestments 0.04 0.05 0.08 0.04 0.04 0.06 0.13 0.04
Cashflowinterestraterisk
Frominvestments(incl.cash) 2.45 2.48 2.74 2.13 1.73 2.23 2.71 1.73
Fromfinancing 5.03 0.75 5.03 0.00 0.00 0.31 1.00 0.00
Frominterestrateswaps 2.55 2.44 2.55 2.39 2.39 0.60 2.40 0.00
Equity Price Risk ManagementOurinvestmentsinequityinstrumentswithquotedmarketpricesinactivemarkets(2014:€209million;2013:€83million)aremonitoredbasedonthecurrentmarketvaluethatisaffectedbythefluctuationsinthevolatilestockmarketsworldwide.Anassumed20%increase(decrease)inequitypricesasatDecember31,2014(2013),wouldnothaveamaterialimpactonthevalueofourinvestmentsinmarketableequitysecuritiesandthecorrespondingentriesinothercomprehensiveincome.
Weareexposedtoequitypriceriskwithregardtoourshare-basedpayments.Inordertoreduceresultingprofitorlossvolatility,wehedgecertaincashflowexposuresassociatedwiththeseplansthroughthepurchaseofderivativeinstruments,butdonotestablishadesignatedhedgerelationship.Inoursensitivityanalysisweincludetheunderlyingshare-basedpaymentsandthehedginginstruments.Thus,webasethecalculationonournetexposuretoequitypricesaswebelievetakingonlythederivativeinstrumentintoaccountwouldnotproperlyreflectourequitypriceriskexposure.Anassumed20%increase(decrease)inequitypricesasatDecember31,
2014,wouldhaveincreased(decreased)ourshare-basedpaymentexpensesby€158million(€80million)(2013:increasedby€126million(decreasedby€90million);2012:increasedby€139million(decreasedby€117million)).
Credit Risk ManagementTomitigatethecreditriskfromourinvestingactivitiesandderivativefinancialassets,weconductallouractivitiesonlywithapprovedmajorfinancialinstitutionsandissuersthatcarryhighexternalratings,asrequiredbyourinternaltreasuryguideline.Amongitsstipulations,theguidelinerequiresthatweinvestonlyinassetsfromissuerswithaminimumratingofatleast“BBBflat”.Weonlymakeinvestmentsinissuerswithalowerratinginexceptionalcases.Suchinvestmentswerenotmaterialin2014.TheweightedaverageratingofourfinancialassetsisintherangeA+toA.Wepursueapolicyofcautiousinvestmentscharacterizedbypredominantlycurrentinvestments,standardinvestmentinstruments,aswellasawideportfoliodiversificationbydoingbusinesswithavarietyofcounterparties.
228 Consolidated Financial Statements IFRS

Tofurtherreduceourcreditrisk,werequirecollateralforcertaininvestmentsinthefullamountoftheinvestmentvolumewhichwewouldbeallowedtomakeuseofinthecaseofdefaultofthecounterpartytotheinvestment.Assuchcollateral,weonlyacceptbondswithatleastinvestmentgraderatinglevel.
Inaddition,theconcentrationofcreditriskthatexistswhencounterpartiesareinvolvedinsimilaractivitiesbyinstrument,sector,orgeographicareaisfurthermitigatedbydiversificationofcounterpartiesthroughouttheworldandadherencetoaninternallimitsystemforeachcounterparty.Thisinternallimitsystemstipulatesthatthebusinessvolumewithindividualcounterpartiesisrestrictedtoadefinedlimit,whichdependsonthelowestofficiallong-termcreditratingavailablebyatleastoneofthemajorratingagencies,theTier1capitaloftherespectivefinancialinstitution,orparticipationintheGermanDepositors’GuaranteeFundorsimilarprotectionschemes.Wecontinuouslymonitorstrictcompliancewiththesecounterpartylimits.Asthepremiumforcreditdefaultswapsmainlydependsonmarketparticipants’assessmentsofthecreditworthinessofadebtor,wealsocloselyobservethedevelopmentofcreditdefaultswapspreadsinthemarkettoevaluateprobableriskdevelopmentstotimelyreacttochangesiftheseshouldmanifest.
Thedefaultriskofourtradereceivablesismanagedseparately,mainlybasedonassessingthecreditworthinessofcustomersthroughexternalratingsandourhistoricalexperiencewithrespectivecustomers.Outstandingreceivablesarecontinuouslymonitoredlocally.Formoreinformation,seeNote(3).Theimpactofdefaultonourtradereceivablesfromindividualcustomersismitigatedbyourlargecustomerbaseanditsdistributionacrossmanydifferentindustries,companysizes,andcountriesworldwide.Formoreinformationaboutourtradereceivables,seeNote(14).Forinformationaboutthemaximumexposuretocreditrisk,seeNote(25).
Liquidity Risk ManagementOurliquidityismanagedbyourglobaltreasurydepartmentwiththeprimaryaimofmaintainingliquidityatalevelthatisadequatetomeetourfinancialobligations.
Ourprimarysourceofliquidityisfundsgeneratedfromourbusinessoperations,whichhavehistoricallybeentheprimarysourceoftheliquidfundsneededtomaintainourinvestingandfinancingstrategy.Themajorityofoursubsidiariespooltheircashsurplustoourglobaltreasurydepartment,whichthenarrangestofundothersubsidiaries’requirementsorinvestanynetsurplusinthemarket,seekingtooptimizeyields,whileensuringliquidity,byinvestingonlywithcounterpartiesandissuersofhighcreditquality,asexplainedabove.Hence,highlevelsofliquidassetsandmarketablesecuritiesprovideastrategicreserve,helpingkeepSAPflexible,sound,andindependent.
Apartfromeffectiveworkingcapitalandcashmanagement,wehavereducedtheliquidityriskinherentinmanagingourday-to-dayoperationsandmeetingourfinancingresponsibilitiesbyarranginganadequatevolumeofavailablecreditfacilitieswithvariousfinancialinstitutionsonwhichwecandrawifnecessary.
Inordertoretainhighfinancialflexibility,onNovember13,2013,SAPSEenteredintoa€2.0billionsyndicatedcreditfacilityagreementwithaninitialtermoffiveyearsplustwoone-yearextensionoptions.In2014,theoriginaltermofthisfacilitywasextendedforanadditionalperiodofoneyeartoNovember2019.Theuseofthefacilityisnotrestrictedbyanyfinancialcovenants.BorrowingsunderthefacilitybearinterestofEURIBORorLIBORfortherespectivecurrencyplusamarginof22.5basispoints.Wearealsorequiredtopayacommitmentfeeof7.88basispointsperannumontheunusedavailablecredit.Wehaveneverdrawnonthefacility.
Additionally,asatDecember31,2014,and2013,SAPSEhadavailablelinesofcredittotaling€471millionand€487million,respectively.AsatDecember31,2014,and2013,therewerenoborrowingsoutstandingundertheselinesofcredit.Asat
229Notes to the Consolidated Financial Statements
December31,2014,and2013,certainsubsidiarieshadlinesofcreditavailablethatallowedthemtoborrowinlocalcurrenciesatprevailinginterestratesupto€54millionand€36million,respectively.BorrowingsoutstandingunderthesecreditfacilitiesasatDecember31,2014wereimmaterial,andtherewerenoborrowingsfromanyofourforeignsubsidiariesasatDecember31,2013.(27) ADDITIONAL FAIR VALUE DISCLOSURES ON FINANCIAL INSTRUMENTS
Fair Value of Financial InstrumentsWeusevarioustypesoffinancialinstrumentintheordinarycourseofbusiness,whicharegroupedintothefollowingcategories:loansandreceivables(L&R),available-for-sale(AFS),held-for-trading(HFT),andamortizedcost(AC).Forthosefinancialinstrumentsmeasuredatfairvalueorforwhichfairvaluemustbedisclosed,wehavecategorizedthefinancialinstrumentsintoathree-levelfairvaluehierarchydependingontheinputsusedtodeterminefairvalueandtheirsignificanceforthevaluationtechniques.Wherefinancialassetsandliabilitiesareshownasmeasuredatfairvalue,thisisdoneonarecurringbasis.
ThetablebelowshowsthecarryingamountsandfairvaluesoffinancialassetsandliabilitiesbycategoryoffinancialinstrumentaswellasbycategoryinIAS39andtheallocationtothefairvaluehierarchyasmandatedbyIFRS13asatDecember31.
Fair Values of Financial Instruments and Classification Within the Fair Value Hierarchy€millions
2014
Carrying Amount MeasurementCategories FairValue
CategoryAtAmortized
CostAtFairValue Level1 Level2 Level3 Total
AssetsCashandcashequivalents1) L&R 3,328 3,328
Tradeandotherreceivables 4,430
Tradereceivables1) L&R 4,242 4,242
Otherreceivables2) – 188
Otherfinancialassets 1,699
Available-for-salefinancialassets
Debtinvestments AFS 40 40 40 40
Equityinvestments AFS 597 597 108 101 388 597
Investmentsinassociates2) – 49
Loansandotherfinancialreceivables
Financialinstrumentsrelatedtoemployeebenefitplans2) – 136
Otherloansandotherfinancialreceivables L&R 324 324 324 324
Derivativeassets
Designatedashedginginstrument
FXforwardcontracts – 10 10 10 10
Interestrateswaps – 77 77 77 77
Notdesignatedashedginginstrument
FXforwardcontracts HFT 411 411 411 411
Calloptionsforshare-basedpayments HFT 43 43 43 43
Calloptiononequityshares HFT 13 13 13 13
LiabilitiesTradeandotherpayables –1,061
Tradepayables1) AC –756 –756
Otherpayables2) – –305
Financialliabilities –11,542
Non-derivativefinancialliabilities
Loans AC –4,261 –4,261 –4,261 –4,261
Bonds AC –4,628 –4,628 –4,810 –4,810
Privateplacements AC –2,195 –2,195 –2,301 –2,301
Othernon-derivativefinancialliabilities AC –124 –124 –124 –124
Derivatives
Designatedashedginginstrument
FXforwardcontracts – –22 –22 –22 –22
Interestrateswaps – –1 –1 –1 –1
Notdesignatedashedginginstrument
FXforwardcontracts HFT –310 –310 –310 –310
Total financial instruments, net –3,146 –4,072 858 –4,662 –6,054 400 –10,315
1Wedonotdisclosethefairvalueforcashandcashequivalents,tradereceivables,andaccountspayableastheircarryingamountsareareasonableapproximationoftheirfairvalues.
2Sincethelineitemstradereceivables,tradepayables,andotherfinancialassetscontainbothfinancialandnon-financialassetsorliabilities(suchasothertaxesoradvancepayments),thecarryingamountsofnon-financialassetsorliabilitiesareshowntoallowareconciliationtothecorrespondinglineitemsintheConsolidatedStatementsofFinancialPosition.
230 Consolidated Financial Statements IFRS

Fair Values of Financial Instruments and Classification Within the Fair Value Hierarchy€millions
2014
Carrying Amount MeasurementCategories FairValue
CategoryAtAmortized
CostAtFairValue Level1 Level2 Level3 Total
AssetsCashandcashequivalents1) L&R 3,328 3,328
Tradeandotherreceivables 4,430
Tradereceivables1) L&R 4,242 4,242
Otherreceivables2) – 188
Otherfinancialassets 1,699
Available-for-salefinancialassets
Debtinvestments AFS 40 40 40 40
Equityinvestments AFS 597 597 108 101 388 597
Investmentsinassociates2) – 49
Loansandotherfinancialreceivables
Financialinstrumentsrelatedtoemployeebenefitplans2) – 136
Otherloansandotherfinancialreceivables L&R 324 324 324 324
Derivativeassets
Designatedashedginginstrument
FXforwardcontracts – 10 10 10 10
Interestrateswaps – 77 77 77 77
Notdesignatedashedginginstrument
FXforwardcontracts HFT 411 411 411 411
Calloptionsforshare-basedpayments HFT 43 43 43 43
Calloptiononequityshares HFT 13 13 13 13
LiabilitiesTradeandotherpayables –1,061
Tradepayables1) AC –756 –756
Otherpayables2) – –305
Financialliabilities –11,542
Non-derivativefinancialliabilities
Loans AC –4,261 –4,261 –4,261 –4,261
Bonds AC –4,628 –4,628 –4,810 –4,810
Privateplacements AC –2,195 –2,195 –2,301 –2,301
Othernon-derivativefinancialliabilities AC –124 –124 –124 –124
Derivatives
Designatedashedginginstrument
FXforwardcontracts – –22 –22 –22 –22
Interestrateswaps – –1 –1 –1 –1
Notdesignatedashedginginstrument
FXforwardcontracts HFT –310 –310 –310 –310
Total financial instruments, net –3,146 –4,072 858 –4,662 –6,054 400 –10,315
231Notes to the Consolidated Financial Statements

Fair Values of Financial Instruments and Classification Within the Fair Value Hierarchy€millions
2013
Carrying Amount MeasurementCategories FairValue
CategoryAtAmortized
CostAtFairValue Level1 Level2 Level3 Total
AssetsCashandcashequivalents1) L&R 2,748 2,748
Tradeandotherreceivables 3,963
Tradereceivables1) L&R 3,816 3,816
Otherreceivables2) – 147
Otherfinancialassets 858
Available-for-salefinancialassets
Debtinvestments AFS 38 38 38 38
Equityinvestments AFS 322 322 52 31 239 322
Investmentsinassociates2) – 36
Loansandotherfinancialreceivables
Financialinstrumentsrelatedtoemployeebenefitplans2) – 119
Otherloansandotherfinancialreceivables L&R 214 214 214 214
Derivativeassets
Designatedashedginginstrument
FXforwardcontracts – 30 30 30 30
Interestrateswaps – 5 5 5 5
Notdesignatedashedginginstrument
FXforwardcontracts HFT 26 26 26 26
Calloptionsforshare-basedpayments HFT 58 58 58 58
Calloptiononequityshares HFT 10 10 10 10
LiabilitiesTradeandotherpayables –895
Tradepayables1) AC –640 –640
Otherpayables2) – –255
Financialliabilities –4,506
Non-derivativefinancialliabilities
Bonds AC –2,291 –2,291 –2,340 –2,340
Privateplacements AC –1,977 –1,977 –2,031 –2,031
Othernon-derivativefinancialliabilities AC –68 –68 –68 –68
Derivatives
Designatedashedginginstrument
FXforwardcontracts – –3 –3 –3 –3
Interestrateswaps – –23 –23 –23 –23
Notdesignatedashedginginstrument
FXforwardcontracts HFT –144 –144 –144 –144
Total financial instruments, net 2,168 1,802 319 –2,250 –1,905 249 –3,906
1Wedonotdisclosethefairvalueforcashandcashequivalents,tradereceivables,andaccountspayableastheircarryingamountsareareasonableapproximationoftheirfairvalues.
2Sincethelineitemstradereceivables,tradepayables,andotherfinancialassetscontainbothfinancialandnon-financialassetsorliabilities(suchasothertaxesoradvancepayments),thecarryingamountsofnon-financialassetsorliabilitiesareshowntoallowareconciliationtothecorrespondinglineitemsintheConsolidatedStatementsofFinancialPosition.
232 Consolidated Financial Statements IFRS

Fair Values of Financial Instruments and Classification Within the Fair Value Hierarchy€millions
2013
Carrying Amount MeasurementCategories FairValue
CategoryAtAmortized
CostAtFairValue Level1 Level2 Level3 Total
AssetsCashandcashequivalents1) L&R 2,748 2,748
Tradeandotherreceivables 3,963
Tradereceivables1) L&R 3,816 3,816
Otherreceivables2) – 147
Otherfinancialassets 858
Available-for-salefinancialassets
Debtinvestments AFS 38 38 38 38
Equityinvestments AFS 322 322 52 31 239 322
Investmentsinassociates2) – 36
Loansandotherfinancialreceivables
Financialinstrumentsrelatedtoemployeebenefitplans2) – 119
Otherloansandotherfinancialreceivables L&R 214 214 214 214
Derivativeassets
Designatedashedginginstrument
FXforwardcontracts – 30 30 30 30
Interestrateswaps – 5 5 5 5
Notdesignatedashedginginstrument
FXforwardcontracts HFT 26 26 26 26
Calloptionsforshare-basedpayments HFT 58 58 58 58
Calloptiononequityshares HFT 10 10 10 10
LiabilitiesTradeandotherpayables –895
Tradepayables1) AC –640 –640
Otherpayables2) – –255
Financialliabilities –4,506
Non-derivativefinancialliabilities
Bonds AC –2,291 –2,291 –2,340 –2,340
Privateplacements AC –1,977 –1,977 –2,031 –2,031
Othernon-derivativefinancialliabilities AC –68 –68 –68 –68
Derivatives
Designatedashedginginstrument
FXforwardcontracts – –3 –3 –3 –3
Interestrateswaps – –23 –23 –23 –23
Notdesignatedashedginginstrument
FXforwardcontracts HFT –144 –144 –144 –144
Total financial instruments, net 2,168 1,802 319 –2,250 –1,905 249 –3,906
233Notes to the Consolidated Financial Statements

Fair Values of Financial Instruments Classified According IAS 39 €millions
2014
CategoryCarrying Amount
AtAmortizedCost
AtFairValue OutofscopeofIFRS7
Financial assets Atfairvaluethroughprofitorloss HFT 467 467
Available-for-sale AFS 637 637
Loansandreceivables L&R 7,893 7,893
Financial liabilities Atfairvaluethroughprofitorloss HFT –310 –310
Atamortizedcost AC –11,965 –11,965
Outside scope of IAS 39Financialinstrumentsrelatedtoemployeebenefitplans 136 136
Investmentsinassociates 49 49
Otherreceivables 188 188
Otherpayables –305 –305
Derivativesdesignatedashedginginstrument 64 64
Total financial instruments, net –3,146 –4,072 858 68
234 Consolidated Financial Statements IFRS

Fair Values of Financial Instruments Classified According IAS 39 €millions
2013
CategoryCarrying Amount
AtAmortizedCost
AtFairValue OutofscopeofIFRS7
Financial assets Atfairvaluethroughprofitorloss HFT 94 94
Available-for-sale AFS 360 360
Loansandreceivables L&R 6,778 6,778
Financial liabilities Atfairvaluethroughprofitorloss HFT –144 –144
Atamortizedcost AC –4,976 –4,976
Outside scope of IAS 39Financialinstrumentsrelatedtoemployeebenefitplans 119 119
Investmentsinassociates 36 36
Otherreceivables 147 147
Otherpayables –255 –255
Derivativesdesignatedashedginginstrument 9 9
Total financial instruments, net 2,168 1,802 319 47
235Notes to the Consolidated Financial Statements
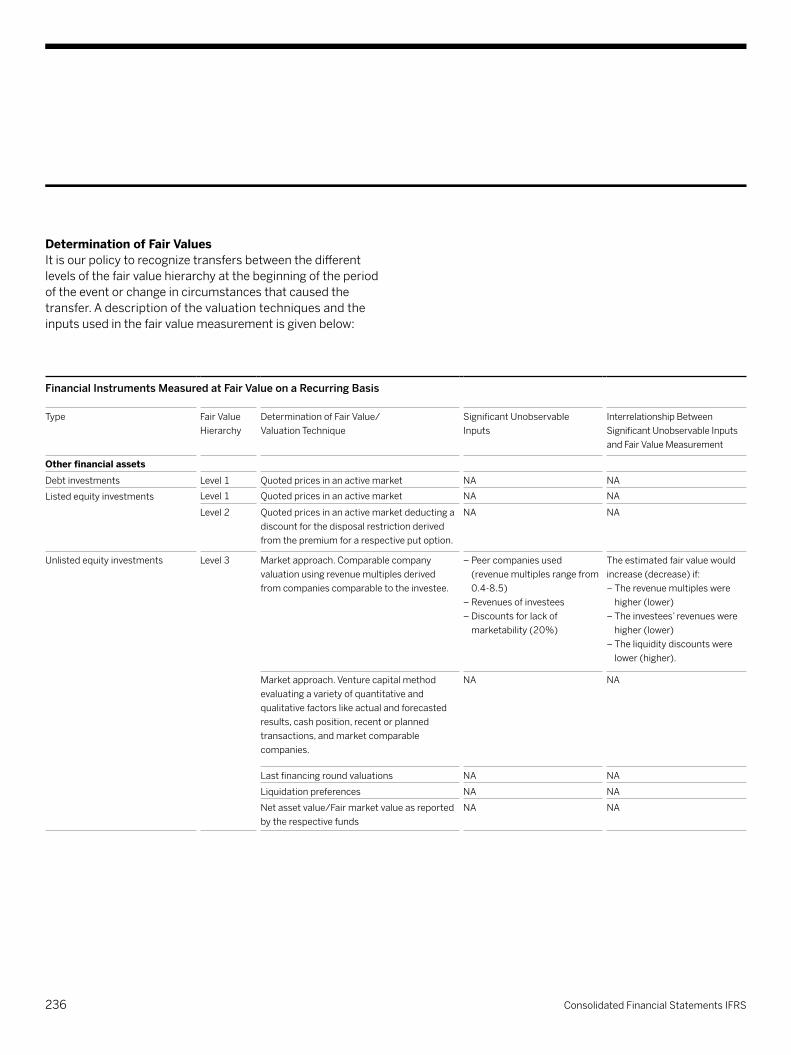
Determination of Fair ValuesItisourpolicytorecognizetransfersbetweenthedifferentlevelsofthefairvaluehierarchyatthebeginningoftheperiodoftheeventorchangeincircumstancesthatcausedthetransfer.Adescriptionofthevaluationtechniquesandtheinputsusedinthefairvaluemeasurementisgivenbelow:
Financial Instruments Measured at Fair Value on a Recurring Basis (continued)
Type FairValueHierarchy
DeterminationofFairValue/ValuationTechnique
SignificantUnobservableInputs
InterrelationshipBetweenSignificantUnobservableInputsandFairValueMeasurement
Other financial assets
Debtinvestments Level1 Quotedpricesinanactivemarket NA NA
Listedequityinvestments Level1 Quotedpricesinanactivemarket NA NA
Level2 Quotedpricesinanactivemarketdeductingadiscountforthedisposalrestrictionderivedfromthepremiumforarespectiveputoption.
NA NA
Unlistedequityinvestments Level3 Marketapproach.Comparablecompanyvaluationusingrevenuemultiplesderivedfromcompaniescomparabletotheinvestee.
–Peercompaniesused(revenuemultiplesrangefrom0.4-8.5)
–Revenuesofinvestees–Discountsforlackofmarketability(20%)
Theestimatedfairvaluewouldincrease(decrease)if:–Therevenuemultipleswerehigher(lower)
–Theinvestees’revenueswerehigher(lower)
–Theliquiditydiscountswerelower(higher).
Marketapproach.Venturecapitalmethodevaluatingavarietyofquantitativeandqualitativefactorslikeactualandforecastedresults,cashposition,recentorplannedtransactions,andmarketcomparablecompanies.
NA NA
Lastfinancingroundvaluations NA NA
Liquidationpreferences NA NA
Netassetvalue/Fairmarketvalueasreportedbytherespectivefunds
NA NA
236 Consolidated Financial Statements IFRS

Financial Instruments Measured at Fair Value on a Recurring Basis (continued)
Type FairValueHierarchy
DeterminationofFairValue/ValuationTechnique
SignificantUnobservableInputs
InterrelationshipBetweenSignificantUnobservableInputsandFairValueMeasurement
Other financial assets(continued)
Calloptionsforshare-basedpaymentsplans
Level2 Monte-CarloModel.Calculatedconsideringrisk-freeinterestrates,theremainingtermofthederivatives,thedividendyields,thestockprice,andthevolatilityofourshare.
NA NA
Calloptiononequityshares Level3 Marketapproach.CompanyvaluationusingEBITDAmultiplesbasedonactualresultsderivedfromtheinvestee.
–EBITDAmultiplesused–EBITDAoftheinvestee
Theestimatedfairvaluewouldincrease(decrease)if:–TheEBITDAmultipleswerehigher(lower)
–Theinvestees’EBITDAwerehigher(lower)
Other financial assets/ Financial liabilities
Foreignexchange(FX)forwardcontracts
Level2 DiscountedcashflowusingPar-Method.Expectedfuturecashflowsbasedonforwardexchangeratesarediscountedovertherespectiveremainingtermofthecontractsusingtherespectivedepositinterestratesandspotrates.
NA NA
Interestrateswaps Level2 Discountedcashflow.Expectedfuturecashflowsareestimatedbasedonforwardinterestratesfromobservableyieldcurvesandcontractinterestrates,discountedataratethatreflectsthecreditriskofthecounterparty.
NA NA
237Notes to the Consolidated Financial Statements

Forothernon-derivativefinancialassets/liabilitiesandvariableratefinancialdebt,itisassumedthattheircarryingvaluereasonablyapproximatestheirfairvalues.
Transfers Between Levels 1 and 2Transfersofavailable-for-saleequityinvestmentsfromLevel2toLevel1whichoccurredbecausedisposalrestrictionslapsedanddeductingadiscountforsuchrestrictionwasnolongernecessarywerenotmaterialinallyearspresented,whiletransfersfromLevel1toLevel2didnotoccuratall.
Financial Instruments Not Measured at Fair Value
Type FairValueHierarchy
DeterminationofFairValue/ValuationTechnique
Financial liabilitiesFixedratebonds(financialliabilities)
Level1 Quotedpricesinanactivemarket
Fixedrateprivateplacements/loans(financialliabilities)
Level2 Discountedcashflows.Futurecashoutflowsforfixedinterestandprincipalarediscountedoverthetermoftherespectivecontractsusingthemarketinterestratesasofthereportingdate.
238 Consolidated Financial Statements IFRS

Level 3 DisclosuresThefollowingtableshowsthereconciliationfromtheopeningtotheclosingbalancesforourunlistedequityinvestmentsandcalloptionsonequitysharesclassifiedasLevel3fairvalues:
Reconciliation of Level 3 Fair Values€millions
2014 2013
January1, 239 0
Transfers
intoLevel3 0 162
outofLevel3 –29 –30
Purchases 141 79
Sales –36 –16
Gains/losses
includedinfinancialincome,netinprofitandloss
27 7
includedinavailable-for-salefinancialassetsinothercomprehensiveincome
21
46
includedinexchangedifferencesinothercomprehensiveincome
37 –9
December 31, 400 239
Changingtheunobservableinputstoreflectreasonablypossiblealternativeassumptionswouldnothaveamaterialimpactonthefairvaluesofourunlistedequityinvestmentsheldasavailable-for-saleasofthereportingdate.
(28) SHARE-BASED PAYMENTS SAPhasgrantedawardsundervariouscash-settledandequity-settledshare-basedpaymentstoitsdirectorsandemployees.Mostoftheseawardsaredescribedindetailbelow.SAPhasothershare-basedpayments,whichare,individuallyandinaggregate,immaterialtoourConsolidatedFinancialStatements.
a) Cash-Settled Share-Based PaymentsSAP’scash-settledshare-basedpaymentsincludethefollowingprograms:EmployeeParticipationPlan(EPP)andLong-TermIncentivePlan(LTIPlanfortheGlobalManagingBoard)2015,StockOptionPlan2010(SOP2010(2010–2014tranches)),RestrictedStockUnitPlan(RSU(2013–2014tranches)),acquiredSFSFRights(formerSuccessFactorsawardsassumedinconnectionwiththeSuccessFactorsacquisitionin2012),acquiredAribaRights(formerAribaawardsassumedinconnectionwiththeAribaacquisitionin2012).
239Notes to the Consolidated Financial Statements

AsatDecember31,2014,thevaluationofouroutstandingcash-settledplanswasbasedonthefollowingparametersandassumptions:
Fair Value and Parameters Used at Year-End 2014 for Cash-Settled Plans
LTIPlan2015(2012–2014
tranches)
EPP2015(2014tranche)
SOP2010(2010–2014
tranches)
RSU(2013–2014
tranches)
SFSFRights AribaRights
Weighted average fair value as at December 31, 2014
€56.40 €58.26 €10.17 €54.09 €32.95 €37.06
Information how fair value was measured at measurement date
Optionpricingmodelused Other1) Other1) Monte-Carlo Other1) NA NA
Shareprice €58.26 €57.37 NA NA
Risk-freeinterestrate(dependingonmaturity) –0.1% NA –0.1%to0.02%
–0.1%to–0.01%
NA NA
ExpectedvolatilitySAPshares NA NA 19.9%to23.4%
NA NA NA
ExpecteddividendyieldSAPshares 1.74% NA 1.74% 1.76% NA NA
Weighted average remaining life of options outstanding as at December 31, 2014 (in years)
1.8 0.1 3.5 1.1 0.5 0.8
1) Fortheseawardsthefairvalueiscalculatedbysubtractingthenetpresentvalueofexpectedfuturedividendpayments,ifany,untilmaturityoftherespectiveawardfromtheprevailingsharepriceasofthevaluationdate.
240 Consolidated Financial Statements IFRS

AsatDecember31,2013,thevaluationofouroutstandingcash-settledplanswasbasedonthefollowingparametersandassumptions:
Fair Value and Parameters Used at Year-End 2013 for Cash-Settled Plans
LTIPlan2015(2012/2013tranches)
EPP2015(2013tranche)
SOP2010(2010–2013
tranches)
RSU(2013tranche)
SFSFRights AribaRights
Weighted average fair value as at December 31, 2013
€59.80 €62.31 €15.71 €61.55 €29.00 €32.63
Information how fair value was measured at measurement date
Optionpricingmodelused Other1) Other1) Monte-Carlo Other1) NA NA
Shareprice €62.31 €63.19 NA NA
Risk-freeinterestrate(dependingonmaturity) 0.26%to0.46%
NA 0.08%to0.92%
0.01%to0.44%
NA NA
ExpectedvolatilitySAPshares NA NA 21.3%to27.6%
NA NA NA
ExpecteddividendyieldSAPshares 1.67% NA 1.67% 1.65% NA NA
Weighted average remaining life of options outstanding as at December 31, 2013 (in years)
2.4 0.1 3.3 1.2 0.8 0.7
1)Fortheseawardsthefairvalueiscalculatedbysubtractingthenetpresentvalueofexpectedfuturedividendpayments,ifany,untilmaturityoftherespectiveawardfromtheprevailingsharepriceasofthevaluationdate.
ExpectedvolatilityoftheSAPsharepriceisbasedonablendofimpliedvolatilityfromtradedoptionswithcorrespondinglifetimesandexercisepricesaswellashistoricalvolatilitywiththesameexpectedlifeastheoptionsgranted.
Expectedremaininglifeoftheoptionsreflectsboththecontractualtermandtheexpected,orhistorical,exercisebehavior.Therisk-freeinterestrateisderivedfromGermangovernmentbondswithasimilarduration.Dividendyieldisbasedonexpectationsoffuturedividends.
241Notes to the Consolidated Financial Statements

Thenumberofawardsunderourcash-settledplansdevelopedasfollowsintheyearsendedDecember31,2014,and2013:
Changes in Numbers of Outstanding Awards Under Our Cash-Settled Plansthousands
LTIPlan2015(2012–2014
tranches)
EPP2015(2012–2014
tranches)
RSU(2013–2014
tranches)
SOP2010(2010–2014
tranches)
SFSFRights AribaRights
Outstandingasat12/31/2012 466 3,502 NA 17,427 2,403 2,360Grantedin2013 311 2,087 1,559 7,421 NA NA
AdjustmentbaseduponKPItargetachievementin2013
–18 –139 0 NA NA NA
Exercisedin2013 –196 –3,502 0 –2,215 –797 –1,362Forfeitedin2013 –48 –103 –96 –967 –531 –90
Outstanding as at 12/31/2013 515 1,845 1,463 21,666 1,075 908Grantedin2014 242 2,177 1,256 8,965 NA NA
AdjustmentbaseduponKPItargetachievementin2014
–41 –458 –88 NA NA NA
Exercisedin2014 –70 –1,845 –738 –2,730 –520 –737Forfeitedin2014 –55 –104 –301 –1,619 –224 –45
Outstanding as at 12/31/2014 591 1,615 1,592 26,282 331 126
Outstanding awards exercisable as at12/31/2013 0 0 0 1,609 0 012/31/2014 0 0 0 3,313 0 0
Total carrying amount (in € millions) of liabilities as at
12/31/2013 41 115 32 183 20 2412/31/2014 45 94 55 167 8 5
Total intrinsic value of vested awards (in € millions) as at
12/31/2013 43 115 0 37 0 012/31/2014 38 94 0 49 0 0
Weighted average share price (in €) for share options exercised in
2013 54.96 59.90 NA 55.47 30.12 33.892014 54.96 57.48 56.62 56.65 30.10 33.86
Total expense (in € millions) recognized in2012 53 216 NA 74 38 212013 –11 118 34 83 10 212014 13 82 57 29 1 4
242 Consolidated Financial Statements IFRS

a.1) Employee Participation Plan (EPP) and Long-Term Incentive Plan (LTI Plan) 2015 SAPimplementedtwonewshare-basedpaymentsin2012:anEmployeeParticipationPlan(EPP)2015foremployeesandaLong-TermIncentive(LTI)Plan2015formembersoftheGlobalManagingBoard.
TheplansarefocusedonSAP’ssharepriceandtheachievementoftwofinancialkeyperformanceindicators(KPIs):non-IFRStotalrevenueandnon-IFRSoperatingprofit,whicharederivedfromtheCompany’s2015financialKPIs.Undertheseplans,virtualshares,calledrestrictedshareunits(RSUs),aregrantedtoparticipants.ParticipantsarepaidoutincashbasedonthenumberofRSUsthatvest.
TheRSUsweregrantedandallocatedatthebeginningofeachyearthrough2015,withEPP2015RSUssubjecttoannualExecutiveBoardapproval.ParticipantsintheLTIPlan2015havealreadybeengrantedabudgetfortheyears2012to2015(2014to2015fornewplanparticipantsin2014).AllparticipantsintheLTIPlan2015aremembersoftheGlobalManagingBoard.
TheRSUallocationprocesswilltakeplaceatthebeginningofeachyearbasedonSAP’ssharepriceafterthepublicationofitspreliminaryannualresultsforthelastfinancialyearpriortotheperformanceperiod.
Attheendofthegivenyear,thenumberofRSUsthatfinallyvestwithplanparticipantsdependsonSAP’sactualperformanceforthegivenyear,andmightbehigherorlowerthanthenumberofRSUsoriginallygranted.IfperformanceagainstbothKPItargetsreachesatleastthedefined60%(80%for2012and2013tranches)threshold,theRSUsvest.Dependingonperformance,thevestingcanreachamaximumof150%ofthebudgetedamount.IfperformanceagainsteitherorbothofthoseKPItargetsdoesnotreachthedefinedthresholdof60%(80%for2012and2013tranches),noRSUsvestandRSUsgrantedforthatyearwillbeforfeited.Theadjustmenttothethresholdofthoseperformanceindicatorswasmadetoreflectourupdatedexpectationsduetotheacceleratedshifttothecloud.Fortheyear2014,theRSUsgrantedatthebeginningoftheyearvestedwith77.89%(2013:92.97%)achievementoftheKPItargets.
UndertheEPP2015,theRSUsarepaidoutinthefirstquarteroftheyearaftertheone-yearperformanceperiod,whereastheRSUsformembersoftheGlobalManagingBoardundertheLTIPlan2015aresubjecttoathree-year-holdingperiodbeforepayout,whichoccursstartingin2016.
Theplansincludea“look-back”provision,duetothefactthattheseplansarebasedonreachingcertainKPItargetsin2015.Iftheoverallachievementin2015ishigherorlowerthanrepresentedbythenumberofRSUsvestedfrom2012to2014,thenumberofRSUsgrantedin2015canincreaseordecreaseaccordingly.However,RSUsthatwerealreadyfullyvestedinprioryearscannotbeforfeited.FortheEPP,theapplicationofthe“look-back”-provisionissubjecttoapprovalbytheExecutiveBoardin2015.
ThefinalfinancialeffectofeachtrancheoftheEPP2015andtheLTIPlan2015willdependonthenumberofvestedRSUsandtheSAPshareprice,whichissetdirectlyaftertheannouncementofthepreliminaryfourthquarterandfull-yearresultsforthelastfinancialyearundertheEPP2015(oftherespectivethree-yearholdingperiodundertheLTIPlan2015),andthusmaybesignificantlyaboveorbelowthebudgetedamounts.
a.2) SAP Stock Option Plan 2010 (SOP 2010 (2010–2014 Tranches))UndertheSAPStockOptionPlan2010,wegrantedmembersoftheSeniorLeadershipTeam/GlobalExecutives,SAP’sTopRewards(employeeswithanexceptionalrating/highpotentials)between2010and2014andonlyin2010and2011membersoftheExecutiveBoardcash-basedvirtualstockoptions,thevalueofwhichdependsonthemulti-yearperformanceoftheSAPshare.
Thegrant-basevalueisbasedontheaveragefairmarketvalueofoneordinaryshareoverthefivebusinessdayspriortotheExecutiveBoardresolutiondate.
243Notes to the Consolidated Financial Statements
ThevirtualstockoptionsgrantedundertheSOP2010givetheemployeestherighttoreceiveacertainamountofmoneybyexercisingtheoptionsunderthetermsandconditionsofthisplan.Afterathree-yearvestingperiod(fouryearsformembersoftheExecutiveBoard),theplanprovidesfor11predeterminedexercisedateseverycalendaryear(onedatepermonthexceptinApril)untiltherightslapsesixyearsafterthegrantdate(sevenyearsformembersoftheExecutiveBoard).EmployeescanexercisetheirvirtualstockoptionsonlyiftheyareemployedbySAP;iftheyleavetheCompany,theyforfeitthem.ExecutiveBoardmembers’optionsarenon-forfeitableoncegranted–iftheserviceagreementendsinthegrantyear,thenumberofoptionsisreducedproratatemporis.Anyoptionsnotexercisedattheendoftheirtermexpire.
Theexercisepriceis110%ofthegrantbasevalue(115%formembersoftheExecutiveBoard)whichis€39.03(€40.80)forthe2010tranche,€46.23(€48.33)forthe2011tranche,€49.28forthe2012tranche,€59.85forthe2013tranche,and€60.96forthe2014tranche.
Monetarybenefitswillbecappedat100%oftheexerciseprice(150%formembersoftheExecutiveBoard).
a.3) Restricted Stock Unit Plan (RSU Plan (2013–2014 tranches))Wemaintainshare-basedpaymentplansthatallowfortheissuanceofrestrictedstockunits(RSU)toretainandmotivateexecutivesandcertainemployees.
UndertheRSUPlan,wegrantedacertainnumberofRSUsthroughout2013and2014representingacontingentrighttoreceiveacashpaymentdeterminedbythemarketvalueofthesamenumberofSAPSEshares(orSAPSEAmericanDepositaryReceiptsontheNewYorkStockExchange)andthenumberofRSUsthatultimatelyvest.GrantedRSUswillvestindifferenttranches,either:–Overaone-to-threeyearserviceperiodonly,or–Overaone-to-threeyearserviceperiodanduponmeetingcertainkeyperformanceindicators(KPIs).
ThenumberofRSUsthatcouldvestunderthe2014tranchewithperformance-basedgrantswascontingentuponaweightedachievementofthefollowingperformancemilestonesforthefiscalyearendedDecember31,2014:–Specificindicatorofgrowthincloudsubscriptionsandsupportrevenue(50%)and
–Cloudsubscriptionandsupportrevenue(50%)
Dependingonperformance,thenumberofRSUsvestingcouldhaverangedbetween80%and150%ofthenumberinitiallygranted.PerformanceagainsttheKPItargetswas90.27%(2013:100%)infiscalyear2014.
TheRSUsarepaidoutincashuponvesting.
a.4) SuccessFactors Cash-Settled Awards Replacing Pre-Acquisition SuccessFactors Awards (SFSF Rights)InconjunctionwiththeacquisitionofSuccessFactorsin2012,underthetermsoftheacquisitionagreement,SAPexchangedunvestedRestrictedStockAwards(RSAs),RestrictedStockUnits(RSUs),andPerformanceStockUnits(PSUs)heldbyemployeesofSuccessFactorsforcash-settledshare-basedpaymentawardsofSAP(SFSFRights).
RSAs,RSUs,andPSUsunvestedattheclosingoftheacquisitionwereconvertedintotherighttoreceive,attheoriginallyagreedvestingdates,anamountincashequaltothenumberofrightsheldatthevestingdatemultipliedbyUS$40.00pershare.
a.5) Ariba Cash-Settled Awards Replacing Pre-Acquisition Ariba Awards (Ariba Rights)ThetermsoftheacquisitionagreementunderwhichSAPacquiredAribain2012requiredSAPtoexchangeunvestedRestrictedStockAwards(RSAs)andRestrictedStockUnits(RSUs)heldbyemployeesofAribaforcash-settledshare-basedpaymentawardsofSAP(AribaRights).
244 Consolidated Financial Statements IFRS

RSAsandRSUsunvestedattheclosingoftheacquisitionwereconvertedintotherighttoreceiveanamountincashequaltothenumberofRSAsandRSUsheldatthevestingdatemultipliedbyUS$45.00pershareinaccordancewiththerespectivevestingterms.
b) Equity-Settled Share-Based PaymentsEquity-settledplansincludeprimarilytheShareMatchingPlan(SMP).
UndertheShareMatchingPlan(SMP)implementedin2010,SAPoffersitsemployeestheopportunitytopurchaseSAPSEsharesatadiscountof40%.ThenumberofSAPsharesaneligibleemployeemaypurchasethroughtheSMPislimitedtoapercentageoftheemployee’sannualbasesalary.Afterathree-yearholdingperiod,suchplanparticipantswillreceive
one(in2012:five)freematchingshareofSAPforeverythreeSAPsharesacquired.
ThetermsforthemembersoftheSeniorLeadershipTeam/GlobalExecutivesareslightlydifferentthanthosefortheotheremployees.Theydonotreceiveadiscountwhenpurchasingtheshares.However,afterathree-yearholdingperiod,theyreceivetwo(in2012:five)freematchingSAPsharesforeverythreeSAPsharesacquired.ThisplanisnotopentomembersoftheSAPExecutiveBoard.
Thefollowingtableshowstheparametersandassumptionsusedatgrantdatetodeterminethefairvalueoffreematchingshares,aswellasthequantityofsharespurchasedandfreematchingsharesgrantedthroughthisprogramin2014,2013,and2012:
Fair Value and Parameters at Grant Date for SMP
2014 2013 2012
Grant date 6/4/2014 9/4/2013 6/6/2012Fair value of granted awards €52.49 €51.09 €42.54
Information how fair value was measured at grant dateOptionpricingmodelused Other1)
Shareprice €55.61 €54.20 €45.43
Risk-freeinterestrate 0.13% 0.43% 0.12%
Expecteddividendyield 1.87% 1.92% 2.13%
Weighted average remaining contractual life of awards outstanding at year-end (in years) 0.9 1.6 2.2
Number of investment shares purchased (in thousands) 1,550 1,559 1,926
1) 1Fortheseawardsthefairvalueiscalculatedbysubtractingthenetpresentvalueofexpectedfuturedividendpayments,ifany,untilmaturityoftherespectiveawardfromtheprevailingsharepriceasofthevaluationdate.
245Notes to the Consolidated Financial Statements

Thefollowingtableshowsthebreakdownoftheexpenserecognizedforthisprogramin2014,2013,and2012:
Recognized Expense at Year-End for SMP €millions,unlessotherwisestated
2014 2013 2012
Expenserecognizedrelatingtodiscount
35 32 34
Expenserecognizedrelatingtovestingoffreematchingshares
54 51 34
Total expense relating to SMP 89 83 68
ThenumberofawardsunderourSMPdevelopedasfollowsintheyearsendedDecember31,2014,and2013:
Changes in Numbers of Outstanding Awards Under SMPthousands
SMP
Outstandingasat12/31/2012 4,071
Grantedin2013 573
Exercisedin2013 –462
Forfeitedin2013 –196
Outstanding as at 12/31/2013 3,986Grantedin2014 568
Exercisedin2014 –432
Forfeitedin2014 –187
Outstanding as at 12/31/2014 3,935
246 Consolidated Financial Statements IFRS

(29) SEGMENT AND GEOGRAPHIC INFORMATION
General InformationOurinternalreportingsystemproducesreportsinwhichinformationregardingourbusinessactivitiesispresentedinavarietyofways,forexample,bylineofbusiness,geography,andareasofresponsibilityoftheindividualBoardmembers.Basedonthesereports,theExecutiveBoard,whichisresponsibleforassessingtheperformanceofourCompanyandformakingresourceallocationdecisionsasourChiefOperatingDecisionMaker(CODM),evaluatesbusinessactivitiesinanumberofdifferentways.
Inthefirstquarter2014,wetooksignificantstepstodriveforwardourstrategyandourambitiontobecomeTHECloudCompanypoweredbySAPHANA.Toexecutethisstrategy,wemergedareasoftheCompanythatperformedsimilartasks(forexample,theon-premisesalesforceswiththecloudsalesforces,andtheon-premisesupportunitswiththecloudsupportunits)toachieveaseamlessorganizationofSAP.Werunouroperationsasasinglebusinessoperationduetothefunctionalorganization.Sincethisintegrationourcloud-relatedactivitiesarenolongerdealtwithbyseparatecomponentsinourCompany.TherearenopartsofourCompanythatqualifyasoperatingsegmentsunderIFRS8andourExecutiveBoardassessesthefinancialperformanceofourCompanyonanintegratedbasisonly.
Consequently,witheffectfromthefirstquarterof2014SAPhasasingleoperatingsegment.
Measurement and PresentationWeareintheprocessofredefiningourorganizationalstructureinthelightoftheConcuracquisition,andwehavenotyetfinishedthisworkduetotheshorttimesincetheacquisition.Wehavenotyetfinishedadaptingourmanagementreporting.Concur’sresultsarenotincludedinpresentsegmentinformationbutarepresentedinareconciliationofsegmentrevenueandresultstotherelatednumberintheconsolidatedincomestatements.
Mostofourdepreciationandamortizationexpenseaffectingoperatingsegmentprofitisallocatedtooursinglesegmentaspartofbroaderinfrastructureallocationsandisthusnottrackedseparatelyontheoperatingsegmentlevel.Depreciationandamortizationexpensethatisdirectlyallocatedtooursingleoperatingsegmentisimmaterial.
Theaccountingpoliciesappliedinthemeasurementsoftheoperatingsegment’srevenuesandresultsdifferfromIFRSaccountingprinciplesdescribedinNote(3)asfollows:–Themeasurementsoftheoperatingsegmentrevenuesandresultsgenerallyattributerevenuetothesegmentbasedonthenatureofthebusinessregardlessofrevenueclassificationinourincomestatement.
–Themeasurementsoftheoperatingsegmentrevenuesandresultsincludestherecurringrevenuesthatwouldhavebeenreflectedbyacquiredentitieshadtheyremainedstand-aloneentitiesbutwhicharenotreflectedasrevenueunderIFRSduetofairvalueaccountingforcustomercontractsineffectatthetimeofanacquisition.
–Themeasurementsoftheoperatingsegmentresultsexcludethefollowingexpenses:Acquisition-relatedchargesAmortizationexpense/impairmentchargesofintangiblesacquiredinbusinesscombinationsandcertainstand-aloneacquisitionsofintellectualproperty(includingpurchasedin-processresearchanddevelopment)Settlementsofpre-existingrelationshipsinconnectionwithabusinesscombinationAcquisition-relatedthird-partycosts
ExpensesfromtheTomorrowNowlitigationandtheVersatalitigationShare-basedpaymentexpensesRestructuringexpenses
–Themeasurementsoftheoperatingsegmentresultsexcluderesearchanddevelopmentexpenseandgeneralandadministrationexpenseatsegmentlevel.TheseexpensesaremanagedandreviewedattheGrouplevelonly.
247Notes to the Consolidated Financial Statements

Reconciliation of Revenues and Segment Results €millions
2014 2013 2012
Totalrevenueofoperatingsegment 17,525 16,897 16,304
Adjustmentrecurringrevenue –19 –82 –81
Revenuefromunallocatedacquisitions 55 0 0
Total revenue 17,560 16,815 16,223
Resultsofoperatingsegment 8,623 8,428 8,082
Adjustmentrecurringrevenues –19 –82 –81
Researchanddevelopmentexpense –2,204 –2,162 –2,132
Generalandadministrationexpense –806 –796 –784
Otheroperatingincome/expense,net 4 12 23
Restructuring –126 –70 –8
Share-basedpayments –290 –327 –522
TomorrowNowandVersatalitigation –309 31 0
Acquisition-relatedcharges –562 –555 –537
Resultfromunallocatedacquisitions(whicharenotincludedinotherreconciliationlineitems) 21 0 0
Operating profit 4,331 4,479 4,041Othernon-operatingincome/expense,net 49 –17 –173
Financialincome,net –25 –66 –72
Profit before tax 4,355 4,396 3,796
Theresearchanddevelopmentexpenseandgeneralandadministrationexpensepresentedinthereconciliationdifferfromthecorrespondingexpensesintheconsolidatedincomestatementsbecauseexpensesrelatingtoshare-basedpaymentsandacquisition-relatedexpensesarepresentedasseparatereconcilingitems.
Geographic Information WehavealignedourrevenuebyregiondisclosureswiththechangesmadetothestructureofourincomestatementasoutlinedinNote(3b).Withthefullintegrationofourcloudactivities,wefurthermorerefinedthemethodofallocatingcloudsubscriptionrevenuestothedifferentgeographies.Comparativepriorperioddatahasbeenadjustedaccordingly.
248 Consolidated Financial Statements IFRS
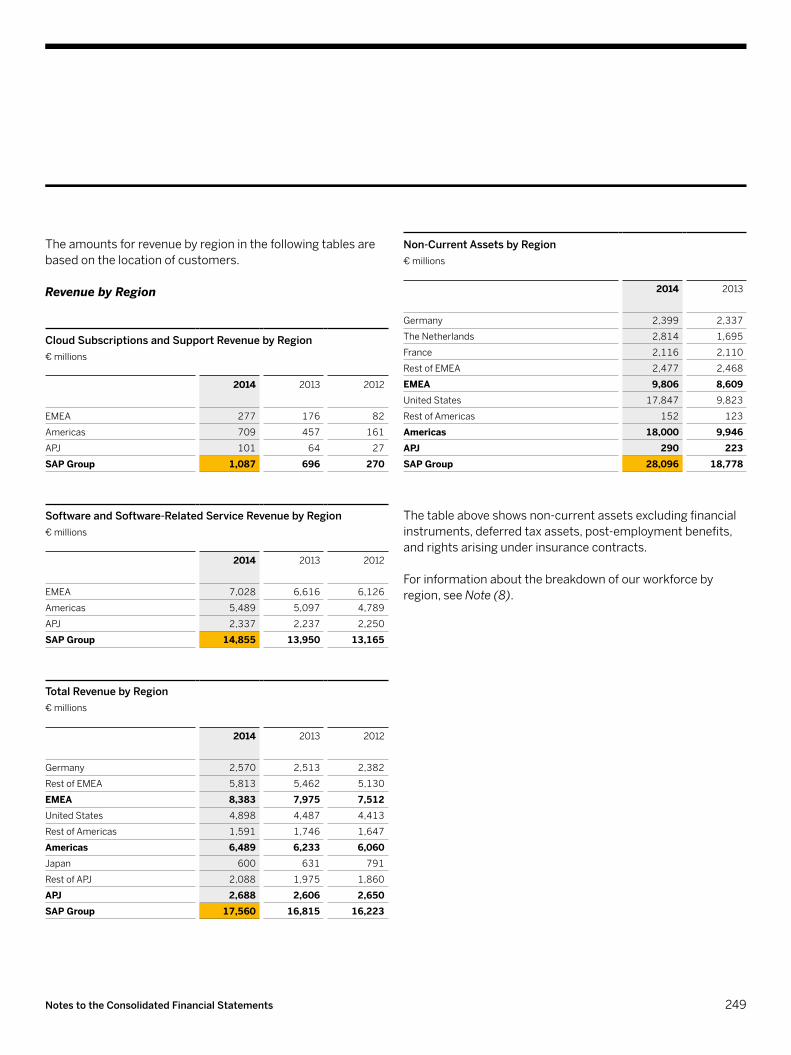
Theamountsforrevenuebyregioninthefollowingtablesarebasedonthelocationofcustomers.
Revenue by Region
Cloud Subscriptions and Support Revenue by Region €millions
2014 2013 2012
EMEA 277 176 82
Americas 709 457 161
APJ 101 64 27
SAP Group 1,087 696 270
Software and Software-Related Service Revenue by Region €millions
2014 2013 2012
EMEA 7,028 6,616 6,126
Americas 5,489 5,097 4,789
APJ 2,337 2,237 2,250
SAP Group 14,855 13,950 13,165
Total Revenue by Region €millions
2014 2013 2012
Germany 2,570 2,513 2,382
RestofEMEA 5,813 5,462 5,130
EMEA 8,383 7,975 7,512UnitedStates 4,898 4,487 4,413
RestofAmericas 1,591 1,746 1,647
Americas 6,489 6,233 6,060Japan 600 631 791
RestofAPJ 2,088 1,975 1,860
APJ 2,688 2,606 2,650SAP Group 17,560 16,815 16,223
Non-Current Assets by Region €millions
2014 2013
Germany 2,399 2,337
TheNetherlands 2,814 1,695
France 2,116 2,110
RestofEMEA 2,477 2,468
EMEA 9,806 8,609UnitedStates 17,847 9,823
RestofAmericas 152 123
Americas 18,000 9,946APJ 290 223SAP Group 28,096 18,778
Thetableaboveshowsnon-currentassetsexcludingfinancialinstruments,deferredtaxassets,post-employmentbenefits,andrightsarisingunderinsurancecontracts.
Forinformationaboutthebreakdownofourworkforcebyregion,seeNote(8).
249Notes to the Consolidated Financial Statements

(30) BOARD OF DIRECTORS
Executive BoardMembershipsonsupervisoryboardsandothercomparablegoverningbodiesofenterprises,otherthansubsidiariesofSAPonDecember31,2014
Bill McDermott ChiefExecutiveOfficer,LaborRelationsDirectorStrategy,Governance,BusinessDevelopment,CorporateDevelopment,CommunicationsandMarketing,HumanResources,BusinessNetwork
BoardofDirectors,ANSYS,Inc.,Canonsburg,Pennsylvania,UnitedStatesBoardofDirectors,UnderArmour,Inc.,Baltimore,Maryland,UnitedStates
Robert Enslin(fromMay4,2014)GlobalCustomerOperationsGlobalGo-to-MarketEfforts,CloudandLineofBusinessSales,RegionalSalesandOperations,SpecializedIndustrySales,EcosystemandChannels,End-to-EndCustomerExperience
Bernd Leukert (fromMay4,2014)Products&InnovationGlobalDevelopmentOrganization,Analytics,Applications,Cloud,Database&Technology,Mobile,SAPLabsNetwork(jointleadershipwithGerhardOswald)
Luka Mucic (fromJuly1,2014)ChiefFinancialOfficer,ChiefOperatingOfficerFinanceandAdministrationincludingInvestorRelationsandDataProtection&Privacy,ProcessOffice
Gerhard OswaldGlobalService&SupportSAPActiveGlobalSupport,SAPHANAEnterpriseCloud,QualityGovernance&Production,Solution&KnowledgePackaging,SAPLabsNetwork(jointleadershipwithBerndLeukert)
Executive Board Members Who Left During 2014Dr. Werner Brandt(untilJune30,2014)Dr. Vishal Sikka(untilMay4,2014)Jim Hagemann Snabe(untilMay21,2014)
Supervisory BoardMembershipsonsupervisoryboardsandothercomparablegoverningbodiesofenterprises,otherthansubsidiariesofSAPonDecember31,2014
Prof. Dr. h. c. mult. Hasso Plattner 2),4),6),7),8)Chairman
SupervisoryBoard,OligoLichttechnikGmbH,Hennef,Germany(untilAugust28,2014)
Christiane Kuntz-Mayr 1),2),8)DeputyChairpersonDevelopmentManager
Pekka Ala-Pietilä 4),6),7)ChairmanoftheBoardofDirectors,SolidiumOy,Helsinki,Finland
BoardofDirectors,PöyryPlc,Vantaa,FinlandChairmanoftheBoardofDirectors,CVONGroupLimited,London,UKBoardofDirectors,CVONLimited,London,UKChairmanoftheBoardofDirectors,CVONInnovationServicesOy,Turku,FinlandBoardofDirectors,CVONFutureLimited,London,UKChairmanoftheBoardofDirectors,BlykInternationalLtd.,London,UK
250 Consolidated Financial Statements IFRS

ChairmanoftheBoardofDirectors,HuhtamäkiOyj,Espoo,FinlandBoardofDirectors,SanomaCorporation,Helsinki,Finland(fromApril9,2014)
Panagiotis Bissiritsas 1),2),5)SupportExpert
Catherine Bordelon (fromJuly7,2014) 1),8)Bid&ProposalManager
Prof. Anja Feldmann 4),8)
ProfessorattheElectricalEngineeringandComputerScienceFacultyattheTechnischeUniversitätBerlin
Prof. Dr. Wilhelm Haarmann 2),5),7),8)Attorney-at-law,certifiedpublicauditor,certifiedtaxadvisorLinklatersLLP,Rechtsanwälte,Notare,Steuerberater,FrankfurtamMain,Germany
ChairmanoftheSupervisoryBoard,CinemaxXAG,Hamburg,Germany(untilApril25,2014)SupervisoryBoard,CelesioAG,Stuttgart,Germany(fromMarch14,2014)
Margret Klein-Magar 1),2),4),7)VicePresident,HeadofPeoplePrinciples
Lars Lamadé 1),2),7),8)HeadofCustomer&EventsGSSCOOManagingDirector,RheinNeckar-LoewenGmbH,Kronau,Germany
DeputyChairmanoftheSupervisoryBoard,Rhein-Neckar-LoewenGmbH,Kronau,Germany(untilAugust31,2014)
Steffen Leskovar(fromJuly7,2014)1),3),4)ResourceManager
Bernard Liautaud 2),4),6)GeneralPartnerBaldertonCapital,London,UK
BoardofDirectors,nlyteSoftwareLtd.,London,UKBoardofDirectors,TalendSA,Suresnes,FranceBoardofDirectors,WongaGroupLtd.,London,UKBoardofDirectors,SCYTLSecureElectronicVotingSA,Barcelona,SpainBoardofDirectors,AbiquoGroupInc.,RedwoodCity,California,UnitedStates(untilFebruary27,2014)BoardofDirectors,VestiaireCollectiveSA,Levallois-Perret,FranceBoardofDirectors,Dashlane,Inc.,NewYork,NewYork,UnitedStatesBoardofDirectors,RecordedFuture,Inc.,Cambridge,Massachusetts,UnitedStatesBoardofDirectors,eWiseGroup,Inc.,RedwoodCity,California,UnitedStatesBoardofDirectors,QubitDigitalLtd.,London,UKBoardofDirectors,StanfordUniversity,Stanford,California,UnitedStatesBoardofDirectors,CitymapperLtd.,London,UKBoardofDirectors,SunriseAtelier,Inc.,NewYork,NewYork,UnitedStates(fromAugust2,2014)BoardofDirectors,OpbeatInc.,SanFrancisco,California,UnitedStates(fromSeptember11,2014)
Dr. h. c. Hartmut Mehdorn 5),8)
CEOofFlughafenBerlin-BrandenburgGmbH,Berlin,Germany
AdvisoryBoard,Fiege-Gruppe,Greven,GermanyBoardofDirectors,RZD–RussianRailways,Moscow,Russia
Dr. Kurt Reiner 1),4),5)DevelopmentExpert
251Notes to the Consolidated Financial Statements

Mario Rosa-Bian 1),5),8)ProjectPrincipalConsultant
Dr. Erhard Schipporeit 3),7)IndependentManagementConsultant
SupervisoryBoard,TalanxAG,Hanover,GermanySupervisoryBoard,DeutscheBörseAG,FrankfurtamMain,GermanySupervisoryBoard,HDIV.a.G.,Hanover,GermanySupervisoryBoard,HannoverRückversicherungSE,Hanover,GermanySupervisoryBoard,FuchsPetrolubSE,Mannheim,GermanySupervisoryBoard,BDOAG,Hamburg,GermanyBoardofDirectors,TUITravelPLC,London,UK(untilDecember11,2014)BoardofDirectors,FidelityFundsSICAV,LuxembourgSupervisoryBoard,RocketInternetAG,Berlin,Germany(fromAugust22,2014)
Stefan Schulz 1),3),4)DevelopmentExecutive,VicePresident
SupervisoryBoard,ORTECInternationalB.V.,Zoetermeer,theNetherlands
Jim Hagemann Snabe(fromJuly7,2014) 2),5)SupervisoryBoardMember
BoardofDirectors,Bang&OlufsenA/S,Struer,DenmarkBoardofDirectors,DanskeBankA/S,Copenhagen,DenmarkSupervisoryBoard,AllianzSE,Munich,Germany(fromMay7,2014)SupervisoryBoard,SiemensAG,Munich,Germany
Prof. Dr.-Ing. Dr.-Ing. E. h. Klaus Wucherer 3)ManagingDirectorofDr.KlausWuchererInnovations-undTechnologieberatungGmbH,Erlangen,Germany
DeputyChairmanoftheSupervisoryBoard,HEITECAG,Erlangen,GermanySupervisoryBoard,DürrAG,Bietigheim-Bissingen,GermanyDeputyChairmanoftheSupervisoryBoard,LEONIAG,Nuremberg,GermanyChairmanoftheSupervisoryBoard,FestoAG&Co.KG,Esslingen,Germany
Supervisory Board Members Who Left During 2014Inga Wiele(untilJuly6,2014)
InformationasatDecember31,2014.
1)Electedbytheemployees2)MemberoftheCompany’sGeneralandCompensationCommittee3)MemberoftheCompany’sAuditCommittee4)MemberoftheCompany’sTechnologyandStrategyCommittee5)MemberoftheCompany’sFinanceandInvestmentCommittee6)MemberoftheCompany’sNominationCommittee7)MemberoftheCompany’sSpecialCommittee8)MemberoftheCompany’sPeopleandOrganizationCommittee
252 Consolidated Financial Statements IFRS

ThetotalcompensationoftheExecutiveBoardmembersfortheyears2014,2013,and2012wasasfollows:
Executive Board Compensation €thousands
2014 2013 2012
Short-termemployeebenefits 16,196 24,728 17,054
Share-basedpayment1) 8,098 8,603 14,855
Subtotal1) 24,294 33,331 31,909
Post-employmentbenefits 3,249 1,324 3,263
Thereofdefined-benefit 2,276 189 1,711
Thereofdefined-contribution 973 1,135 1,552
Total1) 27,543 34,655 35,172
1)Portionoftotalexecutivecompensationallocatedtotherespectiveyear
Theshare-basedpaymentamountsdisclosedabovearebasedonthegrantdatefairvalueoftherestrictedshareunits(RSUs)issuedtoExecutiveBoardmembersduringtheyear.
TheExecutiveBoardmembersalreadyreceived,in2012,theLTIgrantsfortheyears2012to2015subjecttocontinuousserviceasmemberoftheExecutiveBoardintherespectiveyears.Althoughthesegrantsarelinkedtoandthus,economi-cally,compensationfortheExecutiveBoardmembersintherespectiveyears,section314oftheGermanCommercialCode(HGB)requiresthemtobeincludedinthetotalcompensationnumberfortheyearofgrant.DuetotheappointmentsofRobertEnslin,BerndLeukert,andLukaMucictotheExecutiveBoardin2014,additionalgrantswereallocatedtothemrelatedto2014and2015.VestingoftheLTIgrantsisdependentontherespectiveExecutiveBoardmember’scontinuousservicefortheCompany.
Theshare-basedpaymentasdefinedinsection314oftheGermanCommercialCode(HGB)amountsto€8,720,200(2013:€3,149,600)basedontheallocationsfor2014and2015forRobertEnslin,BerndLeukert,andLukaMucicwhichweregrantedin2014inlinewiththeirappointmenttotheExecutiveBoard.Includingtheseamounts,thesumofshort-termemployeebenefitsandshare-basedpaymentamountsto€23,216,200(2013:€24,109,600)andthetotalExecutiveBoardcompensationamountsto€26,464,700(2013:€25,433,400).Theseamountsdifferfromtherespective
amountsshowninthetableabove,sincetheamountsinthetableaboveconsidertheLTItranchesthatwereallocatedtoeachoftherespectiveyears,ratherthanconsideringtheLTItranchesbasedonthegrantdateasdefinedundersection314oftheGermanCommercialCode(HGB).
Share-Based Payment for Executive Board Members
2014 2013 2012
NumberofRSUsgranted 153,909 152,159 326,432
Numberofstockoptionsgranted 0 0 0
Totalexpensein€thousands 11,133 –8,596 57,429
Inthetableabove,theshare-basedpaymentexpenseistheamountrecordedinprofitorlossunderIFRS2intherespectiveperiod. Thedefinedbenefitobligation(DBO)forpensionstoExecutiveBoardmembersandtheannualpensionentitlementofthemembersoftheExecutiveBoardonreachingage60basedonentitlementsfromperformance-basedandsalary-linkedplanswereasfollows:
Retirement Pension Plan for Executive Board Members€thousands
2014 2013 2012
DBODecember31 11,273 9,077 8,889
Annualpensionentitlement 475 452 429
253Notes to the Consolidated Financial Statements

SubjecttotheadoptionofthedividendresolutionbytheshareholdersattheAnnualGeneralMeetingofShareholdersonMay20,2015,thetotalannualcompensationoftheSupervisoryBoardmembersfor2014isasfollows:
Supervisory Board Compensation €thousands
2014 2013 2012
Totalcompensation 3,227 2,966 2,981
Thereoffixedcompensation 924 870 901
Thereofcommitteeremuneration 515 416 340
Thereofvariablecompensation 1,788 1,680 1,741
TheSupervisoryBoardmembersdonotreceiveanyshare-basedpaymentfortheirservices.AsfarasmemberswhoareemployeerepresentativesontheSupervisoryBoardreceiveshare-basedpaymentsuchcompensationisfortheirservicesasemployeesonlyandisunrelatedtotheirstatusasmembersoftheSupervisoryBoard.
Duringthefiscalyear2014,paymentstoandDBOforformerExecutiveBoardmemberswereasfollows:
Payments to/DBO for Former Executive Board Members€thousands
2014 2013 2012
Payments 3,462 1,387 1,360
DBO 33,764 29,181 30,551
SAPdidnotgrantanycompensationadvanceorcreditto,orenterintoanycommitmentforthebenefitof,anymemberoftheExecutiveBoardorSupervisoryBoardin2014,2013,or2012.
OnDecember31ofeachof2014,2013and2012,theshareholdingsofSAP’sboardmemberswereasfollows:
Shareholdings of Executive and Supervisory Board MembersNumberofSAPshares
2014 2013 2012
ExecutiveBoard 36,426 30,201 35,271
SupervisoryBoard 107,467,372 119,316,444 121,363,858
DetailedinformationaboutthedifferentelementsofthecompensationaswellasthenumberofsharesownedbymembersoftheExecutiveBoardandtheSupervisoryBoardaredisclosedintheCompensationReportwhichispartofourManagementReportandofourAnnualReportonForm20-F,bothofwhichareavailableonSAP’sWebsite.(31) RELATED PARTY TRANSACTIONSCertainExecutiveBoardandSupervisoryBoardmembersofSAPSEcurrentlyhold,orheldwithinthelastyear,positionsofsignificantresponsibilitywithotherentities,aspresentedinNote(30).Wehaverelationshipswithcertainoftheseentitiesintheordinarycourseofbusiness,wherebywebuyandsellawidevarietyofproducts,assetsandservicesatpricesbelievedtobeconsistentwiththosenegotiatedatarm’slengthbetweenunrelatedparties.
CompaniescontrolledbyHassoPlattner,chairmanofourSupervisoryBoardandChiefSoftwareAdvisorofSAP,engagedinthefollowingtransactionswithSAP:providingconsultingservicestoSAP,receivingsportsponsoringfromSAP,makingpurchasesofSAPproductsandservices.Intheprioryear,thetransactionsalsoincludedpurchasingapieceoflandfromacompanyindirectlyheldbyHassoPlattner.
ChristianeKuntz-Mayr,vicechairpersonoftheSAPSupervisoryBoard,actsasamanagingdirectoroffamily&kids@workgemeinnützigeUG(“family&kids@work”).
WilhelmHaarmannpracticesasapartnerinthelawfirmLinklatersLLPinFrankfurtamMain,Germany.SAPoccasionallypurchasedandpurchaseslegalandsimilarservicesfromLinklaters.
254 Consolidated Financial Statements IFRS

AllamountsrelatedtotheabovementionedtransactionswereimmaterialtoSAPinallperiodspresented.
Intotal,wesoldproductsandservicestocompaniescontrolledbymembersoftheSupervisoryBoardintheamountof€4million(2013:€3million),weboughtproductsandservicesfromsuchcompaniesintheamountof€1million(2013:€1million),wepurchasedpropertyandotherassetsfromsuchcompaniesintheamountof€0million(2013:€2million)andweprovidedsponsoringandotherfinancialsupporttosuchcompaniesintheamountof€7million(2013:€4million).Outstandingbalancesatyear-endfromtransactionswithsuchcompanieswere€2million(2013:€2million)foramountsowedtosuchcompaniesand€1million(2013:€1million)foramountsowedbysuchcompanies.Allthesebalancesareunsecuredandinterestfreeandsettlementisexpectedtooccurincash.Commitments(thelongestofwhichisfor11years)madebyustopurchasefurthergoodsorservicesfromthesecompaniesandtoprovidefurthersponsoringandotherfinancialsupportamountto€13millionasatDecember31,2014(2013:€14million).
Intotal,wereceivedservicesfrommembersoftheSupervisoryBoard(includingservicesfromemployeerepresentativesontheSupervisoryBoardintheircapacityasemployeesofSAP)intheamountof€2million(2013:€2million).AmountsowedtoSupervisoryBoardmembersfromthesetransactionswere€0millionasatDecember31,2014(2013:€0million).Allthesebalancesareunsecuredandinterestfreeandsettlementisexpectedtooccurincash.CommitmentsmadebyustopurchasefurtherservicesfromSupervisoryBoardmembersamountto€0millionasatDecember31,2014(2013:€0million).
ForinformationaboutthecompensationofourExecutiveBoardandSupervisoryBoardmembers,seeNote(30).(32) PRINCIPAL ACCOUNTANT FEES AND SERVICESAttheAnnualGeneralMeetingofShareholdersheldonMay21,2014,ourshareholderselectedKPMGAGWirtschaftsprüfungs-gesellschaftasSAP’sindependentauditorfor2014.KPMGAGWirtschaftsprüfungsgesellschaftandotherfirmsintheglobalKPMGnetworkchargedthefollowingfeestoSAPforauditandotherprofessionalservicesrelatedto2014andthepreviousyears:
Fees for Audit and Other Professional Services€millions
2014 2013 2012
KPMGAG(Germany)
ForeignKPMGFirms
Total KPMGAG(Germany)
ForeignKPMGFirms
Total KPMGAG(Germany)
ForeignKPMGFirms
Total
Auditfees 2 6 8 2 7 9 2 8 10Audit-relatedfees 0 0 0 1 0 1 2 0 2Taxfees 0 0 0 0 0 0 0 0 0Allotherfees 0 0 0 0 0 0 0 0 0Total 2 6 8 3 7 10 4 8 12
255Notes to the Consolidated Financial Statements

AuditfeesaretheaggregatefeeschargedbyKPMGfortheauditofourConsolidatedFinancialStatementsaswellasauditsofstatutoryfinancialstatementsofSAPSEanditssubsidiaries.Audit-relatedfeesarefeeschargedbyKPMGforassuranceandrelatedservicesthatarereasonablyrelatedtotheperformanceoftheauditorreviewofourfinancialstatementsandarenotreportedunderauditfees.TaxfeesarefeesforprofessionalservicesrenderedbyKPMGfortaxadviceontransferpricing,restructuring,andtaxcomplianceoncurrent,past,orcontemplatedtransactions.Theallotherfeescategoryincludesothersupportservices,suchastrainingandadvisoryservicesonissuesunrelatedtoaccountingandtaxes.
(33) GERMAN CODE OF CORPORATE GOVERNANCETheGermanfederalgovernmentpublishedtheGermanCodeofCorporateGovernanceinFebruary2002.TheCodecontainsstatutoryrequirementsandanumberofrecommendationsandsuggestions.OnlythelegalrequirementsarebindingforGermancompanies.Withregardtotherecommendations,theGermanStockCorporationAct,section161,requiresthateveryyearlistedcompaniespubliclystatetheextenttowhichtheyhaveimplementedthem.Companiescandeviatefromthesuggestionswithouthavingtomakeanypublicstatements.
In2014and2013,ourExecutiveBoardandSupervisoryBoardissuedtherequireddeclarationsofimplementation,thedeclarationfor2014wasmodifiedinFebruary2015.ThesestatementsareavailableonourWebsite:www.sap.com/corporate-en/investors/governance.
(34) EVENTS AFTER THE REPORTING PERIODNoeventsthathaveoccurredsinceDecember31,2014,haveamaterialimpactontheCompany’sConsolidatedFinancialStatements.
256 Consolidated Financial Statements IFRS

AsatDecember31,2014 Ownership TotalRevenuein
20141)
Profit/Loss(–)
afterTaxfor20141)
TotalEquityasat12/31/20141)
NumberofEmployees
asat12/31/20142)
NameandLocationofCompany % €(000) €(000) €(000)
I. Fully Consolidated SubsidiariesGERMANYConcur(Germany)GmbH,FrankfurtamMain 100.0 804 70 696 70
hybrisGmbH,Munich 100.0 57,609 –859 31,377 271
OutlookSoftDeutschlandGmbH,Walldorf 100.0 – –72 –68 –
SAPBeteiligungsGmbH,Walldorf 100.0 3 3 55 –
SAPBusinessComplianceServicesGmbH,Siegen 100.0 4,885 223 1,326 41
SAPDeutschlandSE&Co.KG,Walldorf5),7) 100.0 3,139,049 530,288 1,360,344 4,799
SAPDritteBeteiligungs-undVermögensverwaltungsGmbH,Walldorf6),7) 100.0 – –19,655 521,687 –
SAPErsteBeteiligungs-undVermögensverwaltungsGmbH,Walldorf6),7) 100.0 – –22,037 782,807 –
SAPForeignHoldingsGmbH,Walldorf 100.0 – –11 1,064 –
SAPFünfteBeteiligungs-undVermögensverwaltungsGmbH,Walldorf7) 100.0 – –2,010 2,621,438 –
SAPHostingBeteiligungsGmbH,St.Leon-Rot 100.0 – – 25 –
SAPPortalsEuropeGmbH,Walldorf 100.0 – 36 124,226 –
SAPPortalsHoldingBeteiligungsGmbH,Walldorf 100.0 – –3 930,078 –
SAPProjektverwaltungs-undBeteiligungsGmbH,Walldorf6),7) 100.0 – 29,141 353,015 –
SAPPuertoRicoGmbH,Walldorf 100.0 43,724 2,793 –5,055 18
SAPRetailSolutionsBeteiligungsgesellschaftmbH,Walldorf 100.0 – 388 9,903 –
SAPSechsteBeteiligungs-undVermögensverwaltungsGmbH,Walldorf7) 100.0 – – 25 –
SAPVenturesInvestmentGmbH,Walldorf7) 100.0 – –17 172,973 –
SAPVierteBeteiligungs-undVermögensverwaltungsGmbH,Walldorf 100.0 – –1 24 –
SAPZweiteBeteiligungs-undVermögensverwaltungsGmbH,Walldorf6),7) 100.0 – 286,900 169,273 –
TechniDataGmbH,Markdorf 100.0 105 –94 28,990 –
TRXGermanyGmbH,Berlin 100.0 – –15 1,618 –
REST OF EUROPE, MIDDLE EAST, AFRICAAmbinProperties(Proprietary)Limited,Johannesburg,SouthAfrica 100.0 – 364 1,727 –
AribaCzechs.r.o.,Prague,CzechRepublic 100.0 10,766 360 2,005 193
AribaFrance,SAS,Paris,France 100.0 13,700 539 3,974 47
AribaIberia,S.L.,Madrid,Spain 100.0 1,878 75 790 11
AribaInternationalSwedenAB,Stockholm,Sweden 100.0 1,478 53 372 5
AribaMiddleEast&NorthAfricaFZ-LLC,Dubai,UnitedArabEmirates 100.0 321 –7 317 1
AribaSlovakRepublics.r.o.,Kosice,Slovakia 100.0 1,668 53 449 32
AribaTechnologiesIrelandLtd.,Dublin,Ireland 100.0 998 70 437 –
AribaTechnologiesNetherlandsB.V.,Amsterdam,theNetherlands 100.0 3,735 64 6,293 6
AribaUKLimited,Egham,UnitedKingdom8) 100.0 11,183 670 184 –
b-process,Paris,France 100.0 12,107 –2,972 –7,528 38
BusinessObjects(UK)Limited,London,UnitedKingdom8) 100.0 – – 341 –
BusinessObjectsHoldingB.V.,’s-Hertogenbosch,theNetherlands 100.0 – –1 4,283 –
BusinessObjectsSoftwareLimited,Dublin,Ireland 100.0 895,290 657,070 5,227,134 291
(35) SUBSIDIARIES, ASSOCIATES, AND OTHER EQUITY INVESTMENTS
257Notes to the Consolidated Financial Statements

AsatDecember31,2014 Ownership TotalRevenuein
20141)
Profit/Loss(–)
afterTaxfor20141)
TotalEquityasat12/31/20141)
NumberofEmployees
asat12/31/20142)
NameandLocationofCompany % €(000) €(000) €(000)
ChristiePartnersHoldingC.V.,Rotterdam,theNetherlands 100.0 – –1 –21,829 –
ClearTripInc.(Mauritius),Ebene,Mauritius 54.2
CleartripMEAFZLLC,Dubai,UnitedArabEmirates 54.2
Concur(Austria)GmbH,Vienna,Austria 100.0 10 – 38 1
Concur(France)SAS,Paris,France 100.0 1,237 –14 14,532 98
Concur(Italy)S.r.l.,Milan,Italy 100.0 – – 13 –
Concur(Switzerland)GmbH,Zurich,Switzerland 100.0 33 1 12 2
ConcurCzech(s.r.o.),Prague,CzechRepublic 100.0 938 44 1,617 242
ConcurDenmarkApS,Frederiksberg,Denmark 100.0 – – 3 –
ConcurHoldings(France)SAS,Paris,France 100.0 – –112 5,689 –
ConcurHoldings(Netherlands)B.V.,Amsterdam,theNetherlands 100.0 –479 –650 –26,441 14
ConcurInternationalHoldings(Netherlands)CV,Amsterdam,theNetherlands 100.0 –1,384 –2,744 1,022,116 –
ConcurTechnologies(UK)Ltd.,London,UnitedKingdom 100.0 3,472 154 –9,303 203
ConTgoConsultingLimited,London,UnitedKingdom8) 100.0 74 –139 –2,522 10
ConTgoLimited,London,UnitedKingdom 100.0 – – –2,384 –
ConTgoMTALimited,London,UnitedKingdom 100.0 – – – –
CrossgateUKLtd.,Slough,UnitedKingdom8) 100.0 – – – –
CrystalDecisions(Ireland)Limited,Dublin,Ireland 100.0 – 5 44,548 –
CrystalDecisionsHoldingsLimited,Dublin,Ireland 100.0 – 7 77,732 –
CrystalDecisionsUKLimited,London,UnitedKingdom8) 100.0 – – 2,361 –
EssCubedProcurementPty.Ltd.,Johannesburg,SouthAfrica 100.0 – – –816 –
FieldglassEuropeLimited,London,UnitedKingdom8) 100.0 8,606 145 83 53
GlobalExpense(Consulting)Limited,London,UnitedKingdom 100.0 – – – –
GlobalExpense(UK)Ltd,London,UnitedKingdom 100.0 627 157 2,936 99
hybrisAG,Rotkreuz,Switzerland 100.0 169,965 –23,583 1,064,162 33
hybrisAustriaGmbH,Vienna,Austria 100.0 3,552 17 –150 5
hybrisFranceSAS,Levallois-Perret,France 100.0 14,941 –302 1,204 43
hybrisNetherlandsBV,Amsterdam,theNetherlands 100.0 5,961 –293 5,457 10
hybrisSoftwareAB,Västerås,Sweden 100.0 8,455 –180 8,031 9
hybrisSp.z.o.o.,Gliwice,Poland 100.0 8,478 444 959 166
hybrisUKLtd.,London,UnitedKingdom8) 100.0 34,934 122 22,474 76
JoeDPartnersC.V.,Utrecht,theNetherlands 100.0 147,005 4,601 379,538 –
KXENLtd.,London,UnitedKingdom8) 100.0 113 1,534 102 –
LimitedLiabilityCompany“SAPLabs”,Moscow,Russia 100.0 23,219 –1,157 871 267
LimitedLiabilityCompany“SAPCIS”,Moscow,Russia 100.0 371,669 19,212 64,644 745
LimitedLiabilityCompanySAPKazakhstan,Almaty,Kazakhstan 100.0 18,885 –1,369 2,211 23
LimitedLiabilityCompanySAPUkraine,Kiev,Ukraine 100.0 27,739 –3,954 –5,674 100
MerlinSystemsOy,Espoo,Finland 100.0 9,805 –237 3,078 31
OOOhybrisSoftware,Moscow,Russia 100.0 1,947 –79 86 13
QuadremAfricaPty.Ltd.,Johannesburg,SouthAfrica 100.0 6,420 301 –490 107
258 Consolidated Financial Statements IFRS

AsatDecember31,2014 Ownership TotalRevenuein
20141)
Profit/Loss(–)
afterTaxfor20141)
TotalEquityasat12/31/20141)
NumberofEmployees
asat12/31/20142)
NameandLocationofCompany % €(000) €(000) €(000)
QuadremNetherlandsB.V.,Amsterdam,theNetherlands 100.0 38,278 –144 62,319 4
QuadremOverseasCooperatiefU.A.,Amsterdam,theNetherlands 100.0 – – – –
SAP(Schweiz)AG,Biel,Switzerland 100.0 653,771 67,711 161,753 635
SAP(UK)Limited,Feltham,UnitedKingdom8) 100.0 918,166 66,215 71,294 1,326
SAPBelgiumNV/SA,Brussels,Belgium 100.0 217,771 12,142 137,164 254
SAPBulgariaEOOD,Sofia,Bulgaria 100.0 3,934 233 1,461 4
SAPBusinessServicesCenterEuropes.r.o.,Prague,CzechRepublic 100.0 32,449 677 8,033 543
SAPBusinessServicesCenterNederlandB.V.,Utrecht,theNetherlands 100.0 185,146 4,841 52,407 17
SAPCommercialServicesLtd.,Valletta,Malta 100.0 – –9 –26 –
SAPČR,spol.sr.o.,Prague,CzechRepublic 100.0 77,642 3,862 12,020 249
SAPCyprusLtd,Nicosia,Cyprus 100.0 3,224 –591 637 2
SAPd.o.o.,Zagreb,Croatia 100.0 7,073 –25 –595 13
SAPDanmarkA/S,Copenhagen,Denmark 100.0 198,122 20,137 26,961 174
SAPEastAfricaLimited,Nairobi,Kenya 100.0 9,765 1,065 3,571 47
SAPEgyptLLC,Cairo,Egypt 100.0 12,064 –2,477 –14,316 51
SAPEMEAInsideSalesS.L.,Barcelona,Spain 100.0 13,262 489 3,627 128
SAPEspaña–Sistemas,AplicacionesyProductosenlaInformática,S.A.,Madrid,Spain 100.0 272,734 14,456 239,459 421
SAPEstoniaOÜ,Tallinn,Estonia 100.0 2,082 44 332 1
SAPFinlandOy,Espoo,Finland 100.0 121,412 11,867 50,820 110
SAPFranceHolding,Paris,France 100.0 1,086 116,189 5,285,256 3
SAPFrance,Paris,France 100.0 962,341 220,000 1,562,780 1,431
SAPHellasS.A.,Athens,Greece 100.0 30,644 658 15,159 55
SAPHoldings(UK)Limited,Feltham,UnitedKingdom8) 100.0 – –22,538 806,037 –
SAPHungaryRendszerek,AlkalmazásokésTermékekazAdatfeldolgozásbanInformatikaiKft.,Budapest,Hungary
100.0 48,571 1,959 11,384 522
SAPIrelandLimited,Dublin,Ireland 100.0 –9 13 9,738 –
SAPIrelandUS-FinancialServicesLtd.,Dublin,Ireland 100.0 175 383,434 5,546,367 3
SAPIsraelLtd.,Ra’anana,Israel 100.0 42,182 –1,359 2,241 57
SAPItaliaSistemiApplicazioniProdottiinDataProcessingS.p.A.,Milan,Italy 100.0 412,905 23,511 319,741 567
SAPLabsBulgariaEOOD,Sofia,Bulgaria 100.0 27,105 1,221 6,248 535
SAPLabsFinlandOy,Espoo,Finland 100.0 7,085 272 41,827 47
SAPLabsFranceSAS,Mougins,France 100.0 61,658 1,929 20,335 359
SAPLabsIsraelLtd.,Ra’anana,Israel 100.0 52,455 2,418 20,395 289
SAPLatviaSIA,Riga,Latvia 100.0 2,463 192 7 3
SAPMaltaInvestmentsLtd.,Valletta,Malta 100.0 – –9 –26 –
SAPMiddleEastandNorthAfricaL.L.C.,Dubai,UnitedArabEmirates3) 49.0 178,374 –31,274 –97,964 387
SAPNederlandB.V.,’s-Hertogenbosch,theNetherlands 100.0 482,572 39,550 484,180 492
SAPNederlandHoldingB.V.,’s-Hertogenbosch,theNetherlands 100.0 – 55 521,972 –
SAPNorgeAS,Lysaker,Norway 100.0 89,223 2,683 23,147 80
SAPÖsterreichGmbH,Vienna,Austria 100.0 200,712 21,244 26,047 350
259Notes to the Consolidated Financial Statements

AsatDecember31,2014 Ownership TotalRevenuein
20141)
Profit/Loss(–)
afterTaxfor20141)
TotalEquityasat12/31/20141)
NumberofEmployees
asat12/31/20142)
NameandLocationofCompany % €(000) €(000) €(000)
SAPPolskaSp.zo.o.,Warsaw,Poland 100.0 82,131 6,928 18,508 122
SAPPortalsIsraelLtd.,Ra’anana,Israel 100.0 67,283 22,357 99,695 201
SAPPortugal–Sistemas,AplicaçõeseProdutosInformáticos,SociedadeUnipessoal,Lda.,PortoSalvo,Portugal
100.0 82,651 8,079 26,294 280
SAPPublicServicesHungaryKft.,Budapest,Hungary 100.0 3,043 450 1,673 7
SAPRomaniaSRL,Bucharest,Romania 100.0 38,742 7,242 12,504 374
SAPSaudiArabiaSoftwareServicesLtd,Riyadh,KingdomofSaudiArabia 100.0 59,241 5,959 49,068 52
SAPSaudiArabiaSoftwareTradingLtd,Riyadh,KingdomofSaudiArabia 75.0 45,716 –38,596 –69,848 97
SAPServiceandSupportCentre(Ireland)Limited,Dublin,Ireland 100.0 92,360 859 35,455 1,104
SAPsistemi,aplikacijeinproduktizaobdelavopodatkovd.o.o.,Ljubljana,Slovenia 100.0 14,822 879 4,447 25
SAPSlovenskos.r.o.,Bratislava,Slovakia 100.0 37,361 1,775 10,193 175
SAPSvenskaAktiebolag,Stockholm,Sweden 100.0 179,009 10,332 10,791 164
SAPTrainingandDevelopmentInstituteFZCO,Dubai,UnitedArabEmirates 100.0 6,836 463 –43 39
SAPTürkiyeYazilimÜretimveTicaretA.S.,Istanbul,Turkey 100.0 90,901 –4,128 6,418 189
SAPUAB(Lithuania),Vilnius,Lithuania 100.0 3,048 95 38 1
SAPV(Mauritius),Ebene,Mauritius4) 0 – –139 23,882 –
SAPWestBalkansd.o.o.,Belgrade,Serbia 100.0 15,153 1,437 4,778 32
SeeWhy(UK)Limited,Windsor,UnitedKingdom 100.0 1,073 –53 267 14
SuccessFactors(UK)Limited,London,UnitedKingdom8) 100.0 26,546 888 3,218 96
SuccessFactorsIrelandLimited,Dublin,Ireland 100.0 633 25 3 –
SuccessFactorsNetherlandsB.V.,Amsterdam,theNetherlands 100.0 5,730 379 –7,288 20
Sybase(UK)Limited,Maidenhead,UnitedKingdom8) 100.0 – –2 348 –
SybaseAngola,Ltd.,Luanda,Angola 100.0 – – 1,607 –
SybaseIberiaS.L.,Madrid,Spain 100.0 – 17 65,937 –
SycloInternationalLimited,Leatherhead,UnitedKingdom8) 100.0 – – – –
SystemsApplicationsProductsAfricaRegion(Proprietary)Limited,Johannesburg,SouthAfrica
100.0 94,963 3,847 28,584 8
SystemsApplicationsProductsAfrica(Proprietary)Limited,Johannesburg,SouthAfrica 100.0 – –1 64,816 –
SystemsApplicationsProductsNigeriaLimited,Abuja,Nigeria 100.0 18,782 –1,492 1,334 64
SystemsApplicationsProductsSouthAfrica(Proprietary)Limited,Johannesburg,SouthAfrica 89.5 235,092 –1,640 –7,881 446
TheInfohrmGroupLtd.,London,UnitedKingdom8) 100.0 22 –98 1,295 –
TRXEurope,Ltd.,London,UnitedKingdom 100.0 209 –45 509 20
TRXLuxembourg,S.a.r.l.,LuxembourgCity,Luxembourg 100.0 – – 1,633 –
TRXUK,Ltd.,London,UnitedKingdom 100.0 – – 554 –
AMERICAS110405,Inc.,NewtownSquare,Pennsylvania,USA 100.0 – – 17,209 –
AribaCanada,Inc.,Mississauga,Canada 100.0 4,842 186 1,463 25
Ariba,Inc.,Sunnyvale,California,USA 100.0 430,080 –97,920 3,436,913 1,242
AribaInternationalHoldings,Inc.,Wilmington,Delaware,USA 100.0 – – – –
260 Consolidated Financial Statements IFRS

AsatDecember31,2014 Ownership TotalRevenuein
20141)
Profit/Loss(–)
afterTaxfor20141)
TotalEquityasat12/31/20141)
NumberofEmployees
asat12/31/20142)
NameandLocationofCompany % €(000) €(000) €(000)
AribaInternational,Inc.,Wilmington,Delaware,USA 100.0 6,807 380 –3,681 –
AribaInvestmentCompany,Inc.,Wilmington,Delaware,USA 100.0 373 5,327 244,911 –
BusinessObjectsOptionLLC,Wilmington,Delaware,USA 100.0 – 852 73,290 –
CapturaSoftware,Inc.,Wilmington,Delaware,USA 100.0 – – – –
ClearTripInc.,GeorgeTown,CaymanIslands 54.2
CNQROperationsMexicoS.de.R.L.de.C.V.,SanPedroGarzaGarcia,Mexico 100.0 214 9 211 16
Concur(Canada),Inc.,Toronto,Canada 100.0 371 11 3,782 31
ConcurHoldings(US)LLC,Wilmington,Delaware,USA 100.0 – – 106 –
ConcurPerfectTripFundLLC,Wilmington,Delaware,USA 100.0 – – – –
ConcurTechnologies,Inc.,Wilmington,Delaware,USA 100.0 30,998 –5,209 7,098,997 2,367
ExtendedSystems,Inc.,Boise,Idaho,USA 99.0 – –93 18,658 –
Fieldglass,Inc.,Chicago,Illinois,USA 100.0 49,640 –72 802,515 362
GelcoInformationNetwork,Inc.,Bellevue,Washington,USA 100.0 – – 39,079 –
GelcoInformationNetworkGSD,Inc.,Wilmington,Delaware,USA 100.0 – – – –
H-GHoldings,Inc.,Wilmington,Delaware,USA 100.0 – – 21,456 –
H-GIntermediateHoldings,Inc.,Wilmington,Delaware,USA 100.0 – – 21,456 –
FinancialFusion,Inc.,Concord,Massachusetts,USA 100.0 – – – –
FreeMarketsInternationalHoldingsInc.deMexico,deS.deR.L.deC.V.,MexicoCity,Mexico
100.0 – – –61 –
FreeMarketsLtda.,SãoPaulo,Brazil 100.0 65 –78 –546 –
hybrisCanada,Inc.,Montréal,Canada 100.0 37,214 –499 –523 256
hybris(US)Corp.,Wilmington,Delaware,USA 100.0 70,808 –643 25,615 185
iAnywhereSolutions,Inc.,Dublin,California,USA 99.0 58,089 16,452 212,818 36
InxightFederalSystemsGroup,Inc.,Wilmington,Delaware,USA 100.0 – – 75 –
Jobs2Web,Inc.,Minnetonka,Minnesota,USA 100.0 54 27 5,760 –
OuttaskLLC,Wilmington,Delaware,USA 100.0 – – – –
PlateauSystemsLLC,Arlington,Virginia,USA 100.0 582 3,660 16,147 –
QuadremBrazilLtda.,RiodeJaneiro,Brazil 100.0 22,784 –488 6,946 157
QuadremCanadaLtd.,Mississauga,Canada 100.0 827 32 563 7
QuadremChileLtda.,SantiagodeChile,Chile 100.0 13,958 –1,608 47 173
QuadremColombiaSAS,Bogotá,Colombia 100.0 236 –21 –4 –
QuadremInternationalLtd.,Hamilton,Bermuda 100.0 19,241 9,878 89,505 –
QuadremPeruS.A.C.,Lima,Peru 100.0 4,204 –343 –2,600 91
SanBorjaPartricipadoesLTDA,SãoPaulo,Brazil 100.0 – – – –
SAPAmerica,Inc.,NewtownSquare,Pennsylvania,USA 100.0 3,576,310 –273,031 13,579,632 5,777
SAPAndinaydelCaribeC.A.,Caracas,Venezuela 100.0 11,749 5,597 –42,193 26
SAPArgentinaS.A.,BuenosAires,Argentina 100.0 173,060 52,125 47,823 548
SAPBrasilLtda,SãoPaulo,Brazil 100.0 516,203 –3,965 38,209 1,488
SAPCanada,Inc.,Toronto,Canada 100.0 639,306 37,393 501,468 2,287
SAPChileLimitada,Santiago,Chile 100.0 – 1,460 –29,671 104
261Notes to the Consolidated Financial Statements
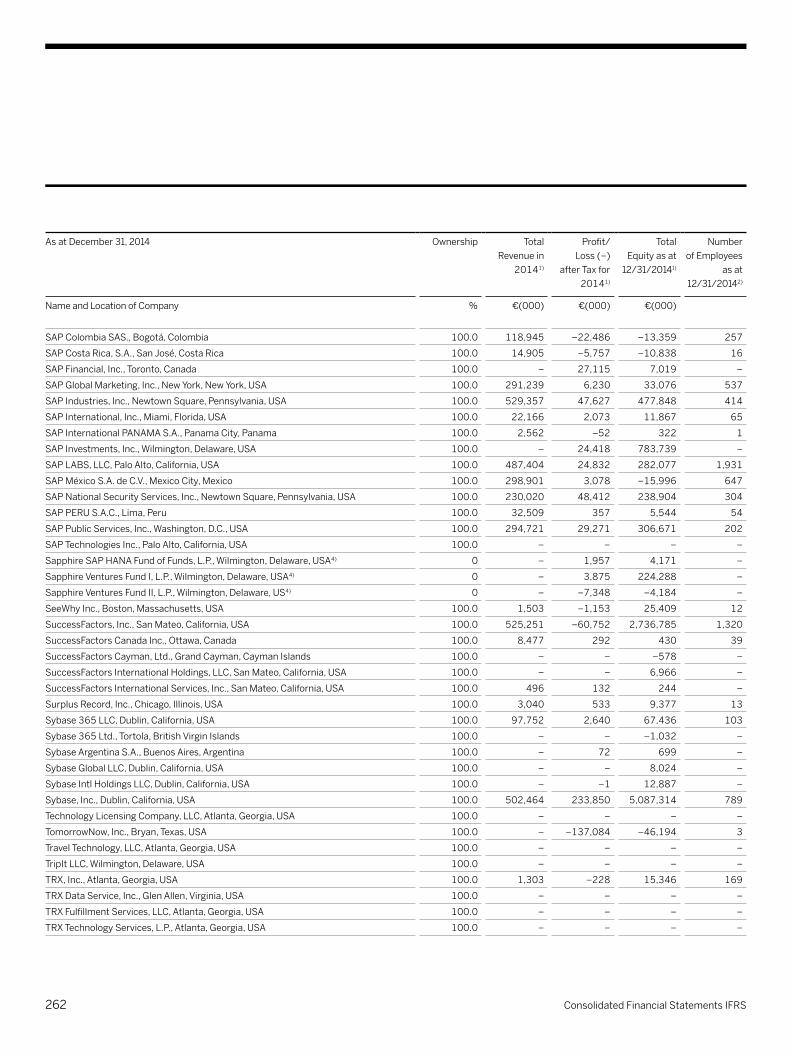
AsatDecember31,2014 Ownership TotalRevenuein
20141)
Profit/Loss(–)
afterTaxfor20141)
TotalEquityasat12/31/20141)
NumberofEmployees
asat12/31/20142)
NameandLocationofCompany % €(000) €(000) €(000)
SAPColombiaSAS.,Bogotá,Colombia 100.0 118,945 –22,486 –13,359 257
SAPCostaRica,S.A.,SanJosé,CostaRica 100.0 14,905 –5,757 –10,838 16
SAPFinancial,Inc.,Toronto,Canada 100.0 – 27,115 7,019 –
SAPGlobalMarketing,Inc.,NewYork,NewYork,USA 100.0 291,239 6,230 33,076 537
SAPIndustries,Inc.,NewtownSquare,Pennsylvania,USA 100.0 529,357 47,627 477,848 414
SAPInternational,Inc.,Miami,Florida,USA 100.0 22,166 2,073 11,867 65
SAPInternationalPANAMAS.A.,PanamaCity,Panama 100.0 2,562 –52 322 1
SAPInvestments,Inc.,Wilmington,Delaware,USA 100.0 – 24,418 783,739 –
SAPLABS,LLC,PaloAlto,California,USA 100.0 487,404 24,832 282,077 1,931
SAPMéxicoS.A.deC.V.,MexicoCity,Mexico 100.0 298,901 3,078 –15,996 647
SAPNationalSecurityServices,Inc.,NewtownSquare,Pennsylvania,USA 100.0 230,020 48,412 238,904 304
SAPPERUS.A.C.,Lima,Peru 100.0 32,509 357 5,544 54
SAPPublicServices,Inc.,Washington,D.C.,USA 100.0 294,721 29,271 306,671 202
SAPTechnologiesInc.,PaloAlto,California,USA 100.0 – – – –
SapphireSAPHANAFundofFunds,L.P.,Wilmington,Delaware,USA4) 0 – 1,957 4,171 –
SapphireVenturesFundI,L.P.,Wilmington,Delaware,USA4) 0 – 3,875 224,288 –
SapphireVenturesFundII,L.P.,Wilmington,Delaware,US4) 0 – –7,348 –4,184 –
SeeWhyInc.,Boston,Massachusetts,USA 100.0 1,503 –1,153 25,409 12
SuccessFactors,Inc.,SanMateo,California,USA 100.0 525,251 –60,752 2,736,785 1,320
SuccessFactorsCanadaInc.,Ottawa,Canada 100.0 8,477 292 430 39
SuccessFactorsCayman,Ltd.,GrandCayman,CaymanIslands 100.0 – – –578 –
SuccessFactorsInternationalHoldings,LLC,SanMateo,California,USA 100.0 – – 6,966 –
SuccessFactorsInternationalServices,Inc.,SanMateo,California,USA 100.0 496 132 244 –
SurplusRecord,Inc.,Chicago,Illinois,USA 100.0 3,040 533 9,377 13
Sybase365LLC,Dublin,California,USA 100.0 97,752 2,640 67,436 103
Sybase365Ltd.,Tortola,BritishVirginIslands 100.0 – – –1,032 –
SybaseArgentinaS.A.,BuenosAires,Argentina 100.0 – 72 699 –
SybaseGlobalLLC,Dublin,California,USA 100.0 – – 8,024 –
SybaseIntlHoldingsLLC,Dublin,California,USA 100.0 – –1 12,887 –
Sybase,Inc.,Dublin,California,USA 100.0 502,464 233,850 5,087,314 789
TechnologyLicensingCompany,LLC,Atlanta,Georgia,USA 100.0 – – – –
TomorrowNow,Inc.,Bryan,Texas,USA 100.0 – –137,084 –46,194 3
TravelTechnology,LLC,Atlanta,Georgia,USA 100.0 – – – –
TripItLLC,Wilmington,Delaware,USA 100.0 – – – –
TRX,Inc.,Atlanta,Georgia,USA 100.0 1,303 –228 15,346 169
TRXDataService,Inc.,GlenAllen,Virginia,USA 100.0 – – – –
TRXFulfillmentServices,LLC,Atlanta,Georgia,USA 100.0 – – – –
TRXTechnologyServices,L.P.,Atlanta,Georgia,USA 100.0 – – – –
262 Consolidated Financial Statements IFRS
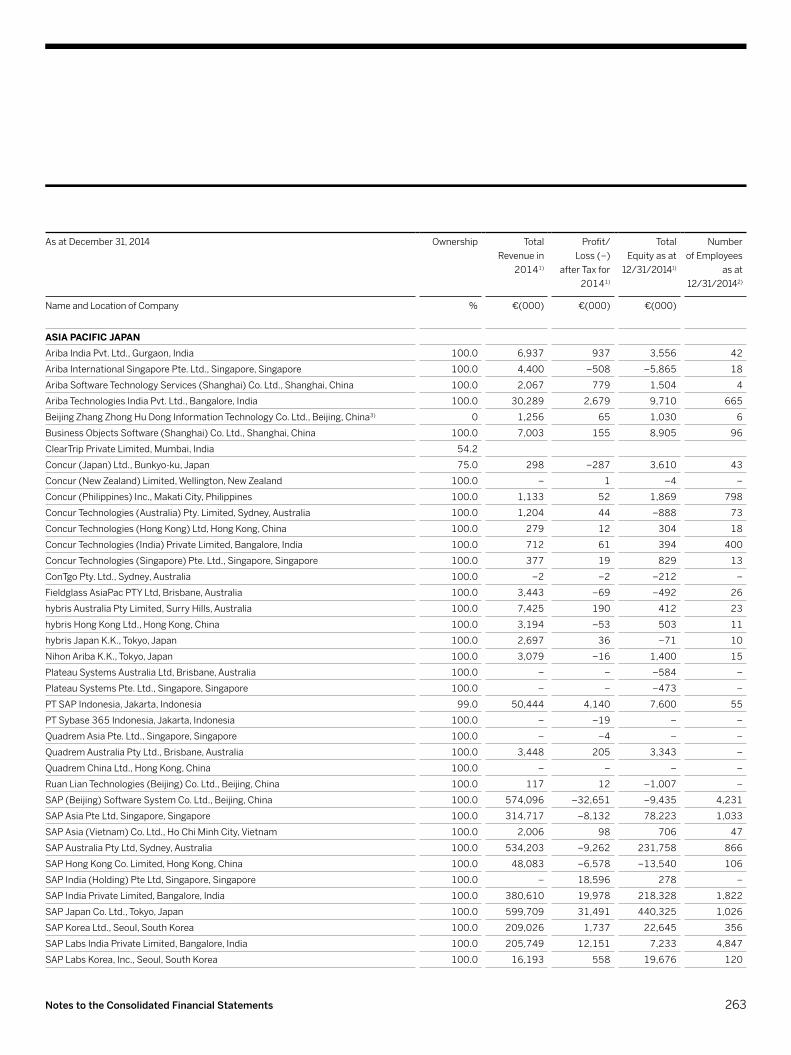
AsatDecember31,2014 Ownership TotalRevenuein
20141)
Profit/Loss(–)
afterTaxfor20141)
TotalEquityasat12/31/20141)
NumberofEmployees
asat12/31/20142)
NameandLocationofCompany % €(000) €(000) €(000)
ASIA PACIFIC JAPANAribaIndiaPvt.Ltd.,Gurgaon,India 100.0 6,937 937 3,556 42
AribaInternationalSingaporePte.Ltd.,Singapore,Singapore 100.0 4,400 –508 –5,865 18
AribaSoftwareTechnologyServices(Shanghai)Co.Ltd.,Shanghai,China 100.0 2,067 779 1,504 4
AribaTechnologiesIndiaPvt.Ltd.,Bangalore,India 100.0 30,289 2,679 9,710 665
BeijingZhangZhongHuDongInformationTechnologyCo.Ltd.,Beijing,China3) 0 1,256 65 1,030 6
BusinessObjectsSoftware(Shanghai)Co.Ltd.,Shanghai,China 100.0 7,003 155 8,905 96
ClearTripPrivateLimited,Mumbai,India 54.2
Concur(Japan)Ltd.,Bunkyo-ku,Japan 75.0 298 –287 3,610 43
Concur(NewZealand)Limited,Wellington,NewZealand 100.0 – 1 –4 –
Concur(Philippines)Inc.,MakatiCity,Philippines 100.0 1,133 52 1,869 798
ConcurTechnologies(Australia)Pty.Limited,Sydney,Australia 100.0 1,204 44 –888 73
ConcurTechnologies(HongKong)Ltd,HongKong,China 100.0 279 12 304 18
ConcurTechnologies(India)PrivateLimited,Bangalore,India 100.0 712 61 394 400
ConcurTechnologies(Singapore)Pte.Ltd.,Singapore,Singapore 100.0 377 19 829 13
ConTgoPty.Ltd.,Sydney,Australia 100.0 –2 –2 –212 –
FieldglassAsiaPacPTYLtd,Brisbane,Australia 100.0 3,443 –69 –492 26
hybrisAustraliaPtyLimited,SurryHills,Australia 100.0 7,425 190 412 23
hybrisHongKongLtd.,HongKong,China 100.0 3,194 –53 503 11
hybrisJapanK.K.,Tokyo,Japan 100.0 2,697 36 –71 10
NihonAribaK.K.,Tokyo,Japan 100.0 3,079 –16 1,400 15
PlateauSystemsAustraliaLtd,Brisbane,Australia 100.0 – – –584 –
PlateauSystemsPte.Ltd.,Singapore,Singapore 100.0 – – –473 –
PTSAPIndonesia,Jakarta,Indonesia 99.0 50,444 4,140 7,600 55
PTSybase365Indonesia,Jakarta,Indonesia 100.0 – –19 – –
QuadremAsiaPte.Ltd.,Singapore,Singapore 100.0 – –4 – –
QuadremAustraliaPtyLtd.,Brisbane,Australia 100.0 3,448 205 3,343 –
QuadremChinaLtd.,HongKong,China 100.0 – – – –
RuanLianTechnologies(Beijing)Co.Ltd.,Beijing,China 100.0 117 12 –1,007 –
SAP(Beijing)SoftwareSystemCo.Ltd.,Beijing,China 100.0 574,096 –32,651 –9,435 4,231
SAPAsiaPteLtd,Singapore,Singapore 100.0 314,717 –8,132 78,223 1,033
SAPAsia(Vietnam)Co.Ltd.,HoChiMinhCity,Vietnam 100.0 2,006 98 706 47
SAPAustraliaPtyLtd,Sydney,Australia 100.0 534,203 –9,262 231,758 866
SAPHongKongCo.Limited,HongKong,China 100.0 48,083 –6,578 –13,540 106
SAPIndia(Holding)PteLtd,Singapore,Singapore 100.0 – 18,596 278 –
SAPIndiaPrivateLimited,Bangalore,India 100.0 380,610 19,978 218,328 1,822
SAPJapanCo.Ltd.,Tokyo,Japan 100.0 599,709 31,491 440,325 1,026
SAPKoreaLtd.,Seoul,SouthKorea 100.0 209,026 1,737 22,645 356
SAPLabsIndiaPrivateLimited,Bangalore,India 100.0 205,749 12,151 7,233 4,847
SAPLabsKorea,Inc.,Seoul,SouthKorea 100.0 16,193 558 19,676 120
263Notes to the Consolidated Financial Statements

AsatDecember31,2014 Ownership TotalRevenuein
20141)
Profit/Loss(–)
afterTaxfor20141)
TotalEquityasat12/31/20141)
NumberofEmployees
asat12/31/20142)
NameandLocationofCompany % €(000) €(000) €(000)
SAPMalaysiaSdn.Bhd.,KualaLumpur,Malaysia 100.0 103,687 5,613 11,758 118
SAPNewZealandLimited,Auckland,NewZealand 100.0 76,095 5,446 52,808 103
SAPPhilippines,Inc.,Makati,Philippines 100.0 38,545 –2,832 –919 147
SAPSYSTEMS,APPLICATIONSANDPRODUCTSINDATAPROCESSING(THAILAND)LTD.,Bangkok,Thailand
100.0 81,508 2,848 15,845 63
SAPTaiwanCo.Ltd.,Taipei,Taiwan 100.0 90,469 14,098 46,933 128
ShanghaiSuccessFactorsSoftwareTechnologyCo.,Ltd.,Shanghai,China 100.0 15,738 1,578 1,990 189
SuccessFactors(Philippines),Inc.,PasigCity,Philippines 100.0 3,403 82 107 101
SuccessFactorsAsiaPacificLimited,HongKong,China 100.0 6 – –571 –
SuccessFactorsAustraliaHoldingsPtyLtd.,Brisbane,Australia 100.0 – –3,195 –17,912 –
SuccessFactorsAustraliaPtyLimited,Brisbane,Australia 100.0 21,976 837 8,825 109
SuccessFactorsBusinessSolutionsIndiaPrivateLimited,Bangalore,India 100.0 12,128 215 684 219
SuccessFactorsHongKongLimited,HongKong,China 100.0 2,013 83 1,634 –
SuccessFactorsJapanK.K.,Tokyo,Japan 100.0 3,025 –107 –94 14
SuccessFactorsSingaporePte.Ltd.,Singapore,Singapore 100.0 4,240 179 342 19
SybaseHongKongLtd,HongKong,China 100.0 – –2 – –
SybaseIndiaLtd.,Mumbai,India 100.0 – 4 2,354 –
SybasePhilippines,Inc.,MakatiCity,Philippines 100.0 – 2 –7 –
SybaseSoftware(China)Co.Ltd.,Beijing,China 100.0 22,405 –2,571 16,501 296
SybaseSoftware(India)PrivateLtd,Mumbai,India 100.0 14,586 1,199 10,638 228
TRXTechnologiesIndiaPrivateLimited,RamanNagar,India 100.0 – –50 1,845 1
II. JOINT OPERATIONS AND INVESTMENTS IN ASSOCIATESAlteryx,Inc.,Irvine,California,USA 13.89 30,045 –8,191 11,497 182
ChinaDataComCorporationLimited,Guangzhou,China 28.30 36,934 –3,658 37,418 880
GreaterPacificCapital(Cayman)L.P.,GrandCayman,CaymanIslands 5.35 315 –769 339,250 –
ProcurementNegóciosEletrônicosS/A,RiodeJaneiro,Brazil 17.00 24,582 1,281 14,440 –
SAP-NOVABASE,A.C.E.,PortoSalvo,Portugal 66.66 – – 5 –
Yapta,Inc.,Seattle,Washington,USA 46.60
1)ThesefiguresarebasedonourlocalIFRSfinancialstatementspriortoeliminationsresultingfromconsolidationandthereforedonotreflectthecontributionofthesecompaniesincludedintheConsolidatedFinancialStatements.ThetranslationoftheequityintoGroupcurrencyisbasedonperiod-endclosingexchangerates,andonaverageexchangeratesforrevenueandnetincome/loss.
2)AsatDecember31,2014,includingmanagingdirectors,inFTE.3)AgreementswiththeothershareholdersprovidethatSAPSEfullycontrolstheentity.4)SAPSEdoesnotholdanyownershipinterestsinfourstructuredentities,SAPV(Mauritius),SapphireSAPHANAFundofFunds,L.P.,SapphireVenturesFundI,L.P.andSapphireVenturesFundII,L.P.However,basedonthetermsoflimitedpartnershipagreementsunderwhichtheseentitieswereestablished,SAPSEisexposedtothemajorityofthereturnsrelatedtotheiroperationsandhasthecurrentabilitytodirecttheseentities'activitiesthataffectthesereturns,inaccordancewithIFRS10.Accordingly,theresultsofoperationsareincludedinSAP’sconsolidatedfinancialstatements.
5)EntitywhosepersonallyliablepartnerisSAPSE.6)Entitywithprofitandlosstransferagreement.7)PursuanttoHGB,section264(3)orsection264b,thesubsidiaryisexemptfromapplyingcertainlegalrequirementstotheirstatutorystand-alonefinancialstatementsincludingtherequirementtopreparenotestothefinancialstatementsandareviewofoperations,therequirementofindependentauditandtherequirementofpublicdisclosure.
8)Pursuanttosections479Ato479CoftheUKCompaniesAct2006,theentityisexemptfromhavingitsfinancialstatementsauditedonthebasisthatSAPSEhasprovidedaguaranteeoftheentity’sliabilitiesinrespectofitsfinancialyearendedDecember31,2014.
264 Consolidated Financial Statements IFRS

AsatDecember31,2014
NameandLocationofCompany
III. OTHER EQUITY INVESTMENTS(ownership of 5% or more)
AlchemistAcceleratorFundILLC,SanFrancisco,California,USA
AllTaxPlatform-SolucoesTributariasS.A.,SãoPaulo,Brazil
AmplifyPartnersL.P.,Cambridge,Massachusetts,USA
ArisGlobalHoldingsLLC,Stamford,Connecticut,USA
Convercent,Inc.,Denver,Colorado,USA
CostanoaVentureCapitalIIL.P.,PaloAlto,California,USA
DataCollectiveIIL.P.,SanFrancisco,California,USA
DataCollectiveIIIL.P.,SanFrancisco,California,USA
EITICTLabsGmbH,Berlin,Germany
EvatureTechnologies(2009)Ltd.,RamatGan,Israel
Five9,Inc.,SanRamon,California,USA
FollowAnalytics,Inc.,SanFrancisco,California,USA
GKSoftwareAG,Schöneck,Germany
InnovationLabGmbH,Heidelberg,Germany
iTACSoftwareAG,Dernbach,Germany
iYogiHoldingsPvt.Ltd.,PortLouis,Mauritius
Jibe,Inc.,NewYork,NewYork,USA
Kaltura,Inc.,NewYork,NewYork,USA
KruxDigital,Inc.,SanFrancisco,California,USA
Lavante,Inc.,SanJose,California,USA
MuleSoft,Inc.,SanFrancisco,California,USA
MVPStrategicPartnershipFundGmbH&Co.KG,Grünwald,Germany
NarrativeScience,Inc.,Chicago,Illinois,USA
Nor1,Inc.,SantaClara,California,USA
OnDeckCapital,Inc.,NewYork,NewYork,USA
OnventisGmbH,Stuttgart,Germany
OpenXSoftwareLimited,Pasadena,California,USA
PatentQuality,Inc.,Bellevue,Washington,USA
PointNineCapitalFundIIGmbH&Co.KG,Berlin,Germany
PostforSystems,Cairo,Egypt
RealizeCorporation,Tokyo,Japan
RetailSolutions,Inc.(legalname:T3C,Inc.),MountainView,California,USA
ReturnPath,Inc.,NewYork,NewYork,USA
RideCharge,Inc.,Alexandria,Virginia,USA
Rome2rioPty.Ltd.,AlbertPark,Australia
Room77,Inc.,MountainView,California,USA
Scytl,S.A.,Barcelona,Spain
SmartCityPlanning,Inc.,Tokyo,Japan
265Notes to the Consolidated Financial Statements

Walldorf,February19,2015
SAPSEWalldorf,BadenTheExecutiveBoard
Bill McDermott Robert Enslin
Bernd Leukert Luka Mucic
Gerhard Oswald
AsatDecember31,2014
NameandLocationofCompany
Socrata,Inc.,Seattle,Washington,USA
StayNTouchInc.,Bethesda,Maryland,USA
StormVenturesV,L.P.,MenloPark,California,USA
SVAngelIVL.P.,SanFrancisco,California,USA
TableNow,Inc.,SanFrancisco,California,USA
Technologie-undGründerzentrumWalldorfStiftungGmbH,Walldorf,Germany
TheSAVOGroupLtd.,Chicago,Illinois,USA
Ticketfly,Inc.,SanFrancisco,California,USA
TidalScale,Inc.,SantaClara,California,USA
Trover,Inc.,Seattle,Washington,USA
UpfrontV,LP,SantaMonica,California,USA
VisageMobile,Inc.,Larkspur,California,USA
ZendTechnologies,Ltd.,RamatGan,Israel
266 Consolidated Financial Statements IFRS
U.S.lawrequiresthatmanagementsubmitareportontheeffectivenessofinternalcontroloverfinancialreportingintheconsolidatedfinancialstatements.For2014,thatreportisasfollows:
ThemanagementofSAPisresponsibleforestablishingandmaintainingadequateinternalcontroloverfinancialreportingassuchtermisdefinedinRules13a-15(f)and15d-15(f)undertheU.S.SecuritiesExchangeActof1934.SAP’sinternalcontroloverfinancialreportingisaprocessdesignedunderthesupervisionofSAP’sCEOandCFOtoprovidereasonableassuranceregardingthereliabilityoffinancialreportingandthepreparationoffinancialstatementsforexternalreportingpurposesinaccordancewithInternationalFinancialReportingStandards(IFRS)asissuedbytheInternationalAccountingStandardsBoard(IASB).
SAP’smanagementassessedtheeffectivenessoftheCompany’sinternalcontroloverfinancialreportingasatDecember31,2014.Inmakingthisassessment,itusedthecriteriasetforthbytheCommitteeofSponsoringOrganizationsoftheTreadwayCommission(COSO)inInternalControl–IntegratedFramework(2013).
Basedontheassessmentunderthesecriteria,SAPmanagementhasconcludedthat,asatDecember31,2014,theCompany’sinternalcontroloverfinancialreportingwaseffective.
KPMGAGWirtschaftsprüfungsgesellschaft,ourindependentregisteredpublicaccountingfirm,hasissueditsattestationreportontheeffectivenessofSAP’sinternalcontroloverfinancialreporting.Itisincludedintheindependentauditor’sreportontheConsolidatedFinancialStatementsandManagementReportasatDecember31,2014.
Management’s Annual Report on Internal Control over Financial Reporting in the Consolidated Financial Statements
267Notes to the Consolidated Financial Statements

PROFITABILITY
We use Non-IFRS operating profit to measure the profitability of our company.
We saw a solid increase in this measure in 2014 (€5.64 billion) compared to 2013
(€5.48 billion) and expect to reach a range of €5.6 billion to €5.9 billion
at constant currencies in 2015, a range of €6.3 billion to €7.0 billion in 2017, and
a range of €8 billion to €9 billion in 2020.
€5.64B

Additional InformationFive-YearSummaryGlossaryAddressesFinancialandSustainabilityPublicationsFinancialCalendarPublicationDetails
269270273292293294295
269
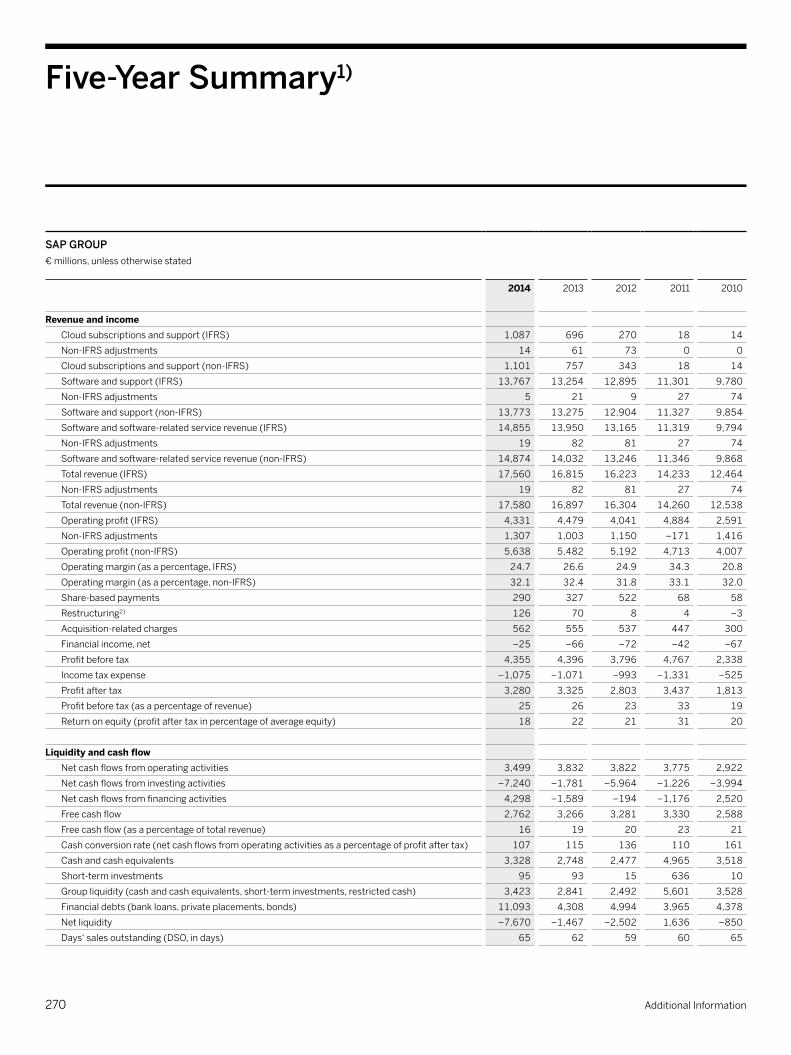
Five-Year Summary1)
SAP GROUP€millions,unlessotherwisestated
2014 2013 2012 2011 2010
Revenue and incomeCloudsubscriptionsandsupport(IFRS) 1,087 696 270 18 14
Non-IFRSadjustments 14 61 73 0 0
Cloudsubscriptionsandsupport(non-IFRS) 1,101 757 343 18 14
Softwareandsupport(IFRS) 13,767 13,254 12,895 11,301 9,780
Non-IFRSadjustments 5 21 9 27 74
Softwareandsupport(non-IFRS) 13,773 13,275 12,904 11,327 9,854
Softwareandsoftware-relatedservicerevenue(IFRS) 14,855 13,950 13,165 11,319 9,794
Non-IFRSadjustments 19 82 81 27 74
Softwareandsoftware-relatedservicerevenue(non-IFRS) 14,874 14,032 13,246 11,346 9,868
Totalrevenue(IFRS) 17,560 16,815 16,223 14,233 12,464
Non-IFRSadjustments 19 82 81 27 74
Totalrevenue(non-IFRS) 17,580 16,897 16,304 14,260 12,538
Operatingprofit(IFRS) 4,331 4,479 4,041 4,884 2,591
Non-IFRSadjustments 1,307 1,003 1,150 –171 1,416
Operatingprofit(non-IFRS) 5,638 5,482 5,192 4,713 4,007
Operatingmargin(asapercentage,IFRS) 24.7 26.6 24.9 34.3 20.8
Operatingmargin(asapercentage,non-IFRS) 32.1 32.4 31.8 33.1 32.0
Share-basedpayments 290 327 522 68 58
Restructuring2) 126 70 8 4 –3
Acquisition-relatedcharges 562 555 537 447 300
Financialincome,net –25 –66 –72 –42 –67
Profitbeforetax 4,355 4,396 3,796 4,767 2,338
Incometaxexpense –1,075 –1,071 –993 –1,331 –525
Profitaftertax 3,280 3,325 2,803 3,437 1,813
Profitbeforetax(asapercentageofrevenue) 25 26 23 33 19
Returnonequity(profitaftertaxinpercentageofaverageequity) 18 22 21 31 20
Liquidity and cash flowNetcashflowsfromoperatingactivities 3,499 3,832 3,822 3,775 2,922
Netcashflowsfrominvestingactivities –7,240 –1,781 –5,964 –1,226 –3,994
Netcashflowsfromfinancingactivities 4,298 –1,589 –194 –1,176 2,520
Freecashflow 2,762 3,266 3,281 3,330 2,588
Freecashflow(asapercentageoftotalrevenue) 16 19 20 23 21
Cashconversionrate(netcashflowsfromoperatingactivitiesasapercentageofprofitaftertax) 107 115 136 110 161
Cashandcashequivalents 3,328 2,748 2,477 4,965 3,518
Short-terminvestments 95 93 15 636 10
Groupliquidity(cashandcashequivalents,short-terminvestments,restrictedcash) 3,423 2,841 2,492 5,601 3,528
Financialdebts(bankloans,privateplacements,bonds) 11,093 4,308 4,994 3,965 4,378
Netliquidity –7,670 –1,467 –2,502 1,636 –850
Days‘salesoutstanding(DSO,indays) 65 62 59 60 65
270 Additional Information

SAP GROUP€millions,unlessotherwisestated
2014 2013 2012 2011 2010
Assets, equity and liabilitiesTradeandotherreceivables 4,430 3,962 4,005 3,577 3,177
Totalcurrentassets 8,980 7,351 6,928 9,669 7,143
Totalnon-currentassets 29,527 19,739 19,378 13,558 13,696
Deferredcloudsubscriptionandsupportrevenue(IFRS) 690 443 317 4 2
Deferredcloudsubscriptionandsupportrevenue(non-IFRS) 699 447 358 4 2
Totalcurrentliabilities(includingdeferredincome) 8,544 6,347 6,546 6,266 5,153
Totalnon-currentliabilities(includingdeferredincome) 10,366 4,695 5,627 4,254 5,862
Totalequity(includingnon-controllinginterests) 19,598 16,048 14,133 12,689 9,824
Totalassets 38,507 27,091 26,306 23,227 20,841
Equityratio(totalequityasapercentageoftotalassets) 51 59 54 55 47
Debtratio(totalliabilities3)asapercentageoftotalassets) 49 41 46 45 53
Investmentsingoodwill,intangibleassetsorproperty,plant,andequipment(includingcapitalizationsduetoacquisitions)
8,636 1,812 6,859 657 5,502
Operating expensesCostofsoftwareandsoftware-relatedservices 2,894 2,629 2,553 2,107 1,823
Thereofcostofcloudsubscriptionsandsupport 481 314 199 49 38
Costofprofessionalservicesandotherservices 2,379 2,402 2,520 2,247 2,071
Totalcostofrevenue 5,272 5,031 5,073 4,354 3,894
Cloudsubscriptionsandsupportmargin(asapercentageofcorrespondingrevenue) 55.7 54.9 26.3 –172.2 –171.4
Softwareandsoftware-relatedservicemargin(asapercentageofcorrespondingrevenue) 80.5 81.2 80.6 81.4 81.4
Professionalserviceandotherservicesmargin(asapercentageofcorrespondingrevenue) 12.1 16.2 17.6 22.9 22.4
Costofresearchanddevelopment 2,331 2,282 2,261 1,935 1,729
Costofresearchanddevelopment(asapercentageoftotalrevenue) 13 14 14 14 14
Costofresearchanddevelopment(asapercentageoftotaloperatingexpenses) 18 18 19 21 18
Costofsalesandmarketing 4,304 4,131 3,912 3,083 2,646
Costofgeneralandadministration 892 866 949 715 636
Depreciationandamortization 1,010 951 863 724 534
Financial performance measuresIssuedshares8)(inmillions) 1,229 1,229 1,229 1,228 1,227
Weightedaveragesharesoutstanding,basic(inmillions) 1,195 1,193 1,192 1,189 1,188
Earningspershare,basic(in€) 2.75 2.79 2.35 2.89 1.52
Weightedaveragesharesoutstanding,diluted(inmillions) 1,197 1,195 1,193 1,190 1,189
Earningspershare,diluted(in€) 2.74 2.78 2.35 2.89 1.52
Dividendpershare4)(in€) 1.10 1.00 0.85 1.10 0.60
Totaldividenddistributed4) 1,315 1,194 1,013 1,310 713
Totaldividenddistributed4)(asapercentageofprofitaftertax) 40 36 36 38 39
SAPsharepriceatyear-end(in€) 58.26 62.31 60.69 40.85 38.10
SAPshareprice–peak(in€) 62.55 64.80 61.43 45.90 38.40
SAPshareprice–low(in€) 50.90 52.20 41.45 34.26 31.12
Marketcapitalization8)(in€billions) 71.6 76.5 74.7 50.2 46.7
271Five-Year Summary

SAP GROUP€millions,unlessotherwisestated
2014 2013 2012 2011 2010
ReturnonSAPshares5)1-yearinvestmentperiod(asapercentage) –4.80 4.20 52.10 8.70 17.00
ReturnonSAPshares5)5-yearinvestmentperiod(asapercentage) 13.90 21.80 13.10 1.70 1.20
ReturnonSAPshares5)10-yearinvestmentperiod(asapercentage) 7.40 7.90 13.80 2.20 3.20
Employees and personnel expensesNumberofemployees6),8) 74,406 66,572 64,422 55,765 53,513
Numberofemployees,annualaverage6) 68,343 65,409 61,134 54,346 49,970
Numberofemployeesinresearchanddevelopment6),8) 18,908 17,804 18,012 15,861 15,884
Personnelexpenses 7,877 7,489 7,286 5,880 5,261
Personnelexpenses–excludingshare-basedpayments 7,587 7,162 6,764 5,812 5,203
Personnelexpensesperemployee–excludingshare-basedpayments(in€thousands) 111 109 111 107 104
WomenworkingatSAP(asapercentage) 31 31 30 30 30
Womeninmanagement8)(total,asapercentage) 21.3 21.2 20.8 19.5 18.7
Womenmanagingmanagers7),8)(asapercentage) 15.9 14.3 14.5 13.5 13.7
Womenmanagingteams7),8)(asapercentage) 23.3 21.7 21.1 20.5 19.6
EmployeeEngagementIndex(asapercentage) 79 77 79 77 68
BusinessHealthCultureIndex(asapercentage) 70 67 66 65 59
Employeeretention(asapercentage) 93.5 93.5 94.0 92.8 92.9
Totalturnoverrate(asapercentage) 9 8 7 9 9
EnvironmentNetGreenhousegasemissions(inkilotons) 500 545 485 490 455
Greenhousegasemissionsperemployee7)(intons) 7.3 8.3 7.9 9.0 8.7
Greenhousegasemissionsper€revenue(ingrams) 28.4 32.4 30.0 34.4 36.3
Totalenergyconsumption(inGWh) 920 910 860 860 845
Energyconsumedperemployee7)(inkWh) 13,400 13,900 14,000 15,700 16,100
Datacenterenergyconsumed(inGWh) 179 173 160 154 144
Datacenterenergyperemployee7),10)(inkWh) NA 2,633 2,598 2,824 2,746
Datacenterenergyper€revenue11)(inkWh) 10 NA NA NA NA
Renewableenergysourced(asapercentage) 100 43 51 32 32
Customer CustomerNetPromoterScore9),12)(asapercentage) 19.1 12.1 8.9 NA NA
1)Amountsfor2010to2014accordingtoIFRS,unlessotherwisestated2)Includes-€5million(2010)acquisition-relatedcharges3)Sumofcurrentandnoncurrentliability4)2014numbersarebasedontheproposeddividendfor2014andon2014closingleveloftreasurystock.5)Assumingalldividendsarereinvested6)Full-timeequivalents7)Relatestodifferentlevelsofmanagementposition8)Numbersbasedonyear-end9)In2012,weadoptedanewmethodologyformeasuringcustomerloyalty:Netpromoterscore(NPS).TherearethereforenocomparableNPSvaluesforyearspriorto2012.10)Duetotheintegrationofcloudcapacityofexternalnon-SAPdatacentersnormalizingenergyconsumptionagainstSAPemployeesbecomesmeaningsless;KPIdiscontinued.11)Datacenterenergyconsumptionnormalizedagainst€revenuecombinesarelativemeasureofrequiredenergytodevelopandoperatesolutionininternalandexternaldatacenter.12)Inadditiontoouron-premisecustomers,in2014,forthefirsttimeweincludedAriba,SuccessFactors,andSybasecustomersinthesurvey.Therefore,the2014CustomerNPSisnotfullycomparabletotheprioryear’sscore.
272 Additional Information

A
AA1000 AccountAbility Principles Standard (AA1000APS)–Providesaframeworkfororganizationstoidentify,prioritize,andrespondtosustainabilitychallenges.TheotherAA1000standards–theAssuranceStandardandtheStakeholderEngagementStandard–arebasedontheAPSprinciplesandsupporttheirachievement.
Americas’ SAP Users’ Group (ASUG)–Non-profitorganizationofSAPcustomercompaniesdedicatedtoprovidingeducationalandnetworkingopportunitiesinsupportofSAPsoftwareandimplementation.TheseusergroupsareestablishedinregionsaroundtheworldtoshareknowledgeandinfluenceSAPdevelopmentefforts.ASUGisthelargestusergroupwithmorethan100,000individualsat3,800companiesinmorethan17industriesacrosstheSAPecosystem.
analytics–Dataanalysistypicallygeneratedintheformofreportsandchartsthatcanbeusedforbusinessinsightanddecisionmaking.
analytics solutions from SAP–AnalyticssolutionsfromSAPenablepeopletounleashthepowerofcollectiveinsightinBigDatabyempoweringthemwiththerightinformationattherighttimetomakeinsightfulbusinessdecisions,anticipatechange,anduncovernewopportunities.Analyticssolutionscovertheareasofbusinessintelligence,enterpriseperformancemanagement,andgovernance,risk,andcompliance.
application–Softwarethatenablesorganizationstoaddressspecificbusinessneedsandtoperformcertainbusinessprocessesoractivities.
application lifecycle management–Describestheprocesses,tools,services,andorganizationalmodelusedtomanageSAPandnon-SAPsoftwarethroughoutthesolutionlifecycle,fromconcepttophase-out.ThisrecommendedapproachtoapplicationlifecyclemanagementenablescompaniestoadoptinnovationsfromSAPrapidlyandgainoptimalvaluefromtheirbusinesssolutions.
applied analytics–CategoryofofferingswithintheportfolioofanalyticssolutionsfromSAPcomprisingindividualofferingsforanalyticapplications,analyticcontent,andaccelerators.
Ariba–CompanyacquiredbySAPinOctober2012.Allcloud-relatedsupplierassetsofSAParenowconsolidatedunderAriba,whichoperatesasanindependentbusinessunderthename“Ariba,anSAPcompany.”Aribasolutionsforprocurement,financials,andsourcing,aswellastheAribaNetwork,continuetomaintaintheAribabrand.
Ariba Network–Businesscommercenetworkwherecompaniesofallsizescanconnecttotheirtradingpartnersanywhere,atanytimefromanyapplicationordevicetobuy,sell,andmanagetheircashmoreefficientlyandeffectivelythaneverbefore.CompaniesaroundtheworldusetheAribaNetworktosimplifyinterenterprisecommerceandenhancetheresultstheydeliver.See“businessnetwork.”
B
best practice–Amanagementconceptthatinvolvesdevisingamethodofprocessthatmosteffectivelyproducesadesiredoutcome.SAPapplicationsusebusinessbestpracticestohelpcustomersautomatecommonbusinessprocessesthroughsoftwareandtechnology.See“SAPBestPractices.”
Big Data–Thelargevolumeofdatacreatedbybillionsofconnecteddevicesandpeoplegeneratingatremendousamountofinformationabouttheirbehavior,location,andactivity.Thisavailabilityofmassiveamountsofdatarequirescompaniestorethinktechnologyarchitectureanddatabasestructures.
Business Health Culture Index–Ascoreforthegeneralculturalconditionsinanorganizationthatenableemployeestostayhealthyandbalanced.Theindexiscalculatedbasedontheresultsofregularemployeesurveys.
business intelligence (BI)–Softwarethatenablesuserstoanalyzeanorganization’srawdataandmakefact-baseddecisions.BI-relatedprocessesincludedatamining,analyticalprocessing,querying,andreporting.SAPBusinessObjectsBIsolutionsincludetheSAPBusinessObjectsBIplatform,SAPCrystalReports,SAPBusinessObjectsDashboards,andSAPLumira.
Glossary
273Glossary

CO2 equivalent–Ameasuretocomparetheemissionsofvariousgreenhousegasesbasedupontheirglobalwarmingpotential.Forexample,theglobalwarmingpotentialformethaneover100yearsis21.Thismeansthatemissionsofonemillionmetrictonsofmethaneareequivalenttoemissionsof21millionmetrictonsofcarbondioxide.
component–Modularpieceofsoftwareofferingfunctionsaccessibleviainterfaces.
Concur Technologies–TravelandexpensemanagementcompanyacquiredbySAPin2014todeliveranewmodelformanagingbusinessresources,processes,andspendthroughtheworld’slargestbusinessnetworkinthecloudforT&E.core applications–StandardbusinessapplicationsavailableinSAPBusinessSuite,includingSAPERP,SAPCustomerRelationshipManagement(SAPCRM),SAPProductLifecycleManagement(SAPPLM),SAPSupplyChainManagement(SAPSCM),andSAPSupplierRelationshipManagement(SAPSRM).
corporate social responsibility–SAP’scorporatesocialresponsibility(CSR)programisabouthowthecompanycreatessocialimpactforpeople,bothinsideandoutsideSAP,tohelpmakesocietymoresustainableandtheworldrunbetter.
customer connection–AsimpleprocessdirectedatincrementallyenhancingandimprovingtheproductsandsolutionsSAPcustomersareusingtoday.ItoffersSAPcustomerstheopportunitytosuggestsmallenhancementstoproductsandsolutionsinmainstreammaintenance,forfastandnon-disruptivedeliveryusingnotesandsupportpackages.
customer engagement lifecycle–Modelthatprovidesanintegratedframeworkofpracticestohelpcreateanddelivercustomervalue.ThephasesofthecustomerengagementlifecyclerepresentthecommonroutefollowedbytheSAPandthecustomerteamsintheprocessofidentifying,delivering,operating,andmanagingsolutionsthatbestfitthecustomer’sneeds.
business network–Anonlineservicethatconnectsbusinessesandtheirsystemstothoseoftheirtradingpartnersandenablesnewprocessesandinformationandinsightsharingonlypossibleinadigitalenvironment.See“AribaNetwork.”
business priority–Animportanttopicforsuccessinbusinessorindustry.SAPrecommendsend-to-endsolutionsbybusinessprioritytohelpbusinessesrunbetterandaddressthecomplexandchallengingrequirementswithintheirparticularindustriesorfunctionalareas.See“end-to-endsolution.”
business process–Setoflogicallyrelatedactivitiesperformedwithinanorganizationtocompleteadefinedbusinesstask.Orderprocessingisatypicalexample.SAPprovidessoftwareandtechnologythatenableandsupportbusinessprocesses.
C
carbon offset or greenhouse gas (GHG) offset–Aunitofcarbondioxide-equivalent(CO2equivalent)thatisreduced,avoided,orsequesteredtocompensateforemissionsoccurringelsewhere.
cloud computing–Generictermforflexible,IT-relatedservicesavailablethrough,orhostedon,theInternetforconsumersandbusiness,includingstorage,computingpower,softwaredevelopmentenvironments,andapplications,combinedwithservicedelivery.Accessedasneeded“inthecloud,”theseserviceseliminatetheneedforin-houseITresources.See“softwareasaservice.”
cloud deployment models–Thedifferentinfrastructure,softwarelifecyclemanagement,andlicensingmodelsusedfordeployingsoftware,thatis,wherethesoftwareisrunningandhowmuchcontrolandflexibilityacustomerhas.
cloud service model–“As-a-service”offeringswherecloudservicesareofferedeitherassoftwareasaservice(SaaS),platformasaservice(PaaS),andinfrastructureasaservice(IaaS).
cloud solutions from SAP–CategoryusedtocommunicateallofSAPofferingsandeffortsrelatedtothecloud,includingplatform,managedservices,solutions,technology,andinfrastructure.Itincludesline-of-businesscloudapplicationsfrombothSuccessFactorsandSAP.
274 Additional Information

Customer Net Promoter Score (NPS)–Describesthewillingnessofcustomerstorecommendorpromoteanorganizationorcompanytoothers.Itisdefinedasthepercentageofcustomersthatarelikelytorecommendanorganizationorcompanytofriendsorcolleagues(promoters)minusthepercentageofcustomersthatareunlikelytodoso.
D
data center energy–TheamountofenergyconsumedinSAP’sdatacentersrelatedtothenumberofemployees(expressedinfull-timeequivalents/FTEs).
data warehouse–Anelectroniccollectionofinformationorganizedforeasyaccessbycomputerprograms.See“SAPBusinessWarehouse.”
design thinking–Amethodologyforroutineinnovationthatbringstogethertherightsideofthebrain(creative)withtheleftsideofthebrain(analytical).
DSAG–AbbreviationforDeutschsprachigeSAP-Anwendergruppe(German-SpeakingSAPUsers’Group),withmorethan50,000membersin2,900membercompaniesinGerman-speakingcountriesandbeyond.
E
Early Knowledge Transfer–SAPtrainingprogramthatdeliversearlyproduct-relatedknowledgetopresales,sales,consultants,partners,andsupportteams.Thisprogramcontributestothesuccessfulimplementationoframp-upprojectsandisacrucialelementoftheramp-upprocessintheproductinnovationlifecycleatSAP.FormerlycalledRamp-UpKnowledgeTransfer.
ecosystem–ConstructencompassingSAPanditscustomersandpartnersthatextendsthevalueSAPprovidestoitscustomers.Bybringingtogethercommunity-basedinsight,innovativepartnersolutions,andindustry-leadingcollaborationandco-innovation,itenablescustomerstoextractthegreatestpossiblevaluefromtheirSAPinvestments.
electronic waste (e-waste)–Electronicproductsthatarediscardedbyconsumersorcompanies,suchascomputers,computermonitors,ormobiledevices.
Employee Engagement Index–Ascoreforthelevelofemployeecommitment,pride,andloyalty,aswellasthefeelingofemployeesofbeingadvocatesfortheircompany.Theindexiscalculatedbasedontheresultsofregularemployeesurveys.
employee retention–Theratiooftheaverageheadcount(expressedinfull-timeequivalents/FTEs)minusemployee-initiatedterminations(turnover)dividedbytheaverageheadcount,takingintoaccountthepast12months.
end-to-end process–Setofactivitiessupportingdefinedmanagement,core,orsupportprocesses.Customerscanusetheseactivitiesasareferencetomaptheirownprocesses.
end-to-end solution–Solutionsthatdrivestrategicbusinessoutcomesanddirectlycontributetoabusinesspriorityinanindustry,lineofbusiness,ortechnologyarea.Thesolutionsarestructuredintosolutioncapabilitieswhichcompriseanumberofindividualproductsand/orlicensematerials.End-to-endsolutionsprovideabusinessscopewithacomprehensivevalueproposition.See“businesspriority.”
enhancement package–Optionalsoftwarepackagesthatenablecompaniestotakeadvantageofinnovationwhilekeepingtheircoresoftwarestable.Enhancementpackagescontainimprovedgeneralbusinessandindustryfunctionality,enterpriseservices,andotheruserinterfaceandfunctionalimprovements.Organizationscanactivateselectedbusinessfunctionscontainedwithintheenhancementpackagesanddeploythemontheirowntimetablewithminimaldisruptiontobusinessoperations.
enterprise mobility–Termusedinbusinessandindustrytorefertotheconceptandapproachtomakingabusinessmobile.AtSAP,weuse“enterprisemobility”asourumbrellatermforanoverallmobilestrategy.
enterprise resource planning–See“SAPERP.”
275Glossary

H
Hasso Plattner Founders' Award–Introducedin2014,anemployeeawardthatsignifiesthehighestemployeerecognitionatSAP,awardedannuallybytheCEOtoanindividualorateam.
hybrid cloud–Ahybridclouddeploymentmodelusesresourcescomprisedofamixoftwoormoredistinctclouddeploymentmodelsthatareintegratedbystandardizedorproprietarytechnologyenablingdataandapplicationportability.
hybrid landscape–Amixofon-premiseandanyclouddeploymentmodel(s).Alternativelyreferredtoasan“onpremisetocloud”or“hybridenvironment.”
hybris–CompanyacquiredbySAPinAugust2013thatoffersanextensibleomnichannelcommerceplatformthathelpsbusinessessellmoregoods,services,anddigitalcontentthrougheverytouchpoint,channel,anddevice.TherenamedhybrisCommerceSuite(SAPhybrisB2BCommerceandSAPhybrisB2CCommercesolutions)supportproductcontentmanagementandunifiedcommerceprocessesthatgiveabusinessasingleviewofitscustomers,products,andorders,anditscustomersasingleviewofthebusiness.hybrisoperatesasanindependentbusinessunderthename“hybris,anSAPcompany.”
I
in-memory computing–Amajoradvanceininformationtechnologythatcreatesadramaticchangeincomputing,analytics,anddatastorage.Combiningadvancesinmulticoreprocessingwithmoreaffordableservers,in-memorycomputingallowsinformationtobestoredinthemainmemoryratherthaninrelationaldatabasestogreatlyaccelerateprocessingtimes.ItdisruptsthetraditionalITstackcomprisedofhardware,middleware,andsoftware,wheredisk-basedrelationaldatabasescanbecomebottlenecks.
F
Fieldglass–CompanyacquiredbySAPin2014tostrengthenthecloudportfoliowithauniqueend-to-endsolutionthataddressestheentireworkforceincludingcontractworkersandpermanentstaff.FieldglasssoftwareofferingsareavailablenowasSAPFieldglassApprovals,SAPFieldglassContingentWorkforceManagement,SAPFieldglassServicesProcurement,SAPFieldglassVendorManagement,andSAPFieldglassWorkerProfileManagement.
G
Global Customer Reference Program–SAPprogramofferingdetailedinformationaboutreferencecustomersfromaroundtheworld,usingadatabasethatchannelpartnerscanaccesstohelpcloseadealwithanewSAPcustomer.ReferencecustomershaveagreedtoparticipateinoneormorereferenceactivitiesonbehalfofSAP.
Global Partner Operations–AsofMay2014,GlobalPartnerOperations(GPO)isthenewnameofSAPEcosystem&Channels(ECO).ItbringsallSAPpartnerrelationshipsunderoneleaderandoneorganization.ItincludestheexistingSAPEcosystem&Channelsteamandisresponsibleformanagingstrategicpartnerships,aswellastheSAPBusinessOnechannelandthegrowingOEMbusiness.
Global Reporting Initiative (GRI)–Anon-profitorganizationthatprovidescompaniesandorganizationswithacomprehensivesustainabilityreportingframeworkthatiswidelyusedaroundtheworld.
greenhouse gas footprint–Thesumofallgreenhousegasemissionsmeasuredandreported,includingrenewableenergyandthird-partyreductions,forexample,offsets.
Greenhouse Gas Protocol (GHG Protocol)–Themostwidelyusedinternationalaccountingtooltounderstand,quantify,andmanagegreenhousegasemissions.
276 Additional Information

in-memory database–Databasethatkeepsallactiverecordsinmainmemoryratherthanondisk.Accessingin-memoryrecordsisconsiderablyfasterthanretrievingthemfromthedisk,significantlyincreasingperformance.SAPHANAisSAP’sgroundbreakingdatabasethatallowsbusinessestotakeadvantageofin-memorycomputing.See“SAPHANA.”
in-memory data fabric–AconceptthatusessmartdataaccesstechnologyfromSAPHANAtodeliveracceleratedbusinessintelligencetocustomers.
inclusivity–Foranorganizationthatacceptsitsaccountabilitytothoseitimpactsandwhoimpactit:Theparticipationofstakeholdersindevelopingandachievingastrategicandaccountableresponsetosustainability.
independent software vendor (ISV)–Companythatmakesandsellssoftwareproductsthatrunononeormorecomputerhardwareoroperatingsystemplatforms.
industry–Aneconomicsectorcharacterizedbyavaluechain,businessprocesses,andasetofproductsandservicesthatistypicalorcommonforallcompaniesbelongingtothissector.AtSAP,“industries”isalsousedasatermtodifferentiatebetweenlines-of-businessfunctionssuchasmarketing,procurement,andfinance,andthosefunctionsspecifictoanindustry.
industry portfolios–SAPofferssoftwareportfoliosthataddressthebusinessneedsof25differentindustries.
infrastructure as a service (IaaS)–Processing,storage,network,othercomputingresourcesandtypicallyadefinedlevelofsupportforconsumerstodeploysoftware(suchasoperatingsystemsandapplications).IaaSconsumersdonotmanageunderlyingcloudinfrastructurebutmaycontrolnetworkingcomponents(suchashostfirewalls).
Internet of Things–Afusionofthedigitalworldandthephysicalworldthatbringstogetherdifferentconceptsandtechnicalcomponents.Everydayobjectsandmachineshavesensorsthatcan“communicate”witheachotherovertheInternet,makingnewmodelspossibleforbusinessprocesses,collaboration,miniaturizationofdevices,andmobilecommunications.SAPoffersseveralsolutionsthataddresstheInternetofThings.
ISO 14001–Astandardforenvironmentalmanagementsystemsthatprovidespracticaltoolsforcompaniesandorganizationstoidentifyandcontroltheirenvironmentalimpactandconstantlyimprovetheirenvironmentalperformance.
K
key performance indicator (KPI)–Performancefigureforwhichthresholdvaluesaredefinedandagainstwhichvalidationisexecuted.
L
line of business (LoB)–Internalorganizationalareaorbusinessunitinacompany(division)thatcombinesallresponsibilitiesforaparticularproduct,group,orsetofprocesses.Examplesincludesales,purchasing,humanresources,finance,marketing,andsoon.
line-of-business portfolios–SAPofferssoftwareportfoliosthataddresstheneedsoforganizationsin12linesofbusiness,orfunctionalareas.Thefollowingsolutionportfoliosarecurrentlyavailable:SAPforAssetManagement,SAPforCommerce,SAPforFinance,SAPforHumanResources,SAPforManufacturing,SAPforMarketing,SAPforR&D/Engineering,SAPforSales,SAPforService,SAPforSourcingandProcurement,SAPforSupplyChainManagement,andSAPforSustainability.
M
maintenance–SoftwaresupportcomprisingsupportforlegalchangesandcorrectionsdeliveredthroughtheSAPNotestool,supportpackages,problemsupport,andaccesstoinformationandonlineservicechannels–dependingonthemaintenancephase.
managed cloud–Deploymentthatimpliesresourcesarededicatedtoonecustomer,managedbythecloudprovider,andaccessedthroughaVPN.SAPHANAEnterpriseCloudisSAP’smanagedcloudoffering.
277Glossary

on premise–Traditionalmodelofsoftwaredeploymentwhereenterprisespurchasesoftwarelicensesanddeployapplicationsin-house.Adeploymentmodelwhereasoftwarelicenseispurchasedanddeployedontheserversatthepremisesofthecustomer.Thecustomermanagesandcontrolsthesoftware.
open source–Softwarebasedontheconceptofsoftwaredeveloperscomingtogethertobuildavirtualcommunityandsolvingacommonproblembydevelopingworkingsoftwarethateveryonehasarighttochange.SuccessfuldevelopmentprojectsundertheopensourcemodelincludeLinux–afreeoperatingsystemsupportedbySAP.
P
platform as a service (PaaS)–Cloudinfrastructure,operatingsystem,programminglanguages,libraries,services,toolsandtypicallyadefinedlevelofsupportforconsumerstodeployconsumer-createdoracquiredapplications.PaaSconsumersdonotmanageunderlyingcloudinfrastructurebuthavecontroloverdeployedapplications.
powered by SAP HANA–AnSAPofferingpoweredbySAPHANArunsontheSAPHANAplatform.Morethan100SAPapplicationsarecurrently“poweredbySAPHANA.”PartnersolutionsorapplicationsthatarepoweredbySAPHANAarecertifiedbySAPtorunontheSAPHANAplatform.TheseapplicationstakeadvantageofdistinctivecapabilitiesofSAPHANAtodeliverkeybenefits,suchassimpleradministration,reducedoverhead,andbetterbusinessintelligenceoverconventionaltraditionaltechnologyplatforms.
priority-one support–AnadditionaloptionalmaintenancephaseofferedafterexpirationofmainstreammaintenanceforspecificreleasesoftheSAPBusinessObjectsBusinessIntelligenceplatformandformerSAPBusinessObjectssolutionsnolongeractivelysoldormarketed.
materiality–Determinestherelevanceandsignificanceofanissuetoanorganizationanditsstakeholders.Amaterialissueisanissuethatwillinfluencethedecisions,actions,andperformanceofanorganizationoritsstakeholders.
mobile apps–Applicationsformobiledevicesavailablefordownload,demo,andpurchaseonSAPStore,AppStore,andotheronlinestores.Mobileappsarecategorizedaseitherbusiness/productinfocusorasconsumer-focused.AtSAP,ourmobileappsaretask-orientedorallowaccesstoexistingon-premisesoftware.
mobile solutions from SAP–Provideafoundationforenterprisemobilityandseamlessintegrationwiththecoreenterpriseapplicationsofourcustomers.Ourportfolioofmobilesolutionsincludesenterprisemobilitymanagement,includingtheSAPAfariamobiledevicemanagementsolutionandtheSAPMobileDocumentssolution;mobileapps;andSAPMobilePlatform.
N
non-profit or not-for-profit–Acorporationoranassociationthatconductsbusinessforthebenefitofthepublicwithoutshareholdersandwithoutaprofitmotive.
O
on demand–Modelofsoftwaredeploymentwherebyproviderslicenseanapplicationtocustomersforuseasaservicewhentheyneedit,thatis,“ondemand.”Iteliminatestheneedforon-siteITresourcestomanageinfrastructureandtherebyreducesoperationalexpenses.Duetotheirsoftware-as-a-servicenature,on-demandsolutionsareoftenavailableinthecloud.See“cloudsolutionsfromSAP.”
278 Additional Information

private cloud –Deploymentimpliesresourcesdedicatedtoonecustomerandaccessedthroughtheinternet.Theinfrastructureisowned,managedandoperatedbythecustomer,athird-party,orboth,andisonthepremisesofthecustomer,cloudprovider,orathirdparty.
private edition–Aprivateeditionisidenticaltothepubliccloud,exceptthattheapplicationisdedicatedtoonecustomer.See“publiccloud.”
product–Anon-versionedhigh-levelviewofsoftwarefromasoftwarelogisticsperspective.Itisa“bracket”thatcontainscorrespondingsoftwareproductversions.
public cloud–Providesconsumersaccesstotheprovider’sapplicationsrunningoncloudinfrastructure.Theresourcesarelocatedonthepremisesofthecloudprovider,notofthecustomer,andaresharedbymultiplecustomersaccessingthemthroughtheInternet.Theapplicationissharedbymultiplecustomersandaccessiblefromvariousclientdevicesviaeitherathinclientinterface,suchasaWebbrowser,oraprograminterface.Thecustomerdoesnotmanageorcontroltheunderlyingcloudinfrastructureincludingnetwork,servers,operatingsystems,storage,orevenindividualapplicationcapabilities,withthepossibleexceptionoflimiteduser-specificapplicationconfiguration.Thecustomerisprovidedself-serviceaccessandtools.
R
Ramp-Up Knowledge Transfer–see“EarlyKnowledgeTransfer.”
renewable energy–Thesharesandtypesofelectricityobtainedfromrenewablesourcessuchashydro,wind,solar,geothermal,andbiomass.Itiscalculatedbyaddingtheamountofrenewableenergyspecificallysourced,producedon-sitebyourownsolarcellsandcoveredbyRenewableEnergyCertificates(RECs).
responsiveness–Inthecontextofstakeholderengagement,anorganization’scooperationandcommunicationwithstakeholders,andthedecisionsandactionstakeninresponsetoaddressedtopicsandissues.
road map–Producttimelinethathasavarietyofobjectives,includingcommunicationtocustomers,users,orotherpartiesinterestedinthetimingoffutureproductreleases;thefeaturesplannedforthosereleases;generalprioritizationoffeatures;andinsomecases,therequirementsoffeaturesinenoughdetailthatcurrentandprospectivecustomerscangivefeedbackonthefeatureitselfandtheproduct’sdirection.
Run Simple–SAP’soperatingprinciplethatreferstohowSAPsolutionscanhelpourcustomersrunattheirbestbyaddressingcomplexityandinnovatingforfuturegrowthaswellastohowSAPcanradicallysimplifyhowweconductbusinessinternallyandexternally.RunSimplehelpsouremployeesconcentrateonwaystomastercomplexityforSAPandourcustomers.Whenfulfilled,itservesasapowerfuldifferentiatorinthemarket.
S
SAP Accounting powered by SAP HANA–FormerlycalledSmartAccountingsoftware.
SAP Active Global Support (SAP AGS)–Aglobalorganizationwithmorethan4,000supportengineersanddevelopersthatfocusesonsupportofferings,helpingcompaniesmanagetheapplicationlifecycleandoptimizesolutionperformanceandconsequentlymanagecomplexity,mitigaterisks,andcontrolcosts.Theservicesareavailablethroughsevenstrategicallylocatedglobalsupportcentersandmorethan30localsupportcenters.
279Glossary

SAP Business All-in-One–Comprehensiveandflexiblebusinessmanagementsolutiontargetedtomidsizecompanieswithupto2,500employeesthatarelookingforacomprehensive,integratedindustry-specificERPsolutionwithbuilt-inbestpractices.
SAP Business ByDesign–Adaptable,cloud-basedbusinesssuiteideallysuitedforSMEsandsubsidiariesoflargecorporations,itisacomplete,integratedsuitethatcanrunawholeenterprise–financials,humanresources,sales,procurement,customerservice,andsupplychain.Thelatestversionsenablepartnersandcustomerstoextendthesystemcapabilitiesorbuildcloud-basedapplicationsusingSAPBusinessByDesignStudio.
SAP Business One–Applicationdesignedespeciallyforsmallbusinesseswithupto100employees,providingasingle,integratedsolutionformanagingtheentirebusinessacrossfinancials,sales,customerrelationships,purchasing,inventory,analytics,andoperations.
SAP Business Suite–Softwaresuitethathelpscompaniesbuildacomprehensivebusinessprocessplatformtorunandperformbetter.Thesoftwaresupportscorebusinessoperationsrangingfromsupplierrelationshipstoproduction,warehousemanagement,sales,andadministrativefunctions,throughtocustomerrelationships.ThemainapplicationsinthesuiteareSAPCRM,SAPERP,SAPPLM,SAPSRM,andSAPSCM.SAPBusinessSuite,SAPCRM,andSAPERParenowavailablepoweredbySAPHANA.
SAP Business Suite 4 SAP HANA–See“SAPS/4HANA.”
SAP ActiveEmbedded–Enhancedengagementservicesforoptimizingsolutionsandacceleratingadoptionoftechnologieswithoutdisruptingcustomerbusinesses.
SAP Adaptive Server Enterprise (SAP ASE)–Ahigh-performancerelationaldatabasemanagementsystemformission-critical,data-intensiveenvironments.Itensureshighestoperationalefficiencyandthroughputonabroadrangeofplatforms.Keyfeaturesincludedataencryptiontoprotectfrominternalandexternalbreaches,partitioningtechnologyforbetterperformanceandeasiermaintenance,andvirtualizationandclusteringcapabilitiesforcontinuousavailabilityandefficientuseofresources.FormerlycalledSAPSybaseASE.
SAP Afaria–Amobiledevicemanagementsolutionthatprovidesasingleadministrativeconsoletocentrallymanage,secure,anddeploymobiledata,applications,anddevices.SAPAfariasimplifiesthemanagementcomplexitiesofaworkforceonthegobymakingthedatastoredandtransmittedbymobiledevicessecure.
SAP Anywhere–NewsolutionfromtheSMBSolutionsGroupatSAPdesignedforsmallercompaniesthatneedaseamlesswaytomanagetheircustomerinteractionsinasinglefront-officesystem.Itisanaffordable,easy-to-usesolutionthatenablescompaniestodeliveraconsistentcustomerexperienceacrossalltheirdigitalmarketing,sales,andcommerceactivities.
SAP API Management–Newcloudofferingthathelpscustomersmanagetheirapplicationprogramminginterfaces;anon-premiseeditionisalsoavailable.
SAP Best Practices–PackagesthatprovideprovenmethodsandtoolsfororganizationstoimplementbestbusinesspracticesinkeyareasandarangeofindustriesusingSAPsoftware.Thepackagesdelivermethodology,documentation,andpreconfigurationthatenablerapid,reliabledeploymentwithquickreturnoninvestment.
280 Additional Information

SAP Business Suite powered by SAP HANA–InJanuary2013,SAPlaunchedSAPBusinessSuitepoweredbySAPHANA,anext-generationbusinesssuitethatcapturesandanalyzesdatainrealtimeonasinglein-memoryplatformempoweringcustomerstoruntheirbusinessinrealtimetotransact,analyze,andpredictinstantlyandproactively.ThecoreapplicationsinthesuitenowtakeadvantageofSAPHANAforsmarterinnovations,fasterbusinessprocesses,andsimplerinteractions.
SAP BusinessObjects Business Intelligence solutions–Categoryofsolutionsdesignedtohelpoptimizebusinessperformanceandprovidebusinessinsightbyconnectingpeoplewithinformation.TheSAPBusinessObjectsbrandnamewasdroppedin2012fromallSAPofferingsexceptforbusinessintelligence.SAPBusinessObjectsBusinessIntelligencesuitecomprisesthemajorityofSAPBusinessObjectsBusinessIntelligencesolutions.See“analyticssolutionsfromSAP.”
SAP Business Warehouse (SAP BW)–ApplicationoftheSAPNetWeavertechnologyplatformthatprovidesacompleteviewofacompanyandthetoolsneededtomaketherightdecisions,optimizeprocesses,andmeasurestrategicsuccess,suchasbusiness-criticalfactorsandbenchmarks.FormerlycalledSAPNetWeaverBusinessWarehouse.
SAP Cloud for Customer–Acloud-basedofferingofCRMapplicationsandtoolsdevelopedforsales,service,andmarketingteamsthatprovidesanoverviewofyourend-to-endbusiness,aswellasdeepcustomerinsightandpersonalizedengagement,sothattheycandeliverarelevantexperienceateverystepofyourcustomer’sjourney.Italsooffersdesigned-insocialcollaborationtohelptransformsocialmediaconversationsintobusinessinsight.TheofferingcurrentlyincludesSAPCloudforSales,SAPCloudforService,SAPCloudforMarketing,andSAPCloudforSocialEngagementsolutions.
SAP Cloud for Financials–Acloud-basedfinancialmanagementsolutionwithanintuitive,easy-to-consumeinterfaceandpersonalizedinformation.Itfeaturesembedded,dynamicanalytics,enablingcompaniestoachievesuperiorfinancialinsightacrossthebusiness.Customerscanusethesolutiontodrivestreamlined,end-to-endcompliantfinancialprocessesaswellasreal-timefinancialperformanceinformationforeveryoneinthebusiness.ItincludesthesolutionformerlycalledSAPFinancialsOnDemandandispartoftheSAPCloudforFinanceportfolio.
SAP Cloud for Sales, SAP Cloud for Service, and SAP Cloud for Marketing–Cloud-basedsolutionstargetedatsales,service,andmarketingorganizationswithdesigned-insocialcollaborationtohelptransformsocialmediaconversationsintobusinessinsight.
SAP Cloud for Social Engagement–Cloud-basedsolutionthathelpstransformsocialmediaconversationsintobusinessinsight.Marketingandcustomerserviceorganizationscanuseittobetterengagewithcustomerstoincreasebrandloyalty,managereputationalrisks,andcapitalizeonopportunities.
SAP Cloud for Planning–Cloud-basedsolutionforalltypesofplanningpoweredbySAPHANA.FormerlycalledSAPCloudforEnterprisePerformanceManagement.
SAP Cloud powered by SAP HANA–TermthatreferstoallofSAPandSuccessFactorsofferingsrelatedtothecloud,includingplatforms,services,applications,technology,andinfrastructure.Itisnotthenameofasingleofferingoracategoryofsolutions.SAPCloudpoweredbySAPHANAcomprisespubliccloudapplications,managedcloudapplicationsdeliveredviaSAPHANAEnterpriseCloud,andaplatformdeliveredasaservice,SAPHANACloudPlatform.SAPCloudalwaysreferstomorethanjustsolutionsorapplications.
281Glossary

SAP Ecosystem & Channels–See“GlobalPartnerOperations.”
SAP Education–Anorganizationwithmorethan1,000resourcesonglobalscalethatprovidesacompleteandhigh-qualityenablementofferingacrosstheentirecustomerlifecycleforalltargetaudiences(businessusers,projectteams,customers,partners,andsoon).Thecomprehensiveportfolioofeducationalproductsandservicesleveragesamultimodaloffering(on-site,e-learning,andvirtualclassrooms)toaccelerateenablementandreducecostandcertificationspathstohelpensureenablementquality.
SAP Enterprise Portal–Intranetorcorporateportalthatprovideseasyaccesstobusinessprocessesandinformation,socialcollaboration,andcontentmanagementacrossvariousconsumptionchannelsandhelpscustomersimplementbusiness-to-employee,partner,andconsumerscenarios.FormerlycalledSAPNetWeaverPortal.
SAP Enterprise Support–ServicesthatprovideproactivesupportinadditiontoallfeaturesofSAPStandardSupportservices.Theseproactivesupportservicesencompasstools,processes,andservicesthatenablecontinuousimprovement,holisticapplicationlifecyclemanagementforcontinuousinnovation,businessandoperationalprocessimprovements,andleverstoaddressthetotalcostofoperation(TCO).
SAP ERP–ApplicationdesignedtooptimizebusinessandITprocessesbyreducingITcomplexity,increasingadaptability,anddeliveringmoreITvalueatalowercostthantraditionalERPsolutions.Itcansupportmission-critical,end-to-endbusinessprocessesforfinance,humancapitalmanagement,assetmanagement,sales,procurement,andotheressentialcorporatefunctions.SAPERPcanalsosupportindustry-specificprocessesbyprovidingindustry-specificbusinessfunctionsthatcanbeactivatedselectivelyviatheswitchframework,keepingtheapplicationcorestableandhelpingensuremaximumperformance.
SAP Co-Innovation Lab–SAPlocationfeaturingasimulated,heterogeneousdatacenterthatincorporateshardwareandinfrastructuresoftwarefromvariousvendors.Thelabprovidesahands-onenvironmentforSAP,customers,andpartnerstoinnovate,accelerate,andshowcasenewbusinesssolutionsandtechnologiescollaboratively.CustomersandpartnerscanvisitthelabtoevaluatethelatestSAPandpartnersolutionsinasimulated,real-worldinfrastructure.
SAP Community Network–Onlineportalwithnearlytwomillionmembersinmorethan200countries,providingindividualswiththeopportunitytotradeexperienceandinsights,pursuebusinessopportunities,andlearnfromeachother.SAPoffersdistinctcommunitiesinthenetworkthatofferinformation,trustedresources,andco-innovation.See“BusinessProcessExpertcommunity,”“SAPDeveloperNetwork,”and“SAPUniversityAlliancescommunity.”
SAP CRM powered by SAP HANA–FirstSAPBusinessSuiteapplicationpoweredbySAPHANA.
SAP Customer Relationship Management (SAP CRM)–Applicationthatprovidescomprehensivesoftwaresupporttohelpmarketing,sales,andserviceprofessionalsobtaincompletecustomerintelligencethattheycanleveragetomanagecustomerrelationshipsandcustomer-relatedprocesseseffectively.SAPCRMcanenablemultichannelcustomerinteractions,includingmobilesmartphones,theInternet,andsocialmediaandalsooffersacommunicationsinfrastructurethatisdesignedtohelpconnectingwithotherusersanytime,anywhere.SAPoffersCRMapplicationsinbothon-premiseandon-demanddeploymentmodels.
SAP Developer Network–PartofSAPCommunityNetwork,thisonlinecommunityoffersdeeptechnicalcontentandexpertiseforSAPdevelopers,analysts,consultants,andadministrators.
SAP EcoHub–OnlinesolutionmarketplacethatcentralizesinformationaboutSAPandpartnersolutions–andincludesfeaturessuchasfeedback,ratings,anddemostohelpdiscover,evaluate,andbuysolutionstocomplementaninvestmentinSAPsoftware.
282 Additional Information

SAP ERP powered by SAP HANA–ThesecondSAPBusinessSuiteapplicationpoweredbySAPHANA.
SAP Executive Board–TheofficialgoverningbodyofSAP,overseeinganddecidingontheactivitiesofthecompany.Subjecttotherequirementsofstockcorporationlaw,theSAPExecutiveBoardiscommittedtotheinterestsofSAPandboundbycompanypolicy.ItprovidestheSAPSupervisoryBoardwithregular,prompt,andcomprehensivereportsaboutallessentialissuesofbusiness,corporatestrategy,andpotentialrisks.MembershipintheSAPExecutiveBoardispartoftheofficialtitlesfortheseboardmembers.
SAP Financing–ServicethathelpscompaniesinvestinSAPsolutionsimplementedbyastrategicpartnerofSAP:SiemensFinancialServicesGmbH(SFS).SFStargetsthefinancingservicechieflyatmidsizecompanies.Dependingonlocalconditions,theSFSplanleasessolutionstocustomersandprovidesloanfinance.
SAP Fiori–FirstdevelopedasasetofextensibleHTML5appsspecifictokeyuserroles,offeringaseamlessuserexperienceacrossdevicesusingresponsivedesignprinciples.SAPFioriappstargetallemployeesofexistingSAPcustomers,addressingthemostcommonbusinessfunctions,suchasworkflowapprovals,informationlookups,andself-servicetasks.InMay2014,SAPFiorialsobecamethenewuserexperience(UX)forSAPsoftware.Basedonmoderndesignprinciples,itrepresentsaconsumer-like,consistentexperienceacrossdevices,includingtabletsandsmartphones.
SAP for Aerospace & Defense (SAP for A&D)–Solutionportfoliospecificallydesignedtomeettheneedsoftheaerospaceanddefenseindustry.Itofferscapabilitiesformaintenance,repairandoverhaul,airlineoperations,defense,manufacturing,contractandprogrammanagement,andbusinessacquisitions.
SAP for Automotive–Solutionportfoliodesignedtomeetthespecificneedsoftheautomotiveindustry.Itscapabilitieshelplinkcomplexbusinessprocessesintoalogicalflow,maximizingefficiencyandprofitabilityandsatisfyingcustomers’expectations.
SAP for Banking–Solutionportfoliothatenablesbankstoobtainallcustomerinformationataglanceandoffersafullcomplementofhigh-performancecapabilitiesforstrategicplanning,financialaccounting,costing,andenterprise-widecontrol.Italsofeatureskeyindustry-specificapplicationsforprofitabilitymanagement,riskmanagement,customerrelationshipmanagement,andintegratedcustomeraccountsystems.
SAP for Chemicals–Solutionportfoliothatdeliverssupportforspecificprocessesandtoolsthatchemicalcompaniesrequire.Industry-specificcapabilitiesincluderecipemanagement,batchmanagement,andversioncontrol.
SAP for Consumer Products–Solutionportfoliothatsupportstheintegrationofeverystepoftheconsumerproductvaluechain–fromsupplierstoconsumers.KeycapabilitiesincludemobileandInternetsales,tradepromotionmanagement,inventorymanagement,brandandchannelmanagement,anddemandsignalmanagement.
SAP for Defense & Security–Solutionportfoliothatoffersavarietyofcapabilitiesthatmeetthecriticalneedsofthedefenseandsecuritysector.Keyindustry-specificcapabilitiesincludeacquisitionandmaterialsmanagement;forceplanning;maintenance,repair,andoverhaul(MRO);personnelandorganization;infrastructuremanagement;planningandsupportfordeployedoperations;in-servicesupport;andlinemaintenance.
SAP for Engineering, Construction & Operations (SAP for EC&O)–Solutionportfoliodesignedtomeetthespecificrequirementsofproject-orientedenterprisesthatofferscapabilitiesforindustrialplantconstruction,constructionofcommercialandprivatebuildings,andshipbuilding.
283Glossary

SAP for Media–Solutionportfoliothatsupportsprocessesspecifictothemediaindustrywithcapabilitiesthatincludesalesanddistribution,advertisingmanagement,productdevelopment,andintellectualpropertymanagement.
SAP for Mill Products–Solutionportfolioformanufacturersofbuildingmaterials,thepaperandtimberindustry,metalandprimarymetalproducers,andtextileandfurnituremanufacturers.
SAP for Mining–Solutionportfoliothatsupportsprocessesspecifictotheminingindustry,includingminingoperationsandassetperformance;salesandsupplychainmanagement;operationalriskandcompliance;aswellashumanresources;finance;procurement;andITmanagement.
SAP for Oil & Gas (SAP for O&G)–Solutionportfoliothatmeetsthedemandsofoilandgascompaniesofallsizes.
SAP for Professional Services–Solutionportfoliothatdeliversintegratedtools,bestpractices,andsupportforautomatedprocessesdesignedspecificallyforthedemandsoftheprofessionalservicesindustry,includingmanagementconsultanciesaswellasaccountingandlegalfirms.
SAP for Public Sector–Solutionportfolioforpublicadministration,providinganelectronicframeworkthatenablesonlinecommunicationthroughvariousapplicationsforthepublic,governmentauthorities,andrelatedentities.
SAP for Retail–Solutionportfoliothatoffersmultichannelapplicationsdesignedspecificallytoprovidethebestretailservicestoalargecustomerbase.
SAP for Sports & Entertainment–Solutionportfoliothatcomprisessolutionsforsportsteams,leagues,andvenues,designedtohelpthemdeepenfanengagement,driveon-fieldperformance,andoptimizebusinessefficiency.
SAP for Healthcare–Solutionportfolioforhospitalsandclinicstomanageavarietyofrequiredadministrativeandclinicalprocesses.
SAP for High Tech–Solutionportfoliothatmeetsthedemandsofhigh-techindustries,includingRosettaNetsupport.
SAP for Higher Education and Research (SAP for HE&R)–Solutionportfoliothatsupportsorganizationalprocessesanduniqueneedsofpublicandprivateuniversities,multicampusinstitutions,researchagencies,andmedicalcolleges,includingcampusmanagement,grantsmanagement,studentlife-cyclemanagement,financials,operations,humancapitalmanagement,procurement,analytics,research,andassetmanagement.
SAP for Industrial Machinery & Components (SAP for IM&C)–Solutionportfoliothatcoordinatestheentirescopeofbusinessactivities(estimating,orderentry,projectmanagement,andproductionplanning)fortheindustrialsectorandsupportsareasrangingfrommaintenanceandservicestobillingandprofitabilityanalysis.
SAP for Insurance–Solutionportfoliothatintegratesstepsintheinsurancebusinessprocess,includingcapabilitiesforcustomercontact,policyandproductmanagement,collectionsanddisbursement,andclaimsmanagement.
SAP for Life Sciences–Solutionportfoliothatmeetstherequirementsofpharmaceutical,biotechnology,anddiagnosticscompanies,aswellasmanufacturersofmedicaldevicesandproducts.
284 Additional Information

SAP for Telecommunications–Solutionportfoliothatprovidestelecommunicationsenterprisesofalltypesandsizesarangeofindustry-specificcapabilities,includingsupportforconvergentinvoicingandcontractaccounting.
SAP for Transportation & Logistics–Solutionportfoliothatcoverstheuniquebusinessneedsofpostalservices,railways,airlines,andtollcollectioncompanies,aswellaslogisticsserviceproviders,tooptimizesupplychainandplanning.
SAP for Utilities–Solutionportfolioforallsupplyandenergyindustries,withcapabilitiesrangingfromcallcentersandInternetcommunicationstoconsumptionbilling.
SAP for Wholesale Distribution–Solutionportfoliothataddressestheneedsofmidsizeandlargewholesaledistributionbusinessesinawiderangeofsegments.Industry-specificcapabilitiessupportnewbusinessmodelsandstrategiesthatmeettheneedsofanimportantsupplysector.
SAP Global Managing Board–TheSAPGlobalManagingBoardwasestablishedinMay2012inadditiontotheSAPExecutiveBoardandallowsSAPtoappointabroaderrangeofgloballeaderstohelpsteertheorganization.ItcomprisesmembersoftheSAPExecutiveBoardandselectedadditionalexecutives,andhasadvisoryanddecision-supportingfunctionsfortheSAPExecutiveBoard.Perdefinition,allmembersoftheSAPExecutiveBoardaremembersoftheSAPGlobalManagingBoard.
SAP HANA–Flexible,data-agnostic,in-memoryplatformthathelpsorganizationsanalyzetheirbusinessoperations,usinghugevolumesofdetailedtransactionalandanalyticinformationfromvirtuallyanydatasource.Theplatformprovidesthefoundationforinnovativeapplicationsthattakeadvantageofanin-memorydatabaseandcalculationengine,allowingcustomerstoconductcomplexplanning,forecasting,andsimulationbasedonreal-timedata.
SAP HANA Cloud Platform–Anopencloudplatformthatisthefoundationforrunningapplicationsandanalyticstodayandallowsdeveloperstobuildcustomapplicationsinthecloudaseitherstand-aloneorconnectedtoon-premisesolutions.Itincludesinfrastructure,application,anddatabaseservicesinasubscriptionmodel.ThisplatformallowsdevelopersfromSAP,customers,partners,andindependentsoftwarevendorstobuildapplicationsinthecloudwithinfrastructure,database,andapplicationservicesusingin-memorytechnologyandtheaccelerationprovidedbySAPHANA.Separatelylicensed,SAPHANACloudPlatformispartofSAPCloudpoweredbySAPHANA.
SAP HANA Enterprise Cloud–Thisserviceenablescustomerstoaccesssolutionsinthecloud.Itcontainsmanagedcloudapplications,in-memoryinfrastructure,managedservices,andthroughanadditionallicense,SAPHANACloudPlatform,tobuildcustomapplicationsinthecloud.On-premiseapplicationsfromSAPcanbedeliveredtocustomersviaSAPHANAEnterpriseCloud.
SAP HANA Live–UmbrellatermforagroupofanalyticsfoundationsforSAPHANA,specifictoanindustryorforaparticularsoftware(SAPHANALiveforEventManagement,SAPHANALiveforSAPCRM),andsoon,aswellasabrowser(SAPHANALiveBrowser).
SAP HANA One–DeploymentofSAPHANAcertifiedforproductiveuseontheAmazonWebServicesCloud.SAPHANAOnecanbedeployedforproductionusewithsmalldatasets,inminutes,openingadoortostarterprojectsfromcustomers,ISVs,andstartups.
285Glossary

SAP Mobile Platform–Aplatformofmobilecapabilitiesandtechnologythatbundlesthreeexistingofferingsunderonename(SybaseUnwiredPlatform,SybaseMobiliser,andaSycloofferingnamedAgentry).SAPMobilePlatformisofferedinenterpriseorconsumereditionsandeacheditionisavailableaseitheranon-premiseoracloudversion.
SAP Month of Service–HeldinOctober,SAP’ssignaturecorporatevolunteerismeffortoffersSAPemployeesaroundtheworldopportunitiestocometogethertosupportsocialchangeintheircommunities.
SAP NetWeaver–Acomprehensivetechnologyplatformdesignedtoefficientlydevelop,run,andextendbusinessapplications.SAPNetWeaverprovidesfoundationandenterprisesoftware,includingtheSAPBusinessWarehouseapplication,andtheSAPNetWeaverApplicationServer,SAPEnterprisePortal,andSAPProcessOrchestrationcomponents.ItfacilitatestheeasyintegrationofSAPsoftwarewithheterogeneoussystemenvironments,third-partysolutions,andexternalbusinesspartners.See“technologyplatform.”
SAP NetWeaver Application Server (SAP NetWeaver AS)–ComponentofSAPNetWeaverthatprovidessupportforplatform-independentWebservices,businessapplications,andstandards-baseddevelopmentbaseduponkeytechnologiessuchasJavaandABAP.
SAP NetWeaver Business Intelligence–See“SAPBusinessWarehouse.”SAP ONE Service–AsinglechannelforSAPsupportandmaintenancecustomerstoaccessallSAPsupportdeliveryengagementsthatcomewithSAPMaxAttentionandSAPActiveEmbeddedofferings.
SAP ONE Support–AprogramtosimplifythedeliveryandconsumptionofsupportandmaintenanceforagrowingportfolioofsolutionsfrombothSAPandacquiredcompanies.Theprogramprovidescustomerswithcomprehensiveandharmonizedsupport,regardlessofwhethertheirSAPsolutionsoperateonpremiseorinthecloud..
SAP IQ–Ananalyticsserverdesignedspecificallyforadvancedanalytics,datawarehousing,andbusinessintelligenceenvironments.Abletoworkwithmassivevolumesofstructuredandunstructureddata,itisideallysuitedtotakeadvantageofBigDataopportunitiesbydiscoveringmoreaccurateinsightintobusinessperformanceandmarketdynamics.FormerlycalledSAPSybaseIQ.
SAP Lumira–Datavisualizationsoftwarethathelpsconnect,access,andvisualizedatawithoutasinglelineofcode.
SAP Managed Services–OrganizationandofferingsthatenableSAPcustomerstoaccessSAPapplicationsandthatprovidetheinfrastructurerequired.Inthisway,solutionsarereadytouseandcanbeadaptedtocustomers’growingrequirements.
SAP Manufacturing–SolutionformanagingmanufacturingoperationswithembeddedleanmanufacturingandSixSigmaprinciples.Itprovidescapabilitiesforplanning,execution,quality,maintenance,aswellasenvironment,health,andsafety.
SAP Match Insights–Anshowcaseon-premisesolutiondevelopedaspartofacustomerco-innovationprojectfortheGermanSoccerAssociation(DFB).ThesolutionwasavailableforDFBcoachesandplayersinapilottrialduringthepreparationphaseandthroughoutthe2014FIFAWorldCupinBrazil.ThesolutionenablesmembersacrosstheDFBteamtoanalyzeplayers'andteams'performancesinindividualmatchesusingstreamedvideofromthematchcombinedwithanalyticspoweredbySAPHANA.
SAP MaxAttention–SupportoptionwithafullrangeofservicescustomizedforindividualcustomerneedsandcoveringallstagesofanSAPsolution’slifecycle,drivenbyanon-sitetechnicalqualitymanager.
286 Additional Information

SAP PartnerEdge–Global,partner-to-partnerbusinesscollaborationnetworkwhereSAPpartnerscanshareexpertise,developmentcapabilities,solutions,andknowledgetoextendtheirmarketreach.Inlate2012,SAP’sextranetforpartners,SAPChannelPartnerPortal,mergedwithSAPPartnerEdge.Thecombinedsite,availableatwww.sappartneredge.comnowgivespartnersaccesstoinformation,productandbusinessnews,tools,training,andbusinessresourcestoorderproducts.PartnerscanalsomanagetheirrelationshipwithSAPandcollaboratewithotherSAPpartnersthroughSAPPartnerEdge.
SAP Pinnacle Award–AnnualpartnerrecognitionawardedtoSAPpartnersinvariouscategories.
SAPPHIRE NOW–SAP’ssignaturebusinesstechnologyeventandthelargestSAPcustomer-drivenconferenceisheldannuallyinseverallocationsaroundtheglobe.TheglobaleventintheUnitedStatesisco-locatedwiththeAmericas’SAPUsers’Group(ASUG)annualconference.Attendeesdiscovernewinitiatives,solutions,products,andservices,aswellasuniqueaccesstothelatestbusinessstrategiesandindustrybestpracticesfromSAPcustomers,partners,executives,andindustryexpertstohelpthemdrivebusinessresultsacrossalllevels.
Sapphire Ventures–NewnameofindependentventurefirmspunofffromSAP,providingtheagilityofastart-upwhileallowingcompaniestotapintoSAP’sglobalenterpriseecosystemofcustomersandpartners.Thefirmpartnerswithoutstandingentrepreneursandventurefirmsworldwidetobuildindustry-leadingbusinesses.FormerlycalledSAPVentures.
SAP Premier Customer Network–ExclusiveSAPcommunityoftopindustryleadersrepresentingsomeoftheworld’slargestandbest-runbusinesses.Forthesepremiercustomers,SAPaimstosimplifyandtailorthepartnershiptowardtheuniqueneedsofeachcustomerbyproactivelyassemblingthebesttalentandsynchronizationacrossallSAPlinesofbusiness(productdevelopment,sales,services,support,andmarketing)globally.
SAP Product Lifecycle Management (SAP PLM)–Applicationthathelpscompaniesmanage,track,andcontrolallproduct-relatedinformationoverthecompleteproductandassetlifecycleaswellasthroughouttheextendedsupplychain.SAPPLMisdesignedtofacilitatecreativityandtofreetheprocessofproductinnovationfromorganizationalconstraints.
SAP Ramp-Up–ProgramSAPusestointroducenewapplicationreleasesonthemarkettoselectedcustomersduringtherestrictedshipmentphase.
SAP Rapid Deployment solutions–Packagesofpreconfiguredsoftwareandpredefinedserviceswithcontentincludingbestpractices,templates,tools,andbusinessuserenablementwithpredeterminedscope,time,andcosts.Becausethesolutionsareinstalledquickly,customerscanbenefitfromcrucialsoftwarefunctionalitywithinaslittleas12weeks,helpinglowerthetotalcostofimplementationandgivingcustomersimmediateandtangiblevalue.
SAP Replication Server–Softwarethatmovesandsynchronizesdatainrealtime,allowingcompaniestogainbetteruseofapplicationdataandtocreatereportswithoutaffectingoperationalsystems.Administratorscansetupredundantdisasterrecoverysitesanddistribute,consolidate,andsynchronizedataacrossmultipleplatforms.FormerlycalledSAPSybaseReplicationServer.
SAP Resolve–AnewhelpdeskprogramforSAPpartnerstomanagecustomersupportproblemsandqueries.
SAP road maps–Availableforindustries,linesofbusiness,andtechnology,SAProadmapshighlighttheSAPsolutionsavailabletoday,plannedinnovation,andtheSAPvisionforthefuture.
SAP Safeguarding–Project-basedsupportoptionthathelpscustomersmanagerisksandenablethetechnicalrobustnessofSAPsolutionsduringimplementation,upgrade,andoperations.
SAP Service Marketplace–ExtranetplatformthatofferscapabilitiesforcollaborationbetweenSAP,customers,andpartners.TheextranetprovidescentralaccessandguidednavigationtoSAP’scompleteproductlistingwithsupport,maintenance,andupgradeinformation.
287Glossary

SAP Solution Explorer–Acustomer-facingself-servicetoolthathelpsusersfindthebusinessmanagementsoftwaresolutionstheyneedfromSAPtooperateprofitably,adaptcontinuously,andgrowsustainably.ContentincludesvaluemapsandexecutivesummariesforallSAP-supportedlinesofbusinesses,industries,technology,andselectedtopics.
SAP Solution Manager–ApplicationmanagementsolutionthatenablescustomerstomanagetheirSAPandnon-SAPapplicationsbetter.WithSAPSolutionManager,customerscancentralize,enhance,automate,andimprovethemanagementoftheirentiresystemlandscape,thusreducingtotalcostofownership.Thesolutionincludesfeaturessuchasdiagnostics,testing,rootcauseanalysis,andsolutionmonitoring.
SAP solutions for customer engagement and commerce–Categoryofsolutionsthathelpbusinessescreateexperiencesthatengagecustomerslikeneverbeforeandcanleadtomoreeffectivemarketingpromotions,increasedrevenueshareofnewcustomers,reducedcustomerchurn,increasedrevenuegrowth,andimprovedcart-to-orderconversionrate.
SAP solutions for fan engagement–Categoryofsolutionstohelpsportsteamsandentertainmentvenuesinteractwiththeirfanstodriveengagementandrevenue.
SAP solutions for enterprise information management (EIM)–Categoryofsolutionsthathelpyoudeliverintegrated,accurate,andtimelydataacrossyourenterprise.
SAP solutions for enterprise performance management (EPM)–Categoryofsolutionsthathelpscompaniesimproveperformance,organizationalagility,anddecisionmaking.
SAP solutions for governance, risk, and compliance (GRC)–Categoryofsolutionsthatprovideorganizationswithareal-timeapproachtomanagingGRCacrossheterogeneousenvironments.
SAP Service and Support–ServiceandsupportfromSAPhelpscustomersderivevaluefromtheirSAPsolutionsinafast,cost-effective,andpredictableway.TheSAPServiceandSupportportfolioincludesavarietyofnamedservicesandsupportofferingsincludingSAPMaxAttention,SAPSafeguarding,SAPEnterpriseSupport,andothers.
SAP S/4HANA–AfamilynameforSAP’snext-generationbusinesssuiteofferedexclusivelyontheSAPHANAplatform,withon-premiseandclouddeploymentoptions.AlsoknownbyitsfullnameSAPBusinessSuite4SAPHANA.
SAP Simple Finance–AglobalfinancialsolutionpoweredbySAPHANAofferingacompletechoiceofdeployment(cloud,onpremise,hybrid).ForcustomerswhochoosetodeploySAPSimpleFinanceinthecloud,SAPoffersSAPHANAEnterpriseCloudasamanagedservice,availableviafullsubscription.
SAP Smart Business–Cockpitdashboardsthatenableuserstoquicklyaggregatedata,performanalytics,andgaininsightsintoKPIsrelatedtovariouscorporatefunctions.Avarietyofoptionsareavailableforspecificusecases/rolesincludingaccountspayable,eventmanagement,financialclose,purchasing,andothercorporatefunctions.
SAP Solidarity Fund–TheSAPSolidarityFunde.V.wassetupbySAPemployeesasanimmediateresponsetotheterroristattacksonSeptember11,2001.Thegoalofthischaritableassociationwastohelppeople–asaresultofanaturaldisaster,forexample–quicklyandwithminimumbureaucracy.TheactivitiesoftheSAPSolidarityFundaremadepossiblemainlythroughcontributionsfromSAPemployeesandpeopleassociatedwithSAP.Sinceitsfoundation,theSAPSolidarityFundhasmanagedtomakemorethan€2millionavailableforvariousprojects.
288 Additional Information
SAP solutions for small businesses and midsize companies–Categoryofsolutionsthatcombinebusinessmanagementandbusinessintelligencesoftwareforsmallandmidsizeenterprises(SMEs).ItcurrentlyincludesSAPBusinessAll-in-Onesolution,SAPBusinessOneapplication,andSAPBusinessObjectsEdgesolutions.Aswithlargeenterprises,thesefirmsseektostreamlinebusinessprocesses,cutcosts,drivegrowth,andincreaseprofitabilitybyreceivingtherightinformationattherighttime–acrossalloperations.
SAP solutions for sustainability–Categoryofsolutionsthathelpscompaniesmeasuresustainabilitykeyperformanceindicators;energyandcarbonmanagement;andenvironment,health,andsafety.SAPsolutionsforsustainabilityhelporganizationstackleenergyconsumptionandgreenhousegasemissions,aswellassupporteffortsinproductsafety,healthcare,andsustainabilityperformancemanagement.
SAP SQL Anywhere–Amobile,embedded,andcloud-enabledfullyrelationaldatabasethatisembeddedinmorethan10millioninstallationsworldwide,fromlaptopstotabletstosmartphones.FormerlycalledSAPSybaseSQLAnywhere.
SAP Standard Support–Supportoptionofferingareliableresponsetotechnicaldisruptionsandformaintainingsystemhealthandintegrity.Thisbasicsupportofferingfeaturesincludingupdates,problemresolution,knowledgetransfer,qualitymanagement,andmoretokeepITlandscapesup-to-dateandstable.
SAP Startup Focus–Programthatoffersavarietyofresourcesforyoungcompaniesincludingtechnology,training,technicaladviceandvaluablego-to-marketsupport.ItservesasadevelopmentandgrowthacceleratorthatprovidesanintegratedapproachforstartupstoinnovateontheSAPHANAplatform.
SAP Supplier Relationship Management (SAP SRM)–Procurementapplicationthathelpsorganizationsinallindustriesimprovetheircentralizedsourcingandcontractmanagementandinteractwithsuppliersthroughmultiplechannels.SAPSRMisdesignedtoaccelerateandoptimizetheentireend-to-endprocure-to-payprocessbysupportingintegratedprocessesandbyenforcingcontractcompliance,whichcanresultinrealizablesavings.
SAP Supply Chain Management (SAP SCM)–Applicationthathelpscompaniesadapttheirsupply-chainprocessestoarapidlychangingcompetitiveenvironment.SAPSCMhelpstransformtraditionalsupplychainsfromlinear,sequentialprocessesintoopen,configurable,responsivesupplynetworksinwhichcustomer-centric,demand-drivencompaniescanmonitorandrespondmoresmartlyandquicklytodemandandsupplydynamicsacrossagloballydistributedenvironment.
SAP TechEd–Annualtechnicaleducationconferencethatencompassesabroadscopeoftopicsandaudience,focusingontechnologywithanemphasisoncollaborationandhands-onworkshops.
SAP University Alliances–Programthatintroducesstudentstotheexcitingtechnologiesshapingbusinesstoday,anddesignedtoconnectstudentsaroundtheworldinterestedinSAPsolutions,careers,andresearchopportunities.Studentsparticipateinclassroomsessions,appdevelopment,networkingopportunities,events,andmore.AspartofSAPCommunityNetwork.theSAPUniversityAlliancescommunityprovidesconnectionsbetweenuniversityleadersandstudents,SAPcustomersandpartners,andSAPinternalexperts.
SAP User Group Executive Network (SUGEN)–In2007,SAPinitiatedaprogramthatencouragedallSAPusergroupstosharetheirexpertiseandrecommendedpracticeswiththewideruser-groupcommunity.Itkindledsomevaluablediscussion,which,intheend,isgoodforallSAPstakeholders.Anumbrellaorganization,SUGENembraces12nationalSAPusergroupswiththesharedaimofdefiningprioritiesandagreeingonplansofactiontobringgreaterfocustothedialogbetweenSAPanditsusergroupsontheglobalplane.
289Glossary

solution–SAPsolutionsenableacustomertomeetachallengeortakeadvantageofanopportunityandarebuiltorassembledbyflexiblycombiningSAPapplicationsandotherSAPsoftware.Thesolutionsmayincludesupportforbestbusinesspracticesandbeaidedbyconsultingandongoingsupport.TheymayalsobeenhancedorextendedbySAPpartnerapplicationsandservices.
solution extensions–Developedbyindependentpartners,solutionextensionsintegrateeasilywithSAPsoftware,offeringcustomerscross-solutionandcross-industryfunctionsthatcomplementSAPsoftware.Theseselectthird-partyofferingsarebrandedwith“SAP,”andsoldandsupportedbySAPandpartners.
SuccessFactors–AcquiredbySAPin2013,thecompanyoperatesasanindependentbusinessunderthename“SuccessFactors,anSAPcompany.”
SuccessFactors HCM Suite–SuiteofHRsolutionsfortalentmanagement,coreHR,collaboration,andworkforceanalytics.Thecloud-basedsuiteprovidessolutionstobridgethegapbetweenstrategyandexecutionwithtoolstohire,reward,anddeveloptherightpeoplewiththerightskillstogrowabusinesssustainably.FormerlycalledSuccessFactorsBusinessExecutionSuite(SuccessFactorsBizXSuite).
systems integrator (SI)–CompanyfocusedonintegratingITsystemsandprovidingrelatedconsulting.Thisisaclassicchannelusedbylargesoftwarevendors,largehardwarevendors,andoriginalequipmentmanufacturers.
SAP Ventures–see“SapphireVentures.”
Scope 1 (emissions)–Directgreenhousegasemissionsfromsourcesthatareownedorcontrolledbythereportingcompany,forexample,fuelburnedincorporatecars.
Scope 2 (emissions)–Indirectgreenhousegasemissionsfromconsumptionofpurchasedelectricity,heat,orsteam.
Scope 3 (emissions)–Indirectemissionsthatareaconsequenceoftheactivitiesofthereportingcompany,butoccurfromsourcesownedorcontrolledbyanothercompany,suchasbusinessflights.
SMB Solutions Group–NewbusinessunitcreatedatSAPin2014responsibleforthego-to-marketstrategyanddevelopmentofinnovativesolutionsforthesmallandmidsizebusiness(SMB)market,comprisingcompanieswith<500employeesonly.Includesallcorporateareas(marketing,sales,anddevelopment)responsibleforSAPBusinessByDesign,SAPBusinessOne,andthenewSAPAnywherefront-officesolutionforsmallbusinesses.See“SAPAnywhere.”
software and software-related services (SSRS)–SAPreportsrevenuesinsoftwareandsoftware-relatedservices(SSRS),whichencompassessoftware,support,subscription,andothersoftware-relatedservicerevenue.
software as a service (SaaS)–Softwarethatisprovidedliterally“asaservice.”SoftwareapplicationsaredeliveredandmanagedremotelyoverasecureInternetconnectionandastandardWebbrowser.Accessischargedonasubscriptionbasisusuallyonadedicatedtimebasisandwithexpandablefeatureaccessoptions.Typicallyadefinedlevelofsupportisincluded.See“cloudcomputing.”
290 Additional Information
W
women in management–Phraseusedtorefertothepercentageofwomeninmanagementpositions(managingteams,managingmanagers,executiveboards)ascomparedtothetotalnumberofmanagers,expressedbythenumberofindividualsandnotfull-timeequivalents(FTEs).
works council–AsdictatedbytheGermanWorksCouncilConstitutionAct,aworkscouncilisalegalbodyforrepresentingemployees’intereststotheemployerandcodeterminingtheworksinprivatecompanies.OnJune21,2006,theSAPAGemployeesworkinginGermanyelecteditsfirstworkscouncil.AEuropeanworkscouncilwascreatedinthespringof2012.TheSAPAGworkscouncilevolvedtobecometheSAPSEworkscouncilin2014toreflectthelegalentityofSAPSE.
T
technology platform–Thetechnicalfoundationforabusiness-drivensoftwarearchitecturethatincreasestheadaptability,flexibility,openness,andcost-efficiencyofIToperationsandenablesorganizationstobecomemoreagileinrespondingtochange.See“SAPNetWeaver.”
V
value map–AstructuraloverviewofSAP’send-to-endsolutionsorganizedaccordingtoindustry,lineofbusiness,ortechnology.ValuemapsarepresentedinSAPSolutionExplorer.
value-added reseller (VAR)–Partnerthatreceivesthemajorityofitsrevenuefromresellingavendor’shardwareorsoftwaresolutionsdirectlytoendusers.Additionally,VARsoftenprovideconsulting,implementation,postsalessupport,andtrainingtotheirowncustomers.VARsmaydevelopandselladd-onapplicationstomeettheneedsofverticalmarketsandmayexpandSAPproductfunctionality.
vertical solution–Aspecializedapplicationdesignedtomeettheuniqueneedsofaparticularbusinessorindustry.Alsocalled“industrysolution.”
291Glossary

Addresses
Formoreinformationaboutthemattersdiscussedinthisreport,contact:
Investor RelationsTel. +496227767336Fax [email protected]/investor
PressTel. [email protected]/press
GROUP HEADQUARTERS
SAP SEDietmar-Hopp-Allee1669190WalldorfGermany
Tel. +496227747474Fax [email protected]
TheaddressesofallourinternationalsubsidiariesandsalespartnersareavailableonourpublicWebsiteatwww.sap.com/directory/main.html.
292 Additional Information

Financial and Sustainability Publications
TheSAPIntegratedReportisavailableonlineonlyatwww.sapintegratedreport.cominEnglish,orinGermanatwww.sapintegratedreport.de.
ThefollowingpublicationsareavailableinEnglishatwww.sap.com/investor,orinGermanatwww.sap.de/investor:–SAPGroupAnnualReport(IFRS,inEnglishandGerman)–AnnualReportonForm20-F(IFRS,inEnglish)–SAPSEStatutoryFinancialStatementsandReviewofOperations(HGB,inGerman)
–Interimreports(inEnglishandGerman)–XBRLversionsoftheannualandinterimreports–SAPINVESTOR,SAP’squarterlyshareholdermagazine(www.sap-investor.com,inEnglishandGerman)
CompleteinformationonthegovernanceofSAPisavailableatwww.sap.com/corpgovernance.Materialsinclude:–Informationaboutthemanagementofthecompany,includingthedirectorsonthegoverningbodies
–Detailsofthedirectors’dealingsinSAPshares–Shareholdermeetingpapersandballotresults–ArticlesofIncorporation–AgreementontheInvolvementofEmployeesinSAPSE–GermanCodeofCorporateGovernance–DeclarationofImplementationpursuanttotheGermanStockCorporationAct,Section161
–CodeofBusinessConductforEmployees–CorporateGovernanceStatementpursuanttotheGermanCommercialCode,Section289a
–CorporateGovernanceReport
AdditionalSAPpoliciesaremadepublicatwww.sap.com/corporate-en/sustainability:–SAPEnvironmentalPolicy–SAPHumanRightsCommitment–SAPGlobalHealthandSafetyManagementPolicy–SAPSupplierCodeofConduct–SAPPartnerCodeofConduct
293293Financial and Sustainability Publications

2016
January 22Preliminaryresultsforfiscalyear2015
May 12AnnualGeneralMeetingofShareholdersMannheim,Germany
May 13Dividendpayment
2015
March 20PublicationofSAPIntegratedReport
April 21Resultsforthefirstquarterof2015
May 20AnnualGeneralMeetingofShareholdersMannheim,Germany
May 21Dividendpayment
July 21Resultsforthesecondquarterof2015
October 20Resultsforthethirdquarterof2015
Financial Calendar
294294 AdditionalInformation

TRADEMARKS© 2015 SAP SE or an SAP affiliate company. All rights reserved.
No part of this publication may be reproduced or transmitted in any form or for any purpose without the express permission of SAP SE or an SAP affiliate company.
SAP and other SAP products and services mentioned herein as well as their respective logos are trademarks or registered trademarks of SAP SE or an SAP affiliate company in Germany and other countries. Please see http://www.sap.com/about/legal/copyright.html for additional trademark information and notices.
PUBLISHERSAP SEInvestor Relations
CONCEPT AND REALIZATIONKuhn, Kammann & Kuhn GmbH, Cologne, Germany
PHOTOGRAPHY GLOBAL MANAGING BOARD Andreas Pohlmann, Munich, Germany
PRINTINGABC Druck, Heidelberg, Germany
COPYRIGHT© 2015 SAP SEDietmar-Hopp-Allee 1669190 WalldorfGermany
carbon neutralnatureOffice.com | DE-135-168230
print production
295Publication Details
Publication Details

RUN
SIMPLE
2014 AN
NU
AL R
EPORT
GROUP HEADQUARTERS
SAP SEDietmar-Hopp-Allee 1669190 WalldorfGermanywww.sap.com www.sap.com/investor
50127569


