ASSESSING SOFTWARE EXCELLENCE: A MODEL AND AN EMPIRICAL TEST by S. DUTrA* and L. N. VAN WASSENHOVE** 96/69/TM * Associate Professor of Information Systems at INSEAD, Boulevard de Constance, Fontainebleau 77305 Cedex, France. ** Professor of Operations Management and Operations Research at INSEAD, Boulevard de Constance, Fontainebleau 77305 Cede; France. A working paper in the INSEAD Working Paper Series is intended as a means whereby a faculty researcher's thoughts and findings may be communicated to interested readers. The paper should be considered preliminary in nature and may require revision. Printed at INSEAD, Fontainebleau, France.
Transcript
ASSESSING SOFTWARE EXCELLENCE:A MODEL AND AN EMPIRICAL TEST
by
S. DUTrA*and
L. N. VAN WASSENHOVE**
96/69/TM
* Associate Professor of Information Systems at INSEAD, Boulevard de Constance, Fontainebleau 77305Cedex, France.
** Professor of Operations Management and Operations Research at INSEAD, Boulevard de Constance,Fontainebleau 77305 Cede; France.
A working paper in the INSEAD Working Paper Series is intended as a means whereby a faculty researcher'sthoughts and findings may be communicated to interested readers. The paper should be consideredpreliminary in nature and may require revision.
Printed at INSEAD, Fontainebleau, France.
Assessing Software Excellence:A Model and An Empirical Test
Soumitra Dutta and Luk N. Van Wassenhove*Research Initiative in Software Excellence (RISE)
Technology Management AreaINSEAD
FontainebleauFrance 77305
Abstract
The strategic importance of software has long been recognised by both
practitioners and academics. Organizations have faced two challenges in
leveraging the strategic potential of software. First, there is a need for increased
maturity in software development processes. Second, many organisations have
struggled to derive adequate business value from software to key stakeholders.
Several models for assessing and improving the maturity of software processes
have been proposed in the literature. Taking guidance from recent developments
in the domain of Total Quality Management, this research proposes a model of
Software Excellence which extends the narrow focus of current software
maturity models on the "software factory" to the broader organisational context.
The Software Excellence Model defines the degree to which an organisation is
succeeding in both creating the enabling conditions and also in obtaining results
for leveraging software to create value for all key stakeholders including
shareholders, end-users, employees and the parent business unit at large. The
validity and usefulness of the Software Excellence Model is demonstrated by an
empirical test - a questionnaire-based survey of European organisations.
1 Introduction
This section introduces the need for excellence in software and outlines the focus and
structure of the paper.
1.1 Strategic Importance of Software
Software forms the "back-bone" of major industries such as banking, airlines and
publishing, and is an increasingly important value-adding component of consumer
products such as television sets, cameras, cars and mobile phone sets. Software is
* Author names are listed in alphabetical order. Both authors contributed equally to the paper.
1
today a dominant force in enabling companies to exploit new distribution channels,
create new products and deliver differentiated value-added services to customers. In
reality, there is often little difference between an organisation's software strategy and its
business strategy [7,44].
In addition to the ubiquitous nature of software, the amount of software code in most
consumer products and systems is doubling every two to three years. This increase is
being driven both by escalating demands placed on the functionality of software
systems and the rapid pace of progress in the enabling hardware technology.
Consequently, software developers are scrambling to cope with the pressures of
developing systems which are not only a couple of orders of magnitude bigger and
more complex than those developed a few years ago, but also which need to meet ever-
increasing demands for higher quality and superior performance.
The strategic importance of software has been long understood by practitioners and
researchers [33,40,42,41,47]. However, organisations face two major challenges in
leveraging the strategic potential of software. First, there is a need for a better execution
of software projects. Stories of dramatic time and cost overruns of software projects are
legendary. For example, Gibbs [16] notes that: "for every six new large-scale software
systems that are put into operation, two others are cancelled. The average software
project overshoots its schedule by half; larger projects generally do worse" (pp. 72-73).
Second, there is a need to derive greater business value for key organisational
stakeholders from software. Several researchers [1,31] have found little or no benefits
to organisations from recurrent investments in information technology. This
"productivity paradox" [6] is particularly significant when one notes that the delivered
computing power in many developed economies has increased by more than two orders
of magnitude over the past two decades [6]. Given the technological promise and
potential of software, Brynjolfsson [6] states that "..disillusionment and even
frustration with the technology is increasingly evident.." (p. 67). Indeed, there is a
growing concern that there is often a fundamental mis-alignment between the software
and business strategies of many organisations [4,13,19].
Over the last decade, several models such as the Capability Maturity Model (CMM)
[23,38,39], have been proposed and used within industry for assessing and improving
software development processes. The focus in CMM and similar models is on
addressing chronic problems in software development processes. They typically
address issues such as whether an organisation has appropriate software project
2
management procedures in place and whether the right metrics are being collected and
utilised for managing software processes.
Given the hurdles in obtaining adequate returns from rapidly escalating software
investments, and in aligning software strategy with an organisation's business strategy,
there is a need to include the broader organisational context of the application of
software within models for assessing and improving the strategic leverage of software.
Guidance can be obtained from the domain of Total Quality Management (TQM) where
research over the past four decades has incrementally extended the focus of TQM
models from a narrow "quality control" perspective to a company-wide strategic
"quality of management" perspective which is synonymous with overall business
excellence.
The contribution of this research lies in the proposal of a model of Software Excellence
(SE) which integrates the strengths of software process assessment models with the
overall business-wide scope of TQM models. Inspired by the European Quality Award
model [29], the proposed SE model defines the degree to which an organisation is
succeeding in . both creating the enabling conditions and also in obtaining results for
leveraging software to create value for all -key stakeholders. We also demonstrate the
validity and usefulness of the SE model by means of an empirical test - a questionnaire-
based survey of European organisations.
1.2 Structure of Paper
There are seven additional sections of the paper. The next section describes prior
research in assessing software maturity and TQM and outlines potential synergies
between the two domains. Section 3 outlines the integrated model for assessing SE
proposed in this paper. The research design used for this study is the subject of the next
section. The next three sections describe the empirical validation of our research.
Section 5 describes general results and overall scores of SE among the surveyed
organisations. This is followed by an analysis of the discriminatory and explanatory
power of the SE model in Section 6. Section 7 presents a discussion of the overall
results of the study and provides relevant comparisons with the literature. The last
section concludes the paper with notes on the limitations of the study and directions for
further research.
3
2 Software Maturity and Total Quality Management
This section describes prior research in TQM and software process maturity
assessments.
2.1 Models of Total Quality Management
The roots of the quality movement can be traced back to more than four decades ago.
The Deming Prize was launched in Japan in 1951 with the declared purpose of
"Awarding Prizes to those companies recognised as having applied Company Wide
Quality Control based on statistical quality control" [29, p. 152]. For the first decade,
the focus of the Deming Prize was limited to the application of statistical techniques in
the factory. Since 1964, the scope was expanded to include company-wide quality
control.
Established in the USA in 1987, the Malcolm Baldrige National Quality Award [36], is
based on the implementation of a company-wide system of Total Quality Management
(TQM). The Baldrige Award framework consists of several categories: Leadership,
Process Management, Human Resource Development and Management, Strategic
Planning, Information and Analysis, Customer Focus and Satisfaction and Business
Results. Over the years, the Baldrige Award categories have evolved from a
product/service quality focus to a wider definition of business excellence. For example
the categories "Process Management" and "Business Results" were previously titled
"Quality Assurance of Products and Services" and "Quality Results" respectively. Also
after criticism that the award emphasised investments in quality efforts at the expense of
bottom-line financial results, the award criteria were adjusted to give more importance
to customer satisfaction and bottom-line business results [15].
The European Quality Award was created in 1991 by the European Foundation for
Quality Management (EFQM). While influenced by the Baldrige Award framework,
the European Quality Award emphasises a holistic view of overall business excellence
[29]. It splits business excellence into two categories: Enablers (cause) and Results
(effect), with equal importance being assigned to both categories. There are five major
dimensions of Enablers: Leadership, People Management, Policy and Strategy,
Resources and Processes. Both financial and non-financial results for the key
stakeholders of an organisation are included in the Results category: People
Satisfaction, Customer Satisfaction, Impact on Society and Business Results. The
European Quality Award has been widely accepted within different European countries
as a basis for self-assessment and performance improvement.
4
Thus, over the years, quality models have progressively expanded in two directions.
First, there has been an increase in their scope from the "factory" to the entire
organisation. Second, the focus has shifted from a pre-dominant "product/service
quality" perspective to a notion of overall business excellence which delivers value to all
key stakeholders of the organisation - including customers, employees, shareholders
and society at large.
2.2 Software Maturity Models
The roots of research in software maturity assessment can be traced back to a decade
ago when the SEI in collaboration with the MITRE Corporation, began developing a
framework for assessing the maturity of software processes within organisations. From
a first description in 1987 [22] the framework has evolved over the years into the
widely accepted Capability Maturity Model (CMM) model for software maturity
assessment [38]. A recent article [39] provides a comprehensive review of the evolution
of the CMM model.
Since the pioneering work of the SEI, a number of initiatives in modelling and
assessing software process maturity have been started in parallel across the globe.
Some initiatives were started at the pan-European level such as BOOTSTRAP [28].
Other initiatives were developed with a focus on specific industries such as the Trillium
model [2] for the telecom industry. A common denominator in these alternate initiatives
is that they are all strongly influenced by the CMM model and essentially represent
different variations of the same themes.
The core concept underlying the CMM model [38] is that of five maturity levels - Initial,
Repeatable, Defined, Managed and Optimized - which define an ordinal scale for
assessing the maturity of an organisation's software processes. At the initial level, an
organisation's software processes are ad hoc and occasionally even chaotic. In contrast,
at the highest level, continuous improvement procedures enabled by the appropriate use
of metrics are institutionalised within the organisation's software processes. Table 1
provides a summary of the key process areas considered within the CMM [39].
Table 1 about here
The proliferation of different process assessment standards coupled with their increased
use in industry lead to the creation of the SPICE (Software Process Improvement and
5
Capability dEtermination) initiative [12,46], an attempt to create an international
standard for process assessment. While an initial architecture for the SPICE framework
has been proposed, the validation of this framework is ongoing within selected
organisations across the world [46].
The SPICE framework has the twin objectives of facilitating both process improvement
and capability determination [46]. Towards these ends, it distinguishes between two
types of practices: base practices and generic practices. Base practices cover the core
processes related to software development and are grouped into the following five
process categories: customer-supplier activity; engineering; project management;
support, and organisational (see Table 2). Generic practices refer to the implementation
and institutionalisation of processes within an organisation and help in the determination
of the appropriate capability level for the organisation. SPICE recognises six capability
levels: Initial, Performed, Managed, Defined, Measured and Optimized.
Table 2 about here
The evolution of software maturity models mirrors that of quality models. This is not
surprising given the fact that research in software maturity assessment was and
continues to be influenced strongly by research in total quality management. For
example, the CMM maturity framework was influenced by the work of Crosby [10]
and resulted from the adaptation of Crosby's quality management maturity grid to
software processes [43].
However, there is a lag in the evolution of software maturity models relative to quality
models. Current software maturity models emphasise the quality of the "software
factory" as opposed to measuring the impact of software on the entire organisation.
Also, the focus is primarily "software-product-related" as opposed to overall excellence
in delivering value from software to all major stakeholders of the organisation. A clear
indication of this lag is the fact that none of the existing software maturity models
include an emphasis on bottom-line business results.
3 Software Excellence
This section introduces a comprehensive model of SE which incorporates the strengths
of software maturity models and extends their scope to a wider organisational context.
6
3.1 A Model of Software Excellence
Software maturity models such as the CMM and SPICE largely focus on the superior
execution of software projects. For example, the CMM model prescribes specific
actions such as effective software project management, product assurance and change
control, for enabling an organisation to move its software processes from Level 1 to
Level 2. There is a need to expand the scope of software maturity models in order to
address the other important challenge mentioned in Section 1.1: the effective leverage of
software to derive value for all key organisational stakeholders. If experience in the
application of TQM models is to be taken as a guide, a narrow focus on improving the
maturity of software processes alone will not deliver the required organisational value.
The continuing quest for business value has been a major driver in the expansion of the
scope of TQM models from narrow "quality control" issues to a wider "quality of
management" perspective [11]. We propose below a model of Software Excellence
which integrates a software process perspective with the larger organisational context of
the application of software and focuses on the derivation of business value from
software.
In line with the notion of "business excellence" inherent within the European Quality
Model [29], we define "Software Excellence" (SE) as follows.
In any Software Producing Unit(SPU), leadership driving policy & strategy,
SPU people management, end-user management, resource management and
processes lead to Software Excellence, i.e., excellence in all aspects of the
creation and application of software in the broad organisational context.
Software Excellence in turn leads to end-user satisfaction, SPU people
satisfaction, a positive impact on the organisation and effective bottom-line
business results for the organisation.
In the above defmition, we use the term SPU (Software Producing Unit) to refer to
either an independent information technology organisation within a larger parent
organisation or an information technology division or department within an
organisation.
Figure 1 about here
Adapted from the European Quality Award model, the framework used for defming SE
is shown in Figure 1. There are ten aspects to be considered in total, which are
7
organised into two categories: Enablers and Results. Enablers are more concerned with
how things are done. Results are more focused on what has been achieved. A brief
description of the emphasis of each Enabler/Result category is as follows:
Enablers
• Leadership: The role of senior managers in creating and driving a culture of software
excellence throughout the organisation (including the SPU).
• SPU Policy and Strategy: The role of software excellence in the organisation's values,
vision, strategic direction and the implementation of its policy and strategy.
• SPU People Management How the organisation manages the SPU employees and
releases their potential to continuously improve the business.
• End-user Management: The nature, extent and effectiveness of partnerships created
between the SPU and its customers.
• Resource Management: The management, utilisation and preservation of financial and
non-financial resources by the SPU in a planned manner.
• Processes: The identification, management and continuous improvement of all key
processes related to the development of software.
Results
• SPU People Satisfaction: The organisation's success in meeting the needs and
expectations of the SPU employees.
• End-user Satisfaction: The degree of success in satisfying the needs and expectations
of the customers of the SPU.
• Impact on Organisation: The perception of the SPU within the organisation at large;
the degree of success of the SPU in satisfying the needs and expectations of the
organisation at large.
• Business Results: The success of the SPU in making the appropriate contribution to
the financial success and other business targets of the organisation.
There are two major changes in the SE model as compared to the European Quality
Award model. First, End-user Management has been introduced as a key element of the
Enablers. This is in recognition of the importance of partnerships with end-users for the
success of software projects [18,25]. All software maturity models have a special focus
on processes/activities interfacing with end-users. Second, the element "Impact on
Society" has been changed to "Impact on Organisation" in recognition of the fact that a
SPU exists within the context of the parent organisation analogous to an organisation
existing within society at large.
8
Analogous to the European Quality Award, a total of 1000 points has been divided
equally between the Enablers and the Results. As the assignment of points within the
European Quality Award was established "following a wide-ranging exercise to collect
views from business leaders, practitioners, academics and consultants" [29, p. 15], we
used it as a guide to determine the proportion of points assigned to each category of
Enablers and Results in the SE model. The proportion of points assigned to each Result
category is the same as in the European Quality Award. Due to the additional Enabler -
End-user Management - in the SE model, the points for this category were obtained by
proportionately reducing the points for the other Enablers. Table 3 summarises the
number of points assigned to and the salient aspects considered within each category of
the SE model.
Table 3 about here
3.2 Distinguishing .Features of the Software Excellence Model
Software maturity models such as CMM and SPICE primarily emphasise issues related
to software project management, software quality management, and the management
and improvement of software processes (see Tables 1 and 2). Within the SE model, the
Enabler category Processes includes aspects related to the management of software
processes which have been identified as important within CMM and SPICE. However,
there are nine other categories in the SE model which provides it with several unique
features relative to CMM and SPICE.
Perhaps the most striking feature is that the SE model emphasises the achievement of
business results, something which is ignored in software maturity models. As.
mentioned in Section 1.1, the derivation of business value from software is a key
challenge faced by organisations. The SE model includes both non-fmancial and
financial indicators of business results for all major stakeholders of the SPU - end-
users, SPU employees, shareholders and the parent business unit. Due to the equal
weight assigned to the Enabler and Result categories, it is impossible to achieve SE
without being good at both of them. Thus, the SE model explicitly includes the degree
to which an organisation has been successful in obtaining all-round business value from
software.
The SPICE framework recognises that software process improvement occurs in a
business context and, to be successful, must address business goals. However, within
9
SPICE, only process area ORG.1 (see Table 2) deals with selected organisational
aspects as detailed below:
• (ORG 1.1) Establish a strategic vision for the SPU;
• (ORG 1.2) Deploy the organisation's strategic vision to all employees;
• (ORG 1.3) Establish a culture which focuses on customer satisfaction;
• (ORG 1.4) Build integrated teams to satisfy customers;
• (ORG 1.5) Provide incentives to team members to accomplish team goals; and
• (ORG 1.6) Define appropriate career plans for employees.
In contrast, the SE model includes a significantly more comprehensive set of features of
the rich organisational context in which software is developed and applied to benefit the
major stakeholders of an organisation (see Table 3). Aspects related to software
Processes, which constitute the bulk of the content of CMM and SPICE, only account
for 12% of the total score assigned within the SE model. The importance of effective
software Processes is recognised by the fact that it accounts for the single largest
contribution (24%) within the Enablers. However, the SE model also includes five
other Enabler categories which cumulatively account for the bulk (76%) of the total
Enabler score, and cover the broad organisational context in which software is
developed and applied.
More specifically, the SE model recognises the important role -of top management
leadership in influencing the success of the SPU. Research [13,21,26,49] has indicated
that leadership and involvement of senior business managers are critical for the success
of software divisions within organisations. Issues related to top management leadership
and their involvement , in creating . a culture of software excellence within the
organisation remain largely unrecognised in software maturity models. The- SE model
also includes an elaborate treatment of issues related to SPU people management. The
literature [17,24] recognises that while software-related professionals constitute an
important and distinct group of employees within organisations, little effort has been
made to deal with their specific concerns and to better integrate them with the rest of the
organisation [13].
4 Empirical Validation of the Software Excellence Model
The research reported in this paper is based on the results of a questionnaire-based
survey of European organisations in late 1995. The research and survey described
below was conducted in collaboration with the European Software Institute, Bilbao,
Spain. This section describes the research design used in the study.
10
4.1 Design of Questionnaire
Several sources of information were used for the design of a questionnaire based on the
SE model. First, the existing body of literature on Software Maturity Assessment and
Quality Models was scrutinised carefully. In particular, aspects used to assess business
excellence within the European Quality Award model [29] and software maturity within
the CMM and SPICE models were found to be particularly useful for the design of the
questionnaire. Second, the authors conducted several discussions with managers to
elicit the key aspects of software excellence as perceived by practitioners. Finally, the
resulting questionnaire was pre-tested with selected INSEAD MBA participants and
evaluated by experts both at INSEAD and the European Software Institute for clarity
and relevance of the individual questions.
The SE questionnaire was made up of four sections. Section A had 9 general questions
about the SPU and its management, areas of operation and type of development
activities undertaken.
Section B and C contained 73 questions related to the Enablers and Results of the SE
model respectively. As the questionnaire represented a first exploratory attempt to test
our model of SE, we did not have pre-tested constructs representing the constituent
categories of the SE model. The use of a single item scale was discarded in favour of a
multi-item scale as research in measurement theory has "established beyond doubt...the
superiority of multi-item scales in respect of such matters as reliability,
unidimensionality and freedom from specific wording bias" [35, p. 182]. We used a
Likert scale [45] with multiple statements for each category, each statement covering a
particular facet of the respective dimension. Table 4 illustrates the nature of questions in
the SE questionnaire with a list of the precise questions used for the Enabler category
"SPU People Management".
Table 4 about here
Section D contained 6 questions to gather information on international software
development and the major obstacles in global software operations. In addition,
questions were included to ascertain the:
• Current and future competitive priorities for the responding SPUs (18 different
priorities were assessed);
11
• Use of formal methods by which the performance of the SPU was assessed, audited
or certified (9 different methods were included);
• Quantitative estimations of performance improvement in 28 key areas over the last two
years;
• Development cost structure for the SPU (3 questions); and
• Overall financial results of the SPU (12 questions).
4.2 Data Collection
The SE questionnaire was sent to around 3,000 companies all over Europe. Companies
were chosen at random from the INSEAD database as well as from the ESI database.
The data sample was distributed over all the European countries with at least 200
companies from each of the top 10 countries in order of GDP, and at least 100
companies each for the rest of the countries. Companies were selected from a number
of industrial sectors including information technology, manufacturing, business and
services.
A total of 85 duly completed questionnaires were received from companies (see
Appendix A for a profile of the respondents). This represents a response rate of 2.84%.
The low response rate can be attributed to the length of the questionnaire (20 pages), the
timing of the mailing (during the summer month of August 1995) and a lack of follow-
up with telephone or other direct contact after the mailing.
4.3 Analysis Outline
Very few responses were received from respondents for the data related to Section D
(global operations), estimations of performance improvement, development cost
structures and overall financial results. These questions were omitted entirely from the
analyses. The lack of responses on the above questions can be attributed to the
reluctance of respondents to part with financial information, the low usage of
quantitative measures of SPU performance and the lack of global operations on the part
of the respondents.
There were a few missing data for statements related to the various categories of
Enablers and Results of the SE model. The literature on replacing missing data [45] is
extensive and inconclusive. Given the limited missing data in the relevant part (Sections
B and C) of our survey and the exploratory nature of the research we decided to replace
the missing data with the "worst-case" assumption of "Absent" (see Response
categories in Table 4).
12
The reliability of the multi-item scale used in the SE questionnaire was measured with
the inter-item correlation matrix [34]. Cronbach' s alphas for each category of Enablers
and Results in the SE model was seen to be higher than 0.9. This suggests that the
scales used to measure the various categories of Enablers and Results are reliable. The
correlation matrices for the different Enabler and Result categories are shown in
Appendix B. The correlations are on the higher side, specially among the Enabler
categories.
The research results presented below consist of three parts. The focus in the first part
(Section 5) is on determining overall scores of SE for all responding SPUs and on
identifying their performance along each Enabler/Result category. Scores for both the
current and desired future levels of SE are presented. In . the next part (Section 6), we
focus on the explanatory power of the SE model. The group of respondents are divided
into two categories - those with high and low overall SE scores and the discriminatory
power of each Enabler and Result category is tested via discriminatory function
analysis. Also included in this section is a validation of the SE model through an
analysis of the variance in the Result categories which can be explained by the Enabler
categories. Section 7 provides a discussion of our findings and relates it to prior
research. Finally, the last part (Section 8) contains some concluding comments.
All statistical analyses were performed using Statistica [48].
5 General Results
This section describes the overall scores of SE determined in the survey and also
presents an analysis of the scores for the Enabler and Result categories for all
respondents.
5.1 Scores of Overall Software Excellence
An overall score of SE was computed for each company out of a maximum of 1000
points assigned across all dimensions of Enablers and Results (see Table 3 for the
distribution of points across the various Enabler and Result categories). This score was
calculated by normalising the scores for each Enabler/Result category and then
aggregating them with appropriate weights (as indicated in Table 3) to arrive at the final
overall score. The average SE score across all respondents is 473 out of a maximum of
1000 points (with a standard deviation of 125). The average scores for the Enablers and
13
Results for all respondents are 256 and 217 respectively out of a maximum of 500
points each (with standard deviations of 62 and 70 respectively).
It is important to note that the SE score (similar to scores computed using other
Software Maturity and Total Quality Models) is an assessment and not an accurate
measurement of the level of SE within an organisation. Thus it would not be right to
directly rank the performance of organisations based on the scores. Rather, the scores
give a good indication of the relative strengths and weaknesses of an organisation and
outline areas where further improvements are possible [9,20].
It is too early to establish the appropriate threshold for truly world-class SE in
companies. However some guidance can be obtained from the profiles of scores
achieved by companies winning major Quality Awards' . Allowing for variations in
assessor ratings and in the underlying model, Lascelles and Peacock [29, p.77] note
that "...anything between 700 and 800 points represents genuine world class. Anything
above 600 points represents a level of excellence to which few companies can aspire. A
typical score for an organisation that is being run competently and has a set of good
results is 450 points."
The distribution of the overall SE scores is depicted in Figure 2. Focusing on the
current SE scores, five companies have obtained scores in the range of 700 - 799 and
can claim to have achieved a measure of SE. About 64% of all respondents score below
500 and this gives an indication of the degree to which they can further improve their
respective levels of SE.
Figure 2 about here
The "future" SE scores of Figure 2 are computed on the basis of the importance
assigned by the responding SPUs to each dimension of the SE model over the next
three years (also see Table 4). Thus they cannot be directly compared to the current SE
scores. However, a distinct shift towards a "higher score" can be observed by
comparing the current and future "scores" in Figure 2. The average for the future score
is 657 with a standard deviation of 106. The average future scores for the Enablers and
Results for all respondents are 350 and 307 respectively out of a maximum of 500
points each (with standard deviations of 48 and 68 respectively). Clearly, all
1 One should keep in mind that the method used for computing the SE score is not the same as thatused for computing the overall scores for the European Quality Award. The latter does not use a strictquestionnaire format and leaves considerable freedom of judgement to the individual assessors inapplying the award criteria to specific organizations.
14
responding SPUs wish to improve their overall levels of SE in the near future with a
stronger emphasis on the Enablers.
Most organisations score below 500 in assessments using the European Quality Award
model. It is also a fact that software process maturity assessments have demonstrated
fairly low levels of software process capability in most organisations. Gibbs [16] notes
that as of 1994, of all the 261 organisations world-wide assessed using the CMM
model, a staggering 75% were at level 1 - the Initial level with no formal processes, no
measurements and no way to track their progress/failure; only two organisations world-
wide were found to be at the highest (Optimized) level of the CMM model. In another
recent survey, Brodman and Johnson [5] found that 64% of the companies in their
sample were at the lowest two levels of the CMM model and only 11% in the two
highest levels of the CMM model.
Against this background, the overall SE Scores tend to seem a bit optimistic - about
36% of the respondents score above 500. This could be caused by an upward bias due
to the limitations of self-assessment by the questionnaire format of the current survey.
The European Quality Award and CMM/Bootstrap assessments use a more rigorous
approach comprising several field visits and in-depth interviews by trained external
assessors [29] - aspects which are difficult to replicate in the current SE survey.
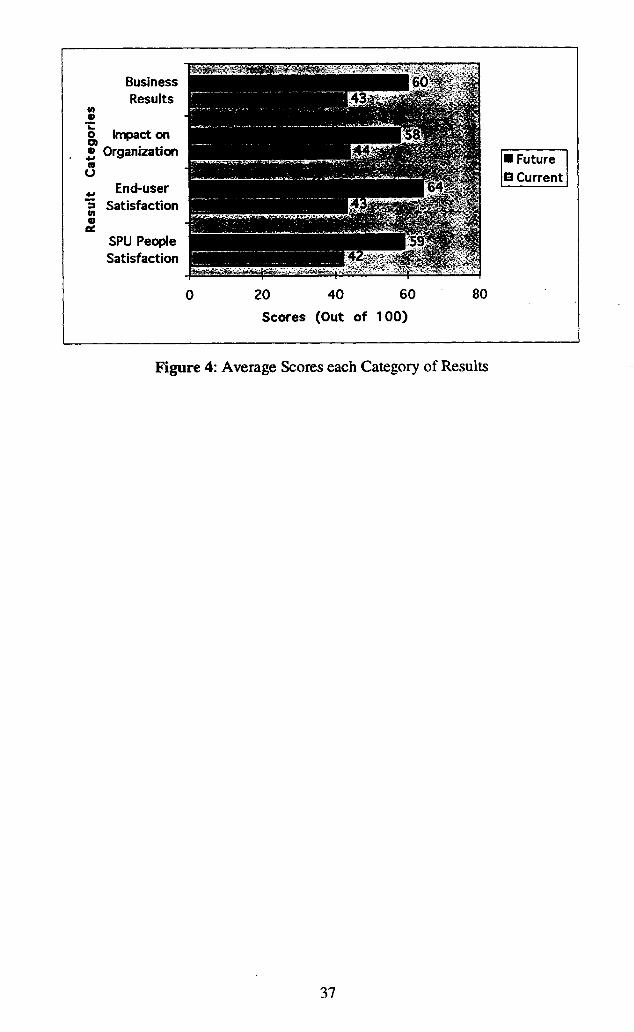
5.2 Overall Scores for Individual Enabler and Result Categories
Normalising each dimension of the SE model to a scale of 100, the average scores for
each category of Enablers and Results are shown in Figures 3 and 4 respectively.
Analogous to the future overall SE scores, the future scores for each Enabler and Result
category in Figures 3 and 4 are computed on the basis of the assigned importance to
each item constituting the scale for the respective category.
Figures 3 and 4 about here
Comparing the current and future "scores" it can be observed that the responding SPUs
assign a higher level of importance to all dimensions of Enablers and Results. More
importance is given in general to the Enablers as compared to the Results categories.
Also, all scores are clustered within relatively narrow ranges. This indicates a possible
lack of discriminatory focus in investments for enhancing SE - SPUs may not
necessarily be obtaining the right balance in their efforts along different categories of
Enablers and Results.
15
A more detailed discussion of our findings related to the salient management practices
comprising the Enabler and Result categories is presented in Section 7.
6 Validation of the Software Excellence Model
For the next phase of analysis, two subsets were selected from the responding
companies - twenty companies with the highest and lowest overall SE scores -
henceforth termed as the High Scorers and Low Scorers. Table 5 compares the average
future and current scores for the High and Low Scorers with all responding SPUs. The
Mann-Whitney U Test' [32] was used to confirm that there is a statistically significant
difference (p 0.001) in the overall SE scores between the High and Low Scoring
groups. A computation of the Mahalanobis distances [45,48] showed a very clear
distinction between the two groups with no incorrect classifications.
Table 5 about here
6.1 Discrimination by the Result Categories
Figure 5 depicts the scores for the different categories of Results for the High and Low
Scorers. A large difference can be observed between the two groups along all of the
Result categories. This indicates that the High Scorers have been more successful in
translating their investments in the Enablers to financial and non-financial business
results. The High Scorers have avoided falling in the trap which ailed many of the early
investments in TQM [11].
Figure 5 about here
Multiple discriminant function analysis was used to find the discriminatory power of
each Result category for distinguishing between the High and Low Scorers: Table 6
summarises the results. Overall, the discrimination is highly significant (Wilks' Lambda
= 0.091; F(4,35) = 87.25; p <0.000). As a Wilks' Lambda of 0 indicates perfect
discriminatory power, it can be concluded that the Result categories provide a robust
discrimination between the High and Low Scorers.
Table 6 about here
2 The Mann-Whitney U test is the most powerful non-parametric alternative to the west for independentsamples and is well suited to the sample sizes considered in our data set.
16
The Wilks' Partial Lambdas in Table 6 give the unique contribution of the respective
categories to the discrimination between the High and Low Scorers. We note that End-
user Satisfaction has the maximum discriminatory power between the two groups
(Wilks' Partial Lambda = 0.7; p = 0.0004). Thus if end-users of a SPU have a high
degree of satisfaction, then it is likely that the SPU is a High Scorer. The category
Business Results has the next highest discriminatory power (Wilks' Partial Lambda =
0.843; p = 0.01). This emphasises the importance of including bottom-line business
results in the SE model. It is interesting to note that SPU People Satisfaction also has
some discriminatory power (Wilks' Partial Lambda = 0.896; p = 0.05) between the
High and Low Scorers.
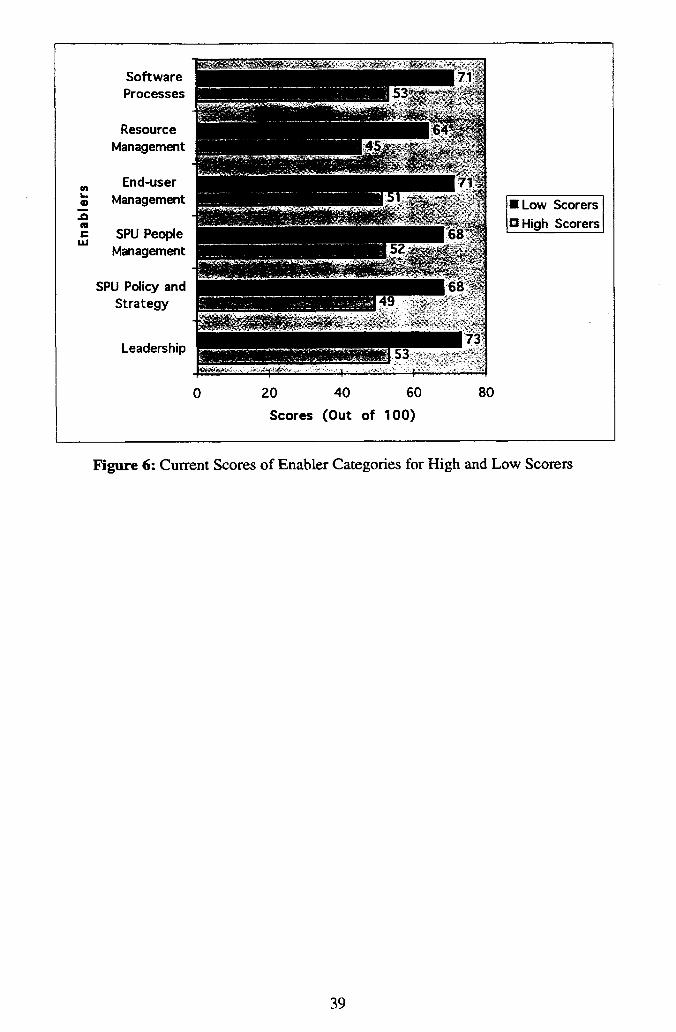
6.2 Discrimination by the Enabler Categories
Figure 6 depicts the scores for the different categories of Enablers for the High and
Low Scorers. A large difference can be observed between the two groups along all
Enabler categories.
Figure 6 about here
Multiple discriminant function analysis was also used to find the discriminatory power
of each Enabler category for distinguishing between the High and Low Scorers. Table 7
summarises the results. Overall, the discrimination is again highly significant (Wilks'
Lambda = 0.0828; F = 60.898; p <0.000) and the Enablers provide a robust
discrimination between the High and Low Scorers
Table 7 about here
Table 7 shows that the category SPU People Management has the maximum
discriminatory power (Wilks' Partial Lambda = 0.621; p = 0.000) between the High
and Low Scorers. The category End-user Management has a marginally lower
discriminatory power (Wilks' Partial Lambda = 0.657; p = 0.000) between the two
groups. The High Scorers are investing and succeeding in keeping both the developers
and customers of software satisfied to a higher degree. The categories of Leadership
(Wilks' Partial Lambda = 0.882; p = 0.043) and SPU Policy and Strategy (Wilks'
Partial Lambda = 0.891; p = 0.052) also have some discriminatory power between the
High and Low Scorers. These results show that senior management's role and actions
are relevant for influencing the level of SE.
17
It is interesting to note that the categories of Resource Management and Processes do
not discriminate between the High and Low Scorers. Thus the question can be raised
whether a narrow focus on Software Processes, as is common with software maturity
models such as CMM and SPICE, can lead to high levels of overall SE.
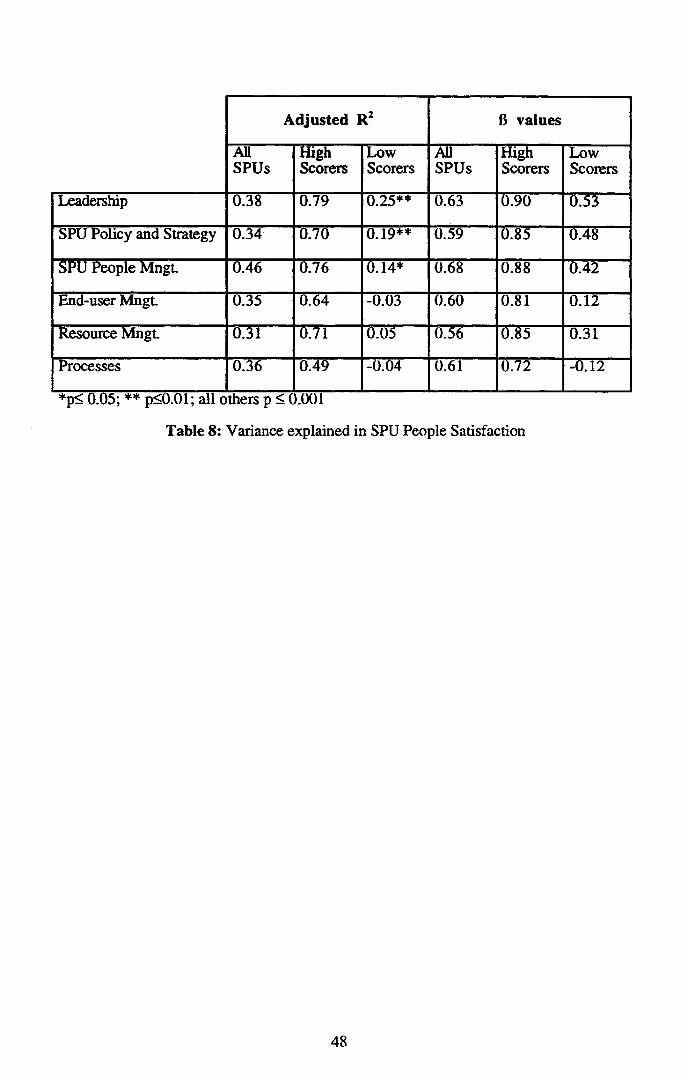
6.3 Analysis of Variance Based on Individual Enabler Categories
6.3.1 SPU People Satisfaction
Table 8 summarises the variance in SPU People Satisfaction explained by the different
Enabler categories individually. Not surprisingly, SPU People Management explains
the greatest amount of variance (46%) in SPU People Satisfaction when all respondents
are considered. All other Enabler categories also explain a significant amount of the
variance in SPU People Satisfaction - ranging from a high of 38% for Leadership to a
low of 31% for Resource Management.
Table 8 about here
The situation is different when one considers the High Scorers: although SPU People
Management explains a large proportion (71%) of the variance, Leadership now
explains the greatest amount (79%) of variance in SPU People Satisfaction. This
highlights the importance and need for effective leadership in guiding a SPU towards
higher levels of SPU People Satisfaction. The amount of variance explained by all other
Enabler categories also increases, though the increase is the smallest for the category
Processes (from 36% to 49%). It is interesting to note that the Enablers do not explain
much of the variation in SPU People Satisfaction for the Low Scorers.
While considering all responding SPUs and the High Scorers, the B values are all
positive and of a reasonably large magnitude. This indicates a direct positive impact of
each Enabler category on SPU People Satisfaction. Note that the B values are much
higher for the High Scorers than for all respondents (and the Low Scorers).
6.3.2 End-user Satisfaction
The variances in End-user Satisfaction explained by the different Enabler categories
individually are summarised in Table 9. Taking all responding SPUs into consideration,
Processes and End-user Management explain 39% and 37% of the variance in End-user
18
Satisfaction respectively. Next to these two Enablers, Leadership explains 24% of the
variance for all respondents. The proportion of variance explained by all Enabler
categories is low as compared to Table 8. While the low figures can be partly explained
by the diversity in the respondents (see Appendix A), it also indicates that the SE
questionnaire does not fully capture all causal factors for End-user Satisfaction
satisfactorily.
Table 9 about here
When only the High Scorers are considered, the amount of variance explained by
Processes, End-user Management and Leadership declines. However, all Enabler
categories (except for Resource Management) now explain a similar amount of variance
which ranges from a low of 20% for Leadership to a high of 27% for SPU Policy and
Strategy. Analogous to SPU People Satisfaction, the Enabler categories do not explain
any significant variance in End-user Satisfaction for the Low Scorers.
The B values are positive for all SPUs and the High Scorers. This indicates a direct
positive impact of each Enabler category on End-user Satisfaction. The B values for
Processes are the largest for all SPUs (0.63) and High Scorers (0.54). End-user
Management has the next largest B values, 0.62 for all SPUs and 0.51 for High
Scorers.
6.3.3 Impact on Organisation
Table 10 summarises the variances in Impact on Organisation as explained by the
different Enabler categories. When all respondents are included, SPU Policy and
Strategy explains 63% of the variance. SPU People Management and Resource
Management come in next explaining 52% and 50% of the variance respectively.
Table 10 about here
Similar to SPU People Satisfaction, the percentage of variance explained by all Enabler
categories increases when the High Scorers are considered. SPU People Management
and SPU Policy and Strategy now explain a very large part of the variance: 93% and
90% respectively. It is interesting to note that while the first five Enabler categories each
explain 72% or more of the variance in Impact on Organisation, the last category of
Enablers, Processes, only explains 47% of the variance in Impact on Organisation
(even though this is a relatively high figure for the diverse sample considered in this
19
research). These results indicate that overall excellence in the different Enablers do have
a beneficial impact on the organisation. While none of the Enablers explain a major part
of the variance in the Low Scorers for SPU People Satisfaction and End-user
Satisfaction, a significant part of the variance in Impact on Organisation for the Low
Scorers is explained by the different Enablers (except for Processes).
The B values are all positive and thus indicate a positive direct impact of each Enabler
category on Impact on Organisation. Note that the B values are much higher for the
High Scorers than for all respondents - ranging from a high of 0.96 for SPU People
Management to a low of 0.71 for Processes.
6.3.4 Business Results
Table 11 summarises the variances in Business Results as explained by the different
Enabler categories. End-user Management explains the largest (45%) variance in
Business Results for all respondents. Processes and Leadership explain 38% and 35%
of the variance in Business Results respectively.
Table 11 about here.
The proportion of variance explained increases for all Enablers when one considers
only the High Scorers - the figures range from a low of 44.% for Processes to a high of
65% for Resource Management. The uniformly high proportion of variance explained
by each Enabler shows that all Enabler categories have a significant impact on Business
Results. The Enablers do not explain any of the variance in the business results of the
Low Scorers.
• Again, the B values are all positive and thus indicate a positive direct impact of each
Enabler category on Business Results. Note that the B values are much higher for the
High Scorers than for all respondents and the Low Scorers.
6.4 Analysis of Variance Based on Combinations of Enablers
The variance explained in each Result category by a combination of two Enabler
categories and all Enabler categories was also analysed. The results of this analysis are
summarised in Table 12 for all respondents. There is no significant change in the
proportion of variance explained by either considering two Enabler categories at a time
or all Enabler categories at once. This is due to the relatively high correlations between
20
the different Enabler categories (see Appendix B). This stresses the need to further
ref= the SE model and the multiple-item scales used to measure each category in future
editions of the SE survey.
Table 12 about here
7 Discussion of Results
This section discusses the managerial implications of our research and relates our
findings to prior research.
7.1 Validity of the Software Excellence Model
A core assumption underlying the SE model is that a narrow focus on software
processes alone is insufficient to enable organisations derive business value from
software. The argument was made, that analogous to the evolution of TQM models, it
is necessary to expand the scope of software maturity models to the broader
organisational context. Thus, the range of Enablers was expanded to include five other
categories (beside Processes) which cumulatively account for 76% of the total
contribution of the Enablers to the SE score.
In this context, it is interesting to note that the Enabler category - Processes, which
represents the dominant emphasis within software maturity models, does not
discriminate between the High and Low Scorers (see Table 7). In contrast, the other
Enabler categories of End-user Management, SPU People Management, Leadership and
SPU Policy and Strategy all discriminate (to varying degrees) between the High and
Low Scorers. The benefits of using software maturity models to improve levels of
software maturity have been documented in the literature [9,20]. However, the results
of this study show that other aspects of the general organisational context are more
important in determining the overall level of software excellence achieved by an
organisation.
Relative to software maturity models, the SE model is unique in explicitly including the
value accrued to key organisational stakeholders. The underlying theory is that due
attention to the setting up of the right organisational context for the development and
application of software will lead to good business results as measured by the different
Result categories. The analysis of variance results summarised in Tables 8 through 12
show that a large proportion of the variance in the responding SPUs is explained by the
21
different Enabler categories, either individually or jointly. The proportion of variance
explained by the Enablers goes up significantly (except for End-user Satisfaction) when
only the High Scorers are considered. These results demonstrate a strong association
between investments in Enablers and the derivation of relevant business value and
justify the inclusion of both Enabler and Result categories in the SE model.
Figure 7 about here
Figure 7 provides a graphical summary of the Enabler categories which individually
explain the largest and least amount of variance in the Result categories for the High
Scorers. It is striking to note that the Enabler category Processes, explains the least
amount of variance in three Result categories: SPU People Satisfaction, Impact on
Organisation and Business Results. This again raises questions about the usefulness of
the narrow focus on software processes prevalent within software maturity models.
Figure 7 also shows that the other Enabler categories, Leadership, SPU Policy and
Strategy, SPU People Management and Resource Management play important roles in
explaining the variance in the Results. This reinforces the utility of including aspects of
the general organisational context within the SE model.
7.2 Robustness of the Results
The results of our research show strong support for the SE model. The utility of
including the general .organisational context in which software is developed and applied
has been demonstrated. Also, a strong association between the Enabler and Result
categories has been observed.
The SE model has been adapted from the European Quality Award model and it is likely
that the model will need further refinement. While the results of this research do not
support any obvious additions or deletions of Enabler/Result categories, the constituent
elements of the different categories will need additional careful attention. In particular,
the results of Table 9 suggest that aspects which explain End-user Satisfaction may not
be adequately captured within the current SE model/questionnaire.
The proportion of variance explained in the Result categories (see Tables 7 through 11)
is not very high when all respondents are considered. This could be attributed to the
diversity inherent in the sample of respondents (see Appendix A). However, it is
interesting to note that the explained variance increases significantly when only the High
Scorers are considered. This indicates that there are some common distinct features of
22
organisations with high levels of SE regardless of their underlying differences in terms
of sectors, countries, sizes and business foci.
7.3 Salient Management Practices
An analysis of the responses to the SE survey highlighted several salient aspects of
current management practices within the respondents. We restrict the discussion below
to key aspects of management practices related to the role of senior management,
partnerships with end-users, management of SPU personnel and software processes.
The quantitative numbers mentioned below within brackets following particular
statements are in either of the following formats: (AR) or (HS;AR;LS), where HS, AR
and LS are the average scores on a scale of 1 to 5 (see Table 4) for the High Scorers,
All Respondents and Low Scorers respectively for•the corresponding statement in the
SE survey.
7.3.1 Role of Senior Management
In only about half the responding SPUs, the strategy and mission of the SPU is set
personally by senior management, (2.7). A large number of SPUs said that progress
towards achieving software excellence is retarded by the fact, that senior management
display a lack of commitment and do not "walk the talk" with appropriate follow-up
actions (2.5). Few respondents felt that there is a method for evaluating whether the
SPU goals are attainable and if they fit the strategy of the parent business unit (2.2).
The above fmdings are consistent with these observations from the literature which has
documented the lack of adequate involvement of senior management in the planning and
execution of technology strategy. Business managers frequently do not consider
technology to be an area in which they needed to get involved personally [13].
Jarvenpaa and Ives [26] mention that "few nostrums have been prescribed so
religiously and ignored as regularly as executive support in the development and
implementation of management information systems" (p. 205). Lederer and Mendelow
[30] note that their research has shown that "top management still needs to be convinced
of the potential strategic impact of information systems" (p. 525).
However, a difference can also be observed between the High and Low Scorers in the
more intimate involvement of the senior management in setting the basic strategy and
mission of the SPU (3.3;2.7;2.1). Within the high scoring SPUs, senior management
take more active steps to instil a culture of SE within the SPU and the parent business
unit (3.2;2.7;2.2), and show their own commitment to it by their actions (3.1;2.5;1.9).
23
These views are echoed by Jarvenpaa and Ives [26], who found from a survey of fifty
five CEOs that those CEOs who participated in the management of IT were more
involved in it and that this in turn led to their firm being more progressive in the use of
IT. While senior management is more involved in the High Scorers, there is room for
improvement - they do not score higher than 3.5 for any management practice
7.3.2 Partnerships with End-users
The importance and utility of having end-users participate in the software development
process for defining requirements and specifications are well documented in the
literature [8,18,25]. Keil and Cannel [27] note that the issue "is not whether customers
should participate in the development process, but how they should participate" (p. 34).
Beyer and Holtzblatt [3] have emphasised the importance of a close collaborative
relationship between the software design team and the customer. A number of
customer-centred software development approaches such as participatory design [8]
have been proposed in the literature [3] in recent years.
Thus, it is not surprising to find that on average, the responding SPUs have created
procedures to create partnerships with end-users in order to learn about their needs and
concerns (2.9). However these partnerships are, in general, not very effective.
Procedures for obtaining regular feedback from end-users (2.5) 'and for reviewing the
scope and coverage of relationships with them are weak (2.3). As a result, SPUs do not
have a realistic overview of all customer complaints (2.5). While SPUs collect customer
data, they have neither established the relevance of these measures for customer
satisfaction (1.9) nor benchmarked them against comparable external organisations
(1.7).
The High Scorers fare much better than the average for all surveyed management
practices related to end-users. Their partnerships with end-users are more effective
overall (3.9;2.9;2.3). This is partially because personnel from all levels and functions
are actively involved in partnerships with end-users (3.4;2.6;2.0). This helps to create
multiple links between the SPU and its user community. Keil and Cannel [27] have
found that more successful projects have more links with end-users/customers than less
successful projects. The greater the number of indirect and direct links with end-
users/customers, the greater the exchange of information between developers and end-
users and the more successful the projects. In addition, the High Scorers have formal
processes for obtaining regular feedback from end-users (3.5;2.5;1.7) and for
systematic reviews and updates of the scope and coverage of the partnerships
(3.2;2.3;1.5). They have a better overview of all customer complaints and are more in
24
tune with the needs of their customers (3.2;2.5;1.8). It is useful to note that while the
High Scorers fare much higher than the average for all end-user related management
practices, their scores for each practice is less than 4.
7.3.3 Management of SPU Personnel
The effective management and satisfaction of SPU personnel is an area of general
weakness for the respondents. There is little progress in making SPU personnel more
empowered to act and take responsibility without increasing business risk (2.2). Most
SPUs do not regularly measure factors (such as staff turnover) which influence or
predict their personnel satisfaction (2.1). The career development plans for SPU
personnel are not adequately linked to the business plans of the SPU (2.5) and the
recognition and reward of their efforts are performed informally (2.3). Few SPUs have
succeeded in involving their employees in generating ideas for continuous
improvement, either individually or in groups (2.6). It is also interesting to note that in
most SPUs, management does not publicise results of SPU personnel perceptions and
act on them accordingly (1.9).
The High Scorers fare better, but not significantly more, than the average with respect
to SPU people management. They emphasise the empowerment of their personnel
(3.0;2.2;1.6) and involve them both individually and within groups in generating
improvements (3.3;2.6;2). They tend to have a more open organisation in which
management seeks out the perceptions of SPU personnel (3.4;2.6;1.9). However, they
do not score more than 3.5 for any people-management practice.
The above findings are again supported by the literature. While the concepts of
empowerment and career development have been researched extensively by
organisational researchers, "little attention has been devoted to exploring job
involvement and its relationship to the work experiences and job attitudes of IS
personnel" [24, pp. 176-177]. Prior research [17] has demonstrated that overall job
satisfaction is the primary motivator for SPU personnel to be organisationally
committed. SPU personnel have evolved over the years as a large and distinct group of
organisational employees who through the implementation of new technologies directly
and indirectly impact the consciousness and practices of other organisational employees
[24,37]. Without their commitment, it is unlikely that an organisation can leverage
technology successfully. Thus, a number of researchers have "identified effective
human resource management as a critical issue facing the IS field and have called
attention to the need for improving human resource planning, recruitment, and
development of IS employees" [24, p. 175].
25
7.3.4 Management of Software Processes
Relative to the other categories of Enablers, the responding SPUs score higher along
the Processes dimension. This reflects both the process-focus within software maturity
models and their increasing use within industry [23,38,39]. While project management
procedures are commonly adopted in most surveyed SPUs (3.0), few report having
systematic processes to evaluate and manage project related risks (2.5). The use of
metrics for managing software processes is poor (2.2) and this is confirmed in a recent
study on the adoption of software management best practices within Europe [14]. The
responding SPUs emphasise the structuring of processes to code and test software
(2.9) and the creation of a detailed software design is a routine part of the development
process (3.0). However, there is. little emphasis on the systematic reuse of software
components (1.9). This is supported by the literature [14].
The High and Low Scorers are similar with respect to coding, unit testing and software
integration practices. Project management practices are also equally emphasised in both
high and low scoring SPUs except with respect to risk assessment and the use of
metrics. High Scorers have established processes by which project risks are evaluated
and take steps to manage these risks continuously (3.0;2.5;1.9); they also collect and
analyse a more extensive set of software-related metrics to improve project performance
(3.0;2.2;1.7).
8 Conclusion
Software is an important enabler for organisations to exploit new distribution channels,
create new products and deliver differentiated value-adding services to customers.
Given the rapid progress of technology and the increasing inter-dependencies between
an organisation's business and software strategies, the ability to successfully develop
and leverage software is critical for the competitiveness of organisations.
Organizations have traditionally faced two major challenges with respect to software.
First, software development processes have been notoriously immature and examples
of dramatic cost and time overruns in software projects are common in the literature
[16]. Second, there has often been a fundamental mis-alignment between an
organisation's software and business strategies [4,13,19] leading to discontent and
frustration with inadequate returns from investments in technology.
26
Prior research in the domain of software engineering has largely focused on the former
challenge. Consequently, several software maturity models such as the CMM [39] and
SPICE [46], have been proposed with the aims of assessing and improving the maturity
of software development processes. The literature [9,20] provides examples of how
these software maturity models have been used by organisations to the identify
strengths and limitations of, and then improve software development processes.
Little has been done in the literature to define models which extend the software process
focus of software maturity models to the broader organisational context with the
objective of helping organisations obtain adequate business value from software.
Guidance in this direction can be taken from the domain of Total Quality Management,
where over the last four decades, quality models have progressively expanded in two
directions. First, they have increased their scope from the "factory" to the entire
organisation. Second, their emphases have shifted from a dominant "quality of product"
perspective to a "quality of management" perspective leading to overall business
excellence.
This research has put forward the concept of "Software Excellence" to capture the
ability of an organisation to (a) create the right organisational context for developing and
applying software and (b) derive appropriate business value to all key stakeholders -
shareholders, end-users, software-related employees and the organisation at large.
Adapted from the European Quality Award model [29], the SE model includes ten
different categories which have been grouped into two groups: Enablers and Results.
Enablers focus on how an organisation creates the appropriate context for Software
Excellence and consist of the following categories: Leadership, SPU Policy and
Strategy, SPU People Management, End-user Management, Resource Management and
Processes. Results describe the value accrued from software to key organisational
stakeholders and comprise SPU People Satisfaction, End-user Satisfaction, Impact on
Organisation and Business Results.
The SE model extends current research in software maturity models in the following
manner. First, it includes an explicit focus on the achievement of both financial and
non-financial business results for the organisation from software. Current software
maturity models ignore business results and thus can lead organisations into the pitfall
of inadequate returns faced by organisations investing in quality about a decade ago
[11,15]. The Result and Enabler categories have equal importance within the SE model
and thus it is impossible for an organisation to achieve a high level of SE without good
results from software-related activities. Second, the SE model includes far more of the
rich organisational context in which software is developed and applied than current
27
software maturity models. Software Processes, the pre-dominant focus of software
maturity models such as the CMM, account for only 12% of the entire SE score.
We have performed an empirical validation of the SE model through a questionnaire-
based survey of European organisations. Our survey results show that there is a strong
association between the Enablers and Results. A significant proportion of the variance
in the individual Result categories can be explained by the different Enabler categories
(see Section 6.3). These results show that investment in the Enabler categories is
associated positively with increased value in the Result categories. The necessity of
increasing the scope of the SE model from a narrow software process focus to the
broad organisational context is validated by the observation that the Enabler category,
Processes, does not discriminate between organisations with high and low levels of
overall SE. In contrast, the other Enabler categories of End-user Management, SPU
People Management, Leadership and SPU Policy and Strategy all discriminate between
the High and Low Scorers.
The overall scores of SE show that "Software Excellence", i.e., excellence in all aspects
of the creation and application of software in the general organisational context, remains
a distant objective for SPUs. Despite the lack of rigorous assessment in the
questionnaire format of the current survey, a large majority of the surveyed SPUs score
well below 500 (see Figure 2). In particular, the scores of the Result categories are
lower than for those for the Enablers. This shows that additional efforts are needed to
create more value for the key stakeholders of a SPU.
The results of the SE survey has also identified strengths and limitations of the
surveyed SPUs. Issues relating to senior management leadership, SPU personnel
management and end-user management need more attention. Senior management need
to get more involved in setting and communicating SPU strategy, and should reflect
their commitment to SE by their own actions. The aspirations and careers of SPU
personnel need to be managed more actively in order to increase their level of job
satisfaction and dedication to the organisation. While many SPUs are taking steps to
create partnerships with end-users, it is important the increase the degree of
effectiveness of these partnerships.
When the SE model is used to differentiate between SPUs with high and low overall SE
scores, it is clear that the high scoring SPUs score higher for all management practices
than their low scoring counterparts. However, their scores for all management practices
are relatively low (rarely above 3.5 and never above 4) and this highlights the large
scope for further improvement in the surveyed SPUs. It is also interesting to note that
28
aspects related to end-user management, SPU personnel satisfaction and senior
management leadership discriminate between the High and Low Scorers to a much
higher degree than the maturity of their respective software processes.
While the SE model shows promise in setting a new benchmark for assessing SE and
identifying areas for improvement for SPUs, some caution is necessary in interpreting
the results. The survey sample is relatively diverse - from many different countries and
sectors. One should note that the results presented in this report are for the aggregate
sample and thus may only be partially valid for a particular country or sector. Also, as
this was the first time that the SE model was proposed and used, the management
practices used to assess the different Enabler and Result categories may need to be
refined further. It is planned to conduct annual SE surveys in collaboration with the
European Software Institute to give a better feel for both the constituent elements of the
SE model and the true level of SE in European organisations.
Acknowledgements
The authors would like to thank Ashis Bhattacharya and Amit Pathare for conducting
the analyses for this research, and Santiago Rementeria and other colleagues at the
European Software Institute, Bilbao for help with the design and implementation of the
Software Excellence Questionnaire.
29
References
1. A. Barua, C. Kriebel, and T. Mukhopadhyay, "Information Technology and
Business Value: An Analytic and Empirical Investigation", University of Texas at
Austin Working Paper, Austin, TX, May 1991.
2. Bell Canada, "Trillium - Telecom Software Product Development Capability
Assessment Model", Draft 2.1, July 1992.
3. H.G. Beyer and K. Holtzblatt, "Apprenticing with the Customer", Communications
of the ACM, Vol. 38, No. 5, pp. 45-52, May 1995.
4. M. Broadbent and P. Weill, "Improving Business and Information Strategy
Alignment: Learning from the Banking Industry", IBM Systems Journal, Vol. 32,
No. 1, 1993, pp. 162-179.
5. J.G. Brodman and D.L. Johnson, "Return on Investment (ROI) from Software
Process Improvement as Measured by US Industry, Software Process
Improvement and Practice", Pilot Issue, pp. 35-47, 1995.
6. E. Brynjolfsson, "The Productivity Paradox of Information Technology",
Communications of the ACM, 35, pp. 66-77, 1993.
7. J.L. Cecil and E.A. Hall, 'When IT Really Matters to Business Strategy", The
McKinsey Quarterly, 2-26, Autumn 1988.
8. A. Clement and P. Van den Besselaar, "A Retrospective Look at PD Projects",
Communications of the ACM, Vol. 36, No.4., pp. 29-37, June 1993.
9. M. Craigmyle and I. Fletcher, "Improving IT Effectiveness through Software
Process Assessment", Software Quality Journal, 2, pp. 257-264, 1993.
10. P.B. Crosby, Quality is Free, Mc-Graw Hill, New York, 1979.
11. X. de Groote, C.H. Loch, L. Van der Heyden, Luk N. Wassenhove and E.
Yucesan, "Measuring Management Quality in the Factory", forthcoming European
Management Journal, 1996.
12. A. Dorling, "SPICE: Software Process Improvement and Capability
determination", Software Quality Journal, 2, pp. 209-224, 1993.
13. S. Dutta, "Linking IT and Business Strategy: The Role and Responsibility of
Senior Management", European Management Journal, 14:3, pp.255-268, 1996.
14. S. Dutta, S. Kulandaiswamy and L. N. Van Wassenhove, "Benchmarking
European Software Management Best Practices", INSEAD Working Paper
96/45/TM, 1996.
15. D.A. Garvin, "How the Baldrige Award Really Works", Harvard Business
Table 1: Key Process Areas within Different Maturity Levels of the CMM Framework
41
Process Area List of Processes
Customer-Supplier CUS.1 Acquire Software Product and/or ServiceCUS.2 Establish ContractCUS.3 Manage Customer Requirements and RequestsCUS.4 Perform Joint Audits and ReviewsCUS.5 Package, Deliver, and Install the SoftwareCUS.6 Support Operation of SoftwareCUS.7 Provide Customer ServiceCUS.8 Assess Customer Satisfaction
Engineering ENG.1 Develop System Requirements and DesignENG.2 Develop Software RequirementsENG.3 Develop Software DesignENG.4 Implement Software DesignENG.5 Integrate and Test SoftwareENG.6 Integrate and Test SystemENG.7 Maintain System and SoftwareENG.8 Perform Peer Reviews
Project PRO.1 Plan Project Life CyclePRO.2 Establish Project PlanPRO.3 Build Project TeamsPRO.4 Coordinate Project TeamsPRO.5 Manage RequirementsPRO.6 Manage QualityPRO.7 Manage RisksPRO.8 Manage Resources and SchedulePRO.9 Manage Subcontractors
Support SUP.1 Develop DocumentationSUP.2 Perform Configuration ManagementSUP.3 Perform Quality AssuranceSUP.4 Perform Problem Resolution
Organisation ORG.1 Engineer the BusinessORG.2 Define the ProcessORG.3 Improve the ProcessORG.4 Perform TrainingORG.5 Enable ReuseORG.6 Provide Development EnvironmentORG.7 Provide Work Facilities
Table 2: List of Process Categories and Processes within the SPICE Framework
42
Category(Points assigned) _
Examples of Aspects Considered
Leadership • Role of senior management in setting and communicating strategy and(90) mission of SPU;
• Steps taken by senior management to create a culture of SE;• Review of progress towards SE by senior management; and• Commitment of senior management towards SE with specific actions.
SPU Policy and • Role of SE in setting mission, values and strategy of SPU;Strategy • Use of information about internal and supplier performance in(60) planning SPU operations;
•Methods for evaluating the attainability and degree of fit of SPU'sgoals with those of the parent business unit; and• Knowledge of SPU's goals and plans among SPU employees.
SPU People • Established processes for employee appraisal and career development;Management • Involvement of employees in continuous improvement;(70) • Empowerment of employees;
• • Effective communication between employees and management; and• Perceptions of employees about the value, of their oyinions.
End-user • Steps to create active partnerships with end-users;Management . • Involvement of different personnel in partnerships with end-users;(90) • Formal processes to obtain feedback on partnerships with end-users;
• Review of scope and coverage of partnerships with end-users; and• Appropriate action on feedback from end-users.
Resource • Allocation of financial resources based on SE goals and strategy;Management • Reliability and availability of all information for decision making;(70) • Efficient use of sub-contractors; and
• Identification and appropriate use of emerging technologies.Software Processes • Definition of and management of software processes;(120) • Formal processes for obtaining software from external agencies;
• Conversion of customer requirements into a software architecture;• Formal project management process with estimates and schedules;
. • Evaluation of and management of project-related risks;• Formal process for change management;• Collection and analyses of software metrics;• Software quality control.
I i
SPU People •Measurement of factors influencing people satisfaction;Satisfaction • Process for employees to give their perceptions and feedback; and(90) • Actions by management upon feedback from employees.End-user Satisfaction • Realistic overview of all end-user complaints from all areas;(200) • Regular evaluation of key measures of end-user satisfaction; and
• Benchmarked superiority of results vis-a-vis competitors.Impact on • Evaluation of impact of SPU on parent business unit;Organisation • Use of SPU's capabilities to enhance parent unit's performance; and(60) • Recognition of SPU's contribution by management of parent unit.
, Business Results • Measurement of impact of SPU on parent unit's financial results;(150) •Measurement of impact of SPU on parent unit's non-financial results;
• Benchmarked superiority of results vis-a-vis competitors; and_ • Communication of financial and non-financial results to all personnel.
Table 3: Selected Aspects of Enablers and Results
43
Instructions (common for all questions of the Enablers categories)
In the following list we identify a number of factors which are enablers of the SoftwareExcellence Strategy of the SPU. On the left-hand side, please indicate the number thatbest indicates the current practice levels of your SPU. The numbers representing thecapability levels should be interpreted in the following manner:
1- Absent not performed; perhaps some good ideas but not much progress onimplementation.
2 - Performed Informally: not rigorously performed; performance depending onthe skill and effort of individuals
3 - Institutionalised: performance according to well-defined procedures isformalised across the organisation;
4 - Controlled and Managed: subject is well understood; performance measuresare systematically collected and analysed; performance is objectivelymanaged for improvements.
5 - Optimised: an outstanding result that is universally implemented and servesas a role model achievement.
On the right hand side, please indicate the number that best indicates the importance ofeach item to your SPU over the next three years. On a scale from 1 to 5, 1 representsthe lowest degree of importance and 5 the highest degree.
SPU People Satisfaction
1 2 3 4
2 3 4
1 2 3 4
2 3 4
2 3 4
1 2 3 4
2 3 4
1 2 3 4
1 2 3 4
1 2 3 4
1 2 3 4 5
1 2 3 4 5
1 2 3 4 5
1 2 3 4 5
5 Does the SPU derive its peopleplans directly and formally from itsbusiness plans?
5 Is there an established and generallyaccepted process in the SPU forperiodic employee appraisalsincluding career development andtraining?
5 Are all SPU personnel both asindividuals and groups involved ingenerating improvements?
5 Can the SPU show that SPUpersonnel are becoming moreempowered to act and takeresponsibility without increasingbusiness risk?
5 Does the SPU recognise and rewardeffort towards software excellence atthe same level as other factors likequalifications or service?
5 Has the SPU management achievedeffective two-way communicationwith the SPU personnel?
5 Do the SPU personnel feel that theyare informed about activities in theSPU and do they feel that theiropinions are valued?
Table 4: Sample questions from the Software Excellence Questionnaire
44
Current Scores
All Respondents High Scorers Low ScorersMean Standard
deviationMean Standard
deviationMean Standard
deviationOverall SEScore(1000)
473 125 653 56 321 35
Enablers(500)
256 62 335 37 181 24
Results(500)
217 70 317 34 139 23
Future Scores
Overall SEScore(1000)
657 106 741 67 589 106
Enablers(500)
350 48 381 43 322 50
Results(500)
307 68 359 36 266 65
Table 5: Software Excellence Scores Summary
45
Wilks' Lambda for model = 0.09115F(4,35) = 87.250 N = 40 p < 0.0000
Variables Wilks' Lambda Wilks' PartialLambda
p-level
SPU PeopleSatisfaction
0.101 0.896 0.0516
End-userSatisfaction
0.130 0.700 0.0004
Impact onOrganisation
0.107 0.854 0.7674
Business Results 0.108 0.843 0.0154
Table 6: Discriminant Function Analysis Summary for Results Between High andLow Scorers
46
Wilks' Lamda for model = 0.08283F(6,33) = 60.898 N = 40 p < 0.0000
Variables Wilks' Lambda Wilks' PartialLambda
p-level
Leadership 0.094 0.882 0.043
SPU Policy &Strategy
0.092 0.891 s 0.052
SPU PeopleManagement
0.133 0.621.
0.000.
End-userManagement
0.126 0.657 0.000
ResourceManagement
0.084 0.987 0.513
Processes 0.085 0.973 0.352
Table 7: Discriminant Function Analysis Summary for Enablers Between High' andLow Scorers
47
Adjusted R2 B values
AllSPUs
HighScorers
LowScorers
AllSPUs
HighScorers
LowScorers
Leadership 0.38 0.79 0.25** 0.63 0.90 0.53
SPU Policy and Strategy 0.34 0.70 0.19** 0.59 0.85 0.48
SPU People Mngt. 0.46 0.76 0.14* 0.68 0.88 0.42
End-user Mngt. 0.35 0.64 -0.03 0.60 0.81 0.12
Resource Mngt. 0.31 0.71 0.05 0.56 0.85 0.31
Processes 0.36 0.49 -0.04 0.61 0.72 -0.12
*p5_ 0.05; ** p�. .01; all others p 0.001
Table 8: Variance explained in SPU People Satisfaction
48
Adjusted le B values
AllSPUs
HighScorers
LowScorers
AllSPUs
HighScorers
LowScorers
Leadership 0.24 0.20 0.11* 0.45 0.49 -0.4
SPU Policy and Strategy 0.17 0.27 0.01 0.43 0.51 -0.25
SPU People Mngt. 0.21 0.22 0.13 0.47 0.51 -0.42
End-user Mngt. 0.37 0.22 -0.04 0.62 0.51 0.11
Resource Mngt. 0.15 0.16
'
-0.05 0.40 0.44 -0.05
Processes 0.39 0.26 -0.05 0.63 0.54 0.07
*p.� 0.05; ** 1; all others p 0.
Table 9: Variance explained in End-user Satisfaction
49
Adjusted R2 B values
AllSPUs
HighScorers
LowScorers
AllSPUs
HighScorers
LowScorers
Leadership 0.37 0.84 0.32** 0.62 0.92 0.60
SPU Policy and Strategy 0.63 0.90 0.75** 0.79 0.95 0.88
SPU People Mngt. 0.52 0.93 0.67** 0.72 0.96 0.83
End-user Mngt 0.41 0.81 0.36** 0.65 0.90 0.63
Resource Mngt 0.50 0.72 0.57** 0.71 0.86 0.77
Processes 0.27 0.47 0.01 0.53 0.71 0.24
*p5_ 0.05; ** p5.0.01; all others p 0.001
Table 10: Variance explained in Impact on Organisation
50
Adjusted R2 B values
AllSPUs
HighScorers
LowScorers
AllSPUs
HighScorers
LowScorers
Leadership 0.35 ' 0.52 -0.04 0.60 0.74 0.13
SPU Policy and Strategy 0.31 0.56 -0.02 0.57 0.76 0.17
SPU People Mngt. 0.32 0.54 -0.02 0.57 0.75 0.18
End-user Mngt. 0.45 0.54 0.06 0.67 0.75 0.32
Resource Mngt. 0.30 0.65 0.05 0.55 0.82 0.31
Processes 0.38 0.44 0.003 0.63 0.68 0.23
*p� 0.05; ** p5. .01; all others p 0.00
Table 11: Variance explained in Business Results
51
Result Category Enabler Category(ies) Proportion of VarianceExplained
Best Models with two Enabler Categories (All Respondents)
SPU People Satisfaction SPU People ManagementProcesses
Impact on Organisation SPU Policy and StrategySPU People Management
63.67%
Business Results End-user ManagementProcesses
46.84%
Models Considering all Enabler Categories (All Respondents)
SPU People Satisfaction All Enablers 46.2%
End-user Satisfaction All Enablers 41.5%
Impact on Organisation All Enablers 64.3%
Business Results All Enablers 47.3%
Note: p5. 0.01 for all numbers
Table 12: Variance Explained in Result Categories by Combinations of Enablers
52
Appendix A: Profile of Respondents
A breakdown of the home-countries of the respondents is as follows: France (12),Ireland (12), Germany (10), Finland (8), Switzerland (8), Great Britain (7), Spain (6),Sweden (4), Belgium (3), Croatia (3), Italy (2), Netherlands (2), USA (2), Austria (1),Denmark (1), Iceland (1), Mexico (1), Portugal (1) and Russia (1).
A sectorial breakdown of the responding SPUs is as follows: IT activities (58%),Business (16%) and Manufacturing (12%). Individual SIC codes were not taken as thebase unit of differentiation among companies because of the small sample size.
Companies were asked to classify themselves as either a company, a department, adivision or as an "other" category. About 60% of the respondents were SPUs whichwere a division or a department within a larger organisational unit while 40% wereautonomous companies.
Fifty two out of the 85 respondents (60%) had less than 100 employees. At the otherend of the spectrum, there were a few very large firms (only 8 companies have morethan 10,000 employees). Twenty seven companies out of 78 (almost 35%) had lessthan 10% of the total number of employees in software-related jobs.
With respect to the development categories for the respondents (each respondent couldtick multiple categories if applicable), the largest number were from the Electronic DataProcessing/Management Information Systems domain (50), followed by TransactionProcessing (40), Decision Support Systems (32), Control Systems (27),Telecommunications (25), Production Systems (20) and Software DevelopmentProducts (16). This shows that a majority of surveyed companies were involved in -developing software applications to support business needs. In fact, 71% of therespondents were working in at least one of the top three categories.
Customised Software Development was the largest percentage (38%) of the portfolio of.software activities for the responding SPUs, although this number was expected todecline slightly (to 33%) in the next year. The next three major categories of softwareactivities for the responding SPUs were Software Product Development (28%),Maintenance (28%) and Embedded Applications (25%).
An analysis was done of the distribution of project work among the various softwarelife cycle activities. The maximum amount of time (27%) was being spent by therespondents on coding and unit testing. Upstream activities such as Requirements(11%) and Planning/Specifications (13%) were getting less emphasis while moreemphasis was being given to activities like System Testing (17%) and Maintenance(16%).
53
Appendix B
Correlation Matrices for Enablers and Results (All Respondents)
Leader- -ship ,
SPU Policy '& Strategy
SPU People 'Mngt. ,
End-user -Mngt.
ResourceMngt.
Processes
Leader-ship
1 0.78 0.74 0.66 0.60 0.70
SPUPolicy &Strategy
1 0.83 0.72 0.82 0.66
SPUPeopleMngt.
1 0.72 0.75 0.74
End-userMngt.
1 0.70 0.77,ResourceMngt.
1 0.64
Processes 1
Correlations Among Enabler Categories for All Respondents
SPU PeopleSatisfaction
End-userSatisfaction
Impact onOrganisation
BusinessResults
SPU PeopleSatisfaction
1 0.55 0.64 0.55
End-userSatisfaction
1 0.44 0.69
Impact onOrganisation
1 0.60
BusinessResults
1
Correlations Among Result Categories for all Respondents