48
Sample Reports for
Sample Reports for
Inputs Primary data input sheet.
This is where the majority of assumptions regarding project costs, revenues and financing are entered.

Main Inputs for Greenwood Park Estate Option 1 - Subdivision - Subdivision - 179 Lots
Estate Master Licensed to: Estate Master Administration Version 5.3 May 2013
Preliminary
Cash Flow Title Option 1 - Subdivision Description of Option/Stage Subdivision - 179 Lots
Date of First Period: Jun-2007
Cash Flow Rest Period: Monthly
Enter Project Size (a) 14.0 ha
Enter Project Size (b) 179.0 lots
Enter Site Area 14.0 Ha Floor Space Ratio 0 :1 Equated Gross Floor Area= 0.0 Ha
Type Land Subdivision
Status Under Review
Goods and Services Tax (Using General Tax Rule)
N Developer Credits Reclaimed in the Same Month Liability Paid in the Same Month Liability on Sales All Paid by Developer
Goods and Services Tax Rate 10.00% 12.50% 20.00% 0.00%
13,000,000
0.0%
Start Span %Owner All Project Costs To be entered Inclusive of GST- 0 - - Rental Income & Leasing Costs To be entered Inclusive of GST
Sales Revenue To be entered Inclusive of GSTOther Income To be entered Inclusive of GST
Y
1000 Land Purchase & Acquisition Costs
Costs to be entered Inclusive of GST
-
Land Purchase Price 13,000,000
GST Component on Purchase Price -
% of Land Purchase Price AND/OR Month Month Cash Flow GST Included on Land Price? n Total Current Total Current Total Escalated
Code Stage % paid Amount Lump Amount Start Span Period Reclaim All After First Land Payment Costs (exc GST) Costs (inc GST) Cost1002 - Deposit in Trust Account ¹ 0.00% - - 0 - - - - -1003 - Payment 1 10.00% 1,300,000 - 0 1 Jun-07 - Jun-07 1,300,000 1,300,000 1,300,0001004 - Payment 2 40.00% 5,200,000 - 11 1 May-08 - May-08 5,200,000 5,200,000 5,200,0001005 - Payment 3 30.00% 3,900,000 - 19 1 Jan-09 - Jan-09 3,900,000 3,900,000 3,900,0001006 - Payment 4 0.00% - - 0 1 Jun-07 - Jun-07 - - -1007 - Settlement (Balance) 20.00% 2,600,000 27 1 Sep-09 - Sep-09 2,600,000 2,600,000 2,600,0001008 - Stamp Duty ¹ NSW 850,490 0 1 Jun-07 - Jun-07 (Stamp Duty calculated on Land Value of 13,000,000 exc. GST) Stamp Duty 850,490 850,490 850,490
Interest on Deposit in Trust Account 0.00% Interest from deposit shared between parties TOTAL 13,850,490 13,850,490 13,850,490
Profit Share to Land Owner 0.00% Paid progressively as project makes a profit.
Other Acquisition Costs % of Land Price exc Tax AND/OR Month Month Cash Flow Total Current Total Current Total Escalated
Code Stage (to be entered Inclusive of GST) % paid Amount Lump Amount Start Span Period GST Included Remarks Costs (exc GST) Costs (inc GST) Cost1011 - legals and valuation 1.00% 130,000 - L - Jun-07 - Sep-09 Y 118,182 130,000 130,0001012 - . 0.00% - - 0 - - Y - - -1015 - . 0.00% - - 0 - - Y - - -
Manual Input (refer to Cash Flow) - - -
¹ (No GST credit available for Stamp Duty) ² Pro-rata with Land Payments ('L') TOTAL 118,182 130,000 130,000
Cost Escalation
Escalation Rates (Monthly Compounded Escalation) based on Cashflow Period Years commencing
Jun-07 Jun-08 Jun-09 Jun-10 Jun-11 Jun-12 Jun-13 Jun-14 Jun-15 Jun-16
Professional Fees 2.50% 2.50% 2.50% 2.50% 0.00% 0.00% 0.00% 0.00% 0.00% 0.00%
Code Construction Costs (Uncategorised) 2.50% 2.50% 2.50% 2.50% 0.00% 0.00% 0.00% 0.00% 0.00% 0.00%
SUB Subdivision Costs 0.00% 0.00% 0.00% 0.00% 0.00% 0.00% 0.00% 0.00% 0.00% 0.00%
STG Stage Costs 0.00% 0.00% 0.00% 0.00% 0.00% 0.00% 0.00% 0.00% 0.00% 0.00%
BUI Built Form 0.00% 0.00% 0.00% 0.00% 0.00% 0.00% 0.00% 0.00% 0.00% 0.00%
OT1 Other 0.00% 0.00% 0.00% 0.00% 0.00% 0.00% 0.00% 0.00% 0.00% 0.00%
OT2 Other 0.00% 0.00% 0.00% 0.00% 0.00% 0.00% 0.00% 0.00% 0.00% 0.00%
None Statutory Fees 2.50% 2.50% 2.50% 2.50% 0.00% 0.00% 0.00% 0.00% 0.00% 0.00%
Miscellaneous Costs 1 2.50% 2.50% 2.50% 2.50% 0.00% 0.00% 0.00% 0.00% 0.00% 0.00%
Miscellaneous Costs 2 2.50% 2.50% 2.50% 2.50% 0.00% 0.00% 0.00% 0.00% 0.00% 0.00%
Miscellaneous Costs 3 2.50% 2.50% 2.50% 2.50% 0.00% 0.00% 0.00% 0.00% 0.00% 0.00%
Land Holding Costs 2.50% 2.50% 2.50% 2.50% 0.00% 0.00% 0.00% 0.00% 0.00% 0.00%
Selling and Leasing Costs 2.50% 2.50% 2.50% 2.50% 0.00% 0.00% 0.00% 0.00% 0.00% 0.00%
Finance Costs 2.50% 2.50% 2.50% 2.50% 0.00% 0.00% 0.00% 0.00% 0.00% 0.00%
2000 Project Contingency - And / Or 0.00% of Construction, Professional , Statutory Fees, Miscellaneous Costs 1, Miscellaneous Costs 2, Miscellaneous Costs 3 TOTAL -
Estate Master DF Ver 5.3 Page 1 of 5 Pages File: New2.emdf Date of Report: 14/10/2013 12:17 PM
Main Inputs for Greenwood Park Estate Option 1 - Subdivision - Subdivision - 179 Lots
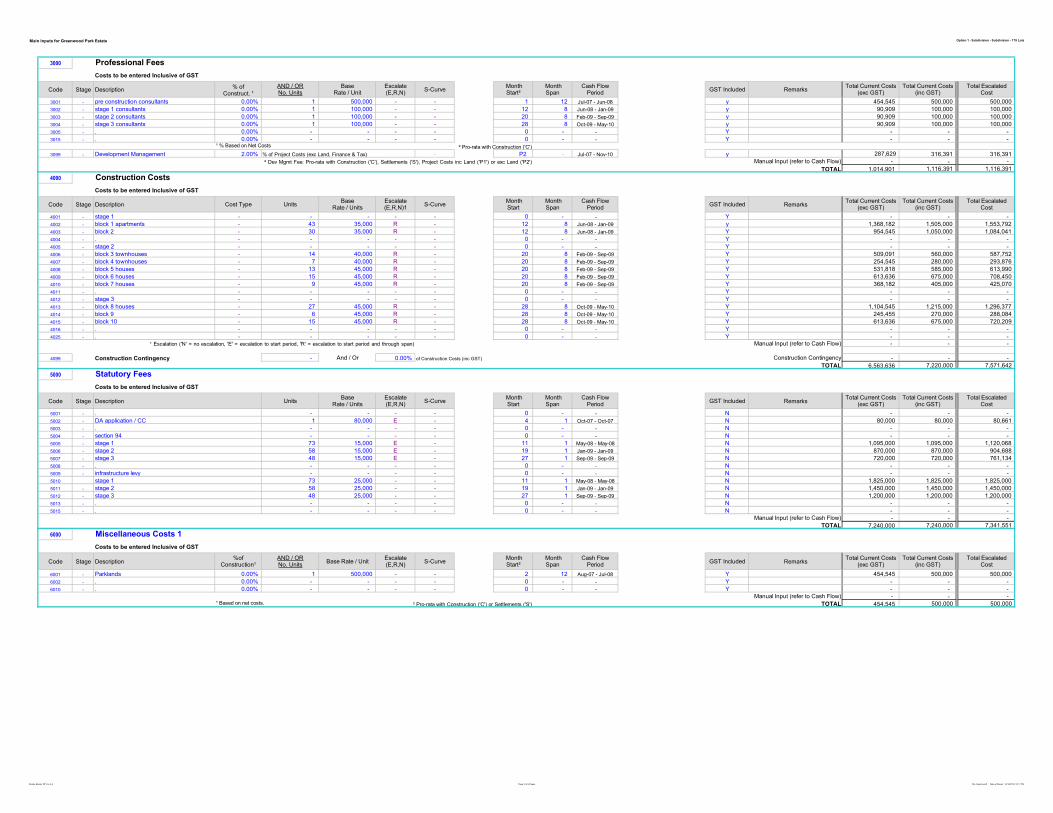
3000 Professional Fees
Costs to be entered Inclusive of GST
Code Stage Description% of
Construct. ¹
AND / ORNo. Units
BaseRate / Unit
Escalate(E,R,N)
S-Curve MonthStart²
MonthSpan
Cash Flow Period
% Paid byOwner
GST Included RemarksTotal Current Costs
(exc GST)Total Current Costs
(inc GST)Total Escalated
Cost
3001 - pre construction consultants 0.00% 1 500,000 - - 1 12 Jul-07 - Jun-08 - y 454,545 500,000 500,000
3002 - stage 1 consultants 0.00% 1 100,000 - - 12 8 Jun-08 - Jan-09 - y 90,909 100,000 100,000
3003 - stage 2 consultants 0.00% 1 100,000 - - 20 8 Feb-09 - Sep-09 - y 90,909 100,000 100,000
3004 - stage 3 consultants 0.00% 1 100,000 - - 28 8 Oct-09 - May-10 - y 90,909 100,000 100,000
3005 - . 0.00% - - - - 0 - - - Y - - -
3015 - . 0.00% - - - - 0 - - - Y - - -¹ % Based on Net Costs ² Pro-rata with Construction ('C')
3099 - Development Management 2.00% % of Project Costs (exc Land, Finance & Tax) - P2 - Jul-07 - Nov-10 - y 287,629 316,391 316,391
² Dev Mgmt Fee: Pro-rata with Construction ('C'), Settlements ('S'), Project Costs inc Land ('P1') or exc Land ('P2') Manual Input (refer to Cash Flow) - - -
TOTAL 1,014,901 1,116,391 1,116,391
4000 Construction Costs
Costs to be entered Inclusive of GST
Code Stage Description Cost Type UnitsBase
Rate / UnitsEscalate(E,R,N)1
S-Curve MonthStart
MonthSpan
Cash Flow Period
% Paid byOwner
GST Included RemarksTotal Current Costs
(exc GST)Total Current Costs
(inc GST)Total Escalated
Cost
4001 - stage 1 - - - - - 0 - - - Y - - -
4002 - block 1 apartments - 43 35,000 R - 12 8 Jun-08 - Jan-09 - y 1,368,182 1,505,000 1,553,792
4003 - block 2 - 30 35,000 R - 12 8 Jun-08 - Jan-09 - Y 954,545 1,050,000 1,084,041
4004 - . - - - - - 0 - - - Y - - -
4005 - stage 2 - - - - - 0 - - - Y - - -
4006 - block 3 townhouses - 14 40,000 R - 20 8 Feb-09 - Sep-09 - Y 509,091 560,000 587,752
4007 - block 4 townhouses - 7 40,000 R - 20 8 Feb-09 - Sep-09 - Y 254,545 280,000 293,876
4008 - block 5 houses - 13 45,000 R - 20 8 Feb-09 - Sep-09 - Y 531,818 585,000 613,990
4009 - block 6 houses - 15 45,000 R - 20 8 Feb-09 - Sep-09 - Y 613,636 675,000 708,450
4010 - block 7 houses - 9 45,000 R - 20 8 Feb-09 - Sep-09 - Y 368,182 405,000 425,070
4011 - . - - - - - 0 - - - Y - - -
4012 - stage 3 - - - - - 0 - - - Y - - -
4013 - block 8 houses - 27 45,000 R - 28 8 Oct-09 - May-10 - Y 1,104,545 1,215,000 1,296,377
4014 - block 9 - 6 45,000 R - 28 8 Oct-09 - May-10 - Y 245,455 270,000 288,084
4015 - block 10 - 15 45,000 R - 28 8 Oct-09 - May-10 - Y 613,636 675,000 720,209
4016 - . - - - - - 0 - - - Y - - -
4025 - . - - - - - 0 - - - Y - - -
¹ Escalation ('N' = no escalation, 'E' = escalation to start period, 'R' = escalation to start period and through span) Manual Input (refer to Cash Flow) - - -
4099 Construction Contingency - And / Or 0.00% of Construction Costs (inc GST) Construction Contingency - - -
TOTAL 6,563,636 7,220,000 7,571,642
5000 Statutory Fees
Costs to be entered Inclusive of GST
Code Stage Description UnitsBase
Rate / UnitsEscalate(E,R,N)
S-Curve MonthStart
MonthSpan
Cash Flow Period
% Paid byOwner
GST Included RemarksTotal Current Costs
(exc GST)Total Current Costs
(inc GST)Total Escalated
Cost
5001 - . - - - - 0 - - - N - - -
5002 - DA application / CC 1 80,000 E - 4 1 Oct-07 - Oct-07 - N 80,000 80,000 80,661
5003 - . - - - - 0 - - - N - - -
5004 - section 94 - - - - 0 - - - N - - -
5005 - stage 1 73 15,000 E - 11 1 May-08 - May-08 - N 1,095,000 1,095,000 1,120,068
5006 - stage 2 58 15,000 E - 19 1 Jan-09 - Jan-09 - N 870,000 870,000 904,688
5007 - stage 3 48 15,000 E - 27 1 Sep-09 - Sep-09 - N 720,000 720,000 761,134
5008 - . - - - - 0 - - - N - - -
5009 - infrastructure levy - - - - 0 - - - N - - -
5010 stage 1 73 25,000 - - 11 1 May-08 - May-08 - N 1,825,000 1,825,000 1,825,000
5011 - stage 2 58 25,000 - - 19 1 Jan-09 - Jan-09 - N 1,450,000 1,450,000 1,450,000
5012 - stage 3 48 25,000 - - 27 1 Sep-09 - Sep-09 - N 1,200,000 1,200,000 1,200,000
5013 - . - - - - 0 - - - N - - -
5015 - . - - - - 0 - - - N - - -
Manual Input (refer to Cash Flow) - - -
TOTAL 7,240,000 7,240,000 7,341,551
6000 Miscellaneous Costs 1
Costs to be entered Inclusive of GST
Code Stage Description%of
Construction¹AND / ORNo. Units
Base Rate / UnitEscalate(E,R,N)
S-Curve MonthStart²
MonthSpan
Cash Flow Period
% Paid byOwner
GST Included RemarksTotal Current Costs
(exc GST)Total Current Costs
(inc GST)Total Escalated
Cost
6001 - Parklands 0.00% 1 500,000 - - 2 12 Aug-07 - Jul-08 - Y 454,545 500,000 500,000
6002 - . 0.00% - - - - 0 - - - Y - - -
6010 - . 0.00% - - - - 0 - - - Y - - -
Manual Input (refer to Cash Flow) - - -¹ Based on net costs. ² Pro-rata with Construction ('C') or Settlements ('S') TOTAL 454,545 500,000 500,000
Estate Master DF Ver 5.3 Page 2 of 5 Pages File: New2.emdf Date of Report: 14/10/2013 12:17 PM
Main Inputs for Greenwood Park Estate Option 1 - Subdivision - Subdivision - 179 Lots
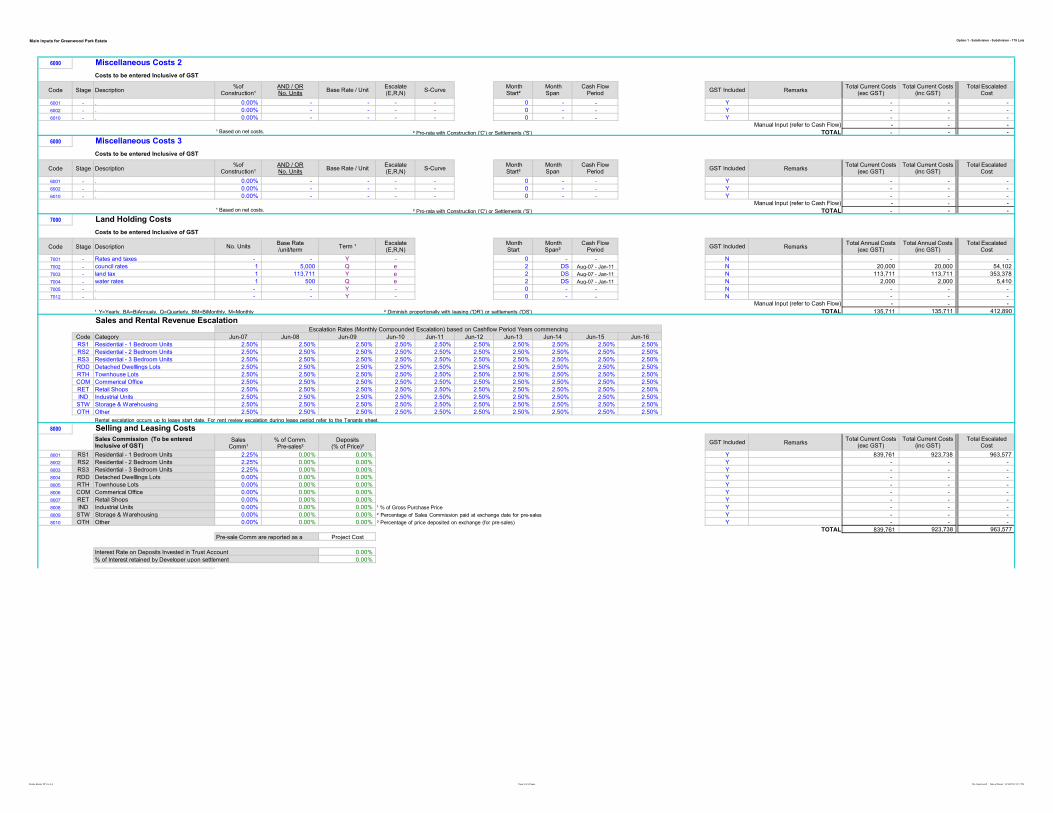
6000 Miscellaneous Costs 2
Costs to be entered Inclusive of GST
Code Stage Description%of
Construction¹AND / ORNo. Units
Base Rate / UnitEscalate(E,R,N)
S-Curve MonthStart²
MonthSpan
Cash Flow Period
% Paid byOwner
GST Included RemarksTotal Current Costs
(exc GST)Total Current Costs
(inc GST)Total Escalated
Cost
6001 - . 0.00% - - - - 0 - - - Y - - -
6002 - . 0.00% - - - - 0 - - - Y - - -
6010 - . 0.00% - - - - 0 - - - Y - - -
Manual Input (refer to Cash Flow) - - -¹ Based on net costs. ² Pro-rata with Construction ('C') or Settlements ('S') TOTAL - - -
6000 Miscellaneous Costs 3
Costs to be entered Inclusive of GST
Code Stage Description%of
Construction¹AND / ORNo. Units
Base Rate / UnitEscalate(E,R,N)
S-Curve MonthStart²
MonthSpan
Cash Flow Period
% Paid byOwner
GST Included RemarksTotal Current Costs
(exc GST)Total Current Costs
(inc GST)Total Escalated
Cost
6001 - . 0.00% - - - - 0 - - - Y - - -
6002 - . 0.00% - - - - 0 - - - Y - - -
6010 - . 0.00% - - - - 0 - - - Y - - -
Manual Input (refer to Cash Flow) - - -¹ Based on net costs. ² Pro-rata with Construction ('C') or Settlements ('S') TOTAL - - -
7000 Land Holding Costs
Costs to be entered Inclusive of GST
Code Stage Description No. UnitsBase Rate/unit/term
Term ¹Escalate(E,R,N)
MonthStart
MonthSpan²
Cash Flow Period
% Paid byOwner
GST Included RemarksTotal Annual Costs
(exc GST)Total Annual Costs
(inc GST)Total Escalated
Cost
7001 - Rates and taxes - - Y - 0 - - - N - - -
7002 - council rates 1 5,000 Q e 2 DS Aug-07 - Jan-11 - N 20,000 20,000 54,102
7003 - land tax 1 113,711 Y e 2 DS Aug-07 - Jan-11 - N 113,711 113,711 353,378
7004 - water rates 1 500 Q e 2 DS Aug-07 - Jan-11 - N 2,000 2,000 5,410
7005 - . - - Y - 0 - - - N - - -
7012 - . - - Y - 0 - - - N - - -
Manual Input (refer to Cash Flow) - - -
¹ Y=Yearly, BA=BiAnnualy, Q=Quarterly, BM=BiMonthly, M=Monthly ² Diminish proportionally with leasing ('DR') or settlements ('DS') TOTAL 135,711 135,711 412,890
Sales and Rental Revenue EscalationEscalation Rates (Monthly Compounded Escalation) based on Cashflow Period Years commencing
Code Category Jun-07 Jun-08 Jun-09 Jun-10 Jun-11 Jun-12 Jun-13 Jun-14 Jun-15 Jun-16
RS1 Residential - 1 Bedroom Units 2.50% 2.50% 2.50% 2.50% 2.50% 2.50% 2.50% 2.50% 2.50% 2.50%
RS2 Residential - 2 Bedroom Units 2.50% 2.50% 2.50% 2.50% 2.50% 2.50% 2.50% 2.50% 2.50% 2.50%
RS3 Residential - 3 Bedroom Units 2.50% 2.50% 2.50% 2.50% 2.50% 2.50% 2.50% 2.50% 2.50% 2.50%
RDD Detached Dwelllings Lots 2.50% 2.50% 2.50% 2.50% 2.50% 2.50% 2.50% 2.50% 2.50% 2.50%
RTH Townhouse Lots 2.50% 2.50% 2.50% 2.50% 2.50% 2.50% 2.50% 2.50% 2.50% 2.50%
COM Commerical Office 2.50% 2.50% 2.50% 2.50% 2.50% 2.50% 2.50% 2.50% 2.50% 2.50%
RET Retail Shops 2.50% 2.50% 2.50% 2.50% 2.50% 2.50% 2.50% 2.50% 2.50% 2.50%
IND Industrial Units 2.50% 2.50% 2.50% 2.50% 2.50% 2.50% 2.50% 2.50% 2.50% 2.50%
STW Storage & Warehousing 2.50% 2.50% 2.50% 2.50% 2.50% 2.50% 2.50% 2.50% 2.50% 2.50%
OTH Other 2.50% 2.50% 2.50% 2.50% 2.50% 2.50% 2.50% 2.50% 2.50% 2.50%
Rental escalation occurs up to lease start date. For rent review escalation during lease period refer to the Tenants sheet. S
8000 Selling and Leasing Costs
#####Sales Commission (To be entered Inclusive of GST)
SalesComm¹
% of Comm.Pre-sales²
Deposits (% of Price)³
% Paid byOwner
GST Included RemarksTotal Current Costs
(exc GST)Total Current Costs
(inc GST)Total Escalated
Cost
8001 RS1 Residential - 1 Bedroom Units 2.25% 0.00% 0.00% - Y 839,761 923,738 963,577
8002 RS2 Residential - 2 Bedroom Units 2.25% 0.00% 0.00% - Y - - -
8003 RS3 Residential - 3 Bedroom Units 2.25% 0.00% 0.00% - Y - - -
8004 RDD Detached Dwelllings Lots 0.00% 0.00% 0.00% - Y - - -
8005 RTH Townhouse Lots 0.00% 0.00% 0.00% - Y - - -
8006 COM Commerical Office 0.00% 0.00% 0.00% - Y - - -
8007 RET Retail Shops 0.00% 0.00% 0.00% - Y - - -
8008 IND Industrial Units 0.00% 0.00% 0.00% ¹ % of Gross Purchase Price - Y - - -
8009 STW Storage & Warehousing 0.00% 0.00% 0.00% ² Percentage of Sales Commission paid at exchange date for pre-sales - Y - - -
8010 OTH Other 0.00% 0.00% 0.00% ³ Percentage of price deposited on exchange (for pre-sales) - Y - - -
TOTAL 839,761 923,738 963,577
Pre-sale Comm are reported as a Project Cost
Interest Rate on Deposits Invested in Trust Account 0.00%
% of Interest retained by Developer upon settlement 0.00%
Estate Master DF Ver 5.3 Page 3 of 5 Pages File: New2.emdf Date of Report: 14/10/2013 12:17 PM

Main Inputs for Greenwood Park Estate Option 1 - Subdivision - Subdivision - 179 Lots
Other Selling Costs % of AND / OR Base Rate / Escalate Month Month Cash Flow % Paid by Total Current Total Current Total
Code Stage To be entered Inclusive of GST Gross Sales No. Units Unit (E,R,N) Start Span Period Owner GST Included Remarks Costs (exc GST) Costs (inc GST) Escalated Cost
8002 - legals on sale 0.50% - - - S 1 Feb-09 - Jan-11 - Y 186,614 205,275 214,128
8003 - marketing 0.00% - - - 0 - - - Y - - -
8004 - stage 1 0.00% 73 3,000 - 5 12 Nov-07 - Oct-08 - Y 199,091 219,000 219,000
8005 - stage 2 0.00% 58 3,000 - 13 12 Jul-08 - Jun-09 - Y 158,182 174,000 174,000
8006 - stage 3 0.00% 48 3,000 - 21 12 Mar-09 - Feb-10 - Y 130,909 144,000 144,000
8007 - . 0.00% - - - 0 - - - Y - - -
8012 - . 0.00% - - - 0 - - - Y - - -
Manual Input (refer to Cash Flow) - - -
Pro-rata with Settlements ('S') or Exchanges ('E') TOTAL 674,795 742,275 751,128
Other Leasing Costs % of AND / OR Base Rate / Escalate Month Month Cash Flow % Paid by Total Current Total Current Total
Code Stage To be entered Inclusive of GST Gross Rent No. Units Unit (E,R,N) Start Span Period Owner GST Included Remarks Costs (exc GST) Costs (inc GST) Escalated Cost
8201 - . 0.00% - - - 0 - - - Y - - -
8202 - . 0.00% - - - 0 - - - Y - - -
8211 - . 0.00% - - - 0 - - - Y - - -
Manual Input (refer to Cash Flow) - - -
Pro-rata with Rental Income ('R') TOTAL - - -
9000 Sales
Sales Revenue to be entered Inclusive of GST
1 2 Current Sales Pre-Sale Exchanges Settlements Sales Rate Land Revenue Total Current Total Current Total Escalated
Code Stage Description No. Units Total Area Sale Calc Month Month Month Month Cash Flow Units / SqM % Split to GST Use Collection Sales Revenue Sales Revenue Sales Revenue
SqM Price Method Start Span Start Span Period per Month Owner Included Code Profile (exc GST) (inc GST)
9001 - stage 1 - - - Per Unit 0 - 0 - - - - Y - - - - -
9002 - block 1 apartments 43 10,750 110,000 Per Unit 2 12 20 8 Feb-09 - Sep-09 3.58 - Y rs1 - 4,300,000 4,730,000 4,803,685
9003 - block 2 apartments 30 7,500 110,000 Per Unit 2 12 20 8 Feb-09 - Sep-09 2.50 - Y rs1 - 3,000,000 3,300,000 3,351,408
9004 - . - - - Per Unit 0 - 0 - - - - Y - - - - -
9005 - stage 2 - - - Per Unit 0 - 0 - - - - Y - - - - -
9006 - block 3 townhouses 14 7,000 220,000 Per Unit 14 12 28 8 Oct-09 - May-10 1.17 - Y rs1 - 2,800,000 3,080,000 3,206,180
9007 - block 4 townhouses 7 3,500 220,000 Per Unit 14 12 28 8 Oct-09 - May-10 0.58 - Y rs1 - 1,400,000 1,540,000 1,603,090
9008 - block 5 13 6,500 310,000 Per Unit 14 12 28 8 Oct-09 - May-10 1.08 - Y rs1 - 3,663,636 4,030,000 4,195,100
9009 - block 6 15 7,500 310,000 Per Unit 14 12 28 8 Oct-09 - May-10 1.25 - Y rs1 - 4,227,273 4,650,000 4,840,500
9010 - block 7 9 4,500 310,000 Per Unit 14 12 28 8 Oct-09 - May-10 0.75 - Y rs1 - 2,536,364 2,790,000 2,904,300
9011 - . - - - Per Unit 0 - 0 - - - - Y - - - - -
9012 - stage 3 - - - Per Unit 0 - 0 - - - - Y - - - - -
9013 - block 8 houses 27 27,000 330,000 Per Unit 22 12 36 8 Jun-10 - Jan-11 2.25 - Y rs1 - 8,100,000 8,910,000 9,428,969
9014 - block 9 6 6,000 350,000 Per Unit 22 12 36 8 Jun-10 - Jan-11 0.50 - Y rs1 - 1,909,091 2,100,000 2,222,316
9015 - block 10 15 15,000 395,000 Per Unit 22 12 36 8 Jun-10 - Jan-11 1.25 - Y rs1 - 5,386,364 5,925,000 6,270,105
9016 - . - - - Per Unit 0 - 0 - - - - Y - - - - -
9020 - . - - - Per Unit 0 - 0 - - - - Y - - - - -
Capitalised Sales (refer to Tenants) - - -
Manual Input (refer to Cash Flow) - - -
TOTAL 37,322,727 41,055,000 42,825,652
9100 Other Income
Other Income to be entered Inclusive of GST
Code Stage Description Land Use Code UnitsBase
Rate / Units MonthStart
MonthSpan
Cash Flow Period
% Split toOwner
GST Included RemarksTotal Current
Income (exc GST)Total Current
Income (inc GST)Total Escalated
Income
9101 - . - - - 0 - - - Y - - -
9102 - . - - - 0 - - - Y - - -
9110 - . - - - 0 - - - Y - - -
Manual Input (refer to Cash Flow) - - -
TOTAL - - -
10000 FinancingGeneral Notes: All Line Fees are paid during period of debt, in arrears
(Simple Mode) All Profit Share is Paid progressively as project makes a profit.
Equity Equity Notes: Equity is paying outstanding debt Opening Balances Equity
Developer's Equity Contribution Fixed Amount Percentage Equity is repaid at project end. Totals
Injected in total upfront. 2,000,000 0.00% Fixed Amount Developer's Injections 2,000,000
10001 Interest Charged on Equity 0.00% per annum Nominal - Accrued not Capitalised (Simple) - Interest Charged -
10002 Interest received on Surplus Cash 0.00% per annum received in arrears. - Interest Received -
% of Available Funds to Repay Equity Before Debt 0.00%
Land Owner's Equity Contribution - -
Estate Master DF Ver 5.3 Page 4 of 5 Pages File: New2.emdf Date of Report: 14/10/2013 12:17 PM
Main Inputs for Greenwood Park Estate Option 1 - Subdivision - Subdivision - 179 Lots
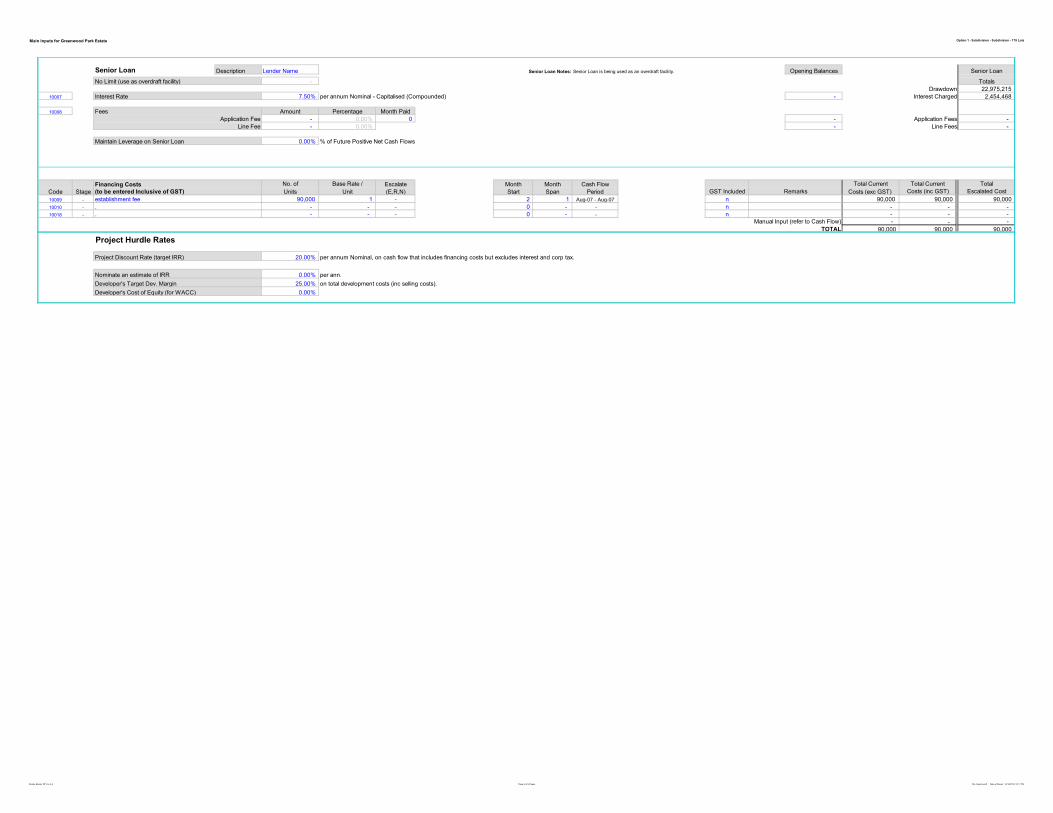
Senior Loan Description Lender Name Senior Loan Notes: Senior Loan is being used as an overdraft facility. Opening Balances Senior Loan
No Limit (use as overdraft facility) - Totals
Drawdown 22,975,215
10007 Interest Rate 7.50% per annum Nominal - Capitalised (Compounded) - Interest Charged 2,454,468
10008 Fees Amount Percentage Month Paid
Application Fee - 0.00% 0 - Application Fees -
Line Fee - 0.00% - Line Fees -
Maintain Leverage on Senior Loan 0.00% % of Future Positive Net Cash Flows
0.00% -
Financing Costs No. of Base Rate / Escalate Month Month Cash Flow % Paid by Total Current Total Current Total
Code Stage (to be entered Inclusive of GST) Units Unit (E,R,N) Start Span Period Owner GST Included Remarks Costs (exc GST) Costs (inc GST) Escalated Cost
10009 - establishment fee 90,000 1 - 2 1 Aug-07 - Aug-07 - n 90,000 90,000 90,000
10010 - . - - - 0 - - - n - - -
10018 - . - - - 0 - - - n - - -
Manual Input (refer to Cash Flow) - - -
TOTAL 90,000 90,000 90,000
Project Hurdle Rates
Project Discount Rate (target IRR) 20.00% per annum Nominal, on cash flow that includes financing costs but excludes interest and corp tax.
0.00%
Nominate an estimate of IRR 0.00% per ann.
Developer's Target Dev. Margin 25.00% on total development costs (inc selling costs).
Developer's Cost of Equity (for WACC) 0.00%
Estate Master DF Ver 5.3 Page 5 of 5 Pages File: New2.emdf Date of Report: 14/10/2013 12:17 PM

Tenants Tenancy Schedule input sheet for rental income, outgoings, leasing costs and
incentives, rent reviews, capitalisation rates, etc.

Tenancy Schedule for Commercial Feasbility 110 Boulevard Heights - Commercial Feasibility
12000
Land Total Current Outgoings and Vacancies Pre- Lease Lease Escalated Rent Letting Fee Incentives Residual Pre-Sale Leasing Up Period Total Net Escalated
Code Stage Description Use Area Rent Amount % of Total Commit Month Month at Lease Start % of % paid at Total Rent Free Fit out Month Cap. Exchange Months Discount Rental Income End-Sale
Code SqM /SqM/annum /SqM/annum Rent Per Annum Month Start Span /SqM/annum Gross Rent PreCommit Amount Months Cost Start Rate Month Vacant Rate less Incentives Value
12001 - Mayfair department Store (Anchor) MAL 9,200 250 10 0.00% 92,000 - 34 60 May-14 - Apr-19 276 10.00% 0.00% 253,547 - 50,000 24 9.00% - - 6 10.00% 0.00% - 2,208,000 24,533,333 12,363,363 27,941,328
12002 - Home Decor MAL 5,160 350 - 0.81% 14,561 - 34 60 May-14 - Apr-19 386 10.00% 0.00% 199,090 - - - 8.50% - - - 0.00% 0.00% - 1,791,439 21,075,754 10,078,084 25,148,658
12003 - Pret Coffee MAL 2,205 630 - 0.34% 4,786 - 34 60 May-14 - Apr-19 694 10.00% 0.00% 153,137 - - - 8.50% - - - 0.00% 0.00% - 1,384,364 16,286,635 7,788,717 19,434,037
12004 - Diamond Boutique MAL 2,205 725 - 0.34% 5,508 - 34 60 May-14 - Apr-19 799 10.00% 0.00% 176,229 - - - 8.50% - - - 0.00% 0.00% - 1,593,117 18,742,556 8,963,206 22,364,567
12005 - Il taglio Pizzeria MAL 2,205 670 - 0.34% 5,090 - 34 60 May-14 - Apr-19 739 10.00% 0.00% 162,860 - - - 8.50% - - - 0.00% 0.00% - 1,472,260 17,320,707 8,283,239 20,667,944
12006 - Posh Frocks MAL 2,205 750 - 0.34% 5,698 - 34 60 May-14 - Apr-19 827 10.00% 0.00% 182,306 - - - 8.50% - - - 0.00% 0.00% - 1,648,052 19,388,851 9,272,282 23,135,759
12007 - Sara Fashion MAL 2,205 620 - 0.34% 4,710 - 34 60 May-14 - Apr-19 683 10.00% 0.00% 150,706 - - - 8.50% - - - 0.00% 0.00% - 1,362,390 16,028,117 7,665,087 19,125,561
12008 - Geant Express MAL 2,205 595 - 0.34% 4,520 - 34 60 May-14 - Apr-19 656 10.00% 0.00% 144,629 - - - 8.50% - - - 0.00% 0.00% - 1,307,455 15,381,822 7,356,011 18,354,369
12009 - Geant Express MAL 2,205 595 - 0.34% 4,520 - 34 60 May-14 - Apr-19 656 10.00% 0.00% 144,629 - - - 8.50% - - - 0.00% 0.00% - 1,307,455 15,381,822 7,356,011 18,354,369
12010 - TLC Dry Cleaning MAL 2,205 760 - 0.34% 5,774 - 34 60 May-14 - Apr-19 838 10.00% 0.00% 184,737 - - - 8.50% - - - 0.00% 0.00% - 1,670,026 19,647,369 9,395,913 23,444,235
TOTAL 32,000.00 50,000.00 15,744,559 183,786,964 88,521,913 217,970,826
0%
² End sale value = annual income (net of outgoings) divided by the capitalisation rate Estate Master Licensed to: Estate Master Administration
Rental Income & Capitalised Sales
Cash Flow PeriodSettlement Month
Purchaser's Costs
Current Net Annual Rent
Current End Sale Value²
Estate Master DF Ver 5.3 Page 1 of 1 Pages File: DF_CS015 - Develop and Hold of Shopping Mall Project in UAE.emdf Date of Report: 14/10/2013 12:37 PM
Cash Flow Contains the detailed development cash flow outputs for the developer and land
owner (joint venture).

Cash Flow Table for Greenwood Park Estate Option 1 - Subdivision - Subdivision - 179 Lots
PROJECT CASH FLOW TOTAL GST0 1 2 3 4 5 6 7 8 9 10 11 12 13 14 15 16 17 18 19 20 21
Jun-07 Jul-07 Aug-07 Sep-07 Oct-07 Nov-07 Dec-07 Jan-08 Feb-08 Mar-08 Apr-08 May-08 Jun-08 Jul-08 Aug-08 Sep-08 Oct-08 Nov-08 Dec-08 Jan-09 Feb-09 Mar-09
SALES SUMMARY
Units Sold 179.00
Cumulative Units Sold
% Units Sold
SqM Sold 95,250.00
Cumulative SqM Sold
% SqM Sold
AUD Sold 42,825,652
Cumulative AUD Sold
% AUD Sold
HANDOVER SUMMARY
Units Handed Over 179.00
Cumulative Units Handed Over
% Units Handed Over
SqM Handed Over 95,250.00
Cumulative SqM Handed Over
% SqM Handed Over
AUD Handed Over 42,825,652
Cumulative AUD Handed Over
% AUD Handed Over
PROJECT CASH FLOW
REVENUE
Gross Sales Revenue 42,825,652
Selling Costs (1,714,705)
Gross Rental Income -
Leasing Costs -
Other Income -
Interest Received* -
GST Payments (Liabilities) (3,893,241)
TOTAL NET REVENUE 37,217,706
COSTS
Land and Acquisition 13,980,490
Professional Fees 1,116,391
Construction Costs 7,571,642
Statutory Fees 7,341,551
Miscellaneous Costs 1 500,000
Miscellaneous Costs 2 -
Miscellaneous Costs 3 -
Project Contingency (Reserve) -
Land Holding Costs 412,890
Pre-Sale Commissions -
Financing Costs (exc Fees) 90,000
GST Refunds (Input Credits) (1,002,976)
TOTAL COSTS 30,009,988
Net Cash Flow (before Interest & Corporate Tax) 7,207,718
Cumulative Cash Flow
Corporate Tax -
Net Cash Flow (before Interest & after Corporate Tax) 7,207,718
Cumulative Cash Flow
FINANCING
Equity
Manual Adjustments (Inject + / Repay -)
Injections 2,000,000
Interest Charged -
Equity Repayment 6,753,250
Less Profit Share -
Equity Balance 4,753,250
Equity Cash Flow 4,753,250
Project Cash Account
Surplus Cash Injection 6,772,733
Cash Reserve Drawdown (6,772,733)
Interest on Surplus Cash -
Surplus Cash Balance
Senior Loan - Lender Name
Drawdown (22,975,215)
Loan Interest Rate (%/ann)
Interest Charged (2,454,468)
Application and Line Fees - -
Interest Paid by Equity -
Loan Repayment 25,429,683
Interest and Fees 2,454,468
Principal 22,975,215
Loan Balance - 3
% of Land Purchase Price.
Senior Loan Cash Flow 2,454,468
Interest Coverage Ratio 12.75
Debt Service Ratio 1.21
Project Overdraft
% of Land Purchase Price.
Total Equity to Debt Ratio 8.71%
Total Debt Interest Coverage Ratio 12.75
Total Debt Service Ratio 1.21
Net Cash Flow (after Interest & Corporate Tax) 4,753,250
Cumulative Cash Flow**
Check Balance -
PROJECT IRR & NPV
Cash Flow that includes financing costs but excludes interest and corp tax.
Static Discount Rate (per ann. nominal) 20.00%
PV for each Month (1,358,831)
NPV of Future Cash Flows
Variable Discount Rate (per ann. nominal) 20.00% 1.67%
NPV (using weighted avg discount rate) (1,358,831) #######
* Includes half interest from deposit on land acquisition plus Interest received from pre-sale deposits
** Cumulative Cash Flow After Interest is revenue less costs (including interest on overdraft)
Estate Master Licensed to: Estate Master Administration
- - 6.08 6.08 6.08 6.08 6.08 6.08 6.08 6.08 6.08 6.08 6.08 6.08 4.83 4.83 4.83 4.83 4.83 4.83 4.83 4.83
- - 6.08 12.17 18.25 24.33 30.42 36.50 42.58 48.67 54.75 60.83 66.92 73.00 77.83 82.67 87.50 92.33 97.17 102.00 106.83 111.67
- - 3.4% 6.8% 10.2% 13.6% 17.0% 20.4% 23.8% 27.2% 30.6% 34.0% 37.4% 40.8% 43.5% 46.2% 48.9% 51.6% 54.3% 57.0% 59.7% 62.4%
- - 1,520.83 1,520.83 1,520.83 1,520.83 1,520.83 1,520.83 1,520.83 1,520.83 1,520.83 1,520.83 1,520.83 1,520.83 2,416.67 2,416.67 2,416.67 2,416.67 2,416.67 2,416.67 2,416.67 2,416.67
- - 1,520.83 3,041.67 4,562.50 6,083.33 7,604.17 9,125.00 10,645.83 12,166.67 13,687.50 15,208.33 16,729.17 18,250.00 20,666.67 23,083.33 25,500.00 27,916.67 30,333.33 32,750.00 35,166.67 37,583.33
- - 1.6% 3.2% 4.8% 6.4% 8.0% 9.6% 11.2% 12.8% 14.4% 16.0% 17.6% 19.2% 21.7% 24.2% 26.8% 29.3% 31.8% 34.4% 36.9% 39.5%
- - 671,926 673,310 674,697 676,087 677,480 678,875 680,273 681,675 683,079 684,486 685,896 687,309 1,380,022 1,382,865 1,385,713 1,388,567 1,391,428 1,394,294 1,397,166 1,400,044
- - 671,926 1,345,237 2,019,934 2,696,021 3,373,500 4,052,375 4,732,649 5,414,324 6,097,403 6,781,888 7,467,784 8,155,093 9,535,115 10,917,979 12,303,692 13,692,260 15,083,687 16,477,981 17,875,147 19,275,190
- - 1.6% 3.1% 4.7% 6.3% 7.9% 9.5% 11.1% 12.6% 14.2% 15.8% 17.4% 19.0% 22.3% 25.5% 28.7% 32.0% 35.2% 38.5% 41.7% 45.0%
- - - - - - - - - - - - - - - - - - - - 9.13 9.13
- - - - - - - - - - - - - - - - - - - - 9.13 18.25
- - - - - - - - - - - - - - - - - - - - 5.1% 10.2%
- - - - - - - - - - - - - - - - - - - - 2,281.25 2,281.25
- - - - - - - - - - - - - - - - - - - - 2,281.25 4,562.50
- - - - - - - - - - - - - - - - - - - - 2.4% 4.8%
- - - - - - - - - - - - - - - - - - - - 1,019,387 1,019,387
- - - - - - - - - - - - - - - - - - - - 1,019,387 2,038,773
- - - - - - - - - - - - - - - - - - - - 2.4% 4.8%
- - - - - - - - - - - - - - - - - - - - 1,019,387 1,019,387
- - - - - (18,250) (18,250) (18,250) (18,250) (18,250) (18,250) (18,250) (18,250) (32,750) (32,750) (32,750) (32,750) (14,500) (14,500) (14,500) (42,533) (54,533)
- - - - - - - - - - - - - - - - - - - - - -
- - - - - - - - - - - - - - - - - - - - - -
- - - - - - - - - - - - - - - - - - - - - -
- - - - - - - - - - - - - - - - - - - - - -
- - - - - - - - - - - - - - - - - - - - (92,672) (92,672)
- - - - - (18,250) (18,250) (18,250) (18,250) (18,250) (18,250) (18,250) (18,250) (32,750) (32,750) (32,750) (32,750) (14,500) (14,500) (14,500) 884,182 872,182
2,163,490 - - - - - - - - - - 5,252,000 - - - - - - - 3,939,000 - -
- 42,460 45,530 43,252 44,787 43,358 43,252 43,252 43,358 43,252 43,252 99,402 62,220 19,773 21,271 19,006 19,019 19,137 19,045 63,867 19,050 18,960
- - - - - - - - - - - - 327,359 328,034 328,709 329,386 330,065 330,745 331,426 332,109 326,280 326,952
- - - - 80,661 - - - - - - 2,945,068 - - - - - - - 2,354,688 - -
- - 41,667 41,667 41,667 41,667 41,667 41,667 41,667 41,667 41,667 41,667 41,667 41,667 - - - - - - - -
- - - - - - - - - - - - - - - - - - - - - -
- - - - - - - - - - - - - - - - - - - - - -
- - - - - - - - - - - - - - - - - - - - - -
- - 119,703 - - 5,523 - - 5,523 - - 5,523 - - 119,703 - - 5,523 - - 5,391 -
- - - - - - - - - - - - - - - - - - - - - -
- - 90,000 - - - - - - - - - - - - - - - - - - -
(1,182) (3,860) (7,927) (7,720) (7,859) (9,389) (9,379) (9,379) (9,389) (9,379) (9,379) (19,211) (40,863) (38,384) (34,794) (34,649) (34,712) (33,126) (33,179) (40,861) (35,260) (36,404)
2,162,308 38,600 288,973 77,199 159,256 81,158 75,540 75,540 81,158 75,540 75,540 8,324,448 390,383 351,090 434,889 313,743 314,372 322,279 317,292 6,648,802 315,461 309,508
(2,162,308) (38,600) (288,973) (77,199) (159,256) (99,408) (93,790) (93,790) (99,408) (93,790) (93,790) (8,342,698) (408,633) (383,840) (467,639) (346,493) (347,122) (336,779) (331,792) (6,663,302) 568,721 562,674
(2,162,308) (2,200,908) (2,489,880) (2,567,080) (2,726,336) (2,825,744) (2,919,534) (3,013,324) (3,112,733) (3,206,523) (3,300,313) (11,643,011) (12,051,644) (12,435,483) (12,903,123) (13,249,616) (13,596,738) (13,933,516) (14,265,308) (20,928,610) (20,359,889) (19,797,215)
- - - - - - - - - - - - - - - - - - - - - -
(2,162,308) (38,600) (288,973) (77,199) (159,256) (99,408) (93,790) (93,790) (99,408) (93,790) (93,790) (8,342,698) (408,633) (383,840) (467,639) (346,493) (347,122) (336,779) (331,792) (6,663,302) 568,721 562,674
(2,162,308) (2,200,908) (2,489,880) (2,567,080) (2,726,336) (2,825,744) (2,919,534) (3,013,324) (3,112,733) (3,206,523) (3,300,313) (11,643,011) (12,051,644) (12,435,483) (12,903,123) (13,249,616) (13,596,738) (13,933,516) (14,265,308) (20,928,610) (20,359,889) (19,797,215)
0 0 0 0 0 0 0 0 0 0 0 0 0 0 0 0 0 0 0 0 0 0
2,000,000 - - - - - - - - - - - - - - - - - - - - -
- - - - - - - - - - - - - - - - - - - - - -
- - - - - - - - - - - - - - - - - - - - - -
- - - - - - - - - - - - - - - - - - - - - -
(2,000,000) (2,000,000) (2,000,000) (2,000,000) (2,000,000) (2,000,000) (2,000,000) (2,000,000) (2,000,000) (2,000,000) (2,000,000) (2,000,000) (2,000,000) (2,000,000) (2,000,000) (2,000,000) (2,000,000) (2,000,000) (2,000,000) (2,000,000) (2,000,000) (2,000,000)
(2,000,000) - - - - - - - - - - - - - - - - - - - - -
2,000,000 - - - - - - - - - - - - - - - - - - - - -
(2,000,000) - - - - - - - - - - - - - - - - - - - - -
- - - - - - - - - - - - - - - - - - - - - -
- - - - - - - - - - - - - - - - - - - - - -
(162,308) (38,600) (288,973) (77,199) (159,256) (99,408) (93,790) (93,790) (99,408) (93,790) (93,790) (8,342,698) (408,633) (383,840) (467,639) (346,493) (347,122) (336,779) (331,792) (6,663,302) - -
7.50% 7.50% 7.50% 7.50% 7.50% 7.50% 7.50% 7.50% 7.50% 7.50% 7.50% 7.50% 7.50% 7.50% 7.50% 7.50% 7.50% 7.50% 7.50% 7.50% 7.50% 7.50%
- (1,014) (1,262) (3,076) (3,578) (4,595) (5,245) (5,864) (6,487) (7,149) (7,780) (8,415) (60,609) (63,542) (66,338) (69,675) (72,277) (74,898) (77,471) (80,029) (122,174) (119,384)
- - - - - - - - - - - - - - - - - - - - - -
- - - - - - - - - - - - - - - - - - - - - -
- - - - - - - - - - - - - - - - - - - - 568,721 562,674
- - - - - - - - - - - - - - - - - - - - 568,721 292,142
- - - - - - - - - - - - - - - - - - - - - 270,532
(162,308) (201,922) (492,157) (572,432) (735,266) (839,269) (938,305) (1,037,960) (1,143,855) (1,244,794) (1,346,364) (9,697,477) (10,166,719) (10,614,101) (11,148,078) (11,564,247) (11,983,645) (12,395,322) (12,804,585) (19,547,915) (19,101,369) (18,658,078)
1.25% 1.55% 3.77% 4.36% 5.59% 6.35% 7.07% 7.79% 8.56% 9.28% 10.00% 74.18% 77.32% 80.27% 83.87% 86.54% 89.21% 91.80% 94.35% 145.60% 145.60% 145.60%
(162,308) (38,600) (288,973) (77,199) (159,256) (99,408) (93,790) (93,790) (99,408) (93,790) (93,790) (8,342,698) (408,633) (383,840) (467,639) (346,493) (347,122) (336,779) (331,792) (6,663,302) 568,721 562,674
- - - - - (3.97) (3.48) (3.11) (2.81) (2.55) (2.35) (2.17) (0.30) (0.52) (0.49) (0.47) (0.45) (0.19) (0.19) (0.18) 7.24 7.31
- - - - - - - - - - - - - - - - - - - - 1.55 1.55
(162,308) (201,922) (492,157) (572,432) (735,266) (839,269) (938,305) (1,037,960) (1,143,855) (1,244,794) (1,346,364) (9,697,477) (10,166,719) (10,614,101) (11,148,078) (11,564,247) (11,983,645) (12,395,322) (12,804,585) (19,547,915) (19,101,369) (18,658,078)
1.25% 1.55% 3.77% 4.36% 5.59% 6.35% 7.07% 7.79% 8.56% 9.28% 10.00% 74.18% 77.32% 80.27% 83.87% 86.54% 89.21% 91.80% 94.35% 145.60% 145.60% 145.60%
1232.23% 995.48% 408.26% 352.68% 275.35% 242.21% 217.50% 197.37% 179.74% 165.77% 153.81% 20.74% 19.90% 19.17% 18.34% 17.78% 17.25% 16.76% 16.31% 10.57% 10.57% 10.57%
- - - - - (3.97) (3.48) (3.11) (2.81) (2.55) (2.35) (2.17) (0.30) (0.52) (0.49) (0.47) (0.45) (0.19) (0.19) (0.18) 7.24 7.31
- - - - - - - - - - - - - - - - - - - - 1.55 1.55
(2,162,308) (39,614) (290,235) (80,275) (162,834) (104,004) (99,036) (99,655) (105,896) (100,939) (101,570) (8,351,113) (469,242) (447,382) (533,978) (416,169) (419,398) (411,677) (409,263) (6,743,331) 446,547 443,290
(2,162,308) (2,201,922) (2,492,157) (2,572,432) (2,735,266) (2,839,269) (2,938,305) (3,037,960) (3,143,855) (3,244,794) (3,346,364) (11,697,477) (12,166,719) (12,614,101) (13,148,078) (13,564,247) (13,983,645) (14,395,322) (14,804,585) (21,547,915) (21,101,369) (20,658,078)
- - - - - - - - - - - - - - - - - - - - - -
(2,162,308) (38,600) (288,973) (77,199) (159,256) (99,408) (93,790) (93,790) (99,408) (93,790) (93,790) (8,342,698) (408,633) (383,840) (467,639) (346,493) (347,122) (336,779) (331,792) (6,663,302) 568,721 562,674
(2,162,308) (37,967) (279,576) (73,464) (149,067) (91,523) (84,935) (83,542) (87,095) (80,826) (79,501) (6,955,720) (335,112) (309,619) (371,032) (270,406) (266,455) (254,278) (246,406) (4,867,393) 408,628 397,655
(1,358,831) 816,869 869,726 1,178,011 1,276,130 1,459,309 1,584,696 1,706,461 1,830,255 1,961,825 2,089,875 2,220,059 10,738,804 11,333,227 11,912,351 12,586,323 13,148,364 13,720,410 14,291,475 14,866,988 21,889,129 21,675,748
20.00% 20.00% 20.00% 20.00% 20.00% 20.00% 20.00% 20.00% 20.00% 20.00% 20.00% 20.00% 20.00% 20.00% 20.00% 20.00% 20.00% 20.00% 20.00% 20.00% 20.00% 20.00%
Estate Master DF Ver 5.3 Page 1 of 2 Pages File: New2.emdf Date of Report: 14/10/2013 12:18 PM

Cash Flow Table for Greenwood Park Estate Option 1 - Subdivision - Subdivision - 179 Lots
PROJECT CASH FLOW TOTAL GST22 23 24 25 26 27 28 29 30 31 32 33 34 35 36 37 38 39 40 41 42 43
Apr-09 May-09 Jun-09 Jul-09 Aug-09 Sep-09 Oct-09 Nov-09 Dec-09 Jan-10 Feb-10 Mar-10 Apr-10 May-10 Jun-10 Jul-10 Aug-10 Sep-10 Oct-10 Nov-10 Dec-10 Jan-11
SALES SUMMARY
Units Sold 179.00
Cumulative Units Sold
% Units Sold
SqM Sold 95,250.00
Cumulative SqM Sold
% SqM Sold
AUD Sold 42,825,652
Cumulative AUD Sold
% AUD Sold
HANDOVER SUMMARY
Units Handed Over 179.00
Cumulative Units Handed Over
% Units Handed Over
SqM Handed Over 95,250.00
Cumulative SqM Handed Over
% SqM Handed Over
AUD Handed Over 42,825,652
Cumulative AUD Handed Over
% AUD Handed Over
PROJECT CASH FLOW
REVENUE
Gross Sales Revenue 42,825,652
Selling Costs (1,714,705)
Gross Rental Income -
Leasing Costs -
Other Income -
Interest Received* -
GST Payments (Liabilities) (3,893,241)
TOTAL NET REVENUE 37,217,706
COSTS
Land and Acquisition 13,980,490
Professional Fees 1,116,391
Construction Costs 7,571,642
Statutory Fees 7,341,551
Miscellaneous Costs 1 500,000
Miscellaneous Costs 2 -
Miscellaneous Costs 3 -
Project Contingency (Reserve) -
Land Holding Costs 412,890
Pre-Sale Commissions -
Financing Costs (exc Fees) 90,000
GST Refunds (Input Credits) (1,002,976)
TOTAL COSTS 30,009,988
Net Cash Flow (before Interest & Corporate Tax) 7,207,718
Cumulative Cash Flow
Corporate Tax -
Net Cash Flow (before Interest & after Corporate Tax) 7,207,718
Cumulative Cash Flow
FINANCING
Equity
Manual Adjustments (Inject + / Repay -)
Injections 2,000,000
Interest Charged -
Equity Repayment 6,753,250
Less Profit Share -
Equity Balance 4,753,250
Equity Cash Flow 4,753,250
Project Cash Account
Surplus Cash Injection 6,772,733
Cash Reserve Drawdown (6,772,733)
Interest on Surplus Cash -
Surplus Cash Balance
Senior Loan - Lender Name
Drawdown (22,975,215)
Loan Interest Rate (%/ann)
Interest Charged (2,454,468)
Application and Line Fees - -
Interest Paid by Equity -
Loan Repayment 25,429,683
Interest and Fees 2,454,468
Principal 22,975,215
Loan Balance - 3
% of Land Purchase Price.
Senior Loan Cash Flow 2,454,468
Interest Coverage Ratio 12.75
Debt Service Ratio 1.21
Project Overdraft
% of Land Purchase Price.
Total Equity to Debt Ratio 8.71%
Total Debt Interest Coverage Ratio 12.75
Total Debt Service Ratio 1.21
Net Cash Flow (after Interest & Corporate Tax) 4,753,250
Cumulative Cash Flow**
Check Balance -
PROJECT IRR & NPV
Cash Flow that includes financing costs but excludes interest and corp tax.
Static Discount Rate (per ann. nominal) 20.00%
PV for each Month (1,358,831)
NPV of Future Cash Flows
Variable Discount Rate (per ann. nominal) 20.00% 1.67%
NPV (using weighted avg discount rate) (1,358,831) #######
* Includes half interest from deposit on land acquisition plus Interest received from pre-sale deposits
** Cumulative Cash Flow After Interest is revenue less costs (including interest on overdraft)
Estate Master Licensed to: Estate Master Administration
8.83 8.83 8.83 8.83 4.00 4.00 4.00 4.00 4.00 4.00 4.00 4.00 - - - - - - - - - -
120.50 129.33 138.17 147.00 151.00 155.00 159.00 163.00 167.00 171.00 175.00 179.00 179.00 179.00 179.00 179.00 179.00 179.00 179.00 179.00 179.00 179.00
67.3% 72.3% 77.2% 82.1% 84.4% 86.6% 88.8% 91.1% 93.3% 95.5% 97.8% 100.0% 100.0% 100.0% 100.0% 100.0% 100.0% 100.0% 100.0% 100.0% 100.0% 100.0%
6,416.67 6,416.67 6,416.67 6,416.67 4,000.00 4,000.00 4,000.00 4,000.00 4,000.00 4,000.00 4,000.00 4,000.00 - - - - - - - - - -
44,000.00 50,416.67 56,833.33 63,250.00 67,250.00 71,250.00 75,250.00 79,250.00 83,250.00 87,250.00 91,250.00 95,250.00 95,250.00 95,250.00 95,250.00 95,250.00 95,250.00 95,250.00 95,250.00 95,250.00 95,250.00 95,250.00
46.2% 52.9% 59.7% 66.4% 70.6% 74.8% 79.0% 83.2% 87.4% 91.6% 95.8% 100.0% 100.0% 100.0% 100.0% 100.0% 100.0% 100.0% 100.0% 100.0% 100.0% 100.0%
2,879,533 2,885,464 2,891,408 2,897,363 1,488,809 1,491,876 1,494,949 1,498,028 1,501,114 1,504,206 1,507,304 1,510,409 - - - - - - - - - -
22,154,723 25,040,187 27,931,594 30,828,958 32,317,767 33,809,642 35,304,591 36,802,619 38,303,733 39,807,939 41,315,243 42,825,652 42,825,652 42,825,652 42,825,652 42,825,652 42,825,652 42,825,652 42,825,652 42,825,652 42,825,652 42,825,652
51.7% 58.5% 65.2% 72.0% 75.5% 78.9% 82.4% 85.9% 89.4% 93.0% 96.5% 100.0% 100.0% 100.0% 100.0% 100.0% 100.0% 100.0% 100.0% 100.0% 100.0% 100.0%
9.13 9.13 9.13 9.13 9.13 9.13 7.25 7.25 7.25 7.25 7.25 7.25 7.25 7.25 6.00 6.00 6.00 6.00 6.00 6.00 6.00 6.00
27.38 36.50 45.63 54.75 63.88 73.00 80.25 87.50 94.75 102.00 109.25 116.50 123.75 131.00 137.00 143.00 149.00 155.00 161.00 167.00 173.00 179.00
15.3% 20.4% 25.5% 30.6% 35.7% 40.8% 44.8% 48.9% 52.9% 57.0% 61.0% 65.1% 69.1% 73.2% 76.5% 79.9% 83.2% 86.6% 89.9% 93.3% 96.6% 100.0%
2,281.25 2,281.25 2,281.25 2,281.25 2,281.25 2,281.25 3,625.00 3,625.00 3,625.00 3,625.00 3,625.00 3,625.00 3,625.00 3,625.00 6,000.00 6,000.00 6,000.00 6,000.00 6,000.00 6,000.00 6,000.00 6,000.00
6,843.75 9,125.00 11,406.25 13,687.50 15,968.75 18,250.00 21,875.00 25,500.00 29,125.00 32,750.00 36,375.00 40,000.00 43,625.00 47,250.00 53,250.00 59,250.00 65,250.00 71,250.00 77,250.00 83,250.00 89,250.00 95,250.00
7.2% 9.6% 12.0% 14.4% 16.8% 19.2% 23.0% 26.8% 30.6% 34.4% 38.2% 42.0% 45.8% 49.6% 55.9% 62.2% 68.5% 74.8% 81.1% 87.4% 93.7% 100.0%
1,019,387 1,019,387 1,019,387 1,019,387 1,019,387 1,019,387 2,093,646 2,093,646 2,093,646 2,093,646 2,093,646 2,093,646 2,093,646 2,093,646 2,240,174 2,240,174 2,240,174 2,240,174 2,240,174 2,240,174 2,240,174 2,240,174
3,058,160 4,077,546 5,096,933 6,116,320 7,135,706 8,155,093 10,248,739 12,342,385 14,436,032 16,529,678 18,623,324 20,716,970 22,810,616 24,904,263 27,144,436 29,384,610 31,624,784 33,864,957 36,105,131 38,345,305 40,585,479 42,825,652
7.1% 9.5% 11.9% 14.3% 16.7% 19.0% 23.9% 28.8% 33.7% 38.6% 43.5% 48.4% 53.3% 58.2% 63.4% 68.6% 73.8% 79.1% 84.3% 89.5% 94.8% 100.0%
1,019,387 1,019,387 1,019,387 1,019,387 1,019,387 1,019,387 2,093,646 2,093,646 2,093,646 2,093,646 2,093,646 2,093,646 2,093,646 2,093,646 2,240,174 2,240,174 2,240,174 2,240,174 2,240,174 2,240,174 2,240,174 2,240,174
(54,533) (54,533) (54,533) (40,033) (40,033) (40,033) (69,575) (69,575) (69,575) (69,575) (69,575) (57,575) (57,575) (57,575) (61,605) (61,605) (61,605) (61,605) (61,605) (61,605) (61,605) (61,605)
- - - - - - - - - - - - - - - - - - - - - -
- - - - - - - - - - - - - - - - - - - - - -
- - - - - - - - - - - - - - - - - - - - - -
- - - - - - - - - - - - - - - - - - - - - -
(92,672) (92,672) (92,672) (92,672) (92,672) (92,672) (190,331) (190,331) (190,331) (190,331) (190,331) (190,331) (190,331) (190,331) (203,652) (203,652) (203,652) (203,652) (203,652) (203,652) (203,652) (203,652)
872,182 872,182 872,182 886,682 886,682 886,682 1,833,739 1,833,739 1,833,739 1,833,739 1,833,739 1,845,739 1,845,739 1,845,739 1,974,917 1,974,917 1,974,917 1,974,917 1,974,917 1,974,917 1,974,917 1,974,917
- - - - - 2,626,000 - - - - - - - - - - - - - - - -
18,973 19,080 18,998 19,011 20,922 56,357 18,181 18,267 18,203 18,214 18,285 18,237 18,248 18,304 - - 596 - - 11 - -
327,626 328,301 328,977 329,655 330,334 331,014 286,013 286,602 287,193 287,784 288,377 288,971 289,566 290,163 - - - - - - - -
- - - - - 1,961,134 - - - - - - - - - - - - - - - -
- - - - - - - - - - - - - - - - - - - - - -
- - - - - - - - - - - - - - - - - - - - - -
- - - - - - - - - - - - - - - - - - - - - -
- - - - - - - - - - - - - - - - - - - - - -
- 4,997 - - 99,758 - - 3,931 - - 3,121 - - 2,311 - - 31,308 - - 578 - -
- - - - - - - - - - - - - - - - - - - - - -
- - - - - - - - - - - - - - - - - - - - - -
(36,467) (36,538) (36,592) (35,336) (35,572) (41,219) (33,979) (34,040) (34,088) (34,143) (34,203) (33,162) (33,217) (33,277) (5,600) (5,600) (5,655) (5,600) (5,600) (5,601) (5,600) (5,600)
310,132 315,840 311,384 313,329 415,442 4,933,287 270,215 274,760 271,308 271,856 275,580 274,046 274,597 277,501 (5,600) (5,600) 26,249 (5,600) (5,600) (5,013) (5,600) (5,600)
562,050 556,342 560,798 573,353 471,240 (4,046,605) 1,563,525 1,558,980 1,562,432 1,561,884 1,558,160 1,571,694 1,571,142 1,568,239 1,980,517 1,980,517 1,948,668 1,980,517 1,980,517 1,979,929 1,980,517 1,980,517
(19,235,165) (18,678,823) (18,118,025) (17,544,673) (17,073,432) (21,120,037) (19,556,512) (17,997,533) (16,435,101) (14,873,217) (13,315,057) (11,743,364) (10,172,221) (8,603,983) (6,623,466) (4,642,949) (2,694,281) (713,763) 1,266,754 3,246,683 5,227,200 7,207,718
- - - - - - - - - - - - - - - - - - - - - -
562,050 556,342 560,798 573,353 471,240 (4,046,605) 1,563,525 1,558,980 1,562,432 1,561,884 1,558,160 1,571,694 1,571,142 1,568,239 1,980,517 1,980,517 1,948,668 1,980,517 1,980,517 1,979,929 1,980,517 1,980,517
(19,235,165) (18,678,823) (18,118,025) (17,544,673) (17,073,432) (21,120,037) (19,556,512) (17,997,533) (16,435,101) (14,873,217) (13,315,057) (11,743,364) (10,172,221) (8,603,983) (6,623,466) (4,642,949) (2,694,281) (713,763) 1,266,754 3,246,683 5,227,200 7,207,718
0 0 0 0 0 0 0 0 0 0 0 0 0 0 0 0 0 0 0 0 0 0
- - - - - - - - - - - - - - - - - - - - - -
- - - - - - - - - - - - - - - - - - - - - -
- - - - - - - - - - - - - - - - - - - - - 6,753,250
- - - - - - - - - - - - - - - - - - - - - -
(2,000,000) (2,000,000) (2,000,000) (2,000,000) (2,000,000) (2,000,000) (2,000,000) (2,000,000) (2,000,000) (2,000,000) (2,000,000) (2,000,000) (2,000,000) (2,000,000) (2,000,000) (2,000,000) (2,000,000) (2,000,000) (2,000,000) (2,000,000) (2,000,000) 4,753,250
- - - - - - - - - - - - - - - - - - - - - 6,753,250
- - - - - - - - - - - - - - - - - - 812,286 1,979,929 1,980,517 -
- - - - - - - - - - - - - - - - - - - - - (4,772,733)
- - - - - - - - - - - - - - - - - - - - - -
- - - - - - - - - - - - - - - - - - 812,286 2,792,216 4,772,733 -
- - - - - (4,046,605) - - - - - - - - - - - - - - - -
7.50% 7.50% 7.50% 7.50% 7.50% 7.50% 7.50% 7.50% 7.50% 7.50% 7.50% 7.50% 7.50% 7.50% 7.50% 7.50% 7.50% 7.50% 7.50% 7.50% 7.50% 7.50%
(116,613) (113,829) (111,063) (108,252) (105,346) (103,059) (128,994) (120,028) (111,035) (101,964) (92,839) (83,681) (74,381) (65,026) (55,631) (43,600) (31,495) (19,512) (7,256) - - -
- - - - - - - - - - - - - - - - - - - - - -
- - - - - - - - - - - - - - - - - - - - - -
562,050 556,342 560,798 573,353 471,240 - 1,563,525 1,558,980 1,562,432 1,561,884 1,558,160 1,571,694 1,571,142 1,568,239 1,980,517 1,980,517 1,948,668 1,980,517 1,168,231 - - -
116,613 113,829 111,063 108,252 105,346 - 232,053 120,028 111,035 101,964 92,839 83,681 74,381 65,026 55,631 43,600 31,495 19,512 7,256 - - -
445,437 442,513 449,735 465,100 365,895 - 1,331,472 1,438,951 1,451,397 1,459,920 1,465,321 1,488,013 1,496,761 1,503,212 1,924,886 1,936,917 1,917,173 1,961,005 1,160,975 - - -
(18,212,641) (17,770,129) (17,320,393) (16,855,293) (16,489,399) (20,639,062) (19,204,532) (17,765,580) (16,314,183) (14,854,263) (13,388,942) (11,900,930) (10,404,168) (8,900,956) (6,976,070) (5,039,153) (3,121,980) (1,160,975) - - - -
145.60% 145.60% 145.60% 145.60% 145.60% 176.73% 176.73% 176.73% 176.73% 176.73% 176.73% 176.73% 176.73% 176.73% 176.73% 176.73% 176.73% 176.73%
562,050 556,342 560,798 573,353 471,240 (4,046,605) 1,563,525 1,558,980 1,562,432 1,561,884 1,558,160 1,571,694 1,571,142 1,568,239 1,980,517 1,980,517 1,948,668 1,980,517 1,168,231 - - -
7.48 7.66 7.85 8.19 8.42 8.60 14.22 15.28 16.51 17.98 19.75 22.06 24.81 28.38 35.50 45.30 62.71 101.22 272.18 - - -
1.55 1.57 1.56 1.55 1.88 - 1.17 1.18 1.17 1.17 1.18 1.17 1.17 1.18 1.00 1.00 1.01 1.00 1.69 - - -
(18,212,641) (17,770,129) (17,320,393) (16,855,293) (16,489,399) (20,639,062) (19,204,532) (17,765,580) (16,314,183) (14,854,263) (13,388,942) (11,900,930) (10,404,168) (8,900,956) (6,976,070) (5,039,153) (3,121,980) (1,160,975) - - - -
145.60% 145.60% 145.60% 145.60% 145.60% 176.73% 176.73% 176.73% 176.73% 176.73% 176.73% 176.73% 176.73% 176.73% 176.73% 176.73% 176.73% 176.73%
10.57% 10.57% 10.57% 10.57% 10.57% 8.71% 8.71% 8.71% 8.71% 8.71% 8.71% 8.71% 8.71% 8.71% 8.71% 8.71% 8.71% 8.71% 8.71% 8.71% 8.71% -
7.48 7.66 7.85 8.19 8.42 8.60 14.22 15.28 16.51 17.98 19.75 22.06 24.81 28.38 35.50 45.30 62.71 101.22 272.18 - - -
1.55 1.57 1.56 1.55 1.88 - 1.17 1.18 1.17 1.17 1.18 1.17 1.17 1.18 1.00 1.00 1.01 1.00 1.69 - - -
445,437 442,513 449,735 465,100 365,895 (4,149,663) 1,434,530 1,438,951 1,451,397 1,459,920 1,465,321 1,488,013 1,496,761 1,503,212 1,924,886 1,936,917 1,917,173 1,961,005 1,973,261 1,979,929 1,980,517 1,980,517
(20,212,641) (19,770,129) (19,320,393) (18,855,293) (18,489,399) (22,639,062) (21,204,532) (19,765,580) (18,314,183) (16,854,263) (15,388,942) (13,900,930) (12,404,168) (10,900,956) (8,976,070) (7,039,153) (5,121,980) (3,160,975) (1,187,714) 792,216 2,772,733 4,753,250
- - - - - - - - - - - - - - - - - - - - - -
562,050 556,342 560,798 573,353 471,240 (4,046,605) 1,563,525 1,558,980 1,562,432 1,561,884 1,558,160 1,571,694 1,571,142 1,568,239 1,980,517 1,980,517 1,948,668 1,980,517 1,980,517 1,979,929 1,980,517 1,980,517
390,702 380,394 377,156 379,278 306,619 (2,589,817) 984,248 965,298 951,576 935,648 918,115 910,908 895,661 879,350 1,092,319 1,074,412 1,039,804 1,039,474 1,022,434 1,005,374 989,186 972,970
21,464,958 21,251,290 21,039,864 20,820,383 20,584,481 20,448,462 24,903,318 23,728,790 22,539,307 21,326,489 20,094,016 18,844,787 17,560,978 16,256,333 14,932,896 13,168,252 11,374,197 9,582,621 7,728,806 5,844,094 3,928,567 1,980,517
20.00% 20.00% 20.00% 20.00% 20.00% 20.00% 20.00% 20.00% 20.00% 20.00% 20.00% 20.00% 20.00% 20.00% 20.00% 20.00% 20.00% 20.00% 20.00% 20.00% 20.00% 20.00%
Estate Master DF Ver 5.3 Page 2 of 2 Pages File: New2.emdf Date of Report: 14/10/2013 12:18 PM

Charts Project Cash Flow charts for the developer and land owner (joint venture).

Cash Flow Charts
Greenwood Park Estate
Option 1 - Subdivision
Subdivision - 179 Lots
Estate Master Licensed to: Estate Master Administration
-25
-20
-15
-10
-5
0
5
10
AU
D M
illio
ns .
Ju
n-0
7
Ju
l-0
7
Au
g-0
7
Se
p-0
7
Oct-
07
No
v-0
7
De
c-0
7
Ja
n-0
8
Fe
b-0
8
Ma
r-0
8
Ap
r-0
8
Ma
y-0
8
Ju
n-0
8
Ju
l-0
8
Au
g-0
8
Se
p-0
8
Oct-
08
No
v-0
8
De
c-0
8
Ja
n-0
9
Fe
b-0
9
Ma
r-0
9
Ap
r-0
9
Ma
y-0
9
Ju
n-0
9
Ju
l-0
9
Au
g-0
9
Se
p-0
9
Oct-
09
No
v-0
9
De
c-0
9
Ja
n-1
0
Fe
b-1
0
Ma
r-1
0
Ap
r-1
0
Ma
y-1
0
Ju
n-1
0
Ju
l-1
0
Au
g-1
0
Se
p-1
0
Oct-
10
No
v-1
0
De
c-1
0
Ja
n-1
1
Month
Project Cash Flow
Project Overdraft Net Cash Flow Cumulative Net Cash Flow
-25
-20
-15
-10
-5
0
5
10
AU
D M
illio
ns .
Ju
n-0
7
Ju
l-0
7
Au
g-0
7
Se
p-0
7
Oct-
07
No
v-0
7
De
c-0
7
Ja
n-0
8
Fe
b-0
8
Ma
r-0
8
Ap
r-0
8
Ma
y-0
8
Ju
n-0
8
Ju
l-0
8
Au
g-0
8
Se
p-0
8
Oct-
08
No
v-0
8
De
c-0
8
Ja
n-0
9
Fe
b-0
9
Ma
r-0
9
Ap
r-0
9
Ma
y-0
9
Ju
n-0
9
Ju
l-0
9
Au
g-0
9
Se
p-0
9
Oct-
09
No
v-0
9
De
c-0
9
Ja
n-1
0
Fe
b-1
0
Ma
r-1
0
Ap
r-1
0
Ma
y-1
0
Ju
n-1
0
Ju
l-1
0
Au
g-1
0
Se
p-1
0
Oct-
10
No
v-1
0
De
c-1
0
Ja
n-1
1
Month
Project Cumulative Cash Flow
Land Owner's Equity Developer's Equity Loan 1 Loan 2 Loan 3 Senior Loan
Estate Master DF Ver 5.3 Page 1 of 2 Pages File: New2.emdf Date of Report: 14/10/2013 12:19 PM
Cash Flow Charts
Greenwood Park Estate
Option 1 - Subdivision
Subdivision - 179 Lots
Estate Master Licensed to: Estate Master Administration
Project Cash Flow
-10
-8
-6
-4
-2
0
2
4
AU
D M
illio
ns .
Ju
n-0
7
Ju
l-0
7
Au
g-0
7
Se
p-0
7
Oct-
07
No
v-0
7
De
c-0
7
Ja
n-0
8
Fe
b-0
8
Ma
r-0
8
Ap
r-0
8
Ma
y-0
8
Ju
n-0
8
Ju
l-0
8
Au
g-0
8
Se
p-0
8
Oct-
08
No
v-0
8
De
c-0
8
Ja
n-0
9
Fe
b-0
9
Ma
r-0
9
Ap
r-0
9
Ma
y-0
9
Ju
n-0
9
Ju
l-0
9
Au
g-0
9
Se
p-0
9
Oct-
09
No
v-0
9
De
c-0
9
Ja
n-1
0
Fe
b-1
0
Ma
r-1
0
Ap
r-1
0
Ma
y-1
0
Ju
n-1
0
Ju
l-1
0
Au
g-1
0
Se
p-1
0
Oct-
10
No
v-1
0
De
c-1
0
Ja
n-1
1
Month
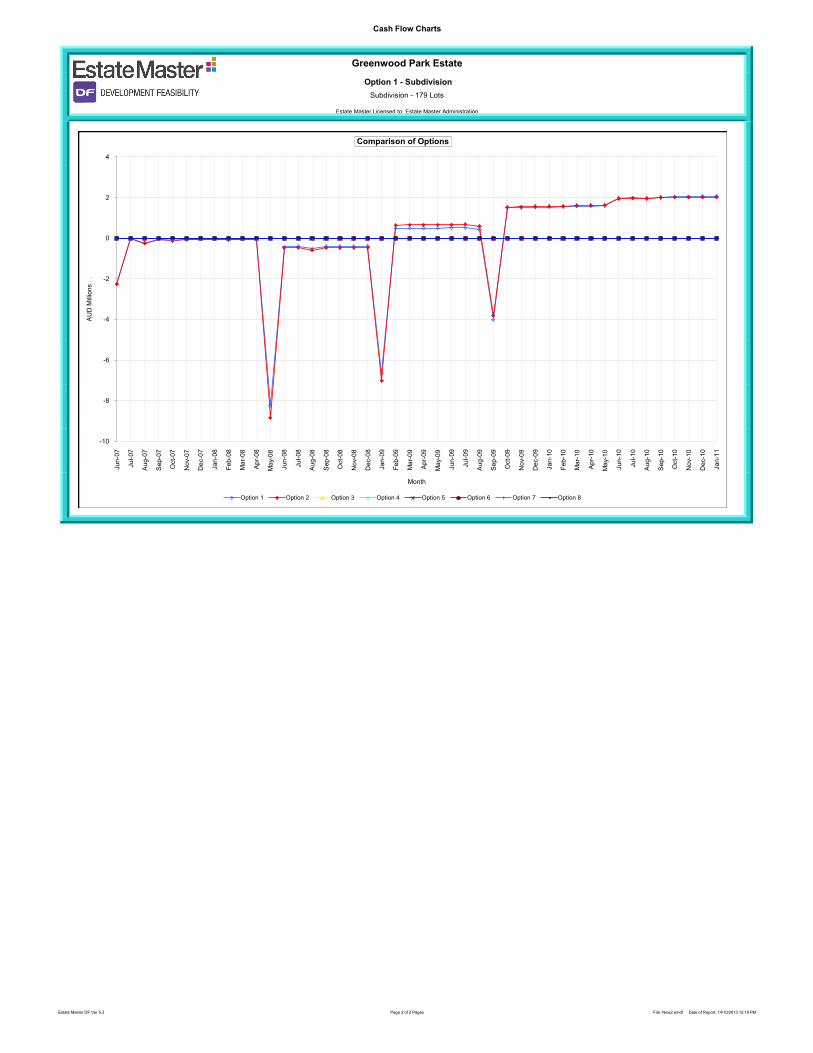
Comparison of Options
Option 1 Option 2 Option 3 Option 4 Option 5 Option 6 Option 7 Option 8
Estate Master DF Ver 5.3 Page 2 of 2 Pages File: New2.emdf Date of Report: 14/10/2013 12:19 PM

Summary The development financial summary sheets for the developer, including the returns to
the different financiers/investors in the project.
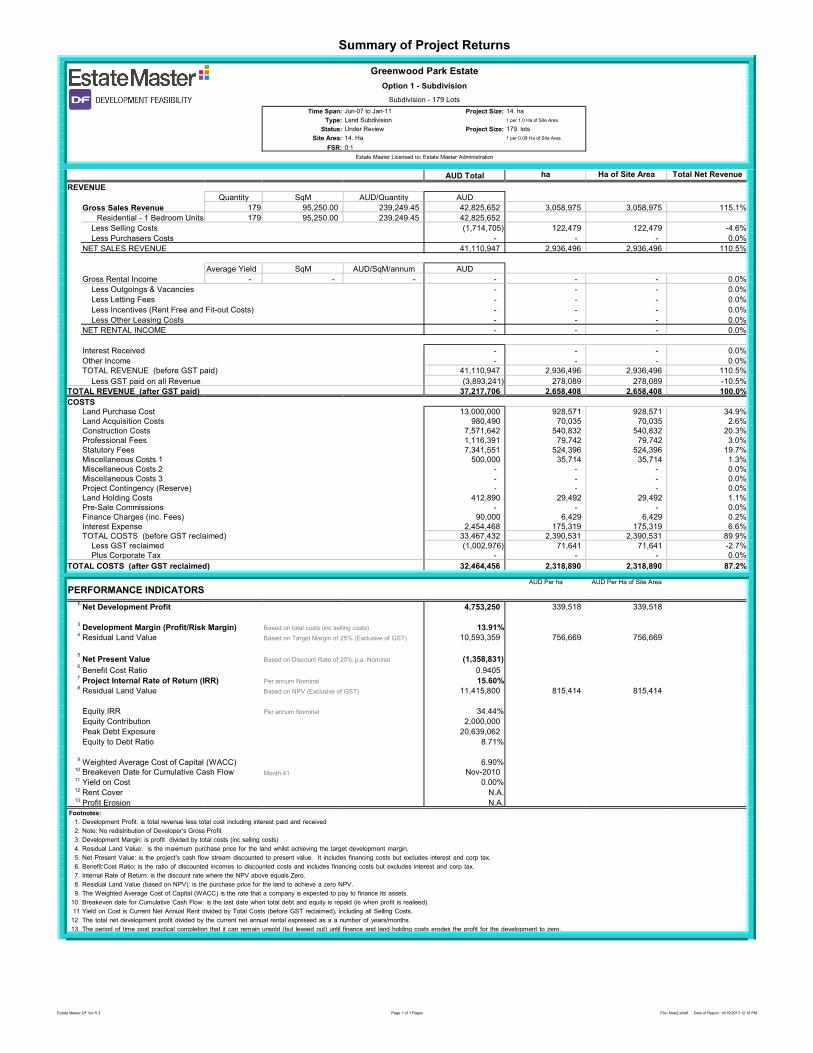
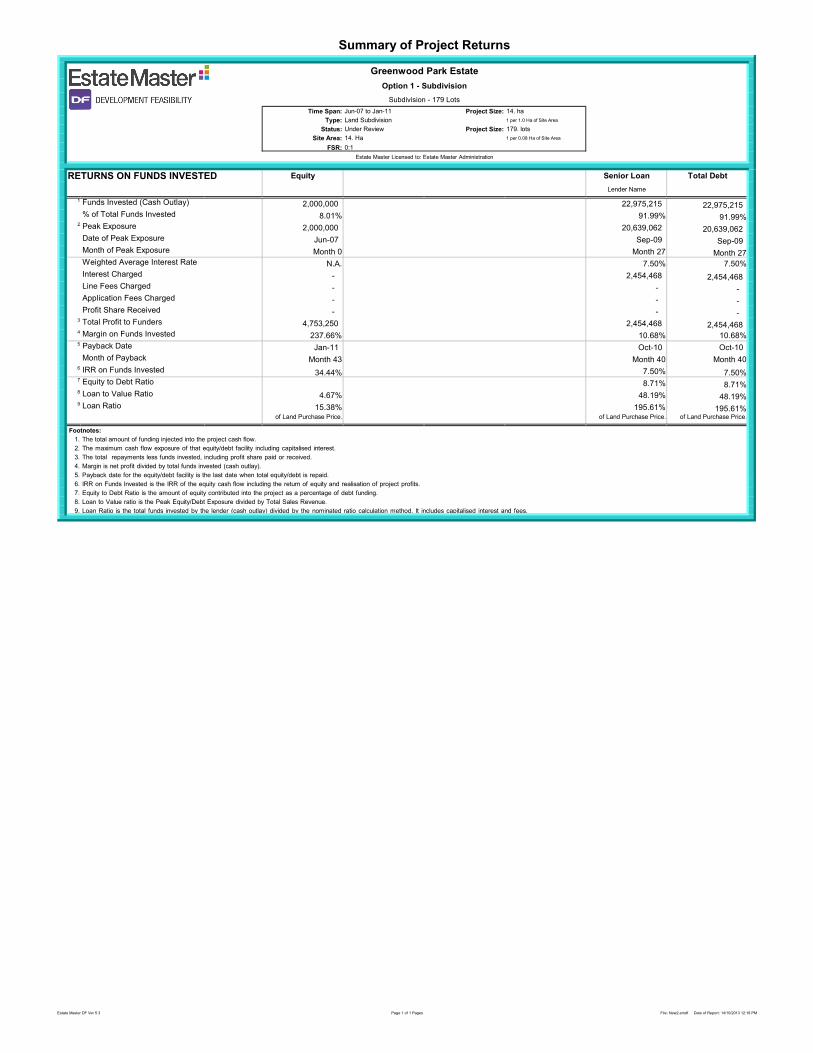
Summary of Project Returns
Greenwood Park Estate
Option 1 - Subdivision
Subdivision - 179 Lots
Time Span: Jun-07 to Jan-11 Project Size: 14. ha
Type: Land Subdivision 1 per 1.0 Ha of Site Area
Status: Under Review Project Size: 179. lots
Site Area: 14. Ha 1 per 0.08 Ha of Site Area
FSR: 0:1 Equated GFA: 0.0 Ha
Estate Master Licensed to: Estate Master Administration
AUD Total ha Ha of Site Area Total Net Revenue
REVENUE
Quantity SqM AUD/Quantity AUD
Gross Sales Revenue 179 95,250.00 239,249.45 42,825,652 3,058,975 3,058,975 115.1%
Residential - 1 Bedroom Units 179 95,250.00 239,249.45 42,825,652
Less Selling Costs (1,714,705) 122,479 122,479 -4.6%
Less Purchasers Costs - - - 0.0%
NET SALES REVENUE 41,110,947 2,936,496 2,936,496 110.5%
Average Yield SqM AUD/SqM/annum AUD
Gross Rental Income - - - - - - 0.0%
Less Outgoings & Vacancies - - - 0.0%
Less Letting Fees - - - 0.0%
Less Incentives (Rent Free and Fit-out Costs) - - - 0.0%
Less Other Leasing Costs - - - 0.0%
NET RENTAL INCOME - - - 0.0%
Interest Received - - - 0.0%
Other Income - - - 0.0%
TOTAL REVENUE (before GST paid) 41,110,947 2,936,496 2,936,496 110.5%
Less GST paid on all Revenue (3,893,241) 278,089 278,089 -10.5%
TOTAL REVENUE (after GST paid) 37,217,706 2,658,408 2,658,408 100.0%
COSTS
Land Purchase Cost 13,000,000 928,571 928,571 34.9%
Land Acquisition Costs 980,490 70,035 70,035 2.6%
Construction Costs 7,571,642 540,832 540,832 20.3%
Professional Fees 1,116,391 79,742 79,742 3.0%
Statutory Fees 7,341,551 524,396 524,396 19.7%
Miscellaneous Costs 1 500,000 35,714 35,714 1.3%
Miscellaneous Costs 2 - - - 0.0%
Miscellaneous Costs 3 - - - 0.0%
Project Contingency (Reserve) - - - 0.0%
Land Holding Costs 412,890 29,492 29,492 1.1%
Pre-Sale Commissions - - - 0.0%
Finance Charges (inc. Fees) 90,000 6,429 6,429 0.2%
Interest Expense 2,454,468 175,319 175,319 6.6%
TOTAL COSTS (before GST reclaimed) 33,467,432 2,390,531 2,390,531 89.9%
Less GST reclaimed (1,002,976) 71,641 71,641 -2.7%
Plus Corporate Tax - - - 0.0%
TOTAL COSTS (after GST reclaimed) 32,464,456 2,318,890 2,318,890 87.2%
PERFORMANCE INDICATORSAUD Per ha AUD Per Ha of Site Area
1Net Development Profit 4,753,250 339,518 339,518
4,753,250 339,518 339,5183Development Margin (Profit/Risk Margin) Based on total costs (inc selling costs) 13.91%
4Residual Land Value Based on Target Margin of 25% (Exclusive of GST) 10,593,359 756,669 756,669
5Net Present Value Based on Discount Rate of 20% p.a. Nominal (1,358,831)
6Benefit Cost Ratio 0.9405
7Project Internal Rate of Return (IRR) Per annum Nominal 15.60%
8Residual Land Value Based on NPV (Exclusive of GST) 11,415,800 815,414 815,414
Equity IRR Per annum Nominal 34.44%
Equity Contribution 2,000,000
Peak Debt Exposure 20,639,062
Equity to Debt Ratio 8.71%
9Weighted Average Cost of Capital (WACC) 6.90%
10 Breakeven Date for Cumulative Cash Flow Month 41 Nov-201011 Yield on Cost 0.00%12 Rent Cover N.A.13 Profit Erosion N.A.
Footnotes:
1. Development Profit: is total revenue less total cost including interest paid and received
2. Note: No redistribution of Developer's Gross Profit
3. Development Margin: is profit divided by total costs (inc selling costs)
4. Residual Land Value: is the maximum purchase price for the land whilst achieving the target development margin.
5. Net Present Value: is the project's cash flow stream discounted to present value. It includes financing costs but excludes interest and corp tax.
6. Benefit:Cost Ratio: is the ratio of discounted incomes to discounted costs and includes financing costs but excludes interest and corp tax.
7. Internal Rate of Return: is the discount rate where the NPV above equals Zero.
8. Residual Land Value (based on NPV): is the purchase price for the land to achieve a zero NPV.
9. The Weighted Average Cost of Capital (WACC) is the rate that a company is expected to pay to finance its assets.
10. Breakeven date for Cumulative Cash Flow: is the last date when total debt and equity is repaid (ie when profit is realised).
11 Yield on Cost is Current Net Annual Rent divided by Total Costs (before GST reclaimed), including all Selling Costs.
12. The total net development profit divided by the current net annual rental expressed as a a number of years/months.
13. The period of time post practical completion that it can remain unsold (but leased out) until finance and land holding costs erodes the profit for the development to zero.
Estate Master DF Ver 5.3 Page 1 of 1 Pages File: New2.emdf Date of Report: 14/10/2013 12:18 PM
Summary of Project Returns
Greenwood Park Estate
Option 1 - Subdivision
Subdivision - 179 Lots
Time Span: Jun-07 to Jan-11 Project Size: 14. ha
Type: Land Subdivision 1 per 1.0 Ha of Site Area
Status: Under Review Project Size: 179. lots
Site Area: 14. Ha 1 per 0.08 Ha of Site Area
FSR: 0:1 Equated GFA: 0.0 Ha
Estate Master Licensed to: Estate Master Administration
RETURNS ON FUNDS INVESTED Equity Loan 1 Loan 2 Loan 3 Senior Loan Total Debt
Lender Name Lender Name Lender Name Lender Name
1 Funds Invested (Cash Outlay) 2,000,000 - - - 22,975,215 22,975,215% of Total Funds Invested 8.01% 0.00% 0.00% 0.00% 91.99% 91.99%
2 Peak Exposure 2,000,000 - - - 20,639,062 20,639,062Date of Peak Exposure Jun-07 N.A. N.A. N.A. Sep-09 Sep-09Month of Peak Exposure Month 0 Month 27 Month 27Weighted Average Interest Rate N.A. N.A. N.A. N.A. 7.50% 7.50%
Interest Charged - - - - 2,454,468 2,454,468Line Fees Charged - - - - - -Application Fees Charged - - - - - -Profit Share Received - - - - - -
3 Total Profit to Funders 4,753,250 - - - 2,454,468 2,454,4684 Margin on Funds Invested 237.66% N.A. N.A. N.A. 10.68% 10.68%5 Payback Date Jan-11 N.A. N.A. N.A. Oct-10 Oct-10
Month of Payback Month 43 N.A. N.A. N.A. Month 40 Month 406 IRR on Funds Invested 34.44% N.A. N.A. N.A. 7.50% 7.50%7 Equity to Debt Ratio N.A. N.A. N.A. 8.71% 8.71%8 Loan to Value Ratio 4.67% 0.00% 0.00% 0.00% 48.19% 48.19%9 Loan Ratio 15.38% 0.00% 0.00% 0.00% 195.61% 195.61%
of Land Purchase Price. of Land Purchase Price. of Land Purchase Price. of Land Purchase Price. of Land Purchase Price. of Land Purchase Price.
Footnotes:
1. The total amount of funding injected into the project cash flow.
2. The maximum cash flow exposure of that equity/debt facility including capitalised interest.
3. The total repayments less funds invested, including profit share paid or received.
4. Margin is net profit divided by total funds invested (cash outlay).
5. Payback date for the equity/debt facility is the last date when total equity/debt is repaid.
6. IRR on Funds Invested is the IRR of the equity cash flow including the return of equity and realisation of project profits.
7. Equity to Debt Ratio is the amount of equity contributed into the project as a percentage of debt funding.
8. Loan to Value ratio is the Peak Equity/Debt Exposure divided by Total Sales Revenue.
9. Loan Ratio is the total funds invested by the lender (cash outlay) divided by the nominated ratio calculation method. It includes capitalised interest and fees.
Estate Master DF Ver 5.3 Page 1 of 1 Pages File: New2.emdf Date of Report: 14/10/2013 12:18 PM

Joint Venture The development financial summary for the land owner in a joint venture scenario.
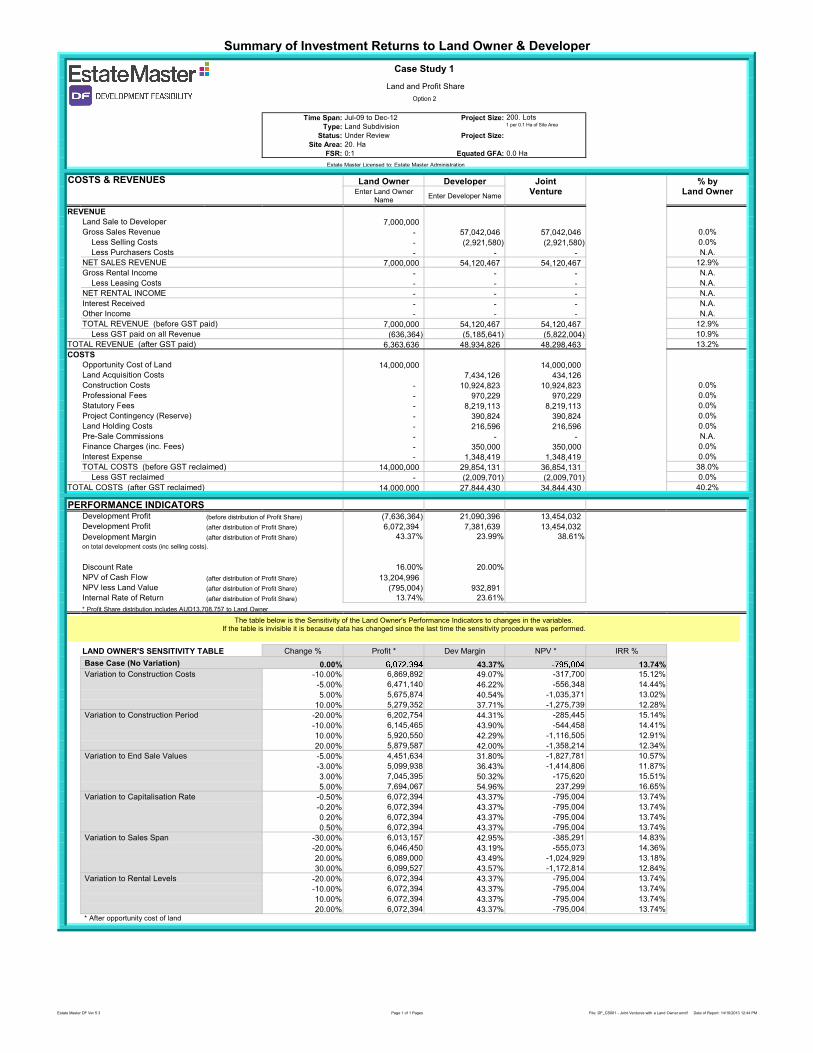
Summary of Investment Returns to Land Owner & Developer
Case Study 1
Land and Profit Share
Option 2
Time Span: Jul-09 to Dec-12 Project Size: 200. Lots
Type: Land Subdivision 1 per 0.1 Ha of Site Area
Status: Under Review Project Size:
Site Area: 20. Ha
FSR: 0:1 Equated GFA: 0.0 Ha
Estate Master Licensed to: Estate Master Administration
COSTS & REVENUES Land Owner Developer Joint % byEnter Land Owner
NameEnter Developer Name
Venture Land Owner
REVENUE
Land Sale to Developer 7,000,000
Gross Sales Revenue - 57,042,046 57,042,046 0.0%
Less Selling Costs - (2,921,580) (2,921,580) 0.0%
Less Purchasers Costs - - - N.A.
NET SALES REVENUE 7,000,000 54,120,467 54,120,467 12.9%
Gross Rental Income - - - N.A.
Less Leasing Costs - - - N.A.
NET RENTAL INCOME - - - N.A.
Interest Received - - - N.A.
Other Income - - - N.A.
TOTAL REVENUE (before GST paid) 7,000,000 54,120,467 54,120,467 12.9%
Less GST paid on all Revenue (636,364) (5,185,641) (5,822,004) 10.9%
TOTAL REVENUE (after GST paid) 6,363,636 48,934,826 48,298,463 13.2%
COSTS
Opportunity Cost of Land 14,000,000 14,000,000
Land Acquisition Costs 7,434,126 434,126
Construction Costs - 10,924,823 10,924,823 0.0%
Professional Fees - 970,229 970,229 0.0%
Statutory Fees - 8,219,113 8,219,113 0.0%
Project Contingency (Reserve) - 390,824 390,824 0.0%
Land Holding Costs - 216,596 216,596 0.0%
Pre-Sale Commissions - - - N.A.
Finance Charges (inc. Fees) - 350,000 350,000 0.0%
Interest Expense - 1,348,419 1,348,419 0.0%
TOTAL COSTS (before GST reclaimed) 14,000,000 29,854,131 36,854,131 38.0%
Less GST reclaimed - (2,009,701) (2,009,701) 0.0%
TOTAL COSTS (after GST reclaimed) 14,000,000 27,844,430 34,844,430 40.2%
PERFORMANCE INDICATORSDevelopment Profit (before distribution of Profit Share) (7,636,364) 21,090,396 13,454,032
Development Profit (after distribution of Profit Share) 6,072,394 7,381,639 13,454,032
Development Margin (after distribution of Profit Share) 43.37% 23.99% 38.61%
on total development costs (inc selling costs).
Discount Rate 16.00% 20.00%
NPV of Cash Flow (after distribution of Profit Share) 13,204,996
NPV less Land Value (after distribution of Profit Share) (795,004) 932,891
Internal Rate of Return (after distribution of Profit Share) 13.74% 23.61%
* Profit Share distribution includes AUD13,708,757 to Land Owner
LAND OWNER'S SENSITIVITY TABLE Change % Profit * Dev Margin NPV * IRR %
Base Case (No Variation) 0.00% 43.37% 13.74%
Variation to Construction Costs -10.00% 6,869,892 49.07% -317,700 15.12%
-5.00% 6,471,140 46.22% -556,348 14.44%
5.00% 5,675,874 40.54% -1,035,371 13.02%
10.00% 5,279,352 37.71% -1,275,739 12.28%
Variation to Construction Period -20.00% 6,202,754 44.31% -285,445 15.14%
-10.00% 6,145,465 43.90% -544,458 14.41%
10.00% 5,920,550 42.29% -1,116,505 12.91%
20.00% 5,879,587 42.00% -1,358,214 12.34%
Variation to End Sale Values -5.00% 4,451,634 31.80% -1,827,781 10.57%
-3.00% 5,099,938 36.43% -1,414,806 11.87%
3.00% 7,045,395 50.32% -175,620 15.51%
5.00% 7,694,067 54.96% 237,299 16.65%
Variation to Capitalisation Rate -0.50% 6,072,394 43.37% -795,004 13.74%
-0.20% 6,072,394 43.37% -795,004 13.74%
0.20% 6,072,394 43.37% -795,004 13.74%
0.50% 6,072,394 43.37% -795,004 13.74%
Variation to Sales Span -30.00% 6,013,157 42.95% -385,291 14.83%
-20.00% 6,046,450 43.19% -555,073 14.36%
20.00% 6,089,000 43.49% -1,024,929 13.18%
30.00% 6,099,527 43.57% -1,172,814 12.84%
Variation to Rental Levels -20.00% 6,072,394 43.37% -795,004 13.74%
-10.00% 6,072,394 43.37% -795,004 13.74%
10.00% 6,072,394 43.37% -795,004 13.74%
20.00% 6,072,394 43.37% -795,004 13.74%* After opportunity cost of land
The table below is the Sensitivity of the Land Owner's Performance Indicators to changes in the variables. If the table is invisible it is because data has changed since the last time the sensitivity procedure was performed.
Estate Master DF Ver 5.3 Page 1 of 1 Pages File: DF_CS001 - Joint Ventures with a Land Owner.emdf Date of Report: 14/10/2013 12:44 PM

Gantt Chart Gantt chart for viewing and editing the project timeline.
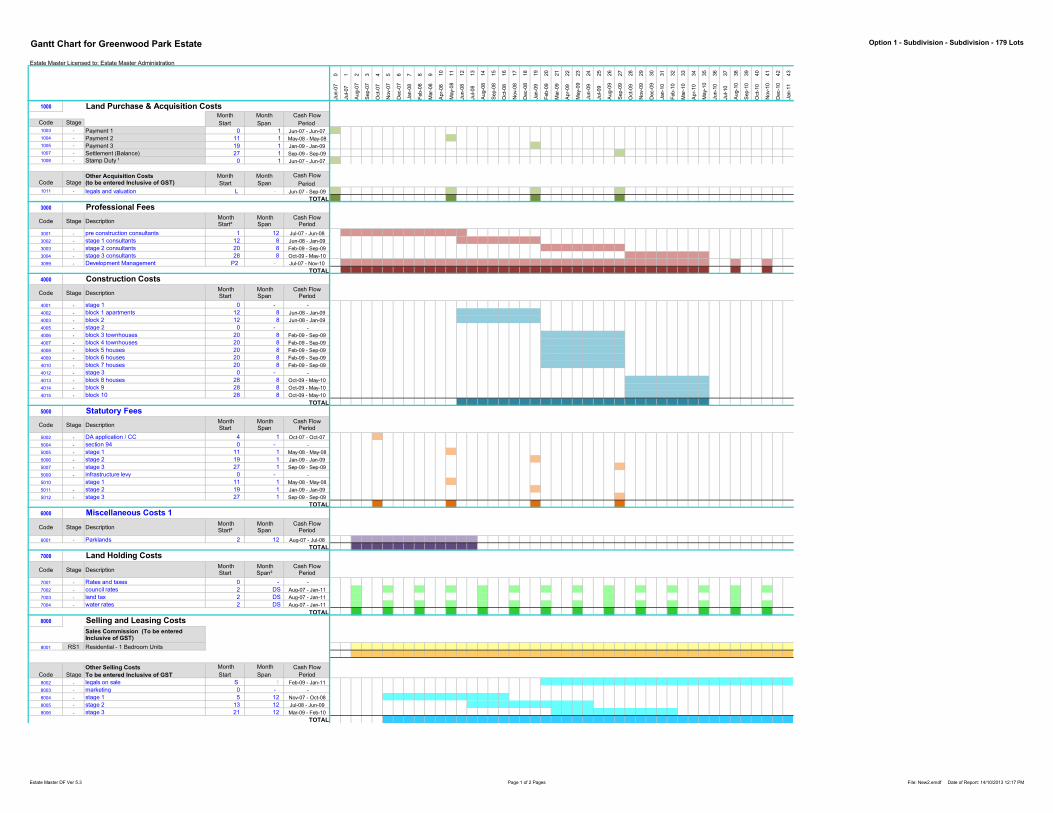
Gantt Chart for Greenwood Park Estate Option 1 - Subdivision - Subdivision - 179 Lots
Estate Master Licensed to: Estate Master Administration
0 1 2 3 4 5 6 7 8 9 10
11
12
13
14
15
16
17
18
19
20
21
22
23
24
25
26
27
28
29
30
31
32
33
34
35
36
37
38
39
40
41
42
43
Jun-07
Jul-07
Aug-07
Sep-07
Oct-07
Nov-07
Dec-07
Jan-08
Feb-08
Mar-08
Apr-08
May-08
Jun-08
Jul-08
Aug-08
Sep-08
Oct-08
Nov-08
Dec-08
Jan-09
Feb-09
Mar-09
Apr-09
May-09
Jun-09
Jul-09
Aug-09
Sep-09
Oct-09
Nov-09
Dec-09
Jan-10
Feb-10
Mar-10
Apr-10
May-10
Jun-10
Jul-10
Aug-10
Sep-10
Oct-10
Nov-10
Dec-10
Jan-11
1000 Land Purchase & Acquisition CostsMonth Month Cash Flow
Code Stage Start Span Period1003 - Payment 1 0 1 Jun-07 - Jun-07
1004 - Payment 2 11 1 May-08 - May-08
1005 - Payment 3 19 1 Jan-09 - Jan-09
1007 - Settlement (Balance) 27 1 Sep-09 - Sep-09
1008 - Stamp Duty ¹ 0 1 Jun-07 - Jun-07
Other Acquisition Costs Month Month Cash Flow
Code Stage (to be entered Inclusive of GST) Start Span Period1011 - legals and valuation L - Jun-07 - Sep-09
² Pro-rata with Land Payments ('L') TOTAL
3000 Professional Fees
Code Stage Description MonthStart²
MonthSpan
Cash Flow Period
3001 - pre construction consultants 1 12 Jul-07 - Jun-08
3002 - stage 1 consultants 12 8 Jun-08 - Jan-09
3003 - stage 2 consultants 20 8 Feb-09 - Sep-09
3004 - stage 3 consultants 28 8 Oct-09 - May-10
3099 - Development Management P2 - Jul-07 - Nov-10
TOTAL
4000 Construction Costs
Code Stage Description MonthStart
MonthSpan
Cash Flow Period
4001 - stage 1 0 - -
4002 - block 1 apartments 12 8 Jun-08 - Jan-09
4003 - block 2 12 8 Jun-08 - Jan-09
4005 - stage 2 0 - -
4006 - block 3 townhouses 20 8 Feb-09 - Sep-09
4007 - block 4 townhouses 20 8 Feb-09 - Sep-09
4008 - block 5 houses 20 8 Feb-09 - Sep-09
4009 - block 6 houses 20 8 Feb-09 - Sep-09
4010 - block 7 houses 20 8 Feb-09 - Sep-09
4012 - stage 3 0 - -
4013 - block 8 houses 28 8 Oct-09 - May-10
4014 - block 9 28 8 Oct-09 - May-10
4015 - block 10 28 8 Oct-09 - May-10
TOTAL
5000 Statutory Fees
Code Stage Description MonthStart
MonthSpan
Cash Flow Period
5002 - DA application / CC 4 1 Oct-07 - Oct-07
5004 - section 94 0 - -
5005 - stage 1 11 1 May-08 - May-08
5006 - stage 2 19 1 Jan-09 - Jan-09
5007 - stage 3 27 1 Sep-09 - Sep-09
5009 - infrastructure levy 0 - -
5010 stage 1 11 1 May-08 - May-08
5011 - stage 2 19 1 Jan-09 - Jan-09
5012 - stage 3 27 1 Sep-09 - Sep-09
TOTAL
6000 Miscellaneous Costs 1
Code Stage Description MonthStart²
MonthSpan
Cash Flow Period
6001 - Parklands 2 12 Aug-07 - Jul-08
TOTAL
7000 Land Holding Costs
Code Stage Description MonthStart
MonthSpan²
Cash Flow Period
7001 - Rates and taxes 0 - -
7002 - council rates 2 DS Aug-07 - Jan-11
7003 - land tax 2 DS Aug-07 - Jan-11
7004 - water rates 2 DS Aug-07 - Jan-11
TOTAL
8000 Selling and Leasing Costs
#####Sales Commission (To be entered Inclusive of GST)
8001 RS1 Residential - 1 Bedroom Units
Other Selling Costs Month Month Cash Flow
Code Stage To be entered Inclusive of GST Start Span Period
8002 - legals on sale S 1 Feb-09 - Jan-11
8003 - marketing 0 - -
8004 - stage 1 5 12 Nov-07 - Oct-08
8005 - stage 2 13 12 Jul-08 - Jun-09
8006 - stage 3 21 12 Mar-09 - Feb-10
TOTAL
1 - - - - - - - - - - - - - - - - - - - - - - - - - - - - - - - - - - - - - - - - - - -
- - - - - - - - - - - 1 - - - - - - - - - - - - - - - - - - - - - - - - - - - - - - - -
- - - - - - - - - - - - - - - - - - - 1 - - - - - - - - - - - - - - - - - - - - - - - -
- - - - - - - - - - - - - - - - - - - - - - - - - - - 1 - - - - - - - - - - - - - - - -
1 - - - - - - - - - - - - - - - - - - - - - - - - - - - - - - - - - - - - - - - - - - -
1 - - - - - - - - - - 1 - - - - - - - 1 - - - - - - - 1 - - - - - - - - - - - - - - - -
1 - - - - - - - - - - 1 - - - - - - - 1 - - - - - - - 1 - - - - - - - - - - - - - - - -
- 1 1 1 1 1 1 1 1 1 1 1 1 - - - - - - - - - - - - - - - - - - - - - - - - - - - - - - -
- - - - - - - - - - - - 1 1 1 1 1 1 1 1 - - - - - - - - - - - - - - - - - - - - - - - -
- - - - - - - - - - - - - - - - - - - - 1 1 1 1 1 1 1 1 - - - - - - - - - - - - - - - -
- - - - - - - - - - - - - - - - - - - - - - - - - - - - 1 1 1 1 1 1 1 1 - - - - - - - -
- 1 1 1 1 1 1 1 1 1 1 1 1 1 1 1 1 1 1 1 1 1 1 1 1 1 1 1 1 1 1 1 1 1 1 1 - - 1 - - 1 - -
- 1 1 1 1 1 1 1 1 1 1 1 1 1 1 1 1 1 1 1 1 1 1 1 1 1 1 1 1 1 1 1 1 1 1 1 - - 1 - - 1 - -
- - - - - - - - - - - - - - - - - - - - - - - - - - - - - - - - - - - - - - - - - - - -
- - - - - - - - - - - - 1 1 1 1 1 1 1 1 - - - - - - - - - - - - - - - - - - - - - - - -
- - - - - - - - - - - - 1 1 1 1 1 1 1 1 - - - - - - - - - - - - - - - - - - - - - - - -
- - - - - - - - - - - - - - - - - - - - - - - - - - - - - - - - - - - - - - - - - - - -
- - - - - - - - - - - - - - - - - - - - 1 1 1 1 1 1 1 1 - - - - - - - - - - - - - - - -
- - - - - - - - - - - - - - - - - - - - 1 1 1 1 1 1 1 1 - - - - - - - - - - - - - - - -
- - - - - - - - - - - - - - - - - - - - 1 1 1 1 1 1 1 1 - - - - - - - - - - - - - - - -
- - - - - - - - - - - - - - - - - - - - 1 1 1 1 1 1 1 1 - - - - - - - - - - - - - - - -
- - - - - - - - - - - - - - - - - - - - 1 1 1 1 1 1 1 1 - - - - - - - - - - - - - - - -
- - - - - - - - - - - - - - - - - - - - - - - - - - - - - - - - - - - - - - - - - - - -
- - - - - - - - - - - - - - - - - - - - - - - - - - - - 1 1 1 1 1 1 1 1 - - - - - - - -
- - - - - - - - - - - - - - - - - - - - - - - - - - - - 1 1 1 1 1 1 1 1 - - - - - - - -
- - - - - - - - - - - - - - - - - - - - - - - - - - - - 1 1 1 1 1 1 1 1 - - - - - - - -
- - - - - - - - - - - - 1 1 1 1 1 1 1 1 1 1 1 1 1 1 1 1 1 1 1 1 1 1 1 1 - - - - - - - -
- - - - 1 - - - - - - - - - - - - - - - - - - - - - - - - - - - - - - - - - - - - - - -
- - - - - - - - - - - - - - - - - - - - - - - - - - - - - - - - - - - - - - - - - - - -
- - - - - - - - - - - 1 - - - - - - - - - - - - - - - - - - - - - - - - - - - - - - - -
- - - - - - - - - - - - - - - - - - - 1 - - - - - - - - - - - - - - - - - - - - - - - -
- - - - - - - - - - - - - - - - - - - - - - - - - - - 1 - - - - - - - - - - - - - - - -
- - - - 1 - - - - - - 1 - - - - - - - 1 - - - - - - - 1 - - - - - - - - - - - - - - - -
- - 1 1 1 1 1 1 1 1 1 1 1 1 - - - - - - - - - - - - - - - - - - - - - - - - - - - - - -
- - 1 1 1 1 1 1 1 1 1 1 1 1 - - - - - - - - - - - - - - - - - - - - - - - - - - - - - -
- - - - - - - - - - - - - - - - - - - - - - - - - - - - - - - - - - - - - - - - - - - -
- - 1 - - 1 - - 1 - - 1 - - 1 - - 1 - - 1 - - 1 - - 1 - - 1 - - 1 - - 1 - - 1 - - 1 - -
- - 1 - - - - - - - - - - - 1 - - - - - - - - - - - 1 - - - - - - - - - - - 1 - - - - -
- - 1 - - 1 - - 1 - - 1 - - 1 - - 1 - - 1 - - 1 - - 1 - - 1 - - 1 - - 1 - - 1 - - 1 - -
- - 1 - - 1 - - 1 - - 1 - - 1 - - 1 - - 1 - - 1 - - 1 - - 1 - - 1 - - 1 - - 1 - - 1 - -
- - 1 1 1 1 1 1 1 1 1 1 1 1 1 1 1 1 1 1 1 1 1 1 1 1 1 1 1 1 1 1 1 1 1 1 1 1 1 1 1 1 1 1
- - 1 1 1 1 1 1 1 1 1 1 1 1 1 1 1 1 1 1 1 1 1 1 1 1 1 1 1 1 1 1 1 1 1 1 1 1 1 1 1 1 1 1
- - - - - - - - - - - - - - - - - - - - 1 1 1 1 1 1 1 1 1 1 1 1 1 1 1 1 1 1 1 1 1 1 1 1
- - - - - - - - - - - - - - - - - - - - - - - - - - - - - - - - - - - - - - - - - - - -
- - - - - 1 1 1 1 1 1 1 1 1 1 1 1 - - - - - - - - - - - - - - - - - - - - - - - - - - -
- - - - - - - - - - - - - 1 1 1 1 1 1 1 1 1 1 1 1 - - - - - - - - - - - - - - - - - - -
- - - - - - - - - - - - - - - - - - - - - 1 1 1 1 1 1 1 1 1 1 1 1 - - - - - - - - - - -
- - - - - 1 1 1 1 1 1 1 1 1 1 1 1 1 1 1 1 1 1 1 1 1 1 1 1 1 1 1 1 1 1 1 1 1 1 1 1 1 1 1
Estate Master DF Ver 5.3 Page 1 of 2 Pages File: New2.emdf Date of Report: 14/10/2013 12:17 PM

Gantt Chart for Greenwood Park Estate Option 1 - Subdivision - Subdivision - 179 Lots
Estate Master Licensed to: Estate Master Administration
0 1 2 3 4 5 6 7 8 9 10
11
12
13
14
15
16
17
18
19
20
21
22
23
24
25
26
27
28
29
30
31
32
33
34
35
36
37
38
39
40
41
42
43
Jun-07
Jul-07
Aug-07
Sep-07
Oct-07
Nov-07
Dec-07
Jan-08
Feb-08
Mar-08
Apr-08
May-08
Jun-08
Jul-08
Aug-08
Sep-08
Oct-08
Nov-08
Dec-08
Jan-09
Feb-09
Mar-09
Apr-09
May-09
Jun-09
Jul-09
Aug-09
Sep-09
Oct-09
Nov-09
Dec-09
Jan-10
Feb-10
Mar-10
Apr-10
May-10
Jun-10
Jul-10
Aug-10
Sep-10
Oct-10
Nov-10
Dec-10
Jan-11
9000 Sales
Settlements
Code Stage Description Month Month Cash Flow
Start Span Period
9001 - stage 1 0 - -
9002 - block 1 apartments 20 8 Feb-09 - Sep-09
9003 - block 2 apartments 20 8 Feb-09 - Sep-09
9005 - stage 2 0 - -
9006 - block 3 townhouses 28 8 Oct-09 - May-10
9007 - block 4 townhouses 28 8 Oct-09 - May-10
9008 - block 5 28 8 Oct-09 - May-10
9009 - block 6 28 8 Oct-09 - May-10
9010 - block 7 28 8 Oct-09 - May-10
9012 - stage 3 0 - -
9013 - block 8 houses 36 8 Jun-10 - Jan-11
9014 - block 9 36 8 Jun-10 - Jan-11
9015 - block 10 36 8 Jun-10 - Jan-11
TOTAL
FinancingFinancing Costs Month Month Cash Flow
Code Stage (to be entered Inclusive of GST) Start Span Period
10009 - establishment fee 2 1 Aug-07 - Aug-07
TOTAL
Presales/Exchanges
Settlements
- - - - - - - - - - - - - - - - - - - - - - - - - - - - - - - - - - - - - - - - - - - -
- - 2 2 2 2 2 2 2 2 2 2 2 2 - - - - - - 1 1 1 1 1 1 1 1 - - - - - - - - - - - - - - - -
- - 2 2 2 2 2 2 2 2 2 2 2 2 - - - - - - 1 1 1 1 1 1 1 1 - - - - - - - - - - - - - - - -
- - - - - - - - - - - - - - - - - - - - - - - - - - - - - - - - - - - - - - - - - - - -
- - - - - - - - - - - - - - 2 2 2 2 2 2 2 2 2 2 2 2 - - 1 1 1 1 1 1 1 1 - - - - - - - -
- - - - - - - - - - - - - - 2 2 2 2 2 2 2 2 2 2 2 2 - - 1 1 1 1 1 1 1 1 - - - - - - - -
- - - - - - - - - - - - - - 2 2 2 2 2 2 2 2 2 2 2 2 - - 1 1 1 1 1 1 1 1 - - - - - - - -
- - - - - - - - - - - - - - 2 2 2 2 2 2 2 2 2 2 2 2 - - 1 1 1 1 1 1 1 1 - - - - - - - -
- - - - - - - - - - - - - - 2 2 2 2 2 2 2 2 2 2 2 2 - - 1 1 1 1 1 1 1 1 - - - - - - - -
- - - - - - - - - - - - - - - - - - - - - - - - - - - - - - - - - - - - - - - - - - - -
- - - - - - - - - - - - - - - - - - - - - - 2 2 2 2 2 2 2 2 2 2 2 2 - - 1 1 1 1 1 1 1 1
- - - - - - - - - - - - - - - - - - - - - - 2 2 2 2 2 2 2 2 2 2 2 2 - - 1 1 1 1 1 1 1 1
- - - - - - - - - - - - - - - - - - - - - - 2 2 2 2 2 2 2 2 2 2 2 2 - - 1 1 1 1 1 1 1 1
- - 1 1 1 1 1 1 1 1 1 1 1 1 1 1 1 1 1 1 1 1 1 1 1 1 1 1 1 1 1 1 1 1 1 1 1 1 1 1 1 1 1 1
- - 1 - - - - - - - - - - - - - - - - - - - - - - - - - - - - - - - - - - - - - - - - -
- - 1 - - - - - - - - - - - - - - - - - - - - - - - - - - - - - - - - - - - - - - - - -
Estate Master DF Ver 5.3 Page 2 of 2 Pages File: New2.emdf Date of Report: 14/10/2013 12:17 PM
Financials Report Profit and Loss and Balance Sheet reporting.

Financials Report for Greenwood Park Estate Option 1 - Subdivision - Option 1 - Subdivision
Financial Reporting TOTAL
Estate Master Licensed to: Estate Master Administration
0 1 2 3 4 5 6 7 8 9
Jun-07 Jul-07 Aug-07 Sep-07 Oct-07 Nov-07 Dec-07 Jan-08 Feb-08 Mar-08
REVENUE RECOGNITION CALCULATION
Development Costs for WIP Calculation
Land and Acquisition (WIP) 13,968,672
Professional Fees (WIP) 1,072,427
Construction Costs (WIP) 6,883,311
Statutory Fees (WIP) 7,341,551
Miscellaneous Costs 1 (WIP) 454,545
Miscellaneous Costs 2 (WIP) -
Miscellaneous Costs 3 (WIP) -
Project Contingency (Reserve) (WIP) -
Land Holding Costs (WIP) 412,890
Pre-Sale Commissions (WIP) -
Financing Costs (exc Fees) (WIP) 90,000
Total Development Costs Incurred 30,223,396
Cumulative Total Development Costs Incurred
Other Costs
Selling Costs (WIP) 1,558,823
Leasing Costs (WIP) -
Interest (WIP) 2,511,306
Funding Application and Line Fees (WIP) -
Total Costs 34,293,525
Cumulative Total Costs
Directly Expensed through P&L -
Operating Costs -
Going through to WIP 34,293,525
Current Projected WIP 34,293,525
Cost Accruals/Adjustments (Cumulative)
Accruals
Retentions
Prepayments
Total Cumulative Cost Accruals/Adjustments
Net Movement -
Revenue Accruals/Adjustments (Cumulative)
Net Movement -
% COMPLETE CALCULATIONS
Total Dev Costs Post Adjust. (inc. Land and exc. Op Costs) 30,223,396
Total Expected Development Costs
% Cumulative Development Costs Incurred
Total Expected Revenue
Total Expected Area Sold
Total Sold based on Revenue Sold
PROFIT REALISATION
Revenue Collected Threshold 50.00%
Cumulative Cash Collected 38,932,411
Collections as a % of Total Revenue
Threshold Achieved
% Sold Threshold 80.00%
% Sold based on % Revenue Sold
Threshold Achieved
Construction Completion Threshold 80.00%
Total Cumulative Development Costs ex Interest 30,223,396
% Complete
Threshold Achieved
Profit Realisation Thresholds OK
Profit Realisation Analysis
% Sold based on % Revenue Sold
% Cumulative Development Costs Incurred
Profit Realised
Cumulative Profit Realised
2,162,308 - - - - - - - - -
- 38,744 42,094 39,609 41,283 39,723 39,609 39,609 39,723 39,609
- - - - - - - - - -
- - - - 80,661 - - - - -
- - 37,879 37,879 37,879 37,879 37,879 37,879 37,879 37,879
- - - - - - - - - -
- - - - - - - - - -
- - - - - - - - - -
- - 119,703 - - 5,523 - - 5,523 -
- - - - - - - - - -
- - 90,000 - - - - - - -
2,162,308 38,744 289,675 77,488 159,823 83,125 77,488 77,488 83,125 77,488
2,162,308 2,201,052 2,490,727 2,568,215 2,728,038 2,811,163 2,888,650 2,966,138 3,049,263 3,126,750
- - - - - 16,591 16,591 16,591 16,591 16,591
- - - - - - - - - -
- 1,014 1,262 3,076 3,578 4,595 5,245 5,864 6,487 7,149
- - - - - - - - - -
2,162,308 39,758 290,937 80,564 163,401 104,311 99,324 99,943 106,203 101,228
2,162,308 2,202,066 2,493,004 2,573,567 2,736,968 2,841,279 2,940,603 3,040,546 3,146,749 3,247,977
- - - - - - - - - -
- - - - - - - - - -
2,162,308 39,758 290,937 80,564 163,401 104,311 99,324 99,943 106,203 101,228
34,293,525 34,293,525 34,293,525 34,293,525 34,293,525 34,293,525 34,293,525 34,293,525 34,293,525 34,293,525
- - - - - - - - - -
- - - - - - - - - -
- - - - - - - - - -
- - - - - - - - - -
- - - - - - - - - -
- - - - - - - - - -
- - - - - - - - - -
2,162,308 2,201,052 2,490,727 2,568,215 2,728,038 2,811,163 2,888,650 2,966,138 3,049,263 3,126,750
30,223,396 30,223,396 30,223,396 30,223,396 30,223,396 30,223,396 30,223,396 30,223,396 30,223,396 30,223,396
7.15% 7.28% 8.24% 8.50% 9.03% 9.30% 9.56% 9.81% 10.09% 10.35%
42,825,652 42,825,652 42,825,652 42,825,652 42,825,652 42,825,652 42,825,652 42,825,652 42,825,652 42,825,652
95,250 95,250 95,250 95,250 95,250 95,250 95,250 95,250 95,250 95,250
42,825,652 42,825,652 42,825,652 42,825,652 42,825,652 42,825,652 42,825,652 42,825,652 42,825,652 42,825,652
- - - - - - - - - -
0.00% 0.00% 0.00% 0.00% 0.00% 0.00% 0.00% 0.00% 0.00% 0.00%
FALSE FALSE FALSE FALSE FALSE FALSE FALSE FALSE FALSE FALSE
0.00% 0.00% 1.57% 3.14% 4.72% 6.30% 7.88% 9.46% 11.05% 12.64%
FALSE FALSE FALSE FALSE FALSE FALSE FALSE FALSE FALSE FALSE
2,162,308 2,201,052 2,490,727 2,568,215 2,728,038 2,811,163 2,888,650 2,966,138 3,049,263 3,126,750
7.15% 7.28% 8.24% 8.50% 9.03% 9.30% 9.56% 9.81% 10.09% 10.35%
FALSE FALSE FALSE FALSE FALSE FALSE FALSE FALSE FALSE FALSE
FALSE FALSE FALSE FALSE FALSE FALSE FALSE FALSE FALSE FALSE
0.00% 0.00% 1.57% 3.14% 4.72% 6.30% 7.88% 9.46% 11.05% 12.64%
7.15% 7.28% 8.24% 8.50% 9.03% 9.30% 9.56% 9.81% 10.09% 10.35%
0.00% 0.00% 0.00% 0.00% 0.00% 0.00% 0.00% 0.00% 0.00% 0.00%
0.00% 0.00% 0.00% 0.00% 0.00% 0.00% 0.00% 0.00% 0.00% 0.00%
Estate Master DF Ver 5.3 Page 1 of 15 Pages File: New2.emdf Date of Report: 14/10/2013 12:23 PM
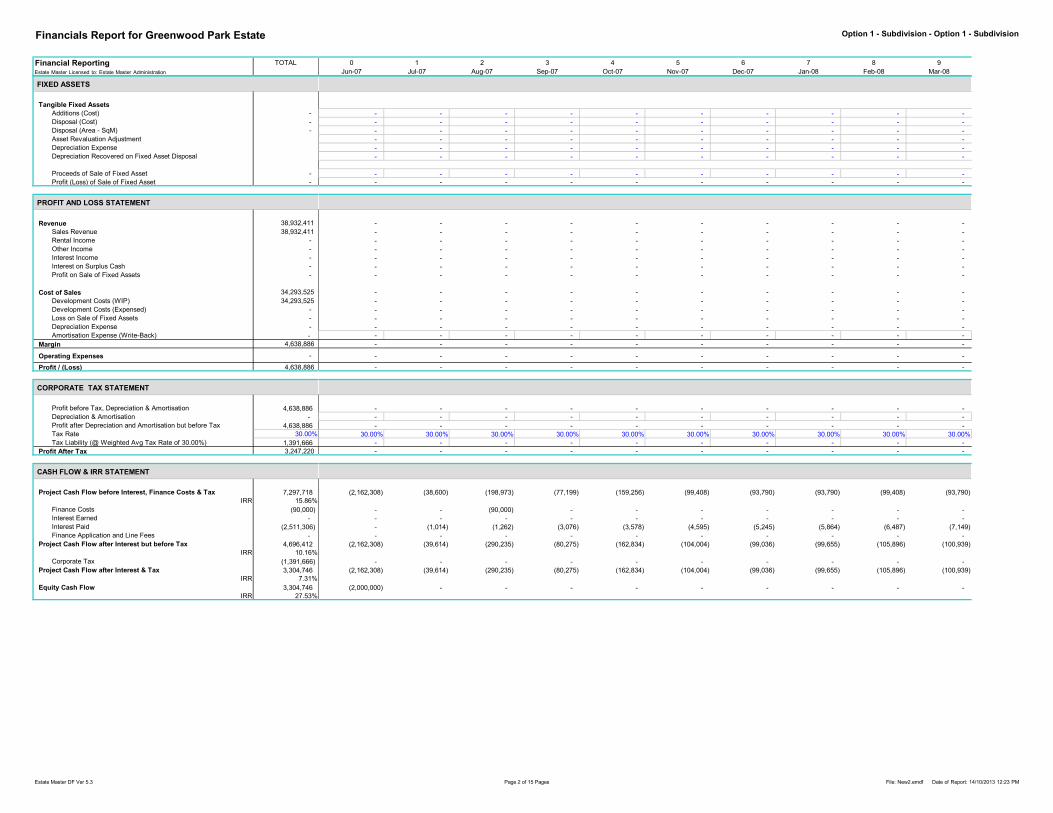
Financials Report for Greenwood Park Estate Option 1 - Subdivision - Option 1 - Subdivision
Financial Reporting TOTAL
Estate Master Licensed to: Estate Master Administration
0 1 2 3 4 5 6 7 8 9
Jun-07 Jul-07 Aug-07 Sep-07 Oct-07 Nov-07 Dec-07 Jan-08 Feb-08 Mar-08
FIXED ASSETS
Tangible Fixed Assets
Additions (Cost) -
Disposal (Cost) -
Disposal (Area - SqM) -
Asset Revaluation Adjustment
Depreciation Expense
Depreciation Recovered on Fixed Asset Disposal
Proceeds of Sale of Fixed Asset -
Profit (Loss) of Sale of Fixed Asset -
PROFIT AND LOSS STATEMENT
Revenue 38,932,411
Sales Revenue 38,932,411
Rental Income -
Other Income -
Interest Income -
Interest on Surplus Cash -
Profit on Sale of Fixed Assets -
Cost of Sales 34,293,525
Development Costs (WIP) 34,293,525
Development Costs (Expensed) -
Loss on Sale of Fixed Assets -
Depreciation Expense -
Amortisation Expense (Write-Back) -
Margin 4,638,886
Operating Expenses -
Profit / (Loss) 4,638,886
CORPORATE TAX STATEMENT
Profit before Tax, Depreciation & Amortisation 4,638,886
Depreciation & Amortisation -
Profit after Depreciation and Amortisation but before Tax 4,638,886
Tax Rate 30.00%
Tax Liability (@ Weighted Avg Tax Rate of 30.00%) 1,391,666
Profit After Tax 3,247,220
CASH FLOW & IRR STATEMENT
Project Cash Flow before Interest, Finance Costs & Tax 7,297,718
IRR 15.86%
Finance Costs (90,000)
Interest Earned -
Interest Paid (2,511,306)
Finance Application and Line Fees -
Project Cash Flow after Interest but before Tax 4,696,412
IRR 10.16%
Corporate Tax (1,391,666)
Project Cash Flow after Interest & Tax 3,304,746
IRR 7.31%
Equity Cash Flow 3,304,746
IRR 27.53%
- - - - - - - - - -
- - - - - - - - - -
- - - - - - - - - -
- - - - - - - - - -
- - - - - - - - - -
- - - - - - - - - -
- - - - - - - - - -
- - - - - - - - - -
- - - - - - - - - -
- - - - - - - - - -
- - - - - - - - - -
- - - - - - - - - -
- - - - - - - - - -
- - - - - - - - - -
- - - - - - - - - -
- - - - - - - - - -
- - - - - - - - - -
- - - - - - - - - -
- - - - - - - - - -
- - - - - - - - - -
- - - - - - - - - -
- - - - - - - - - -
- - - - - - - - - -
- - - - - - - - - -
- - - - - - - - - -
- - - - - - - - - -
- - - - - - - - - -
30.00% 30.00% 30.00% 30.00% 30.00% 30.00% 30.00% 30.00% 30.00% 30.00%
- - - - - - - - - -
- - - - - - - - - -
(2,162,308) (38,600) (198,973) (77,199) (159,256) (99,408) (93,790) (93,790) (99,408) (93,790)
- - (90,000) - - - - - - -
- - - - - - - - - -
- (1,014) (1,262) (3,076) (3,578) (4,595) (5,245) (5,864) (6,487) (7,149)
- - - - - - - - - -
(2,162,308) (39,614) (290,235) (80,275) (162,834) (104,004) (99,036) (99,655) (105,896) (100,939)
- - - - - - - - - -
(2,162,308) (39,614) (290,235) (80,275) (162,834) (104,004) (99,036) (99,655) (105,896) (100,939)
(2,000,000) - - - - - - - - -
0
Estate Master DF Ver 5.3 Page 2 of 15 Pages File: New2.emdf Date of Report: 14/10/2013 12:23 PM

Financials Report for Greenwood Park Estate Option 1 - Subdivision - Option 1 - Subdivision
Financial Reporting TOTAL
Estate Master Licensed to: Estate Master Administration
0 1 2 3 4 5 6 7 8 9
Jun-07 Jul-07 Aug-07 Sep-07 Oct-07 Nov-07 Dec-07 Jan-08 Feb-08 Mar-08
BALANCE SHEET
ASSETS
Current Assets
Cash and Bank
Accrued Income
Work In Progress
Prepayments,Deposits and Other Receivables
GST Receivable
Total Current Assets
Long Term Assets
Tangible Fixed Assets - Cost (Owned Assets)
Tangible Fixed Assets - Revaluation Adj. (Owned Assets)
Less - Acc.Dep (Owned Assets) & Amortisation
Long Term Assets Total
TOTAL ASSETS
LIABILITIES
Current Liabilities
Accounts Payables
Deferred Income
Accrued Expenses
GST Payable
Total Current Liabilities
Long Term Liabilities
Long Term Loans
Intercompany Loans
Total Long Term Liabilities
TOTAL LIABILITIES
NET ASSETS
SHAREHOLDERS' EQUITY
Project Capital -
Asset Revaluation Reserve
Dividends
Retained Earnings (Accumulated Deficit)
P&L - Current Year
TOTAL SHAREHOLDERS' EQUITY
Check Balance -
SUPPORTING CALCULATIONS
Work In Progress / (Accrued Expenses)
Deferred Income - Short Term / (Accrued Income)
Intercompany Loans / (Dividends)
Interest on Equity
Charged
Paid
Cumulative
Calculate P+L for Current Financial Year
Tax on Sales
Tax on Rents
Tax on Other Income
Tax on Selling Costs
Tax on Leasing Costs
Cumulative Manual inputs - Sales Revenue
Corporate Tax Liability
Paid Monthly
Paid Quarterly
Paid Bi-Annually
Paid Annually
Selected Option
Realise Tax Benefit at time of Loss
Roll forward loss until profit is realised
Selected Option
With Reforecasting
Last Period used in Financials Sheet 43
- - - - - - - - - -
- - - - - - - - - -
2,162,308 2,201,922 2,492,157 2,572,432 2,735,266 2,839,269 2,938,305 3,037,960 3,143,855 3,244,794
- - - - - - - - - -
- - - - - - - - - -
2,162,308 2,201,922 2,492,157 2,572,432 2,735,266 2,839,269 2,938,305 3,037,960 3,143,855 3,244,794
- - - - - - - - - -
- - - - - - - - - -
- - - - - - - - - -
- - - - - - - - - -
2,162,308 2,201,922 2,492,157 2,572,432 2,735,266 2,839,269 2,938,305 3,037,960 3,143,855 3,244,794
- - - - - - - - - -
- - - - - - - - - -
- - - - - - - - - -
- - - - - - - - - -
- - - - - - - - - -
162,308 201,922 492,157 572,432 735,266 839,269 938,305 1,037,960 1,143,855 1,244,794
- - - - - - - - - -
162,308 201,922 492,157 572,432 735,266 839,269 938,305 1,037,960 1,143,855 1,244,794
162,308 201,922 492,157 572,432 735,266 839,269 938,305 1,037,960 1,143,855 1,244,794
2,000,000 2,000,000 2,000,000 2,000,000 2,000,000 2,000,000 2,000,000 2,000,000 2,000,000 2,000,000
2,000,000 2,000,000 2,000,000 2,000,000 2,000,000 2,000,000 2,000,000 2,000,000 2,000,000 2,000,000
- - - - - - - - - -
- - - - - - - - - -
- - - - - - - - - -
- - - - - - - - - -
2,000,000 2,000,000 2,000,000 2,000,000 2,000,000 2,000,000 2,000,000 2,000,000 2,000,000 2,000,000
- - - - - - - - - -
2,162,308 2,201,922 2,492,157 2,572,432 2,735,266 2,839,269 2,938,305 3,037,960 3,143,855 3,244,794
- - - - - - - - - -
2,000,000 2,000,000 2,000,000 2,000,000 2,000,000 2,000,000 2,000,000 2,000,000 2,000,000 2,000,000
- - - - - - - - - -
- - - - - - - - - -
- - - - - - - - - -
FALSE TRUE FALSE FALSE FALSE FALSE FALSE FALSE FALSE FALSE
- - - - - - - - - -
- - - - - - - - - -
- - - - - - - - - -
- - - - - 1,659 1,659 1,659 1,659 1,659
- - - - - - - - - -
- - - - - - - - - -
TRUE TRUE TRUE TRUE TRUE TRUE TRUE TRUE TRUE TRUE
FALSE FALSE FALSE FALSE FALSE FALSE FALSE FALSE FALSE FALSE
FALSE FALSE FALSE FALSE FALSE FALSE FALSE FALSE FALSE FALSE
FALSE FALSE FALSE FALSE FALSE FALSE FALSE FALSE FALSE FALSE
TRUE TRUE TRUE TRUE TRUE TRUE TRUE TRUE TRUE TRUE
- - - - - - - - - -
- - - - - - - - - -
- - - - - - - - - -
- - - - - - - - - -
- - - - - - - - - -
Estate Master DF Ver 5.3 Page 3 of 15 Pages File: New2.emdf Date of Report: 14/10/2013 12:23 PM
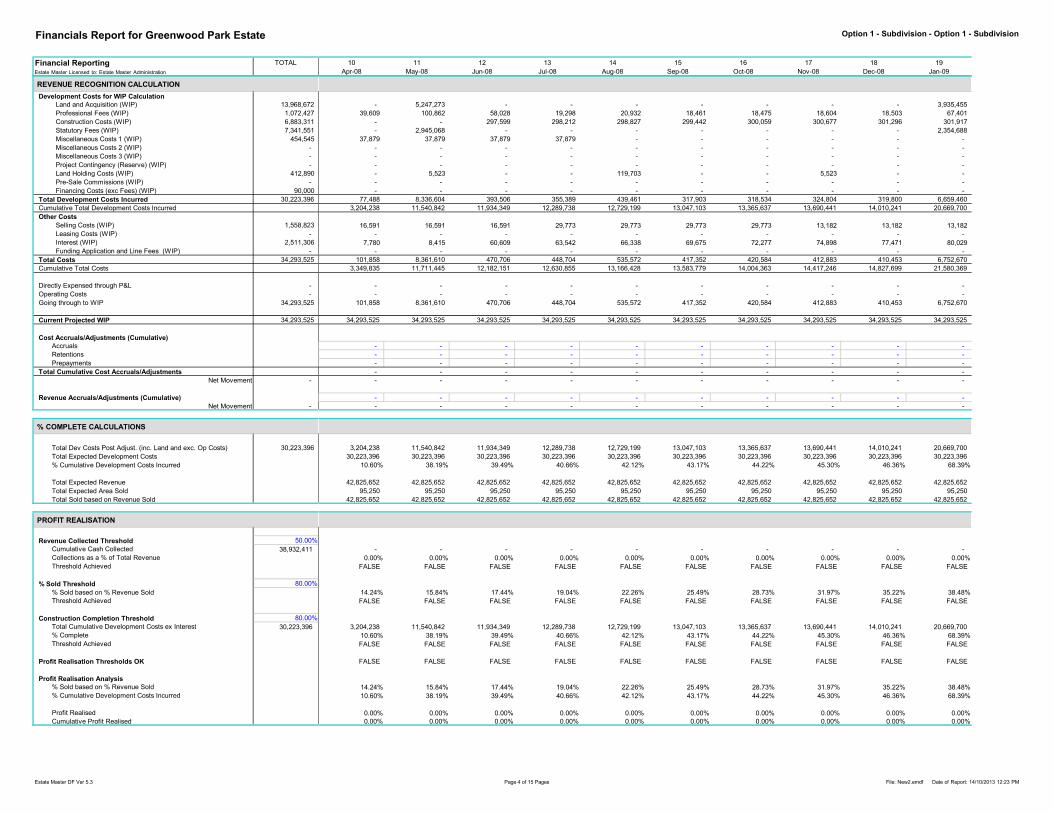
Financials Report for Greenwood Park Estate Option 1 - Subdivision - Option 1 - Subdivision
Financial Reporting TOTAL
Estate Master Licensed to: Estate Master Administration
10 11 12 13 14 15 16 17 18 19
Apr-08 May-08 Jun-08 Jul-08 Aug-08 Sep-08 Oct-08 Nov-08 Dec-08 Jan-09
REVENUE RECOGNITION CALCULATION
Development Costs for WIP Calculation
Land and Acquisition (WIP) 13,968,672
Professional Fees (WIP) 1,072,427
Construction Costs (WIP) 6,883,311
Statutory Fees (WIP) 7,341,551
Miscellaneous Costs 1 (WIP) 454,545
Miscellaneous Costs 2 (WIP) -
Miscellaneous Costs 3 (WIP) -
Project Contingency (Reserve) (WIP) -
Land Holding Costs (WIP) 412,890
Pre-Sale Commissions (WIP) -
Financing Costs (exc Fees) (WIP) 90,000
Total Development Costs Incurred 30,223,396
Cumulative Total Development Costs Incurred
Other Costs
Selling Costs (WIP) 1,558,823
Leasing Costs (WIP) -
Interest (WIP) 2,511,306
Funding Application and Line Fees (WIP) -
Total Costs 34,293,525
Cumulative Total Costs
Directly Expensed through P&L -
Operating Costs -
Going through to WIP 34,293,525
Current Projected WIP 34,293,525
Cost Accruals/Adjustments (Cumulative)
Accruals
Retentions
Prepayments
Total Cumulative Cost Accruals/Adjustments
Net Movement -
Revenue Accruals/Adjustments (Cumulative)
Net Movement -
% COMPLETE CALCULATIONS
Total Dev Costs Post Adjust. (inc. Land and exc. Op Costs) 30,223,396
Total Expected Development Costs
% Cumulative Development Costs Incurred
Total Expected Revenue
Total Expected Area Sold
Total Sold based on Revenue Sold
PROFIT REALISATION
Revenue Collected Threshold 50.00%
Cumulative Cash Collected 38,932,411
Collections as a % of Total Revenue
Threshold Achieved
% Sold Threshold 80.00%
% Sold based on % Revenue Sold
Threshold Achieved
Construction Completion Threshold 80.00%
Total Cumulative Development Costs ex Interest 30,223,396
% Complete
Threshold Achieved
Profit Realisation Thresholds OK
Profit Realisation Analysis
% Sold based on % Revenue Sold
% Cumulative Development Costs Incurred
Profit Realised
Cumulative Profit Realised
- 5,247,273 - - - - - - - 3,935,455
39,609 100,862 58,028 19,298 20,932 18,461 18,475 18,604 18,503 67,401
- - 297,599 298,212 298,827 299,442 300,059 300,677 301,296 301,917
- 2,945,068 - - - - - - - 2,354,688
37,879 37,879 37,879 37,879 - - - - - -
- - - - - - - - - -
- - - - - - - - - -
- - - - - - - - - -
- 5,523 - - 119,703 - - 5,523 - -
- - - - - - - - - -
- - - - - - - - - -
77,488 8,336,604 393,506 355,389 439,461 317,903 318,534 324,804 319,800 6,659,460
3,204,238 11,540,842 11,934,349 12,289,738 12,729,199 13,047,103 13,365,637 13,690,441 14,010,241 20,669,700
16,591 16,591 16,591 29,773 29,773 29,773 29,773 13,182 13,182 13,182
- - - - - - - - - -
7,780 8,415 60,609 63,542 66,338 69,675 72,277 74,898 77,471 80,029
- - - - - - - - - -
101,858 8,361,610 470,706 448,704 535,572 417,352 420,584 412,883 410,453 6,752,670
3,349,835 11,711,445 12,182,151 12,630,855 13,166,428 13,583,779 14,004,363 14,417,246 14,827,699 21,580,369
- - - - - - - - - -
- - - - - - - - - -
101,858 8,361,610 470,706 448,704 535,572 417,352 420,584 412,883 410,453 6,752,670
34,293,525 34,293,525 34,293,525 34,293,525 34,293,525 34,293,525 34,293,525 34,293,525 34,293,525 34,293,525
- - - - - - - - - -
- - - - - - - - - -
- - - - - - - - - -
- - - - - - - - - -
- - - - - - - - - -
- - - - - - - - - -
- - - - - - - - - -
3,204,238 11,540,842 11,934,349 12,289,738 12,729,199 13,047,103 13,365,637 13,690,441 14,010,241 20,669,700
30,223,396 30,223,396 30,223,396 30,223,396 30,223,396 30,223,396 30,223,396 30,223,396 30,223,396 30,223,396
10.60% 38.19% 39.49% 40.66% 42.12% 43.17% 44.22% 45.30% 46.36% 68.39%
42,825,652 42,825,652 42,825,652 42,825,652 42,825,652 42,825,652 42,825,652 42,825,652 42,825,652 42,825,652
95,250 95,250 95,250 95,250 95,250 95,250 95,250 95,250 95,250 95,250
42,825,652 42,825,652 42,825,652 42,825,652 42,825,652 42,825,652 42,825,652 42,825,652 42,825,652 42,825,652
- - - - - - - - - -
0.00% 0.00% 0.00% 0.00% 0.00% 0.00% 0.00% 0.00% 0.00% 0.00%
FALSE FALSE FALSE FALSE FALSE FALSE FALSE FALSE FALSE FALSE
14.24% 15.84% 17.44% 19.04% 22.26% 25.49% 28.73% 31.97% 35.22% 38.48%
FALSE FALSE FALSE FALSE FALSE FALSE FALSE FALSE FALSE FALSE
3,204,238 11,540,842 11,934,349 12,289,738 12,729,199 13,047,103 13,365,637 13,690,441 14,010,241 20,669,700
10.60% 38.19% 39.49% 40.66% 42.12% 43.17% 44.22% 45.30% 46.36% 68.39%
FALSE FALSE FALSE FALSE FALSE FALSE FALSE FALSE FALSE FALSE
FALSE FALSE FALSE FALSE FALSE FALSE FALSE FALSE FALSE FALSE
14.24% 15.84% 17.44% 19.04% 22.26% 25.49% 28.73% 31.97% 35.22% 38.48%
10.60% 38.19% 39.49% 40.66% 42.12% 43.17% 44.22% 45.30% 46.36% 68.39%
0.00% 0.00% 0.00% 0.00% 0.00% 0.00% 0.00% 0.00% 0.00% 0.00%
0.00% 0.00% 0.00% 0.00% 0.00% 0.00% 0.00% 0.00% 0.00% 0.00%
Estate Master DF Ver 5.3 Page 4 of 15 Pages File: New2.emdf Date of Report: 14/10/2013 12:23 PM

Financials Report for Greenwood Park Estate Option 1 - Subdivision - Option 1 - Subdivision
Financial Reporting TOTAL
Estate Master Licensed to: Estate Master Administration
10 11 12 13 14 15 16 17 18 19
Apr-08 May-08 Jun-08 Jul-08 Aug-08 Sep-08 Oct-08 Nov-08 Dec-08 Jan-09
FIXED ASSETS
Tangible Fixed Assets
Additions (Cost) -
Disposal (Cost) -
Disposal (Area - SqM) -
Asset Revaluation Adjustment
Depreciation Expense
Depreciation Recovered on Fixed Asset Disposal
Proceeds of Sale of Fixed Asset -
Profit (Loss) of Sale of Fixed Asset -
PROFIT AND LOSS STATEMENT
Revenue 38,932,411
Sales Revenue 38,932,411
Rental Income -
Other Income -
Interest Income -
Interest on Surplus Cash -
Profit on Sale of Fixed Assets -
Cost of Sales 34,293,525
Development Costs (WIP) 34,293,525
Development Costs (Expensed) -
Loss on Sale of Fixed Assets -
Depreciation Expense -
Amortisation Expense (Write-Back) -
Margin 4,638,886
Operating Expenses -
Profit / (Loss) 4,638,886
CORPORATE TAX STATEMENT
Profit before Tax, Depreciation & Amortisation 4,638,886
Depreciation & Amortisation -
Profit after Depreciation and Amortisation but before Tax 4,638,886
Tax Rate 30.00%
Tax Liability (@ Weighted Avg Tax Rate of 30.00%) 1,391,666
Profit After Tax 3,247,220
CASH FLOW & IRR STATEMENT
Project Cash Flow before Interest, Finance Costs & Tax 7,297,718
IRR 15.86%
Finance Costs (90,000)
Interest Earned -
Interest Paid (2,511,306)
Finance Application and Line Fees -
Project Cash Flow after Interest but before Tax 4,696,412
IRR 10.16%
Corporate Tax (1,391,666)
Project Cash Flow after Interest & Tax 3,304,746
IRR 7.31%
Equity Cash Flow 3,304,746
IRR 27.53%
- - - - - - - - - -
- - - - - - - - - -
- - - - - - - - - -
- - - - - - - - - -
- - - - - - - - - -
- - - - - - - - - -
- - - - - - - - - -
- - - - - - - - - -
- - - - - - - - - -
- - - - - - - - - -
- - - - - - - - - -
- - - - - - - - - -
- - - - - - - - - -
- - - - - - - - - -
- - - - - - - - - -
- - - - - - - - - -
- - - - - - - - - -
- - - - - - - - - -
- - - - - - - - - -
- - - - - - - - - -
- - - - - - - - - -
- - - - - - - - - -
- - - - - - - - - -
- - - - - - - - - -
- - - - - - - - - -
- - - - - - - - - -
- - - - - - - - - -
30.00% 30.00% 30.00% 30.00% 30.00% 30.00% 30.00% 30.00% 30.00% 30.00%
- - - - - - - - - -
- - - - - - - - - -
(93,790) (8,342,698) (408,633) (383,840) (467,639) (346,493) (347,122) (336,779) (331,792) (6,663,302)
- - - - - - - - - -
- - - - - - - - - -
(7,780) (8,415) (60,609) (63,542) (66,338) (69,675) (72,277) (74,898) (77,471) (80,029)
- - - - - - - - - -
(101,570) (8,351,113) (469,242) (447,382) (533,978) (416,169) (419,398) (411,677) (409,263) (6,743,331)
- - - - - - - - - -
(101,570) (8,351,113) (469,242) (447,382) (533,978) (416,169) (419,398) (411,677) (409,263) (6,743,331)
- - - - - - - - - -
Estate Master DF Ver 5.3 Page 5 of 15 Pages File: New2.emdf Date of Report: 14/10/2013 12:23 PM

Financials Report for Greenwood Park Estate Option 1 - Subdivision - Option 1 - Subdivision
Financial Reporting TOTAL
Estate Master Licensed to: Estate Master Administration
10 11 12 13 14 15 16 17 18 19
Apr-08 May-08 Jun-08 Jul-08 Aug-08 Sep-08 Oct-08 Nov-08 Dec-08 Jan-09
BALANCE SHEET
ASSETS
Current Assets
Cash and Bank
Accrued Income
Work In Progress
Prepayments,Deposits and Other Receivables
GST Receivable
Total Current Assets
Long Term Assets
Tangible Fixed Assets - Cost (Owned Assets)
Tangible Fixed Assets - Revaluation Adj. (Owned Assets)
Less - Acc.Dep (Owned Assets) & Amortisation
Long Term Assets Total
TOTAL ASSETS
LIABILITIES
Current Liabilities
Accounts Payables
Deferred Income
Accrued Expenses
GST Payable
Total Current Liabilities
Long Term Liabilities
Long Term Loans
Intercompany Loans
Total Long Term Liabilities
TOTAL LIABILITIES
NET ASSETS
SHAREHOLDERS' EQUITY
Project Capital -
Asset Revaluation Reserve
Dividends
Retained Earnings (Accumulated Deficit)
P&L - Current Year
TOTAL SHAREHOLDERS' EQUITY
Check Balance -
SUPPORTING CALCULATIONS
Work In Progress / (Accrued Expenses)
Deferred Income - Short Term / (Accrued Income)
Intercompany Loans / (Dividends)
Interest on Equity
Charged
Paid
Cumulative
Calculate P+L for Current Financial Year
Tax on Sales
Tax on Rents
Tax on Other Income
Tax on Selling Costs
Tax on Leasing Costs
Cumulative Manual inputs - Sales Revenue
Corporate Tax Liability
Paid Monthly
Paid Quarterly
Paid Bi-Annually
Paid Annually
Selected Option
Realise Tax Benefit at time of Loss
Roll forward loss until profit is realised
Selected Option
With Reforecasting
Last Period used in Financials Sheet 43
- - - - - - - - - -
- - - - - - - - - -
3,346,364 11,697,477 12,166,719 12,614,101 13,148,078 13,564,247 13,983,645 14,395,322 14,804,585 21,547,915
- - - - - - - - - -
- - - - - - - - - -
3,346,364 11,697,477 12,166,719 12,614,101 13,148,078 13,564,247 13,983,645 14,395,322 14,804,585 21,547,915
- - - - - - - - - -
- - - - - - - - - -
- - - - - - - - - -
- - - - - - - - - -
3,346,364 11,697,477 12,166,719 12,614,101 13,148,078 13,564,247 13,983,645 14,395,322 14,804,585 21,547,915
- - - - - - - - - -
- - - - - - - - - -
- - - - - - - - - -
- - - - - - - - - -
- - - - - - - - - -
1,346,364 9,697,477 10,166,719 10,614,101 11,148,078 11,564,247 11,983,645 12,395,322 12,804,585 19,547,915
- - - - - - - - - -
1,346,364 9,697,477 10,166,719 10,614,101 11,148,078 11,564,247 11,983,645 12,395,322 12,804,585 19,547,915
1,346,364 9,697,477 10,166,719 10,614,101 11,148,078 11,564,247 11,983,645 12,395,322 12,804,585 19,547,915
2,000,000 2,000,000 2,000,000 2,000,000 2,000,000 2,000,000 2,000,000 2,000,000 2,000,000 2,000,000
2,000,000 2,000,000 2,000,000 2,000,000 2,000,000 2,000,000 2,000,000 2,000,000 2,000,000 2,000,000
- - - - - - - - - -
- - - - - - - - - -
- - - - - - - - - -
- - - - - - - - - -
2,000,000 2,000,000 2,000,000 2,000,000 2,000,000 2,000,000 2,000,000 2,000,000 2,000,000 2,000,000
- - - - - - - - - -
3,346,364 11,697,477 12,166,719 12,614,101 13,148,078 13,564,247 13,983,645 14,395,322 14,804,585 21,547,915
- - - - - - - - - -
2,000,000 2,000,000 2,000,000 2,000,000 2,000,000 2,000,000 2,000,000 2,000,000 2,000,000 2,000,000
- - - - - - - - - -
- - - - - - - - - -
- - - - - - - - - -
FALSE FALSE FALSE TRUE FALSE FALSE FALSE FALSE FALSE FALSE
- - - - - - - - - -
- - - - - - - - - -
- - - - - - - - - -
1,659 1,659 1,659 2,977 2,977 2,977 2,977 1,318 1,318 1,318
- - - - - - - - - -
- - - - - - - - - -
TRUE TRUE TRUE TRUE TRUE TRUE TRUE TRUE TRUE TRUE
FALSE FALSE FALSE FALSE FALSE FALSE FALSE FALSE FALSE FALSE
FALSE FALSE FALSE FALSE FALSE FALSE FALSE FALSE FALSE FALSE
FALSE FALSE FALSE FALSE FALSE FALSE FALSE FALSE FALSE FALSE
TRUE TRUE TRUE TRUE TRUE TRUE TRUE TRUE TRUE TRUE
- - - - - - - - - -
- - - - - - - - - -
- - - - - - - - - -
- - - - - - - - - -
- - - - - - - - - -
Estate Master DF Ver 5.3 Page 6 of 15 Pages File: New2.emdf Date of Report: 14/10/2013 12:23 PM
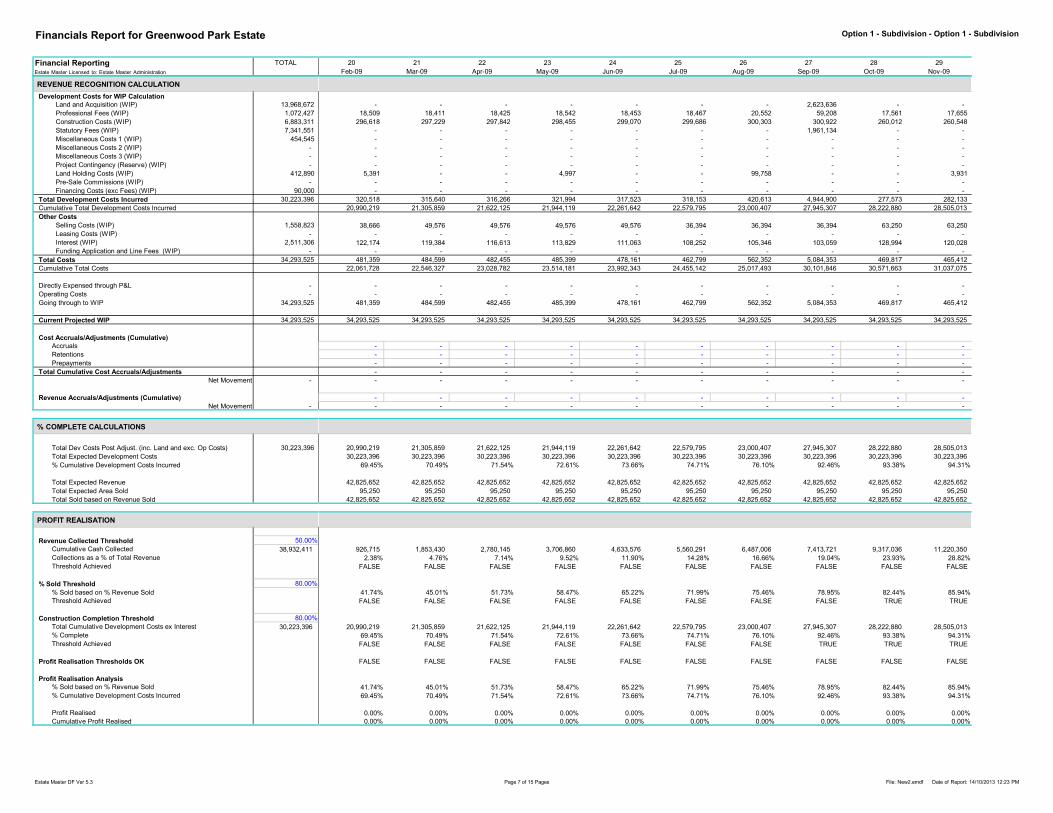
Financials Report for Greenwood Park Estate Option 1 - Subdivision - Option 1 - Subdivision
Financial Reporting TOTAL
Estate Master Licensed to: Estate Master Administration
20 21 22 23 24 25 26 27 28 29
Feb-09 Mar-09 Apr-09 May-09 Jun-09 Jul-09 Aug-09 Sep-09 Oct-09 Nov-09
REVENUE RECOGNITION CALCULATION
Development Costs for WIP Calculation
Land and Acquisition (WIP) 13,968,672
Professional Fees (WIP) 1,072,427
Construction Costs (WIP) 6,883,311
Statutory Fees (WIP) 7,341,551
Miscellaneous Costs 1 (WIP) 454,545
Miscellaneous Costs 2 (WIP) -
Miscellaneous Costs 3 (WIP) -
Project Contingency (Reserve) (WIP) -
Land Holding Costs (WIP) 412,890
Pre-Sale Commissions (WIP) -
Financing Costs (exc Fees) (WIP) 90,000
Total Development Costs Incurred 30,223,396
Cumulative Total Development Costs Incurred
Other Costs
Selling Costs (WIP) 1,558,823
Leasing Costs (WIP) -
Interest (WIP) 2,511,306
Funding Application and Line Fees (WIP) -
Total Costs 34,293,525
Cumulative Total Costs
Directly Expensed through P&L -
Operating Costs -
Going through to WIP 34,293,525
Current Projected WIP 34,293,525
Cost Accruals/Adjustments (Cumulative)
Accruals
Retentions
Prepayments
Total Cumulative Cost Accruals/Adjustments
Net Movement -
Revenue Accruals/Adjustments (Cumulative)
Net Movement -
% COMPLETE CALCULATIONS
Total Dev Costs Post Adjust. (inc. Land and exc. Op Costs) 30,223,396
Total Expected Development Costs
% Cumulative Development Costs Incurred
Total Expected Revenue
Total Expected Area Sold
Total Sold based on Revenue Sold
PROFIT REALISATION
Revenue Collected Threshold 50.00%
Cumulative Cash Collected 38,932,411
Collections as a % of Total Revenue
Threshold Achieved
% Sold Threshold 80.00%
% Sold based on % Revenue Sold
Threshold Achieved
Construction Completion Threshold 80.00%
Total Cumulative Development Costs ex Interest 30,223,396
% Complete
Threshold Achieved
Profit Realisation Thresholds OK
Profit Realisation Analysis
% Sold based on % Revenue Sold
% Cumulative Development Costs Incurred
Profit Realised
Cumulative Profit Realised
- - - - - - - 2,623,636 - -
18,509 18,411 18,425 18,542 18,453 18,467 20,552 59,208 17,561 17,655
296,618 297,229 297,842 298,455 299,070 299,686 300,303 300,922 260,012 260,548
- - - - - - - 1,961,134 - -
- - - - - - - - - -
- - - - - - - - - -
- - - - - - - - - -
- - - - - - - - - -
5,391 - - 4,997 - - 99,758 - - 3,931
- - - - - - - - - -
- - - - - - - - - -
320,518 315,640 316,266 321,994 317,523 318,153 420,613 4,944,900 277,573 282,133
20,990,219 21,305,859 21,622,125 21,944,119 22,261,642 22,579,795 23,000,407 27,945,307 28,222,880 28,505,013
38,666 49,576 49,576 49,576 49,576 36,394 36,394 36,394 63,250 63,250
- - - - - - - - - -
122,174 119,384 116,613 113,829 111,063 108,252 105,346 103,059 128,994 120,028
- - - - - - - - - -
481,359 484,599 482,455 485,399 478,161 462,799 562,352 5,084,353 469,817 465,412
22,061,728 22,546,327 23,028,782 23,514,181 23,992,343 24,455,142 25,017,493 30,101,846 30,571,663 31,037,075
- - - - - - - - - -
- - - - - - - - - -
481,359 484,599 482,455 485,399 478,161 462,799 562,352 5,084,353 469,817 465,412
34,293,525 34,293,525 34,293,525 34,293,525 34,293,525 34,293,525 34,293,525 34,293,525 34,293,525 34,293,525
- - - - - - - - - -
- - - - - - - - - -
- - - - - - - - - -
- - - - - - - - - -
- - - - - - - - - -
- - - - - - - - - -
- - - - - - - - - -
20,990,219 21,305,859 21,622,125 21,944,119 22,261,642 22,579,795 23,000,407 27,945,307 28,222,880 28,505,013
30,223,396 30,223,396 30,223,396 30,223,396 30,223,396 30,223,396 30,223,396 30,223,396 30,223,396 30,223,396
69.45% 70.49% 71.54% 72.61% 73.66% 74.71% 76.10% 92.46% 93.38% 94.31%
42,825,652 42,825,652 42,825,652 42,825,652 42,825,652 42,825,652 42,825,652 42,825,652 42,825,652 42,825,652
95,250 95,250 95,250 95,250 95,250 95,250 95,250 95,250 95,250 95,250
42,825,652 42,825,652 42,825,652 42,825,652 42,825,652 42,825,652 42,825,652 42,825,652 42,825,652 42,825,652
926,715 1,853,430 2,780,145 3,706,860 4,633,576 5,560,291 6,487,006 7,413,721 9,317,036 11,220,350
2.38% 4.76% 7.14% 9.52% 11.90% 14.28% 16.66% 19.04% 23.93% 28.82%
FALSE FALSE FALSE FALSE FALSE FALSE FALSE FALSE FALSE FALSE
41.74% 45.01% 51.73% 58.47% 65.22% 71.99% 75.46% 78.95% 82.44% 85.94%
FALSE FALSE FALSE FALSE FALSE FALSE FALSE FALSE TRUE TRUE
20,990,219 21,305,859 21,622,125 21,944,119 22,261,642 22,579,795 23,000,407 27,945,307 28,222,880 28,505,013
69.45% 70.49% 71.54% 72.61% 73.66% 74.71% 76.10% 92.46% 93.38% 94.31%
FALSE FALSE FALSE FALSE FALSE FALSE FALSE TRUE TRUE TRUE
FALSE FALSE FALSE FALSE FALSE FALSE FALSE FALSE FALSE FALSE
41.74% 45.01% 51.73% 58.47% 65.22% 71.99% 75.46% 78.95% 82.44% 85.94%
69.45% 70.49% 71.54% 72.61% 73.66% 74.71% 76.10% 92.46% 93.38% 94.31%
0.00% 0.00% 0.00% 0.00% 0.00% 0.00% 0.00% 0.00% 0.00% 0.00%
0.00% 0.00% 0.00% 0.00% 0.00% 0.00% 0.00% 0.00% 0.00% 0.00%
Estate Master DF Ver 5.3 Page 7 of 15 Pages File: New2.emdf Date of Report: 14/10/2013 12:23 PM

Financials Report for Greenwood Park Estate Option 1 - Subdivision - Option 1 - Subdivision
Financial Reporting TOTAL
Estate Master Licensed to: Estate Master Administration
20 21 22 23 24 25 26 27 28 29
Feb-09 Mar-09 Apr-09 May-09 Jun-09 Jul-09 Aug-09 Sep-09 Oct-09 Nov-09
FIXED ASSETS
Tangible Fixed Assets
Additions (Cost) -
Disposal (Cost) -
Disposal (Area - SqM) -
Asset Revaluation Adjustment
Depreciation Expense
Depreciation Recovered on Fixed Asset Disposal
Proceeds of Sale of Fixed Asset -
Profit (Loss) of Sale of Fixed Asset -
PROFIT AND LOSS STATEMENT
Revenue 38,932,411
Sales Revenue 38,932,411
Rental Income -
Other Income -
Interest Income -
Interest on Surplus Cash -
Profit on Sale of Fixed Assets -
Cost of Sales 34,293,525
Development Costs (WIP) 34,293,525
Development Costs (Expensed) -
Loss on Sale of Fixed Assets -
Depreciation Expense -
Amortisation Expense (Write-Back) -
Margin 4,638,886
Operating Expenses -
Profit / (Loss) 4,638,886
CORPORATE TAX STATEMENT
Profit before Tax, Depreciation & Amortisation 4,638,886
Depreciation & Amortisation -
Profit after Depreciation and Amortisation but before Tax 4,638,886
Tax Rate 30.00%
Tax Liability (@ Weighted Avg Tax Rate of 30.00%) 1,391,666
Profit After Tax 3,247,220
CASH FLOW & IRR STATEMENT
Project Cash Flow before Interest, Finance Costs & Tax 7,297,718
IRR 15.86%
Finance Costs (90,000)
Interest Earned -
Interest Paid (2,511,306)
Finance Application and Line Fees -
Project Cash Flow after Interest but before Tax 4,696,412
IRR 10.16%
Corporate Tax (1,391,666)
Project Cash Flow after Interest & Tax 3,304,746
IRR 7.31%
Equity Cash Flow 3,304,746
IRR 27.53%
- - - - - - - - - -
- - - - - - - - - -
- - - - - - - - - -
- - - - - - - - - -
- - - - - - - - - -
- - - - - - - - - -
- - - - - - - - - -
- - - - - - - - - -
- - - - - - - - - -
- - - - - - - - - -
- - - - - - - - - -
- - - - - - - - - -
- - - - - - - - - -
- - - - - - - - - -
- - - - - - - - - -
- - - - - - - - - -
- - - - - - - - - -
- - - - - - - - - -
- - - - - - - - - -
- - - - - - - - - -
- - - - - - - - - -
- - - - - - - - - -
- - - - - - - - - -
- - - - - - - - - -
- - - - - - - - - -
- - - - - - - - - -
- - - - - - - - - -
30.00% 30.00% 30.00% 30.00% 30.00% 30.00% 30.00% 30.00% 30.00% 30.00%
- - - - - - - - - -
- - - - - - - - - -
568,721 562,674 562,050 556,342 560,798 573,353 471,240 (4,046,605) 1,563,525 1,558,980
- - - - - - - - - -
- - - - - - - - - -
(122,174) (119,384) (116,613) (113,829) (111,063) (108,252) (105,346) (103,059) (128,994) (120,028)
- - - - - - - - - -
446,547 443,290 445,437 442,513 449,735 465,100 365,895 (4,149,663) 1,434,530 1,438,951
- - - - - - - - - -
446,547 443,290 445,437 442,513 449,735 465,100 365,895 (4,149,663) 1,434,530 1,438,951
- - - - - - - - - -
Estate Master DF Ver 5.3 Page 8 of 15 Pages File: New2.emdf Date of Report: 14/10/2013 12:23 PM
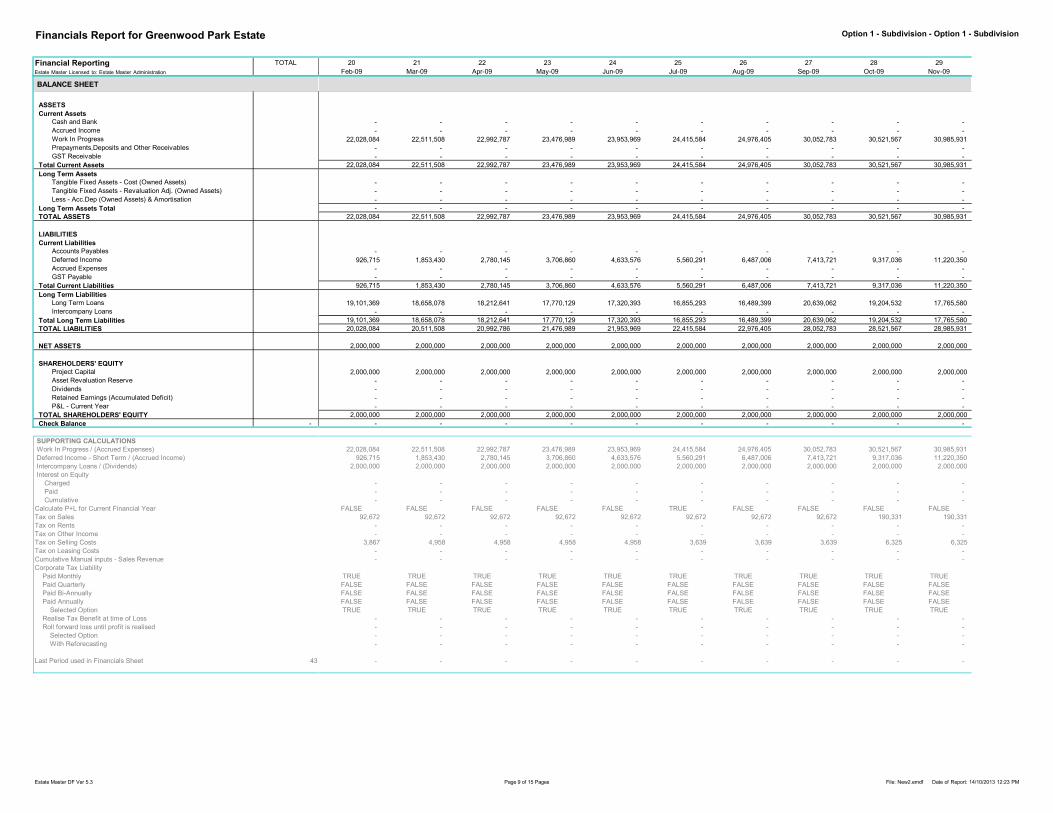
Financials Report for Greenwood Park Estate Option 1 - Subdivision - Option 1 - Subdivision
Financial Reporting TOTAL
Estate Master Licensed to: Estate Master Administration
20 21 22 23 24 25 26 27 28 29
Feb-09 Mar-09 Apr-09 May-09 Jun-09 Jul-09 Aug-09 Sep-09 Oct-09 Nov-09
BALANCE SHEET
ASSETS
Current Assets
Cash and Bank
Accrued Income
Work In Progress
Prepayments,Deposits and Other Receivables
GST Receivable
Total Current Assets
Long Term Assets
Tangible Fixed Assets - Cost (Owned Assets)
Tangible Fixed Assets - Revaluation Adj. (Owned Assets)
Less - Acc.Dep (Owned Assets) & Amortisation
Long Term Assets Total
TOTAL ASSETS
LIABILITIES
Current Liabilities
Accounts Payables
Deferred Income
Accrued Expenses
GST Payable
Total Current Liabilities
Long Term Liabilities
Long Term Loans
Intercompany Loans
Total Long Term Liabilities
TOTAL LIABILITIES
NET ASSETS
SHAREHOLDERS' EQUITY
Project Capital -
Asset Revaluation Reserve
Dividends
Retained Earnings (Accumulated Deficit)
P&L - Current Year
TOTAL SHAREHOLDERS' EQUITY
Check Balance -
SUPPORTING CALCULATIONS
Work In Progress / (Accrued Expenses)
Deferred Income - Short Term / (Accrued Income)
Intercompany Loans / (Dividends)
Interest on Equity
Charged
Paid
Cumulative
Calculate P+L for Current Financial Year
Tax on Sales
Tax on Rents
Tax on Other Income
Tax on Selling Costs
Tax on Leasing Costs
Cumulative Manual inputs - Sales Revenue
Corporate Tax Liability
Paid Monthly
Paid Quarterly
Paid Bi-Annually
Paid Annually
Selected Option
Realise Tax Benefit at time of Loss
Roll forward loss until profit is realised
Selected Option
With Reforecasting
Last Period used in Financials Sheet 43
- - - - - - - - - -
- - - - - - - - - -
22,028,084 22,511,508 22,992,787 23,476,989 23,953,969 24,415,584 24,976,405 30,052,783 30,521,567 30,985,931
- - - - - - - - - -
- - - - - - - - - -
22,028,084 22,511,508 22,992,787 23,476,989 23,953,969 24,415,584 24,976,405 30,052,783 30,521,567 30,985,931
- - - - - - - - - -
- - - - - - - - - -
- - - - - - - - - -
- - - - - - - - - -
22,028,084 22,511,508 22,992,787 23,476,989 23,953,969 24,415,584 24,976,405 30,052,783 30,521,567 30,985,931
- - - - - - - - - -
926,715 1,853,430 2,780,145 3,706,860 4,633,576 5,560,291 6,487,006 7,413,721 9,317,036 11,220,350
- - - - - - - - - -
- - - - - - - - - -
926,715 1,853,430 2,780,145 3,706,860 4,633,576 5,560,291 6,487,006 7,413,721 9,317,036 11,220,350
19,101,369 18,658,078 18,212,641 17,770,129 17,320,393 16,855,293 16,489,399 20,639,062 19,204,532 17,765,580
- - - - - - - - - -
19,101,369 18,658,078 18,212,641 17,770,129 17,320,393 16,855,293 16,489,399 20,639,062 19,204,532 17,765,580
20,028,084 20,511,508 20,992,786 21,476,989 21,953,969 22,415,584 22,976,405 28,052,783 28,521,567 28,985,931
2,000,000 2,000,000 2,000,000 2,000,000 2,000,000 2,000,000 2,000,000 2,000,000 2,000,000 2,000,000
2,000,000 2,000,000 2,000,000 2,000,000 2,000,000 2,000,000 2,000,000 2,000,000 2,000,000 2,000,000
- - - - - - - - - -
- - - - - - - - - -
- - - - - - - - - -
- - - - - - - - - -
2,000,000 2,000,000 2,000,000 2,000,000 2,000,000 2,000,000 2,000,000 2,000,000 2,000,000 2,000,000
- - - - - - - - - -
22,028,084 22,511,508 22,992,787 23,476,989 23,953,969 24,415,584 24,976,405 30,052,783 30,521,567 30,985,931
926,715 1,853,430 2,780,145 3,706,860 4,633,576 5,560,291 6,487,006 7,413,721 9,317,036 11,220,350
2,000,000 2,000,000 2,000,000 2,000,000 2,000,000 2,000,000 2,000,000 2,000,000 2,000,000 2,000,000
- - - - - - - - - -
- - - - - - - - - -
- - - - - - - - - -
FALSE FALSE FALSE FALSE FALSE TRUE FALSE FALSE FALSE FALSE
92,672 92,672 92,672 92,672 92,672 92,672 92,672 92,672 190,331 190,331
- - - - - - - - - -
- - - - - - - - - -
3,867 4,958 4,958 4,958 4,958 3,639 3,639 3,639 6,325 6,325
- - - - - - - - - -
- - - - - - - - - -
TRUE TRUE TRUE TRUE TRUE TRUE TRUE TRUE TRUE TRUE
FALSE FALSE FALSE FALSE FALSE FALSE FALSE FALSE FALSE FALSE
FALSE FALSE FALSE FALSE FALSE FALSE FALSE FALSE FALSE FALSE
FALSE FALSE FALSE FALSE FALSE FALSE FALSE FALSE FALSE FALSE
TRUE TRUE TRUE TRUE TRUE TRUE TRUE TRUE TRUE TRUE
- - - - - - - - - -
- - - - - - - - - -
- - - - - - - - - -
- - - - - - - - - -
- - - - - - - - - -
Estate Master DF Ver 5.3 Page 9 of 15 Pages File: New2.emdf Date of Report: 14/10/2013 12:23 PM

Financials Report for Greenwood Park Estate Option 1 - Subdivision - Option 1 - Subdivision
Financial Reporting TOTAL
Estate Master Licensed to: Estate Master Administration
30 31 32 33 34 35 36 37 38 39
Dec-09 Jan-10 Feb-10 Mar-10 Apr-10 May-10 Jun-10 Jul-10 Aug-10 Sep-10
FIXED ASSETS
Tangible Fixed Assets
Additions (Cost) -
Disposal (Cost) -
Disposal (Area - SqM) -
Asset Revaluation Adjustment
Depreciation Expense
Depreciation Recovered on Fixed Asset Disposal
Proceeds of Sale of Fixed Asset -
Profit (Loss) of Sale of Fixed Asset -
PROFIT AND LOSS STATEMENT
Revenue 38,932,411
Sales Revenue 38,932,411
Rental Income -
Other Income -
Interest Income -
Interest on Surplus Cash -
Profit on Sale of Fixed Assets -
Cost of Sales 34,293,525
Development Costs (WIP) 34,293,525
Development Costs (Expensed) -
Loss on Sale of Fixed Assets -
Depreciation Expense -
Amortisation Expense (Write-Back) -
Margin 4,638,886
Operating Expenses -
Profit / (Loss) 4,638,886
CORPORATE TAX STATEMENT
Profit before Tax, Depreciation & Amortisation 4,638,886
Depreciation & Amortisation -
Profit after Depreciation and Amortisation but before Tax 4,638,886
Tax Rate 30.00%
Tax Liability (@ Weighted Avg Tax Rate of 30.00%) 1,391,666
Profit After Tax 3,247,220
CASH FLOW & IRR STATEMENT
Project Cash Flow before Interest, Finance Costs & Tax 7,297,718
IRR 15.86%
Finance Costs (90,000)
Interest Earned -
Interest Paid (2,511,306)
Finance Application and Line Fees -
Project Cash Flow after Interest but before Tax 4,696,412
IRR 10.16%
Corporate Tax (1,391,666)
Project Cash Flow after Interest & Tax 3,304,746
IRR 7.31%
Equity Cash Flow 3,304,746
IRR 27.53%
- - - - - - - - - -
- - - - - - - - - -
- - - - - - - - - -
- - - - - - - - - -
- - - - - - - - - -
- - - - - - - - - -
- - - - - - - - - -
- - - - - - - - - -
- - - - 38,524,919 365,566 - - 41,166 -
- - - - 38,524,919 365,566 - - 41,166 -
- - - - - - - - - -
- - - - - - - - - -
- - - - - - - - - -
- - - - - - - - - -
- - - - - - - - - -
- - - - 33,934,587 322,008 - - 36,261 -
- - - - 33,934,587 322,008 - - 36,261 -
- - - - - - - - - -
- - - - - - - - - -
- - - - - - - - - -
- - - - - - - - - -
- - - - 4,590,332 43,558 - - 4,905 -
- - - - - - - - - -
- - - - 4,590,332 43,558 - - 4,905 -
- - - - 4,590,332 43,558 - - 4,905 -
- - - - - - - - - -
- - - - 4,590,332 43,558 - - 4,905 -
30.00% 30.00% 30.00% 30.00% 30.00% 30.00% 30.00% 30.00% 30.00% 30.00%
- - - - 1,377,100 13,067 - - 1,472 -
- - - - 3,213,233 30,491 - - 3,434 -
1,562,432 1,561,884 1,558,160 1,571,694 1,571,142 1,568,239 1,980,517 1,980,517 1,948,668 1,980,517
- - - - - - - - - -
- - - - - - - - - -
(111,035) (101,964) (92,839) (83,681) (74,381) (73,633) (64,373) (52,397) (40,347) (28,429)
- - - - - - - - - -
1,451,397 1,459,920 1,465,321 1,488,013 1,496,761 1,494,606 1,916,144 1,928,120 1,908,321 1,952,088
- - - - (1,377,100) (13,067) - - (1,472) -
1,451,397 1,459,920 1,465,321 1,488,013 119,662 1,481,538 1,916,144 1,928,120 1,906,850 1,952,088
- - - - - - - - - -
Estate Master DF Ver 5.3 Page 11 of 15 Pages File: New2.emdf Date of Report: 14/10/2013 12:23 PM

Financials Report for Greenwood Park Estate Option 1 - Subdivision - Option 1 - Subdivision
Financial Reporting TOTAL
Estate Master Licensed to: Estate Master Administration
30 31 32 33 34 35 36 37 38 39
Dec-09 Jan-10 Feb-10 Mar-10 Apr-10 May-10 Jun-10 Jul-10 Aug-10 Sep-10
BALANCE SHEET
ASSETS
Current Assets
Cash and Bank
Accrued Income
Work In Progress
Prepayments,Deposits and Other Receivables
GST Receivable
Total Current Assets
Long Term Assets
Tangible Fixed Assets - Cost (Owned Assets)
Tangible Fixed Assets - Revaluation Adj. (Owned Assets)
Less - Acc.Dep (Owned Assets) & Amortisation
Long Term Assets Total
TOTAL ASSETS
LIABILITIES
Current Liabilities
Accounts Payables
Deferred Income
Accrued Expenses
GST Payable
Total Current Liabilities
Long Term Liabilities
Long Term Loans
Intercompany Loans
Total Long Term Liabilities
TOTAL LIABILITIES
NET ASSETS
SHAREHOLDERS' EQUITY
Project Capital -
Asset Revaluation Reserve
Dividends
Retained Earnings (Accumulated Deficit)
P&L - Current Year
TOTAL SHAREHOLDERS' EQUITY
Check Balance -
SUPPORTING CALCULATIONS
Work In Progress / (Accrued Expenses)
Deferred Income - Short Term / (Accrued Income)
Intercompany Loans / (Dividends)
Interest on Equity
Charged
Paid
Cumulative
Calculate P+L for Current Financial Year
Tax on Sales
Tax on Rents
Tax on Other Income
Tax on Selling Costs
Tax on Leasing Costs
Cumulative Manual inputs - Sales Revenue
Corporate Tax Liability
Paid Monthly
Paid Quarterly
Paid Bi-Annually
Paid Annually
Selected Option
Realise Tax Benefit at time of Loss
Roll forward loss until profit is realised
Selected Option
With Reforecasting
Last Period used in Financials Sheet 43
- - - - - - - - - -
- - - - 17,787,995 16,250,246 14,213,725 12,177,203 10,181,848 8,145,326
31,437,848 31,881,243 32,319,237 32,734,539 - - - - - -
- - - - - - - - - -
- - - - - - - - - -
31,437,848 31,881,243 32,319,237 32,734,539 17,787,995 16,250,246 14,213,725 12,177,203 10,181,848 8,145,326
- - - - - - - - - -
- - - - - - - - - -
- - - - - - - - - -
- - - - - - - - - -
31,437,848 31,881,243 32,319,237 32,734,539 17,787,995 16,250,246 14,213,725 12,177,203 10,181,848 8,145,326
- - - - - - - - - -
13,123,665 15,026,980 16,930,295 18,833,609 - - - - - -
- - - - 793,494 706,793 586,415 478,014 386,075 301,641
- - - - - - - - - -
13,123,665 15,026,980 16,930,295 18,833,609 793,494 706,793 586,415 478,014 386,075 301,641
16,314,183 14,854,263 13,388,942 11,900,930 11,781,268 10,299,730 8,383,586 6,455,466 4,548,617 2,596,528
- - - - - - - - - -
16,314,183 14,854,263 13,388,942 11,900,930 11,781,268 10,299,730 8,383,586 6,455,466 4,548,617 2,596,528
29,437,848 29,881,243 30,319,237 30,734,539 12,574,763 11,006,523 8,970,001 6,933,480 4,934,691 2,898,170
2,000,000 2,000,000 2,000,000 2,000,000 5,213,233 5,243,723 5,243,723 5,243,723 5,247,157 5,247,157
2,000,000 2,000,000 2,000,000 2,000,000 2,000,000 2,000,000 2,000,000 2,000,000 2,000,000 2,000,000
- - - - - - - - - -
- - - - - - - - - -
- - - - - - - 3,243,723 3,243,723 3,243,723
- - - - 3,213,233 3,243,723 3,243,723 - 3,434 3,434
2,000,000 2,000,000 2,000,000 2,000,000 5,213,233 5,243,723 5,243,723 5,243,723 5,247,157 5,247,157
- - - - - - - - - -
31,437,848 31,881,243 32,319,237 32,734,539 (793,494) (706,793) (586,415) (478,014) (386,075) (301,641)
13,123,665 15,026,980 16,930,295 18,833,609 (17,787,995) (16,250,246) (14,213,725) (12,177,203) (10,181,848) (8,145,326)
2,000,000 2,000,000 2,000,000 2,000,000 2,000,000 2,000,000 2,000,000 2,000,000 2,000,000 2,000,000
- - - - - - - - - -
- - - - - - - - - -
- - - - - - - - - -
FALSE FALSE FALSE FALSE FALSE FALSE FALSE TRUE FALSE FALSE
190,331 190,331 190,331 190,331 190,331 190,331 203,652 203,652 203,652 203,652
- - - - - - - - - -
- - - - - - - - - -
6,325 6,325 6,325 5,234 5,234 5,234 5,600 5,600 5,600 5,600
- - - - - - - - - -
- - - - - - - - - -
TRUE TRUE TRUE TRUE TRUE TRUE TRUE TRUE TRUE TRUE
FALSE FALSE FALSE FALSE FALSE FALSE FALSE FALSE FALSE FALSE
FALSE FALSE FALSE FALSE FALSE FALSE FALSE FALSE FALSE FALSE
FALSE FALSE FALSE FALSE FALSE FALSE FALSE FALSE FALSE FALSE
TRUE TRUE TRUE TRUE TRUE TRUE TRUE TRUE TRUE TRUE
- - - - 1,377,100 13,067 - - 1,472 -
- - - - 1,377,100 13,067 - - 1,472 -
- - - - 1,377,100 13,067 - - 1,472 -
- - - - 1,377,100 13,067 - - 1,472 -
- - - - 1,377,100 13,067 - - 1,472 -
Estate Master DF Ver 5.3 Page 12 of 15 Pages File: New2.emdf Date of Report: 14/10/2013 12:23 PM

Financials Report for Greenwood Park Estate Option 1 - Subdivision - Option 1 - Subdivision
Financial Reporting TOTAL
Estate Master Licensed to: Estate Master Administration
30 31 32 33 34 35 36 37 38 39
Dec-09 Jan-10 Feb-10 Mar-10 Apr-10 May-10 Jun-10 Jul-10 Aug-10 Sep-10
REVENUE RECOGNITION CALCULATION
Development Costs for WIP Calculation
Land and Acquisition (WIP) 13,968,672
Professional Fees (WIP) 1,072,427
Construction Costs (WIP) 6,883,311
Statutory Fees (WIP) 7,341,551
Miscellaneous Costs 1 (WIP) 454,545
Miscellaneous Costs 2 (WIP) -
Miscellaneous Costs 3 (WIP) -
Project Contingency (Reserve) (WIP) -
Land Holding Costs (WIP) 412,890
Pre-Sale Commissions (WIP) -
Financing Costs (exc Fees) (WIP) 90,000
Total Development Costs Incurred 30,223,396
Cumulative Total Development Costs Incurred
Other Costs
Selling Costs (WIP) 1,558,823
Leasing Costs (WIP) -
Interest (WIP) 2,511,306
Funding Application and Line Fees (WIP) -
Total Costs 34,293,525
Cumulative Total Costs
Directly Expensed through P&L -
Operating Costs -
Going through to WIP 34,293,525
Current Projected WIP 34,293,525
Cost Accruals/Adjustments (Cumulative)
Accruals
Retentions
Prepayments
Total Cumulative Cost Accruals/Adjustments
Net Movement -
Revenue Accruals/Adjustments (Cumulative)
Net Movement -
% COMPLETE CALCULATIONS
Total Dev Costs Post Adjust. (inc. Land and exc. Op Costs) 30,223,396
Total Expected Development Costs
% Cumulative Development Costs Incurred
Total Expected Revenue
Total Expected Area Sold
Total Sold based on Revenue Sold
PROFIT REALISATION
Revenue Collected Threshold 50.00%
Cumulative Cash Collected 38,932,411
Collections as a % of Total Revenue
Threshold Achieved
% Sold Threshold 80.00%
% Sold based on % Revenue Sold
Threshold Achieved
Construction Completion Threshold 80.00%
Total Cumulative Development Costs ex Interest 30,223,396
% Complete
Threshold Achieved
Profit Realisation Thresholds OK
Profit Realisation Analysis
% Sold based on % Revenue Sold
% Cumulative Development Costs Incurred
Profit Realised
Cumulative Profit Realised
- - - - - - - - - -
17,585 17,597 17,675 17,622 17,634 17,695 - - 650 -
261,084 261,622 262,161 262,701 263,242 263,784 - - - -
- - - - - - - - - -
- - - - - - - - - -
- - - - - - - - - -
- - - - - - - - - -
- - - - - - - - - -
- - 3,121 - - 2,311 - - 31,308 -
- - - - - - - - - -
- - - - - - - - - -
278,669 279,220 282,957 280,323 280,877 283,790 - - 31,958 -
28,783,683 29,062,902 29,345,859 29,626,182 29,907,058 30,190,849 30,190,849 30,190,849 30,222,806 30,222,806
63,250 63,250 63,250 52,341 52,341 52,341 56,004 56,004 56,004 56,004
- - - - - - - - - -
111,035 101,964 92,839 83,681 74,381 73,633 64,373 52,397 40,347 28,429
- - - - - - - - - -
452,955 444,433 439,046 416,345 407,599 409,764 120,378 108,402 128,309 84,433
31,490,030 31,934,463 32,373,509 32,789,854 33,197,453 33,607,217 33,727,595 33,835,996 33,964,305 34,048,738
- - - - - - - - - -
- - - - - - - - - -
452,955 444,433 439,046 416,345 407,599 409,764 120,378 108,402 128,309 84,433
34,293,525 34,293,525 34,293,525 34,293,525 34,293,525 34,293,525 34,293,525 34,293,525 34,293,525 34,293,525
- - - - - - - - - -
- - - - - - - - - -
- - - - - - - - - -
- - - - - - - - - -
- - - - - - - - - -
- - - - - - - - - -
- - - - - - - - - -
28,783,683 29,062,902 29,345,859 29,626,182 29,907,058 30,190,849 30,190,849 30,190,849 30,222,806 30,222,806
30,223,396 30,223,396 30,223,396 30,223,396 30,223,396 30,223,396 30,223,396 30,223,396 30,223,396 30,223,396
95.24% 96.16% 97.10% 98.02% 98.95% 99.89% 99.89% 99.89% 100.00% 100.00%
42,825,652 42,825,652 42,825,652 42,825,652 42,825,652 42,825,652 42,825,652 42,825,652 42,825,652 42,825,652
95,250 95,250 95,250 95,250 95,250 95,250 95,250 95,250 95,250 95,250
42,825,652 42,825,652 42,825,652 42,825,652 42,825,652 42,825,652 42,825,652 42,825,652 42,825,652 42,825,652
13,123,665 15,026,980 16,930,295 18,833,609 20,736,924 22,640,239 24,676,760 26,713,282 28,749,803 30,786,325
33.71% 38.60% 43.49% 48.38% 53.26% 58.15% 63.38% 68.61% 73.85% 79.08%
FALSE FALSE FALSE FALSE TRUE TRUE TRUE TRUE TRUE TRUE
89.44% 92.95% 96.47% 100.00% 100.00% 100.00% 100.00% 100.00% 100.00% 100.00%
TRUE TRUE TRUE TRUE TRUE TRUE TRUE TRUE TRUE TRUE
28,783,683 29,062,902 29,345,859 29,626,182 29,907,058 30,190,849 30,190,849 30,190,849 30,222,806 30,222,806
95.24% 96.16% 97.10% 98.02% 98.95% 99.89% 99.89% 99.89% 100.00% 100.00%
TRUE TRUE TRUE TRUE TRUE TRUE TRUE TRUE TRUE TRUE
FALSE FALSE FALSE FALSE TRUE TRUE TRUE TRUE TRUE TRUE
89.44% 92.95% 96.47% 100.00% 100.00% 100.00% 100.00% 100.00% 100.00% 100.00%
95.24% 96.16% 97.10% 98.02% 98.95% 99.89% 99.89% 99.89% 100.00% 100.00%
0.00% 0.00% 0.00% 0.00% 98.95% 0.94% 0.00% 0.00% 0.11% 0.00%
0.00% 0.00% 0.00% 0.00% 98.95% 99.89% 99.89% 99.89% 100.00% 100.00%
Estate Master DF Ver 5.3 Page 10 of 15 Pages File: New2.emdf Date of Report: 14/10/2013 12:23 PM
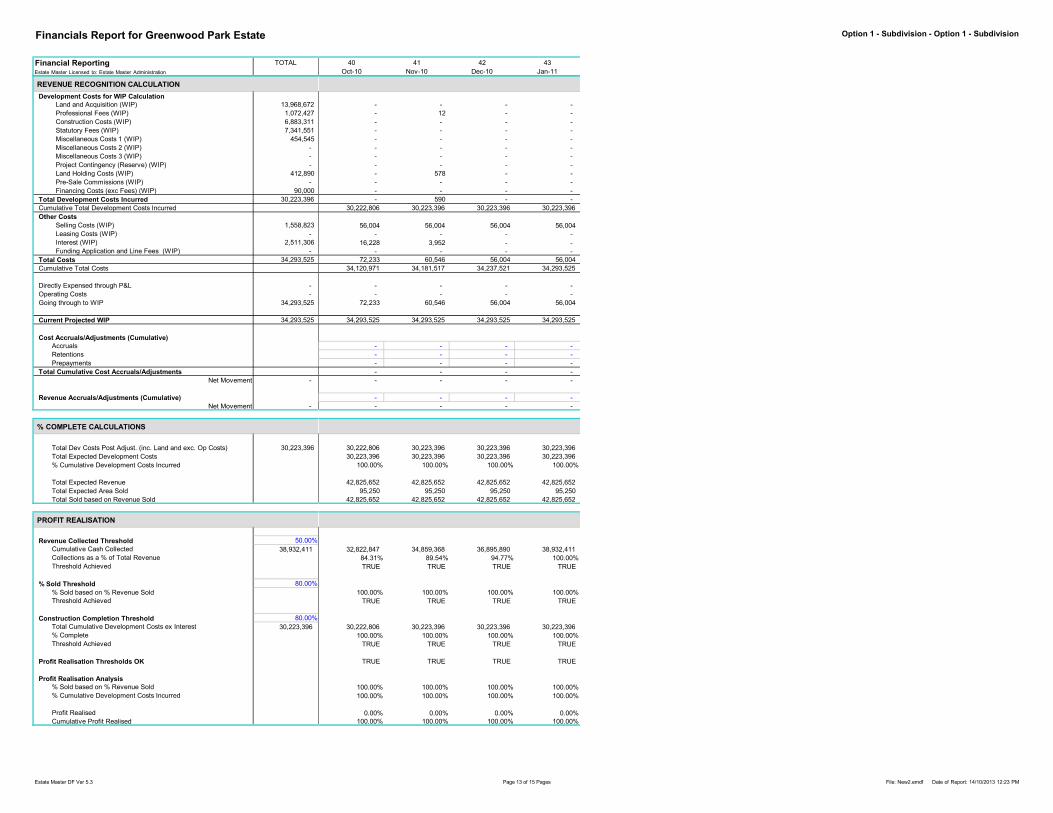
Financials Report for Greenwood Park Estate Option 1 - Subdivision - Option 1 - Subdivision
Financial Reporting TOTAL
Estate Master Licensed to: Estate Master Administration
40 41 42 43
Oct-10 Nov-10 Dec-10 Jan-11
REVENUE RECOGNITION CALCULATION
Development Costs for WIP Calculation
Land and Acquisition (WIP) 13,968,672
Professional Fees (WIP) 1,072,427
Construction Costs (WIP) 6,883,311
Statutory Fees (WIP) 7,341,551
Miscellaneous Costs 1 (WIP) 454,545
Miscellaneous Costs 2 (WIP) -
Miscellaneous Costs 3 (WIP) -
Project Contingency (Reserve) (WIP) -
Land Holding Costs (WIP) 412,890
Pre-Sale Commissions (WIP) -
Financing Costs (exc Fees) (WIP) 90,000
Total Development Costs Incurred 30,223,396
Cumulative Total Development Costs Incurred
Other Costs
Selling Costs (WIP) 1,558,823
Leasing Costs (WIP) -
Interest (WIP) 2,511,306
Funding Application and Line Fees (WIP) -
Total Costs 34,293,525
Cumulative Total Costs
Directly Expensed through P&L -
Operating Costs -
Going through to WIP 34,293,525
Current Projected WIP 34,293,525
Cost Accruals/Adjustments (Cumulative)
Accruals
Retentions
Prepayments
Total Cumulative Cost Accruals/Adjustments
Net Movement -
Revenue Accruals/Adjustments (Cumulative)
Net Movement -
% COMPLETE CALCULATIONS
Total Dev Costs Post Adjust. (inc. Land and exc. Op Costs) 30,223,396
Total Expected Development Costs
% Cumulative Development Costs Incurred
Total Expected Revenue
Total Expected Area Sold
Total Sold based on Revenue Sold
PROFIT REALISATION
Revenue Collected Threshold 50.00%
Cumulative Cash Collected 38,932,411
Collections as a % of Total Revenue
Threshold Achieved
% Sold Threshold 80.00%
% Sold based on % Revenue Sold
Threshold Achieved
Construction Completion Threshold 80.00%
Total Cumulative Development Costs ex Interest 30,223,396
% Complete
Threshold Achieved
Profit Realisation Thresholds OK
Profit Realisation Analysis
% Sold based on % Revenue Sold
% Cumulative Development Costs Incurred
Profit Realised
Cumulative Profit Realised
- - - -
- 12 - -
- - - -
- - - -
- - - -
- - - -
- - - -
- - - -
- 578 - -
- - - -
- - - -
- 590 - -
30,222,806 30,223,396 30,223,396 30,223,396
56,004 56,004 56,004 56,004
- - - -
16,228 3,952 - -
- - - -
72,233 60,546 56,004 56,004
34,120,971 34,181,517 34,237,521 34,293,525
- - - -
- - - -
72,233 60,546 56,004 56,004
34,293,525 34,293,525 34,293,525 34,293,525
- - - -
- - - -
- - - -
- - - -
- - - -
- - - -
- - - -
30,222,806 30,223,396 30,223,396 30,223,396
30,223,396 30,223,396 30,223,396 30,223,396
100.00% 100.00% 100.00% 100.00%
42,825,652 42,825,652 42,825,652 42,825,652
95,250 95,250 95,250 95,250
42,825,652 42,825,652 42,825,652 42,825,652
32,822,847 34,859,368 36,895,890 38,932,411
84.31% 89.54% 94.77% 100.00%
TRUE TRUE TRUE TRUE
100.00% 100.00% 100.00% 100.00%
TRUE TRUE TRUE TRUE
30,222,806 30,223,396 30,223,396 30,223,396
100.00% 100.00% 100.00% 100.00%
TRUE TRUE TRUE TRUE
TRUE TRUE TRUE TRUE
100.00% 100.00% 100.00% 100.00%
100.00% 100.00% 100.00% 100.00%
0.00% 0.00% 0.00% 0.00%
100.00% 100.00% 100.00% 100.00%
Estate Master DF Ver 5.3 Page 13 of 15 Pages File: New2.emdf Date of Report: 14/10/2013 12:23 PM

Financials Report for Greenwood Park Estate Option 1 - Subdivision - Option 1 - Subdivision
Financial Reporting TOTAL
Estate Master Licensed to: Estate Master Administration
40 41 42 43
Oct-10 Nov-10 Dec-10 Jan-11
FIXED ASSETS
Tangible Fixed Assets
Additions (Cost) -
Disposal (Cost) -
Disposal (Area - SqM) -
Asset Revaluation Adjustment
Depreciation Expense
Depreciation Recovered on Fixed Asset Disposal
Proceeds of Sale of Fixed Asset -
Profit (Loss) of Sale of Fixed Asset -
PROFIT AND LOSS STATEMENT
Revenue 38,932,411
Sales Revenue 38,932,411
Rental Income -
Other Income -
Interest Income -
Interest on Surplus Cash -
Profit on Sale of Fixed Assets -
Cost of Sales 34,293,525
Development Costs (WIP) 34,293,525
Development Costs (Expensed) -
Loss on Sale of Fixed Assets -
Depreciation Expense -
Amortisation Expense (Write-Back) -
Margin 4,638,886
Operating Expenses -
Profit / (Loss) 4,638,886
CORPORATE TAX STATEMENT
Profit before Tax, Depreciation & Amortisation 4,638,886
Depreciation & Amortisation -
Profit after Depreciation and Amortisation but before Tax 4,638,886
Tax Rate 30.00%
Tax Liability (@ Weighted Avg Tax Rate of 30.00%) 1,391,666
Profit After Tax 3,247,220
CASH FLOW & IRR STATEMENT
Project Cash Flow before Interest, Finance Costs & Tax 7,297,718
IRR 15.86%
Finance Costs (90,000)
Interest Earned -
Interest Paid (2,511,306)
Finance Application and Line Fees -
Project Cash Flow after Interest but before Tax 4,696,412
IRR 10.16%
Corporate Tax (1,391,666)
Project Cash Flow after Interest & Tax 3,304,746
IRR 7.31%
Equity Cash Flow 3,304,746
IRR 27.53%
- - - -
- - - -
- - - -
- - - -
- - - -
- - - -
- - - -
- - - -
- 760 - -
- 760 - -
- - - -
- - - -
- - - -
- - - -
- - - -
- 669 - -
- 669 - -
- - - -
- - - -
- - - -
- - - -
- 91 - -
- - - -
- 91 - -
- 91 - -
- - - -
- 91 - -
30.00% 30.00% 30.00% 30.00%
- 27 - -
- 63 - -
1,980,517 1,979,929 1,980,517 1,980,517
- - - -
- - - -
(16,228) (3,952) - -
- - - -
1,964,289 1,975,978 1,980,517 1,980,517
- (27) - -
1,964,289 1,975,951 1,980,517 1,980,517
- - - 5,304,746
Estate Master DF Ver 5.3 Page 14 of 15 Pages File: New2.emdf Date of Report: 14/10/2013 12:23 PM
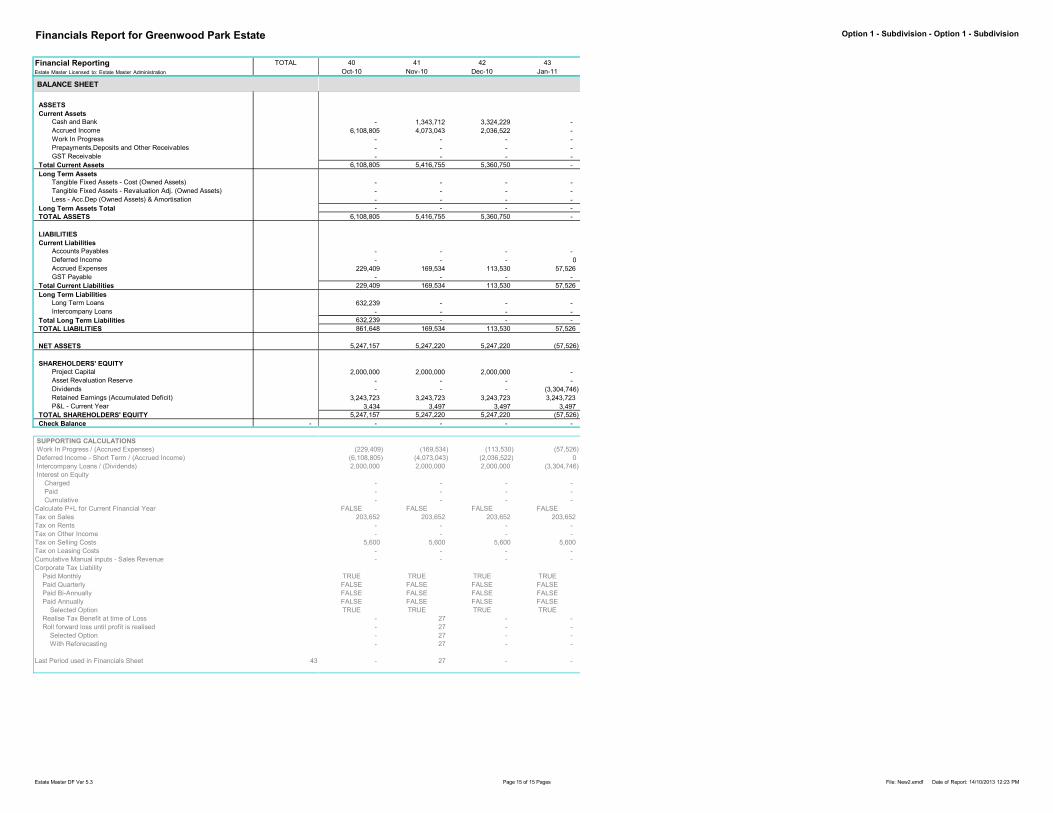
Financials Report for Greenwood Park Estate Option 1 - Subdivision - Option 1 - Subdivision
Financial Reporting TOTAL
Estate Master Licensed to: Estate Master Administration
40 41 42 43
Oct-10 Nov-10 Dec-10 Jan-11
BALANCE SHEET
ASSETS
Current Assets
Cash and Bank
Accrued Income
Work In Progress
Prepayments,Deposits and Other Receivables
GST Receivable
Total Current Assets
Long Term Assets
Tangible Fixed Assets - Cost (Owned Assets)
Tangible Fixed Assets - Revaluation Adj. (Owned Assets)
Less - Acc.Dep (Owned Assets) & Amortisation
Long Term Assets Total
TOTAL ASSETS
LIABILITIES
Current Liabilities
Accounts Payables
Deferred Income
Accrued Expenses
GST Payable
Total Current Liabilities
Long Term Liabilities
Long Term Loans
Intercompany Loans
Total Long Term Liabilities
TOTAL LIABILITIES
NET ASSETS
SHAREHOLDERS' EQUITY
Project Capital -
Asset Revaluation Reserve
Dividends
Retained Earnings (Accumulated Deficit)
P&L - Current Year
TOTAL SHAREHOLDERS' EQUITY
Check Balance -
SUPPORTING CALCULATIONS
Work In Progress / (Accrued Expenses)
Deferred Income - Short Term / (Accrued Income)
Intercompany Loans / (Dividends)
Interest on Equity
Charged
Paid
Cumulative
Calculate P+L for Current Financial Year
Tax on Sales
Tax on Rents
Tax on Other Income
Tax on Selling Costs
Tax on Leasing Costs
Cumulative Manual inputs - Sales Revenue
Corporate Tax Liability
Paid Monthly
Paid Quarterly
Paid Bi-Annually
Paid Annually
Selected Option
Realise Tax Benefit at time of Loss
Roll forward loss until profit is realised
Selected Option
With Reforecasting
Last Period used in Financials Sheet 43
- 1,343,712 3,324,229 -
6,108,805 4,073,043 2,036,522 -
- - - -
- - - -
- - - -
6,108,805 5,416,755 5,360,750 -
- - - -
- - - -
- - - -
- - - -
6,108,805 5,416,755 5,360,750 -
- - - -
- - - 0
229,409 169,534 113,530 57,526
- - - -
229,409 169,534 113,530 57,526
632,239 - - -
- - - -
632,239 - - -
861,648 169,534 113,530 57,526
5,247,157 5,247,220 5,247,220 (57,526)
2,000,000 2,000,000 2,000,000 -
- - - -
- - - (3,304,746)
3,243,723 3,243,723 3,243,723 3,243,723
3,434 3,497 3,497 3,497
5,247,157 5,247,220 5,247,220 (57,526)
- - - -
(229,409) (169,534) (113,530) (57,526)
(6,108,805) (4,073,043) (2,036,522) 0
2,000,000 2,000,000 2,000,000 (3,304,746)
- - - -
- - - -
- - - -
FALSE FALSE FALSE FALSE
203,652 203,652 203,652 203,652
- - - -
- - - -
5,600 5,600 5,600 5,600
- - - -
- - - -
TRUE TRUE TRUE TRUE
FALSE FALSE FALSE FALSE
FALSE FALSE FALSE FALSE
FALSE FALSE FALSE FALSE
TRUE TRUE TRUE TRUE
- 27 - -
- 27 - -
- 27 - -
- 27 - -
- 27 - -
Estate Master DF Ver 5.3 Page 15 of 15 Pages File: New2.emdf Date of Report: 14/10/2013 12:23 PM

Sensitivity The Sensitivity Tables and Two-way What-if charts.

Sensitivity Analysis
Greenwood Park Estate
Option 1 - Subdivision
Subdivision - 179 Lots
Estate Master Licensed to: Estate Master Administration
SENSITIVITY TABLEChange % Net Dev. Profit NPV Dev. Margin Project IRR Equity IRR
Base Case (No Variation)
Land Acquisition Costs -5.0% 5,583,180 (796,918) 16.74% 17.38% 37.78%
-3.0% 5,251,291 (1,021,628) 15.59% 16.66% 36.49%
3.0% 4,254,961 (1,696,200) 12.27% 14.56% 32.25%
5.0% 3,922,516 (1,921,205) 11.20% 13.87% 30.68%
Construction Costs -10.0% 5,532,326 (877,854) 16.56% 17.15% 37.58%
-5.0% 5,142,788 (1,118,342) 15.22% 16.37% 36.06%
5.0% 4,363,712 (1,599,320) 12.62% 14.82% 32.74%
10.0% 3,974,173 (1,839,809) 11.37% 14.05% 30.93%
Construction Period * -20.0% 5,446,071 239,162 16.37% 20.99% 44.63%
-10.0% 5,038,314 (726,120) 14.91% 17.42% 38.35%
10.0% 4,305,163 (2,231,985) 12.40% 13.54% 29.68%
20.0% 3,856,673 (3,060,790) 10.92% 11.98% 25.55%
End Sale Values -5.0% 2,769,080 (2,456,321) 8.09% 11.83% 24.50%
-3.0% 3,564,779 (2,017,325) 10.42% 13.36% 28.90%
3.0% 5,940,492 (700,337) 17.39% 17.77% 39.10%
5.0% 6,729,412 (261,341) 19.71% 19.17% 41.84%
Capitalisation Rate -0.5% 4,753,250 (1,358,831) 13.91% 15.60% 34.44%
-0.2% 4,753,250 (1,358,831) 13.91% 15.60% 34.44%
0.2% 4,753,250 (1,358,831) 13.91% 15.60% 34.44%
0.5% 4,753,250 (1,358,831) 13.91% 15.60% 34.44%
Sales Span ** -30.0% 4,779,009 (1,085,918) 14.06% 16.29% 36.26%
-20.0% 4,860,387 (1,040,014) 14.30% 16.45% 36.62%
20.0% 4,646,692 (1,670,675) 13.52% 14.85% 32.46%
30.0% 4,728,854 (1,625,864) 13.76% 14.99% 32.79%
Rental Levels -20.0% 4,753,250 (1,358,831) 13.91% 15.60% 34.44%
-10.0% 4,753,250 (1,358,831) 13.91% 15.60% 34.44%
10.0% 4,753,250 (1,358,831) 13.91% 15.60% 34.44%
20.0% 4,753,250 (1,358,831) 13.91% 15.60% 34.44%
Debt Interest Rates -2.0% 5,456,035 (1,358,831) 16.30% 15.60% 37.29%
-1.0% 5,109,247 (1,358,831) 15.11% 15.60% 35.92%
1.0% 4,387,832 (1,358,831) 12.70% 15.60% 32.85%
3.0% 3,625,129 (1,358,831) 10.27% 15.60% 29.21%
Discount Rate 18.0% (770,951)
19.0% (1,070,799)
20.0% (1,358,831)
21.0% (1,635,451)
* Variation to Construction Period in sensitivity table delays span dates for Construction and start and span for Professional Fees, Statutory Contributions and Misc. Costs.Delays start but not span date for Sales, Rental and Other Income. Delays the span for Land Holding costs. Has no effect on Land Purchase or Finance costs (except interest).
** Varies span date for Pre-Sale Exchange and Settlement periods, but not commencement dates.
Notes: Two-Way What-If Charts do not take into consideration any variations to the Corporate Tax caused by the change in the 2 selected variables.This is due to Finance Fess and/or Interest Charges being set in the Preferences to be allocated to Works in Progress (WIP) for Profit and Loss reporting.
0%
5%
10%
15%
20%
25%
Pro
ject IR
R (
%)
-10.0% -5.0% 0.0% 5.0% 10.0%
Construction Cost
End Sale Value down 5%
End Sale Value down 3%
End Sale Value no change
End Sale Value up 3%
End Sale Value up 5%
0
1,000
2,000
3,000
4,000
5,000
6,000
7,000
Deve
lopm
ent P
rofit (,
000's
)
-5.0% -3.0% 0.0% 3.0% 5.0%
Land Cost
Construction Cost down 10%
Construction Cost down 5%
Construction Cost no change
Construction Cost up 5%
Construction Cost up 10%
Estate Master DF Ver 5.3 Page 1 of 1 Pages File: New2.emdf Date of Report: 14/10/2013 12:19 PM

Probability The Probability Analysis inputs and distribution profiles of the Development Margin
and IRR.
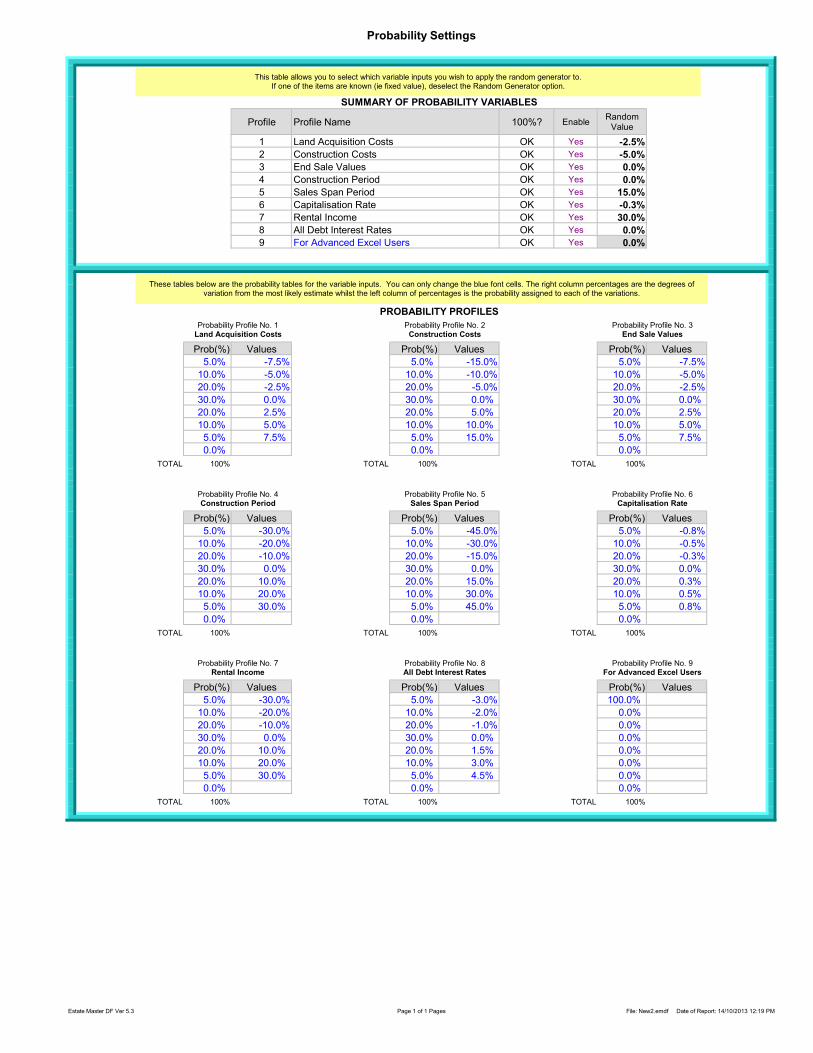
Probability Settings
SUMMARY OF PROBABILITY VARIABLES
Profile Profile Name 100%? EnableRandom Value
1 Land Acquisition Costs OK Yes -2.5%
2 Construction Costs OK Yes -5.0%
3 End Sale Values OK Yes 0.0%
4 Construction Period OK Yes 0.0%
5 Sales Span Period OK Yes 15.0%
6 Capitalisation Rate OK Yes -0.3%
7 Rental Income OK Yes 30.0%
8 All Debt Interest Rates OK Yes 0.0%
9 For Advanced Excel Users OK Yes 0.0%
PROBABILITY PROFILES
Probability Profile No. 1 Probability Profile No. 2 Probability Profile No. 3Land Acquisition Costs Construction Costs End Sale Values
Prob(%) Values Prob(%) Values Prob(%) Values
5.0% -7.5% 5.0% -15.0% 5.0% -7.5%
10.0% -5.0% 10.0% -10.0% 10.0% -5.0%
20.0% -2.5% 20.0% -5.0% 20.0% -2.5%
30.0% 0.0% 30.0% 0.0% 30.0% 0.0%
20.0% 2.5% 20.0% 5.0% 20.0% 2.5%
10.0% 5.0% 10.0% 10.0% 10.0% 5.0%
5.0% 7.5% 5.0% 15.0% 5.0% 7.5%
0.0% 0.0% 0.0%
TOTAL 100% TOTAL 100% TOTAL 100%
Probability Profile No. 4 Probability Profile No. 5 Probability Profile No. 6Construction Period Sales Span Period Capitalisation Rate
Prob(%) Values Prob(%) Values Prob(%) Values
5.0% -30.0% 5.0% -45.0% 5.0% -0.8%
10.0% -20.0% 10.0% -30.0% 10.0% -0.5%
20.0% -10.0% 20.0% -15.0% 20.0% -0.3%
30.0% 0.0% 30.0% 0.0% 30.0% 0.0%
20.0% 10.0% 20.0% 15.0% 20.0% 0.3%
10.0% 20.0% 10.0% 30.0% 10.0% 0.5%
5.0% 30.0% 5.0% 45.0% 5.0% 0.8%
0.0% 0.0% 0.0%
TOTAL 100% TOTAL 100% TOTAL 100%
Probability Profile No. 7 Probability Profile No. 8 Probability Profile No. 9Rental Income All Debt Interest Rates For Advanced Excel Users
Prob(%) Values Prob(%) Values Prob(%) Values
5.0% -30.0% 5.0% -3.0% 100.0%
10.0% -20.0% 10.0% -2.0% 0.0%
20.0% -10.0% 20.0% -1.0% 0.0%
30.0% 0.0% 30.0% 0.0% 0.0%
20.0% 10.0% 20.0% 1.5% 0.0%
10.0% 20.0% 10.0% 3.0% 0.0%
5.0% 30.0% 5.0% 4.5% 0.0%
0.0% 0.0% 0.0%
TOTAL 100% TOTAL 100% TOTAL 100%
This table allows you to select which variable inputs you wish to apply the random generator to. If one of the items are known (ie fixed value), deselect the Random Generator option.
These tables below are the probability tables for the variable inputs. You can only change the blue font cells. The right column percentages are the degrees of variation from the most likely estimate whilst the left column of percentages is the probability assigned to each of the variations.
Estate Master DF Ver 5.3 Page 1 of 1 Pages File: New2.emdf Date of Report: 14/10/2013 12:19 PM

Probability Profiles of Returns
Greenwood Park Estate
Option 1 - Subdivision
Subdivision - 179 Lots
Estate Master Licensed to: Estate Master Administration
Development Margin Internal Rate of Return
First Decile 5.58% First Decile 9.71%
First Quartile 9.16% First Quartile 12.77%
Median 13.50% Median 15.30%
Third Quartile 17.82% Third Quartile 19.37%
Last Decile 21.45% Last Decile 22.86%
Average 13.35% Average 16.02%
Standard Deviation 6.32% Standard Deviation 5.25%
Target Margin = 25%
Target IRR = 20%
0%
10%
20%
30%
40%
50%
60%
70%
80%
90%
100%
Probability
< -10 -5 0 5 10 15 20 25 30 35 40 45+
Development Margin (%)
Probability Distribution of Development Margin
0%
10%
20%
30%
40%
50%
60%
70%
80%
90%
100%
Probability
< -10 -5 0 5 10 15 20 25 30 35 40 45+
IRR (%)
Probability Distribution of IRR
Estate Master DF Ver 5.3 Page 1 of 1 Pages File: New2.emdf Date of Report: 14/10/2013 12:20 PM

Comparison Store and compare up to 8 different development scenarios or options.

Comparison of Options
TRUE 1 TRUE 1 TRUE 1
Case Study 1
Warning! - Information in the Report is not up to date.
Recommend you store the current option/stage.
Estate Master Licensed to: Estate Master Administration
REVENUE
Gross Sales Revenue
Less Selling Costs
Less Purchasers Costs
NET SALES REVENUE
Gross Rental Income
Less Outgoings & Vacancies
Less Letting Fees
Less Incentives (Rent Free and Fit Out Costs)
Less Other Leasing Costs
NET RENTAL INCOME
Interest Received
Other Income
TOTAL REVENUE (before GST paid)
Less GST paid on all Revenue
TOTAL REVENUE (after GST paid)
COSTS
Land Purchase Cost
Land Acquisition Costs
Construction (inc. Construct. Contingency)
Professional Fees
Statutory Fees
Miscellaneous Costs 1
Miscellaneous Costs 2
Miscellaneous Costs 3
Project Contingency (Reserve)
Land Holding Costs
Pre-Sale Commissions
Finance Charges (inc. Line Fees)
Interest Expense
TOTAL COSTS (before GST reclaimed)
Less GST reclaimed
Plus Corporate Tax
TOTAL COSTS (after GST reclaimed)
PERFORMANCE INDICATORS1
Gross Development Profit2
Net Developer's Profit after Profit Share3
Development Margin (Profit/Risk Margin)
Target Development Margin4
Residual Land Value (Target Margin)
5
Breakeven Date for Cumulative Cash Flow
Discount Rate (Target IRR)6
Net Present Value8
Benefit Cost Ratio9
Project Internal Rate of Return (IRR)10
Residual Land Value (NPV)
Peak Debt Exposure
Date of Peak Debt Exposure11
Breakeven Date for Project Overdraft
Total Equity Contribution
Peak Equity Exposure
Date of Peak Equity Exposure12
IRR on Equity
Weighted Average Cost of Capital (WACC)
YIELD ANALYSIS Qty Area Qty Area Qty Area
SALES SqM SqM SqM
Residential - 1 Bedroom Units 200 3,720 200 3,720 120 2,232
TOTAL 200 3,720 200 3,720 120 2,232
TENANCIES SqM SqM SqM
TOTAL 0 0 0
Footnotes (based on current Preferences):
1. Development Profit: is total revenue less total cost including interest paid and received
2. Developer's Net Profit after distribution of profit share.
3. Development Margin: is profit divided by total costs (inc selling costs)
4. Residual Land Value: is the maximum purchase price for the land whilst achieving the target development margin.
5. Breakeven date for Cumulative Cash Flow: is the last date when total debt and equity is repaid (ie when profit is realised).
6. Net Present Value: is the Developer's cash flow stream discounted to present value.
It includes financing costs but excludes interest and corp tax.
8. Benefit:Cost Ratio: is the ratio of discounted incomes to discounted costs and includes financing costs but excludes interest and corp tax.
9. Internal Rate of Return: is the discount rate where the NPV above equals Zero.
10. Residual Land Value (based on NPV): is the purchase price for the land to achieve a zero NPV.
11. Payback date for the equity/debt facility is the last date when total equity/debt is repaid.
12. IRR on Funds Invested is the IRR of the equity cash flow including the return of equity and realisation of project profits.
1 2 3
Deferred Land Payment JV
Land and Profit Share Percentage of Sales JV
Summary of Comparison of Options
Option 1 Option 2 Option 3
200. Lots 200. Lots 200. Lots
- - -
20. Ha 20. Ha 20. Ha
Land Subdivision Land Subdivision Land Subdivision
Under Review Under Review Under Review
57,042,046 57,042,046 34,225,228
(2,921,580) (2,921,580) (2,921,580)
- - -
54,120,467 54,120,467 31,303,648
- - -
- - -
- - -
- - -
- - -
- - -
- - -
- - -
54,120,467 54,120,467 31,303,648
(5,185,641) (5,185,641) (3,111,384)
48,934,826 48,934,826 28,192,264
20,000,000 7,000,000 -
1,267,308 434,126 -
10,924,823 10,924,823 10,924,823
970,229 970,229 970,229
8,219,113 8,219,113 8,219,113
- - -
- - -
- - -
390,824 390,824 390,824
216,596 216,596 216,596
- - -
350,000 350,000 350,000
2,335,569 1,348,750 2,677,394
44,674,463 29,854,462 23,748,981
(3,202,263) (2,009,701) (1,367,552)
- - -
41,472,200 27,844,761 22,381,428
7,462,626 21,090,065 5,810,836
7,462,626 7,381,523 5,810,836
16.81% 23.99% 22.96%
22.00% 22.00% 22.00%
18,127,345 8,013,704 194,688
Aug-2012 Apr-2012 Jul-2012
20.00% 20.00% 20.00%
37,969 932,347 758,302
1.001 1.045 1.047
20.12% 23.61% 22.95%
20,057,885 10,228,866 1,170,918
32,937,718 17,943,424 20,698,993
Jul-2011 Jul-2011 Jun-2011
Dec-2012 Dec-2012 Dec-2012
6,627,942 7,627,942 1,363,399
6,000,000 7,000,000 1,000,000
Jan-2010 Jan-2010 Jan-2010
33.64% 31.70% 72.04%
7.06% 12.81% 10.23%
Estate Master DF Ver 5.3 Page 1 of 1 Pages File: DF_CS001 - Joint Ventures with a Land Owner.emdf Date of Report: 14/10/2013 12:27 PM

Consolidate Consolidates up to 8 input sheets into a consolidated summary and cash flow chart.
Ideal for staged developments.

Consolidation of Stages
TRUE 1 TRUE 1 TRUE 1 TRUE 1 TRUE 1 TRUE 1 TRUE 1 TRUE 1
TOTAL
Stanwell Gardens
Warning! - Information in the Report is not up to date.
Recommend you store the current option/stage.
Estate Master Licensed to: Estate Master Administration
REVENUE
Gross Sales Revenue
Less Selling Costs
Less Purchasers Costs
NET SALES REVENUE
Gross Rental Income
Less Outgoings & Vacancies
Less Letting Fees
Less Incentives (Rent Free and Fit Out Costs)
Less Other Leasing Costs
NET RENTAL INCOME
Interest Received
Other Income
TOTAL REVENUE (before GST paid)
Less GST paid on all Revenue
TOTAL REVENUE (after GST paid)
COSTS
Land Purchase Cost
Land Acquisition Costs
Construction (inc. Construct. Contingency)
Professional Fees
Statutory Fees
Miscellaneous Costs 1
Miscellaneous Costs 2
Miscellaneous Costs 3
Project Contingency (Reserve)
Land Holding Costs
Pre-Sale Commissions
Finance Charges (inc. Line Fees)
Interest Expense
TOTAL COSTS (before GST reclaimed)
Less GST reclaimed
Plus Corporate Tax
TOTAL COSTS (after GST reclaimed)
PERFORMANCE INDICATORS1
Gross Development Profit2
Net Developer's Profit after Profit Share3
Development Margin (Profit/Risk Margin)
Target Development Margin4
Residual Land Value (Target Margin)
5
Breakeven Date for Cumulative Cash Flow
Discount Rate (Target IRR)6
Net Present Value @ Start of Stage
Date of Commencement
Holding Discount Rate -7
NPV at Start of Consolidated Cash Flow8
Benefit Cost Ratio9
Project Internal Rate of Return (IRR)10
Residual Land Value (NPV) @ Start of Stage
Peak Debt Exposure
Date of Peak Debt Exposure11
Breakeven Date for Project Overdraft
Total Equity Contribution
Peak Equity Exposure
Date of Peak Equity Exposure12
IRR on Equity
Weighted Average Cost of Capital (WACC)
YIELD ANALYSIS Qty Area Qty Area Qty Area Qty Area Qty Area Qty Area Qty Area Qty Area Qty Area
SALES SqKm SqKm SqKm SqKm SqKm SqKm SqKm SqKm SqKm
Residential - 1 Bedroom Units 1 0 1 0 1 0 1 0 1 0 1 0 1 0 1 0 8 0
Residential - 2 Bedroom Units 1 0 1 0 1 0 1 0 1 0 1 0 1 0 1 0 8 0
Residential - 3 Bedroom Units 1 0 1 0 1 0 1 0 1 0 1 0 1 0 1 0 8 0
Detached Dwelllings Lots 1 0 1 0 1 0 1 0 1 0 1 0 1 0 1 0 8 0
Townhouse Lots 1 0 1 0 1 0 1 0 1 0 1 0 1 0 1 0 8 0
TOTAL 5 0 5 0 5 0 5 0 5 0 5 0 5 0 5 0 40 0
TENANCIES SqM SqM SqM SqM SqM SqM SqM SqM SqM
TOTAL 0 0 0 0 0 0 0 0 0
Footnotes (based on current Preferences):
1. Development Profit: is total revenue less total cost including interest paid and received
2. Developer's Net Profit after distribution of profit share.
3. Development Margin: is profit divided by total costs (inc selling costs)
4. Residual Land Value: is the maximum purchase price for the land whilst achieving the target development margin.
5. Breakeven date for Cumulative Cash Flow: is the last date when total debt and equity is repaid (ie when profit is realised).
6. Net Present Value: is the project's cash flow stream discounted to present value.
It includes financing costs but excludes interest and corp tax.
7. Net Present Value of each stage at commencement of the consolidated cash flow using the Holding Discount Rate.
8. Benefit:Cost Ratio: is the ratio of discounted incomes to discounted costs and includes financing costs but excludes interest and corp tax.
9. Internal Rate of Return: is the discount rate where the NPV above equals Zero.
10. Residual Land Value (based on NPV): is the purchase price for the land to achieve a zero NPV.
11. Payback date for the equity/debt facility is the last date when total equity/debt is repaid.
12. IRR on Funds Invested is the IRR of the equity cash flow including the return of equity and realisation of project profits.
1 2 3 4 5 6 7 8
Precinct 1 Precinct 2 Precinct 3 Precinct 4 Precinct 5 Precinct 6 Precinct 7 Precinct 8
Summary of Stages and Consolidated Project
Proposal to Bank Proposal to Bank Proposal to Bank Proposal to Bank Proposal to Bank Proposal to Bank Proposal to Bank Proposal to Bank
- - - - - - - -
29. No. of Lots 14. No. of Lots 13. No. of Lots 20. No. of Lots 29. No. of Lots 10. No. of Lots 12. No. of Lots 2. No. of Lots
89,716. SqM 48,193. SqM 44,891. SqM 64,268. SqM 87,880. SqM 88,812. SqM 97,775. SqM 32,426. SqM
Land Subdivision Land Subdivision Land Subdivision Land Subdivision Land Subdivision Land Subdivision Land Subdivision Land Subdivision
Under Review Under Review Under Review Under Review Under Review Under Review Under Review Under Review
31,994,053 16,605,960 15,510,020 21,851,120 29,879,200 30,196,080 33,243,500 9,285,080 188,565,013
(1,846,277) (715,357) (667,628) (949,525) (1,305,634) (1,234,691) (1,363,649) (382,654) (8,465,414)
- - - - - - - - -
30,147,777 15,890,603 14,842,392 20,901,595 28,573,566 28,961,389 31,879,851 8,902,426 180,099,599
- - - - - - - - -
- - - - - - - - -
- - - - - - - - -
- - - - - - - - -
- - - - - - - - -
- - - - - - - - -
- - - - - - - - -
- - - - - - - - -
30,147,777 15,890,603 14,842,392 20,901,595 28,573,566 28,961,389 31,879,851 8,902,426 180,099,599
- - - - - - - - -
30,147,777 15,890,603 14,842,392 20,901,595 28,573,566 28,961,389 31,879,851 8,902,426 180,099,599
4,800,000 2,563,042 2,387,433 3,417,957 4,673,711 4,723,278 5,199,956 1,724,508 29,489,885
256,525 127,900 117,802 177,058 249,263 252,114 279,523 79,684 1,539,868
5,962,831 2,775,826 2,585,637 3,701,716 5,061,723 5,115,404 5,631,656 1,867,677 32,702,469
1,278,583 247,875 230,892 330,555 452,001 456,794 502,894 166,779 3,666,373
1,027,954 737,201 686,691 983,098 1,344,287 1,358,544 1,495,650 496,016 8,129,441
805,257 373,116 346,809 521,781 743,549 400,038 458,442 116,007 3,765,000
4,839,875 2,514,556 2,342,269 3,353,298 4,585,297 4,633,926 5,101,586 1,691,885 29,062,692
400,000 142,639 132,866 190,217 260,103 262,862 289,390 95,973 1,774,051
- 606,306 564,764 808,543 1,105,600 1,117,326 1,230,087 407,945 5,840,571
380,250 158,035 147,942 429,601 283,929 312,867 348,678 127,598 2,188,899
- - - - - - - - -
- - - - - - - - -
936,417 654,583 735,273 1,596,376 3,011,622 3,344,404 4,179,093 1,418,927 15,876,696
20,687,692 10,901,081 10,278,379 15,510,200 21,771,085 21,977,555 24,716,955 8,192,998 134,035,946
- - - - - - - - -
- - - - - - - - -
20,687,692 10,901,081 10,278,379 15,510,200 21,771,085 21,977,555 24,716,955 8,192,998 134,035,946
9,460,084 4,989,522 4,564,012 5,391,395 6,802,480 6,983,834 7,162,896 709,428 46,063,653
9,460,084 4,989,522 4,564,012 5,391,395 6,802,480 6,983,834 7,162,896 709,428 46,063,653
41.98% 42.95% 41.70% 32.76% 29.48% 30.09% 27.46% 8.27% 32.33%
15.00% 15.00% 15.00% 15.00% 15.00% 15.00% 15.00% 15.00%
Not Computed Not Computed Not Computed Not Computed Not Computed Not Computed Not Computed Not Computed -
May-2008 Mar-2009 Oct-2009 Nov-2010 Jun-2012 May-2013 Feb-2014 May-2014 Dec-2012
20.00% 20.00% 20.00% 20.00% 20.00% 20.00% 20.00% 20.00%
5,865,068 2,243,651 1,640,594 603,690 (739,641) (1,071,365) (1,806,589) (1,010,565)
Jan-07 Jan-07 Jan-07 Jan-07 Jan-07 Jan-07 Jan-07 Jan-07
5,865,068 2,243,651 1,640,594 603,690 (739,641) (1,071,365) (1,806,589) (1,010,565) 5,724,843
1.331 1.272 1.232 1.062 0.935 0.888 0.819 0.673
60.87% 42.19% 35.59% 23.19% 17.52% 16.49% 14.80% 9.82% 24.07%
Not Computed Not Computed Not Computed Not Computed Not Computed Not Computed Not Computed Not Computed -
19,711,413 10,809,499 10,252,229 15,066,810 20,819,715 21,604,356 24,253,066 8,191,910 48,611,002
Jan-2008 Nov-2008 Jul-2009 Jan-2010 Mar-2011 Nov-2012 Jul-2013 Apr-2014 May-2014
May-2008 Mar-2009 Oct-2009 Nov-2010 Jun-2012 May-2013 Feb-2014 May-2014
- - - - - - - - -
- - - - - - - - -
N.A. N.A. N.A. N.A. N.A. N.A. N.A. N.A. Jan-1900
N.A. N.A. N.A. N.A. N.A. N.A. N.A. N.A. #NUM!
8.50% 7.20% 7.20% 7.20% 7.20% 7.20% 7.20% 7.20%
Estate Master DF Ver 5.3 Page 1 of 1 Pages File: New3.emdf Date of Report: 14/10/2013 12:32 PM


