Oil: Evaluation and Innovative SolutionSasidharan Adiyodi Kenoth and Ali Al Matar, Dragon Oil, and D. K. Gupta, University of Petroleum and Energy Studies
prediction of pig velocity, pig-generated slug volume, slug du-ration, backpressure increase in the pipeline, and process-plant upset. Control of these parameters is very difficult during by-pass-pigging operations because of its transient nature. The fluid behavior through bypass holes, subsequent downstream flow re-gime, and the nature of turbulence are unknown. Transient mod-eling and simulation results of bypass pigging with help of the OLGA Dynamic Multiphase Flow Simulator (available from Sch-lumberger) do not match with actual field results. Wax blockage of bypass holes also leads to erroneous results. In this paper, ef-forts are made to develop empirical correlations to approximate various parameters on the basis of experimental results in com-parison with simulation-model prediction. Later, an innovative bypass geometry/profile is proposed and designed, and experi-mental results are evaluated.
Fluid-Flow Modeling and Dynamic Pig ModelingUnderstanding the motion of pigs and pig trains in pipelines is important, in general, to avoid surprises. Missed inspection data, damage to pigs, or, in the extreme case, fatality caused by high speeds lead to the need to understand pig acceleration, peak ve-locity, and how the pig or train might be brought under control.
Gas-Velocity and Pig-Velocity Calculations. It is generally be-lieved that in multiphase-flow pigging without bypass, the pig ve-locity is equal to the gas-stream velocity. Though this assumption is a fairly good approximation, the actual pig velocity is slightly lower than the gas velocity/mixture velocity in a long-distance pipeline. The initial pig velocity is high compared with the latter part of its travel because the pig generated liquid displacement. The pig speed is generally calculated on the basis of the ideal-gas law acoss a control section, as follows:
where P1 is the initial pressure (standard pressure condition) in bara; P2 is the final pressure (actual pressure condition) in bara, V1 is the initial volumetric-flow rate (standard volumetric rate) in m3/s, V2 is the final volumetric-flow rate (actual volumetric rate at pressure) in m3/s, T1 is the initial (standard) temperature in °R, T2
is the final (actual) temperature in °R, n1 and n2 are the number of moles of gas at different pressures, A is the area of the pipeline in m2, R is the gas constant, and z1 and z2 are the compressibility fac-tors at different pressures.
Eq. 1 gives the superficial gas velocity, which can be approxi-mated to the pig velocity in the pipeline without bypass. With bypass, the pig velocity will be different and shall be calculated by reducing the bypassed-gas quantity, as discussed in the following subsection.
Pig-Motion Analysis. The pig-motion analysis shows the follow-ing results (Tiratsoo 1999):
Original SPE manuscript received for review 3 November 2014. Revised manuscript received for review 29 June 2015. Paper (SPE 178424) peer approved 14 July 2015.
SummaryBypass pigging, compared with conventional pigging, reduces the damaging effects of the pig-generated liquid slug by redistributing gas and liquid in the pipeline. Oil- and gas-production rate, high liquid-slug flow to the slug catcher, high pipeline backpressure, and the capacity of the slug-handling facility at the receiving end are major considerations when designing a bypass-pigging solu-tion. Various operational and engineering challenges are encoun-tered while implementing the commonly known bypass-pigging solutions, and empirical correlations are developed on the basis of experimental results and compared with simulation results. This paper suggests an innovative bypass-pig geometry as a solution. The Thornhill-Craver equation is introduced to calculate the by-pass-flow quantity and the pig velocity. A comparison between transient-flow simulation and field results showed some devia-tions. Empirical correlations are developed for prediction on the basis of experimental results. A new convergent/divergent bypass-pig geometry/profile is developed, followed by simplified model development. Through this innovative design, critical and constant gas-flow rate is achieved at lower pressure ratio through the bypass hole, where the gas enters through a nozzle, stabilizes at the throat, and recovers pressure through a diffuser section. At a predefined inlet pressure and area of cross section of the hole, a properly de-signed convergent nozzle with throat section will give maximum critical flow rate at the exit by reducing the gas pressure to the crit-ical pressure ratio. However, with help from the diffuser section, the high-velocity energy is converted back into pressure energy, and the line pressure regains up to 90% of the upstream pressure. Adopting such a bypass-hole profile with suitable geometry can ensure required bypass-gas quantity through the pig and can avoid pig stalling and minimize process upset, thus ensuring better pipe-line cleaning.
IntroductionPigging of multiphase-flow pipelines is highly complicated com-pared with pigging of single-phase-flow pipelines. Bypass pigging, as compared with conventional pigging, reduces the damaging ef-fect of the pig-generated liquid slug by distributing gas and liquid in the pipeline. Allowable oil- and gas-production rate while pigging, high liquid-slug flow to the slug catcher, high pipeline backpres-sure, and the liquid-withdrawal rate/capacity of the slug-handling facility at the receiving end are major considerations for designing a suitable bypass-pigging solution. Most of the time, bypass pig-ging is not fully effective in waxy crude oil because of blockage of the bypass holes with wax.
Various operational and engineering challenges while imple-menting the commonly known bypass-pigging solutions include
52 Oil and Gas Facilities • December 2015
∆ = × −( ) = × ×( )P C V V C Vp D p D d� �2
22 2/ / , ......................(2)
where Pp is the pressure difference across the pig, CD is the drag coefficient of the pig, ρ is the density of the transportation medium in kg/m3, V is the velocity of the transportation fluid in m/s, Vp is the velocity of the pig in m/s, and Vd is the velocity difference be-tween the fluid mixture and the pig in m/s.
The CD depends to a large extent on the size of the end disks of the pig and the degree of seal provided by the end disks. Accu-rate determination of CD requires testing of prototype capsules in a pipe. The Kosugi equation, as follows, can predict CD to within a 20% error margin:
where kd is the disk-diameter ratio (diameter of the end disk di-vided by the internal pipe diameter while the pig is inside the pipe). In the case of a bypass pig, an effective disk diameter is calculated by reducing the bypass opening area. Hence, for a bypass pig, the disk-diameter ratio will be smaller, and correspondingly, the drag coefficient of the bypass pig will be smaller compared with a pig with no bypass of similar size. This will result in a lower pressure drop across the pig and also a reduced drag force. The drag force is calculated for a known cross-sectional pipe with area A, as follows:
F A CD D= × , ..........................................................................(4)
where FD is the drag force in Newtons.The pig moves at a constant velocity Vp through a pipeline. Because
of the presence of large contact friction between the pipe wall and the pig disks, the pig moves at a velocity that is less than the mean flow velocity of fluid.
V V V V V Vd p p d= − = −, or . ..................................................(5)
During steady-state motion, the drag force FD is equal in magni-tude, but opposite in direction, to the contact friction force Ff,
F F ND f= = � , ...................................................................(6)
where N is the total normal force (Newtons) that the pig exerts on the pipe in the radial direction (scalar sum of forces) and η is the contact friction coefficient. N can also be considered as the weight of the pig.
From the pig-motion analysis and Newton’s second law of mo-tion, the following results can be obtained for the horizontal length of pipeline (Liu 2003):
V V V N C Ap d D− = = × ×( ) × ×( )2 � � . ............................(7)
Calculation of Bypass-Gas-Flow Quantity. In multiphase flow, though it is a mixture of oil and gas, it is generally assumed that the bypassing-gas quantity only will be calculated. The quantity of gas bypassed is a function of the pressure differential across the pig and the area of cross section for bypass. The larger the differential pressure across the pig, the higher the volumetric-flow rate. The gas-flow rate is given by the Thornhill-Craver equation through a choke/square-edged orifice, as follows:
Q C A Pgk k r r
S Td o
k k k
g g
= × × ×−( ) × −( )
×
+( )
155 52 1
1
2 1
. , .......(8)
where Q is the bypass-gas-flow rate in MMscf/D, r = P2/P1, Sp is the specific gravity of gas, Ao is the area of the cross section of each bypass hole/orifice in square inches, P1 is the initial pressure in psia, P2 is the final pressure in psia, Tg is the temperature of gas in °R, k is the specific-heat ratio Cp/Cv, and Cd is the coefficient of discharge (accounts for the hole geometry and multidimensional-flow effects).
Pig-Velocity Reduction Because of Bypass. The bypass-pigging so-lution for single-phase fluid (liquid or gas) is generally clean in nature and is predictable to a good extent. Bypass pigging becomes com-plicated when the flow is multiphase, and all the more complicated when the crude oil is waxy and wax crystallization and precipitation/deposition starts on the pipe wall. This is evident from field experi-ence, where in several cases, the bypass holes are being plugged by wax. The chance of bypass-hole blockage is high when the holes are small and peripheral because the scraped-out sticky wax could plug the holes easily (Lee et al. 2012; Minami and Shoham 1995).
Experiments and SimulationsEmpirical Correlations Based on Field-Study Results. Correlations to determine the pig travel time on the basis of the production flow during pigging, the speed reduction because of bypass, the expected slug reduction with help of bypass, and the backpressure conditions in the pipeline can be evolved with a cor-relation developed from experimental results.
The liquid holdup in a long-distance pipeline is a function of the gas/liquid ratio prevailing in the pipeline, which is an indication of production level. Gas/liquid ratio has an inverse relation with the liquid holdup. On the basis of the liquid holdup in the pipeline, the backpressure starts increasing earlier or later while pigging. A simple correlation for the inventory collected during pigging is proposed in this paper. Empirical equations were developed to de-scribe the flow characteristics of a bypass pig. The slope of best fit was performed. Regression fit is developed on the basis of the data by use of a straight-line model: Y= m X + C.
Field and Experimental Description. Figs. 1 through 3 show a typical long-distance, offshore subsea-pipeline profile and pigging operation set up in the field. The subsea pipeline transports multi-phase fluid (oil, gas, and water with small sand and wax particles) from wellhead platforms to the nearest block-collection platform. From the block-collection platform, the multiphase fluid is trans-ported to the onshore processing plant through a subsea-trunk pipe-line. The offshore riser portion is on the order of 30 to 40 m in length. The flow-pipeline profile has high potential for slugging at suboptimal flow rate.
Fig. 1 provides the elevation profile of a typical 30-in. subsea pipeline, which starts, from the top, at 20 m above the sea level. The approximate water depth in the area is 25 m. The pipeline terrain is nonuniform. Various colors are used for indicating the riser and the offshore and onshore portions of the pipeline. The receiving end also has a very bad profile, which leads to severe slugging phenomenon.
25RiserOffshore Block-2 to Shore approach
Onshore Shore approach to CPF
20
15
10
5
0
–5
–10
–15
–20
–25
–30Ele
vatio
n (
m)
–35
–40
–45
–50
–55
–60
–5000 0 5000 10 000
Length (m)
15 000 20 000 25 000 30 000 35 000 40 000
Fig. 1—Typical 30-in. pipeline-elevation pro�le. CPF = central processing facility.
December 2015 • Oil and Gas Facilities 53
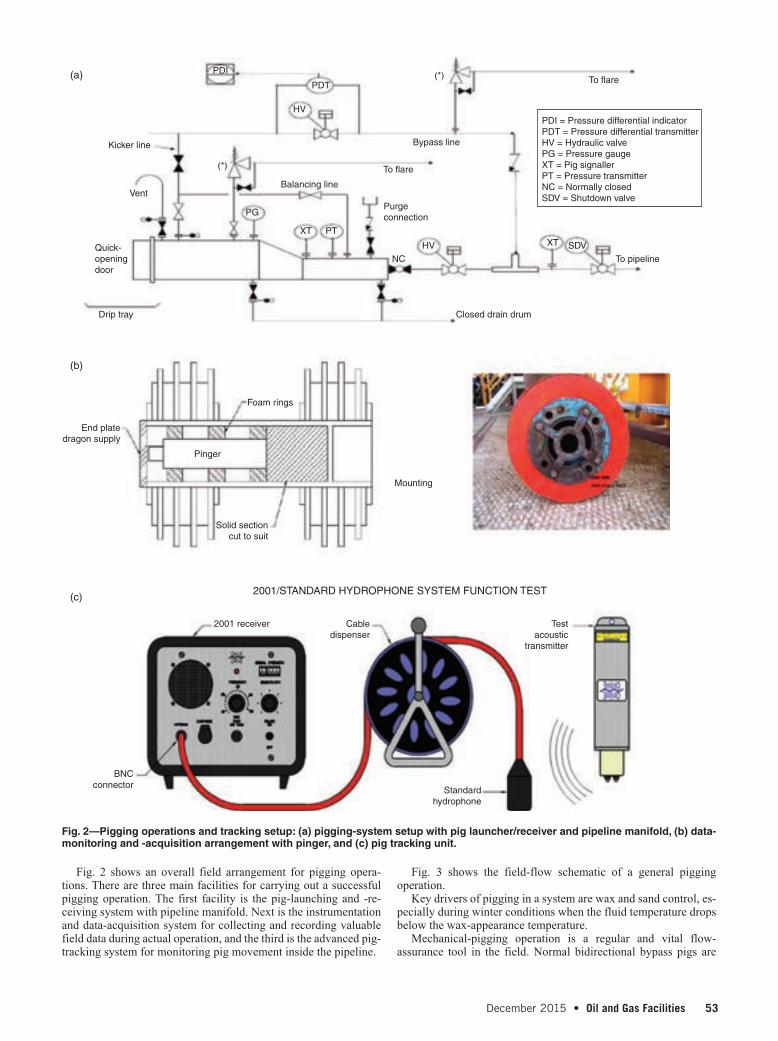
Fig. 2 shows an overall field arrangement for pigging opera-tions. There are three main facilities for carrying out a successful pigging operation. The first facility is the pig-launching and -re-ceiving system with pipeline manifold. Next is the instrumentation and data-acquisition system for collecting and recording valuable field data during actual operation, and the third is the advanced pig-tracking system for monitoring pig movement inside the pipeline.
Fig. 3 shows the field-flow schematic of a general pigging operation.
Key drivers of pigging in a system are wax and sand control, es-pecially during winter conditions when the fluid temperature drops below the wax-appearance temperature.
Mechanical-pigging operation is a regular and vital flow- assurance tool in the field. Normal bidirectional bypass pigs are
PDI
PDT
HV
PG
XT PT
XT SDVHV
Purge
connection
Closed drain drum
To flare
To flare
To pipeline
Bypass line
Balancing line
Kicker line
Vent
Quick-
opening
door
Drip tray
Pinger
Mounting
Solid section
cut to suit
2001/STANDARD HYDROPHONE SYSTEM FUNCTION TEST
Foam rings
End plate
dragon supply
NC
(*)
(*)
Standard
hydrophone
Test
acoustic
transmitter
Cable
dispenser
2001 receiver
BNC
connector
(a)
(b)
(c)
PDI = Pressure differential indicator
PDT = Pressure differential transmitter
HV = Hydraulic valve
PG = Pressure gauge
XT = Pig signaller
PT = Pressure transmitter
NC = Normally closed
SDV = Shutdown valve
Fig. 2—Pigging operations and tracking setup: (a) pigging-system setup with pig launcher/receiver and pipeline manifold, (b) data-monitoring and -acquisition arrangement with pinger, and (c) pig tracking unit.
54 Oil and Gas Facilities • December 2015
commonly used in the field to reduce production and process upset and to control the pig velocity. Several pigging operations were carried out in many of the selected pipelines with bypass pigs at different operating and flow conditions.
Bypass-Pig Geometry/Profile. Figs. 4 through 6 show the differ-ent pig geometries used in the field for pigging operations. These bidirectional pigs have multiple disks and weigh approximately 150 kg. Bypass holes are drilled into the outer periphery of the pig body. The bypass area is controlled by increasing the number of bypass holes and the diameter of each hole. By this method, the bypass area can be increased to a maximum of 3 to 4% in a 30-in. pig. The three types of geometry used in the pigging operation are explained in the following.
Care should be taken when designing bypass-pig geometry. Pig stability, pig stalling, and the mechanical integrity of the pig are given prime importance during the design of bypass-pig geometry. In the first stage of experiments, bypass pigs with peripheral holes of 1 and 1.25 in. on the front and back disks were designed.
The simulation model with different bypass percentages is run and pig travel time, pressure conditions, slug volume and slug-ini-tiation time and duration are predicted with the OLGA Dynamic Multiphase Flow Simulator (available from Schlumberger). The following are the physical input parameters:• Pipeline diameter = 30 in.• Pipe-wall thickness = 12.7 mm.• Total pipeline length = 35 km (running from an offshore mani-
fold platform to an onshore process complex). The pipeline is
Pigging-Flow Schematic
LauncherInter field trunk line
Receiver
L2
L3
R2
Pig receiver
Slug catcher
R3
Pig
launcher
Manifo
ld
35
Fig. 3—Offshore pipeline-pigging-�ow scheme.
105 cms
72.5 cms
73 c
ms
78 c
ms
110 cms34 cms
34 cms
50 cms
73 cms
Fig. 4—Pro�le 1.
30-in. pig
30-in. pigs
Fig. 5—Pro�le 2.
December 2015 • Oil and Gas Facilities 55
cement coated, and the pipeline profile used for modeling is as shown in Fig. 1. • A 30-in. bidirectional pickup pig is used, with two front disks,
two rear disks with support disks, and up to 12 bypass holesin the front and rear. The hole size varied from 25 to 34 mmfor initial pigging.
The following are the operating parameters used during pigging:• Total gas-flow rate through the pipeline = 80 MMscf/D, which
is reduced to 60 MMscf/D at least 12 hours in advance of pig-ging to maintain a steady-state condition.
• Total liquid-flow rate = 70,000 BLPD with 8% water (approx-imately).• The inlet pressure at the start of pigging is 17 to 18 barg. The
receiving-end pressure, which is the normal operating pres-sure of the plant, is 7 barg.
Profile 1. Initial geometry with six peripheral holes in the front disk and rear disks, with a hole size of 25 mm. Many experiments with different oil- and gas-flow rates were carried out with various percentages of bypass area (bidirectional, 150 kg, six disks).
Profile 2. The geometry is revised with 12 holes in the front and rear disks and a hole size of 34 mm. Many experiments were car-ried out with different oil- and gas-flow rates and various percent-ages of bypass area.
Profile 3. The geometry is revised with 12 holes in the front and rear disks, a hole size of 34 mm, and a central hole of 75 mm. Three experiments are carried out with different oil- and gas-flow rates and various percentages of bypass area.
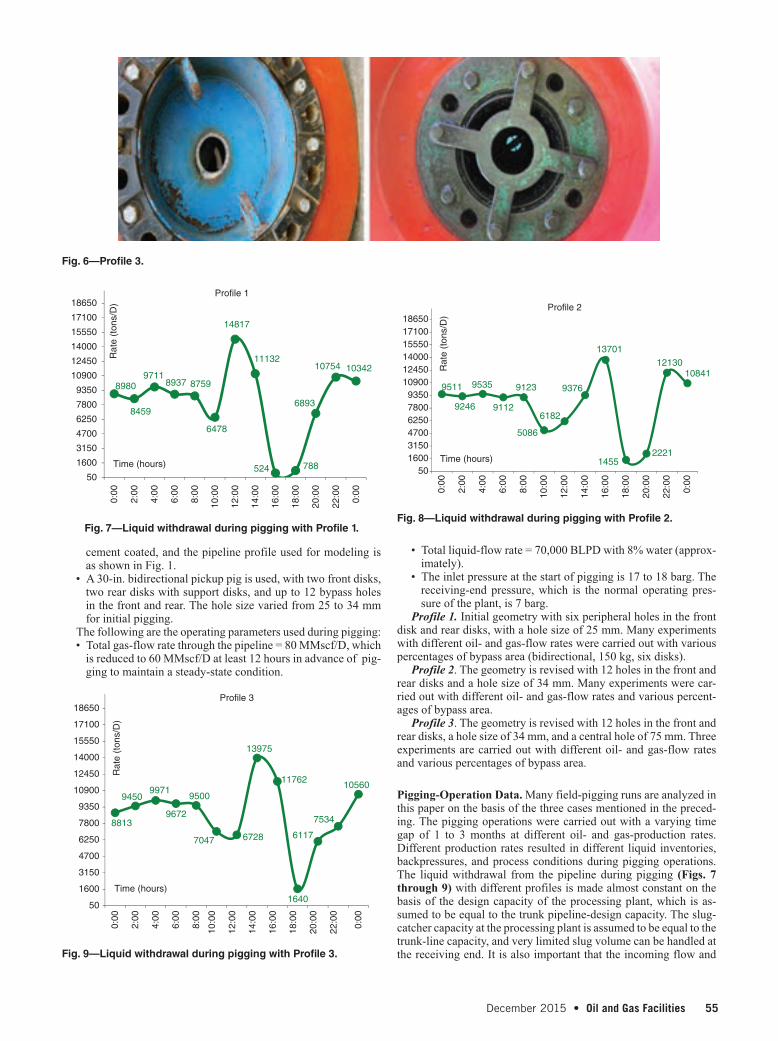
Pigging-Operation Data. Many field-pigging runs are analyzed in this paper on the basis of the three cases mentioned in the preced-ing. The pigging operations were carried out with a varying time gap of 1 to 3 months at different oil- and gas-production rates. Different production rates resulted in different liquid inventories, backpressures, and process conditions during pigging operations. The liquid withdrawal from the pipeline during pigging (Figs. 7 through 9) with different profiles is made almost constant on the basis of the design capacity of the processing plant, which is as-sumed to be equal to the trunk pipeline-design capacity. The slug-catcher capacity at the processing plant is assumed to be equal to the trunk-line capacity, and very limited slug volume can be handled at the receiving end. It is also important that the incoming flow and
Fig. 6—Pro�le 3.
8980
8459
97118937 8759
6478
14817
11132
524 788
6893
10754 10342
50
1600
3150
4700
6250
7800
9350
10900
12450
14000
15550
17100
18650
0:0
0
2:0
0
4:0
0
6:0
0
8:0
0
10:0
0
12:0
0
14:0
0
16:0
0
18:0
0
20:0
0
22:0
0
0:0
0
Time (hours)
Ra
te (
ton
s/D
)
Profile 1
Fig. 7—Liquid withdrawal during pigging with Pro�le 1.
9511
9246
9535
9112
9123
5086
6182
9376
13701
14552221
1213010841
50
1600
3150
4700
6250
7800
9350
10900
12450
14000
15550
17100
18650
0:0
0
2:0
0
4:0
0
6:0
0
8:0
0
10:0
0
12:0
0
14:0
0
16:0
0
18:0
0
20:0
0
22:0
0
0:0
0
Profile 2
Time (hours)
Rate
(to
ns/D
)
Fig. 8—Liquid withdrawal during pigging with Pro�le 2.
8813
94509971
9672
9500
7047 6728
13975
11762
1640
6117
7534
10560
50
1600
3150
4700
6250
7800
9350
10900
12450
14000
15550
17100
18650
0:0
0
2:0
0
4:0
0
6:0
0
8:0
0
10:0
0
12:0
0
14:0
0
16:0
0
18:0
0
20:0
0
22:0
0
0:0
0
Profile 3
Time (hours)
Rate
(to
ns/D
)
Fig. 9—Liquid withdrawal during pigging with Pro�le 3.
56 Oil and Gas Facilities • December 2015
slugs be suppressed and controlled by use of inlet-control valves. This results in high backpressure in the trunk pipeline, which is closely monitored and controlled during pigging operations to re-main within the maximum allowable working pressure of offshore platforms. Because of this, the pigging operation of a long-distance
trunk pipeline always results in some kind of production loss and process upset.
Fig. 10 shows a real-time photo of backpressure increase in a trunk pipeline during a bypass-pigging operation. The graph indicates a gradual pressure rise in the pipeline even after use of a bypass pig.
Pig Runs 1 through 21 are carried out with Profile 1.
Pig Runs 22 through 28 are carried out with Profile 2.
Pig Runs 29 through 31 are carried out with Profile 3.
Pig Runs 32 through 34 are carried out with Profile 4.
Table 1—Tabulation of bypass-pigging input and output parameters.
December 2015 • Oil and Gas Facilities 57
Empirical Correlations Based on Field-Pigging Results. Many field-pigging runs were carried out over the past 2 years with by-pass pigs (bypass area up to 4%) and analyzed. Different gas- and liquid-production rates resulted in different liquid inventories in each run. Each pigging operation was unique, and took different pig traveling time. Each run brought different results in terms of wax recovery and gas surge. It is also to be noted that the pres-sure differential across the source and sink also varied in a small range, though efforts were made to control the variation. Another risk in pipeline pigging was the presence of sand content, though to a smaller percentage, which was unknown. Regular desanding operations from the pipeline and downstream process equipment, close monitoring of liquid samples, and analysis are a routine part of the operation. It is also a fact that enough slug-handling capacity is unavailable for handling the total production during the transient pigging operation. The pigging operation has evolved to minimize production downtime and surge risks. For example, to achieve a steady-state condition and slow down of the pig before starting the pigging operation, the gas-flow rate is reduced to a certain extent on the basis of simulation results. The gas-flow rate has been reduced, while keeping the liquid-flow rate the same to avoid production loss. It is also to be noted that to have good control on the process operation in the plant, the liquid drain rate at the process-plant inlet has been controlled by throttling the subsea-pipeline exit-control valve downstream of the pig receiver.
The use of a pig-tracking system provides authentic information of pig travel and assists in locating the pig journey at various points in time. This also provides an idea of the pig travel velocity at dif-ferent travel segments, pig acceleration and deceleration on the basis of the pipeline profile, and the terrain conditions. Pig tracking gives an advance indication about any blockage in the system on the basis of the travel speed.
The following input parameters were collected:• Bypass percentage• Liquid- and gas-flow rate before start of pigging• Pressure and temperature at the start and end of the pipeline
at constant intervals• Pigging start and end timesThe output parameters that were generated are as follows:• Pig travel time vs. pressure graph at source and sink• Gas velocity at start and end• Pig-travel-time calculation on the basis of gas velocity• Bypass-gas quantity calculation• Time at which pressure increase started
• Distance traveled by the pig before the pressure rise started• Surge-/inventory-estimation calculation• Average liquid holdup in the pipeline (Cunliffe’s method)• Distance traveled before pressure increase• Straight-line trend fitting• Slope and intercept of the pressure curve• Empirical formula with average slope and interceptTable 1 shows the details of the pigging operations carried out
during the last 2 years with different bypass pigs and flow param-eters. The input and output data are tabulated.
Figs. 11 through 13 are typical examples of graphs depicting the relation between pig travel time [x-axis (hours)], pipeline pres-sure at start and end points [y-axis (barg)], and gas-flow rate [y-axis (MMscf/D)] observed in the plant during pigging.
Summary of Experimental Results. The following are the main observations and conclusions of the experimental results:
1. The pig travels a certain distance before pressure increase inall pigging operations.
2. The liquid slug observed during pigging at the receiving endis very high and is unable to be accommodated with the cur-rent design capacity.
3. Conventional methods of increasing the bypass-hole size donot give positive results.
4. The bypass-gas-flow rate is not increasing per the design re-quirement as the bypass-hole size increases.
5. Conventional bypass pigging is ineffective because of lessgas bypass and less differential pressure across the pig.
6. The differential pressure across the pig is proportional to thedrag force, which in turn depends on the pig weight.
7. The distance traveled before pressure rise is proportional tothe liquid holdup in the pipeline.
8. The liquid holdup in the pipeline depends on the gas/liquidratio maintained in the pipeline before the pigging operation.
9. The multiphase fluid stream in the pipeline tends to act as amechanical spring.
Trend Analysis and Analytical Modeling. Correlations to deter-mine the pig travel time on the basis of the production flow during pigging, the speed reduction because of bypass, the expected slug reduction with help of bypass, and the backpressure conditions in the pipeline can be evolved with a correlation developed from pre-viously calculated results.
FIELD TEST RESULTS (Profile 1, Run 19)
80.0
70.0
60.0
Pre
ssure
(barg
)
50.0
40.0
30.0
20.0
10.0
0.00 0.5 1 1.5 2 2.5 3 3.5 4 4.5
Pig Travel Time (hours)
5 5.5 6 6.5 7 7.5
Qg
8 8.5
B-2 PrCPSF-PrGasLinear (B-2 Pr)Linear (CPSF-Pr)
y = 4,7080x + 2,9555
R2 = 0.9492
y = 3.8242x + 12.418
R2 = 0.9291
9
Fig. 11—Pigging with Pro�le 1.
58 Oil and Gas Facilities • December 2015
The liquid holdup in a long-distance pipeline is a function of the gas/liquid ratio prevailing in the pipeline, which is an indication of the production level. Gas/liquid ratio has an inverse relation with the liquid holdup. On the basis of the liquid holdup in the pipeline, the backpressure starts increasing earlier or later during pigging operation. A simple empirical correlation that is based on the data collected during the pigging operation is proposed in this subsec-tion. This empirical equation describes the flow characteristics of bypass pigging. The slope of the best-fit curve was calculated. Re-gression fit is developed from the data by use of the straight-line model Y = mX + C.
From the preceding tabulated results and on the basis of the linear-trend fitting curve, the following equations are derived:
Y X= +2 9121 13 0756. . , .........................................................(9)
m = 2 9121. , ..........................................................................(10)
and
C = 13 0756. . .........................................................................(11)
With this formula, the backpressure at the starting point (Y) can be calculated during pigging at any point of time to determine the maximum backpressure that can be attained for calculated pig travel time. Therefore, if the start pressure before pigging is 17 barg and the calculated maximum pig travel time is 6 hours, the highest pressure at the source while pigging can be calculated as Y X= + =2 9121 6 13 0756 30 5482. . . barg .
Developed empirical correlations show a good match with ex-perimental results for the conventional profiles (Profiles 1 through 3), and they can be used for future prediction purposes and quick estimation of the maximum expected pressure in the pipeline for decision making and precautionary actions. For the new profile, the high pressure at B2 is caused by the low pig travel time, which led to uncontrolled flow rate, necessitating throttling of the inlet valves. Table 2 shows the validation of pig travel time and back-pressure in the line, which are highlighted in green and yellow, re-spectively. The table shows the results of available limited runs.
Simulation Results and Field Results: Comparison Study. A comparison between OLGA transient simulation and field results for the surge volume, pigging backpressure, pig travel time, and bypass-flow quantity shows some deviations. The mismatch could
FIELD TEST RESULTS (Profile 2, Runs 22–28)
40.0
35.0
30.0
y = 3.2431x + 11.457
R2 = 0.9669
y = 3.7328x + 2.8216
R2 = 0.9446 B-2 Pr
CPSF-Pr
Gas
25.0
20.0
15.0
10.0
5.0
0.00 0.5 1 1.5 2 2.5 3 3.5 4 4.5 5 5.5
Pig Travel Time (hours)
Pre
ssure
(barg
)
6 6.5 7 7.5 8 8.5 9
140
120
100
80
Qg
60
40
20
0
Fig. 12—Pigging with Pro�le 2.
FIELD TEST RESULTS (Profile 3, Runs 29–31)
40.0 200
180
160
140
120
100 Qg
80
60
40
20
098.587.576.565.554.5
Pig Travel Time (hours)
43.532.521.510.50
35.0
y = 3.5242x + 12.912
y = 4.5549x + 3.4352B-2 pr
CPSF pr
30.0
25.0
Pre
ssure
(barg
)
20.0
15.0
10.0
5.0
0.0
Qg
Fig. 13—Pigging with Pro�le 3.
December 2015 • Oil and Gas Facilities 59
1. Pig travel time calculated on the basis of simulation withoutbypass holes more or less matches with actual pig travel timeobtained during field-pigging operations, though there aresome mismatches. This is evident in the smaller-diameter-
pipeline pigging, in which pigging was carried out without any downstream control in liquid-withdrawal rate.
2. The pig travel time calculated on the basis of simulation withbypass holes does not match with the actual pig travel timeobserved during field application.
3. The liquid slug is predicted to start much earlier than wasobserved in the field. This time gap could be because of thefailure to predict a bubbly slug flow caused by the turbulence of bypass pigging. Moreover, the liquid arriving is also con-trolled by throttling the inlet-flow-control valve.
4. The liquid-surge volume, duration, and arrival time are de-pendent on the normal production rate maintained in thepipeline before pigging and the pigging rate (BLPD, gas/liquid ratio)
5. Simulation results show less of an increase in backpressurecompared with actual backpressure observed during field-pigging operations. This is because of the difference in the
Table 2—Validation data for pigging time and backpressure.
be because of the failure to predict a bubbly liquid surge caused by the turbulence of bypass pigging. Surge-volume prediction and surge-initiation timing and its duration are very complicated. Pigging-surge models that are based on empirical formulations are sometimes very helpful.
The effect of increasing the bypass area on the drag coefficient and drag force is verified. The effect of increasing the drag force by increasing the weight of the pig is proposed. Seal leakage through the disks is reviewed and discussed. Software results are validated, and differences are discussed for better understanding. Figs. 14 through 16 show different scenarios of simulation runs.
Summary of Software Simulations
Pigging of 30-in. Trunk Line
Oil rate = 70,000 BOPD; gas/oil radio = 900
scf/STB; water content = 8%; CPSF pressure = 7 barg with
no bypass/seal leakage.
Inlet and Outlet Pressure Conditions During Pigging
Pigging time = 4.07 hours = 243 minutes
The Liquid-Flow Rate and Gas-Flow Rate at Various
Time, at Sink/CPSF
SOFTWARE SIMULATION RESULTS (RUN 1)
Initial Liquid- and Gas-Flow Rate = 12 650 m3/d,
1.782 million std m3/d
The liquid-flow rate fluctuated up to 45 000 m3/d until
2.5 hours after the pig launched, and started further
increasing to greater values, even up to 10 times that
of the starting production rate. In between, no liquid flow
was observed many times.
Sink
PigSource
Fig. 14—Software simulation, Run 1.
60 Oil and Gas Facilities • December 2015
liquid-withdrawal rate considered in the simulation study and the actual field case.
6. Bypass pigging, as such, cannot be modeled with the OLGA simulation software. Bypass pigging has to be modeled
through allocating a certain percentage of seal leakage across the pig.
7. After allocating the calculated percentage of seal leakage in thesimulation, the simulation is unable to complete and is aborted.
Pigging of 30-in. Trunk Line
Oil rate = 70,000 BOPD; gas/oil ratio = 700
scf/STB; water content = 8%; CPSF pressure = 7
barg; 2.6% bypass/seal leakage.
Pigging time is 4.99 hours = 299 minutes
Inlet and Outlet Pressure Conditions During Pigging
The Liquid-Flow Rate and Gas-Flow Rate at Various
Time, at Sink/CPSF
Initial Liquid- and Gas-Flow Rate = 12 650 m3/d,
1.782 million std m3/d
The liquid-flow rate fluctuated up to 40 000 m3/d until 2.5 hours
after the pig launched, and started further increasing to greater
values, even up to 20 times that of the starting production rate.
In between, no liquid flow was also observed for many times.
The gas-flow rate also reached higher values, dropped down to
double, and touched zero at many times, and started to increase
after 2.9 hours.
Accumulated liquid volume is 7940 m3 and surge
volume is 5097 m3.
SOFTWARE SIMULATION RESULTS (RUN 2)
Sink
PigSource
Fig. 15— Software simulation, Run 2.
SOFTWARE SIMULATION RESULTS (RUN 3)
Pigging of 30-in. Trunk Line
Oil rate = 70,000 BOPD; gas/oil ratio = 900
scf/STB; water content = 8%; CPSF pressure = 7
barg; 20% bypass/seal leakage.
The Liquid-Flow Rate and Gas-Flow Rate at Various
Time, at Sink/CPSF
Accumulated liquid volume is less and maximum surge
volume is 317 m3.
Pigging time is 14.35 hours.
Inlet and Outlet Pressure conditions During Pigging.
Sink
PigSource
Fig. 16— Software simulation, Run 3.
December 2015 • Oil and Gas Facilities 61
New Bypass-Hole Geometry/ProfileA new bypass-pig geometry/profile (Fig. 17), the convergent/di-vergent profile, is suggested in this paper, followed by simplified model development. Various aspects of the proposed profile are discussed and suggested through field trial with selected cases.
Through this innovative design, the critical flow is achieved at a lower pressure ratio so that a stable constant-gas-flow rate can be achieved through the bypass holes by use of the convergent/diver-gent profile, in which the gas enters through a nozzle section, sta-bilizes at the throat, and recovers the pressure through a diffuser section. The nozzle converts the high-pressure energy into velocity energy, and the diffuser regains the pressure back before it exits the hole. At a predefined inlet pressure and area of cross section of the hole, a properly designed convergent nozzle with a throat sec-tion will provide maximum critical flow rate at the exit by reducing the gas pressure to the critical pressure ratio (Fig. 18). However, with assistance from the diffuser section, the high-velocity energy is converted back into pressure energy, and the line pressure is re-gained up to 90% of the upstream pressure.
Salient Features of the New Geometry.� In conventional bypassing, increase in bypass area reduces the
CD�DQG�ǻP, and hence does not increase gas-flow rate corre-spondingly. This is evident from experiments.� New, innovative bypass-hole geometry design (convergent/di-
vergent nozzle design at the center) maintains high gas-flowUDWH�DW�KLJKHU�ǻP.� The throat diameter is decided on the basis of the quantity of
gas bypass required.� At the throat, sonic velocity is achieved with critical gas-
flow rate (Fig. 19).� In the diffuser section, the pressure energy is recovered.� In the diffuser section, the pressure energy is recovered even
up to 90%� In the nozzle and diffuser section, the isentropic expansion
and compression process is anticipated.� Material selection shall be low-temperature carbon steel/stain-
less steel to withstand low temperature.
Typical Design of Convergent/Divergent Profile.�� Oil rate = 70,000 BOPD; gas/oil ratio = 1,300 scf/STB; water
content = 8%; source pressure = 17 barg; sink pressure = 7 barg.� Total gas at starting point = 90 MMscf/D.� Critical gas-flow rate at 17 barg = 43 MMscf/D.� Calculated throat diameter = 7.5 cm.� Critical pressure at throat = 17×0.53 = 9.01 barg.�� Considering an angle of convergence of 10° (total), the length of
the convergent section = 149 cm, with an inlet diameter of 23 cm.For isentropic flow at Po = 17 barg, To = 293 K, A* = 44.156 cm2
(throat diameter = 7.5 cm), and gas density ρ0 = Po/RTo = 21.41 kg/m3. Sound velocity at the entrance and the throat and gas velocity at the entrance and the throat are calculated along with density. The diffuser diameter is calculated at M2 = 0.10 and M2 = 0.05, which is 18.1 and 25.5 cm, respectively. Diffuser length (L) is calculated as shown in Fig. 20.
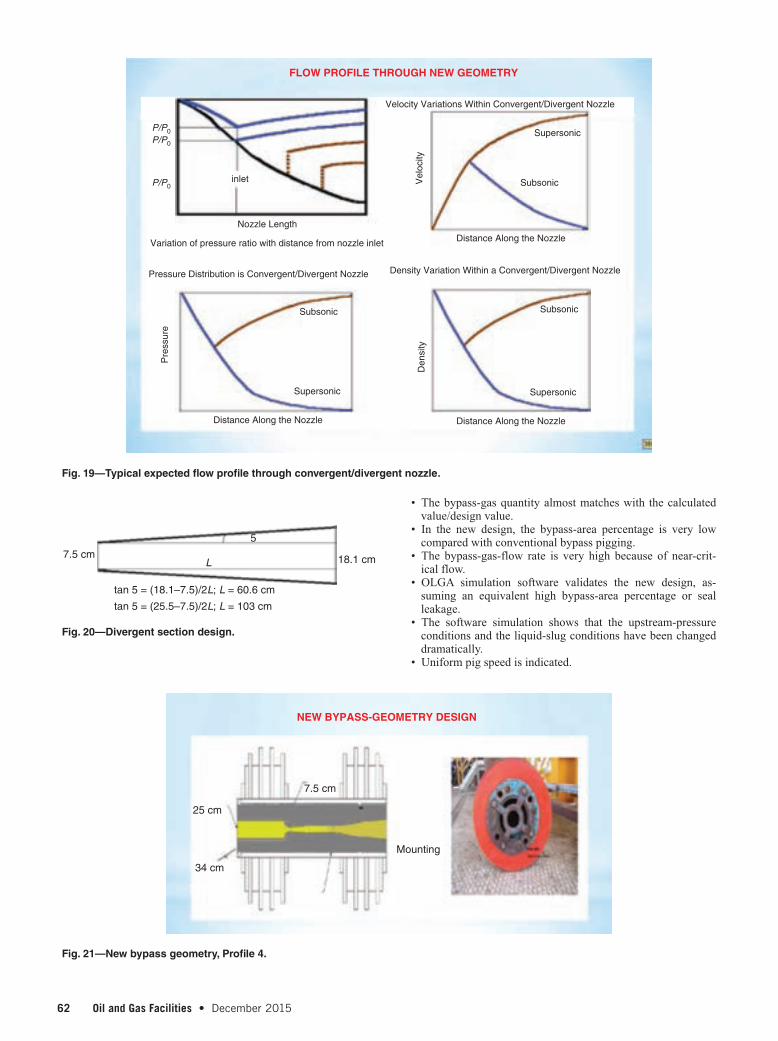
Profile 4: New Profile With Convergent/Divergent Geometry. The inlet diameter of the hole is 25 cm, the throat diameter is 7.5 cm, the exit-diffuser diameter is 18.1 cm, and the overall length is 105 cm (Fig. 21).
The additional force that is exerted on the diffuser wall is also calculated. This force is equal to the thrust of the flow in the back-ward direction, which is equal to the change in the impulse function:
= N ................................................................(15)
The pig body shall be able to withstand this additional force acting on it because of the new profile.
Table 3 shows the validation of bypass-gas-flow rate observed during pigging operations using the new profile with the calculated bypass-gas-flow rate with the Thornhill-Craver equation.
Inlet
fluid
Modified pig body
Discharge
fluid
Fig. 17—Innovative new geometry pro�le.
12 000
10 000
8000
6000Qg
4000
2000
0
0 0.1 0.2 0.3 0.4 0.5 0.6 0.7 0.8 0.9
Old profile
New profile
1
Pressure Ratio
Orifice
Convergent divergent
CRITICAL FLOW RATE
Fig. 18—Typical expected �ow pro�le through convergent/divergent nozzle.
62 Oil and Gas Facilities • December 2015
• The bypass-gas quantity almost matches with the calculatedvalue/design value.• In the new design, the bypass-area percentage is very low
compared with conventional bypass pigging.• The bypass-gas-flow rate is very high because of near-crit-
ical flow.• OLGA simulation software validates the new design, as-
suming an equivalent high bypass-area percentage or sealleakage.• The software simulation shows that the upstream-pressure
conditions and the liquid-slug conditions have been changeddramatically.• Uniform pig speed is indicated.
25 cm
34 cm
7.5 cm
Mounting
NEW BYPASS-GEOMETRY DESIGN
Fig. 21—New bypass geometry, Pro�le 4.
7.5 cm
tan 5 = (18.1–7.5)/2L; L = 60.6 cm
L
5
18.1 cm
tan 5 = (25.5–7.5)/2L; L = 103 cm
Fig. 20—Divergent section design.
Nozzle Length
Variation of pressure ratio with distance from nozzle inlet
Pressure Distribution is Convergent/Divergent Nozzle Density Variation Within a Convergent/Divergent Nozzle
Subsonic
Supersonic
Subsonic
De
nsity
Ve
locity
Velocity Variations Within Convergent/Divergent Nozzle
FLOW PROFILE THROUGH NEW GEOMETRY
Distance Along the Nozzle
Distance Along the Nozzle
Supersonic
Subsonic
Supersonic
Distance Along the Nozzle
Pre
ssu
re
inlet
P/P0
P/P0
P/P0
Fig. 19—Typical expected �ow pro�le through convergent/divergent nozzle.
December 2015 • Oil and Gas Facilities 63
• The software simulation shows that the accumulated liquidand surge liquid are reduced.• The simulation shows a no-pig-travel status as a result of high seal
leakage, which is a limitation of the OLGA simulation software.
Experimental Results and Analysis• With the new geometry, gas quantity and liquid quantity increased.
Gas-flow rate need not be curtailed, unlike in previous cases. High gas rate of 85 to 90 MMscf/D was maintained during pigging.• The design bypass-gas quantity was 43 MMscf/D; however, the
actual achievement was approximately 38 MMscf/D, which is inline with expectations, considering many influencing parameters(Figs. 22 through 24).• The backpressure rise was much lower than expected, unlike
conventional bypass pigging of previous cases.• There was not much temperature-reduction effect noticed
during the operation.• Slug-catcher liquid-withdrawal rate and level were better con-
trolled with the help of the flow-control valve.• The pig-generated volume was controlled effectively.
Fig. 22—Pigging results with new geometry, Pro�le 4.
• Properly designed bypass geometry can minimize the liquid/solid surge effectively by spreading the collected liquid/solidin front of the pig.
ConclusionThe new profile will ensure sufficient bypass-gas quantity through the pig, which is required for very efficient and effective pigging operation, without compromising differential pressure and while avoiding the pig becoming stuck. The availability of more bypass quantity will reduce the high amount of pig-generated-liquid volume and enable delivery of a uniformly mixed fluid during the pigging time. This will also avoid high slugging during pigging and eliminate the requirement for a large slug-catching-facility arrangement. This will enable ease of compressor operation during the pigging time by minimizing the gas-quantity fluc-tuation. The following are major conclusions of this study:• The existing normal square-edged hole operates in the sub-
critical region of the pipeline. The present bypass-hole config-uration induces variable gas-flow rate through the pig, whichcan cause pressure fluctuations in the pipeline, leading to in-stability in flow.
Table 3—Validation data for actual and calculated gas-flow rate.
64 Oil and Gas Facilities • December 2015
• Modified convergent/divergent-type bypass-geometry profiles were designed on the basis of the continuity equation to achieve critical flow at a lower pressure differential across the pig. • The experiments carried out on modified profiles indicated that
critical flow rate through convergent/divergent nozzles was achieved at ratio of downstream pressure to upstream pressure of 87 to 82% for smaller hole sizes of 3/16, 1/4, and 5/16 in. sizes compared with 53% in existing square-edged bypass holes. • The results indicate that the increase in area ratio of exit to
throat section beyond a limit did not result in greater pressure recovery.
• The most-ideal total angle of convergence, as indicated from test results, is approximately 10 to 12°. • Care shall be taken during material selection of the pig body
in view of the anticipated temperature drop across the nozzle. Additional care shall also be taken in design to account for the additional force exerted on the diffuser wall of the pig ge-ometry.• The effectiveness of wax removal/disintegration with the by-
pass pig of new geometry is better.• Effective slug control/process operation/backpressure reduc-
Fig. 23—Pigging results with new geometry, Pro�le 4.
December 2015 • Oil and Gas Facilities 65
η = contact friction coefficient ρ = density of the transport medium, kg/m3
AcknowledgmentsThe authors thank the management of Dragon Oil for giving per-mission to publish this paper and the field-operation team for sharing the experimental data and valuable discussions.
ReferencesLee, H. S., Agustiawan, D., Jati, K. et al. 2012. By-pass Pigging Opera-
tion Experience and Flow Assurance Study. Presented at the Offshore
Tiratsoo, J. N. H. 1999. Pipeline Pigging and Inspection Technology, 2nd
edition. Houston: Gulf Publishing Company.
Recommended ReadingBrennen, C. E. 2009. Fundamentals of Multiphase Flows. New York, New
York: Cambridge University Press.
Nieckele, A. O., Braga, A. M. B., and Azevedo, L. F. A. 2001. Transient Pig
Motion Through Gas and Liquid Pipelines. J. Energy Resour. 123 (4):
260–269. http://dx.doi.org/10.1115/1.1413466.
Sasidharan Adiyodi Kenoth is the head of process engineering at
Dragon Oil. He has been with the company for more than 8 years
and in the oil industry for more than 27 years, with wide experience
in operations management, facility engineering, and project manage-
ment. Kenoth’s current research interests include multiphase flow and
flow assurance. He holds B-Tech and MBA degrees and is pursuing
a PhD degree. Kenoth is the author of a past SPE paper, and he is a
member of SPE and the American Society of Mechanical Engineers.
Kenoth is the recipient of the 2014 Innovation Award from Dragon Oil.
Ali Al Matar is an engineering manager with Dragon Oil. He has more
than 28 years of experience in the oil and gas industry, mostly with
Saudi Aramco. Al Matar has expertise in the engineering and project
management of large-scale gas-treatment plants. He is a chemical en-
gineer and holds a master’s degree in construction engineering man-
agement.
D. K. Gupta is a professor and head of the Petroleum and Earth Science
Department at the University of Petroleum and Energy Studies, India.
He had many years of industrial experience before entering into aca-
demics. Gupta has authored or coauthored several technical papers, is
an expert in drilling technology, and is a member of SPE.
• The new-geometry bypass pigging is used to reduce the pig-ging risks, such as separator trip caused by a surge in liquid/solids and the potential for lost production as the result of a stuck pig. • Only limited success in predicting slug size, slug duration, and
backpressure rise has been reported in bypass pigging through use of software simulation.• Field data and model-prediction results will enable the devel-
opment of liquid-surge prediction practices for pipelines.• Results that are based on the new geometry will help designers
estimate the required surge capacity at the process complex accurately and reduce the capital expenditures of the surface-slug-handling facility.• The new empirical equation and geometry proposed in the
study may be very useful in safe and economical pigging ap-plications in the field.
Nomenclature A = area of the pipeline, m2
Ao = area of the cross section of each bypass hole/orifice, in.2
Cd = discharge coefficient CD = drag coefficient of the pig FD = drag force, N Ff = contact friction force F2, F1 = impulse function k = specific-heat ratio Cp/Cv
kd = disk-diameter ratio n1, n2 = number of moles of gas at different pressures N = total normal forces (weight of the pig), N Pp = pressure difference across the pig P1 = initial pressure, psia P2 = final pressure, psia Q = bypass-gas-flow rate, MMscf/D r = P2/P1
R = universal gas constant Sp = specific gravity of gas T = force on the diffuser Tg = gas temperature, °R
T1 = initial or standard temperature, °R T2 = final or actual temperature, °R V = velocity of the transportation fluid, m/s Vd = velocity difference between the fluid mixture and the
pig, m/s Vp = velocity of the pig, m/s V1 = initial volumetric-flow rate (standard volumetric rate),
m3/s V2 = final volumetric-flow rate (actual volumetric rate at
pressure), m3/s z1, z2 = compressibility factors at different pressures