Page 1
SR Research Report 2014/04/10
SBS Holdings, Inc.(2384)
Shared Research Inc. has produced this report by request from the company discussed in the report. The aim is
to provide an “owner’s manual” to investors. We at Shared Research Inc. make every effort to provide an
accurate, objective, and neutral analysis. In order to highlight any biases, we clearly attribute our data and
findings. We will always present opinions from company management as such. Our views are ours where stated.
We do not try to convince or influence, only inform. We appreciate your suggestions and feedback. Write to us at
[email protected] or find us on Bloomberg.
Page 2
SBS Holdings, Inc.(2384)
2014/04/10
http://www.sharedresearch.jp/ Copyright (C) Shared Research Inc. All Rights Reserved 2/50
SR Research Report
Contents
Executive summary ................................................................................. 3
Key financial data .................................................................................... 4
Recent updates ....................................................................................... 5
Highlights ............................................................................................ 5
Trends and outlook ............................................................................... 5
Business ................................................................................................ 9
Market and value chain ........................................................................ 32
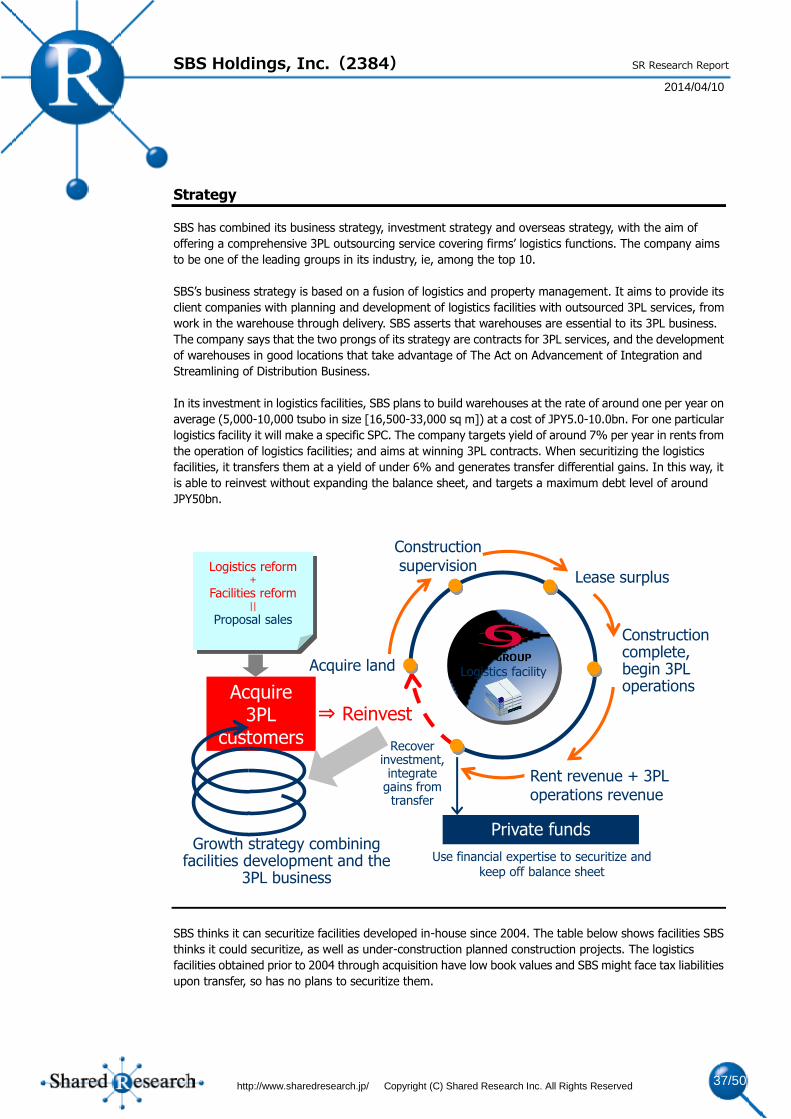
Strategy ............................................................................................ 37
Historical performance ........................................................................... 39
Income statement .............................................................................. 40
Balance sheet .................................................................................... 42
Cash flow statement ........................................................................... 44
Other information .................................................................................. 46
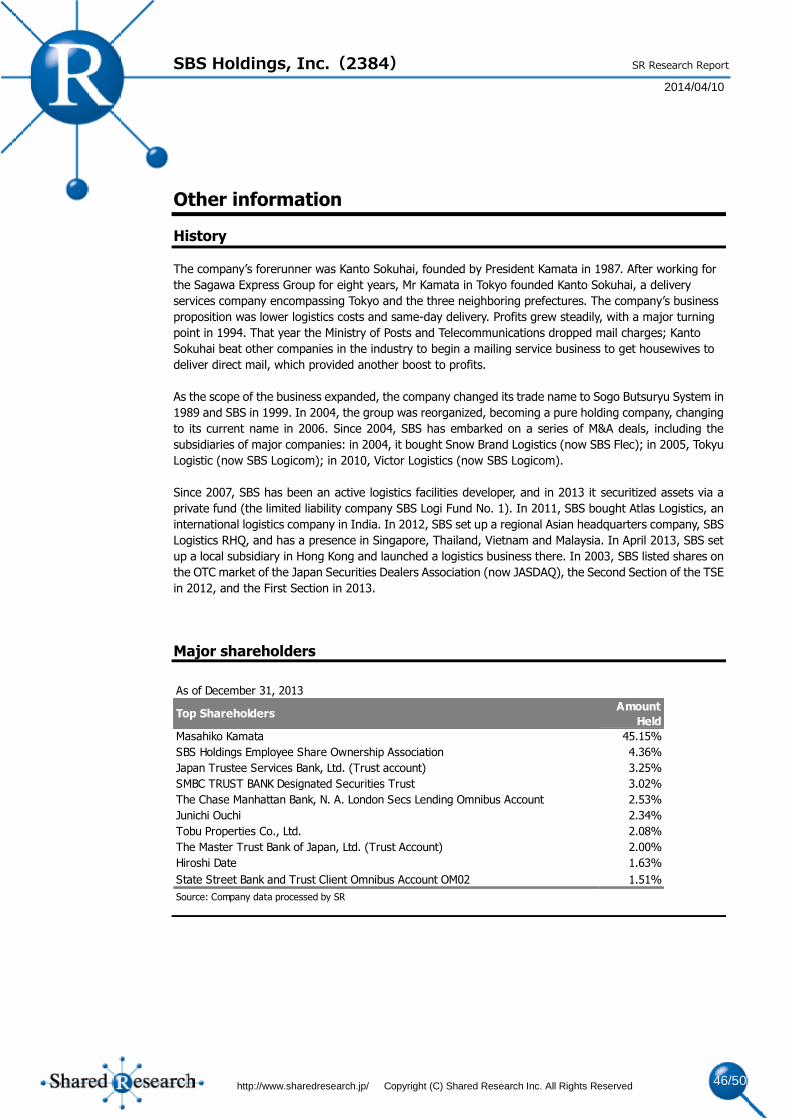
History .............................................................................................. 46
Major shareholders ............................................................................. 46
Top management ................................................................................ 47
Employees ......................................................................................... 47
Shareholder returns ............................................................................ 47
IR ..................................................................................................... 47
By the way ........................................................................................ 48
Company ............................................................................................. 49
Page 3
SBS Holdings, Inc.(2384)
2014/04/10
http://www.sharedresearch.jp/ Copyright (C) Shared Research Inc. All Rights Reserved 3/50
SR Research Report
Executive summary
Business
The logistics business primarily offers company-to-company general logistics, food logistics and specialty
logistics services. The main logistics support service is in property management—SBS develops, rents and
sells logistics facilities. Logistics accounts for the bulk of sales and profits: 93% of sales and 31% of
operating profit in FY12/13.
After just 26 years in business, SBS has grown to annual sales of over JPY130bn in an industry full of
players with more experience. By the end of FY12/13, the company conducted investments of JPY29.7bn
in 25 companies. Companies acquired via M&A include businesses in fields such as food, apparel and
consumables, small lot deliveries, and long distance transport.
Four key growth drivers for the company are M&A, 3PL, overseas expansion, and its logistics facilities
development + private fund system. SBS achieved dramatic growth through M&A, and will continue to
use M&A as well as growth of its 3PL business to accelerate overseas expansion. By adding proprietary
expertise in logistics facilities development, its 3PL business will reach a higher level of competitiveness.
Overseas, increasing the number of logistics hubs providing logistics with Japanese-style quality will be a
key objective. Last, the private fund system will act as an exit strategy for logistics facilities development
with the added benefit of providing gains on transfers. It also serves to foster healthy corporate growth
without weighing down the balance sheet.
Trends
FY12/13 full-year consolidated sales came out at JPY132.2bn (+3.3% YoY), operating profit was
JPY4.1bn (+42.7%), recurring profit was JPY3.8bn (+37.4%), and net income was JPY1.6bn (-4.6%).
The company recorded extraordinary losses of JPY1.3bn, including JPY598mn on relocating and
regrouping logistics centers and brand unification, along with lease cancellation fees as it shut down
offices and warehouses, and other impairment losses.
The company forecasts consolidated sales of JPY135.0bn (+2.1% YoY), operating profit of JPY4.6bn
(+11.1%), recurring profit of JPY4.2bn (+10.5%), and net income of JPY2.5bn (+59.1%) in FY12/14.
In 2017, it will be 30 years since the company’s founding. The company has developed a four-year
medium-term management plan to mark this point in its history. The plan is set to last from FY12/14 to
FY12/17, and is called SBS Growth 2017. By focusing on M&A and development of logistics facilities, the
company hopes to achieve lasting sales growth by developing its overseas businesses—particularly in Asia,
and in the 3PL business. It also hopes that a full-scale move toward low cost operations will help it to
achieve greater profitability and a more solid financial base. Therefore, the company is targeting sales of
JPY200bn in 2017 (CAGR of 14%) and operating profit of JPY8bn (20.3%).
Strengths & weaknesses
SR believes the strengths of the company to be ambitious management hungry for growth, a solid track
record in developing logistics facilities, and a history of successful M&A deals. Weaknesses of the
company are an inherent difficulty in lifting profitability, a need for financial fortification, and limited
opportunities for growth due to insufficient personnel. (see Strengths and weaknesses)
Page 4
SBS Holdings, Inc.(2384)
2014/04/10
http://www.sharedresearch.jp/ Copyright (C) Shared Research Inc. All Rights Reserved 4/50
SR Research Report
Key financial data
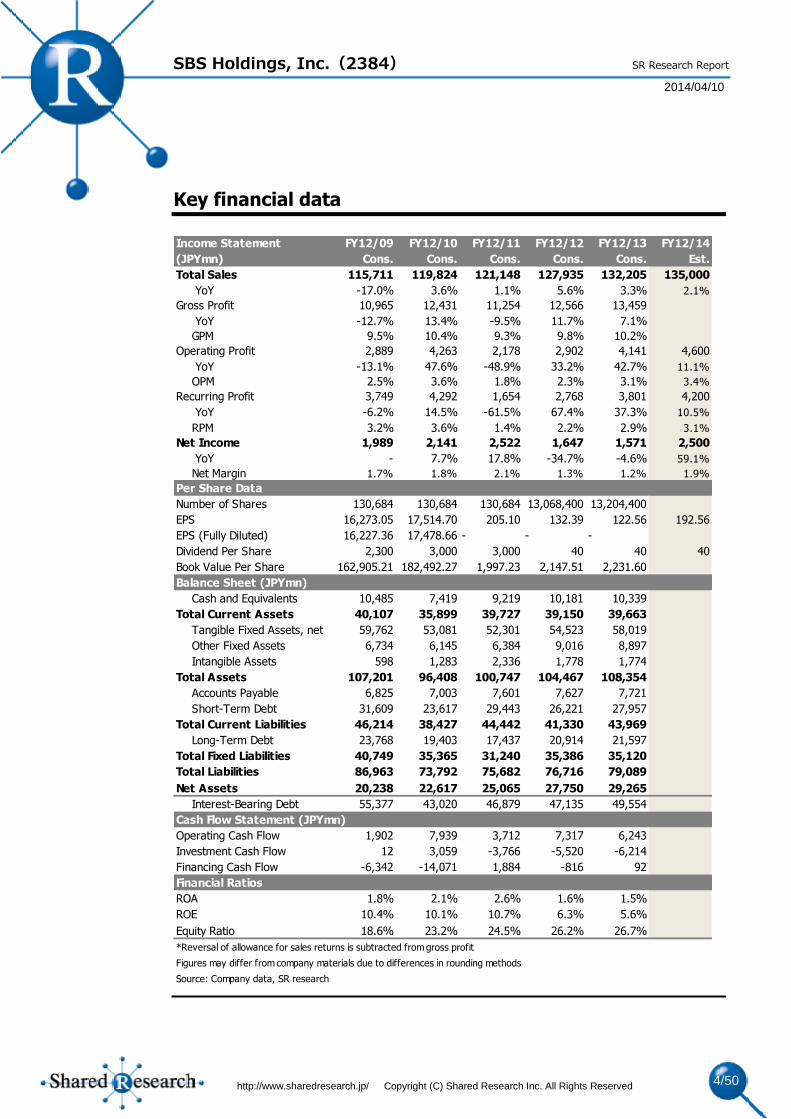
Income Statement FY12/09 FY12/10 FY12/11 FY12/12 FY12/13 FY12/14
(JPYmn) Cons. Cons. Cons. Cons. Cons. Est.
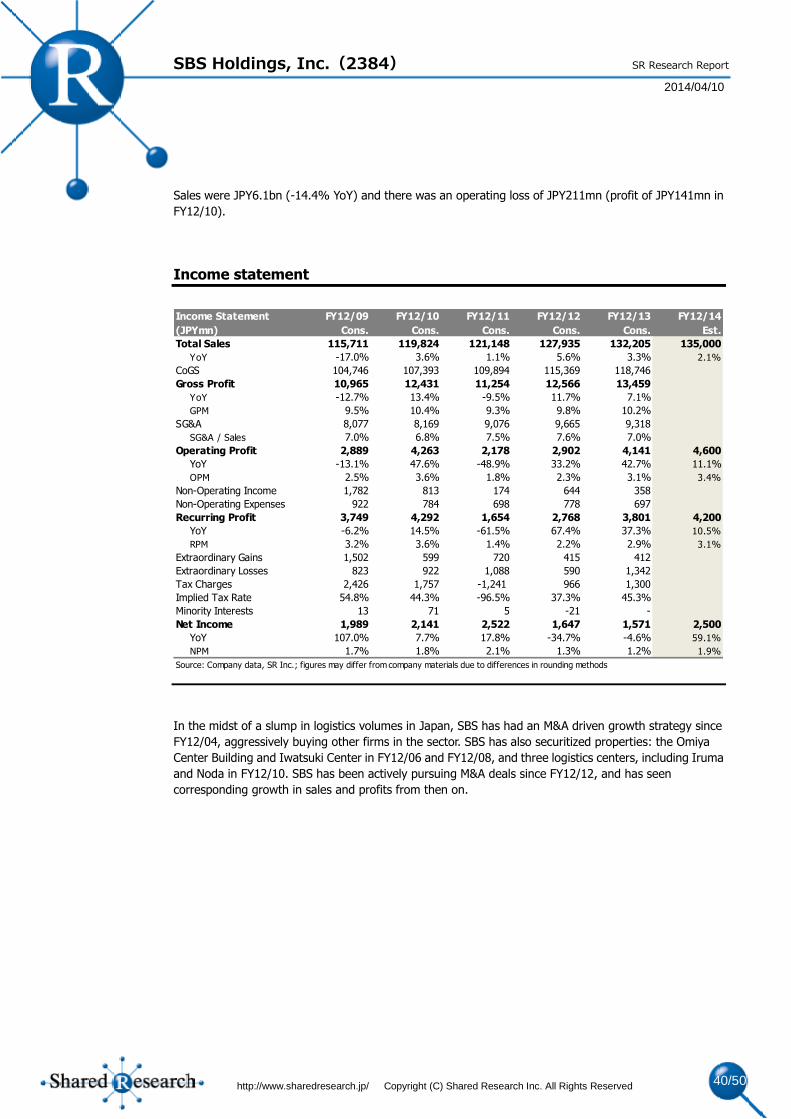
Total Sales 115,711 119,824 121,148 127,935 132,205 135,000
YoY -17.0% 3.6% 1.1% 5.6% 3.3% 2.1%
Gross Profit 10,965 12,431 11,254 12,566 13,459
YoY -12.7% 13.4% -9.5% 11.7% 7.1%
GPM 9.5% 10.4% 9.3% 9.8% 10.2%
Operating Profit 2,889 4,263 2,178 2,902 4,141 4,600
YoY -13.1% 47.6% -48.9% 33.2% 42.7% 11.1%
OPM 2.5% 3.6% 1.8% 2.3% 3.1% 3.4%
Recurring Profit 3,749 4,292 1,654 2,768 3,801 4,200
YoY -6.2% 14.5% -61.5% 67.4% 37.3% 10.5%
RPM 3.2% 3.6% 1.4% 2.2% 2.9% 3.1%
Net Income 1,989 2,141 2,522 1,647 1,571 2,500
YoY - 7.7% 17.8% -34.7% -4.6% 59.1%
Net Margin 1.7% 1.8% 2.1% 1.3% 1.2% 1.9%
Per Share Data
Number of Shares 130,684 130,684 130,684 13,068,400 13,204,400
EPS 16,273.05 17,514.70 205.10 132.39 122.56 192.56
EPS (Fully Diluted) 16,227.36 17,478.66 - - -
Dividend Per Share 2,300 3,000 3,000 40 40 40
Book Value Per Share 162,905.21 182,492.27 1,997.23 2,147.51 2,231.60
Balance Sheet (JPYmn)
Cash and Equivalents 10,485 7,419 9,219 10,181 10,339
Total Current Assets 40,107 35,899 39,727 39,150 39,663
Tangible Fixed Assets, net 59,762 53,081 52,301 54,523 58,019
Other Fixed Assets 6,734 6,145 6,384 9,016 8,897
Intangible Assets 598 1,283 2,336 1,778 1,774
Total Assets 107,201 96,408 100,747 104,467 108,354
Accounts Payable 6,825 7,003 7,601 7,627 7,721
Short-Term Debt 31,609 23,617 29,443 26,221 27,957
Total Current Liabilities 46,214 38,427 44,442 41,330 43,969
Long-Term Debt 23,768 19,403 17,437 20,914 21,597
Total Fixed Liabilities 40,749 35,365 31,240 35,386 35,120
Total Liabilities 86,963 73,792 75,682 76,716 79,089
Net Assets 20,238 22,617 25,065 27,750 29,265
Interest-Bearing Debt 55,377 43,020 46,879 47,135 49,554
Cash Flow Statement (JPYmn)
Operating Cash Flow 1,902 7,939 3,712 7,317 6,243
Investment Cash Flow 12 3,059 -3,766 -5,520 -6,214
Financing Cash Flow -6,342 -14,071 1,884 -816 92
Financial Ratios
ROA 1.8% 2.1% 2.6% 1.6% 1.5%
ROE 10.4% 10.1% 10.7% 6.3% 5.6%
Equity Ratio 18.6% 23.2% 24.5% 26.2% 26.7%
*Reversal of allowance for sales returns is subtracted from gross profit
Figures may differ from company materials due to differences in rounding methods
Source: Company data, SR research
Page 5
SBS Holdings, Inc.(2384)
2014/04/10
http://www.sharedresearch.jp/ Copyright (C) Shared Research Inc. All Rights Reserved 5/50
SR Research Report
Recent updates
Highlights
SR initiates coverage of SBS Holdings, Inc. with this report.
Trends and outlook
Quarterly trends and results
FY12/13 results
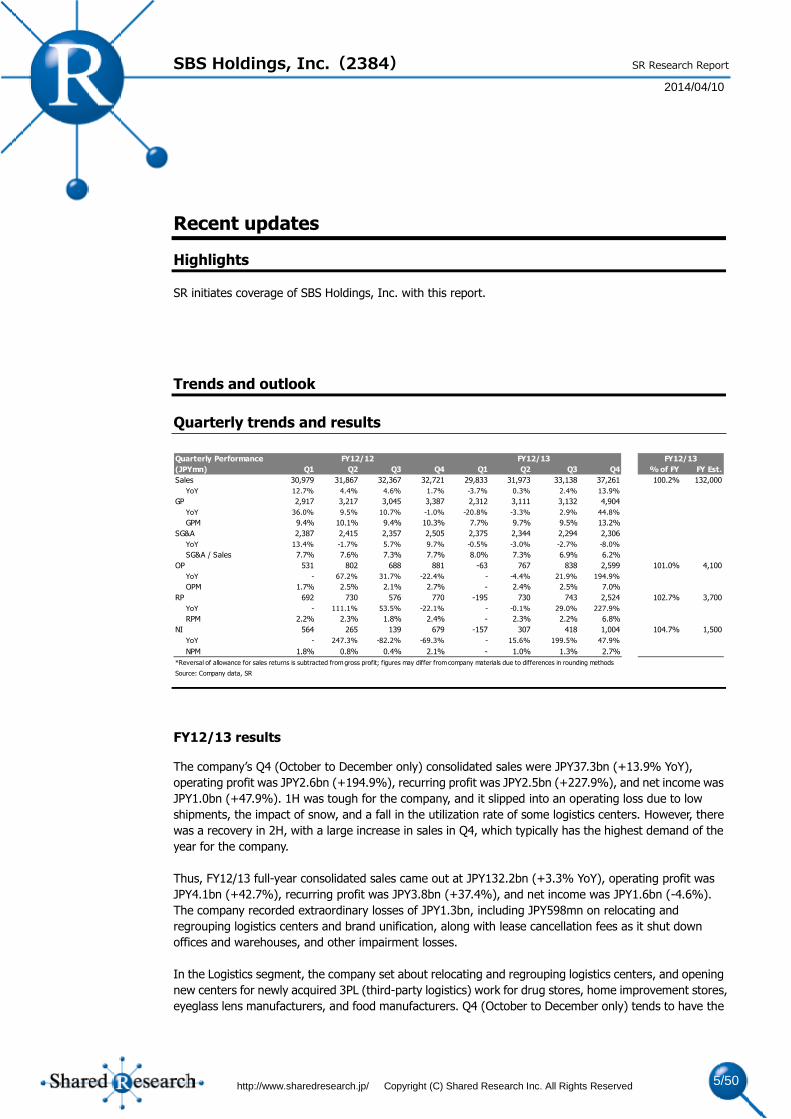
The company’s Q4 (October to December only) consolidated sales were JPY37.3bn (+13.9% YoY),
operating profit was JPY2.6bn (+194.9%), recurring profit was JPY2.5bn (+227.9%), and net income was
JPY1.0bn (+47.9%). 1H was tough for the company, and it slipped into an operating loss due to low
shipments, the impact of snow, and a fall in the utilization rate of some logistics centers. However, there
was a recovery in 2H, with a large increase in sales in Q4, which typically has the highest demand of the
year for the company.
Thus, FY12/13 full-year consolidated sales came out at JPY132.2bn (+3.3% YoY), operating profit was
JPY4.1bn (+42.7%), recurring profit was JPY3.8bn (+37.4%), and net income was JPY1.6bn (-4.6%).
The company recorded extraordinary losses of JPY1.3bn, including JPY598mn on relocating and
regrouping logistics centers and brand unification, along with lease cancellation fees as it shut down
offices and warehouses, and other impairment losses.
In the Logistics segment, the company set about relocating and regrouping logistics centers, and opening
new centers for newly acquired 3PL (third-party logistics) work for drug stores, home improvement stores,
eyeglass lens manufacturers, and food manufacturers. Q4 (October to December only) tends to have the
Quarterly Performance
(JPYmn) Q1 Q2 Q3 Q4 Q1 Q2 Q3 Q4 % of FY FY Est.
Sales 30,979 31,867 32,367 32,721 29,833 31,973 33,138 37,261 100.2% 132,000
YoY 12.7% 4.4% 4.6% 1.7% -3.7% 0.3% 2.4% 13.9%
GP 2,917 3,217 3,045 3,387 2,312 3,111 3,132 4,904
YoY 36.0% 9.5% 10.7% -1.0% -20.8% -3.3% 2.9% 44.8%
GPM 9.4% 10.1% 9.4% 10.3% 7.7% 9.7% 9.5% 13.2%
SG&A 2,387 2,415 2,357 2,505 2,375 2,344 2,294 2,306
YoY 13.4% -1.7% 5.7% 9.7% -0.5% -3.0% -2.7% -8.0%
SG&A / Sales 7.7% 7.6% 7.3% 7.7% 8.0% 7.3% 6.9% 6.2%
OP 531 802 688 881 -63 767 838 2,599 101.0% 4,100
YoY - 67.2% 31.7% -22.4% - -4.4% 21.9% 194.9%
OPM 1.7% 2.5% 2.1% 2.7% - 2.4% 2.5% 7.0%
RP 692 730 576 770 -195 730 743 2,524 102.7% 3,700
YoY - 111.1% 53.5% -22.1% - -0.1% 29.0% 227.9%
RPM 2.2% 2.3% 1.8% 2.4% - 2.3% 2.2% 6.8%
NI 564 265 139 679 -157 307 418 1,004 104.7% 1,500
YoY - 247.3% -82.2% -69.3% - 15.6% 199.5% 47.9%
NPM 1.8% 0.8% 0.4% 2.1% - 1.0% 1.3% 2.7%
*Reversal of allowance for sales returns is subtracted from gross profit; figures may differ from company materials due to differences in rounding methods
Source: Company data, SR
FY12/13FY12/13FY12/12
Page 6
SBS Holdings, Inc.(2384)
2014/04/10
http://www.sharedresearch.jp/ Copyright (C) Shared Research Inc. All Rights Reserved 6/50
SR Research Report
highest demand of any quarter for the company, and this year was no exception with sales of JPY32.0bn
(+4.7% YoY), and operating profit of JPY932mn (+32.0%). Thus, full-year sales for the Logistics segment
were JPY120.8bn (+1.2%), and operating profit—held back by the loss in 1H—was JPY1.2bn (-29.5%).
Also, in November the company purchased land in Yokohama (Isogo, Sugita). It plans to build a 10,000
tsubo (33,000 m2) logistics center there by 2015.
Q4 sales in the Property Management segment were JPY2.9bn, and operating profit was JPY1.2bn. The
company transferred 51% of the trust beneficiary rights of its logistics facilities to SBS Logifund 1, a
private fund operated by a major financial institution. Full-year sales were JPY5.6bn (+121.8% YoY) and
JPY2.6bn (+111.3%), aided by rental income as the company increased its stake of facilities held for
rental purposes.
In terms of other businesses, sales were robust in the Personnel and Industrial Waste Recycling
businesses. In addition, other business sales were boosted by the sales of a new business—Solar Power
Generation—from 2H. However, full-year sales for other businesses nevertheless fell 3.9% YoY to
JPY5.9bn, as the results of a dispatch agency subsidiary were removed from the group’s consolidated
results. Operating profit leaped up 351.0% YoY to JPY202mn, thanks to recovery in the Marketing and
Industrial Waste Recycling businesses, and the contribution of the Personnel business as it moved into the
black.
The net debt/equity ratio was 1.37 (1.39 the previous year). The dividend per share (DPS) was
JPY40—consisting of a regular dividend of JPY30 and a special dividend of JPY10 to commemorate the
company’s listing on the First Section of the Tokyo Stock Exchange (the previous year saw a regular
dividend of JPY30 and a special dividend of JPY10 commemorating the company’s listing on the Second
Section of the TSE). The payout ratio was therefore 32.6%.
In December 2013, the company moved from the Second Section (mid-size companies) of the Tokyo
Stock Exchange to the First Section (large companies).
For details on previous quarterly and annual results, see the Historical performance section.
Full-year (FY12/13) outlook
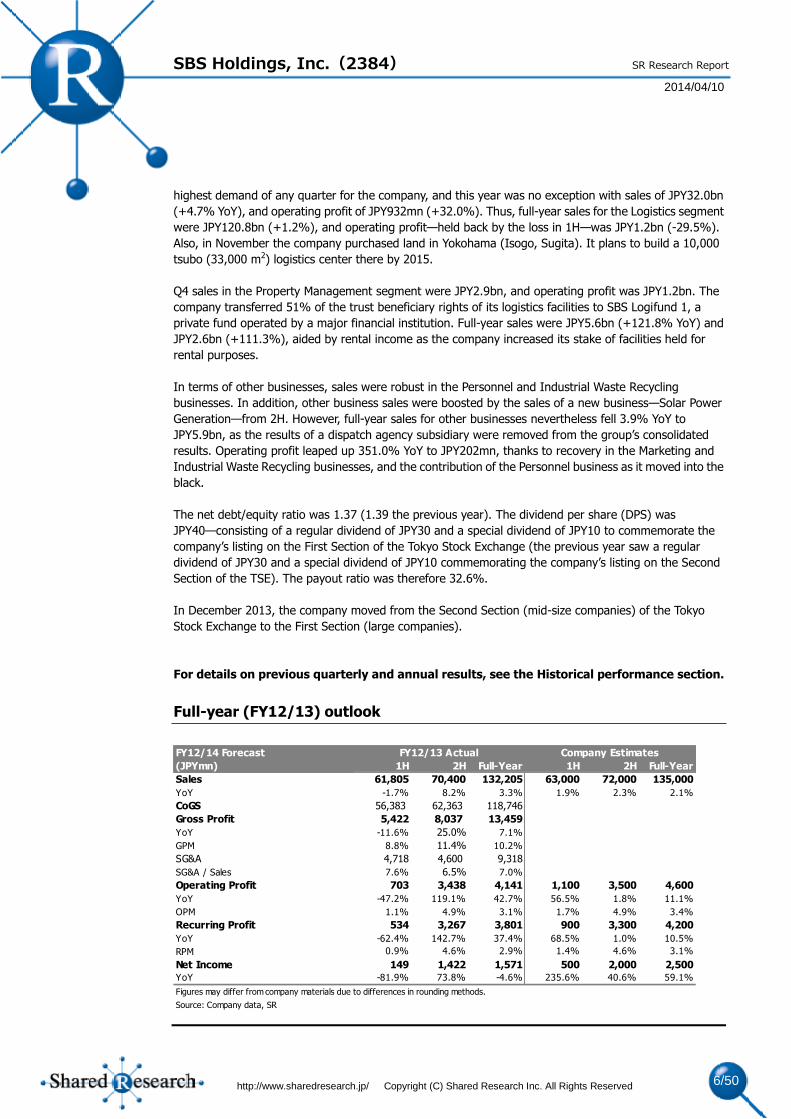
FY12/14 Forecast
(JPYmn) 1H 2H Full-Year 1H 2H Full-Year
Sales 61,805 70,400 132,205 63,000 72,000 135,000
YoY -1.7% 8.2% 3.3% 1.9% 2.3% 2.1%
CoGS 56,383 62,363 118,746
Gross Profit 5,422 8,037 13,459
YoY -11.6% 25.0% 7.1%
GPM 8.8% 11.4% 10.2%
SG&A 4,718 4,600 9,318
SG&A / Sales 7.6% 6.5% 7.0%
Operating Profit 703 3,438 4,141 1,100 3,500 4,600
YoY -47.2% 119.1% 42.7% 56.5% 1.8% 11.1%
OPM 1.1% 4.9% 3.1% 1.7% 4.9% 3.4%
Recurring Profit 534 3,267 3,801 900 3,300 4,200
YoY -62.4% 142.7% 37.4% 68.5% 1.0% 10.5%
RPM 0.9% 4.6% 2.9% 1.4% 4.6% 3.1%
Net Income 149 1,422 1,571 500 2,000 2,500
YoY -81.9% 73.8% -4.6% 235.6% 40.6% 59.1%
Figures may differ from company materials due to differences in rounding methods.
Source: Company data, SR
Company EstimatesFY12/13 Actual
Page 7
SBS Holdings, Inc.(2384)
2014/04/10
http://www.sharedresearch.jp/ Copyright (C) Shared Research Inc. All Rights Reserved 7/50
SR Research Report
The company forecasts consolidated sales of JPY135.0bn (+2.1% YoY), operating profit of JPY4.6bn
(+11.1%), recurring profit of JPY4.2bn (+10.5%), and net income of JPY2.5bn (+59.1%) in FY12/14.
Forecasts by segment:
Logistics: sales JPY123.5bn (+2.2% YoY); operating profit JPY2.0bn (+60.0%);
Property Management: sales JPY5.3bn (-4.6%); operating profit JPY2.4bn (-5.9%);
Other businesses: sales JPY6.2bn (+5.7%); operating profit JPY250mn (+23.8%).
Logistics: the company is forecasting sales of JPY48.0bn (+4.1% YoY) in the 3PL business, as it
strengthens its proposal-based sales. It is also targeting sales of JPY7.7bn (+18.5%) in overseas logistics,
due to bolstered operations in the ASEAN region, India and East Asian region including China. Also, the
company forecasts large increases in profits, in line with the move to a low cost framework for operations.
Property Management: in the rental business, the company expects rental income to fall because it has
securitized a logistics facility (transferring half the trust beneficiary rights of the Kyotanabe facility).
Therefore it forecasts a corresponding fall in sales and profits. In the development business, the company
is planning for securitization of the remaining half of facilities around the Kyotanabe area, continuing from
the previous year. Construction at the Nagatsuta (Yokohama) facility, which is currently under
development, is expected to be completed in November.
Other businesses: the company is expecting the staffing business to maintain solid performance, and is
targeting sales of about JPY200mn in the Solar Power Generation business (sales of JPY100mn the
previous year).
The company is forecasting a jump in net income because it reported extraordinary losses of JPY1.3bn
the previous year. These losses were the result of costs associated with brand unification and the
relocating and regrouping of logistics centers (JPY598mn), along with lease cancellation fees as it shut
down offices and warehouses.
Outlook
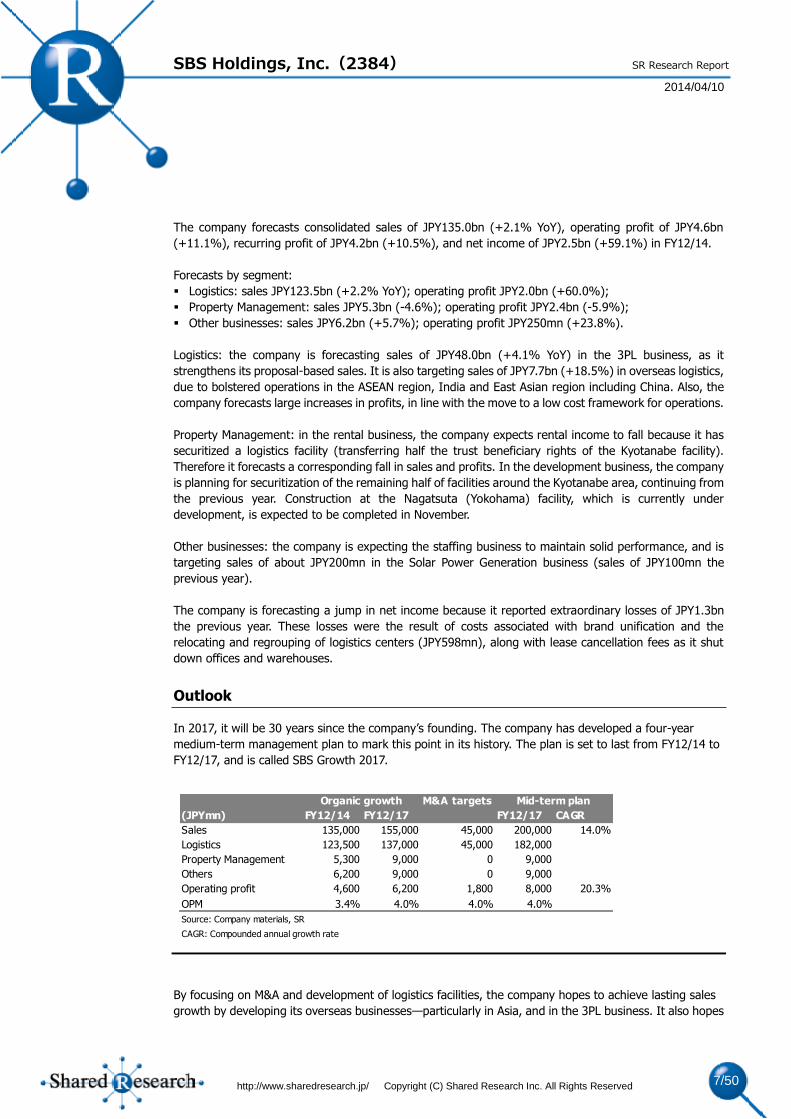
In 2017, it will be 30 years since the company’s founding. The company has developed a four-year
medium-term management plan to mark this point in its history. The plan is set to last from FY12/14 to
FY12/17, and is called SBS Growth 2017.
By focusing on M&A and development of logistics facilities, the company hopes to achieve lasting sales
growth by developing its overseas businesses—particularly in Asia, and in the 3PL business. It also hopes
M&A targets
(JPYmn) FY12/14 FY12/17 FY12/17 CAGR
Sales 135,000 155,000 45,000 200,000 14.0%
Logistics 123,500 137,000 45,000 182,000
Property Management 5,300 9,000 0 9,000
Others 6,200 9,000 0 9,000
Operating profit 4,600 6,200 1,800 8,000 20.3%
OPM 3.4% 4.0% 4.0% 4.0%
Source: Company materials, SR
CAGR: Compounded annual growth rate
Organic growth Mid-term plan
Page 8
SBS Holdings, Inc.(2384)
2014/04/10
http://www.sharedresearch.jp/ Copyright (C) Shared Research Inc. All Rights Reserved 8/50
SR Research Report
that a full-scale move toward low cost operations will help it to achieve greater profitability and a more
solid financial base. Therefore, the company is targeting sales of JPY200bn in 2017 (CAGR of 14%) and
operating profit of JPY8bn (20.3%).
In its 3PL business, the company plans to move into new growth sectors such as consumer goods logistics,
manufacturing logistics, and online retail. Overseas, it will be targeting growth in the ASEAN region, India
and East Asian region including China. It is aiming for sales of JPY70bn in the 3PL business, and JPY30bn
in the International Logistics business, with a total of JPY182.0bn for the Logistics segment as a whole.
The company also plans to grow sales by JPY45bn and operating profit by JPY1.8bn through M&A deals.
The company’s plan calls for an operating profit margin (OPM) of at least 4% (3.1% in FY12/13), and a
return on equity (ROE) of at least 30% (26.7% in FY12/13).
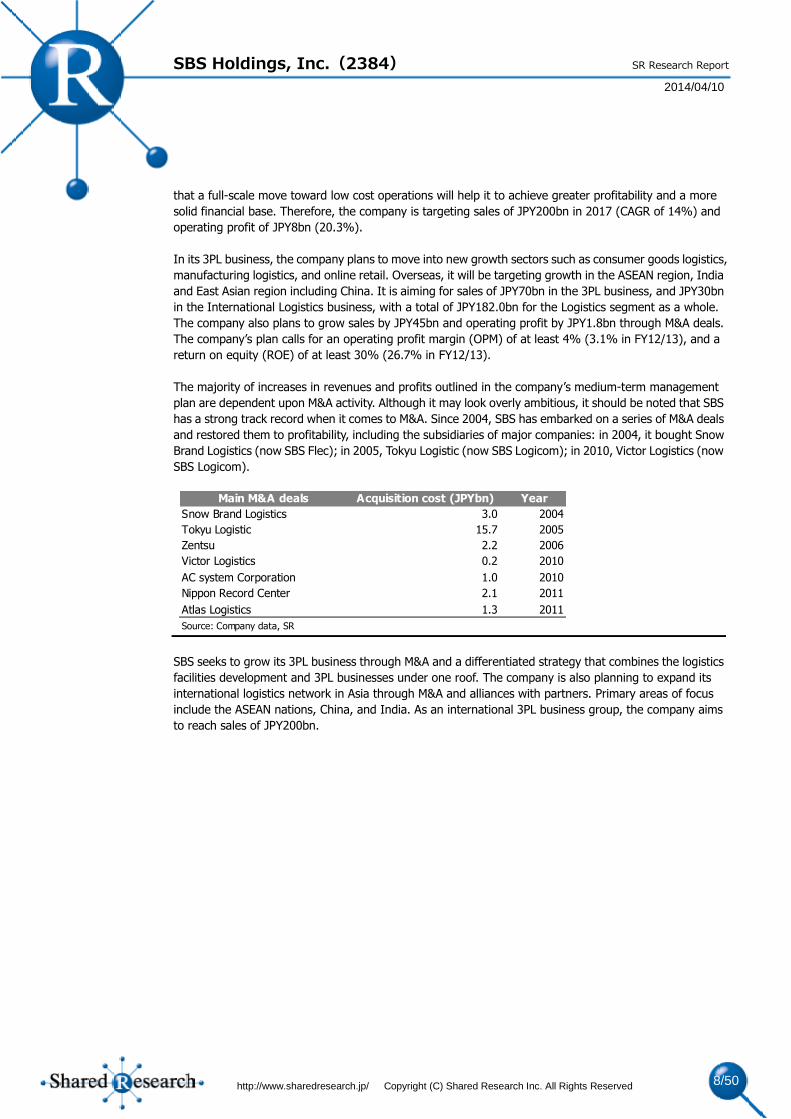
The majority of increases in revenues and profits outlined in the company’s medium-term management
plan are dependent upon M&A activity. Although it may look overly ambitious, it should be noted that SBS
has a strong track record when it comes to M&A. Since 2004, SBS has embarked on a series of M&A deals
and restored them to profitability, including the subsidiaries of major companies: in 2004, it bought Snow
Brand Logistics (now SBS Flec); in 2005, Tokyu Logistic (now SBS Logicom); in 2010, Victor Logistics (now
SBS Logicom).
SBS seeks to grow its 3PL business through M&A and a differentiated strategy that combines the logistics
facilities development and 3PL businesses under one roof. The company is also planning to expand its
international logistics network in Asia through M&A and alliances with partners. Primary areas of focus
include the ASEAN nations, China, and India. As an international 3PL business group, the company aims
to reach sales of JPY200bn.
Main M&A deals Acquisition cost (JPYbn) Year
Snow Brand Logistics 3.0 2004
Tokyu Logistic 15.7 2005
Zentsu 2.2 2006
Victor Logistics 0.2 2010
AC system Corporation 1.0 2010
Nippon Record Center 2.1 2011
Atlas Logistics 1.3 2011
Source: Company data, SR
Page 9
SBS Holdings, Inc.(2384)
2014/04/10
http://www.sharedresearch.jp/ Copyright (C) Shared Research Inc. All Rights Reserved 9/50
SR Research Report
Business
General logistics specialist: logistics is 93% of sales and 30% of operating
profit
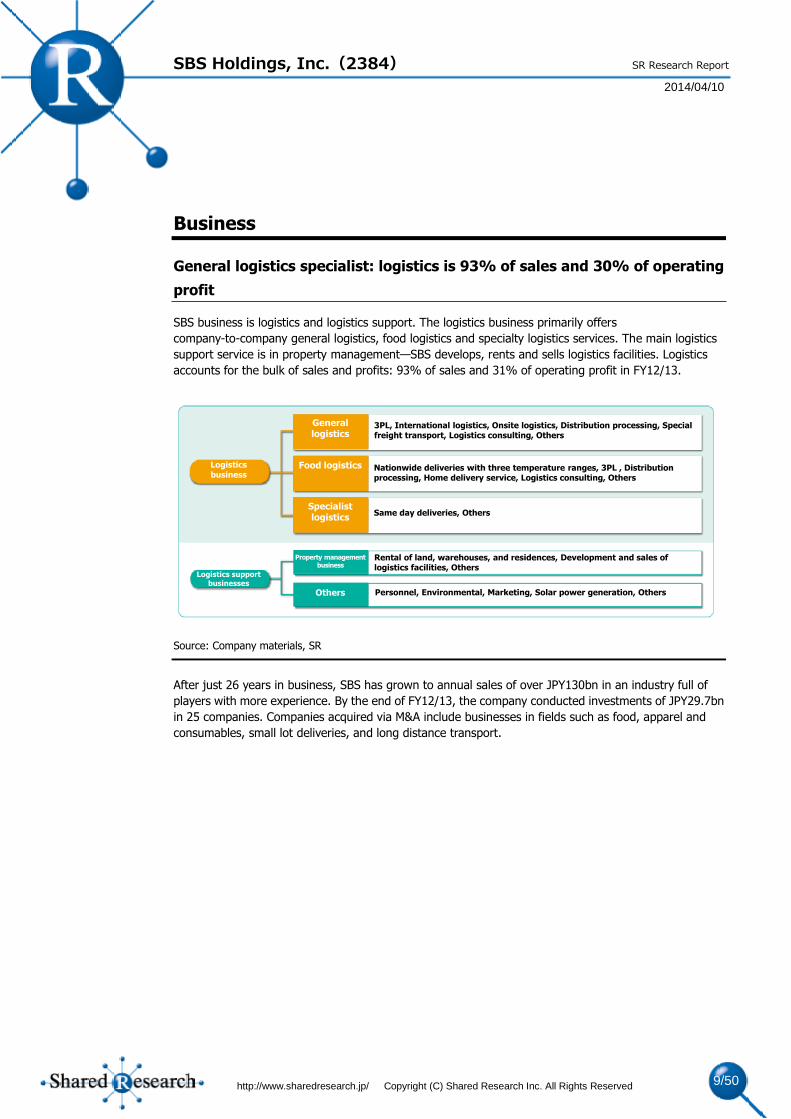
SBS business is logistics and logistics support. The logistics business primarily offers
company-to-company general logistics, food logistics and specialty logistics services. The main logistics
support service is in property management—SBS develops, rents and sells logistics facilities. Logistics
accounts for the bulk of sales and profits: 93% of sales and 31% of operating profit in FY12/13.
Source: Company materials, SR
After just 26 years in business, SBS has grown to annual sales of over JPY130bn in an industry full of
players with more experience. By the end of FY12/13, the company conducted investments of JPY29.7bn
in 25 companies. Companies acquired via M&A include businesses in fields such as food, apparel and
consumables, small lot deliveries, and long distance transport.
Logistics business
General logistics
Food logistics
Specialist logistics
3PL, International logistics, Onsite logistics, Distribution processing, Special freight transport, Logistics consulting, Others
Nationwide deliveries with three temperature ranges, 3PL , Distribution processing, Home delivery service, Logistics consulting, Others
Same day deliveries, Others
Logistics support businesses
Property management business
Others
Rental of land, warehouses, and residences, Development and sales of logistics facilities, Others
Personnel, Environmental, Marketing, Solar power generation, Others
Page 10
SBS Holdings, Inc.(2384)
2014/04/10
http://www.sharedresearch.jp/ Copyright (C) Shared Research Inc. All Rights Reserved 10/50
SR Research Report
Source: Company materials, SR
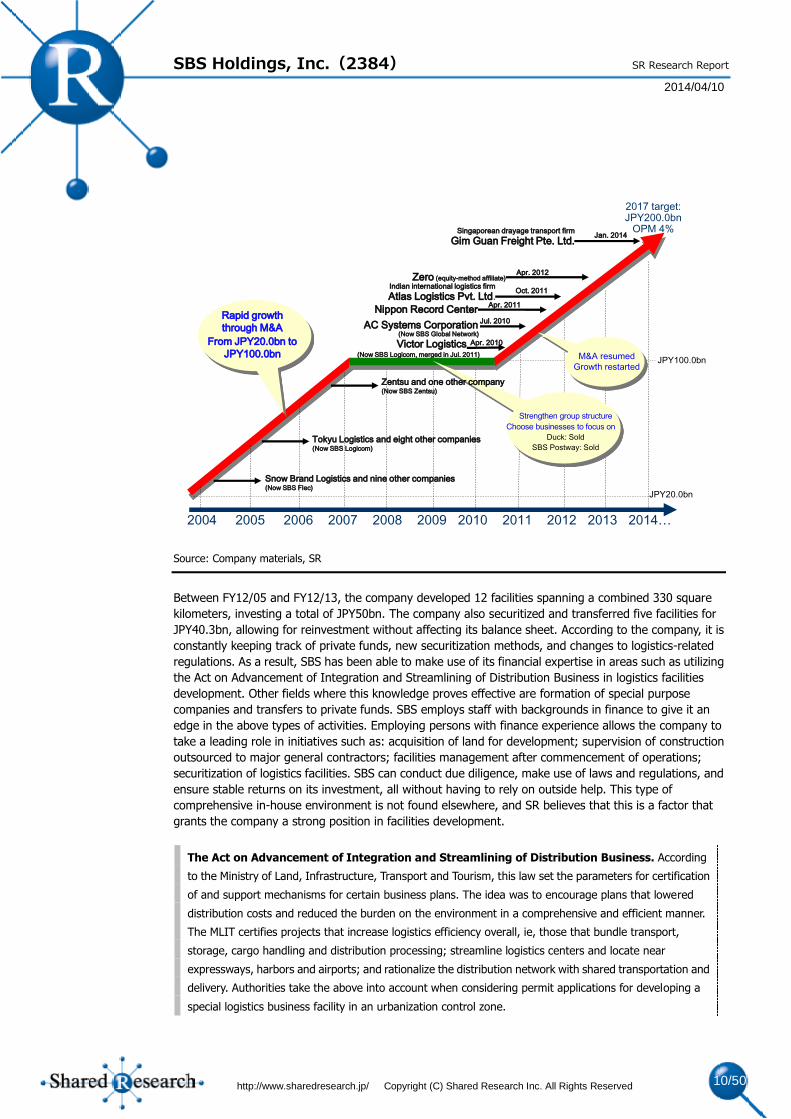
Between FY12/05 and FY12/13, the company developed 12 facilities spanning a combined 330 square
kilometers, investing a total of JPY50bn. The company also securitized and transferred five facilities for
JPY40.3bn, allowing for reinvestment without affecting its balance sheet. According to the company, it is
constantly keeping track of private funds, new securitization methods, and changes to logistics-related
regulations. As a result, SBS has been able to make use of its financial expertise in areas such as utilizing
the Act on Advancement of Integration and Streamlining of Distribution Business in logistics facilities
development. Other fields where this knowledge proves effective are formation of special purpose
companies and transfers to private funds. SBS employs staff with backgrounds in finance to give it an
edge in the above types of activities. Employing persons with finance experience allows the company to
take a leading role in initiatives such as: acquisition of land for development; supervision of construction
outsourced to major general contractors; facilities management after commencement of operations;
securitization of logistics facilities. SBS can conduct due diligence, make use of laws and regulations, and
ensure stable returns on its investment, all without having to rely on outside help. This type of
comprehensive in-house environment is not found elsewhere, and SR believes that this is a factor that
grants the company a strong position in facilities development.
The Act on Advancement of Integration and Streamlining of Distribution Business. According
to the Ministry of Land, Infrastructure, Transport and Tourism, this law set the parameters for certification
of and support mechanisms for certain business plans. The idea was to encourage plans that lowered
distribution costs and reduced the burden on the environment in a comprehensive and efficient manner.
The MLIT certifies projects that increase logistics efficiency overall, ie, those that bundle transport,
storage, cargo handling and distribution processing; streamline logistics centers and locate near
expressways, harbors and airports; and rationalize the distribution network with shared transportation and
delivery. Authorities take the above into account when considering permit applications for developing a
special logistics business facility in an urbanization control zone.
2004 2005 2006 2007 2008 2009 2010 2011 2012 2013 2014…
Snow Brand Logistics and nine other companies (Now SBS Flec)
Tokyu Logistics and eight other companies(Now SBS Logicom)
AC Systems Corporation
Nippon Record CenterRapid growth
through M&A
From JPY20.0bn to
JPY100.0bnJPY100.0bn
JPY20.0bn
2017 target:JPY200.0bn
OPM 4%
Victor Logistics
Indian international logistics firm
Atlas Logistics Pvt. Ltd.
Apr. 2010
Jul. 2010
Apr. 2011
Oct. 2011
(Now SBS Logicom, merged in Jul. 2011)
Strengthen group structure
Choose businesses to focus on
Duck: Sold
SBS Postway: Sold
(Now SBS Global Network)
Zentsu and one other company(Now SBS Zentsu)
M&A resumed
Growth restarted
Zero (equity-method affiliate)Apr. 2012
Singaporean drayage transport firm
Gim Guan Freight Pte. Ltd.Jan. 2014
Page 11
SBS Holdings, Inc.(2384)
2014/04/10
http://www.sharedresearch.jp/ Copyright (C) Shared Research Inc. All Rights Reserved 11/50
SR Research Report
Main business segments
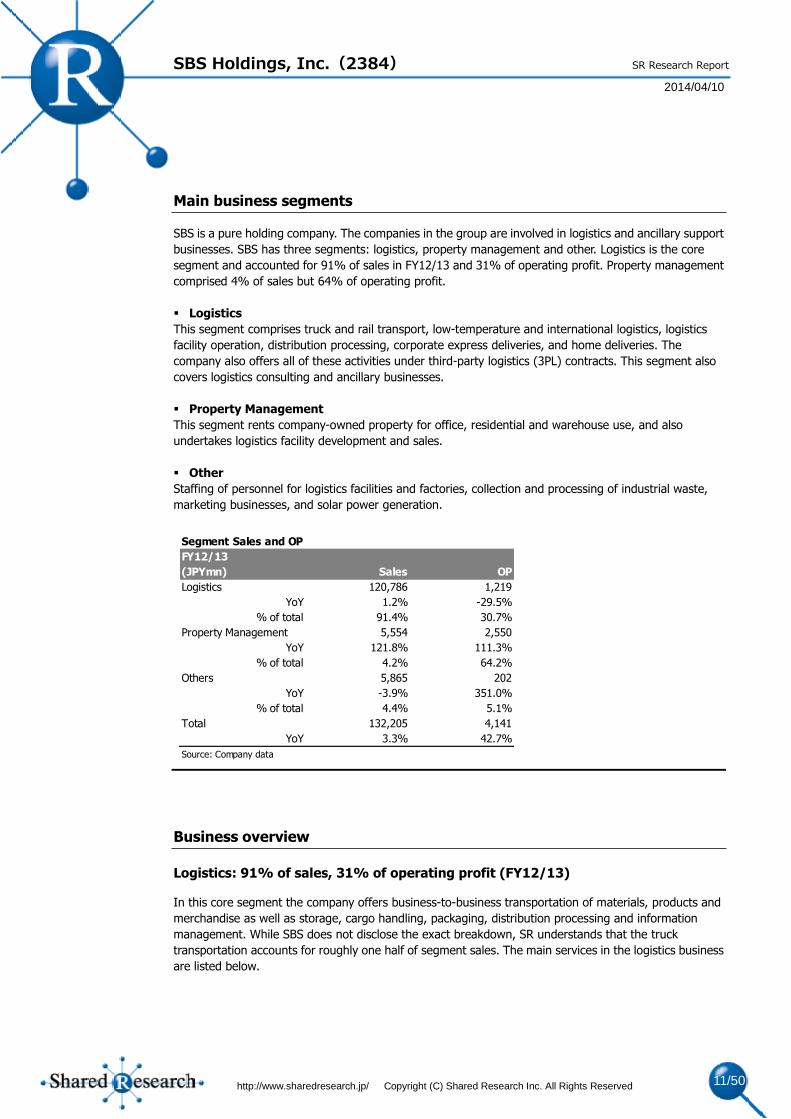
SBS is a pure holding company. The companies in the group are involved in logistics and ancillary support
businesses. SBS has three segments: logistics, property management and other. Logistics is the core
segment and accounted for 91% of sales in FY12/13 and 31% of operating profit. Property management
comprised 4% of sales but 64% of operating profit.
Logistics
This segment comprises truck and rail transport, low-temperature and international logistics, logistics
facility operation, distribution processing, corporate express deliveries, and home deliveries. The
company also offers all of these activities under third-party logistics (3PL) contracts. This segment also
covers logistics consulting and ancillary businesses.
Property Management
This segment rents company-owned property for office, residential and warehouse use, and also
undertakes logistics facility development and sales.
Other
Staffing of personnel for logistics facilities and factories, collection and processing of industrial waste,
marketing businesses, and solar power generation.
Business overview
Logistics: 91% of sales, 31% of operating profit (FY12/13)
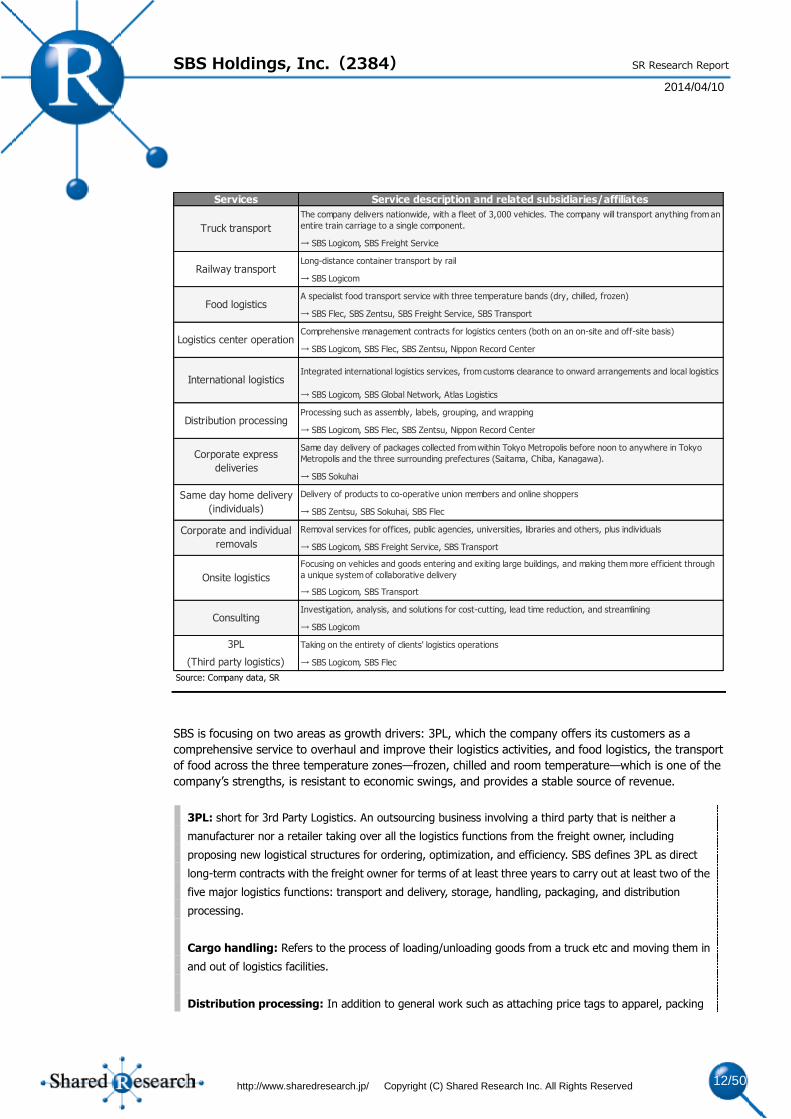
In this core segment the company offers business-to-business transportation of materials, products and
merchandise as well as storage, cargo handling, packaging, distribution processing and information
management. While SBS does not disclose the exact breakdown, SR understands that the truck
transportation accounts for roughly one half of segment sales. The main services in the logistics business
are listed below.
Segment Sales and OP
FY12/13
(JPYmn) Sales OP
Logistics 120,786 1,219
YoY 1.2% -29.5%
% of total 91.4% 30.7%
Property Management 5,554 2,550
YoY 121.8% 111.3%
% of total 4.2% 64.2%
Others 5,865 202
YoY -3.9% 351.0%
% of total 4.4% 5.1%
Total 132,205 4,141
YoY 3.3% 42.7%
Source: Company data
Page 12
SBS Holdings, Inc.(2384)
2014/04/10
http://www.sharedresearch.jp/ Copyright (C) Shared Research Inc. All Rights Reserved 12/50
SR Research Report
SBS is focusing on two areas as growth drivers: 3PL, which the company offers its customers as a
comprehensive service to overhaul and improve their logistics activities, and food logistics, the transport
of food across the three temperature zones—frozen, chilled and room temperature—which is one of the
company’s strengths, is resistant to economic swings, and provides a stable source of revenue.
3PL: short for 3rd Party Logistics. An outsourcing business involving a third party that is neither a
manufacturer nor a retailer taking over all the logistics functions from the freight owner, including
proposing new logistical structures for ordering, optimization, and efficiency. SBS defines 3PL as direct
long-term contracts with the freight owner for terms of at least three years to carry out at least two of the
five major logistics functions: transport and delivery, storage, handling, packaging, and distribution
processing.
Cargo handling: Refers to the process of loading/unloading goods from a truck etc and moving them in
and out of logistics facilities.
Distribution processing: In addition to general work such as attaching price tags to apparel, packing
Services Service description and related subsidiaries/affiliates
The company delivers nationwide, with a fleet of 3,000 vehicles. The company will transport anything from an
entire train carriage to a single component.
→ SBS Logicom, SBS Freight Service
Long-distance container transport by rail
→ SBS Logicom
A specialist food transport service with three temperature bands (dry, chilled, frozen)
→ SBS Flec, SBS Zentsu, SBS Freight Service, SBS Transport
Comprehensive management contracts for logistics centers (both on an on-site and off-site basis)
→ SBS Logicom, SBS Flec, SBS Zentsu, Nippon Record Center
Integrated international logistics services, from customs clearance to onward arrangements and local logistics
→ SBS Logicom, SBS Global Network, Atlas Logistics
Processing such as assembly, labels, grouping, and wrapping
→ SBS Logicom, SBS Flec, SBS Zentsu, Nippon Record Center
Same day delivery of packages collected from within Tokyo Metropolis before noon to anywhere in Tokyo
Metropolis and the three surrounding prefectures (Saitama, Chiba, Kanagawa).
→ SBS Sokuhai
Delivery of products to co-operative union members and online shoppers
→ SBS Zentsu, SBS Sokuhai, SBS Flec
Removal services for offices, public agencies, universities, libraries and others, plus individuals
→ SBS Logicom, SBS Freight Service, SBS Transport
Focusing on vehicles and goods entering and exiting large buildings, and making them more efficient through
a unique system of collaborative delivery
→ SBS Logicom, SBS Transport
Investigation, analysis, and solutions for cost-cutting, lead time reduction, and streamlining
→ SBS Logicom
3PL Taking on the entirety of clients' logistics operations
(Third party logistics) → SBS Logicom, SBS Flec
Source: Company data, SR
Consulting
Distribution processing
Corporate express
deliveries
Same day home delivery
(individuals)
Corporate and individual
removals
Onsite logistics
Truck transport
Railway transport
Food logistics
Logistics center operation
International logistics
Page 13
SBS Holdings, Inc.(2384)
2014/04/10
http://www.sharedresearch.jp/ Copyright (C) Shared Research Inc. All Rights Reserved 13/50
SR Research Report
New Year’s and midsummer gifts in boxes, and replacing labels on imported goods, it can involve
outsourcing some tasks that are often handled on the production line, such as simple assembly and
finishing of products and shrink wrapping.
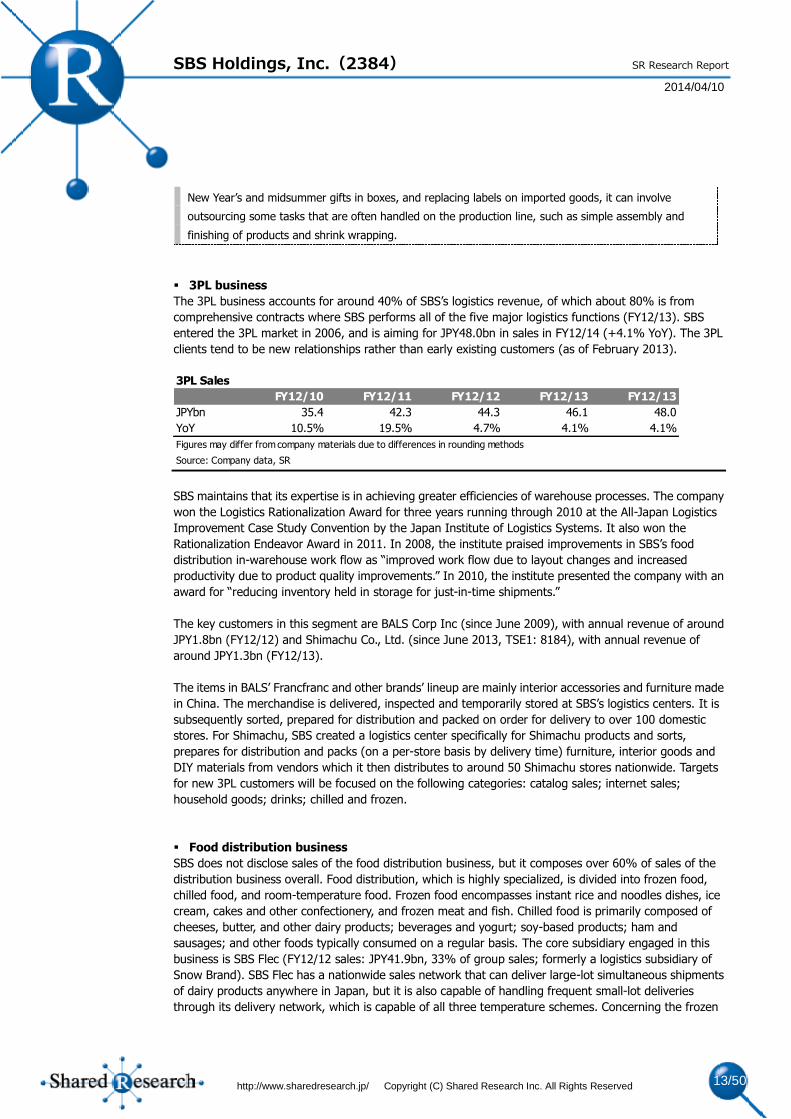
3PL business
The 3PL business accounts for around 40% of SBS’s logistics revenue, of which about 80% is from
comprehensive contracts where SBS performs all of the five major logistics functions (FY12/13). SBS
entered the 3PL market in 2006, and is aiming for JPY48.0bn in sales in FY12/14 (+4.1% YoY). The 3PL
clients tend to be new relationships rather than early existing customers (as of February 2013).
SBS maintains that its expertise is in achieving greater efficiencies of warehouse processes. The company
won the Logistics Rationalization Award for three years running through 2010 at the All-Japan Logistics
Improvement Case Study Convention by the Japan Institute of Logistics Systems. It also won the
Rationalization Endeavor Award in 2011. In 2008, the institute praised improvements in SBS’s food
distribution in-warehouse work flow as “improved work flow due to layout changes and increased
productivity due to product quality improvements.” In 2010, the institute presented the company with an
award for “reducing inventory held in storage for just-in-time shipments.”
The key customers in this segment are BALS Corp Inc (since June 2009), with annual revenue of around
JPY1.8bn (FY12/12) and Shimachu Co., Ltd. (since June 2013, TSE1: 8184), with annual revenue of
around JPY1.3bn (FY12/13).
The items in BALS’ Francfranc and other brands’ lineup are mainly interior accessories and furniture made
in China. The merchandise is delivered, inspected and temporarily stored at SBS’s logistics centers. It is
subsequently sorted, prepared for distribution and packed on order for delivery to over 100 domestic
stores. For Shimachu, SBS created a logistics center specifically for Shimachu products and sorts,
prepares for distribution and packs (on a per-store basis by delivery time) furniture, interior goods and
DIY materials from vendors which it then distributes to around 50 Shimachu stores nationwide. Targets
for new 3PL customers will be focused on the following categories: catalog sales; internet sales;
household goods; drinks; chilled and frozen.
Food distribution business
SBS does not disclose sales of the food distribution business, but it composes over 60% of sales of the
distribution business overall. Food distribution, which is highly specialized, is divided into frozen food,
chilled food, and room-temperature food. Frozen food encompasses instant rice and noodles dishes, ice
cream, cakes and other confectionery, and frozen meat and fish. Chilled food is primarily composed of
cheeses, butter, and other dairy products; beverages and yogurt; soy-based products; ham and
sausages; and other foods typically consumed on a regular basis. The core subsidiary engaged in this
business is SBS Flec (FY12/12 sales: JPY41.9bn, 33% of group sales; formerly a logistics subsidiary of
Snow Brand). SBS Flec has a nationwide sales network that can deliver large-lot simultaneous shipments
of dairy products anywhere in Japan, but it is also capable of handling frequent small-lot deliveries
through its delivery network, which is capable of all three temperature schemes. Concerning the frozen
3PL Sales
FY12/10 FY12/11 FY12/12 FY12/13 FY12/13
JPYbn 35.4 42.3 44.3 46.1 48.0
YoY 10.5% 19.5% 4.7% 4.1% 4.1%
Figures may differ from company materials due to differences in rounding methods
Source: Company data, SR
Page 14
SBS Holdings, Inc.(2384)
2014/04/10
http://www.sharedresearch.jp/ Copyright (C) Shared Research Inc. All Rights Reserved 14/50
SR Research Report
and chilled foods distribution sector, SBS Flec consistently ranks within the top 5 players. SBS Zentsu
(FY12/12 sales: JPY14.3bn, 11% of group sales) has strength in delivering goods to consumer co-ops.
Serving as the main artery connecting the co-op logistics centers with delivery depots, it also delivers
fresh meats and produce directly to co-op member homes. SBS Zentsu is also a unique distribution
company in that it has acquired certification for subdivision of organic produce, allowing it to process and
distribute food as well. As food demand is insensitive to the ups and downs in the economic cycle,
shipment volumes tend to be stable.
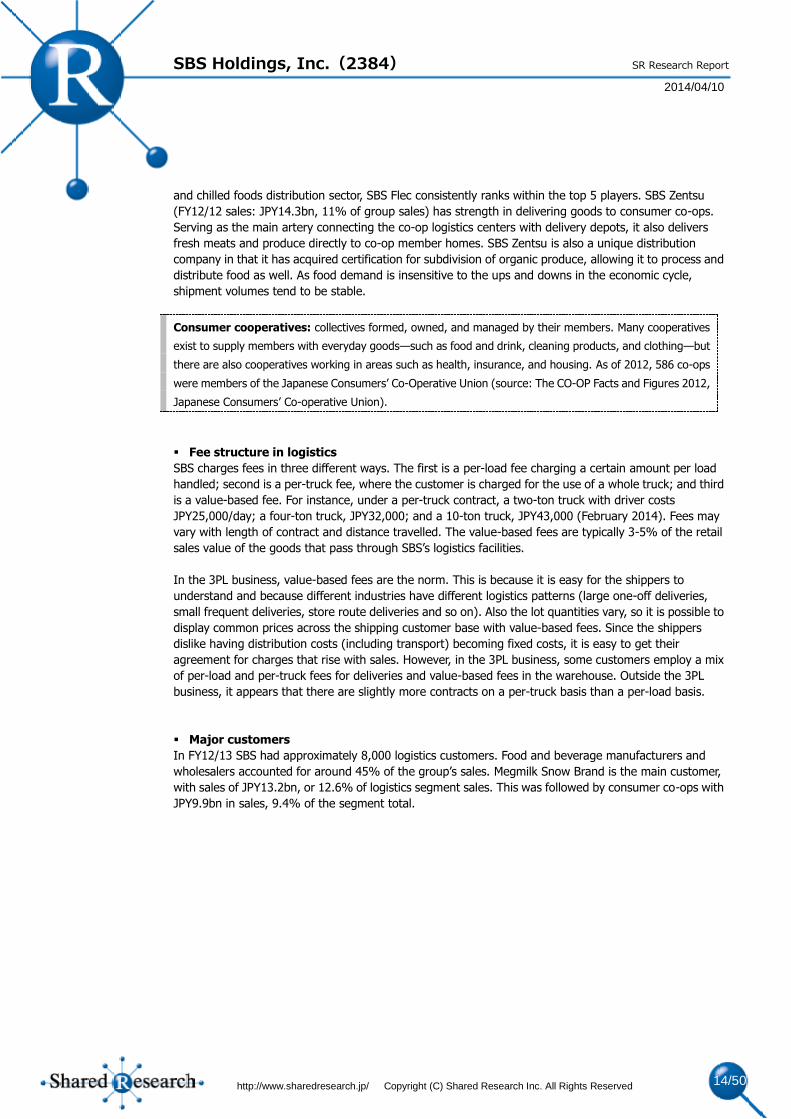
Consumer cooperatives: collectives formed, owned, and managed by their members. Many cooperatives
exist to supply members with everyday goods—such as food and drink, cleaning products, and clothing—but
there are also cooperatives working in areas such as health, insurance, and housing. As of 2012, 586 co-ops
were members of the Japanese Consumers’ Co-Operative Union (source: The CO-OP Facts and Figures 2012,
Japanese Consumers’ Co-operative Union).
Fee structure in logistics
SBS charges fees in three different ways. The first is a per-load fee charging a certain amount per load
handled; second is a per-truck fee, where the customer is charged for the use of a whole truck; and third
is a value-based fee. For instance, under a per-truck contract, a two-ton truck with driver costs
JPY25,000/day; a four-ton truck, JPY32,000; and a 10-ton truck, JPY43,000 (February 2014). Fees may
vary with length of contract and distance travelled. The value-based fees are typically 3-5% of the retail
sales value of the goods that pass through SBS’s logistics facilities.
In the 3PL business, value-based fees are the norm. This is because it is easy for the shippers to
understand and because different industries have different logistics patterns (large one-off deliveries,
small frequent deliveries, store route deliveries and so on). Also the lot quantities vary, so it is possible to
display common prices across the shipping customer base with value-based fees. Since the shippers
dislike having distribution costs (including transport) becoming fixed costs, it is easy to get their
agreement for charges that rise with sales. However, in the 3PL business, some customers employ a mix
of per-load and per-truck fees for deliveries and value-based fees in the warehouse. Outside the 3PL
business, it appears that there are slightly more contracts on a per-truck basis than a per-load basis.
Major customers
In FY12/13 SBS had approximately 8,000 logistics customers. Food and beverage manufacturers and
wholesalers accounted for around 45% of the group’s sales. Megmilk Snow Brand is the main customer,
with sales of JPY13.2bn, or 12.6% of logistics segment sales. This was followed by consumer co-ops with
JPY9.9bn in sales, 9.4% of the segment total.
Page 15
SBS Holdings, Inc.(2384)
2014/04/10
http://www.sharedresearch.jp/ Copyright (C) Shared Research Inc. All Rights Reserved 15/50
SR Research Report
Company-owned trucks; drivers
Almost all SBS trucks are leased by SBS Finance to other group companies. Of the 2,700 trucks in the
group as of December 2013, around 75% were on five- to eight-year leases, with the remaining 25%
owned. Thirty-five percent were small (under five tons); 45% were medium (four tons) and 20% were
large. Small trucks under two tons are depreciated over three years; the rest over four years. Around 70%
of SBS’s trucks are five years old or older (FY12/12). With measures to for greater environmental
regulation in the industry, there is a trend for truck ages to fall.
The group as a whole hires 4,000-5,000 trucks every month, accounted for in vehicle-hire expenses.
Vehicle hire involves hiring a truck with driver from other transport companies. SBS Flec is uses about
3,000 trucks per month under long-term (units are years) contracts.
SBS’s truck drivers are either regular employees or contract employees. Contract employees are under
long-term contracts lasting several years. Under transport regulations set by the Road Transportation Act,
the employment of day laborer truck drivers is prohibited, as it is impossible to manage safety. In line with
other industry players, most of SBS’s drivers are over 40 years of age. The number of drivers is gradually
declining and there appears to be a shortage.
Property Management business: 4% share of sales, 64% share of operating profit
(FY13/12)
There are two divisions in the property management business: a rental business that leases the
company-owned facilities for use as warehouses, offices and residences, as well as the development
business, which develops and sells logistics facilities.
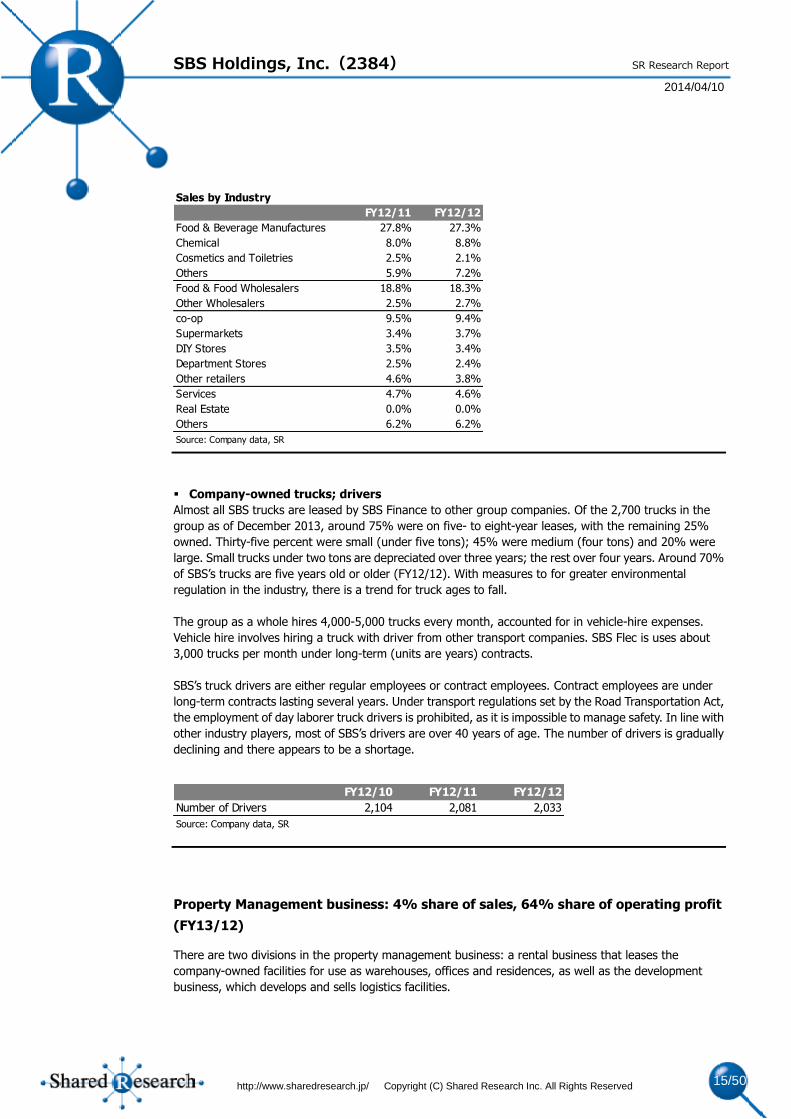
Sales by Industry
FY12/11 FY12/12
Food & Beverage Manufactures 27.8% 27.3%
Chemical 8.0% 8.8%
Cosmetics and Toiletries 2.5% 2.1%
Others 5.9% 7.2%
Food & Food Wholesalers 18.8% 18.3%
Other Wholesalers 2.5% 2.7%
co-op 9.5% 9.4%
Supermarkets 3.4% 3.7%
DIY Stores 3.5% 3.4%
Department Stores 2.5% 2.4%
Other retailers 4.6% 3.8%
Services 4.7% 4.6%
Real Estate 0.0% 0.0%
Others 6.2% 6.2%
Source: Company data, SR
FY12/10 FY12/11 FY12/12
Number of Drivers 2,104 2,081 2,033
Source: Company data, SR
Page 16
SBS Holdings, Inc.(2384)
2014/04/10
http://www.sharedresearch.jp/ Copyright (C) Shared Research Inc. All Rights Reserved 16/50
SR Research Report
Rental business
The rental business involves the rental of assets acquired by the company through M&A, and rental of
logistics facilities. Group companies such as SBS Logicom and SBS Transport that own real estate rent it to
third parties, mainly in the Tokyo Metro Area. The rental buildings are mainly used for logistics, although
there are also office buildings, residences and open land among them as well.
According to SBS, in FY12/13 the yield on rental properties (relative to then-current market values) was
5% for both offices and residential property, and 7.5% for logistics facilities. However, some of the
properties acquired through M&A have low book values. In FY12/12, the vacancy rate for offices and
residential were both under 3%. Because the offices are in prime urban locations, vacancy rates are low.
Most of the residential property is rented by companies for worker accommodation, so vacancy rates are
low there as well. For logistics facilities, those customers that only pay rent on warehouses are accounted
for in the property management business, but warehouse storage undertaken as part of 3PL activities is
accounted for by the logistics business. Warehouse rents vary by region, but SBS said that they average
around JPY3,000-JPY4,000/tsubo. Note: tsubo is a unit of area equating to about 3.3m2. As of February
2014, the company currently has over 50 rental properties which include land, warehouses, offices, and
residences. Book values of real estate acquired through M&A of subsidiaries are consolidated at market
values, and SR estimates the current value of these properties to be between JPY15.0bn and JPY20.0bn.
Development business
In 2004, SBS established A-Max, a real estate securitizer and developer, and made it a subsidiary. A-Max
and its subsidiaries are primarily responsible for planning and developing low-cost logistics facilities for
their corporate customers, mainly in the Tokyo Metro Area. The company aims for average annual returns
of 7.5%.
Business Business description and related subsidiaries/affiliates
Leasing out its facilities as offices, accommodation, and warehouses
→ SBS Logicom, A-Max
Developing and selling logistics facilities such as logistics centers (real estate securitization)
→ A-MAX
Source: Company data, SR
Rental business
Development business
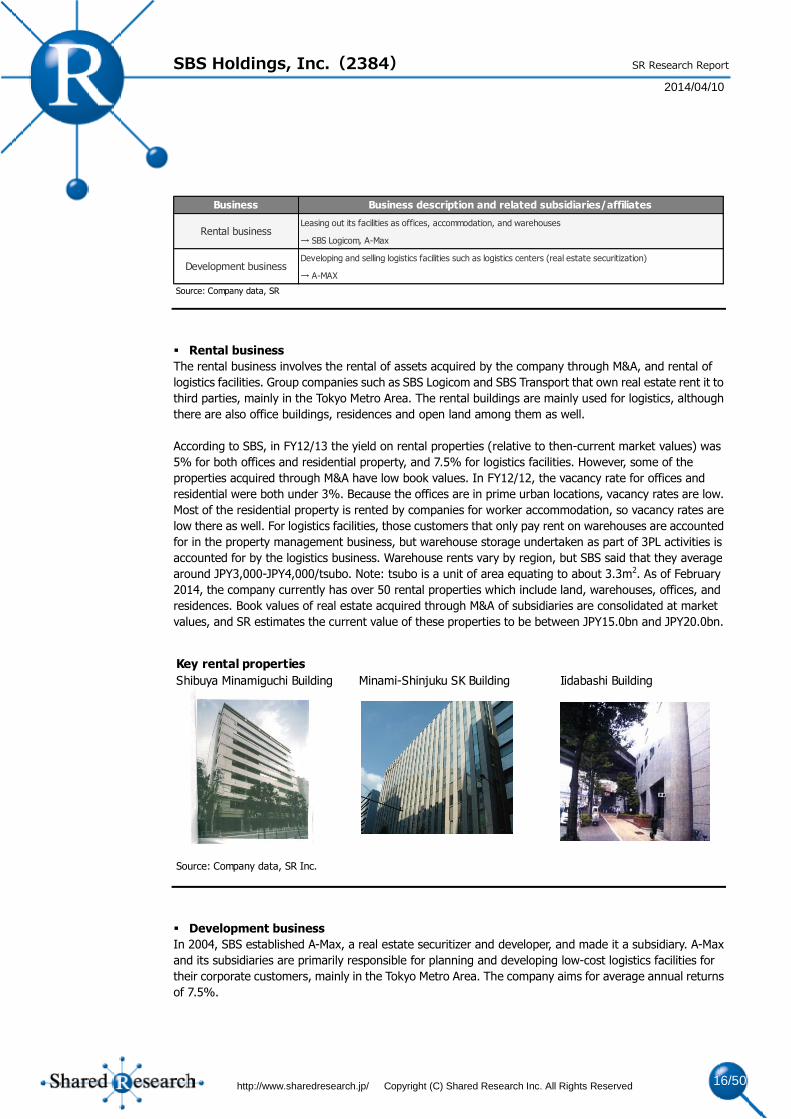
Key rental properties
Shibuya Minamiguchi Building Minami-Shinjuku SK Building Iidabashi Building
Source: Company data, SR Inc.
Page 17
SBS Holdings, Inc.(2384)
2014/04/10
http://www.sharedresearch.jp/ Copyright (C) Shared Research Inc. All Rights Reserved 17/50
SR Research Report
The company’s real estate development fundamentally differs from other logistics facilities developers
such as Prologis and Mitsui Real Estate in one key area. As opposed to developing properties first and
then seeking tenants, SBS acquires contracts with key tenants before development begins. The company
also does not determine rents based upon land prices, but conducts the process in reverse; after
determining the market price for rents in a given area, SBS will then decide on how much to pay for land
acquisition and construction costs. Making accurate assessments of future tenant activity allows facilities
development to remain profitable, even during downturns in the property management sector. The
company also works in tandem with key customers to seek approval under the Act on Advancement of
Integration and Streamlining of Distribution Business for development of facilities in prime locations near
expressway interchanges. SBS can also acquire land at lower prices due to its ability to participate in
auctions that are limited to participants with possession of port operator licenses or warehousing licenses.
These unique traits allow the company to develop facilities in areas that are inaccessible to ordinary real
estate developers.
The company’s ability for comprehensive development of logistics facilities is a strength when seeking
new 3PL clients. In the 3PL business, project proposals to customers are differentiated from those of
competitors through a multi-faceted approach, outlining ideal locations and specifications at rental rates
that are lower than market prices. SBS believes that the quality of logistics facilities is the main factor in
determining the total cost of 3PL.
Deciding on whether or not to move forward with development relies primarily on being able to fill at least
half of the floor space with key clients. The remaining floor space is used for new customers, or for
customers currently renting in a separate SBS facility to consolidate operations. In this way, facilities will
be fully operational and rented immediately after construction is complete. As a result, the company’s
logistics facilities are lower risk than facilities developed by real estate developers. The quality and credit
of tenants are also desirable, and such tenants can be expected to provide the company with stable cash
flows over the medium to long term.
Contract periods are generally ten years or longer, and interest rates are fixed. However, rental rates may
be adjusted in the event of a change in interest rates.
Aside from a rental revenue, which provides a stable yield of around 7.5% per year, the company also
counts operational revenue as a source of income. Operations cover actions undertaken at logistics
facilities such as shipping and receiving, storage, and distribution processing. SBS is also contracted for
deliveries to and from the logistics facilities.
In order to prevent buildup on its balance sheet from logistics facilities development, SBS has raised
capital through securitization of facilities from an early stage. From 2005 until 2013, total investment in
facilities development totaled JPY50.0bn. During this period, the company transferred (securitized) five
facilities to recover JPY40.0bn of this investment. Of the JPY40.0bn, the gain from transfer was JPY10.0bn.
By transferring at below 6%, the coupon on warehouse rentals, SBS collected a gain on transfer in
addition to the gain on sales. Recovered funds and proceeds from the transfer are then used to invest in
development for the next facility, and the virtuous cycle begins anew. The process is an important
element for the company to sustain growth despite a comparatively weak financial standing.
SBS, with its high level of financial expertise, has a business model that integrates finance and logistics to
create a platform for sustained growth. Specifically, this involves logistics facilities development and
corresponding expansion of the logistics (3PL) business. This type of business model is unique to SBS and
has not been attempted by any other firm.
Page 18
SBS Holdings, Inc.(2384)
2014/04/10
http://www.sharedresearch.jp/ Copyright (C) Shared Research Inc. All Rights Reserved 18/50
SR Research Report
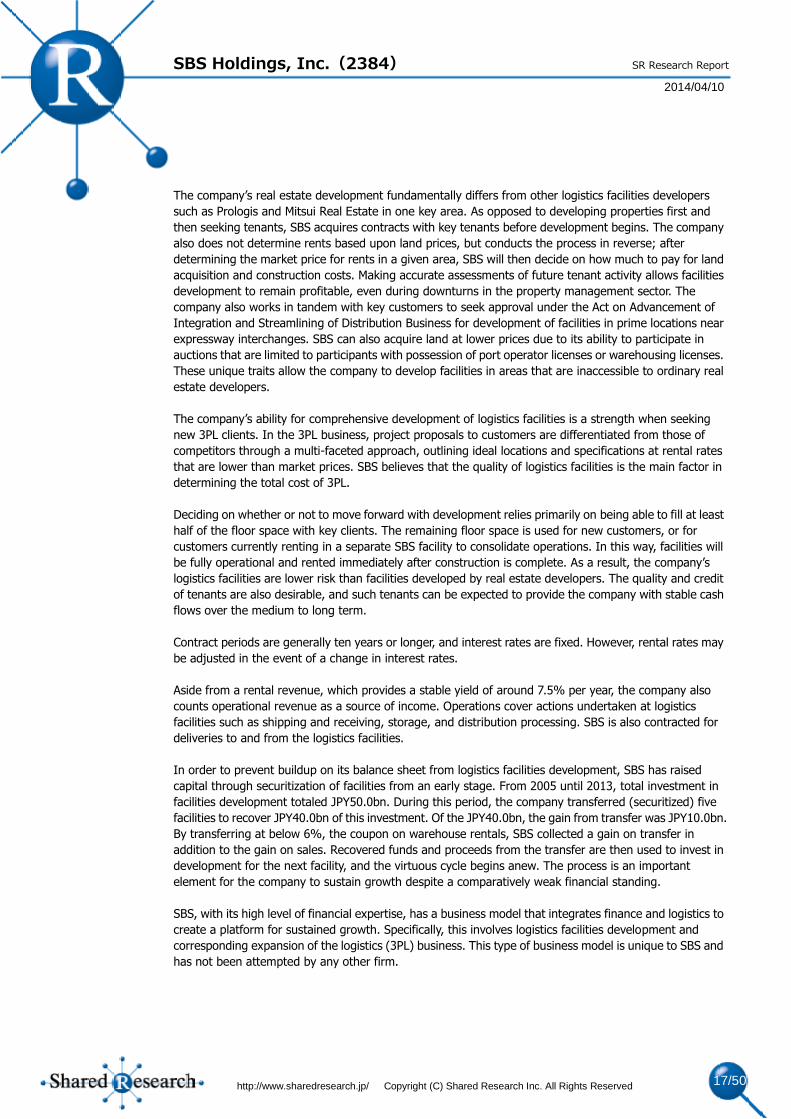
Development performance
Source: Company materials, SR
Numbered facilities have been securitized.
Securitization performance
In December 2013, the company transferred 51% of the trust beneficiary rights to its West Japan
Logistics Center (located in Kyotanabe City, Kyoto) for JPY2.9bn to a limited liability company called SBS
Logifund No. 1 (a logistics property management private placement fund), which was created by a
financial institution. A-Max, a group company, invested 12.5% of the fund equity. Outside investors
included the Development Bank of Japan, Industrial & Infrastructure Fund Investment Corp., domestic
institutional investors and leasing companies.
2005 2006 2007 2008 2009 2010 2011 2012 2013
Kawagoe Warehouse
May 2006
West Japan Logistics Center
Mar. 2007
Chikuma Logistics CenterAug. 2007
Kawagoe Logistics CenterNov. 2007
Iwatsuki Logistics Center
Dec. 2007
Iruma Logistics Center
Jan. 2008
Kimitsu Materials Warehouse No. 3
Mar. 2008
Toyohashi Logistics Center
Apr. 2008
Noda Logistics CenterMar. 2009
Tokorozawa Warehouse
Nov. 2009 Noda Yoshiharu Logistics Center
Oct. 2012
❺
❷
❸
❹
Omiya Center Building
Nov. 2005
❶
Office building used as proof-of-concept for securitization
ShinsunaLogistics Center
May 2008
Development name
Land / buidling
area (Tsubo = 3.3sqm)
Completed Acquired Transferred Book valueTransfer
valueTransfer party
❶Omiya Center Building(Office building)
3,54223,585
Apr. 1993 May 2011Dec. 2006 JPY8.3bn JPY12.0bn GE Real Estate
Jul. 2007 JPY8.0bn JPY12.5bn GE Real Estate
❷Iwatsuki (Saitama)11,9249,069
Dec. 2007 Dec. 2007
Apr. 2008 JPY4.4bn JPY4.7bn Iwatsuki Capital
Sep. 201028.5%
holding
JPY200mn gain on
transferMaple Tree
❸Iruma (Saitama)7,9307,926
Jan. 2008 Jan. 2008 Sep. 2010 JPY2.9bn JPY3.4bn Maple Tree
❹Noda (Chiba)
(Fixed asset)6,977
11,000Mar. 2009 Mar. 2009 Sep. 2010 JPY4.6bn JPY4.8bn Maple Tree
❺Kyotanabe (Kyoto)(West Japan Logistics Center)
3,9605,685
Apr. 2007 Apr. 2007 Dec. 2013JPY1.8bn
(51%)JPY2.9bn
Private fundSBS Logifund No. 1
Total34,33357,265
JPY30.0bn JPY40.3bn
Page 19
SBS Holdings, Inc.(2384)
2014/04/10
http://www.sharedresearch.jp/ Copyright (C) Shared Research Inc. All Rights Reserved 19/50
SR Research Report
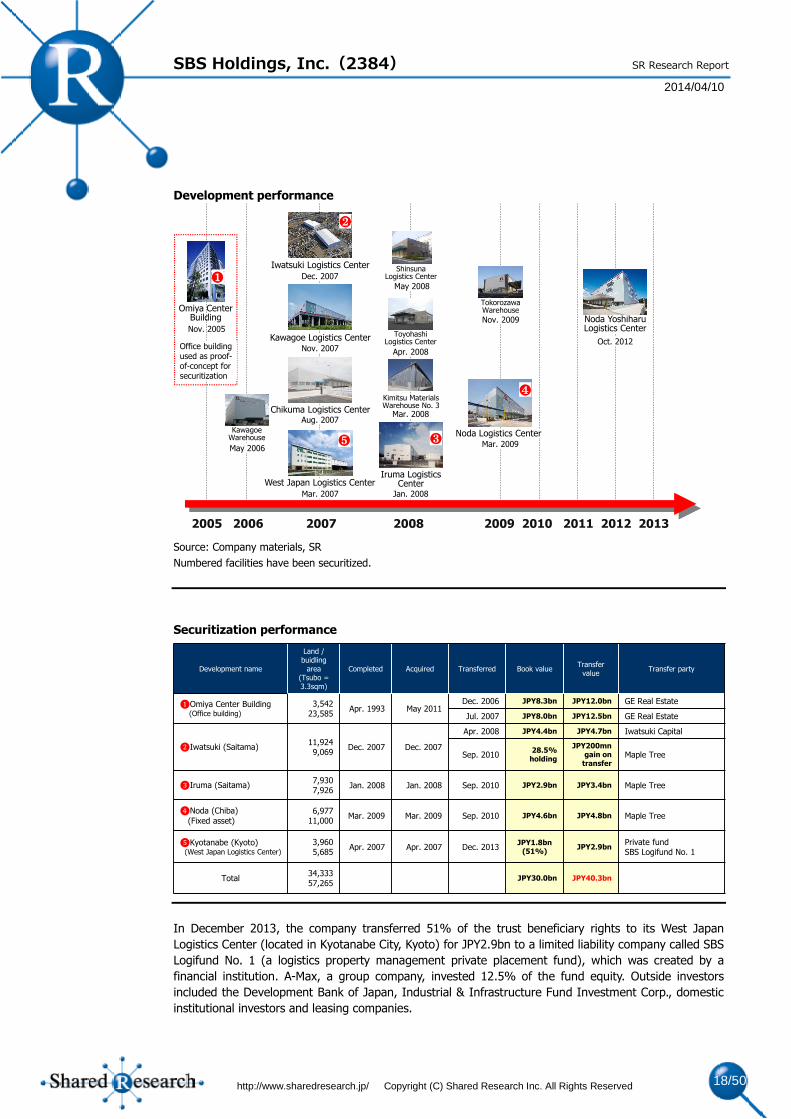
SBS will continue to implement its process of securitization through private funds to collect investments
and realize gains on transfers. Private funds provide stability to property management business results
since funds can be flexible on transfer ratios and transfer dates, and the counterparties are highly
reputable. Also, by providing equity up front, the company can continue to receive rental revenue even
after the assets have been transferred in the form of dividends. Preferred negotiating rights and capital
gains are also a possibility if the assets are sold in the future. If the private fund value reaches JPY30.0bn
or more, then conversion to a real estate investment trust (REIT) is also possible. Securitization through
private funds is a valid exit strategy that allows SBS to accelerate its logistics facilities development.
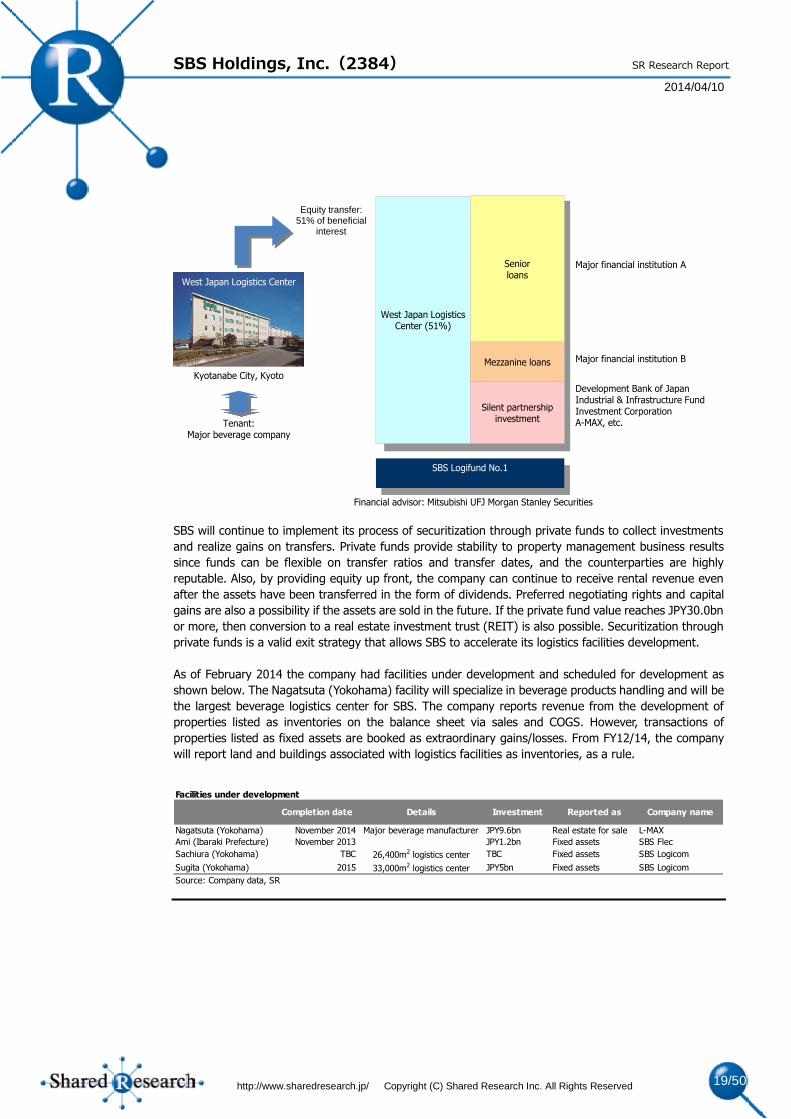
As of February 2014 the company had facilities under development and scheduled for development as
shown below. The Nagatsuta (Yokohama) facility will specialize in beverage products handling and will be
the largest beverage logistics center for SBS. The company reports revenue from the development of
properties listed as inventories on the balance sheet via sales and COGS. However, transactions of
properties listed as fixed assets are booked as extraordinary gains/losses. From FY12/14, the company
will report land and buildings associated with logistics facilities as inventories, as a rule.
Tenant:Major beverage company
Equity transfer:51% of beneficial
interest
West Japan Logistics Center (51%)
Seniorloans
Silent partnership investment
Mezzanine loans
SBS Logifund No.1
Major financial institution B
Development Bank of JapanIndustrial & Infrastructure Fund Investment CorporationA-MAX, etc.
Major financial institution A
Financial advisor: Mitsubishi UFJ Morgan Stanley Securities
West Japan Logistics Center
Kyotanabe City, Kyoto
Facilities under development
Completion date Details Investment Reported as Company name
Nagatsuta (Yokohama) November 2014 Major beverage manufacturer JPY9.6bn Real estate for sale L-MAX
Ami (Ibaraki Prefecture) November 2013 JPY1.2bn Fixed assets SBS Flec
Sachiura (Yokohama) TBC 26,400m2 logistics center TBC Fixed assets SBS Logicom
Sugita (Yokohama) 2015 33,000m2 logistics center JPY5bn Fixed assets SBS Logicom
Source: Company data, SR
Page 20
SBS Holdings, Inc.(2384)
2014/04/10
http://www.sharedresearch.jp/ Copyright (C) Shared Research Inc. All Rights Reserved 20/50
SR Research Report
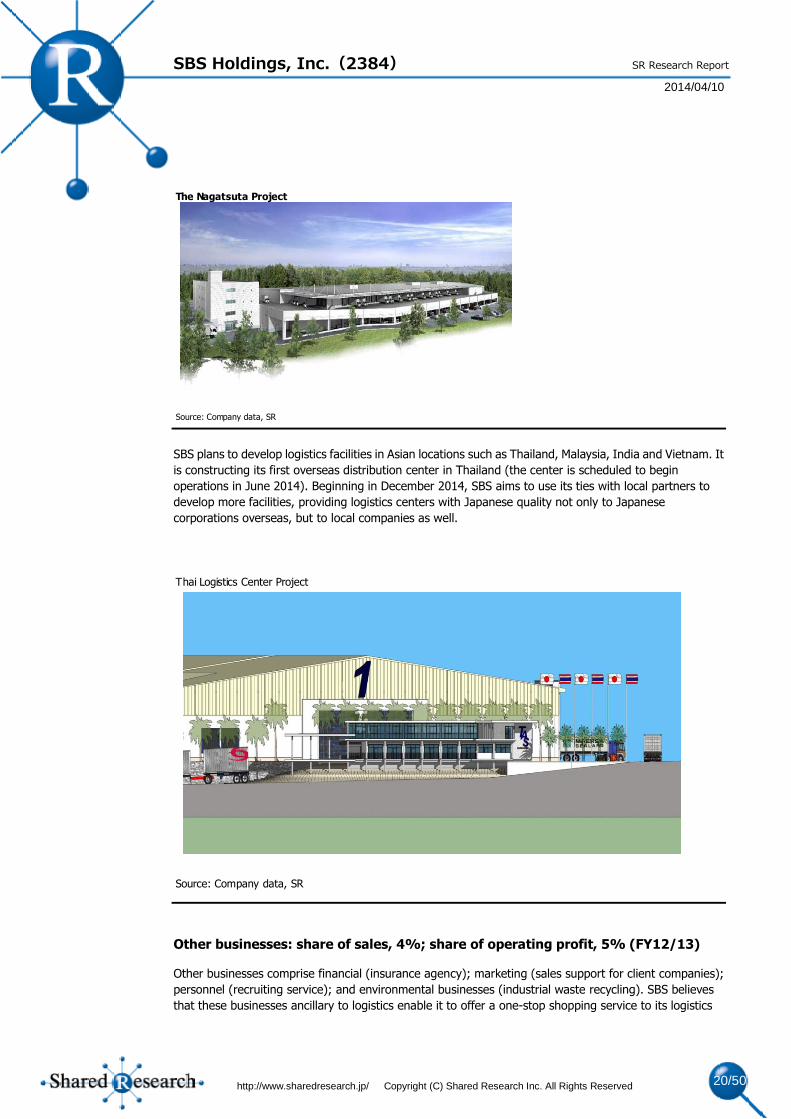
SBS plans to develop logistics facilities in Asian locations such as Thailand, Malaysia, India and Vietnam. It
is constructing its first overseas distribution center in Thailand (the center is scheduled to begin
operations in June 2014). Beginning in December 2014, SBS aims to use its ties with local partners to
develop more facilities, providing logistics centers with Japanese quality not only to Japanese
corporations overseas, but to local companies as well.
Other businesses: share of sales, 4%; share of operating profit, 5% (FY12/13)
Other businesses comprise financial (insurance agency); marketing (sales support for client companies);
personnel (recruiting service); and environmental businesses (industrial waste recycling). SBS believes
that these businesses ancillary to logistics enable it to offer a one-stop shopping service to its logistics
The Nagatsuta Project
Source: Company data, SR
Thai Logistics Center Project
Source: Company data, SR
Page 21
SBS Holdings, Inc.(2384)
2014/04/10
http://www.sharedresearch.jp/ Copyright (C) Shared Research Inc. All Rights Reserved 21/50
SR Research Report
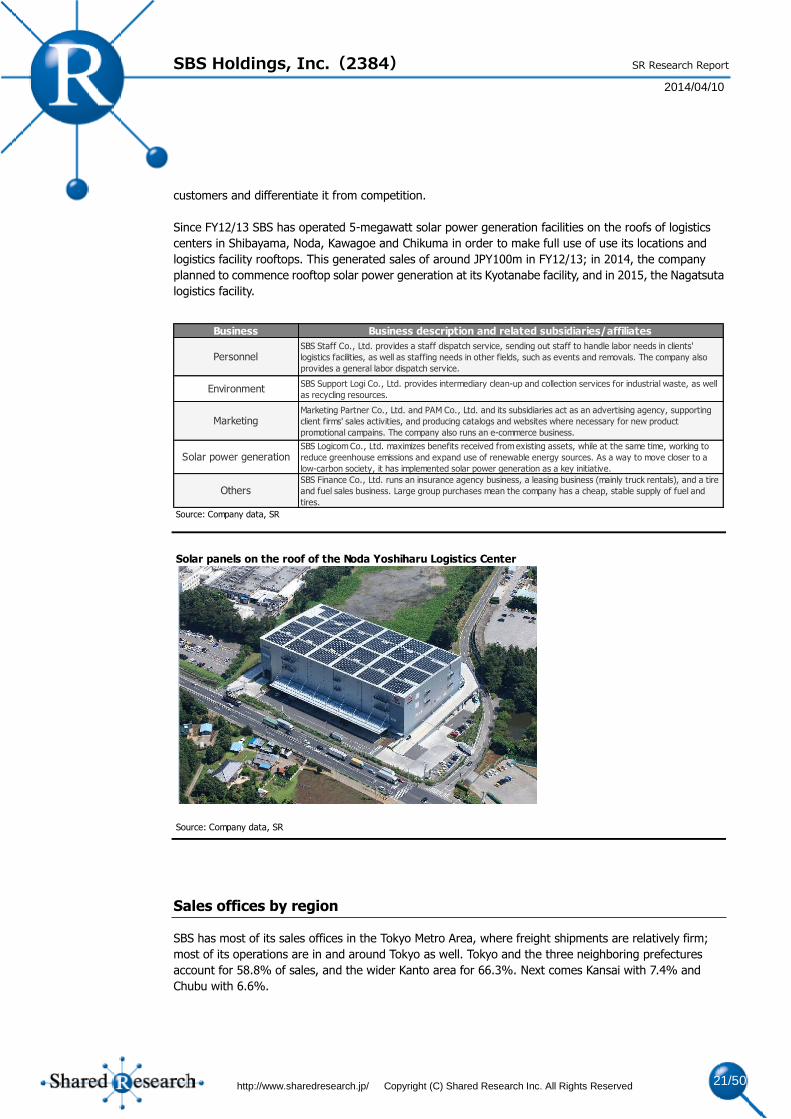
customers and differentiate it from competition.
Since FY12/13 SBS has operated 5-megawatt solar power generation facilities on the roofs of logistics
centers in Shibayama, Noda, Kawagoe and Chikuma in order to make full use of use its locations and
logistics facility rooftops. This generated sales of around JPY100m in FY12/13; in 2014, the company
planned to commence rooftop solar power generation at its Kyotanabe facility, and in 2015, the Nagatsuta
logistics facility.
Sales offices by region
SBS has most of its sales offices in the Tokyo Metro Area, where freight shipments are relatively firm;
most of its operations are in and around Tokyo as well. Tokyo and the three neighboring prefectures
account for 58.8% of sales, and the wider Kanto area for 66.3%. Next comes Kansai with 7.4% and
Chubu with 6.6%.
Business Business description and related subsidiaries/affiliates
PersonnelSBS Staff Co., Ltd. provides a staff dispatch service, sending out staff to handle labor needs in clients'
logistics facilities, as well as staffing needs in other fields, such as events and removals. The company also
provides a general labor dispatch service.
EnvironmentSBS Support Logi Co., Ltd. provides intermediary clean-up and collection services for industrial waste, as well
as recycling resources.
MarketingMarketing Partner Co., Ltd. and PAM Co., Ltd. and its subsidiaries act as an advertising agency, supporting
client firms' sales activities, and producing catalogs and websites where necessary for new product
promotional campains. The company also runs an e-commerce business.
Solar power generationSBS Logicom Co., Ltd. maximizes benefits received from existing assets, while at the same time, working to
reduce greenhouse emissions and expand use of renewable energy sources. As a way to move closer to a
low-carbon society, it has implemented solar power generation as a key initiative.
OthersSBS Finance Co., Ltd. runs an insurance agency business, a leasing business (mainly truck rentals), and a tire
and fuel sales business. Large group purchases mean the company has a cheap, stable supply of fuel and
tires.
Source: Company data, SR
Solar panels on the roof of the Noda Yoshiharu Logistics Center
Source: Company data, SR
Page 22
SBS Holdings, Inc.(2384)
2014/04/10
http://www.sharedresearch.jp/ Copyright (C) Shared Research Inc. All Rights Reserved 22/50
SR Research Report
Main domestic companies; overview of international logistics operations
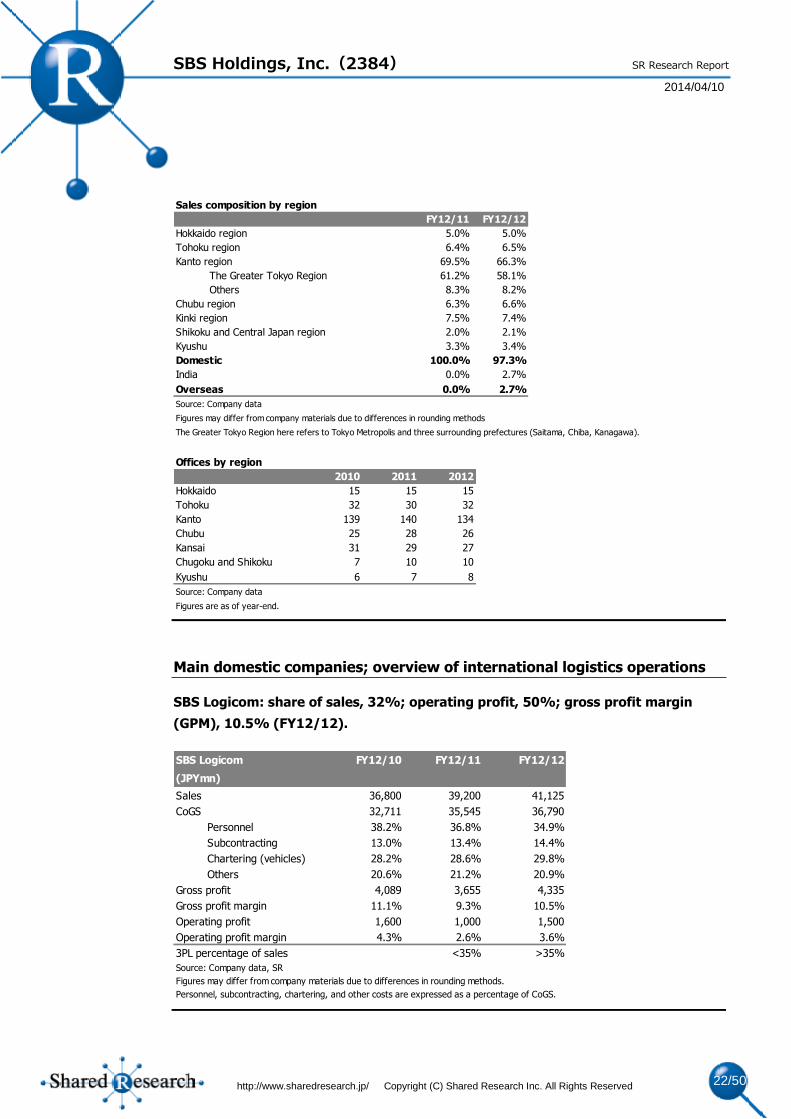
SBS Logicom: share of sales, 32%; operating profit, 50%; gross profit margin
(GPM), 10.5% (FY12/12).
Sales composition by region
FY12/11 FY12/12
Hokkaido region 5.0% 5.0%
Tohoku region 6.4% 6.5%
Kanto region 69.5% 66.3%
The Greater Tokyo Region 61.2% 58.1%
Others 8.3% 8.2%
Chubu region 6.3% 6.6%
Kinki region 7.5% 7.4%
Shikoku and Central Japan region 2.0% 2.1%
Kyushu 3.3% 3.4%
Domestic 100.0% 97.3%
India 0.0% 2.7%
Overseas 0.0% 2.7%
Source: Company data
Figures may differ from company materials due to differences in rounding methods
The Greater Tokyo Region here refers to Tokyo Metropolis and three surrounding prefectures (Saitama, Chiba, Kanagawa).
Offices by region
2010 2011 2012
Hokkaido 15 15 15
Tohoku 32 30 32
Kanto 139 140 134
Chubu 25 28 26
Kansai 31 29 27
Chugoku and Shikoku 7 10 10
Kyushu 6 7 8
Source: Company data
Figures are as of year-end.
SBS Logicom FY12/10 FY12/11 FY12/12
(JPYmn)
Sales 36,800 39,200 41,125
CoGS 32,711 35,545 36,790
Personnel 38.2% 36.8% 34.9%
Subcontracting 13.0% 13.4% 14.4%
Chartering (vehicles) 28.2% 28.6% 29.8%
Others 20.6% 21.2% 20.9%
Gross profit 4,089 3,655 4,335
Gross profit margin 11.1% 9.3% 10.5%
Operating profit 1,600 1,000 1,500
Operating profit margin 4.3% 2.6% 3.6%
3PL percentage of sales <35% >35%
Source: Company data, SR
Figures may differ from company materials due to differences in rounding methods.
Personnel, subcontracting, chartering, and other costs are expressed as a percentage of CoGS.
Page 23
SBS Holdings, Inc.(2384)
2014/04/10
http://www.sharedresearch.jp/ Copyright (C) Shared Research Inc. All Rights Reserved 23/50
SR Research Report
The core of the 3PL business is the old Tokyu Logistic, the logistics arm of the Tokyu group, which SBS
acquired in September 2005 for JPY15.7bn (Tokyu Logistic had sales at the time of JPY30.0bn and
operating profit of JPY1.1bn; TSE2:9079).
The company had sales of JPY41.1bn, 71 offices, and 988 trucks (FY12/12). Main customers are
supermarkets, home renovation centers, department stores, retailers (fashion accessories) etc. The top
five customers account for 33% of sales. The logistics business overall has around 2,000 corporate
customers. The simple average sales/customer was around JPY20mn. Gross profit margin was 10.5% in
FY12/12.
Main components of COGS were personnel, 34.9%; vehicle hire, 29.8%; and outsourcing, 14.4%
(FY12/12). Outsourcing includes work inside the warehouse and individual deliveries to the customer’s
home. The company outsources work to staff dispatch companies such as SBS Staff and Fullcast Holdings,
as well as transport companies such as Sagawa Express and Yamato (Yamato HD, TSE1: 9064).
The 3PL business accounted for over 36% of sales in FY12/12.
SBS Logicom has a number of companies under its umbrella, including:
SBS Freight Service: Sales around JPY5.0bn in FY12/13; formerly Nihon Kamotsu Kyuso.
Nippon Record Center: Sales around JPY4.0bn in FY12/13. Bought in 2011 for JPY2.0bn; the old
distribution arm of Victor Japan. Involved in general logistics (nonfood) and 3PL.
SBS Transport: Sales around JPY2.1bn in FY12/13; formerly TL Transport—distribution company of
Odakyu group; involved in corporate and individual removals, services to Odakyu group.
SBS Global Network: Sales around JPY3.2bn in FY12/13; formerly AC Systems Corporation. Bought
for JPY95mn in 2010. Agent for import/export customs clearance; forwarding operations.
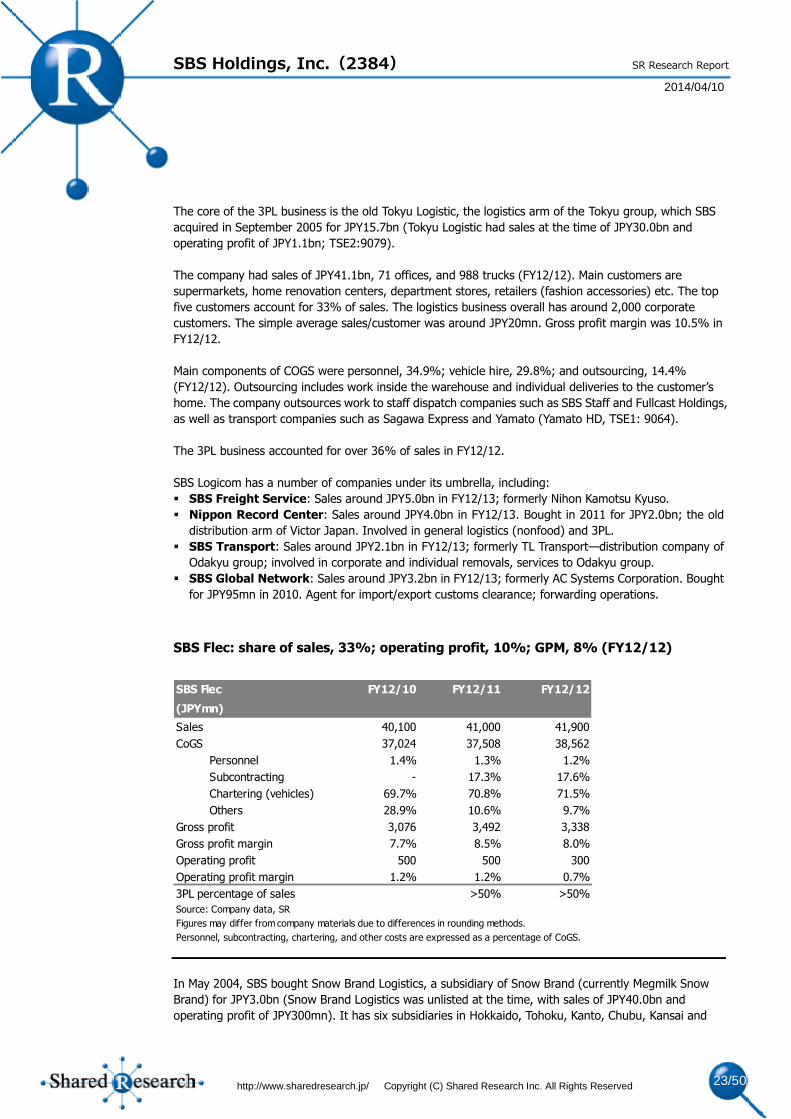
SBS Flec: share of sales, 33%; operating profit, 10%; GPM, 8% (FY12/12)
In May 2004, SBS bought Snow Brand Logistics, a subsidiary of Snow Brand (currently Megmilk Snow
Brand) for JPY3.0bn (Snow Brand Logistics was unlisted at the time, with sales of JPY40.0bn and
operating profit of JPY300mn). It has six subsidiaries in Hokkaido, Tohoku, Kanto, Chubu, Kansai and
SBS Flec FY12/10 FY12/11 FY12/12
(JPYmn)
Sales 40,100 41,000 41,900
CoGS 37,024 37,508 38,562
Personnel 1.4% 1.3% 1.2%
Subcontracting - 17.3% 17.6%
Chartering (vehicles) 69.7% 70.8% 71.5%
Others 28.9% 10.6% 9.7%
Gross profit 3,076 3,492 3,338
Gross profit margin 7.7% 8.5% 8.0%
Operating profit 500 500 300
Operating profit margin 1.2% 1.2% 0.7%
3PL percentage of sales >50% >50%
Source: Company data, SR
Figures may differ from company materials due to differences in rounding methods.
Personnel, subcontracting, chartering, and other costs are expressed as a percentage of CoGS.
Page 24
SBS Holdings, Inc.(2384)
2014/04/10
http://www.sharedresearch.jp/ Copyright (C) Shared Research Inc. All Rights Reserved 24/50
SR Research Report
Kyushu, and distributes food products nationwide in the three temperature zones (frozen, chilled and
room temperature). Megmilk Snow Brand is a major customer (33% of sales in FY12/12). The company
had sales of JPY41.9bn, 57 offices, and 383 trucks. Overall logistics customers numbered around 600.
Average sales/customer was around JPY70mn. GPM was 8.0% (FY12/12).
COGS breakdown in FY12/12 was: vehicle hire, a high 71.5%; outsourcing, 17.6%; and personnel, a low
1.2% (FY12/12). A large proportion of SBS Flec’s trucks and drivers are outsourced, so its vehicle hire
costs are structurally high and personnel costs low.
The 3PL business accounted for a large proportion of sales, at over 50% in FY12/12. This was because
many major clients use 3PL services.
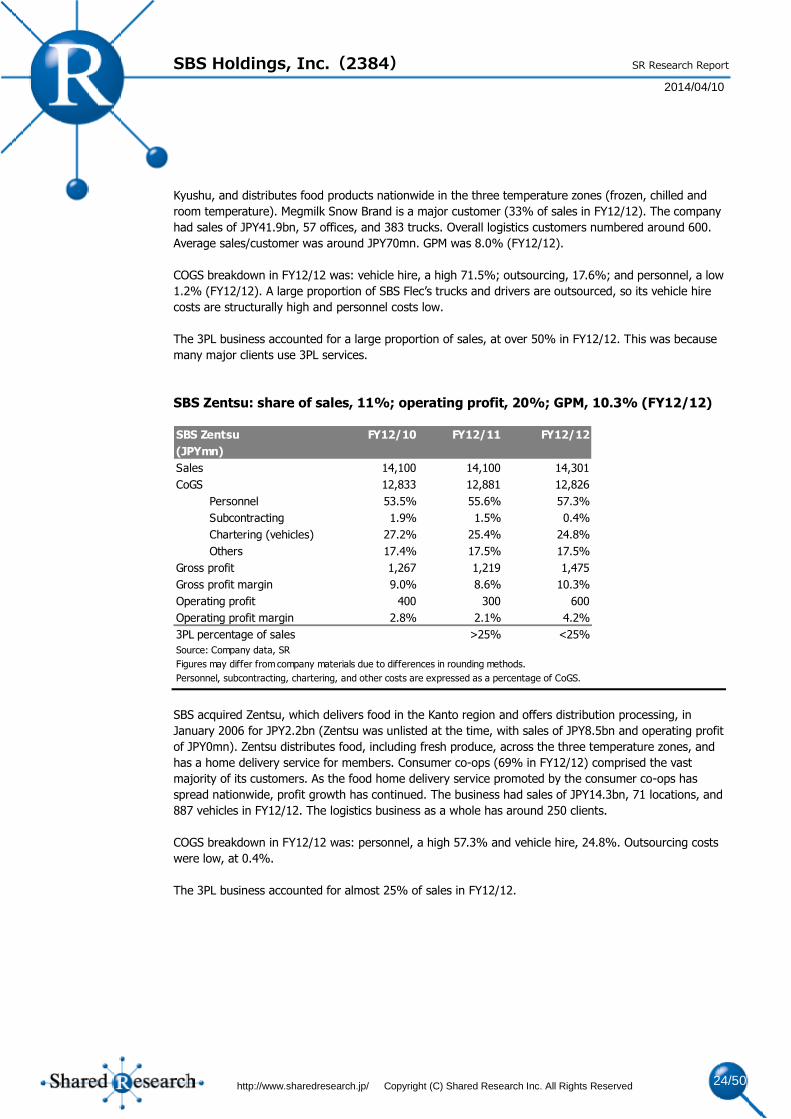
SBS Zentsu: share of sales, 11%; operating profit, 20%; GPM, 10.3% (FY12/12)
SBS acquired Zentsu, which delivers food in the Kanto region and offers distribution processing, in
January 2006 for JPY2.2bn (Zentsu was unlisted at the time, with sales of JPY8.5bn and operating profit
of JPY0mn). Zentsu distributes food, including fresh produce, across the three temperature zones, and
has a home delivery service for members. Consumer co-ops (69% in FY12/12) comprised the vast
majority of its customers. As the food home delivery service promoted by the consumer co-ops has
spread nationwide, profit growth has continued. The business had sales of JPY14.3bn, 71 locations, and
887 vehicles in FY12/12. The logistics business as a whole has around 250 clients.
COGS breakdown in FY12/12 was: personnel, a high 57.3% and vehicle hire, 24.8%. Outsourcing costs
were low, at 0.4%.
The 3PL business accounted for almost 25% of sales in FY12/12.
SBS Zentsu FY12/10 FY12/11 FY12/12
(JPYmn)
Sales 14,100 14,100 14,301
CoGS 12,833 12,881 12,826
Personnel 53.5% 55.6% 57.3%
Subcontracting 1.9% 1.5% 0.4%
Chartering (vehicles) 27.2% 25.4% 24.8%
Others 17.4% 17.5% 17.5%
Gross profit 1,267 1,219 1,475
Gross profit margin 9.0% 8.6% 10.3%
Operating profit 400 300 600
Operating profit margin 2.8% 2.1% 4.2%
3PL percentage of sales >25% <25%
Source: Company data, SR
Figures may differ from company materials due to differences in rounding methods.
Personnel, subcontracting, chartering, and other costs are expressed as a percentage of CoGS.
Page 25
SBS Holdings, Inc.(2384)
2014/04/10
http://www.sharedresearch.jp/ Copyright (C) Shared Research Inc. All Rights Reserved 25/50
SR Research Report
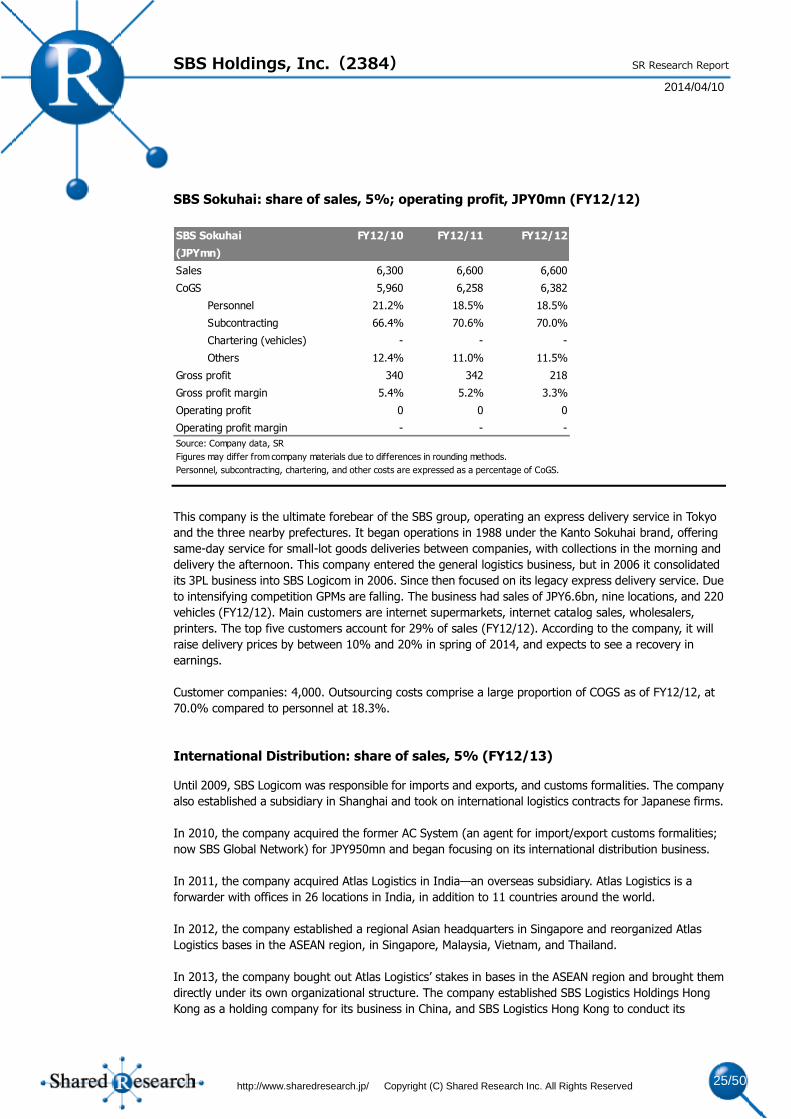
SBS Sokuhai: share of sales, 5%; operating profit, JPY0mn (FY12/12)
This company is the ultimate forebear of the SBS group, operating an express delivery service in Tokyo
and the three nearby prefectures. It began operations in 1988 under the Kanto Sokuhai brand, offering
same-day service for small-lot goods deliveries between companies, with collections in the morning and
delivery the afternoon. This company entered the general logistics business, but in 2006 it consolidated
its 3PL business into SBS Logicom in 2006. Since then focused on its legacy express delivery service. Due
to intensifying competition GPMs are falling. The business had sales of JPY6.6bn, nine locations, and 220
vehicles (FY12/12). Main customers are internet supermarkets, internet catalog sales, wholesalers,
printers. The top five customers account for 29% of sales (FY12/12). According to the company, it will
raise delivery prices by between 10% and 20% in spring of 2014, and expects to see a recovery in
earnings.
Customer companies: 4,000. Outsourcing costs comprise a large proportion of COGS as of FY12/12, at
70.0% compared to personnel at 18.3%.
International Distribution: share of sales, 5% (FY12/13)
Until 2009, SBS Logicom was responsible for imports and exports, and customs formalities. The company
also established a subsidiary in Shanghai and took on international logistics contracts for Japanese firms.
In 2010, the company acquired the former AC System (an agent for import/export customs formalities;
now SBS Global Network) for JPY950mn and began focusing on its international distribution business.
In 2011, the company acquired Atlas Logistics in India—an overseas subsidiary. Atlas Logistics is a
forwarder with offices in 26 locations in India, in addition to 11 countries around the world.
In 2012, the company established a regional Asian headquarters in Singapore and reorganized Atlas
Logistics bases in the ASEAN region, in Singapore, Malaysia, Vietnam, and Thailand.
In 2013, the company bought out Atlas Logistics’ stakes in bases in the ASEAN region and brought them
directly under its own organizational structure. The company established SBS Logistics Holdings Hong
Kong as a holding company for its business in China, and SBS Logistics Hong Kong to conduct its
SBS Sokuhai FY12/10 FY12/11 FY12/12
(JPYmn)
Sales 6,300 6,600 6,600
CoGS 5,960 6,258 6,382
Personnel 21.2% 18.5% 18.5%
Subcontracting 66.4% 70.6% 70.0%
Chartering (vehicles) - - -
Others 12.4% 11.0% 11.5%
Gross profit 340 342 218
Gross profit margin 5.4% 5.2% 3.3%
Operating profit 0 0 0
Operating profit margin - - -
Source: Company data, SR
Figures may differ from company materials due to differences in rounding methods.
Personnel, subcontracting, chartering, and other costs are expressed as a percentage of CoGS.
Page 26
SBS Holdings, Inc.(2384)
2014/04/10
http://www.sharedresearch.jp/ Copyright (C) Shared Research Inc. All Rights Reserved 26/50
SR Research Report
operations in Hong Kong. Domestically, the company also combined SBS Logicom’s international
distribution organization with SBS Global Network. The company also changed its structure to allow it to
be at the center of growth in the international distribution business.
Forwarder: A freight shipping company. Receives freight from the owner, and uses a third party’s
transportation services (ship, airplane, train, truck) to ship the goods.
The company is preparing a supply-chain management network to serve clients at its offices in four
ASEAN countries. In countries such as Thailand it offers integrated cross-border international logistics
services, ranging from the procurement of raw materials for electronic components to the transportation
of finished products. The company also plans to bring its first overseas logistics center online in Thailand
in June 2014 (two warehouses of 3,000 tsubo [9,900 sq m]). The company was in negotiations with
Japanese electronics and auto manufacturers regarding their logistics needs in the region. It has also
begun offering forwarding, warehousing and customs clearing services to Japanese companies operating
in Hong Kong and South Central China. The company’s business in India is subject to a number of
conditions specific to that country. Therefore, the company plans to use Atlas Logistics’ network within
India and abroad to expand its forwarding and cargo operations (the company acquired Atlas Logistics for
JPY1.3bn in 2011). According to the company, growth in the Indian domestic logistics market is viable if it
leverages its expertise in the transport, warehousing and 3PL businesses.
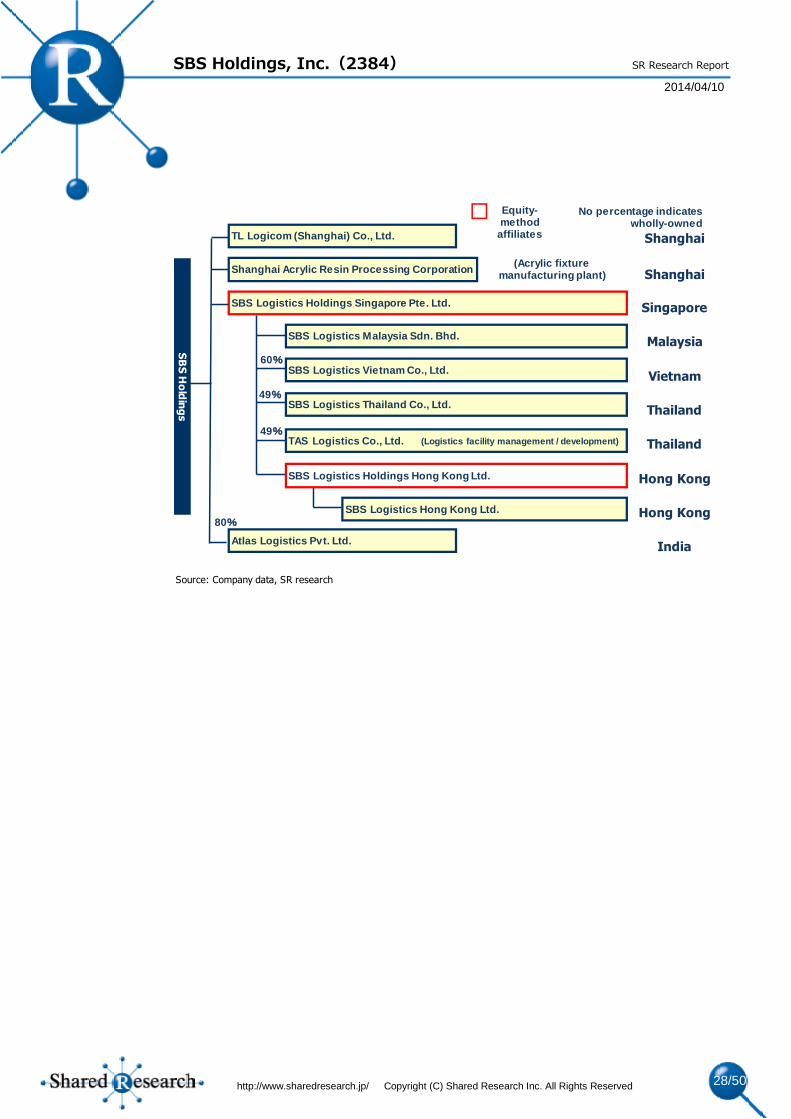
The company’s local subsidiaries in China and the ASEAN region are not classed as consolidated
subsidiaries. Atlas Logistics is the only consolidated overseas subsidiary.
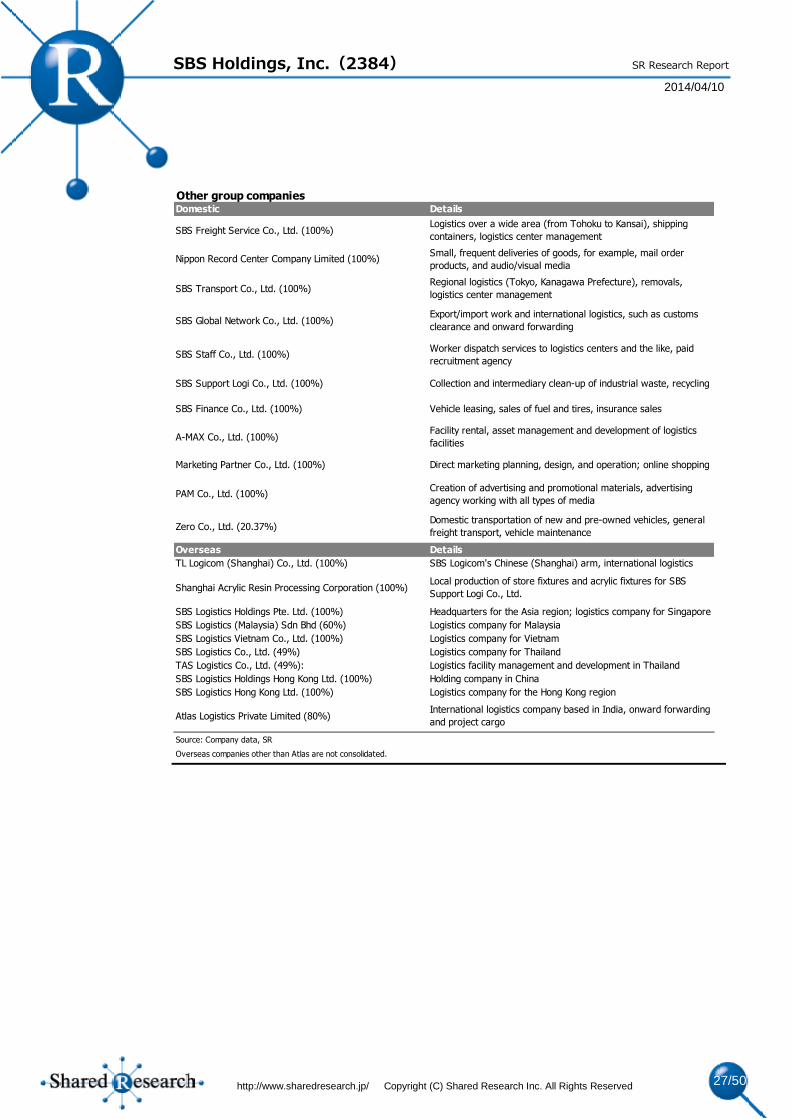
Main group companies
SBS uses a holding company structure. As of December 2013, it was composed of SBS and 40 subsidiaries
(including 23 consolidated subsidiaries), and eight affiliates (including one equity method affiliate).
The table below shows the group companies other than the four key companies. SBS’s stake is in
brackets.
Page 27
SBS Holdings, Inc.(2384)
2014/04/10
http://www.sharedresearch.jp/ Copyright (C) Shared Research Inc. All Rights Reserved 27/50
SR Research Report
Other group companies Domestic Details
SBS Freight Service Co., Ltd. (100%)Logistics over a wide area (from Tohoku to Kansai), shipping
containers, logistics center management
Nippon Record Center Company Limited (100%)Small, frequent deliveries of goods, for example, mail order
products, and audio/visual media
SBS Transport Co., Ltd. (100%)Regional logistics (Tokyo, Kanagawa Prefecture), removals,
logistics center management
SBS Global Network Co., Ltd. (100%)Export/import work and international logistics, such as customs
clearance and onward forwarding
SBS Staff Co., Ltd. (100%)Worker dispatch services to logistics centers and the like, paid
recruitment agency
SBS Support Logi Co., Ltd. (100%) Collection and intermediary clean-up of industrial waste, recycling
SBS Finance Co., Ltd. (100%) Vehicle leasing, sales of fuel and tires, insurance sales
A-MAX Co., Ltd. (100%)Facility rental, asset management and development of logistics
facilities
Marketing Partner Co., Ltd. (100%) Direct marketing planning, design, and operation; online shopping
PAM Co., Ltd. (100%)Creation of advertising and promotional materials, advertising
agency working with all types of media
Zero Co., Ltd. (20.37%)Domestic transportation of new and pre-owned vehicles, general
freight transport, vehicle maintenance
Overseas Details
TL Logicom (Shanghai) Co., Ltd. (100%) SBS Logicom's Chinese (Shanghai) arm, international logistics
Shanghai Acrylic Resin Processing Corporation (100%)Local production of store fixtures and acrylic fixtures for SBS
Support Logi Co., Ltd.
SBS Logistics Holdings Pte. Ltd. (100%) Headquarters for the Asia region; logistics company for Singapore
SBS Logistics (Malaysia) Sdn Bhd (60%) Logistics company for Malaysia
SBS Logistics Vietnam Co., Ltd. (100%) Logistics company for Vietnam
SBS Logistics Co., Ltd. (49%) Logistics company for Thailand
TAS Logistics Co., Ltd. (49%): Logistics facility management and development in Thailand
SBS Logistics Holdings Hong Kong Ltd. (100%) Holding company in China
SBS Logistics Hong Kong Ltd. (100%) Logistics company for the Hong Kong region
Atlas Logistics Private Limited (80%)International logistics company based in India, onward forwarding
and project cargo
Source: Company data, SR
Overseas companies other than Atlas are not consolidated.
Page 28
SBS Holdings, Inc.(2384)
2014/04/10
http://www.sharedresearch.jp/ Copyright (C) Shared Research Inc. All Rights Reserved 28/50
SR Research Report
Source: Company data, SR research
Equity-method
affiliatesTL Logicom (Shanghai) Co., Ltd.
SBS Logistics Holdings Singapore Pte. Ltd.
SBS Logistics Vietnam Co., Ltd.
SBS Logistics Thailand Co., Ltd.
Atlas Logistics Pvt. Ltd.
Shanghai Acrylic Resin Processing Corporation
SBS Logistics Hong Kong Ltd.
SBS Logistics Malaysia Sdn. Bhd.
TAS Logistics Co., Ltd.
Shanghai
Shanghai
Singapore
Malaysia
Vietnam
Thailand
Thailand
Hong Kong
Hong Kong
India
SB
S H
old
ing
s
(Acrylic fixture manufacturing plant)
49%
80%
60%
No percentage indicates wholly-owned
49%(Logistics facility management / development)
SBS Logistics Holdings Hong Kong Ltd.
Page 29
SBS Holdings, Inc.(2384)
2014/04/10
http://www.sharedresearch.jp/ Copyright (C) Shared Research Inc. All Rights Reserved 29/50
SR Research Report
Profitability snapshot, financial ratios
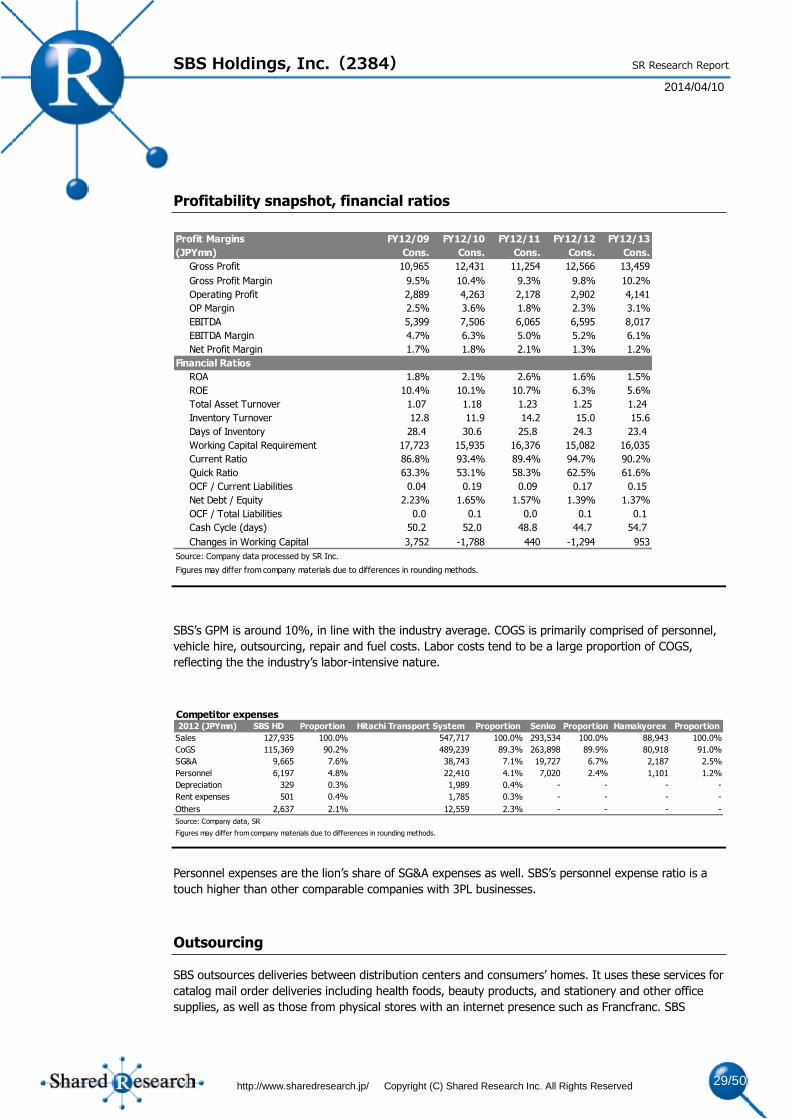
SBS’s GPM is around 10%, in line with the industry average. COGS is primarily comprised of personnel,
vehicle hire, outsourcing, repair and fuel costs. Labor costs tend to be a large proportion of COGS,
reflecting the the industry’s labor-intensive nature.
Personnel expenses are the lion’s share of SG&A expenses as well. SBS’s personnel expense ratio is a
touch higher than other comparable companies with 3PL businesses.
Outsourcing
SBS outsources deliveries between distribution centers and consumers’ homes. It uses these services for
catalog mail order deliveries including health foods, beauty products, and stationery and other office
supplies, as well as those from physical stores with an internet presence such as Francfranc. SBS
Profit Margins FY12/09 FY12/10 FY12/11 FY12/12 FY12/13
(JPYmn) Cons. Cons. Cons. Cons. Cons.
Gross Profit 10,965 12,431 11,254 12,566 13,459
Gross Profit Margin 9.5% 10.4% 9.3% 9.8% 10.2%
Operating Profit 2,889 4,263 2,178 2,902 4,141
OP Margin 2.5% 3.6% 1.8% 2.3% 3.1%
EBITDA 5,399 7,506 6,065 6,595 8,017
EBITDA Margin 4.7% 6.3% 5.0% 5.2% 6.1%
Net Profit Margin 1.7% 1.8% 2.1% 1.3% 1.2%
Financial Ratios
ROA 1.8% 2.1% 2.6% 1.6% 1.5%
ROE 10.4% 10.1% 10.7% 6.3% 5.6%
Total Asset Turnover 1.07 1.18 1.23 1.25 1.24
Inventory Turnover 12.8 11.9 14.2 15.0 15.6
Days of Inventory 28.4 30.6 25.8 24.3 23.4
Working Capital Requirement 17,723 15,935 16,376 15,082 16,035
Current Ratio 86.8% 93.4% 89.4% 94.7% 90.2%
Quick Ratio 63.3% 53.1% 58.3% 62.5% 61.6%
OCF / Current Liabilities 0.04 0.19 0.09 0.17 0.15
Net Debt / Equity 2.23% 1.65% 1.57% 1.39% 1.37%
OCF / Total Liabilities 0.0 0.1 0.0 0.1 0.1
Cash Cycle (days) 50.2 52.0 48.8 44.7 54.7
Changes in Working Capital 3,752 -1,788 440 -1,294 953
Source: Company data processed by SR Inc.
Figures may differ from company materials due to differences in rounding methods.
Competitor expenses2012 (JPYmn) SBS HD Proportion Hitachi Transport System Proportion Senko Proportion Hamakyorex Proportion
Sales 127,935 100.0% 547,717 100.0% 293,534 100.0% 88,943 100.0%
CoGS 115,369 90.2% 489,239 89.3% 263,898 89.9% 80,918 91.0%
SG&A 9,665 7.6% 38,743 7.1% 19,727 6.7% 2,187 2.5%
Personnel 6,197 4.8% 22,410 4.1% 7,020 2.4% 1,101 1.2%
Depreciation 329 0.3% 1,989 0.4% - - - -
Rent expenses 501 0.4% 1,785 0.3% - - - -
Others 2,637 2.1% 12,559 2.3% - - - -
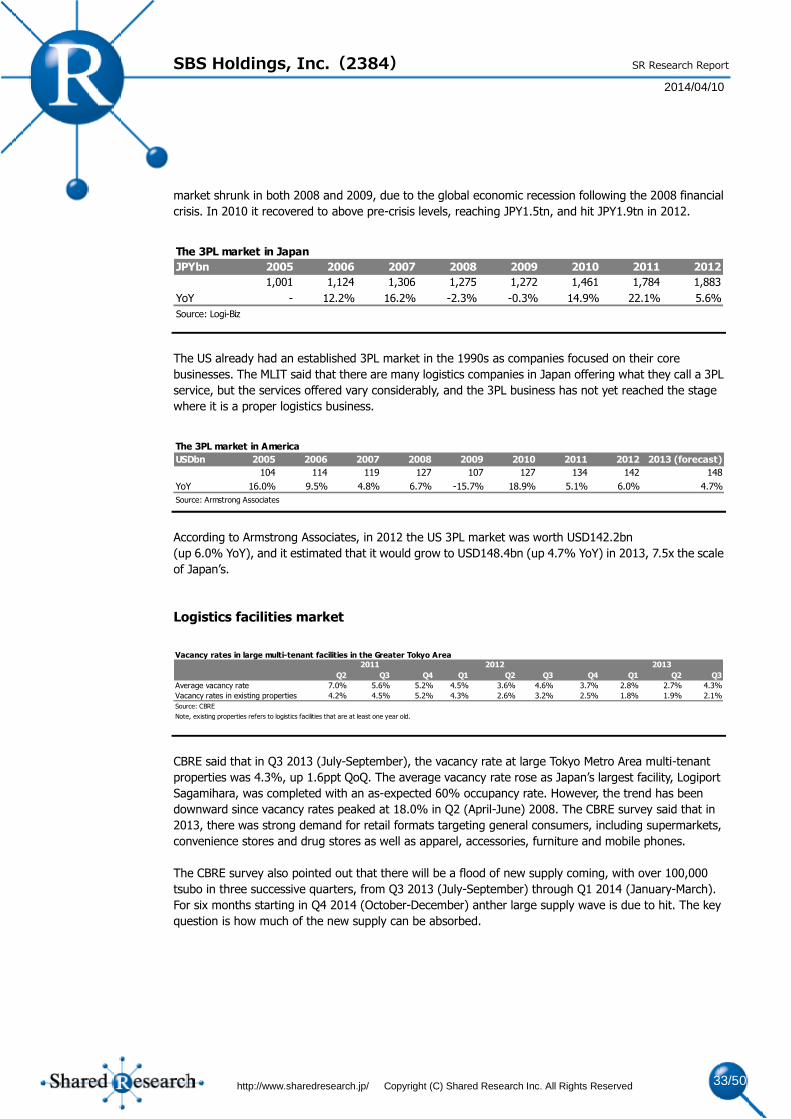
Source: Company data, SR
Figures may differ from company materials due to differences in rounding methods.
Page 30
SBS Holdings, Inc.(2384)
2014/04/10
http://www.sharedresearch.jp/ Copyright (C) Shared Research Inc. All Rights Reserved 30/50
SR Research Report
outsources deliveries to Sagawa Express and Yamato; Sagawa is the largest outsourcer with a 2.9% share.
SBS had a number of partner companies dispersed nationwide, numbering 3,133 in FY12/12.
Fuel costs
SBS acquires fuel jointly with subsidiary SBS Finance. Considering that SBS’s fuel costs were around
JPY2.5bn in FY12/13 and operating profit around JPY4.1bn (FY12/13), fuel price rises have a big impact
on results. It is difficult to levy fuel surcharges on customers, so SBS does not do so.
Page 31
SBS Holdings, Inc.(2384)
2014/04/10
http://www.sharedresearch.jp/ Copyright (C) Shared Research Inc. All Rights Reserved 31/50
SR Research Report
Strengths and weaknesses
Strengths
Ambitious management hungry for growth: President Kamata makes all important decisions at
his company. His strong leadership and appetite for growth, as shown by the company’s use of
property management investment schemes, set SBS apart from its competitors.
Track record in developing logistics facilities: SBS has a significant track record of developing
logistics facilities (as of FY12/13, the company had developed 12 facilities, of a total size of over
100,000 tsubo [330,000 sq m], and a total investment of around JPY50bn). The company is able to
develop competitively priced logistics facilities thanks to management’s knowledge of the land market
and the trust it has earned through its performance thus far. SBS also has the wherewithal to complete
its due diligence checks, with a number of employees with financial backgrounds who are able to help
acquire land and securitize logistics warehouses. According to the company, many of its competitors
lack the requisite knowledge of new financial schemes such as securitization, private funds, and REITs,
and are also constrained by their view of logistics facilities as depreciating assets. This leaves with only
the two traditional methods of developing new logistics centers—namely acquiring them as fixed
assets or leasing them out.
Track record in M&A deals: SBS has invested around JPY30.0bn on acquiring and integrating
businesses. It grows the sales and profits of companies it has invested in without restructuring them.
CEO Kamata’s focus on assimilating and expanding target companies, thanks to the value he places on
human resources, makes SBS one of the few logistics companies to make a success of its M&A activity.
Also, successful M&A deals give rise to further M&A deals, such as Tokyu Logistic after Snow Brand
Logistics, and Nippon Record Center after Victor Logistics. The company’s growth is also supported by
the fact that it has a team of employees with financial backgrounds, who are able to complete mergers
and acquisitions, and develop and securitize logistics facilities—thereby removing any need to use
external specialist companies.
Weaknesses
Difficult to lift profitability: Profitability of SBS is negatively impacted by the fact that the food &
beverage companies and co-op unions make up about 55% of its customer base (end FY12/12). While
these products are stable, they are also low priced. The result is that transport accounts for a large
proportion of sales, and they are not highly profitable.
Financials need to be fortified: Net debt peaked at JPY46bn in FY12/09, following a string of
acquisitions since 2004. Recognizing its indebtedness as a major issue, by FY12/13 the company cut
net debt to JPY39bn, but its net debt-to-EBITDA ratio is still high at around 5x (end FY12/13). Further,
56% of the company’s interest-bearing debt is short-term debt (end FY12/13). The company stated its
intent to continue shifting this short-term debt into long-term debt until its short-term debt ratio falls to
40%.
Opportunities for growth limited by insufficient personnel: One of the company’s growth
strategies is to combine the development of logistics facilities with the 3PL business. However, there is
a possibility that a shortage of staff will be a bottleneck to growth. The 3PL segment faces chronic staff
shortages due to the high level of sales skills it requires, such as the ability to present ways of cutting
costs and the ability to negotiate (clients make strong demands to cut costs). The company’s
expansion overseas will also depend upon whether or not it can train and secure the large number of
employees with logistics experience and language abilities necessary for this business.
Page 32
SBS Holdings, Inc.(2384)
2014/04/10
http://www.sharedresearch.jp/ Copyright (C) Shared Research Inc. All Rights Reserved 32/50
SR Research Report
Market and value chain
Market
According to Nittsu Research Institute and Consulting (NRIC), in fiscal 2013, domestic
consumption-related freight movements rose 1.4%, its first increase in 2 years, as the domestic economy
moved toward recovery and personal consumption was steady. Consumption-related freight was solid,
composed primarily of agricultural and fisheries products and processed food, as well as industrial
products. It appears that in fiscal 2014, NRIC expected consumer durables to be strong as buyers brought
forward purchases to beat the 2014 consumption tax hike. Strong growth in public works construction
and private sector housebuilding also led to strong construction-related shipments. However,
production-related freight, particularly for machinery and equipment, was slightly down, owing to a lack
of momentum in capital investment.
NRIC forecasts that fiscal 2014 will be negatively affected by the fallback from front-loading of the
demand ahead of the 2014 consumption tax hike. The tax hike would also crimp domestic private demand,
pushing down transport volumes. NRIC forecasts a 1.5% fall consumption-related freight as everyday
necessities and other consumer goods trended below normal levels over the year. Construction freight
also would slump by 4% YoY as it faced the peaking out of reconstruction demand, as well as a fall in
private housebuilding and non-residential demand, affecting gravel, sand, stone, cement and
ready-mixed concrete. NRIC forecast just a 0.5% rise in production related freight. In addition to a slump
in auto demand, it expected small falls in steel and chemical products. This would be offset somewhat by
growth in general machinery, amid firm capital investment, and small gains in pulp and paper. It forecast
total freight volumes to fall by 1.9% YoY.
According to the Japan Institute of Logistics Systems, the ratio of corporate logistics costs to sales peaked
in fiscal 1996 at 6.58% and has been falling since then, reaching an historical low of 4.77% in fiscal 2009.
During this period, the ratio breached 5% in 2006, reaching 5.01% due to a jump in fuel prices, but from
2007 onwards it has been in the upper 4% range. The Institute reckons that such costs are in a long-term
downtrend. Behind this trend is the fall in freight rates and expansion of overseas production; there is also
an element of cutting procurement logistics costs and boosting distribution efficiency to cut waste. The
importance of 3PL is rising as shippers’ needs become increasingly diverse and the trend toward
outsourcing logistics functions intensifies.
The Japan Federation of Freight Industries put the size of the Japanese domestic corporate logistics
market at JPY20tn (source: Logistics in Figures, 2013). According to the monthly magazine, LOGI-BIZ, the
3PL market, which was already over JPY1tn in 2005, grew rapidly to JPY1.3tn by 2007. However, the
Growth in the total amount of domestic freight transport
2000 2001 2002 2003 2004 2005 2006 2007 2008 2009 2010 2011 2012 2013 2014
Change in amount of
domestic freight
transport (tons)
-0.7% -3.1% -4.0% -2.4% -2.5% -1.9% 0.0% -0.4% -4.6% -6.0% -0.4% 0.1% -2.5% 1.4% -1.9%
Real GDP 2.0% -0.4% 1.1% 2.3% 1.5% 1.9% 1.8% 1.8% -3.7% -2.0% 3.4% 0.3% 0.7% 2.6% 0.9%
Source: Nittsu Research Institute and Consulting, Inc.
Logistics expenses as a proportion of sales
1996 1997 1998 1999 2000 2001 2002 2003 2004 2005 2006 2007 2008 2009 2010 2011
Japan 6.58% 6.45% 5.84% 6.13% 5.87% 5.45% 5.26% 5.01% 5.01% 4.83% 5.01% 4.84% 4.87% 4.77% 4.79% 4.90%
America 8.01% 9.02% 8.95% 7.34% 9.44% 9.17% 7.65% 7.52% 8.37% 7.51% 8.79% 9.74% 9.28% 8.48% 8.28% 7.77%
Source: Japan Institute of Logistics Systems
Page 33
SBS Holdings, Inc.(2384)
2014/04/10
http://www.sharedresearch.jp/ Copyright (C) Shared Research Inc. All Rights Reserved 33/50
SR Research Report
market shrunk in both 2008 and 2009, due to the global economic recession following the 2008 financial
crisis. In 2010 it recovered to above pre-crisis levels, reaching JPY1.5tn, and hit JPY1.9tn in 2012.
The US already had an established 3PL market in the 1990s as companies focused on their core
businesses. The MLIT said that there are many logistics companies in Japan offering what they call a 3PL
service, but the services offered vary considerably, and the 3PL business has not yet reached the stage
where it is a proper logistics business.
According to Armstrong Associates, in 2012 the US 3PL market was worth USD142.2bn
(up 6.0% YoY), and it estimated that it would grow to USD148.4bn (up 4.7% YoY) in 2013, 7.5x the scale
of Japan’s.
Logistics facilities market
CBRE said that in Q3 2013 (July-September), the vacancy rate at large Tokyo Metro Area multi-tenant
properties was 4.3%, up 1.6ppt QoQ. The average vacancy rate rose as Japan’s largest facility, Logiport
Sagamihara, was completed with an as-expected 60% occupancy rate. However, the trend has been
downward since vacancy rates peaked at 18.0% in Q2 (April-June) 2008. The CBRE survey said that in
2013, there was strong demand for retail formats targeting general consumers, including supermarkets,
convenience stores and drug stores as well as apparel, accessories, furniture and mobile phones.
The CBRE survey also pointed out that there will be a flood of new supply coming, with over 100,000
tsubo in three successive quarters, from Q3 2013 (July-September) through Q1 2014 (January-March).
For six months starting in Q4 2014 (October-December) anther large supply wave is due to hit. The key
question is how much of the new supply can be absorbed.
The 3PL market in Japan
JPYbn 2005 2006 2007 2008 2009 2010 2011 2012
1,001 1,124 1,306 1,275 1,272 1,461 1,784 1,883
YoY - 12.2% 16.2% -2.3% -0.3% 14.9% 22.1% 5.6%
Source: Logi-Biz
The 3PL market in America
USDbn 2005 2006 2007 2008 2009 2010 2011 2012 2013 (forecast)
104 114 119 127 107 127 134 142 148
YoY 16.0% 9.5% 4.8% 6.7% -15.7% 18.9% 5.1% 6.0% 4.7%
Source: Armstrong Associates
Vacancy rates in large multi-tenant facilities in the Greater Tokyo Area
Q2 Q3 Q4 Q1 Q2 Q3 Q4 Q1 Q2 Q3
Average vacancy rate 7.0% 5.6% 5.2% 4.5% 3.6% 4.6% 3.7% 2.8% 2.7% 4.3%
Vacancy rates in existing properties 4.2% 4.5% 5.2% 4.3% 2.6% 3.2% 2.5% 1.8% 1.9% 2.1%
Source: CBRE
Note, existing properties refers to logistics facilities that are at least one year old.
2011 2012 2013
Page 34
SBS Holdings, Inc.(2384)
2014/04/10
http://www.sharedresearch.jp/ Copyright (C) Shared Research Inc. All Rights Reserved 34/50
SR Research Report
According to materials published by the Cabinet Office in August 2013, J-REITs (Japan-style REITs as
defined under Japanese law) have picked up their real estate purchasing activities. In Q1 2013
(January-March) they bought a record amount on a quarterly basis, and have maintained high levels of
purchases since then. Over the three quarters from Q4 2012 through Q2 2013, logistics facilities formed
the bulk of purchases. The share of logistics facilities in J-REITs’ total real estate holdings rose from under
3% in September 2012 to around 9% in June 2013. The funds’ view is that demand for sophisticated
large logistics facilities is rising amid an increased number of items handled by the mail-order business
and increased use of just-in-time management. The Cabinet Office said that Nomura Real Estate had
resumed large-scale developments in 2013 after halting them in 2008, and Mitsubishi Estate planned to
double its development pace. Mitsui Real Estate was also considering adding to its investment pipeline.
Overseas-based real estate funds were also becoming more active, and the logistics market was seeing
increasing activity as investors saw business opportunities there.
Barriers to entry
According to the Japan Trucking Association (JTA)’s Corporate Logistics and Trucking 2012 report, the
trucking business accounted for 70% of the domestic logistics market’s operating revenue.
In 1990, the laws in Japan were relaxed, and the hurdles for entry into the trucking business were
lowered sharply from a license-based to a permit-based system. From 40,072 operators in fiscal 1990,
there were 63,122 at the peak in fiscal 2007 and 62,988 in fiscal 2010, 1.5x the original 1990 number. The
number of commercial trucks increased by a smaller amount than the number of companies, growing
from 907,931 in fiscal 1990 to 1,075,968 in fiscal 2010. In addition to the new entrants being relatively
small, existing operators cut fleet numbers due to sluggish cargo demand.
Two logistics laws: Laws that were passed in December 1989 and came into effect in
December 1990. The Motor Truck Transportation Business Act and Consigned Freight Forwarding
Business Act are commonly referred to as the “two logistics laws”. This was a major reform after a 40-year
interval since the Transport Business Act was passed in 1949 and the Road Transportation Act was passed
Key development projects
Property Operator Location Completion date Total floor space
Yashio Logistics Center Oji Paper Company Yashio, Saitama January 2014 83,557㎡
MFLP Yashio Mitsui Fudosan Yashio, Saitama February 2014 41,600㎡
Prologis Park Kawajima 2 Prologis Kawajima, Hiki-gun, Saitama February 2014 45,670㎡
DPL Yokohama Daikoku Daiwa House Industry Tsurumi, Yokohama, Kanagawa February 2014 149,339㎡
Prologis Park Kitamoto Prologis Kitamoto, Saitama March 2014 73,839㎡
MFLP Kuki Mitsui Fudosan Kuki, Saitama July 2014 74,500㎡
GLP Ayase GLP Ayase, Kanagawa November 2014 68,170㎡
Logiport Hashimoto LaSalle Investment Management/Mitsubishi Estate Midori, Sagamihara, Kanagawa Fall 2014 162,000㎡
MFLP Atsugi Mitsui Fudosan Aikawa, Aiko, Kanagawa Fall 2014 43,700㎡
Yachiyo Logistic Center (redevelopment) Japan Logistics Fund Yachiyo, Chiba December 2014 58,107㎡
Goodman Mizue Goodman Japan Kawagoe, Kawasaki, Kanagawa December 2014 59,261㎡
Goodman Ichikawa Goodman Japan Ichikawa, Chiba March 2015 75,579㎡
GLP Zama GLP Zama, Kanagawa July 2015 130,000㎡
MFLP Funabashi Mitsui Fudosan Funabashi, Chiba Fall 2015 199,917㎡
MFLP Hino Mitsui Fudosan Hino, Tokyo Fall 2015 222,288㎡
Source: SR research based on CBRE materials
Page 35
SBS Holdings, Inc.(2384)
2014/04/10
http://www.sharedresearch.jp/ Copyright (C) Shared Research Inc. All Rights Reserved 35/50
SR Research Report
in 1951. Under the Motor Truck Transportation Business Act, truck transport moved from a licensing to a
permit system, and freight charges from an approval system to a prior-notification system.
According to the JTA, many participants in the trucking market are small companies. It is a difficult
industry for new participants to make profits in, and around 60% of the companies with 50 or fewer
trucks—which make up 90% of the industry—are posting operating losses.
Supply/demand for truck drivers
According to the Japan Trucking Association’s Corporate Logistics and Trucking 2012 report, the truck
driver population is progressively ageing. For large trucks, the proportion of drivers over 40 is more than
70%, and for standard trucks it is nearly 60%. A lack of young workers is making the aging situation even
worse among large-truck drivers. The share of under-20 truck drivers was 15.1% in 1993, and 3.6% in
2011. Meanwhile the share of large-truck drivers over 40 is 72.7%; the aging of the driver population has
intensified over the past 20 years. The ageing of the population is just one factor. Also behind this trend
are the low pay and long hours, tough working conditions with constant danger of traffic accidents, and
the driver licensing system. According to MLIT survey data, the number of truck drivers in the transport
industry peaked at 920,000 in fiscal 2006, and had fallen to 760,000 by 2009. Obtaining a stable transport
capability is one of the major issues facing the industry.
In June 2007 there were major changes in driver’s license regulations, with a new requirement
for a license to drive medium-sized (from five to 11 ton trucks. New conditions included being at least 20
years of age and having a license for at least two years. There was an added on-road test for large truck
licenses, so acquiring one became more difficult.
Competition
SBS ranked 15th by sales (JPY127.9bn) in fiscal 2012 in the domestic land transport industry, which
covers companies whose main business is overland freight. Top ranked was Nippon Express (TSE1: 9062),
with sales of JPY1.6tn; second was Yamato (TSE1: 9064) with sales of JPY1.3tn; and third was SG
Holdings (unlisted), with sales of JPY871.3bn.
Profit and loss in the general freight motor transport industry (approximately 2,000 companies)
2006 2007 2008 2009 2010 2011
Recurring profit margin 0.1% -0.4% -1.3% -0.4% -0.7% -1.0%
Source: Japan Trucking Association
Page 36
SBS Holdings, Inc.(2384)
2014/04/10
http://www.sharedresearch.jp/ Copyright (C) Shared Research Inc. All Rights Reserved 36/50
SR Research Report
According to LOGI-BIZ, the 3PL market, SBS’s strategic focus, was worth JPY1.9tn (+5.6% YoY, 51 major
companies) in fiscal 2012. Top was Hitachi Transport with sales of JPY365.0bn (19% share) followed by
Senko with a 9% share, and Nippon Express, with an 8% share. SBS was 12th with a 2.3% share (11th in
fiscal 2011).
Sales of major land transport companies
(JPYmn) 2012
Nippon Express 1,613,327
Yamato Holdings 1,282,373
SG Holdings 871,388
Hitachi Transport System 547,517
Seino Holdings 516,184
Sankyu 401,658
Senko 293,534
Kintetsu World Express 247,977
Fukuyama Transporting 246,476
Konoike Transport 227,749
Nissin 175,230
Nichirei Logistics Group 156,400
Nippon Konpo Unyu Soko 140,511
K.R.S. Corporation 139,228
SBS Holdings 127,935
Tonami Holdings 115,864
Meitetsu Unyu 92,289
Hamakyorex 89,319
Trancom 88,202
Maruzen Showa Unyu 86,164
Source: Cargo Japan Co., Ltd. (Cargo News, Aug. 13, 2013)
Sales and share of 3PL market(JPYmn) 2011 2012 Market share (2012)
Hitachi Transport System Approx. 370,000 Approx. 365,000 19.4%
Senko 137,700 170,000 9.0%
Nippon Express Approx. 150,000 Approx. 150,000 8.0%
Yusen Logistics 120,512 139,085 7.4%
Nippon Access 108,354 111,364 5.9%
K. R. S. Corporation 104,951 103,810 5.5%
Yamato Holdings 82,478 86,806 4.6%
Nichirei Logistics Group 53,500 57,700 3.1%
Mitsui & Co. 52,500 50,000 2.7%
SG Holdings 50,300 49,800 2.6%
Sankyu 47,800 48,300 2.6%
SBS Holdings 41,467 44,321 2.4%
Hamakyorex 42,317 42,607 2.3%
Trancom 33,926 35,352 1.9%
Mitsui-Soko 12,961 33,096 1.8%
Source: Logi-Biz
Page 37
SBS Holdings, Inc.(2384)
2014/04/10
http://www.sharedresearch.jp/ Copyright (C) Shared Research Inc. All Rights Reserved 37/50
SR Research Report
Strategy
SBS has combined its business strategy, investment strategy and overseas strategy, with the aim of
offering a comprehensive 3PL outsourcing service covering firms’ logistics functions. The company aims
to be one of the leading groups in its industry, ie, among the top 10.
SBS’s business strategy is based on a fusion of logistics and property management. It aims to provide its
client companies with planning and development of logistics facilities with outsourced 3PL services, from
work in the warehouse through delivery. SBS asserts that warehouses are essential to its 3PL business.
The company says that the two prongs of its strategy are contracts for 3PL services, and the development
of warehouses in good locations that take advantage of The Act on Advancement of Integration and
Streamlining of Distribution Business.
In its investment in logistics facilities, SBS plans to build warehouses at the rate of around one per year on
average (5,000-10,000 tsubo in size [16,500-33,000 sq m]) at a cost of JPY5.0-10.0bn. For one particular
logistics facility it will make a specific SPC. The company targets yield of around 7% per year in rents from
the operation of logistics facilities; and aims at winning 3PL contracts. When securitizing the logistics
facilities, it transfers them at a yield of under 6% and generates transfer differential gains. In this way, it
is able to reinvest without expanding the balance sheet, and targets a maximum debt level of around
JPY50bn.
SBS thinks it can securitize facilities developed in-house since 2004. The table below shows facilities SBS
thinks it could securitize, as well as under-construction planned construction projects. The logistics
facilities obtained prior to 2004 through acquisition have low book values and SBS might face tax liabilities
upon transfer, so has no plans to securitize them.
Acquire 3PL
customers
Logistics reform+
Facilities reform||
Proposal sales
Acquire land
Construction supervision
Lease surplus
Construction complete, begin 3PL operations
⇒ Reinvest
Recover investment, integrate
gains from transfer
Private funds
Use financial expertise to securitize and keep off balance sheet
Growth strategy combining facilities development and the
3PL business
Rent revenue + 3PL operations revenue
Logistics facility
Page 38
SBS Holdings, Inc.(2384)
2014/04/10
http://www.sharedresearch.jp/ Copyright (C) Shared Research Inc. All Rights Reserved 38/50
SR Research Report
Its overseas strategy involves focusing on M&A deals and collaborations with local partners. The company
aims to acquire around JPY19.0bn in sales through M&A deals over the course of its mid-term plan (until
FY12/17). In Asia, it plans to acquire a somewhat large firm, which will then form the core of its business
in this region. The company also aims to develop logistics facilities with local partners, with an eye toward
providing logistics services of a quality comparable to those on offer in Japan. Targets are Asian countries
such as ASEAN nations and India. The company plans to grow its logistics business as an Asian company,
rather than just a Japanese company, and thus has an eye toward logistics contracts not only with
Japanese firms, but also with local clients. SBS is constructing its first overseas distribution center in
Thailand. The company has acquired 64,000 sq m of land, and plans to open the facility in June 2014.
According to SBS, in India there is plenty of scope to improve logistics operations. It plans to build and
operate logistics facilities through Atlas Logistics, a company it bought in 2011.
Facilities with securitization potential
BuiltTotal floor space
(m2)
Total investment
(JPYbn)Contract type Details Yield Reported as Company name
Kyotanabe (Kyoto) April 2007 37,676 3.4 Rental Brewer 9.10% Real estate trust beneficiary interests Shimbashi Capital (SPC)
Kawagoe Logistics Center (Saitama) September 2007 47,284 4.2 Internal use 3PL - Fixed assets SBS Logicom
Noda Yoshiharu (Chiba) September 2012 31,577 3.3 Rental, internal use Brewer, food manufacturer - Fixed assets SBS Logicom
Source: Company data, SR
Note, Shimbashi Capital is an SPC. The company controls all voting rights for this SPC. It owns 49% of the Kyotanabe logistics facility, the other 51% being transferred to private funds.
Page 39
SBS Holdings, Inc.(2384)
2014/04/10
http://www.sharedresearch.jp/ Copyright (C) Shared Research Inc. All Rights Reserved 39/50
SR Research Report
Historical performance
Summary
FY12/12 results
Sales were JPY 127.9bn (+5.6% YoY), due to the expanding 3PL business and the impact of M&A in
FY12/11. Operating profit was JPY2.9bn (+33.2% YoY), and recurring profit was JPY2.8bn (+67.4% YoY),
a sharp rise from the previous year, which was affected by the earthquake. Net income was JPY1.6bn
(-34.7% YoY). The company posted JPY369mn in abnormal losses on the impairment of equipment and
assets as part of its plan to consolidate/transfer group company warehouses in FY12/13. Deferred income
taxes increased stemming from the use of loss carry forwards.
Segment results were as follows.
Logistics sales were boosted by the inclusion of two new group companies: Nippon Record Center and
Atlas Logistics. Food freight, which is usually weak due to seasonal factors, was brisk from the start of the
year through early spring, and 3PL business expanded, so sales reached JPY119.3bn (+5.9% YoY).
Operating profit was JPY1.7bn (+36.6%). In addition to sales growth, further improvements in
underperforming businesses, and the absence of the costs incurred in the previous year owing to the
earthquake and the opening of new distribution centers, also contributed to profit growth.
Property Management business sales were JPY2.5bn (+4.6%), as SBS received higher rental income after
increasing its stake in urban rental buildings. Operating profit was JPY126mn (+9.6% YoY).
Other sales were JPY6.1bn (+0.7%) or roughly flat year-on-year, and operating profit turned to the black
(JPY44mn vis-à-vis a loss of JPY211mn in the year before) as SBS cut the cost of managing the personnel
and environmental businesses.
FY12/11 results
Sales grew by 1.1% YoY to JPY 121.1bn, due to expanding 3PL business and M&A. Operating profit was
JPY2.2bn (-48.9% YoY) due to the earthquake, and recurring profit was JPY1.7bn (-61.5% YoY). Net
income turned to growth, at JPY2.5bn (+17.8% YoY). SBS received approval to move to the consolidated
tax regime from FY12/12 and a change in the corporate tax rate gave rise to profits of JPY2.0bn in
deferred income taxes.
Segment results were as follows.
Logistics sales were boosted by the inclusion of three new group companies: VL Loginet and AC Systems
from FY12/10, and Nippon Record Center in FY12/11. SBS also worked to expand its business with the
launch of 3PL operations. While sales reached JPY112.7bn (+5.6% YoY), operating profit was JPY1.3bn
(-28.1%) as utilization rates fell due to the earthquake.
The property management business entails the rental of company-owned offices, residences and
warehouses as well as the development and sale of logistics facilities. As there were no sales of logistics
property management, sales were JPY2.4bn (-60.7% YoY) and operating profit was JPY 1.1bn (-51.3%).
The other business comprises personnel, environmental and marketing businesses. Tough employment
conditions and declining demand for dispatch workers meant the personnel business performed poorly.
Page 40
SBS Holdings, Inc.(2384)
2014/04/10
http://www.sharedresearch.jp/ Copyright (C) Shared Research Inc. All Rights Reserved 40/50
SR Research Report
Sales were JPY6.1bn (-14.4% YoY) and there was an operating loss of JPY211mn (profit of JPY141mn in
FY12/10).
Income statement
In the midst of a slump in logistics volumes in Japan, SBS has had an M&A driven growth strategy since
FY12/04, aggressively buying other firms in the sector. SBS has also securitized properties: the Omiya
Center Building and Iwatsuki Center in FY12/06 and FY12/08, and three logistics centers, including Iruma
and Noda in FY12/10. SBS has been actively pursuing M&A deals since FY12/12, and has seen
corresponding growth in sales and profits from then on.
Income Statement FY12/09 FY12/10 FY12/11 FY12/12 FY12/13 FY12/14
(JPYmn) Cons. Cons. Cons. Cons. Cons. Est.
Total Sales 115,711 119,824 121,148 127,935 132,205 135,000
YoY -17.0% 3.6% 1.1% 5.6% 3.3% 2.1%
CoGS 104,746 107,393 109,894 115,369 118,746
Gross Profit 10,965 12,431 11,254 12,566 13,459
YoY -12.7% 13.4% -9.5% 11.7% 7.1%
GPM 9.5% 10.4% 9.3% 9.8% 10.2%
SG&A 8,077 8,169 9,076 9,665 9,318
SG&A / Sales 7.0% 6.8% 7.5% 7.6% 7.0%
Operating Profit 2,889 4,263 2,178 2,902 4,141 4,600
YoY -13.1% 47.6% -48.9% 33.2% 42.7% 11.1%
OPM 2.5% 3.6% 1.8% 2.3% 3.1% 3.4%
Non-Operating Income 1,782 813 174 644 358
Non-Operating Expenses 922 784 698 778 697
Recurring Profit 3,749 4,292 1,654 2,768 3,801 4,200
YoY -6.2% 14.5% -61.5% 67.4% 37.3% 10.5%
RPM 3.2% 3.6% 1.4% 2.2% 2.9% 3.1%
Extraordinary Gains 1,502 599 720 415 412
Extraordinary Losses 823 922 1,088 590 1,342
Tax Charges 2,426 1,757 -1,241 966 1,300
Implied Tax Rate 54.8% 44.3% -96.5% 37.3% 45.3%
Minority Interests 13 71 5 -21 -
Net Income 1,989 2,141 2,522 1,647 1,571 2,500
YoY 107.0% 7.7% 17.8% -34.7% -4.6% 59.1%
NPM 1.7% 1.8% 2.1% 1.3% 1.2% 1.9%
Source: Company data, SR Inc.; figures may differ from company materials due to differences in rounding methods
Page 41
SBS Holdings, Inc.(2384)
2014/04/10
http://www.sharedresearch.jp/ Copyright (C) Shared Research Inc. All Rights Reserved 41/50
SR Research Report
Historical forecast accuracy
SBS tends to make conservative earnings forecasts. In FY12/11, owing to the Tohoku earthquake, the
company did not meet its forecasts, as freight volumes declined sharply due to falls in production, plus
disruptions to distribution and the prioritization of deliveries to the stricken area. In FY12/13, SBS failed to
meet initial forecasts amid Q1 snow damage in northern Japan and reduced utilization rates at some food
logistics centers. Other than these years, SBS tends to exceed forecasts. Also, when logistics facilities are
securitized in the property management business profits tend to be on the upside, as in FY12/10.
Initial CE vs. Results FY12/09 FY12/10 FY12/11 FY12/12 FY12/13
(JPYmn) Cons. Cons. Cons. Cons. Cons.
Sales (Initial CE) 130,000 116,000 120,000 127,000 128,000
Sales (Results) 115,711 119,824 121,148 127,935 132,205
Initial CE vs. Results -11.0% 3.3% 1.0% 0.7% 3.3%
Operating Profit (Initial CE) 3,100 3,200 3,500 2,900 3,100
Operating Profit (Results) 2,889 4,263 2,178 2,902 4,141
Initial CE vs. Results -6.8% 33.2% -37.8% 0.1% 33.6%
Recurring Profit (Initial CE) 3,700 3,000 3,000 2,400 2,700
Recurring Profit (Results) 3,749 4,292 1,654 2,768 3,801
Initial CE vs. Results 1.3% 43.1% -44.9% 15.3% 40.8%
Net Profit (Initial CE) 2,200 2,000 1,700 1,800 1,100
Net Profit (Results) 1,989 2,141 2,522 1,647 1,571
Initial CE vs. Results -9.6% 7.0% 48.4% -8.5% 42.8%
Source: Company data processed by SR
Figures may differ from company materials due to differences in rounding methods.
Page 42
SBS Holdings, Inc.(2384)
2014/04/10
http://www.sharedresearch.jp/ Copyright (C) Shared Research Inc. All Rights Reserved 42/50
SR Research Report
Balance sheet
Balance Sheet FY12/09 FY12/10 FY12/11 FY12/12 FY12/13
(JPYmn) Cons. Cons. Cons. Cons. Cons.
ASSETS
Cash and Equivalents 10,485 7,419 9,219 10,181 10,339
Accounts Receivable 14,327 15,128 16,263 15,080 16,173
Allowance for Doubtful -66 -49 -66 -70 -46
Inventories 10,222 7,810 7,714 7,629 7,583
Deferred Tax Assets 362 337 579 716 651
Other Current Assets 4,776 5,254 6,018 5,615 4,963
Total Current Assets 40,107 35,899 39,727 39,150 39,663
Buildings 18,096 13,797 13,472 14,946 14,694
Equipment, Plant 3,303 2,726 2,477 2,361 4,024
Land 34,063 32,984 32,807 33,672 36,170
Lease Asset 3,944 3,206 2,685 2,555 2,222
Other Fixed Assets 356 369 859 989 907
Total Tangible Fixed Assets 59,762 53,081 52,301 54,523 58,019
Investments 2,752 2,530 2,407 4,705 5,214
LT Loans 498 607 531 495 414
Deferred Tax Assets 316 186 132 391 184
Deposits Made 2,018 2,206 2,704 2,721 2,388
Other 1,556 704 915 981 898
Allowance for Doubtful -406 -88 -305 -277 -203
Total Other Fixed Assets 6,734 6,145 6,384 9,016 8,897
Goodwill - - 1,524 1,079 909
Other 598 1,283 2,336 700 865
Total Intangible Assets 598 1,283 2,336 1,778 1,774
Total Fixed Assets 67,094 60,510 61,021 65,317 68,691
Total Assets 107,201 96,408 100,747 104,467 108,354
LIABILITIES
Accounts Payable 6,825 7,003 7,601 7,627 7,721
Short-Term Debt 31,609 23,617 29,443 26,221 27,957
Lease Obligation 664 417 731 783 1,490
Income Taxes Payables 899 826 382 557 312
Provision for Bonuses 556 581 638 628 660
Other Current Liabilities 5,661 5,984 5,647 5,514 5,829
Total Current Liabilities 46,214 38,427 44,442 41,330 43,969
Long-Term Debt 23,768 19,403 17,437 20,914 21,597
Lease Obligation 1,454 1,494 1,719 1,716 1,651
Other Fixed Liabilities 15,527 14,467 12,084 12,757 12,760
Total Long-Term Liabilities 40,749 35,365 31,240 35,386 35,120
Total Liabilities 86,963 73,792 75,682 76,716 79,089
Issued Capital 3,834 3,834 3,834 3,834 3,902
Reserves 5,418 5,418 5,418 5,418 5,511
Retained Earnings 12,243 14,100 16,235 18,407 19,468
Treasury Stock -788 -765 -659 -286 -205
Difference in Securities Valuation -624 -98 -69 162 323
Deferred Hedge Gains/Losses -176 -145 -77 -49 -23
Foregin Currency Translation Adjustment -801 -243 -146 29 296
Subscription rights to shares 3 3 15 35 8
Minority Interest 328 269 368 314 283
Total Shareholder Equity (Net Assets) 20,238 22,617 25,065 27,750 29,265
Working Capital 17,723 15,935 16,376 15,082 16,035
Interest-Bearing Debt 55,377 43,020 46,879 47,135 49,554
Net Debt 44,892 35,601 37,661 36,954 39,215
Source: Company data, SR
Figures may differ from company materials due to differences in rounding methods.
Page 43
SBS Holdings, Inc.(2384)
2014/04/10
http://www.sharedresearch.jp/ Copyright (C) Shared Research Inc. All Rights Reserved 43/50
SR Research Report
Assets
Tangible fixed assets are 54% of the total, and 62% of tangible fixed assets are land (FY12/13). This
includes real estate and logistics facilities owned by SBS Logicom and SBS Transport.
Of the JPY7.6bn in inventories: real estate sales in progress and real estate trust beneficiary interests for
sale were JPY5.8bn and JPY1.6bn respectively (FY12/13). The net amount of trucks and other machinery
and transport equipment was JPY4.0bn, with a large amount already depreciated (JPY12.4bn, FY12/13).
This is because the legally designated useful life of these vehicles is between three and four years,
although in fact many of them are actually used for five years or more.
In FY12/12 investment securities increased to JPY4.7bn, from JPY2.4bn in FY12/11. This was the result of
making Zero an equity method affiliate (Zero [TSE2: 9028] was formerly a logistics subsidiary of Nissan
Motor Co., Ltd. [TSE1: 7201]; its main business is the overland transportation of completed and
second-hand cars). Zero had JPY1.6bn worth of shares. The balance of investment securities at the end of
FY12/13 was JPY5.2bn.
Another group company, SBS Logicom, owned the shares of 40 companies in order to strengthen trading
relationships, worth JPY1.4bn (at end FY12/12), including companies such as Kirin Beer (TSE1: 2503) and
Tokyu Real Estate (TSE1: 3289).
Liabilities
SBS had JPY48.7bn in interest-bearing debt, 62% of total liabilities. After deducting cash, net debt was
JPY38.3bn. While interest-bearing debt is high, it is declining gradually year by year; it was 20% lower in
comparison to FY12/07’s JPY47.4bn. The net debt/equity ratio (net debt/shareholders’ funds) was 2.42x
in FY12/08; this had declined to 1.37x in FY12/13.
Short-term interest bearing debt was JPY28.0bn, and long-term interest bearing debt was JPY20.7bn in
FY12/13; short-term debt was 57% of the total (end FY12/13 figures). SBS said it planned to reduce the
share of short-term debt to around 40%, replacing it with long-term debt.
Net assets
Since FY12/04, SBS has grown net assets through aggressive M&A, profit growth and the development
and securitization of logistics facilities. SBS’s net assets grew from JPY1.6bn in FY12/03 to JPY29.3bn in
FY12/13, a factor of 18x.
Shareholders’ funds
The company’s shareholders’ equity ratio was 26.7% in FY12/13. The ratio was just 16.8% in FY12/08,
but by maintaining ROE at around 10% from FY12/09 onwards, SBS has seen the ratio gradually improve.
Number of shares issued
SBS’s investments are usually funded by operating cash flow and borrowings. The company has not
issued equity since FY12/04. The number of shares has been constant since FY02/05 at 130,684, but in
FY12/12, the company had a 1:100 stock split, taking the total to 13,068,400. The exercise of stock
options brought that total up to 13,204,400 shares by end FY12/13.
Page 44
SBS Holdings, Inc.(2384)
2014/04/10
http://www.sharedresearch.jp/ Copyright (C) Shared Research Inc. All Rights Reserved 44/50
SR Research Report
Cash flow statement
Cash flows from operating activities
The main components of SBS’s cash flow are net income before taxes and other adjustments,
depreciation, and changes in working capital. Slumping profits in FY12/10 and FY12/11 saw operating
cash flow worsen. Since real estate is included in inventories, working capital tends to fluctuate due to the
acquisition of land for real estate development as well as in periods around transfers.
Cash flows from investing activities
The acquisition of tangible and intangible fixed assets accounts for the bulk of investing cash flows. There
were fixed asset purchases of JPY6.4bn in FY12/12 and JPY7.0bn in FY12/13.
Cash flows from financing activities
At end FY12/13, SBS’s cash and deposits were JPY10.3bn and interest-bearing debt was JPY48.7bn. The
company has financing needs, but through FY12/13, it refinanced existing debt with new borrowings.
Inflows from long-term borrowings were JPY12.7bn in FY12/12 and JPY13.0bn in FY12/13. The only
equity finance SBS has raised in the past decade was in September 2005, with the issuance of
yen-denominated convertible bonds worth JPY5.0bn maturing in October 2010. SBS’s top management
said it was negative on equity financing (February 2014). In FY12/08 there were outflows of JPY787mn
due to share buybacks (8,486,000 shares, 6.49% of outstanding shares). The company unloaded some of
its treasury stock with a third-party allocation (563,000 shares) following the introduction of an ESOP
(Employee Stock Ownership Plan) in August 2010. The company also conducted a third-party allocation
(285,600 shares) in November 2012, with TOBU Properties Co., Ltd. as the receiving party. As of end
FY12/13, SBS owned 115 of its own shares.
Cash Flow Statement FY12/09 FY12/10 FY12/11 FY12/12 FY12/13
(JPYmn) Cons. Cons. Cons. Cons. Cons.
Operating Cash Flow (1) 1,902 7,939 3,712 7,317 6,243
Investment Cash Flow (2) 12 3,059 -3,766 -5,520 -6,214
Free Cash Flow (1+2) 1,913 10,999 -54 1,796 29
Financial Cash Flow -6,342 -14,071 1,884 -816 92
Depreciation & Amortization (A) 2,511 3,243 3,887 3,693 3,876
Capital Expenditures (B) -1,655 -1,577 -2,408 -6,405 -7,026
Working Capital Changes (C) 3,752 -1,788 440 -1,294 953
Simple FCF (NI + A + B - C) -908 5,595 3,561 230 -2,532
Source: Company data, SR Inc.
Figures may differ from company materials due to differences in rounding methods.
Page 45
SBS Holdings, Inc.(2384)
2014/04/10
http://www.sharedresearch.jp/ Copyright (C) Shared Research Inc. All Rights Reserved 45/50
SR Research Report
SBS’s inventory turnover runs around 20-30 days, as does the accounts payable turnover period. The
company’s customers such as Megmilk Snow Brand and Nippon Access owe the bulk of accounts
receivable, while accounts payable are to Usami East Japan, Suzuyo Energy and other fuel suppliers, in
the main. Also, the turnover period for accounts receivable is around 40-50 days, longer than other
turnover periods. Inventory and accounts payable turnover periods are roughly in balance, so the
accounts receivable turnover period is the cash cycle. Accordingly, the cash conversion cycle is such that
when sales are growing, working capital increases, and cash flow stagnates. As previously mentioned,
SBS’s inventories contain real estate whose sale is in progress.
Cash Conversion Cycle FY12/09 FY12/10 FY12/11 FY12/12 FY12/13
Cons. Cons. Cons. Cons. Cons.
Accounts Receivable Turnover 7.5 8.1 7.7 8.2 8.5
Days in Accounts Receivable 48.4 44.9 47.3 44.7 43.1
Inventory Turnover 12.8 11.9 14.2 15.0 15.6
Days in Inventory 28.4 30.6 25.8 24.3 23.4
Payables Turnover 13.7 15.5 15.0 15.1 31.0
Days in Payables 26.7 23.5 24.3 24.2 11.8
Cash Conversion Cycle (days) 50.16 52.01 48.82 44.74 54.73
Source: Company data processed by SR Inc.
Figures may differ from company materials due to differences in rounding methods.
Page 46
SBS Holdings, Inc.(2384)
2014/04/10
http://www.sharedresearch.jp/ Copyright (C) Shared Research Inc. All Rights Reserved 46/50
SR Research Report
Other information
History
The company’s forerunner was Kanto Sokuhai, founded by President Kamata in 1987. After working for
the Sagawa Express Group for eight years, Mr Kamata in Tokyo founded Kanto Sokuhai, a delivery
services company encompassing Tokyo and the three neighboring prefectures. The company’s business
proposition was lower logistics costs and same-day delivery. Profits grew steadily, with a major turning
point in 1994. That year the Ministry of Posts and Telecommunications dropped mail charges; Kanto
Sokuhai beat other companies in the industry to begin a mailing service business to get housewives to
deliver direct mail, which provided another boost to profits.
As the scope of the business expanded, the company changed its trade name to Sogo Butsuryu System in
1989 and SBS in 1999. In 2004, the group was reorganized, becoming a pure holding company, changing
to its current name in 2006. Since 2004, SBS has embarked on a series of M&A deals, including the
subsidiaries of major companies: in 2004, it bought Snow Brand Logistics (now SBS Flec); in 2005, Tokyu
Logistic (now SBS Logicom); in 2010, Victor Logistics (now SBS Logicom).
Since 2007, SBS has been an active logistics facilities developer, and in 2013 it securitized assets via a
private fund (the limited liability company SBS Logi Fund No. 1). In 2011, SBS bought Atlas Logistics, an
international logistics company in India. In 2012, SBS set up a regional Asian headquarters company, SBS
Logistics RHQ, and has a presence in Singapore, Thailand, Vietnam and Malaysia. In April 2013, SBS set
up a local subsidiary in Hong Kong and launched a logistics business there. In 2003, SBS listed shares on
the OTC market of the Japan Securities Dealers Association (now JASDAQ), the Second Section of the TSE
in 2012, and the First Section in 2013.
Major shareholders
As of December 31, 2013
Top ShareholdersAmount
Held
Masahiko Kamata 45.15%
SBS Holdings Employee Share Ownership Association 4.36%
Japan Trustee Services Bank, Ltd. (Trust account) 3.25%
SMBC TRUST BANK Designated Securities Trust 3.02%
The Chase Manhattan Bank, N. A. London Secs Lending Omnibus Account 2.53%
Junichi Ouchi 2.34%
Tobu Properties Co., Ltd. 2.08%
The Master Trust Bank of Japan, Ltd. (Trust Account) 2.00%
Hiroshi Date 1.63%
State Street Bank and Trust Client Omnibus Account OM02 1.51%
Source: Company data processed by SR
Page 47
SBS Holdings, Inc.(2384)
2014/04/10
http://www.sharedresearch.jp/ Copyright (C) Shared Research Inc. All Rights Reserved 47/50
SR Research Report
Top management
Masahiko Kamata, representative director and president (born 1959), joined Tokyo Sagawa Express in
1979. He worked there for eight years, learning the basics of the logistics business, and also how
improvements to logistics functions can boost corporate profits. In 1987, he left the company to strike out
on his own, establishing Kanto Sokuhai (forerunner of SBS). In 1988, he was appointed representative
director and president of SBS. Since then he has expanded the number of group companies. At end
FY12/13, he was a director of SBS Flec, Zero, Pam, SBS Zentsu, Atlas Logistics, and SBS Logistics RHQ, as
well as representative director of SBS Logicom.
The managing director, Kenichi Iriyama (born 1951), joined the Long-Term Credit Bank of Japan (now
Shinsei Bank) in 1974, rising to head of the personnel department, and joined SBS in 2002 as head of
corporate planning. He became managing director of SBS in 2006. At end FY12/13, he was a director of
Marketing Partner, SBS Flec, A-Max, SBS Logicom and SBS Zentsu, as President Kamata’s right-hand man.
Employees
SBS’s consolidated employee numbers were 4,662 at end FY12/13, and there were 7,906 temporary
employees (yearly average basis). The parent company had 114 employees and eight temporary
employees on a yearly average basis.
Average age: 44.0 years.
Average length of service: 5.8 years.
Average annual salary: JPY6.5mn.
Shareholder returns
SBS aims at a stable dividend. Since FY12/10, it has paid a dividend of JPY30/share (adjusted for a 1:100
stock split in FY12/12). In FY12/12, the company paid a JPY10/share dividend to commemorate listing on
the Second Section of the Tokyo Stock Exchange, and in FY12/13, paid another special JPY10/share
dividend to commemorate listing on the First Section of the Tokyo Stock Exchange.
The company is targeting a dividend per share of JPY40, with a dividend payout ratio of 20.8% in FY12/14.
The company aims to maintain a payout ratio of around 20%, in line with plans to retain a sufficient
amount of earnings to bolster its balance sheet. It did not have any special benefit plan for shareholders
as of FY12/13.
IR
The company holds profit briefings twice yearly at the full-year and interim results.
Page 48
SBS Holdings, Inc.(2384)
2014/04/10
http://www.sharedresearch.jp/ Copyright (C) Shared Research Inc. All Rights Reserved 48/50
SR Research Report
By the way
The company’s name, SBS Holdings, comes from the initials of the Japanese “Sogo” (general) “Butsuryu”
(logistics) and “Shisutemu” (system). According to the company: “The name originates from the group’s
desire to provide customers with organized, systematic and streamlined services, from a comprehensive
logistical perspective”. The company’s new logo was created in June 2013 to mark the company’s 25th
anniversary and listing on the Tokyo Stock Exchange. The company said that, “the logo is in the motif of
the “S” from SBS and depicts the dynamic intersection of two curves. This design represents the
encounter, communion and mutual interaction between SBS, people, corporations and society, as well as
how SBS strives to exist as a company where all employees can take on new challenges and pursue their
dreams”.
Source: Company materials
Page 49
SBS Holdings, Inc.(2384)
2014/04/10
http://www.sharedresearch.jp/ Copyright (C) Shared Research Inc. All Rights Reserved 49/50
SR Research Report
Company
Company name Head office
SBS Holdings, Inc. Olinas Tower,
1-3 Taihei 4-chome, Sumida-ku,
Tokyo, Japan 130-0012
Phone Listed on
+81-3-3829-2222 Tokyo Stock Exchange 1st Section
Established Exchange listing
December 16, 1987 December 15, 2003
Website Fiscal year-end
http://www.sbs-group-ir.com/index.html December
IR contact IR web
http://www.sbs-group-ir.com
IR mail IR phone
Main consolidated segments (% of total sales)
Logistics 91.4 %
Property Management 4.2 %
Other 4.4 %
(December 2013)
Directors Shares outstanding
(including treasury shares)
Masahiko Kamata, president 13,204,000 shares (December 2013)
Kenichi Iriyama, senior director Shareholders capital
Taiji Sugino, director JPY390,200,000 (December 2013)
Makoto Watanabe, director Main subsidiaries
Tetsuya Sekimoto, director (outside) SBS Logicom Co Ltd
Shin-ichiro Watanabe, audit & supervisory board
member (full-time)
SBS Flec Co Ltd
Shigetaka Shomatsumoto, audit & supervisory board
member (outside)
SBS Zentsu Co Ltd
Masahito Takeda, audit & supervisory board member
(outside)
SBS Sokuhai Co Ltd
Jiro Iwasaki, audit & supervisory board member
(outside)
(April 2014) Main banks
Sumitomo Mitsui Banking Corporation
The Bank of Tokyo-Mitsubishi UFJ
Employees (consol.) 4,662 Mizuho Bank
Employees (parent) 114
Average age (parent) 44.0 years Auditors
Average salary (parent) JPY6.5mn Ernst & Young ShinNihon LLC
(December 2013)
Page 50
SBS Holdings, Inc.(2384)
2014/04/10
http://www.sharedresearch.jp/ Copyright (C) Shared Research Inc. All Rights Reserved 50/50
SR Research Report
About Shared Research Inc.
We offer corporate clients comprehensive report coverage, a service that allows them to better inform investors and other stakeholders
by presenting a continuously updated third-party view of business fundamentals, independent of investment biases. Shared Research
can be found on the web at http://www.sharedresearch.jp.
Disclaimer
This document is provided for informational purposes only. No investment opinion or advice is provided, intended, or solicited. Shared
Research Inc. offers no warranty, either expressed or implied, regarding the veracity of data or interpretations of data included in this
report. Shared Research Inc. shall not be held responsible for any damage caused by the use of this report.
The copyright of this report and the rights regarding the creation and exploitation of the derivative work of this and other Shared
Research Reports belong to Shared Research Inc. This report may be reproduced or modified for personal use; distribution, transfer, or
other uses of this report are strictly prohibited and a violation of the copyright of this report. SR Inc. officers and employees may currently,
or in the future, have a position in securities of the companies mentioned in this report, which may affect this report’s objectivity.
Japanese Financial Instruments and Exchange Law (FIEL) Disclaimer
The initial version of this report has been prepared by Shared Research Inc. (“SR”) under a contract with the company described in this
report (“the Company”). Opinions and views presented are SR’s where so stated. Such opinions and views attributed to the Company
are interpretations made by SR. SR represents that if this report is deemed to include an opinion by SR that could influence investment
decisions in the Company, such opinion may be in exchange for consideration or promise of consideration from the Company to SR.
Contact Details
http://www.sharedresearch.jp
Email: [email protected]
3-31-12 Sendagi
Bunkyo-ku Tokyo, Japan
Phone: +81 (0)3 5834-8787
Current Client Coverage of Shared Research Inc.:
Accretive Co., Ltd. Fields Corp. Onward Holdings Co., Inc.
AEON DELIGHT Co. FreeBit Co., Ltd. Panasonic Information Systems Co.
Ai Holdings Corp. Gamecard-Joyco Holdings, Inc. Paris Miki Holdings Inc.
Anritsu Corporation GCA Savvian Corporation Pigeon Corp.
Apamanshop Holdings Co., Ltd. Grandy House Corp. Resorttrust, Inc.
ArtSpark Holdings Inc. Gulliver International Co., Ltd. Round One Corp.
Axell Corporation Happinet Corporation Sanix Incorporated
BALS Corporation Harmonic Drive Systems Inc. Sanrio Co., Ltd.
Bell-Park Co., Ltd. Infomart Corp. SATO Holdings Corp.
Benefit One Inc. Intelligent Wave Inc. SBS Holdings, Inc.
Canon Marketing Japan Inc. ITO EN, Ltd. Ship Healthcare Holdings Inc.
Chiome Bioscience Inc. J Trust Co., Ltd SMS Co., Ltd.
Chiyoda Co., Ltd. Japan Best Rescue Co., Ltd. Star Mica Co., Ltd.
Comsys Holdings Corporation JIN Co., Ltd. Takashimaya Co., Ltd.
Creek & River Co., Ltd. Kenedix, Inc. Takihyo Co., Ltd.
Daiseki Corp. Lasertec Corp. Tamagawa Holdings Co., Ltd
DIC Corporation MAC-HOUSE Co. 3-D Matrix, Ltd.
Digital Garage Inc. Medinet Co., Ltd. TOKAI Holdings Corp.
Don Quijote Co., Ltd. MIRAIT Holdings Corp. Verite Co., Ltd.
Dream Incubator Inc. mobcast inc. WirelessGate, Inc.
Elecom Co. NAIGAI TRANS LINE LTD. Yellow Hat Ltd.
EMERGENCY ASSISTANCE JAPAN Co. NanoCarrier Ltd. Yumeshin Holdings
en-Japan Inc. Nippon Parking Development Co., Ltd. ZAPPALLAS, INC.
FerroTec Corp. NS Tool Co.
A ttention: If y ou would like to see firms y ou inv est in on this list, ask them to become our client, or sponsor a report y ourself.