48
NLR – Netherlands Aerospace Centre CUSTOMER: KDC Schiphol Noise Predictor - Final Report NLR-CR-2017-050 |
NLR – Netherlands Aerospace Centre
CUSTOMER: KDC
Schiphol Noise Predictor - Final Report
NLR-CR-2017-050 |

Netherlands Aerospace Centre
NLR is a leading international research centre for
aerospace. Bolstered by its multidisciplinary expertise
and unrivalled research facilities, NLR provides innovative
and integral solutions for the complex challenges in the
aerospace sector.
For more information visit: www.nlr.nl
NLR's activities span the full spectrum of Research
Development Test & Evaluation (RDT & E). Given NLR's
specialist knowledge and facilities, companies turn to NLR
for validation, verification, qualification, simulation and
evaluation. NLR thereby bridges the gap between research
and practical applications, while working for both
government and industry at home and abroad.
NLR stands for practical and innovative solutions, technical
expertise and a long-term design vision. This allows NLR's
cutting edge technology to find its way into successful
aerospace programs of OEMs, including Airbus, Embraer
and Pilatus. NLR contributes to (military) programs, such
as ESA's IXV re-entry vehicle, the F-35, the Apache
helicopter, and European programs, including SESAR and
Clean Sky 2.
Founded in 1919, and employing some 650 people, NLR
achieved a turnover of 73 million euros in 2014, of which
three-quarters derived from contract research, and the
remaining from government funds.

UNCLASSIFIED
EXECUTIVE SUMMARY
Problem area
Schiphol invests in its relation to the environment by communicating on aircraft noise and through providing a forum for discussion with inhabitants for the communities around the airport. Current information regarding noise for communities around Schiphol is based only on historic and actual data (e.g. “BAS Verslag van de Dag”, “vliegbewegingen online” and NOMOS). To help reduce noise hindrance, new information can be provided to the community. Research shows that if people living in the vicinity of the airport can anticipate on aircraft noise sufficiently ahead in time, it is very likely that they will be less annoyed when noise events occur. Therefore, there is a high potential for improvement if the public could anticipate aircraft noise.
Schiphol Noise Predictor - Final Report
REPORT NUMBER NLR-CR-2017-050 AUTHOR(S) H.H. Hesselink M. den Boer J.M. Nibourg G.B. Stegeman T.D. de Witte M. Smolders B. Overbeek REPORT CLASSIFICATION UNCLASSIFIED DATE KNOWLEDGE AREA(S) Training, Missiesimulatie en Operator Performance Planning, geavanceerde (sensor)informatieverwerking en -regeling Vliegtuiggeluidseffecten op de omgeving DESCRIPTOR(S) vlieggeluid runway management runway configuration forecasting noise forecasting aircraft noise

UNCLASSIFIED
EXECUTIVE SUMMARY
NLR
Anthony Fokkerweg 2
1059 CM Amsterdam
p ) +31 88 511 3113 f ) +31 88 511 3210
e ) [email protected] i ) www.nlr.nl
For increasing cost efficiency, creating a larger social basis and increasing acceptance of noise, a new method for communication is investigated by prototyping a smartphone app that should provide a higher benefit per euro of investment. A forecasted noise for a period of twenty-four hours will be set up through a light interface
Description of work
The work consists of the development of the app, in close cooperation with the stakeholders in KDC (LVNL – project lead, AAS and KLM). The app has been set up in five sprints, where for each sprint an evaluation session has been organised to obtain feedback from KDC and potential end users. Two evaluations session with randomly selected 30 participations from communities around Schiphol airport have been organised, where they have received the app on their smartphone for a period of one week. In a separate path, the calculation engine has been developed.
Results and conclusions
The project provided an app that predicts aircraft noise around Schiphol. From the technical evaluation, it can be concluded that the forecasting capability (24 hour forecast, based on weather conditions) is functioning well. The usability evaluation shows that end users appreciate the app and about half of the participants indicate that the perception of the noise does not fully comply with the forecasted information. About one fifth of the participations indicated that their perception towards the airport has been positively influenced. The perception on the noise experience needs improvement. Some improvements have already been identified.
Applicability
The app can be used as stand-alone information system, but better would be to embed this in an environment that provides more information on runway use for Schiphol. Extensions to the app (e.g. indication of uncertainty of the forecast) may be necessary, before going live. The principle of noise forecasting can be used at other airports as well and the current app is easily adapted to the specific information on other airfields.

NLR - Netherlands Aerospace Centre
AUTHOR(S):
H.H. Hesselink Netherlands Aerospace Centre
M. den Boer NLR J.M. Nibourg NLR G.B. Stegeman NLR T.D. de Witte NLR M. Smolders M2Mobi B. Overbeek KNMI
Schiphol Noise Predictor - Final
Report
NLR-CR-2017-050 |
CUSTOMER: KDC

2
| NLR-CR-2017-050
CUSTOMER KDC
CONTRACT NUMBER KDC2016021
OWNER KDC
DIVISION NLR Aerospace Operations
DISTRIBUTION Limited
CLASSIFICATION OF TITLE UNCLASSIFIED
APPROVED BY :
AUTHOR REVIEWER MANAGING DEPARTMENT
H.H. Hesselink
DATE DATE DATE
No part of this report may be reproduced and/or disclosed, in any form or by any means without the prior written permission of the owner.

3
NLR-CR-2017-050 |
Summary
Schiphol invests in its relation to the environment by communicating on aircraft noise and through providing a forum for discussion with inhabitants for the communities around the airport. Current information regarding noise for communities around Schiphol is based only on historic and actual data (e.g. “BAS Verslag van de Dag”, “vliegbewegingen online” and NOMOS). To help reduce noise hindrance, new information can be provided to the community. Research shows that if people living in the vicinity of the airport can anticipate on aircraft noise sufficiently ahead in time, it is very likely that they will be less annoyed when noise events occur. Communication is a major issue in driving the attitude of people. Therefore, there is a high potential for improvement if the public could anticipate aircraft noise. For increasing cost efficiency, creating a larger social basis and increasing acceptance of noise, a new method for communication is investigated by prototyping a smartphone app that should provide a higher benefit per euro of investment. Within this project, carried out by a consortium of NLR, M2Mobi and KNMIM, forecasted noise for a period of twenty-four hours will be made through a light interface on a smartphone app. The app is called vlieggeluid. In close cooperation with the stakeholders in KDC (LVNL – project lead, AAS and KLM). The app has been set up in several sprints, where for each sprint, at a planning session, the exact contents of the sprint has been decided. After development of the contents, an evaluation session has organised to obtain feedback from KDC and other potential end users. The work has been carried out in five sprints. For two sprints, large evaluation session with randomly selected 30 participations from communities around Schiphol airport have been organised, where they have received the app on their smartphone for a period of one week. After this, an extensive feedback has been obtained from them. From the technical evaluation, it can be concluded that the forecasting capability (24 hour forecast, based on weather conditions) is functioning well. The usability evaluation shows that end users appreciate the app and about half of the participants indicate that the perception of the noise does not fully comply with the forecasted information. The perception on the noise experience needs improvement. Some improvements have already been identified. About one fifth of the participations indicated that their perception towards the airport has been positively influenced. The app can be used as stand-alone information system or may be embedded in a larger system of information provision towards communities around Schiphol. Extensions to the app (e.g. indication of uncertainty of the forecast) may be necessary, before providing the app live to the community. Some further improvements are identified. The result of the project is an app that predicts aircraft noise around Schiphol. The project proved feasibility of a noise prediction for the upcoming 24 hours for Amsterdam Airport Schiphol.
4
| NLR-CR-2017-050

5
NLR-CR-2017-050 |
Contents
Abbreviations 7
1 Introduction 9 1.1 Consortium and roles 9 1.2 Document structure 9
2 General set up of the project 11 2.1 App development – Scrum method 11 2.2 Main elements of the work 12
3 Engine design 13 3.1 Runway forecasting 14 3.2 Route forecasting 15 3.3 Traffic forecasting 16 3.4 Generation of the noise heatmap 17
4 User experience 19 4.1 Representation 19 4.2 SEL or LAmax 19 4.3 Noise accumulation 19 4.4 Graphical presentation 20 4.5 Presenting uncertainty 21
5 App design 23 5.1 Creative session 23 5.2 Representation 23
6 Evaluation 25 6.1 Evaluation of the engine 25
6.1.1 Evaluation of runway use 25 6.1.2 Evaluation of noise 26
6.2 Evaluation of the app 28
7 Conclusions 31
8 References 33
Appendix A All comparisons SNP vs. FANOMOS 34
Appendix B Result from the app evaluation 41

6
| NLR-CR-2017-050
7
NLR-CR-2017-050 |
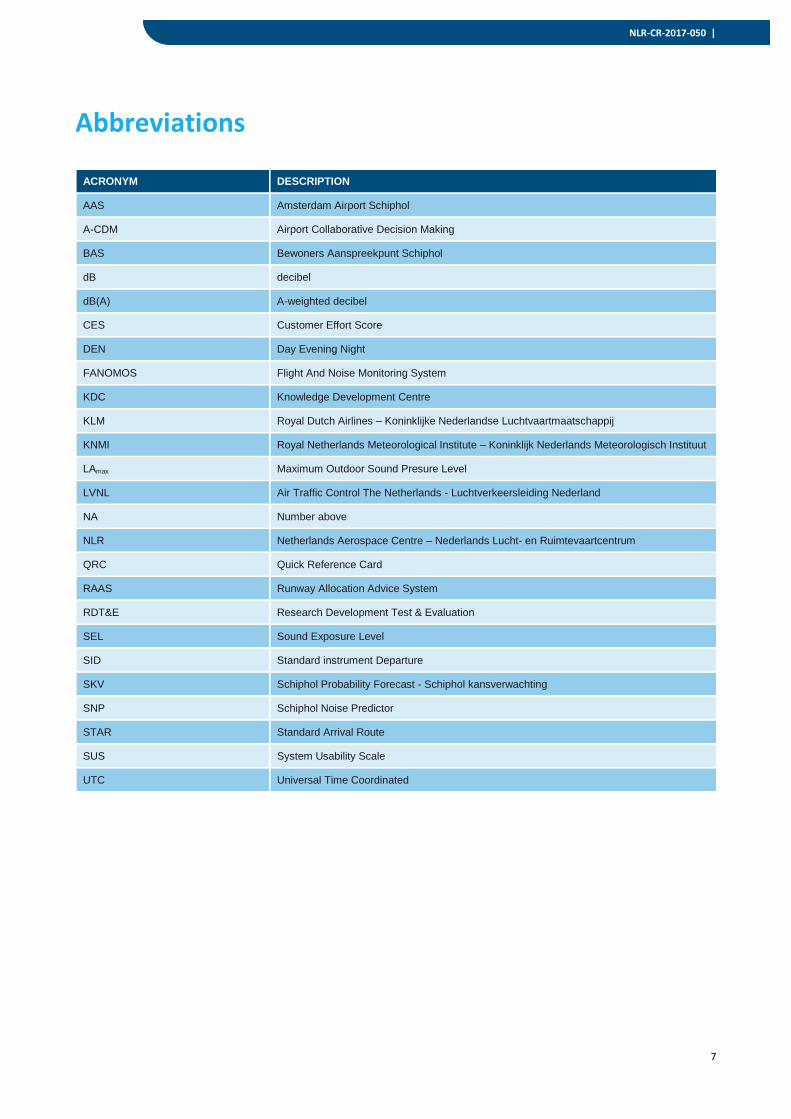
Abbreviations
ACRONYM DESCRIPTION
AAS Amsterdam Airport Schiphol
A-CDM Airport Collaborative Decision Making
BAS Bewoners Aanspreekpunt Schiphol
dB decibel
dB(A) A-weighted decibel
CES Customer Effort Score
DEN Day Evening Night
FANOMOS Flight And Noise Monitoring System
KDC Knowledge Development Centre
KLM Royal Dutch Airlines – Koninklijke Nederlandse Luchtvaartmaatschappij
KNMI Royal Netherlands Meteorological Institute – Koninklijk Nederlands Meteorologisch Instituut
LAmax Maximum Outdoor Sound Presure Level
LVNL Air Traffic Control The Netherlands - Luchtverkeersleiding Nederland
NA Number above
NLR Netherlands Aerospace Centre – Nederlands Lucht- en Ruimtevaartcentrum
QRC Quick Reference Card
RAAS Runway Allocation Advice System
RDT&E Research Development Test & Evaluation
SEL Sound Exposure Level
SID Standard instrument Departure
SKV Schiphol Probability Forecast - Schiphol kansverwachting
SNP Schiphol Noise Predictor
STAR Standard Arrival Route
SUS System Usability Scale
UTC Universal Time Coordinated

8
| NLR-CR-2017-050
This page is intentionally left blank.

| NLR-CR-2017-050
1 Introduction
This report is the final report for the project “Schiphol Noise Predictor”; the app is called vlieggeluid. Vlieggeluid provides inhabitants of communities around the airport information that will enable them to anticipate noise from aircraft. The prediction horizon is 24 hours. Aim of the project is to investigate the development of such an app through prototyping. To help reduce noise hindrance, new information can be provided to the community. Previous research [1] shows that if people living in the vicinity of the airport can anticipate on aircraft noise sufficiently ahead in time, it is very likely that they will be less annoyed when noise events occur. Therefore, there is a high potential for improvement if the public could anticipate aircraft noise. A forecasted noise for a period of twenty-four hours will be made. New methods for communication may appear to be more cost effective than existing ones. Information leaflets and written articles in newspapers have a limited distribution range and time span. Websites are been used frequently for information provision and provide the possibility for updates at any moment. Maintenance of the site and the need for end-users to actively search for information is a disadvantage. Smartphones offer a means of communication that is both flexible and easy to use. The SNP-project will investigate the possibility for providing noise forecast information through a smart phone app. This will enable easy to use access through a “light” interface. As comparison, weather forecast apps and alerting apps such as KNMI’s Weeralarm explain the crucial ingredients for a successful predictor of complex events. Popular weather apps provide personalised information and easily understandable indicators for probability, presented in a visually attractive way. The Schiphol Noise Predictor (SNP) project therefore aims to provide meaningful information on the impact of expected noise to the general public. To this end, a high quality noise forecast will be necessary, where the uncertainties from this forecast can be easily understood. The information will be provided as an app that can be downloaded on the end user’s smartphone. The work consists of the development of the app, in three elements:
Development of the engine, the calculation of the forecast.
Development of the presentation principle, based on the latest insights in communicating about noise.
Development of the user experience, the user interface of the app.
1.1 Consortium and roles
The work is carried out in a consortium led by NLR. Other partners are M2Mobi and KNMI. The work consists of developing a mathematical engine for determining the noise forecast and prototyping of a user interface for the app. The work is carried according to the Scrum method in five sprints. NLR has been responsible for project management and development of the engine. NLR also brings in expertise on noise and noise experience. M2Mobi has been responsible for application of Scrum, through refining the five sprints, developing the app and for including considerations on user experience. KNMI brought expertise on presentation and communication of uncertainty and impacts into the project.
1.2 Document structure

10
This document is organised as follows. Chapter 2 gives the general outline of the project and chapter 3 details the design of the engine. Chapter 4 will discuss use experience aspects concerning design of the contents of the app. Chapters 5 gives the app-design and 6 provides an overview of the feedback from the end users (the representative audience).

| NLR-CR-2017-050
2 General set up of the project
The project is called SNP, which stands for Schiphol Noise Predictor. The corresponding app is called the vlieggeluid app (for aircraft noise). The work has been carried out in five sprints according to the Scrum method as will be explained in section 2.1. The work further consists of four parts: engine development, user experience design, app design and evaluation. These elements will be further introduced in section 2.2.
2.1 App development – Scrum method
For the project Schiphol Noise Predictor, we used Scrum as a method for the product development. Scrum is an iterative agile software development framework for managing product development. It defines a flexible, holistic product development strategy where a development team works as a unit to reach a common goal. A very important principle of Scrum is its recognition that during product development, the customers can change their minds about what they want and need. As such, Scrum adopts an evidence-based empirical approach—accepting that the problem cannot be fully understood or defined at the start of the project and focusing, instead on maximizing the team's ability to deliver quickly, to respond to emerging requirements and to adapt to evolving technologies and changes in market conditions.
During the development phase, the team worked in sprints of two weeks. A sprint is a set period of time during which specific work has to be completed and made ready for review. Each sprint begins with a planning meeting. During the meeting, the product owner (NLR project coordinator), together with representatives of Knowledge Development Center (KDC), and the development team agree exactly upon what work will be accomplished during the sprint. The development team has the final say when it comes to determining how much work can realistically be accomplished during the sprint, and the product owner has the final say on what criteria need to be met for the work to be approved and accepted. Each sprint provides a working increment of the software. The process is depicted in Figure 1. The Product Backlog contains all open requests from the stakeholders on elements that can be included in the product. Per sprint, at the Sprint Planning Meeting, it is decided which of these request will be implemented in the sprint. The sprint cycle is depicted here as 30 days, to include the planning and evaluation meetings; the actual sprint development always takes place in two weeks. Every day, during this development, a brief meeting is held to align all members of the Development Team and to discuss progress and open issues.
Figure 1 Scrum development process
12
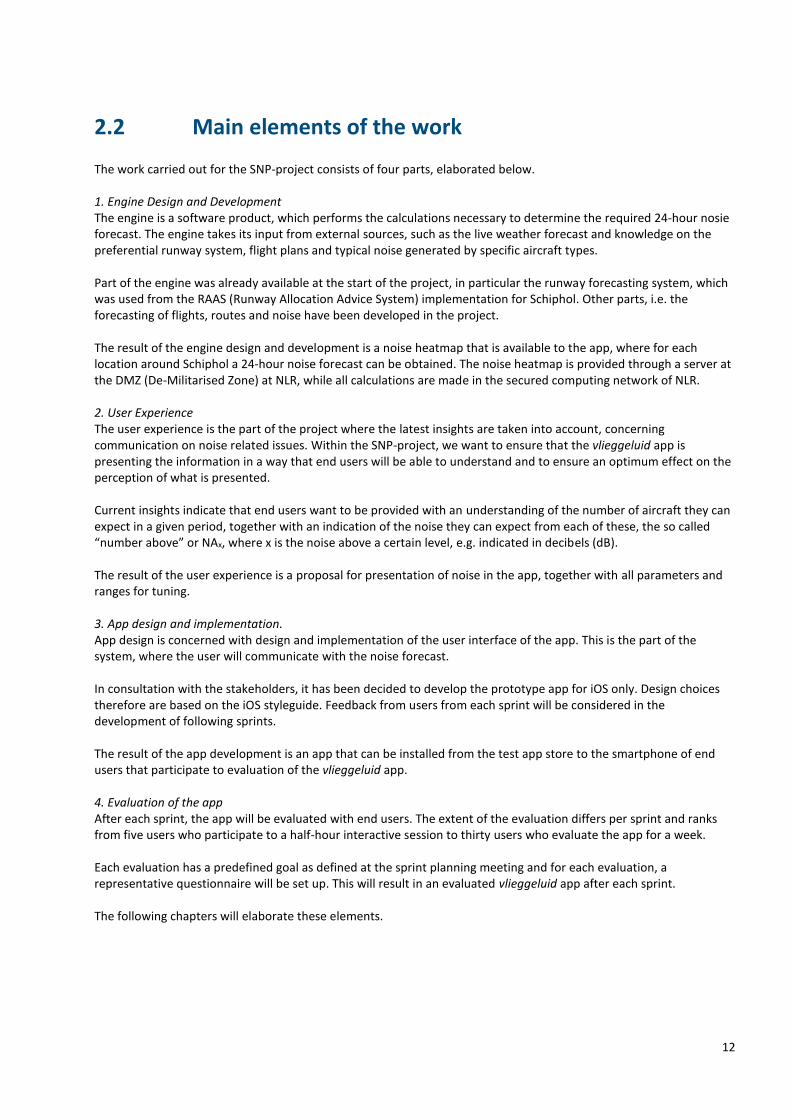
2.2 Main elements of the work
The work carried out for the SNP-project consists of four parts, elaborated below. 1. Engine Design and Development The engine is a software product, which performs the calculations necessary to determine the required 24-hour nosie forecast. The engine takes its input from external sources, such as the live weather forecast and knowledge on the preferential runway system, flight plans and typical noise generated by specific aircraft types. Part of the engine was already available at the start of the project, in particular the runway forecasting system, which was used from the RAAS (Runway Allocation Advice System) implementation for Schiphol. Other parts, i.e. the forecasting of flights, routes and noise have been developed in the project. The result of the engine design and development is a noise heatmap that is available to the app, where for each location around Schiphol a 24-hour noise forecast can be obtained. The noise heatmap is provided through a server at the DMZ (De-Militarised Zone) at NLR, while all calculations are made in the secured computing network of NLR. 2. User Experience The user experience is the part of the project where the latest insights are taken into account, concerning communication on noise related issues. Within the SNP-project, we want to ensure that the vlieggeluid app is presenting the information in a way that end users will be able to understand and to ensure an optimum effect on the perception of what is presented. Current insights indicate that end users want to be provided with an understanding of the number of aircraft they can expect in a given period, together with an indication of the noise they can expect from each of these, the so called “number above” or NAx, where x is the noise above a certain level, e.g. indicated in decibels (dB). The result of the user experience is a proposal for presentation of noise in the app, together with all parameters and ranges for tuning. 3. App design and implementation. App design is concerned with design and implementation of the user interface of the app. This is the part of the system, where the user will communicate with the noise forecast. In consultation with the stakeholders, it has been decided to develop the prototype app for iOS only. Design choices therefore are based on the iOS styleguide. Feedback from users from each sprint will be considered in the development of following sprints. The result of the app development is an app that can be installed from the test app store to the smartphone of end users that participate to evaluation of the vlieggeluid app. 4. Evaluation of the app After each sprint, the app will be evaluated with end users. The extent of the evaluation differs per sprint and ranks from five users who participate to a half-hour interactive session to thirty users who evaluate the app for a week. Each evaluation has a predefined goal as defined at the sprint planning meeting and for each evaluation, a representative questionnaire will be set up. This will result in an evaluated vlieggeluid app after each sprint. The following chapters will elaborate these elements.

| NLR-CR-2017-050
3 Engine design
In order to determine the 24-hour noise forecast, a number of steps will need to be taken. The end user will be situated at a certain location, somewhere in the vicinity of Amsterdam Airport Schiphol. A 70km. x 70km. grid will be considered from where the noise forecast can be consulted. Figure 2 shows a google-maps view where the user is located in Zwanenburg and could request a noise forecast.
Figure 2 Location from where the noise forecast can be requested
In order to determine this noise forecast for the upcoming 24 hours, it will need to be known what air traffic is expected at the given location. Once each expected flight with its characteristics is known, it will be possible to determine the flight noise footprint. The noise footprint of each flight is based on a hybrid database, where each for each flight the registered from measurement or model, the average noise footprint is known. The database was built with actual flights from the year 2016, where for each group of flights with similar characteristics, the origin, destination, aircraft type, and climb procedure is known so that noise information can be retrieved. The used noise model is the Dutch Noise Model that is used for legal computations. The 24-hours forecasted flight schedule will need to be known. Several (on-line) sources provide this information, but for the project it was decided to use an off-line schedule. Because of the repetitive flight schedule at Schiphol, a representative week of flights can be determined for the summer and for the winter schedule. Using these weekly schedules, all flights for one day can be determined. Next, it will need to be determined, where the aircraft are expected to fly in the upcoming day of operations. For this, the active routes and active runways will be determined. The forecasted runways are determined using RAAS (Runway Allocation Advice System) which considers meteorological forecast, the preferential runway system, traffic demand and planned runway maintenance. Routes are considered from the flown tracks as registered in FANOMOS for the year 2016. When put together, all information leads to noise heat map. This is a 70x70 km. grid, where for each grid point the forecasted noise is depicted. Twenty three of those heat maps provide the total requested forecast. Note: the twenty fourth item is the current hour, for which current noise information will be presented, based on actual runway use. The steps as described above will be presented in the following sections and is depicted in Figure 3 as a number of sequential functional steps to determine 1) the runway forecast, 2) traffic, 3) the routes, 4) the noise heat map and finally 5) the noise at each individual point. N.B. step 2 and 3 are combined in the figure.

14
Figure 3 Functional steps in the noise forecast calculation (the engine)
3.1 Runway forecasting
Runway forecasting is performed using RAAS, the NLR Runway Allocation Advice System. Aim of runway forecasting is to determine the forecasted runway use for the upcoming 24 hours. Inputs to this, see Figure 4, are
The detailed weather forecasts as provided by KNMI and known by Schiphol as the Schiphol KansVerwachting (SKV). SKV provides a 30-hour forecast from which the first 24 hours are used in the app. The limitation to 24 hours is an arbitrary choice; the forecast can be extended to a 30-hour forecast without further developments necessary.
The preferential runway system as published in the Quick Reference Card (QRC) 25
Traffic demand
The availability of runways, based on planned maintenance.
Figure 4 Function: runway configuration forecast
The method for runway configuration forecasting has been described in 33[3], [4] and [5] and the implementation used for the current noise forecast forms the basis for the operational implementation of the runway forecast and reporting system at Belgocontrol [6]. To calculate possible runway use, the weather forecast is used. The weather forecast determines cross- and tailwind at each runway after which some configurations may drop out as the wind may exceed their operational limits. A list of potential runway configurations remains. The list will be sorted in order of preference according to QRC25. Alternative preference lists may be used when runways are unavailable e.g. because of long term maintenance. Traffic peak periods are considered to determine whether one or two runways should be used for landing or take-off. All weather related input is probabilistic, which, when taken into consideration, leads to a sorted list of runway configurations with a probability for each configuration. An example is given in Figure 5.

| NLR-CR-2017-050
Figure 5 Example runway configurations with probabilities, indicated per hour
Next, a hybrid method based on empirical data from historical choices and artificial intelligence (a rule based approach) is used to determine the most probable runway configuration. This is done for every hour of the 24-hour forecast. When looking at the example above, at 08:00 (the first coloured column), it is reasonably clear that the configuration 06 - / 36L 36C, with a probability of use of 99%, will be selected; however, the following morning at 09:00 a more complex mechanism for making this choice will be necessary as 18R - / 24 18L has a probability of use of 74%, while the less preferred configuration 27 - / 24 27 has a probability of 99%. The runway configuration transition used in SNP for the 24-hour forecast will be based on the exact moment as defined in the QRC25, e.g. the inbound to outbound peak in the morning takes place at 09:40 UTC. A probability in runway configuration forecasting may be included in the result of the runway forecast. The probability depends on the quality of the weather forecast and the quality of the hybrid runway selection algorithm and can be used in SNP to explain the end user the uncertainty in the noise forecast.
3.2 Route forecasting
Aim of route forecasting is to determine what route will be used for each of the flights. Inputs to this are the routes that have been used in the past period, taken from the 2016 FANOMOS database. Routes are defined for flights from each possible runway, so a set of routes from and to each runway will be the result of this step. Inputs are as depicted in Fout! Verwijzingsbron niet gevonden. as follows:
Flight origin
Flight destination
Runway configuration in use
SIDs/STARs
Figure 6 Function #2: Traffic and Route Forecast
For each possible runway configuration and each possible flight, based on historic data, the routes used in the past are collected.
16
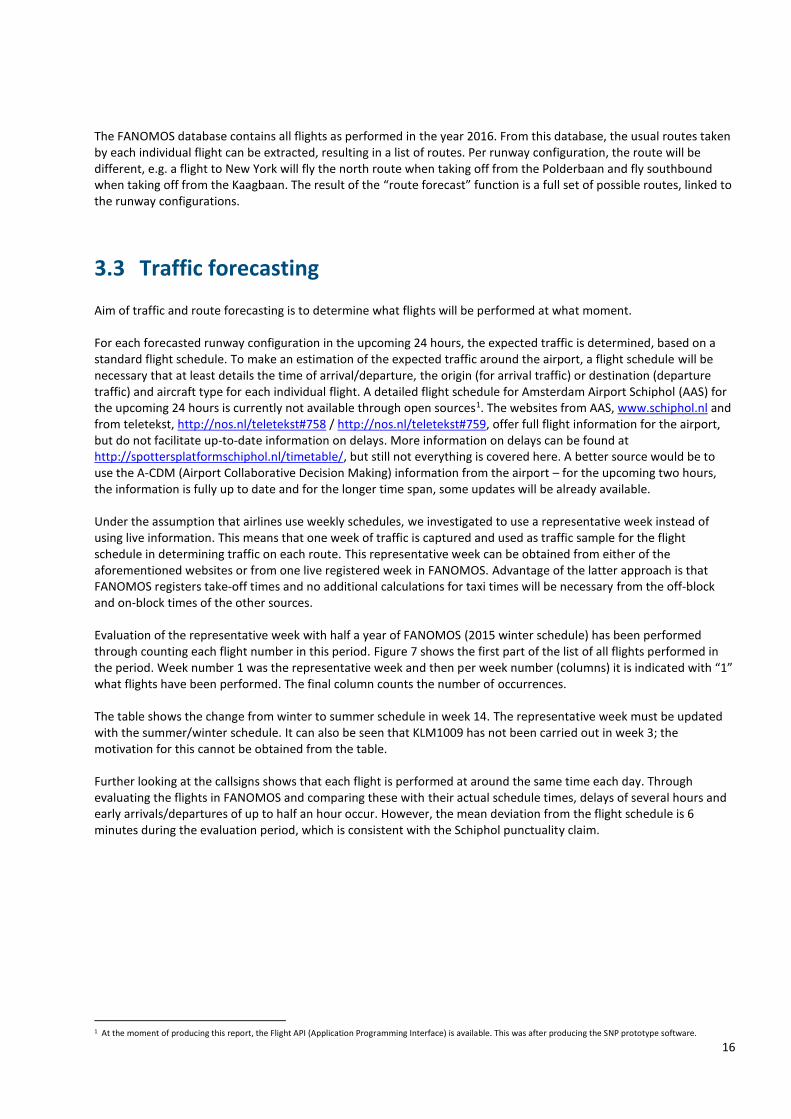
The FANOMOS database contains all flights as performed in the year 2016. From this database, the usual routes taken by each individual flight can be extracted, resulting in a list of routes. Per runway configuration, the route will be different, e.g. a flight to New York will fly the north route when taking off from the Polderbaan and fly southbound when taking off from the Kaagbaan. The result of the “route forecast” function is a full set of possible routes, linked to the runway configurations.
3.3 Traffic forecasting
Aim of traffic and route forecasting is to determine what flights will be performed at what moment. For each forecasted runway configuration in the upcoming 24 hours, the expected traffic is determined, based on a standard flight schedule. To make an estimation of the expected traffic around the airport, a flight schedule will be necessary that at least details the time of arrival/departure, the origin (for arrival traffic) or destination (departure traffic) and aircraft type for each individual flight. A detailed flight schedule for Amsterdam Airport Schiphol (AAS) for the upcoming 24 hours is currently not available through open sources1. The websites from AAS, www.schiphol.nl and from teletekst, http://nos.nl/teletekst#758 / http://nos.nl/teletekst#759, offer full flight information for the airport, but do not facilitate up-to-date information on delays. More information on delays can be found at http://spottersplatformschiphol.nl/timetable/, but still not everything is covered here. A better source would be to use the A-CDM (Airport Collaborative Decision Making) information from the airport – for the upcoming two hours, the information is fully up to date and for the longer time span, some updates will be already available. Under the assumption that airlines use weekly schedules, we investigated to use a representative week instead of using live information. This means that one week of traffic is captured and used as traffic sample for the flight schedule in determining traffic on each route. This representative week can be obtained from either of the aforementioned websites or from one live registered week in FANOMOS. Advantage of the latter approach is that FANOMOS registers take-off times and no additional calculations for taxi times will be necessary from the off-block and on-block times of the other sources. Evaluation of the representative week with half a year of FANOMOS (2015 winter schedule) has been performed through counting each flight number in this period. Figure 7 shows the first part of the list of all flights performed in the period. Week number 1 was the representative week and then per week number (columns) it is indicated with “1” what flights have been performed. The final column counts the number of occurrences. The table shows the change from winter to summer schedule in week 14. The representative week must be updated with the summer/winter schedule. It can also be seen that KLM1009 has not been carried out in week 3; the motivation for this cannot be obtained from the table. Further looking at the callsigns shows that each flight is performed at around the same time each day. Through evaluating the flights in FANOMOS and comparing these with their actual schedule times, delays of several hours and early arrivals/departures of up to half an hour occur. However, the mean deviation from the flight schedule is 6 minutes during the evaluation period, which is consistent with the Schiphol punctuality claim.
1 At the moment of producing this report, the Flight API (Application Programming Interface) is available. This was after producing the SNP prototype software.

| NLR-CR-2017-050
Figure 7 Flights performed in week 2 to week 27
In a further analysis, the traffic sample of the representative week has been used and compared with the actual traffic in the following weeks. A maximum of 9% deviation from the 7525 flights from the representative week has been registered. The table shows that the number of flights is slightly increasing over the year, indicating that it may be interesting to update the representative schedule more often than two times per year; for example an update of the representative week in week 7 would have led to a maximum deviation of 5%.
Figure 8 Forecasted vs. realised traffic based on the representative week
This analysis shows that traffic at Schiphol contains a strong repetition each week. Because of this, a representative week provides sufficient quality for determining forecasted traffic. An update of the schedule will be necessary at least twice a year with the start of the summer and winter schedules. More often would provide higher quality. Result of the flight schedule becoming available is that we now create the possibility to forecast each individual flight for the upcoming 24 hours. When combined with the runway allocation forecast and the routes forecast, we now know exactly when to expect an aircraft at each location around Schiphol.
3.4 Generation of the noise heatmap
Aim of the noise heatmap is to generate a complete picture of the noise situation around Schiphol for every hour within the forecasting horizon. Input for this is the information on forecasted traffic situation at each moment (each individual flight with its characteristics, see section 3.3) and information on the noise generated by each flight. The latter information will be obtained from the hybrid database as assembled by NLR. Corresponding information flows are depicted in Figure 9.
18
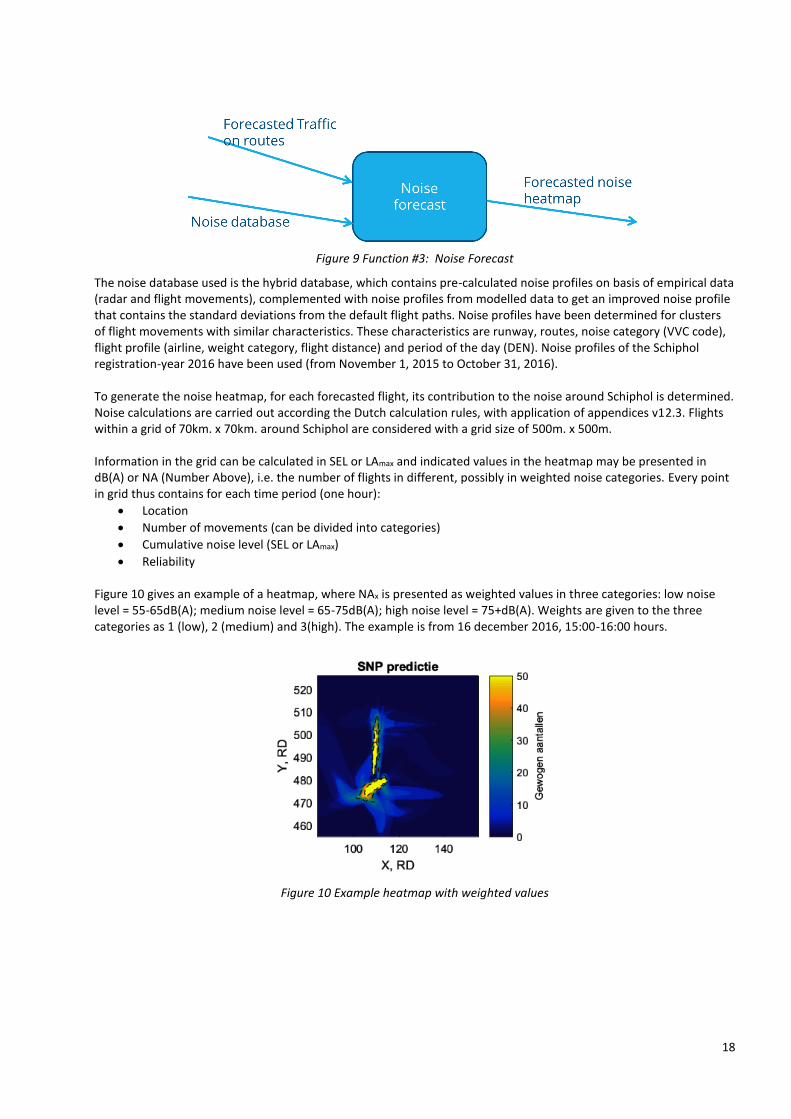
Figure 9 Function #3: Noise Forecast
The noise database used is the hybrid database, which contains pre-calculated noise profiles on basis of empirical data (radar and flight movements), complemented with noise profiles from modelled data to get an improved noise profile that contains the standard deviations from the default flight paths. Noise profiles have been determined for clusters of flight movements with similar characteristics. These characteristics are runway, routes, noise category (VVC code), flight profile (airline, weight category, flight distance) and period of the day (DEN). Noise profiles of the Schiphol registration-year 2016 have been used (from November 1, 2015 to October 31, 2016). To generate the noise heatmap, for each forecasted flight, its contribution to the noise around Schiphol is determined. Noise calculations are carried out according the Dutch calculation rules, with application of appendices v12.3. Flights within a grid of 70km. x 70km. around Schiphol are considered with a grid size of 500m. x 500m. Information in the grid can be calculated in SEL or LAmax and indicated values in the heatmap may be presented in dB(A) or NA (Number Above), i.e. the number of flights in different, possibly in weighted noise categories. Every point in grid thus contains for each time period (one hour):
Location
Number of movements (can be divided into categories)
Cumulative noise level (SEL or LAmax)
Reliability Figure 10 gives an example of a heatmap, where NAx is presented as weighted values in three categories: low noise level = 55-65dB(A); medium noise level = 65-75dB(A); high noise level = 75+dB(A). Weights are given to the three categories as 1 (low), 2 (medium) and 3(high). The example is from 16 december 2016, 15:00-16:00 hours.
Figure 10 Example heatmap with weighted values

| NLR-CR-2017-050
4 User experience
To present the calculated noise to the end user, a suitable format will be required. The result of this work is a presentation of noise in the app, together with all parameters and ranges for tuning
4.1 Representation
The most commonly used indication of noise is to present values in dB(A) units. The A-weight considers the sensitivity of the human ear for the pitch of the noise. This noise level provides a quantitative measure that can be considered as an objective value. The dB(A) measure is often used for providing an indication of the total amount of noise that can be expected at several locations around e.g. an airfield for a given period, usually a year. Disadvantage of the use of the unit is the exponential scale on which it is used, making it difficult to understand for the user, specifically when this concerns a small number of summed events (which is the case in our hourly traffic forecast). A noise representation that is getting more attention is the “number above” or NAx. Number above is a relative measure to a number of events of type “x”. In our situation, we consider the number of events above a given dB(A). The minimum noise level considered for an aircraft to be relevant is 55 dB(A), so we will consider the measure NA55dB(A).
4.2 SEL or LAmax
Each flight will need to be represented in the presentation through a noise level. For this, several measures are available. First tests with the use of SEL (Sound Exposure Level) appeared to provide noise levels that could not be understood by the end user. During the evaluation, end users indicated they did not recognize the noise levels as indicated in the app as compared to the noise they actually experiences. Therefore, it has been decided to use LAmax as indication for the noise level at each grid point for each flight. LAmax is the maximum noise that is generated by each flight at the given grid point. This means we will count each flight that generates an LAmax of 55dB(A) or higher at each point on the grid. To make a distinction between relatively quiet and relatively noisy flights, three categories have been defined for:
55 dB(A) to 65 dB(A)
65 dB(A) to 75 dB(A)
75 dB(A) and higher The noise levels are considered as such from common literature on the topic, but also based on actual experience with overflying aircraft at a test location in Zwanenburg.
4.3 Noise accumulation
The total number above (NA) will be displayed at the app per time interval. The duration chosen for each NA-interval will be one hour, but it needs to be noted that this interval could be changed, e.g. to twenty minutes, which would better represent the runway changes at the airport. The choice for the one-hour has been made to allow the use 24 items in the scroll list; when using a 20 minute interval, the list would extent to 72 items and probably be too long.
20
Each contributing flight to one of the three categories as mentioned in section Fout! Verwijzingsbron niet gevonden. will be counted as one occurrence. This will result in a depiction of traffic as indicated in Figure 11.
Figure 11 Indication of NAx at the app
Apart from the NAx-indication for each category, the app will provide a graphical presentation of the accumulated noise for a given period.
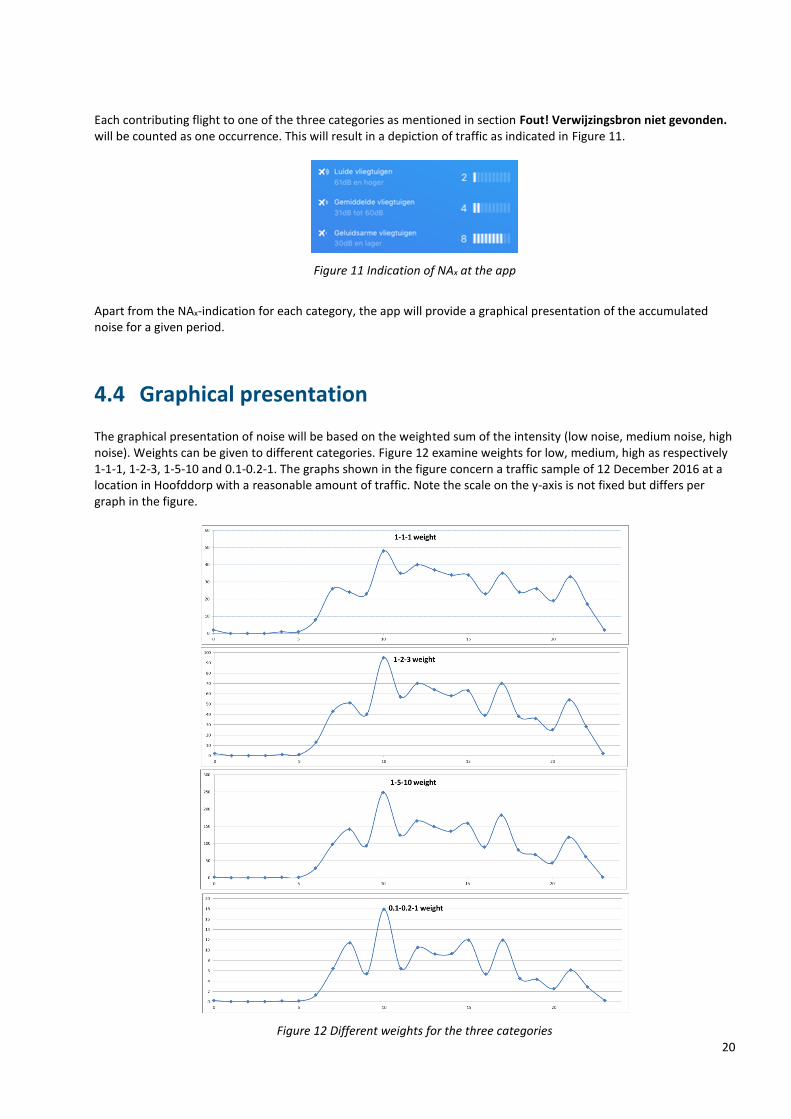
4.4 Graphical presentation
The graphical presentation of noise will be based on the weighted sum of the intensity (low noise, medium noise, high noise). Weights can be given to different categories. Figure 12 examine weights for low, medium, high as respectively 1-1-1, 1-2-3, 1-5-10 and 0.1-0.2-1. The graphs shown in the figure concern a traffic sample of 12 December 2016 at a location in Hoofddorp with a reasonable amount of traffic. Note the scale on the y-axis is not fixed but differs per graph in the figure.
Figure 12 Different weights for the three categories

| NLR-CR-2017-050
It can be concluded that the shape of the graph does not change with the different weights. The (departure) peaks can be recognised in each of the graphs. The height of the peaks differs with more or less weight to the high noise events; therefore, we decide to use the 1-2-3 weight distribution as this gives a good indication of the noise. Five different locations around Schiphol have been investigated, using 1-2-3 weights, where the highest event at Hoofddorp is 96 (see figure above). When setting a fixed scale in the app, this can be done at 100. Locations extremely near the runways will become off-scale and should be truncated at the value 100.
4.5 Presenting uncertainty
As we are dealing with forecasted information, the inherent uncertainty will need to be indicated to the end user. This can be done through a text message at the “on boarding” phase at the moment the end user starts the app or during use of the app. The text message does not have preference as this is momentary information that might get lost when the end user does not read the information well. The use of information on the uncertain character of the information will be relevant for creating basis for acceptance of the app in case of uncertainty in the forecast. The information on uncertainty in the proposed graph presentation may be presented as a plume, similar to a weather forecast (with uncertainty in temperatures for the upcoming days), as percentage or as qualitative information like “highly probably”. A plume will not work in this case, because the uncertainty has not a normal distribution: depending on whether a runway is used or not, there can be for example loud noise or no noise at all on a certain location, with no possibility of “medium noise” in between. User feedback did show us that in the case of noise forecast, uncertainty expressed in percentage doesn’t work either. The meaning of the percentage was unclear. Reason is a missing threshold for perspective for action, which is needed to be able to do something with the information (e.g.: if the chance on precipitation is 70%, someone can choose to take a bus rather than go by bike; a chance of 70% on a certain level of noise doesn’t have any perspective for action). This leaves the possibility of qualitative uncertainty information:
A. Presenting relative uncertainty in runway use The presentation in Figure 13 avoids the use of percentages and gives also information about runways which are certain not to be used (green). Especially that information gives perspective for action, for example to organise a garden party.
Figure 13 Presenting uncertainty in runway use
B. Marking highly uncertain noise forecasts

22
All noise forecasts, for every time interval, are accompanied with uncertainty. However, in some cases, uncertainty is much higher, for example with high north westerly wind speeds. In those cases, the decision for runway use is made at the last moment and the forecast could be totally wrong. The information given on forehand on the highly uncertainty of the forecast will give more acceptance if the forecast indeed appears to be wrong. The highly uncertain forecast can be marked, e.g. with a red symbol, as indicated in Figure 14.
Figure 14 Highly uncertain forecast

| NLR-CR-2017-050
5 App design
5.1 Creative session
Prior to the actual development, M2mobi held a creative session to present and discuss different concepts of presenting a forecasted noise. Figure 15 shows an overview of the different concepts that have been discussed in this creative session.
Figure 15 Concepts discussed at the creative session
The concepts discussed show different elements that have been discussed during the session; all items have been included in the backlog of the project. Per sprint, in consultation with the Product Owner and all stakeholders, it was decided what elements would be further considered and implemented in the phase of the work.
5.2 Representation
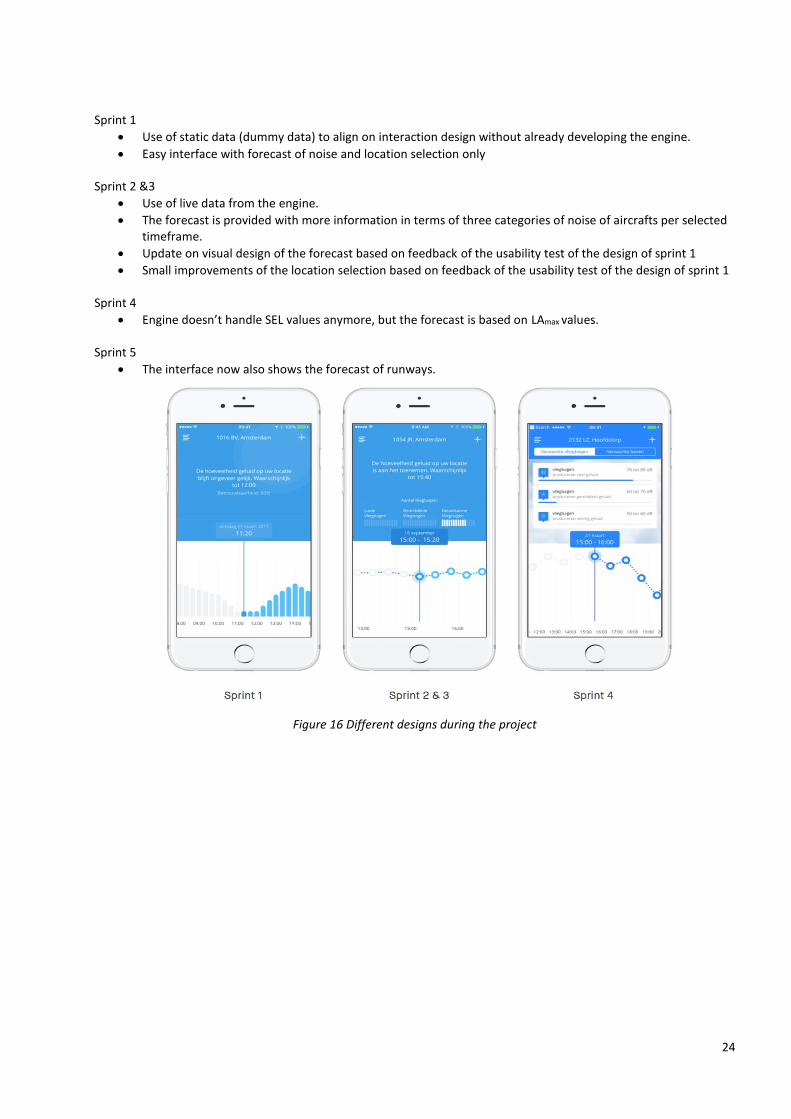
Based on the feedback provided by all stakeholders during the creative session, M2mobi proposed a design as shown in sprint 1 in the image of Figure 16. This has been the first actual design that has been developed by the development team. Each sprint was concluded with a usability test. Small tests with 5 independent end users were held after sprints 1, 2 and 4, while after sprints 3 and 5, a usability test with a user group of 30 users has been held in order to define which direction the design and technical requirements should go to. All feedback from these usability tests has been merged with the findings of the stakeholders and the results from the evaluation of the engine. A more in depth report of these findings is provided in Chapter 7. The evolution of the resulting app presentation following the sprints is given in the remainder of Figure 16. Main elements (feedback and evaluation) on which decisions for the design are made have been:
24
Sprint 1
Use of static data (dummy data) to align on interaction design without already developing the engine.
Easy interface with forecast of noise and location selection only
Sprint 2 &3
Use of live data from the engine.
The forecast is provided with more information in terms of three categories of noise of aircrafts per selected timeframe.
Update on visual design of the forecast based on feedback of the usability test of the design of sprint 1
Small improvements of the location selection based on feedback of the usability test of the design of sprint 1 Sprint 4
Engine doesn’t handle SEL values anymore, but the forecast is based on LAmax values. Sprint 5
The interface now also shows the forecast of runways.
Figure 16 Different designs during the project

| NLR-CR-2017-050
6 Evaluation
The final usability research for vlieggeluid took place between 6th of March 2017 and 13th of March 2017. A total of 46 participants took part in the research, with 26 participants living nearby Schiphol and being particularly receptive to aircraft noise. During the trial phase of the usability research, these participants took use of the vlieggeluid app on a daily basis in order to estimate the amount of aircraft and the amount of noise that would be generated by airplanes flying over their home location. This chapter provides the evaluation of the engine, first from a technical perspective, then from the usability aspect.
6.1 Evaluation of the engine
Evaluation of the engine may be carried out through evaluating each separate function. Within each function for determining the 24-hour noise forecast, choices have been made and uncertainty is introduced in the calculations. This applies for:
The weather forecast
The runway forecast
Traffic forecast
Routes forecast
Noise forecast However, in chapter 3 we have seen that the choices have been made based on long-term evaluation of the forecasts hence any new evaluation will lead to the same results. Note that it may be that the evaluation week as used for the vlieggeluid app may give a different result as the evaluation period has been shorter. Furthermore, a marginal error in the weather forecast will not necessarily lead to an error in the runway forecast as a crosswind or tailwind component may still be within limits for changing the runway configuration. Also, the use of a rolling hour will ensure that errors in determining the number of aircraft within one hour will be compensated through an error in the previous hour and the following hour. The same applies for most of the other functions, so it can be debated whether an evaluation of each component is useful as an extensive evaluation of the results of the engine. The most interesting evaluation will be to determine the actual noise that was experienced in the evaluation week afterwards, based on the flights that have been recorded by FANOMOS. The information must be provided in the same format as it was in the app during the evaluation, i.e. the information on aircraft numbers and the total weighted amount of noise generated. One additional evaluation has been performed: the runway use as this is a critical function at the basis of the calculations.
6.1.1 Evaluation of runway use
During the evaluation period, the runway use has been extensively monitored as this is one of the major contributing factors to a correct forecast of the noise in the vlieggeluid app. The evaluation will differentiate between 1) correct forecasting of runways, 2) correct forecasting of runway direction of use and 3) wrong forecast of northern vs. southern runway use. Ad. 2. A missing runway in the forecast or runway that was forecasted but not used, will have a direct effect on the noise forecast nearby the runway. However, further off the runway routes merge and the noise forecast will show similar results as for correct runway use.

26
Ad. 3. A wrongly forecasted runway direction (northerly instead of southerly or vice versa) will show serious consequences for the noise forecasting as departure and arrival traffic will be reversed. The runway forecasting will be fully wrong and noise forecasting will be off. The effect of a wrong forecast is however reduced as the vlieggeluid app shows only peaks and in which it does not differentiate between arrival and departure peaks (bottom of the screen). This effect will need further study. The evaluation week concerns 182 measurements (one measurement per hour) with the following results:
87% correctly forecasted runway use.
0.5% error in northern or southern runway use.
12.5% direction forecasted correctly; routes and noise levels may differ.
6.1.2 Evaluation of noise
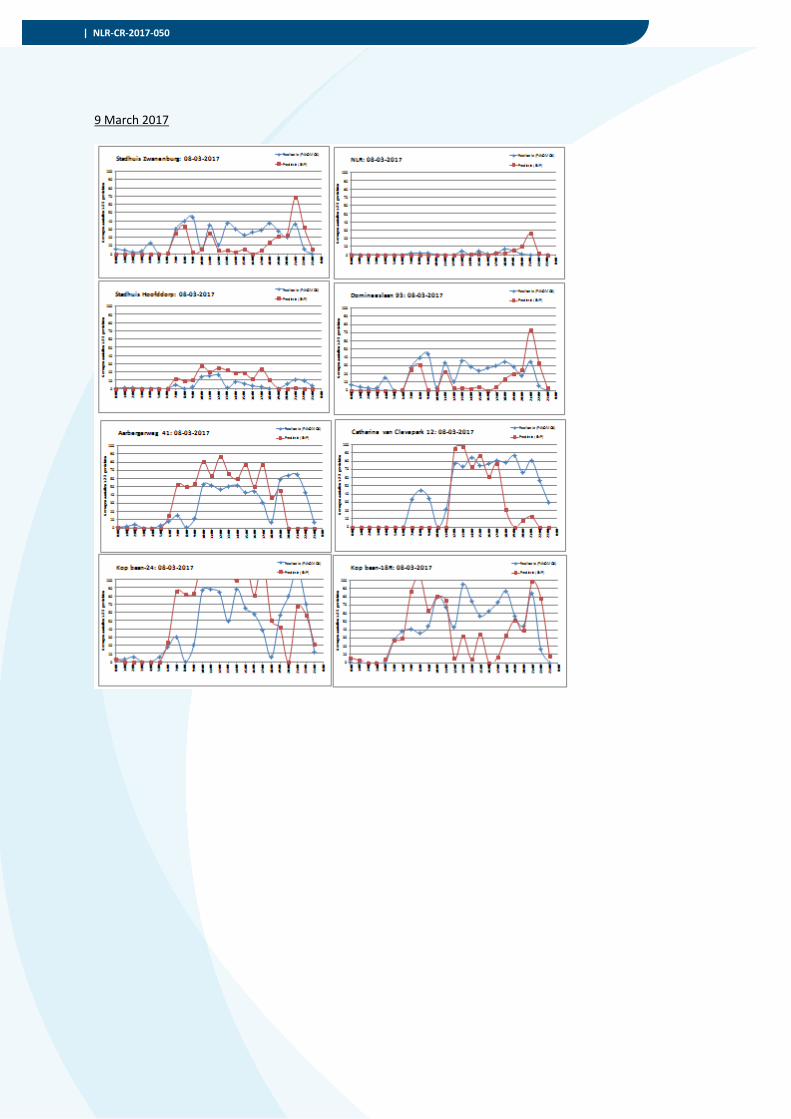
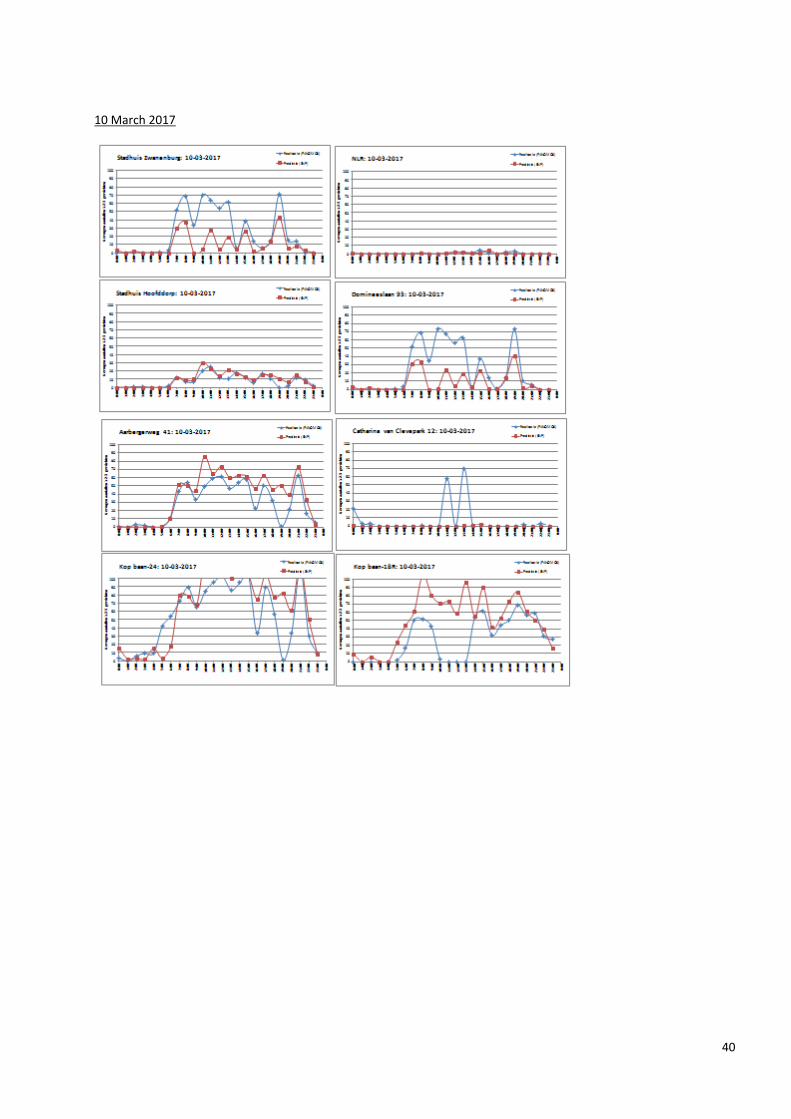
To evaluate the experienced noise in a quantitative manner, FANOMOS recordings from the evaluation week of 6 to 13 March 2017 have been used. Weighted noise levels have been determined. Results for one specific hour are depicted in Figure 17, where the top graphs show the SNP and FANOMOS calculations separately and the bottom graph shows the difference between both.
Figure 17 SNP calculations vs FANOMOS noise levels
Advantage of this presentation is that is displays the complete 70x70 km grid around the airport. It is, however, difficult to interpret and therefore, we selected eight points around the airport to evaluate the noise in more detail. The eight locations all will display a significant noise level under one of the runways and as indicated on Google maps in Figure 18.

| NLR-CR-2017-050
Figure 18 Measurement points
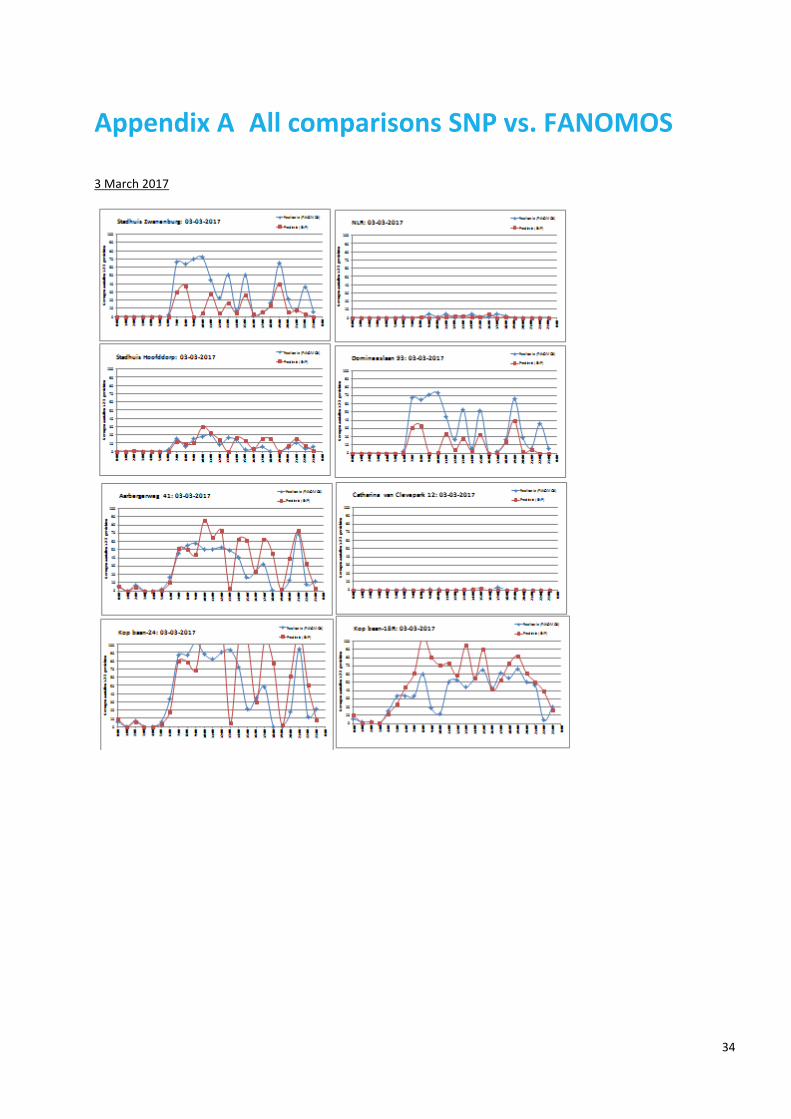
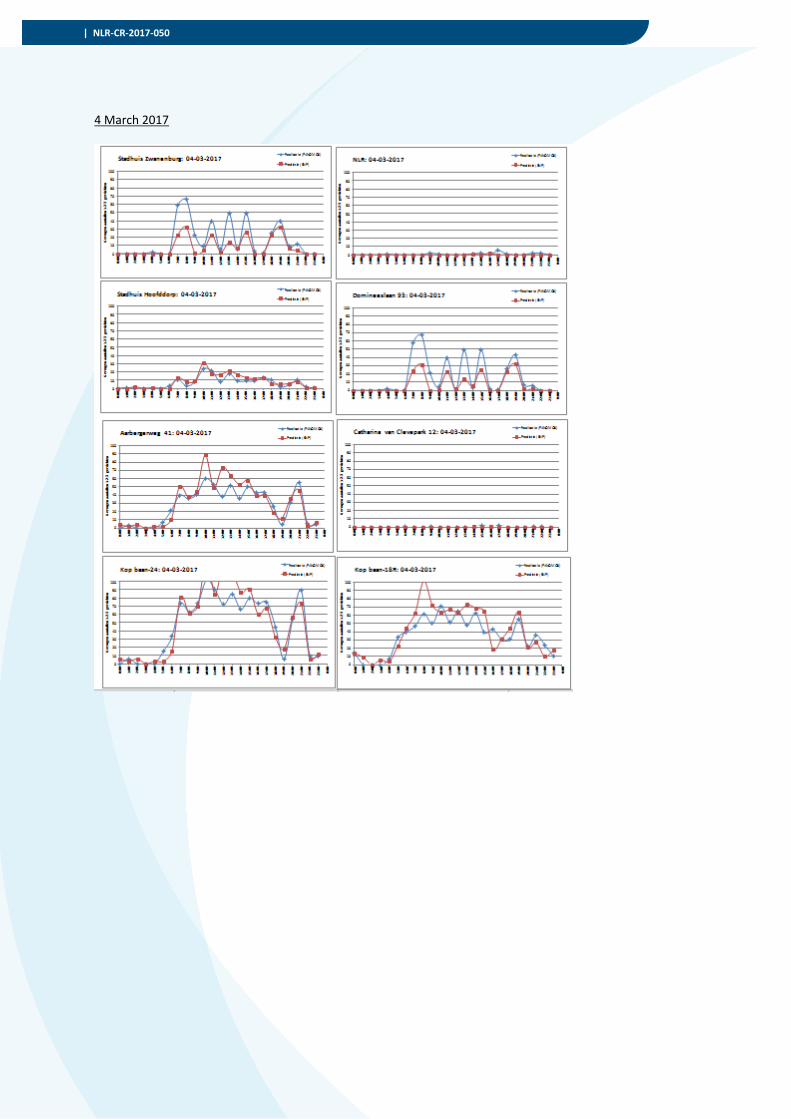
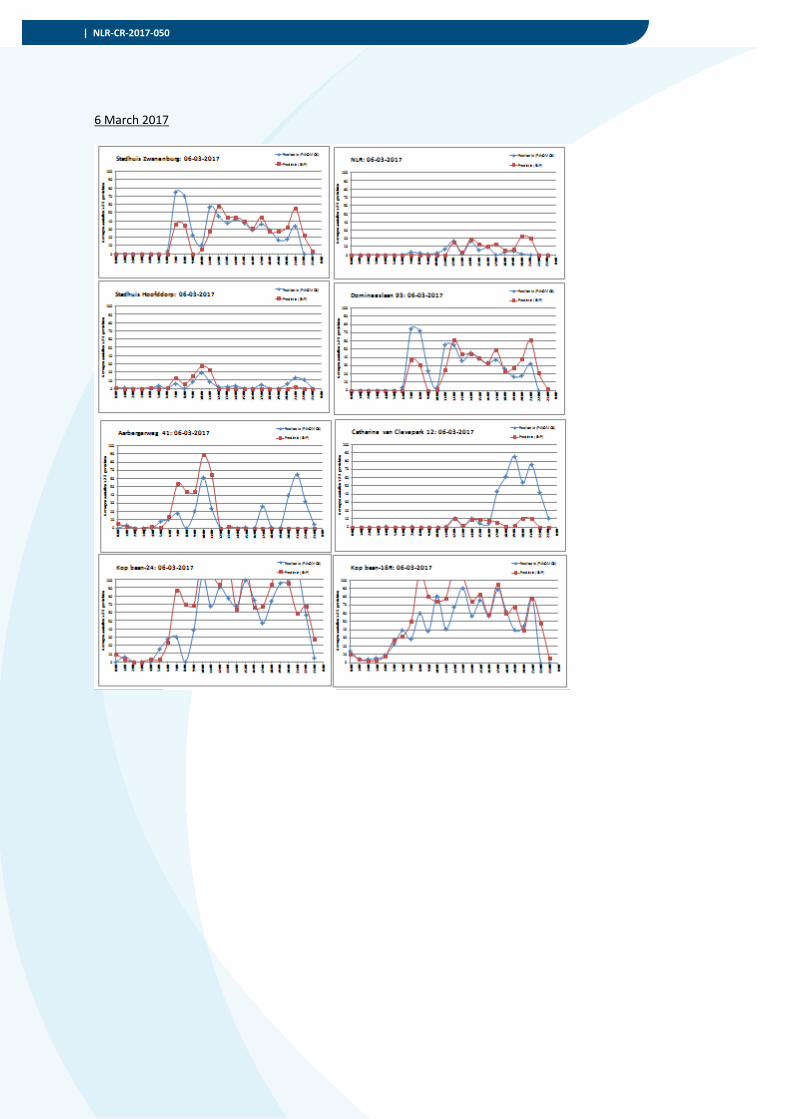
The graph in Figure 19 shows the results of the results of 6 March 2017 at the location of the city hall in Zwanenburg. The red line depicts the SNP forecasts, the blue line the actual noise measurements from FANOMOS (both normalized to the weighted sum as described in section 4.4). Basis for drawing the graph is the 24-hour noise forecast at 0:00 hours for the day (the forecast will improve if a shorter interval is selected, e.g. a 6-hour forecast at four times during the day) All graphical results of the evaluation week can be found in Fout! Verwijzingsbron niet gevonden.. March 7th has been omitted from the presentation as a power disruption at NLR caused the app to be off-line for a number of hours.
Figure 19 SNP predictions and FANOMOS measurements
From the graph in Figure 19 and Fout! Verwijzingsbron niet gevonden., a number of observations made and conclusions can be drawn. The figures for peaks given below are roughly calculated as the graph needs an interpretation from the evaluator. Observations:
The graph as shown in the red lines have been shown exactly the same on the app, where we need to note that no y-axis has been presented there. The noise levels are supposed to be relative levels in the app, e.g. compared to the actual hour. Therefore, the shape of the graphs is more important than the exact height.
The shape of the graph clearly depicts the arrival and departure peaks as occur at Amsterdam Airport Schiphol.
At the eight locations, during seven days, 11 peaks have been missed in the SNP forecasts. These lasted in between one and six hours. A total of about 33 hours has been missed this way.
Four peaks were wrongly predicted, each lasting one hour. A total of four hours has been wrongly predicted as peak period.

28
The total number of peaks is roughly counted as 221. Conclusions:
The number of peaks correctly predicted was 95% (210 of 221).
The times a peak was correctly predicted was 97% (37 wrong peaks of 1344 measurement hours) These conclusions are interpretations from the graphs in Appendix A. When looking at the exact height of the graphs (on the y-axis) one might argue that differences exist between the forecast and the noise as actually occurred. For the calculation above, peaks are considered correctly predicted even if the exact height of the peak was not correct. For the presentation of forecasted noise in the vlieggeluid app, the exact height of the graph is no issue as the peaks are considered relative (no height is indicated in the y-axis of the graphs on the app). One other argument for not making exact comparisons between the SNP forecast and FANOMOS noise figures is that the FANOMOS figures are not measurements, but figures based on modelled calculations. Further, the eight evaluation points chosen have their effect on the evaluation as some are related and will show the same results for correct or incorrect runway use.
6.2 Evaluation of the app
In prelude to the trial phase, participants filled in a survey that measured their paivest experience with aircraft noise; this survey is referred to as “Survey I”. The survey was filled in by a total of 29 participants. The goal of this survey was to collect comparison data that could later on be used as a measuring rod for determining whether using the vlieggeluid app had a notable impact on the way participants perceive aircraft noise. In order to collect results and feedback a second survey was sent to the participants after the trial phase had expired; this survey is referred to as “Survey II”. The survey was filled in by a total of 29 participants. Survey II was made up out of three categories: (1) questions about usage of the app, (2) CES (Customer Effect Score) questions and (3) SUS (System Usability Scale) questions. The goal of this survey was to measure:
The level of ease at which the app can be used.
How users experience daily usage of the app.
Whether the app contributes to a change in perception of aircraft noise. A third and final survey was sent to the participants in order to evaluate the level of accuracy between the decibel categories displayed in the app and the experienced loudness of aircraft noise by our participants. Current experience with aircraft noise - survey I All results as indicated further below in this section can be found in Appendix B. All participants live within a radius of 45 kilometers of Schiphol. 55% of the participants indicate that—on a scale of 1 to 10—aircraft noise poses a medium to serious hinder in their daily lives. A primary example of this hinder is when participants want to sit in their backyard during the day or when they try to sleep at night—because of aircraft noise participants can’t always carry out normal conversations during the day and are woken up during their hours of sleep at night. Two participants mentioned to having filed a complaint about aircraft noise in the past; five other participants indicate that they sometimes look up information about aircraft noise. Feedback about the app - survey II Participants responded positively to the design of the app: 79% of the participants left behind a positive review in the survey. Remarks and feedback collected from the survey:
Navigation of the app is straightforward; simple and obvious.
The app feels modern and has a straightforward interface that keeps it functional and clear of distractions.
The app launches fast, feels consistent and incorporates the different functionalities reasonably.
The app could use a bit more color.
| NLR-CR-2017-050
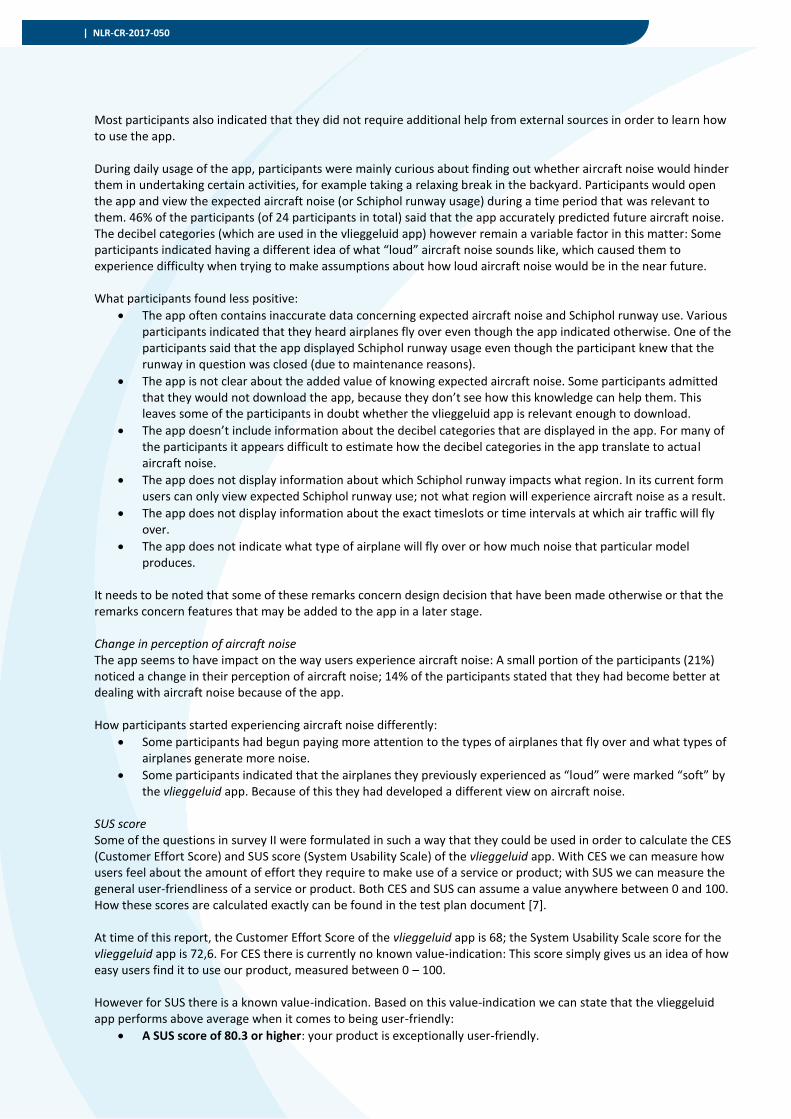
Most participants also indicated that they did not require additional help from external sources in order to learn how to use the app. During daily usage of the app, participants were mainly curious about finding out whether aircraft noise would hinder them in undertaking certain activities, for example taking a relaxing break in the backyard. Participants would open the app and view the expected aircraft noise (or Schiphol runway usage) during a time period that was relevant to them. 46% of the participants (of 24 participants in total) said that the app accurately predicted future aircraft noise. The decibel categories (which are used in the vlieggeluid app) however remain a variable factor in this matter: Some participants indicated having a different idea of what “loud” aircraft noise sounds like, which caused them to experience difficulty when trying to make assumptions about how loud aircraft noise would be in the near future. What participants found less positive:
The app often contains inaccurate data concerning expected aircraft noise and Schiphol runway use. Various participants indicated that they heard airplanes fly over even though the app indicated otherwise. One of the participants said that the app displayed Schiphol runway usage even though the participant knew that the runway in question was closed (due to maintenance reasons).
The app is not clear about the added value of knowing expected aircraft noise. Some participants admitted that they would not download the app, because they don’t see how this knowledge can help them. This leaves some of the participants in doubt whether the vlieggeluid app is relevant enough to download.
The app doesn’t include information about the decibel categories that are displayed in the app. For many of the participants it appears difficult to estimate how the decibel categories in the app translate to actual aircraft noise.
The app does not display information about which Schiphol runway impacts what region. In its current form users can only view expected Schiphol runway use; not what region will experience aircraft noise as a result.
The app does not display information about the exact timeslots or time intervals at which air traffic will fly over.
The app does not indicate what type of airplane will fly over or how much noise that particular model produces.
It needs to be noted that some of these remarks concern design decision that have been made otherwise or that the remarks concern features that may be added to the app in a later stage. Change in perception of aircraft noise The app seems to have impact on the way users experience aircraft noise: A small portion of the participants (21%) noticed a change in their perception of aircraft noise; 14% of the participants stated that they had become better at dealing with aircraft noise because of the app. How participants started experiencing aircraft noise differently:
Some participants had begun paying more attention to the types of airplanes that fly over and what types of airplanes generate more noise.
Some participants indicated that the airplanes they previously experienced as “loud” were marked “soft” by the vlieggeluid app. Because of this they had developed a different view on aircraft noise.
SUS score Some of the questions in survey II were formulated in such a way that they could be used in order to calculate the CES (Customer Effort Score) and SUS score (System Usability Scale) of the vlieggeluid app. With CES we can measure how users feel about the amount of effort they require to make use of a service or product; with SUS we can measure the general user-friendliness of a service or product. Both CES and SUS can assume a value anywhere between 0 and 100. How these scores are calculated exactly can be found in the test plan document [7]. At time of this report, the Customer Effort Score of the vlieggeluid app is 68; the System Usability Scale score for the vlieggeluid app is 72,6. For CES there is currently no known value-indication: This score simply gives us an idea of how easy users find it to use our product, measured between 0 – 100. However for SUS there is a known value-indication. Based on this value-indication we can state that the vlieggeluid app performs above average when it comes to being user-friendly:
A SUS score of 80.3 or higher: your product is exceptionally user-friendly.

30
A SUS score of 68: your product is average user-friendly.
A SUS score of 51 or lower: your product is not very user-friendly. From this score, we can conclude the user friendliness of the app is at the right level.

| NLR-CR-2017-050
7 Conclusions
NLR, M2Mobi and KNMI provided a prototype app, vlieggeluid, for a 24-hour forecast of noise around Amsterdam Airport Schiphol. The team considers the app beneficial and an extension to the current information systems around the airport. The app gives useful pro-active information, is easy to use and provides a modern look. The main conclusions of the prototype development as described in this document are summarised below. 1. A noise forecast is possible Aim of the project has been to provide a prototype app with 24-hour live noise information in a 70x70 km. area around the airport of Schiphol. The project has proven this to be possible through the development of a noise forecasting engine and the development of the app itself. Both the engine and the app show sufficient quality and provide a sufficient positive feedback from end users to consider the possibility of a noise forecast as feasible in the way proposed. The noise forecasting is based on runway forecasting, route forecasting, traffic forecasting and weather forecasting. Although all of these elements bring uncertainty in the forecasted noise, the presentation as chosen provides information to ensure the noise forecasting is of sufficient quality. 2. Expectations from the noise forecast The app takes away uncertainty on overflying aircraft by anticipating aircraft noise. By using the app, an estimation on expected noise on any location around the airport can be made thus marking a new proactive form of information provision form the airport. The project team expects that the app will result in a reduced number of questions to the Bewonersaanspreekpunt Schiphol (BAS). The pro-active information that the app provides is a fundamentally new way of presenting information that must be further explored with respect to the more traditional reactive kind of information provision. 3. Noise presentation The presentation of forecasted noise is based on “number above” or NAx. The noise is provided in three categories so that the end user can make its own assessment on whether the forecast will be more or less disturbing. The presentation also gives a graphical format that can be used to compare the forecasted noise to the current noise level (as from the actual runway use and traffic). After the first evaluation where many respondents reported they missed information on runway use, a runway forecast has been added. Together, these presentations provide information on any chosen location within an area of 70 x 70 km. around the airport of Schiphol. The information together also makes the app sufficiently interesting to use (after a first evaluation, where no runway forecast was presented, the app was considered too simple and possibly even dull). 4. The app is easy to use The app has been developed in such a way that it is considered as “straightforward” in its use by the respondents from the evaluation. The interface is clear and feels consistent and the end users reported to navigate easily to retrieve the information they needed. 5. Added value of the app Respondents from the evaluation considered the added value of the app sometimes limited. They were uncertain how to use the information that was provided and how it could help them in taking actions now and in the next 24 hours. Respondents reported that the noise they experienced did not comply to what the app predicted. Some of the respondents had doubts about the relevance of the app and reported they would probably not download it. 6. NAx categories may be unclear The prototype app provides its information in dB(A) categories, corresponding to categories “low noise”, “medium noise” and “high noise” levels( 55 to 65dB(A), 65 to 75 dB(A) and 77+ dB(A) respectively). Respondents reported they could not directly translate these levels to what they would experience as disturbing in practice.

32
7. Need for more detailed information Respondents reported the need for more information and more detailed information on the noise forecasts. For example, they expressed the wish for a complete overlay of noise information for their region (a noise map presentation such as usually made for yearly noise levels) or more detailed information on the individual aircraft they could expect. Most of the information is available in the engine as result from the calculations but not (yet) presented. The information is either not consisted with the choice to present the information based on the location of the end user (the noise map) or provides a level of detail that will probably not be able to match the quality of the required forecast (individual traffic). The remarks considering the wish for more information will probably depend on the experience of the end user with noise around the airport. The fact that they request more information does show that the app has a potential added value to the end users. Final conclusion From the evaluation, it follows that the app is easy to use. It leads to a more positive noise experience at Schiphol with 21% of the respondents. Attention needs to be paid to the fact that about half of the respondents reported that the forecasted noise did not sufficiently match their experience. A prototype app is available, implemented in iOS for the iPhone. Several locations can be chosen for a presentation of the 24-hour noise forecast. At intervals of one hour, the noise development can be observed. After the first evaluation, a 24-hour runway forecast has been added; respondents reported they would know the expected noise as soon as they would know the expected runway in use. The current prototype app provides the possibility to further examine the use of pro-active information towards communities, which should lead to a smaller number of aircraft related complaints.

| NLR-CR-2017-050
8 References
[1] RIVM 2002 – Gezondheid en beleving van de omgevingskwaliteit in de regio Schiphol
[2] Aldersakkoord, brief aan minister van V&W, 1 oktober 2008
[3] J. M. Nibourg, H. H. Hesselink and Y. A. J. R. van de Vijver, “Environment-aware runway allocation advice system,” in 26th International congress of the aeronautical sciences, ICAS, Anchorage, Alaska, USA, 14-19 September 2008, NLR-TP-2008-506
[4] H. Hesselink and J. Nibourg, “Probabilistic 2-Day Forecast of Runway Use,” in Ninth USA/Europe Air Traffic Management Research and Development Seminar, ATM2011, Berlin, 14-17 June 2011, NLR-TP-2011-287
[5] H. H. Hesselink, J. M. Nibourg, L. d'Estampes and P. Lezaud, “Airport Capacity Forecast - Short-term Forecasting of Runway Capacity,” in Fourth SESAR Innovation Days, Madrid, 25-27 November 2014
[6] Minister Bellot tevreden met aankoop technische ondersteuning door Belgocontrol, http://bellot.belgium.be/nl/minister-bellot-tevreden-met-aankoop-technische-ondersteuning-door-belgocontrol
[7] Vlieggeluid gebruikerstest februari 2017
34
Appendix A All comparisons SNP vs. FANOMOS
3 March 2017
| NLR-CR-2017-050
4 March 2017

36
5 March 2017
| NLR-CR-2017-050
6 March 2017

38
8 March 2017
| NLR-CR-2017-050
9 March 2017
40
10 March 2017

| NLR-CR-2017-050
Appendix B Result from the app evaluation

42

| NLR-CR-2017-050

44


