38
1 SCHOOL DISTRICT OF CHETEK ANNUAL MEETING & BUDGET HEARING SEPT. 22, 2008
1
SCHOOL DISTRICT OF CHETEK
ANNUAL MEETING & BUDGET HEARINGSEPT. 22, 2008
2
INTRODUCTION TO SCHOOL DISTRICT
BUDGETING
“A school district is represented by its budget. What is included in the budget sets the tone for future years. The school budget must be based on a clearly defined educational plan designed to meet the needs of children in the district” (WASB, Annual School District Meeting, 2008).

3
MISSION
Chetek graduates are responsible, caring, productive and healthy citizens with the knowledge and skills to achieve their dreams.
4
Budget Development Assumptions or Limitations
Balanced expenditures and anticipated revenuesBudget development using multi-year projections and anticipated changes
EnrollmentsState budget and state participationGrants and federal programsNew laws and legal requirementsLevy to the state minimum of $9,000 per student
5
Goals Incorporated in the Development of the Budget
Educational goals:Students shall read at grade level by third grade.Life skills will be taught in the curriculum.Build the skills necessary for students to become productive workers, fair-minded citizens and life long learners.Math Curriculum is a primary focus.
6
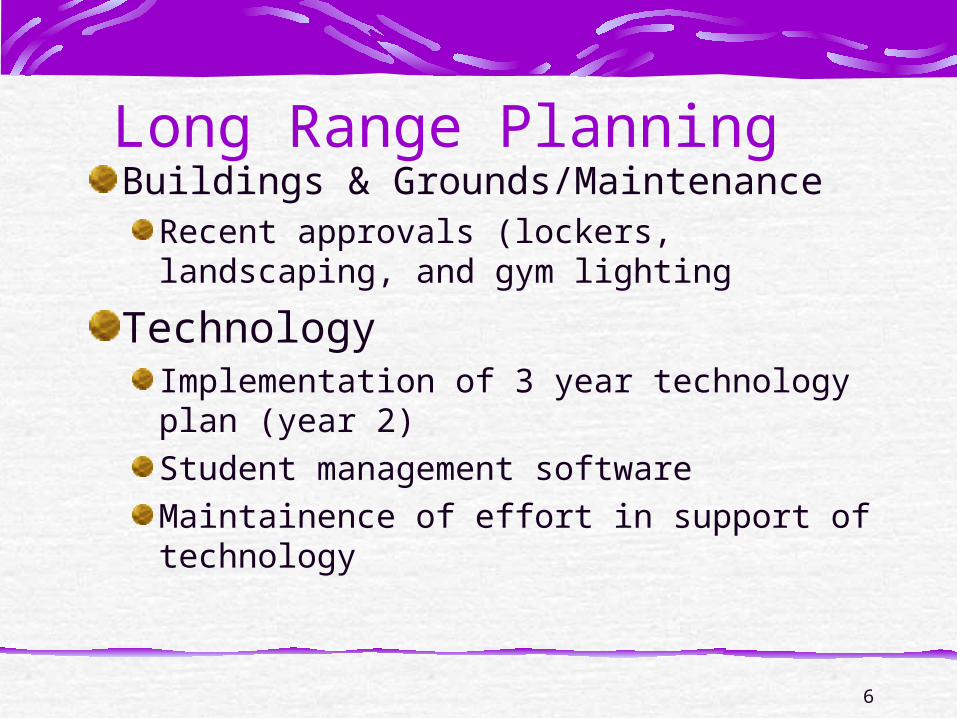
Long Range Planning Buildings & Grounds/Maintenance
Recent approvals (lockers, landscaping, and gym lighting
TechnologyImplementation of 3 year technology plan (year 2)Student management softwareMaintainence of effort in support of technology
7
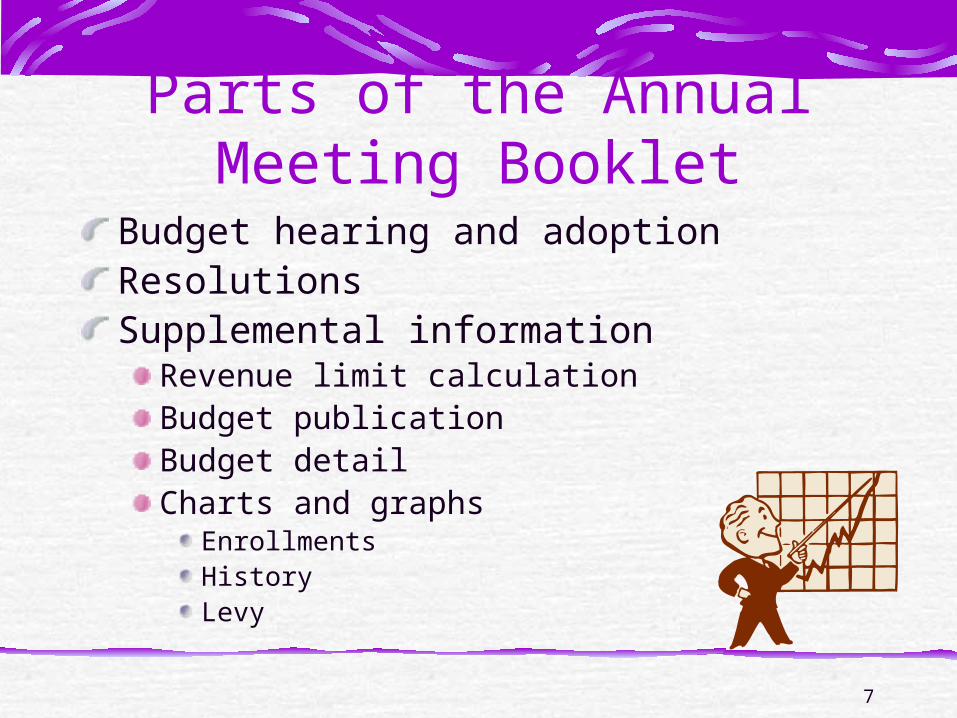
Parts of the Annual Meeting Booklet
Budget hearing and adoptionResolutionsSupplemental information
Revenue limit calculationBudget publicationBudget detailCharts and graphs
EnrollmentsHistoryLevy
8
School District of Chetek
2008-09 Budget
9
General Fund

10
Revenue
Local Sources 50% 2007-08 2008-09
Taxes $ 4,626,435 $4,915,244Non-Capital Sales 5,313 4,000School Activity Income 26,159 23,500Interest on Investments 51,957 60,400Other Revenue 33,122 18,550
Total Local Sources $4,742,986 $5,021,694

11
Revenue Intermediate/Other Sources(Less than 2%) 2007-08 2008-09
Transit of Aids (Grants) $ 11,038 $ 6,923 Open Enrollment 54,867 87,468Medical Services Reimb. 38,713 30,675Refund of Disbursement 25,491 18,170Other Revenue 1,499 0
Total Other Sources $131,608 $143,236
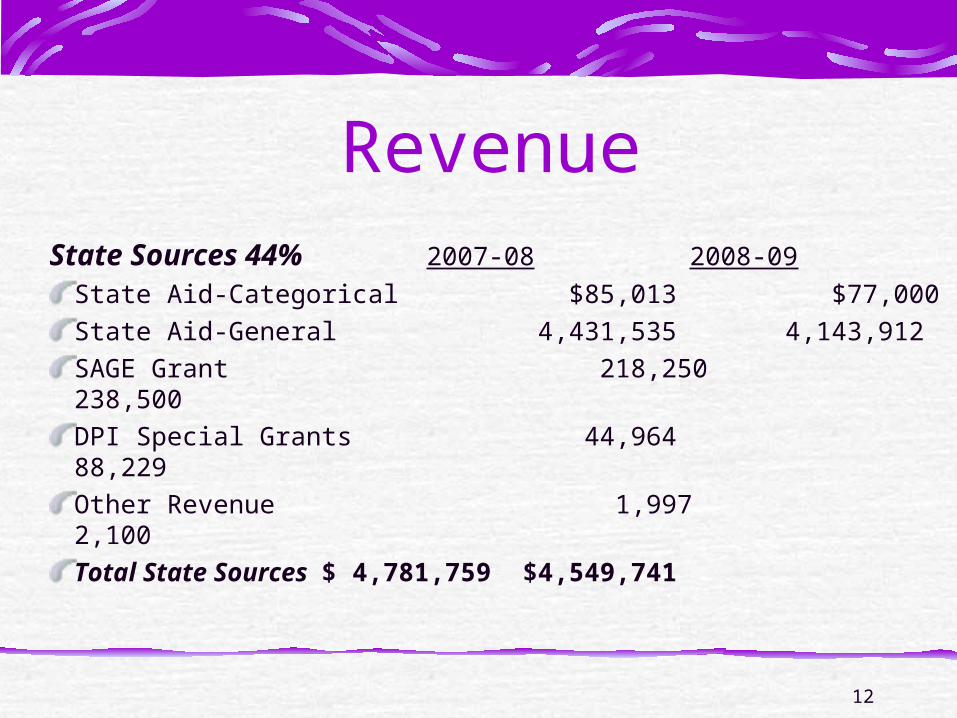
12
RevenueState Sources 44% 2007-08 2008-09
State Aid-Categorical $85,013 $77,000State Aid-General 4,431,535 4,143,912SAGE Grant 218,250 238,500DPI Special Grants 44,964 88,229Other Revenue 1,997 2,100Total State Sources $ 4,781,759 $4,549,741
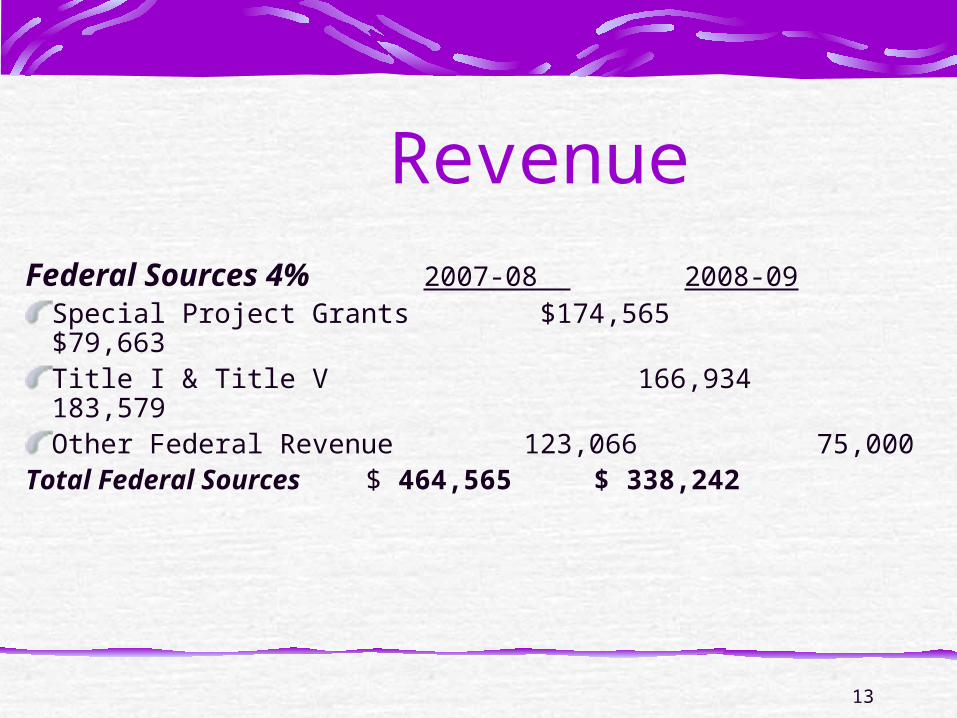
13
Revenue
Federal Sources 4% 2007-08 2008-09Special Project Grants $174,565 $79,663Title I & Title V 166,934 183,579Other Federal Revenue 123,066 75,000
Total Federal Sources $ 464,565 $ 338,242

14
Total Revenues2007-08 $ 10,120,9172008-09 $ 10,052,913
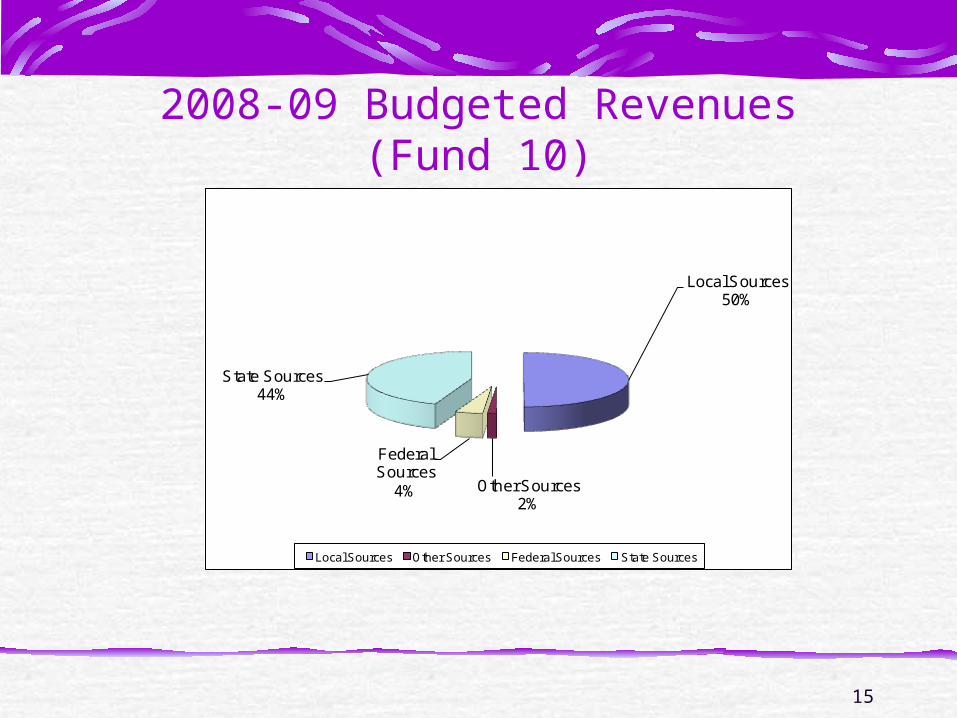
15
2008-09 Budgeted Revenues(Fund 10)
Local Sources50%
Other Sources2%
Federal Sources
4%
State Sources44%
Local Sources Other Sources Federal Sources State Sources
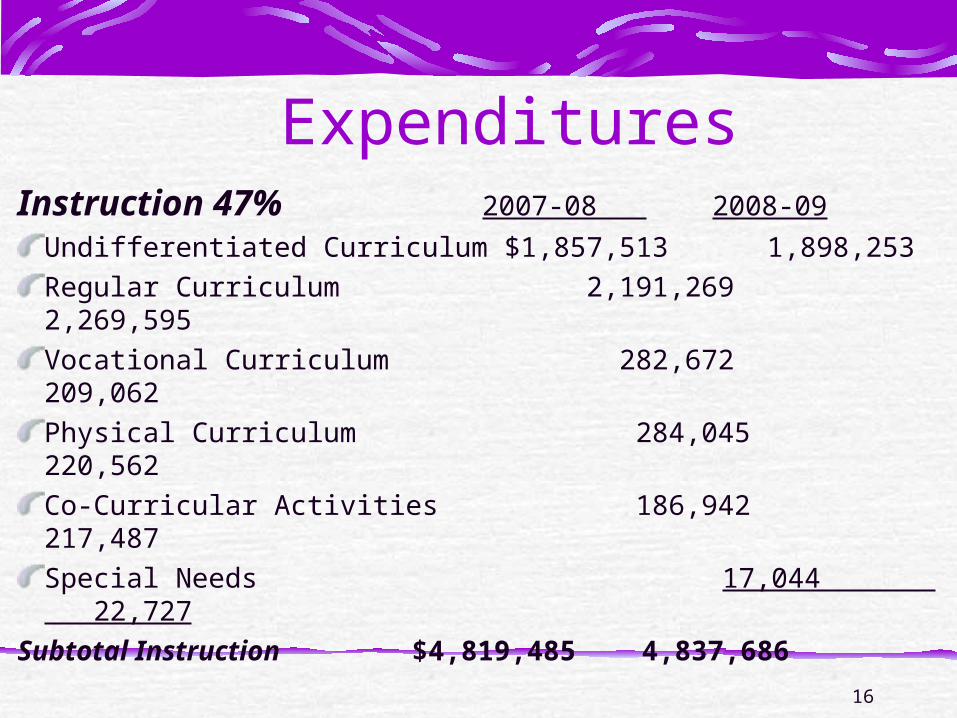
16
Expenditures Instruction 47% 2007-08 2008-09
Undifferentiated Curriculum $1,857,513 1,898,253Regular Curriculum 2,191,269 2,269,595Vocational Curriculum 282,672 209,062Physical Curriculum 284,045 220,562Co-Curricular Activities 186,942 217,487Special Needs 17,044 22,727
Subtotal Instruction $4,819,485 4,837,686
17
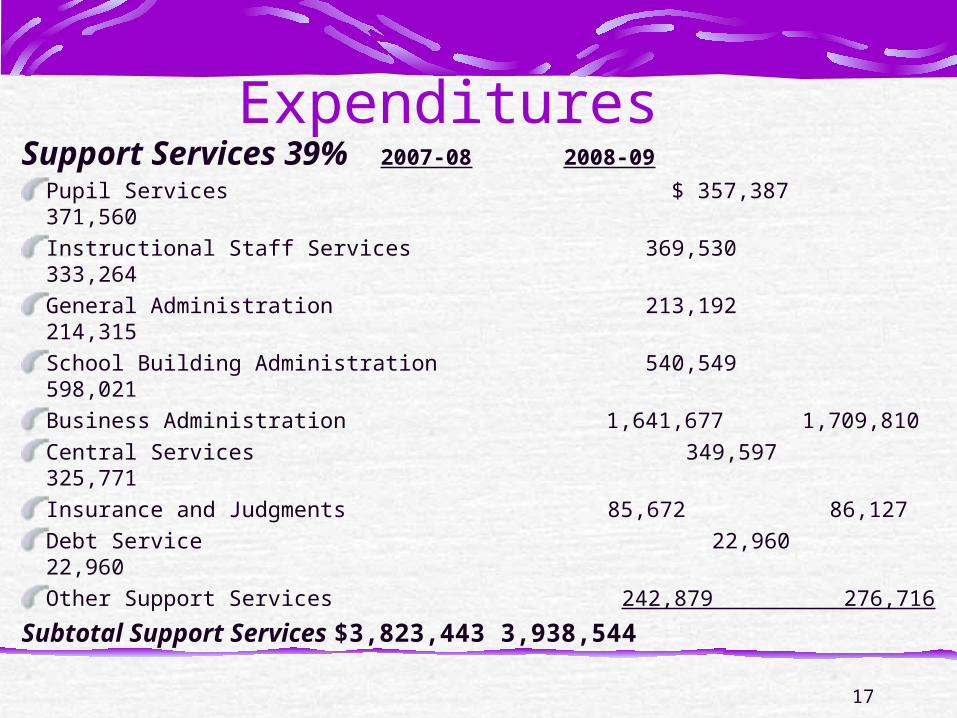
Expenditures
Support Services 39% 2007-08 2008-09
Pupil Services $ 357,387 371,560Instructional Staff Services 369,530 333,264 General Administration 213,192 214,315School Building Administration 540,549 598,021Business Administration 1,641,677 1,709,810 Central Services 349,597 325,771Insurance and Judgments 85,672 86,127Debt Service 22,960 22,960Other Support Services 242,879 276,716
Subtotal Support Services $3,823,443 3,938,544
18
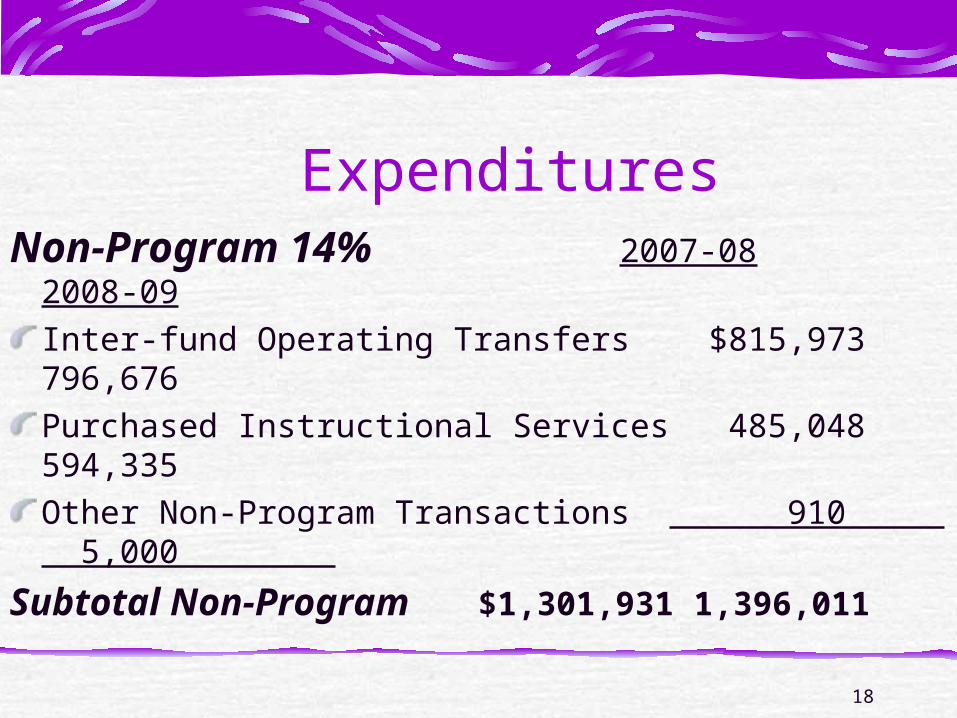
ExpendituresNon-Program 14% 2007-08 2008-09
Inter-fund Operating Transfers $815,973 796,676Purchased Instructional Services 485,048 594,335Other Non-Program Transactions 910 5,000
Subtotal Non-Program $1,301,931 1,396,011
19
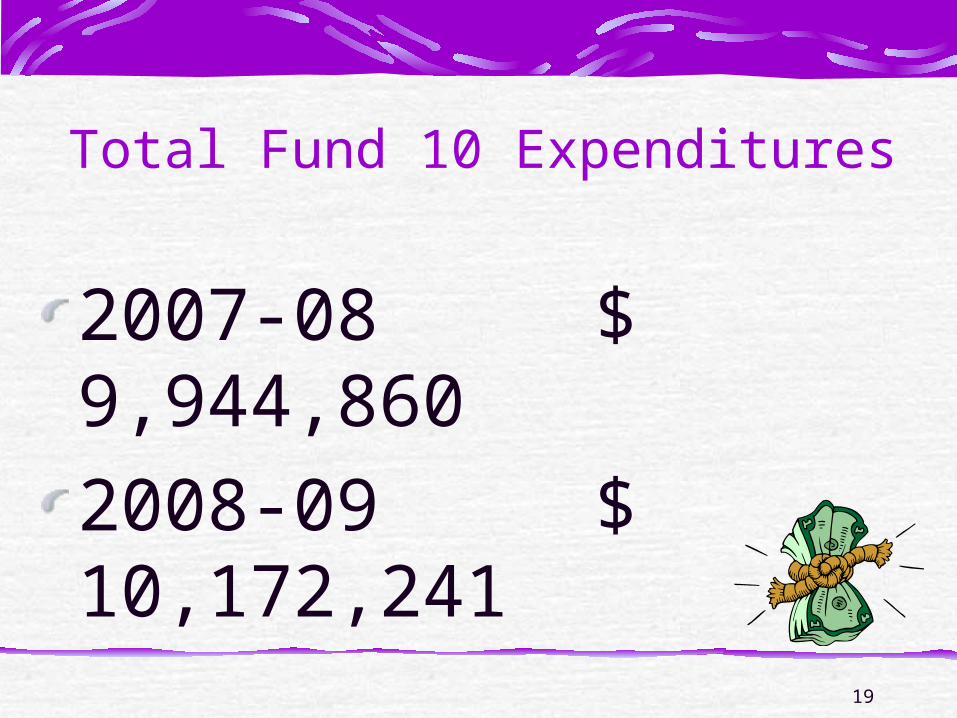
Total Fund 10 Expenditures
2007-08 $ 9,944,8602008-09 $ 10,172,241

20
2008-09 Budgeted Expenses(Fund 10)
Instructional47%
Support39%
Non-Program14%
Instructional Support Non-Program

21
SPECIAL EDUCATION FUND
Revenues 2007-08 2008-09Operating Transfers In $ 815,973 796,676Interdistrict Payments 939 0.00State Aid Through CESA 25,723 12,840Federal Aid (Grants) 165,991 175,365Handicapped Aid 283,838 262,600
Total Revenues $1,295,465 1,247,481
22
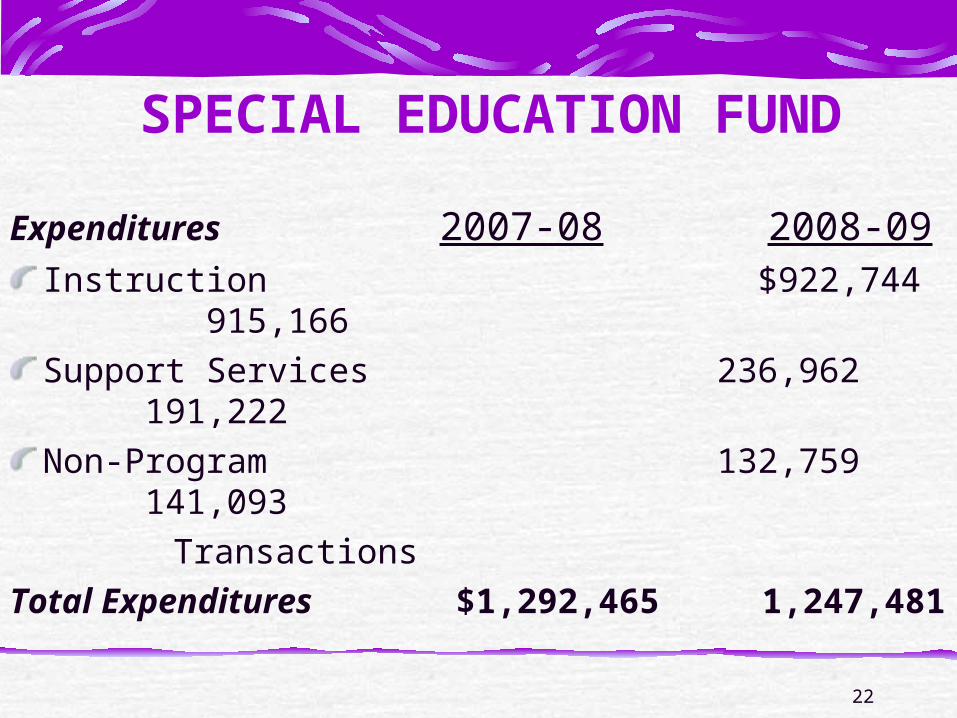
SPECIAL EDUCATION FUND
Expenditures 2007-08 2008-09Instruction $922,744 915,166Support Services 236,962 191,222Non-Program 132,759 141,093
Transactions Total Expenditures $1,292,465
1,247,481

23
DEBT SERVICE FUND
Revenues Expenditures
2007-08 $ 1,049,556 $1,060,150
2008-09 1,053,692 $1,066,005
24
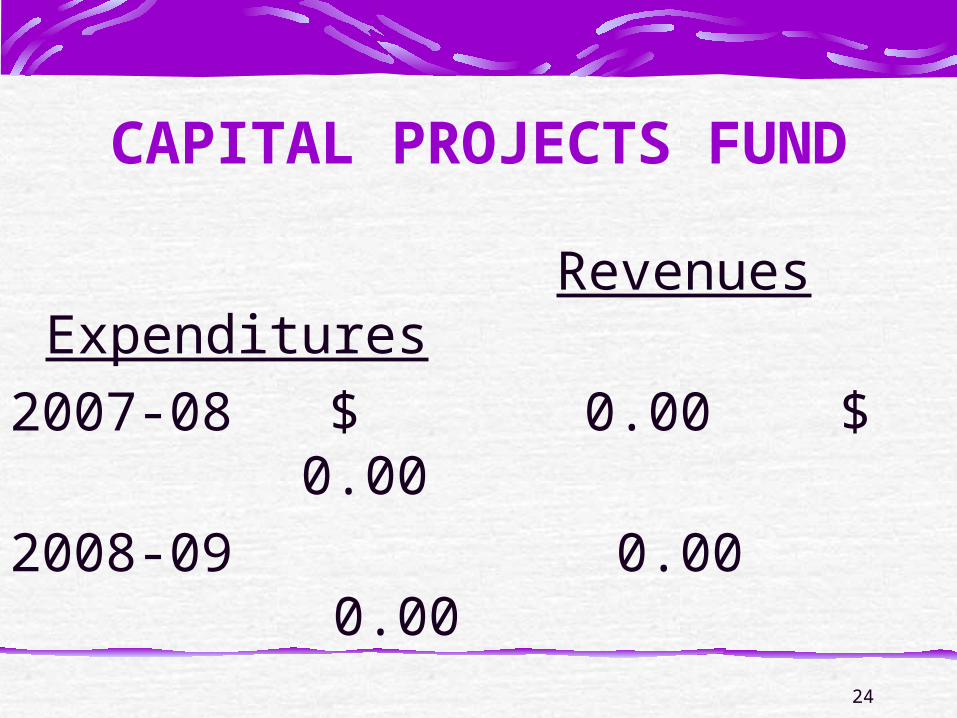
CAPITAL PROJECTS FUND
Revenues Expenditures
2007-08 $ 0.00 $ 0.00
2008-09 0.00 0.00

25
FOOD SERVICE FUND
Revenues Expenditures
2007-08 $ 387,278 $ 381,877
2008-09 378,099 383,500
26
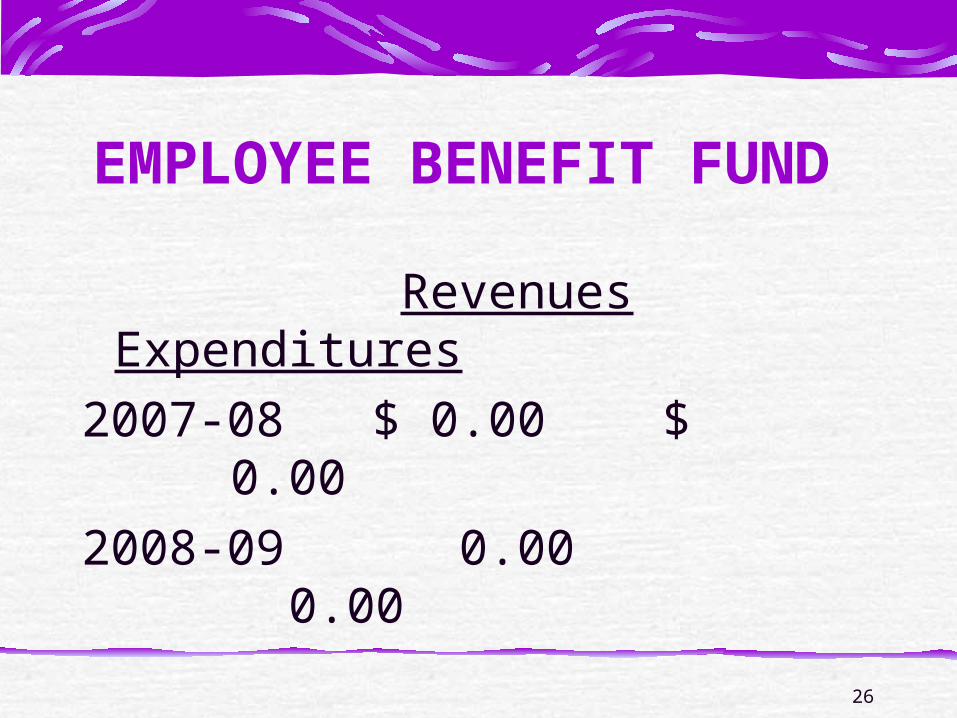
EMPLOYEE BENEFIT FUND
Revenues Expenditures
2007-08 $ 0.00 $ 0.00
2008-09 0.00 0.00
27
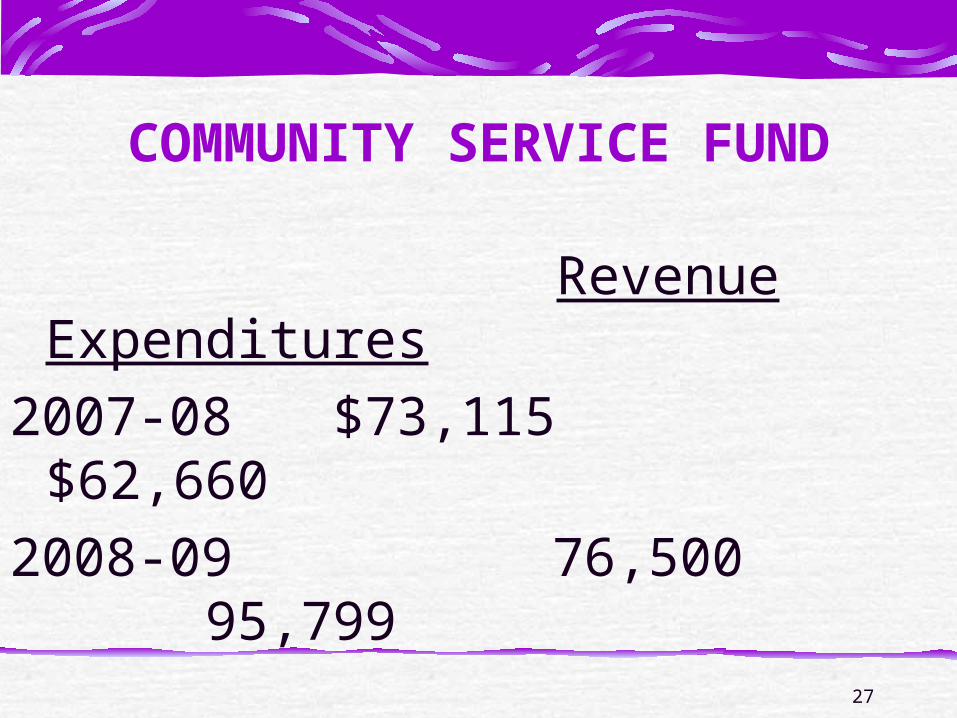
COMMUNITY SERVICE FUND
Revenue Expenditures
2007-08 $73,115 $62,6602008-09 76,500
95,799
28
Factors Impacting Revenue Limit
Levy amount is set by State StatuteFormula
Number of students$ increase set by StatuteEqualization Aid

29
Levy Increase
Loss of State Aid2006-07 49%2007-08 48%2008-09 44%
Property Value per ChildBasis for aid formulaDeclining EnrollmentIncreased Property Values
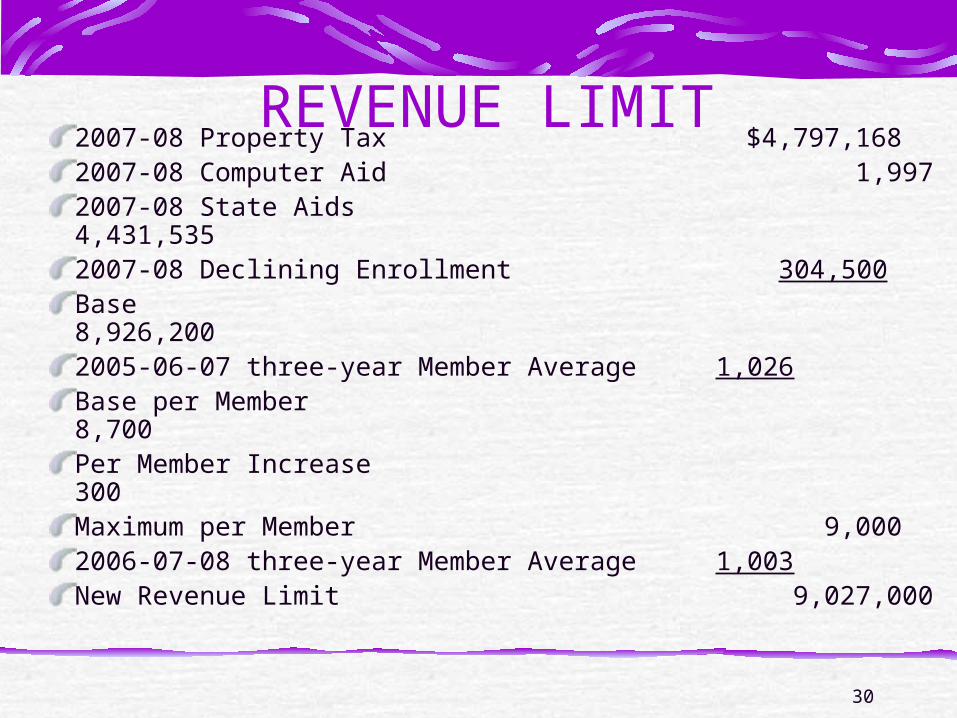
30
REVENUE LIMIT2007-08 Property Tax $4,797,1682007-08 Computer Aid 1,9972007-08 State Aids 4,431,5352007-08 Declining Enrollment 304,500Base 8,926,2002005-06-07 three-year Member Average 1,026Base per Member 8,700Per Member Increase 300Maximum per Member 9,0002006-07-08 three-year Member Average 1,003New Revenue Limit 9,027,000
31
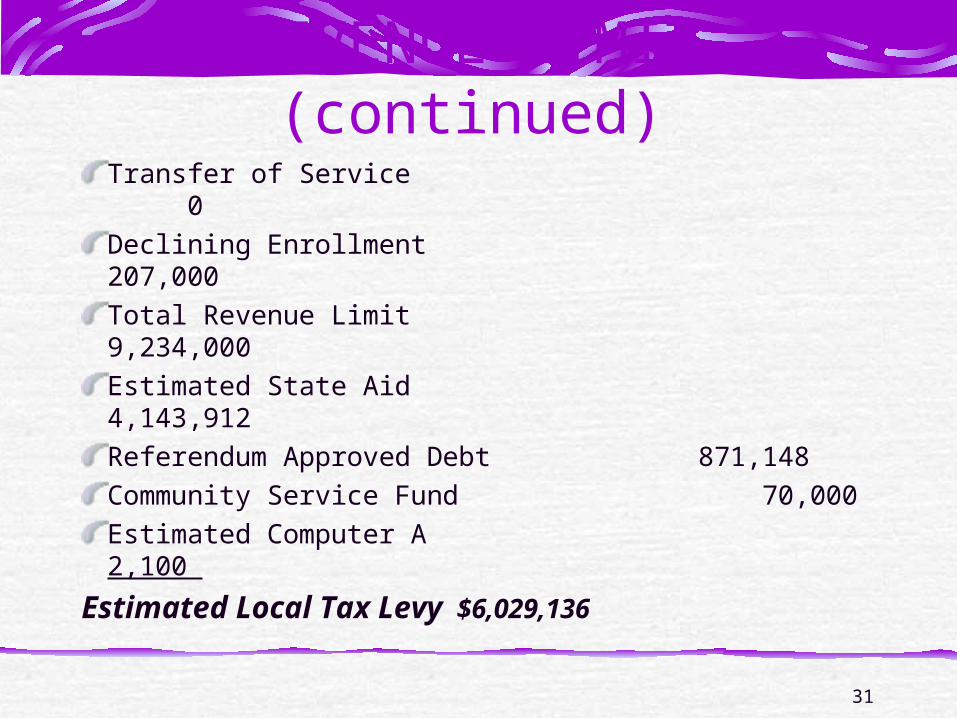
REVENUE LIMIT (continued)
Transfer of Service 0Declining Enrollment 207,000Total Revenue Limit 9,234,000Estimated State Aid 4,143,912Referendum Approved Debt 871,148Community Service Fund 70,000Estimated Computer A 2,100
Estimated Local Tax Levy $6,029,136

32
Present & Future Local Factors
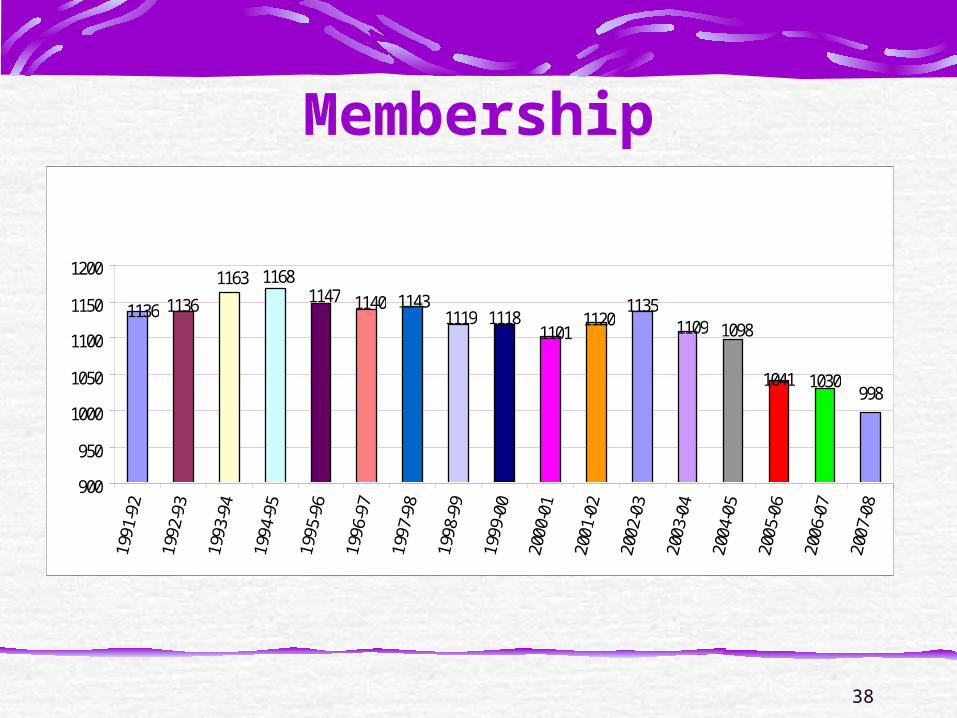
Impacting Future BudgetsDeclining Enrollment (MEMBERSHIP)
2006-2007 10302007-2008 9952008-2009 972
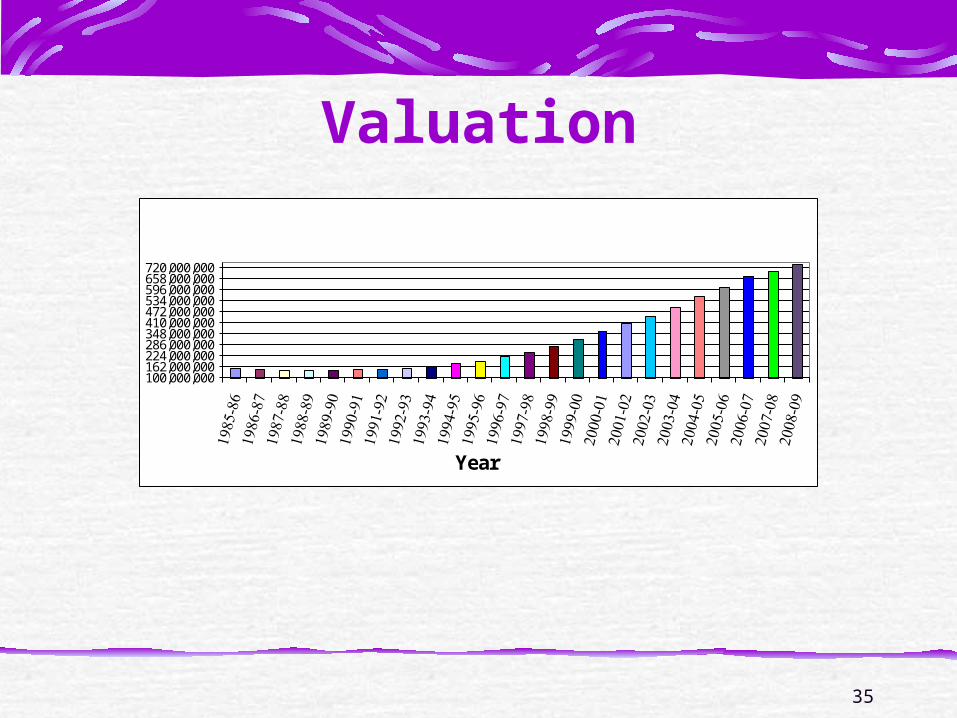
Equalized Property Valuation2006-2007 $667,618,7952007-2008 $698,795,3952008-2009 $740,795,395
33
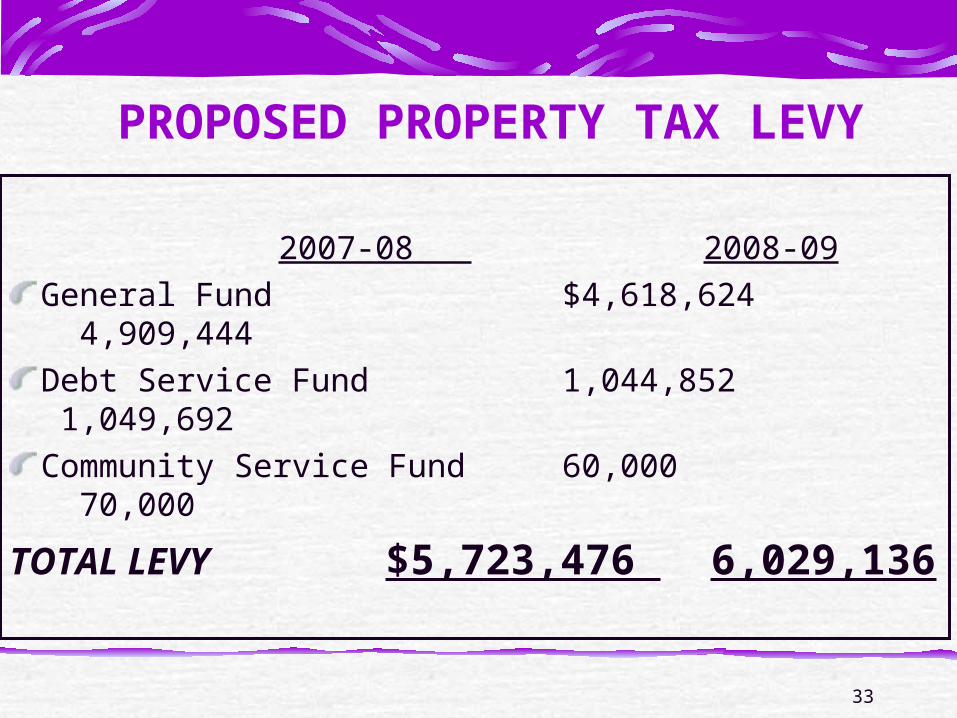
PROPOSED PROPERTY TAX LEVY
2007-08 2008-09General Fund $4,618,624 4,909,444Debt Service Fund 1,044,852 1,049,692 Community Service Fund 60,000 70,000
TOTAL LEVY $5,723,476 6,029,136
34
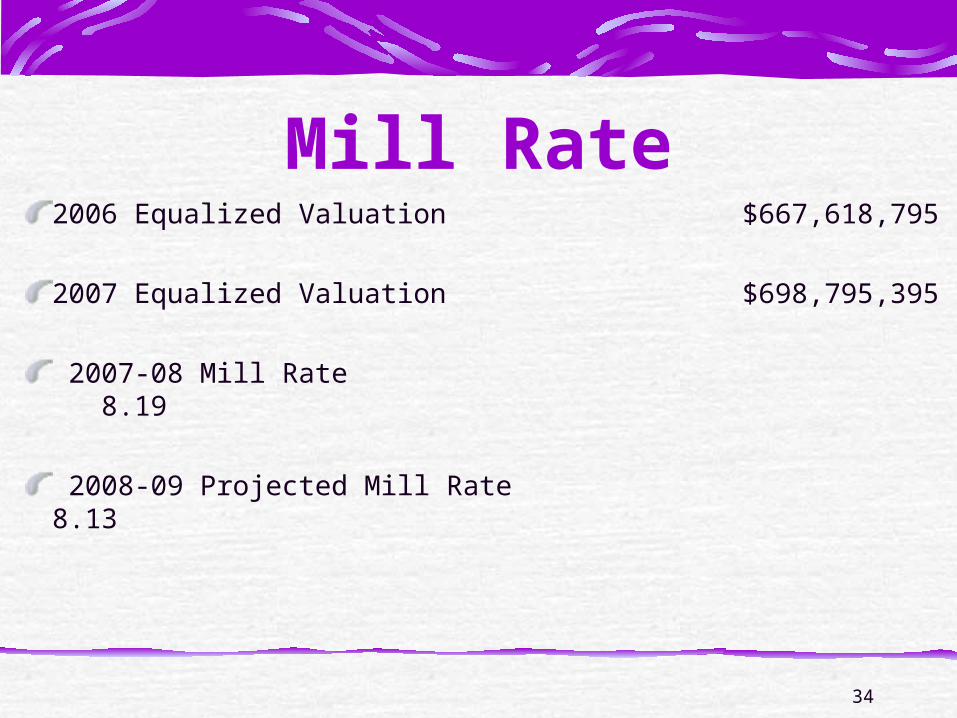
Mill Rate2006 Equalized Valuation $667,618,795
2007 Equalized Valuation $698,795,395
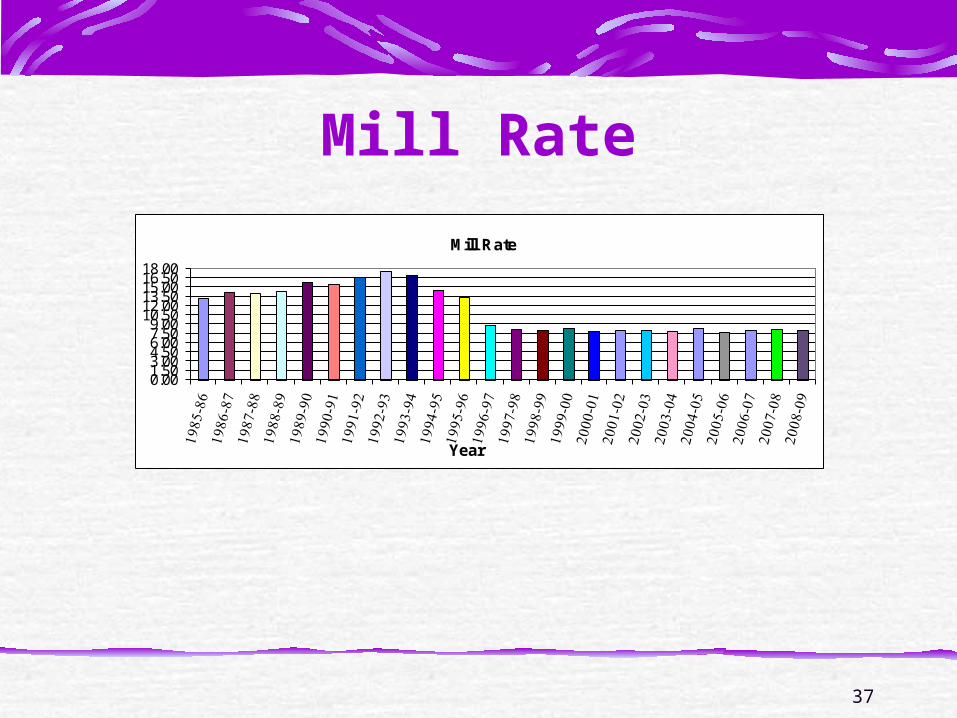
2007-08 Mill Rate 8.19
2008-09 Projected Mill Rate 8.13
35
Valuation
100,000,000162,000,000224,000,000286,000,000348,000,000410,000,000472,000,000534,000,000596,000,000658,000,000720,000,000
Year

36
Tax Levy
1,000,0001,500,0002,000,0002,500,0003,000,0003,500,0004,000,0004,500,0005,000,0005,500,0006,000,000
Levy Year
37
Mill Rate
0.001.503.004.506.007.509.0010.5012.0013.5015.0016.5018.00
Year
Mill Rate
38
Membership
9981030
110911351136 1136
1163 11681147 1140 1143
1119 11181101
11201098
1041
900
950
1000
1050
1100
1150
1200


