www.azti.es 7/7/2015 1 Sea Level Rise: evidences, scenarios and local consequences Marine Research Division AZTI-Tecnalia Sukarrieta (Spain) Guillem Chust 13th- 15th of July (2015) Palacio Miramar - San Sebastián
Transcript
www.azti.es 7/7/2015 1
Sea Level Rise: evidences,
scenarios and local
consequences
Marine Research Division
AZTI-Tecnalia
Sukarrieta (Spain)
Guillem Chust
13th- 15th of July (2015) Palacio Miramar - San Sebastián
www.azti.es 7/7/2015
Index
Sea Level Rise
• Measurements and projections for the Bay of Biscay
• Impacts in the Basque coast (urban, beaches, habitats, species)
• Species distribution shifts
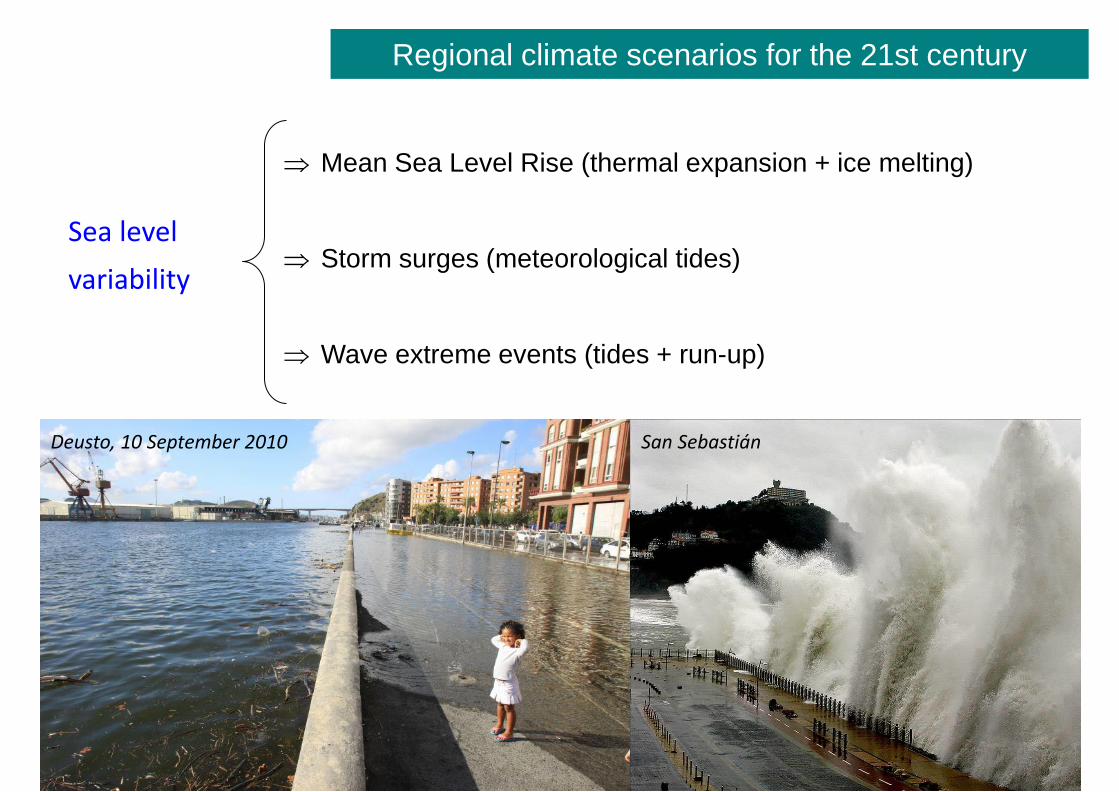
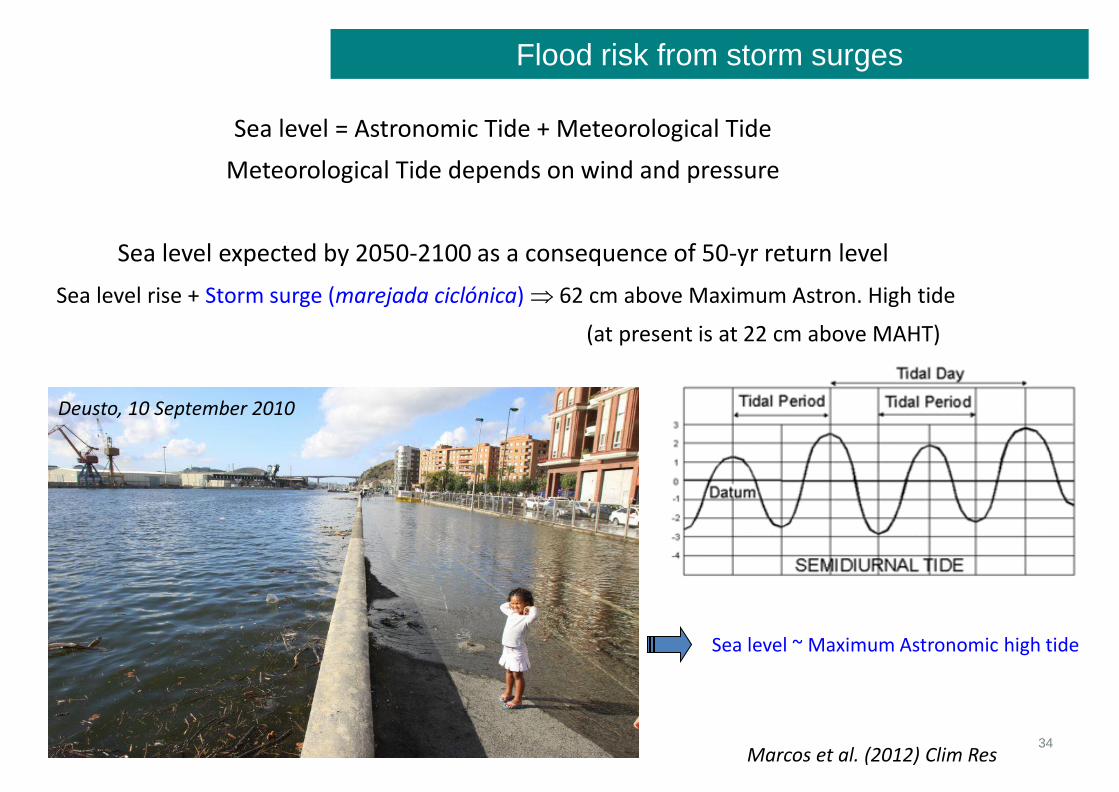
• Sea level variability (storm surges)
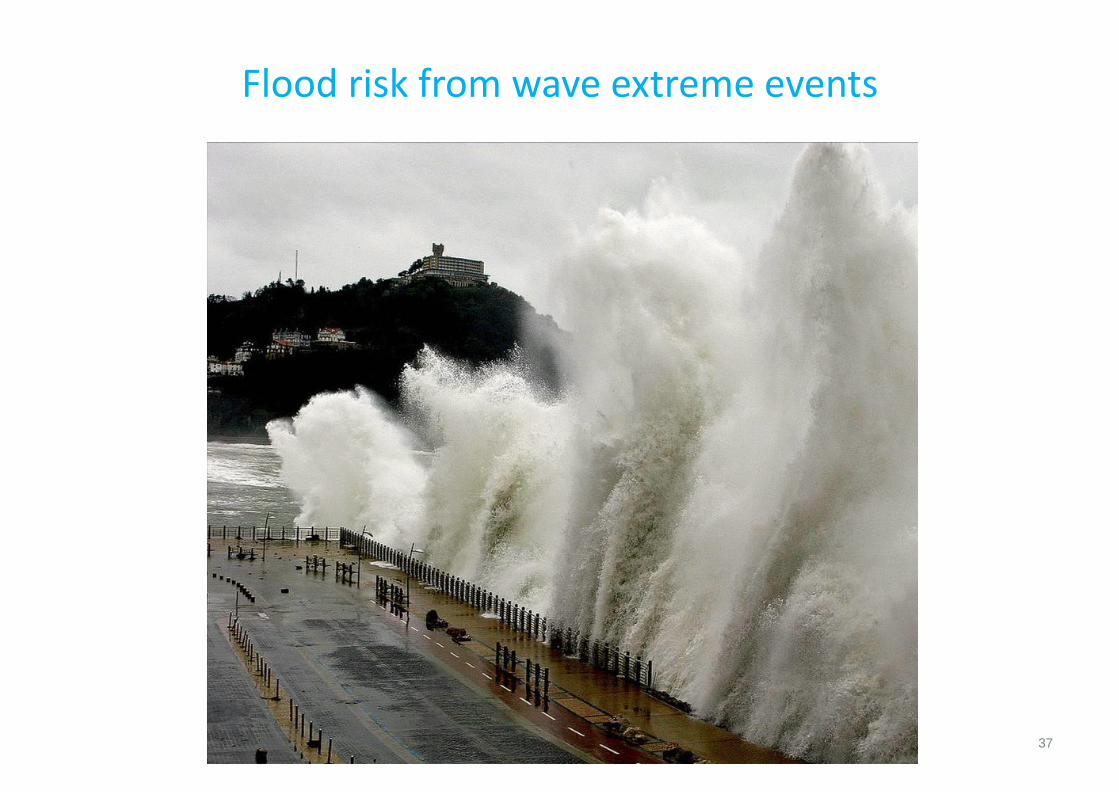
• Interaction with extreme waves
2
www.azti.es 7/7/2015 3
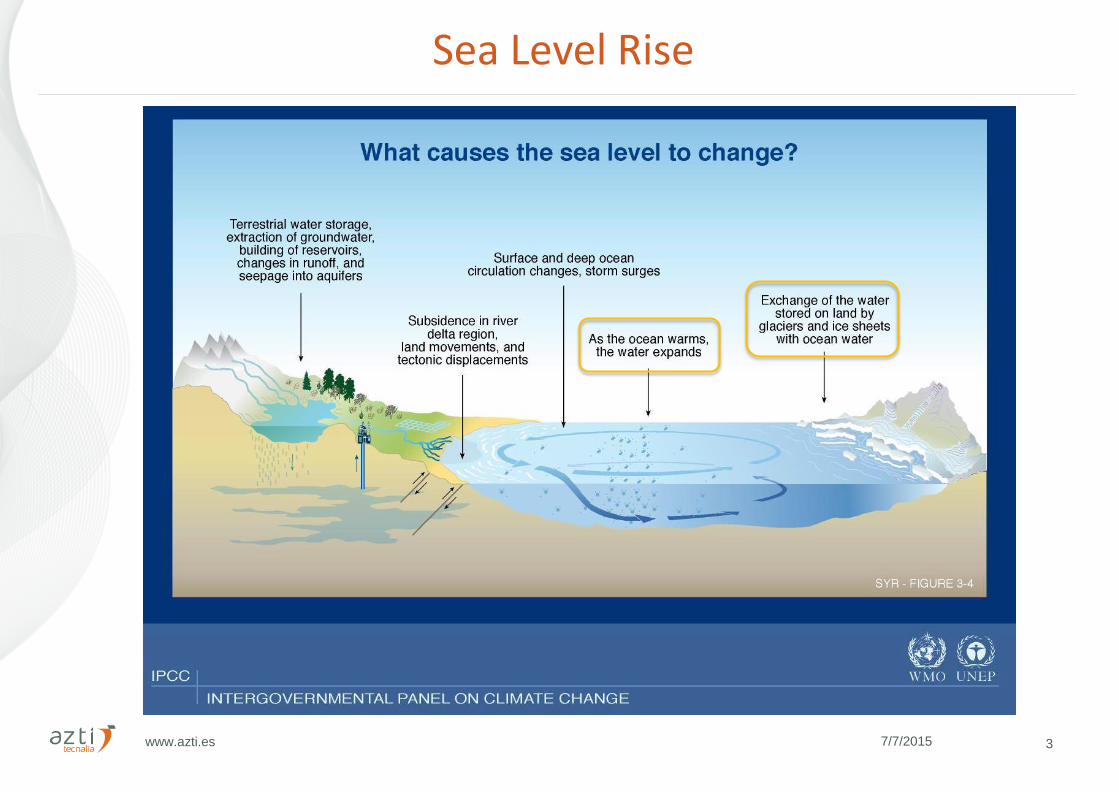
Sea Level Rise
4
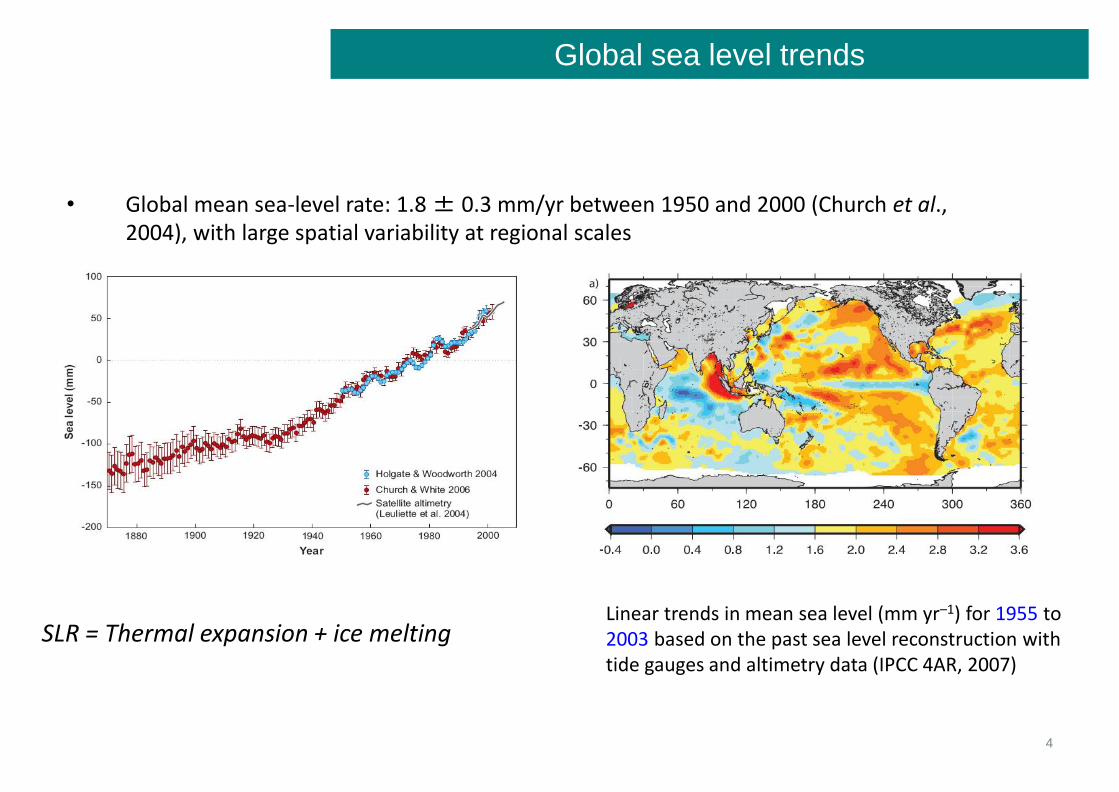
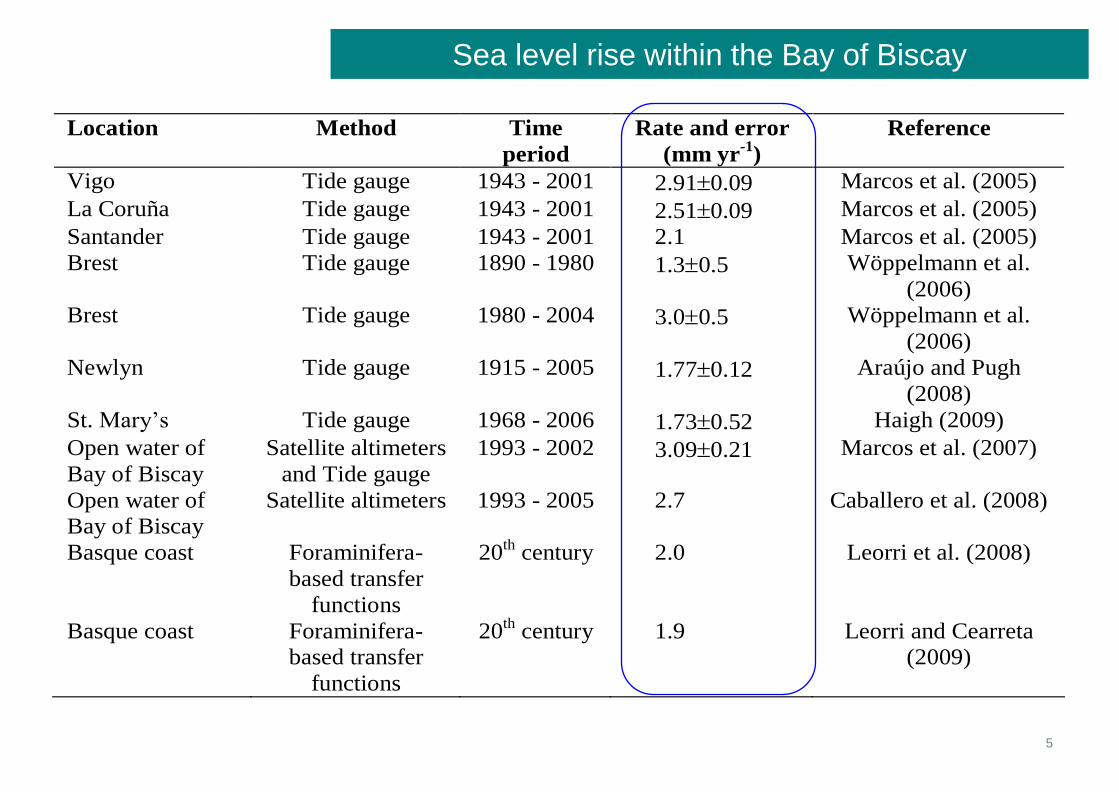
• Global mean sea-level rate: 1.8 ± 0.3 mm/yr between 1950 and 2000 (Church et al., 2004), with large spatial variability at regional scales
Linear trends in mean sea level (mm yr–1) for 1955 to 2003 based on the past sea level reconstruction with tide gauges and altimetry data (IPCC 4AR, 2007)
Chust et al. 2010. Estuarine, Coastal and Shelf Science 87:113-124
01
Hdp
gTSL
Projections for the thermosteric sea level rise
9
Year
1940 1960 1980 2000 2020 2040 2060 2080 2100
Sea level rise (
cm
)
-20
0
20
40
60
St. Jean de Luz
Santander
Bilbao
SRES A2 + MinMelt
SRES A1B + MaxMelt
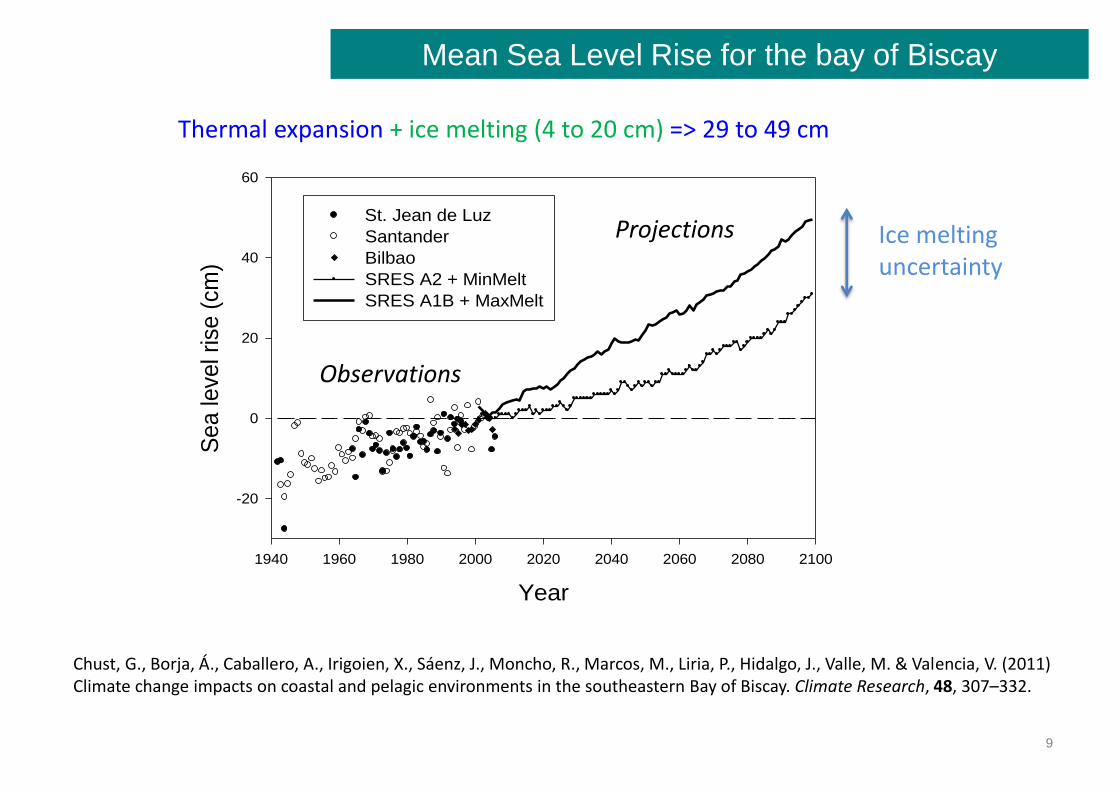
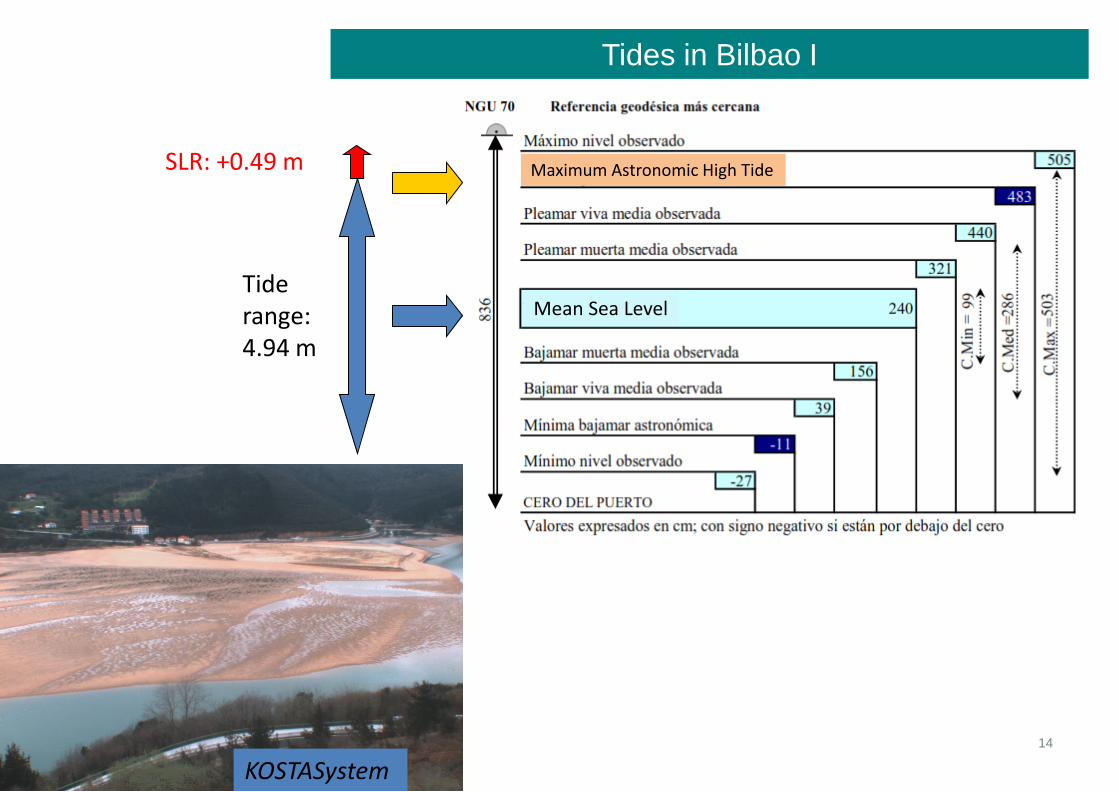
Thermal expansion + ice melting (4 to 20 cm) => 29 to 49 cm
Mean Sea Level Rise for the bay of Biscay
Observations
Projections Ice melting uncertainty
Chust, G., Borja, Á., Caballero, A., Irigoien, X., Sáenz, J., Moncho, R., Marcos, M., Liria, P., Hidalgo, J., Valle, M. & Valencia, V. (2011) Climate change impacts on coastal and pelagic environments in the southeastern Bay of Biscay. Climate Research, 48, 307–332.
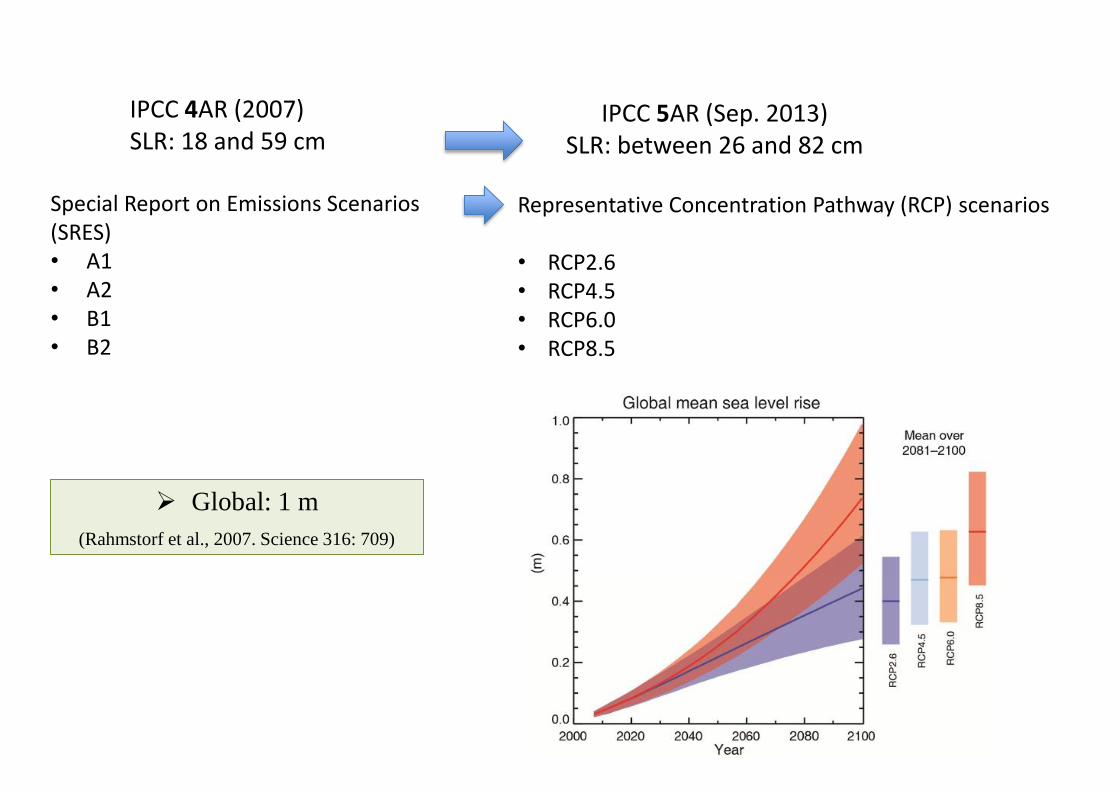
IPCC 5AR (Sep. 2013) SLR: between 26 and 82 cm
IPCC 4AR (2007) SLR: 18 and 59 cm
Special Report on Emissions Scenarios (SRES) • A1 • A2 • B1 • B2
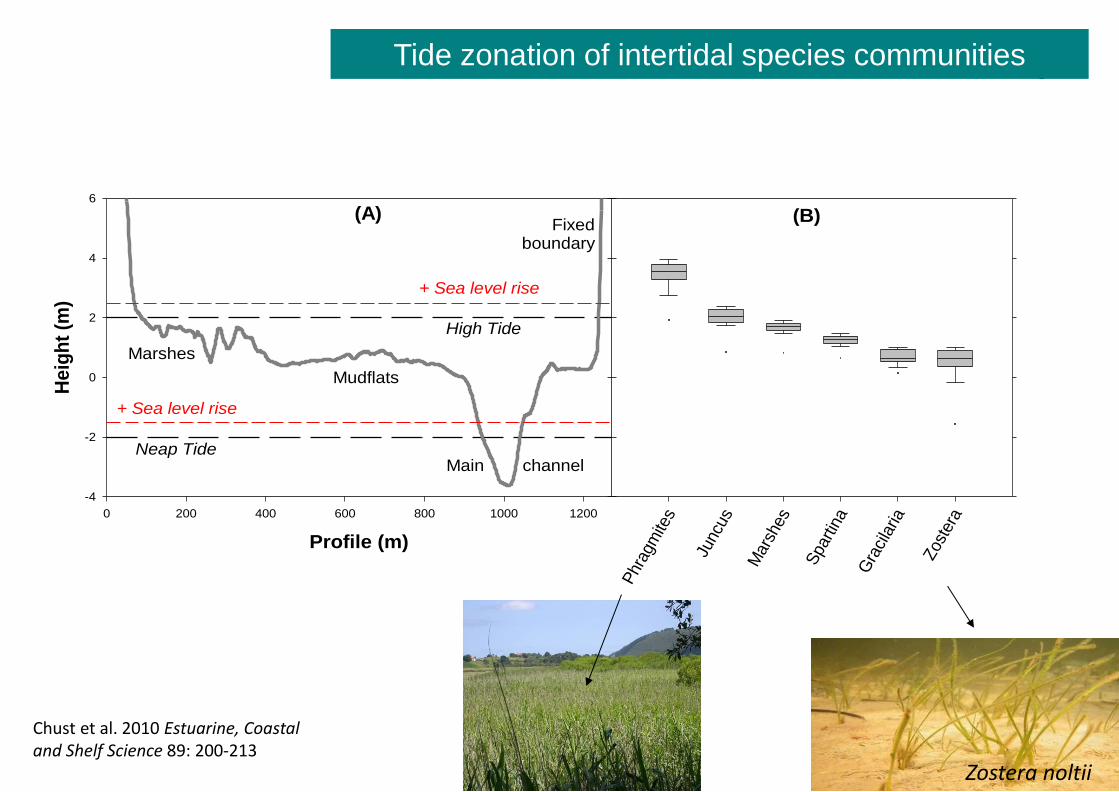
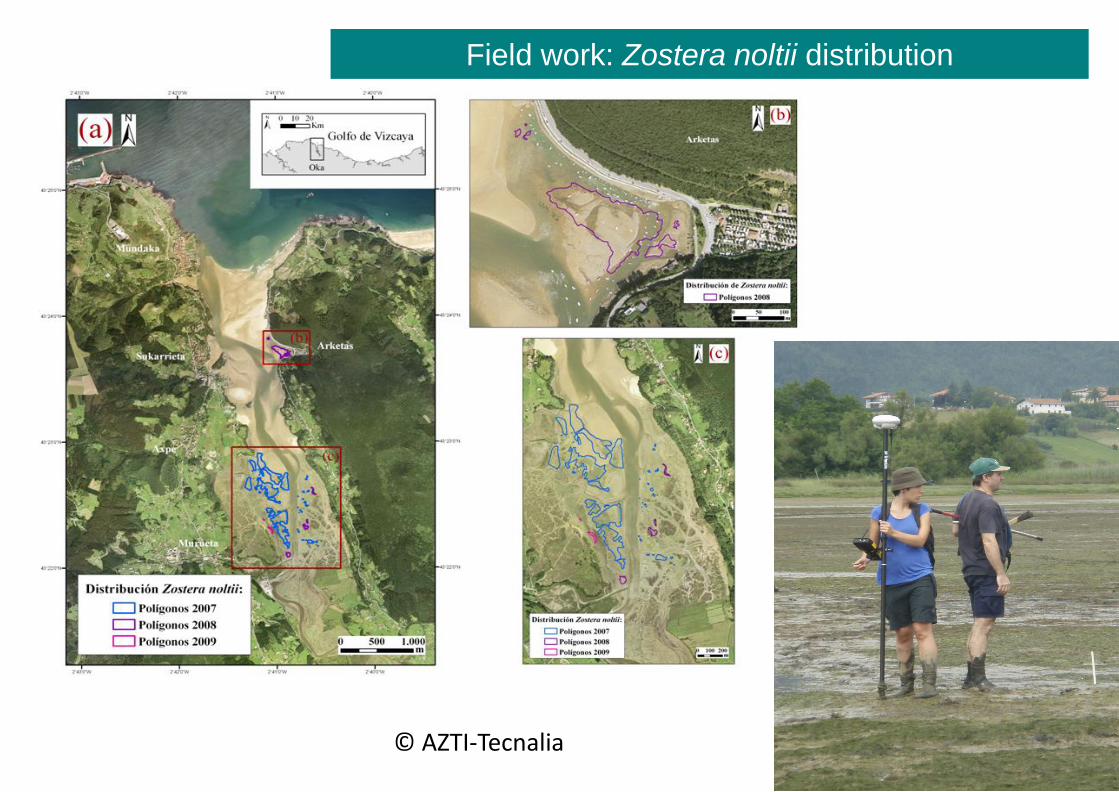
Shift of the seagrass habitat to the inner estuary
Zostera noltii
Saltamarshes
Wall-enclosed areas
+ 14%
- 22%
+ 18%
- 63%
SLR and derived changes in current velocities are expected to induce the landward migration of the species, increasing the available suitable intertidal areas (14–18%) to limits imposed by anthropogenic barriers.
30
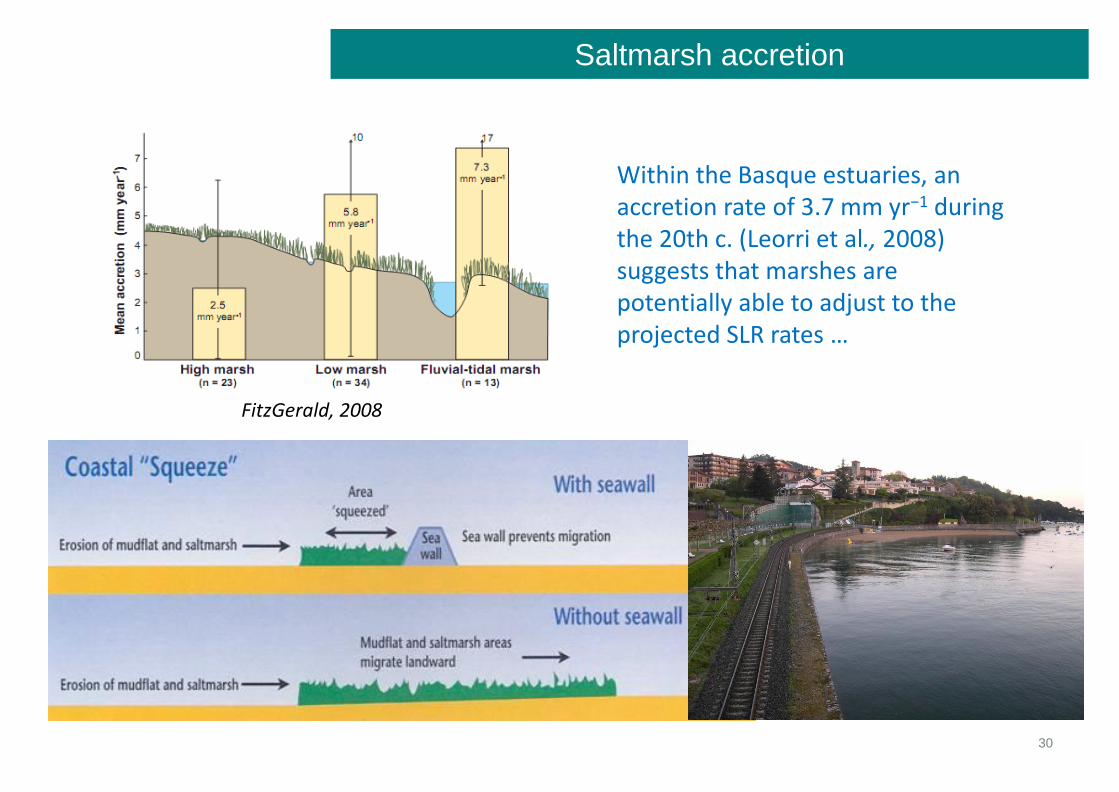
Saltmarsh accretion
FitzGerald, 2008
Within the Basque estuaries, an accretion rate of 3.7 mm yr−1 during the 20th c. (Leorri et al., 2008) suggests that marshes are potentially able to adjust to the projected SLR rates …
www.azti.es 7/7/2015
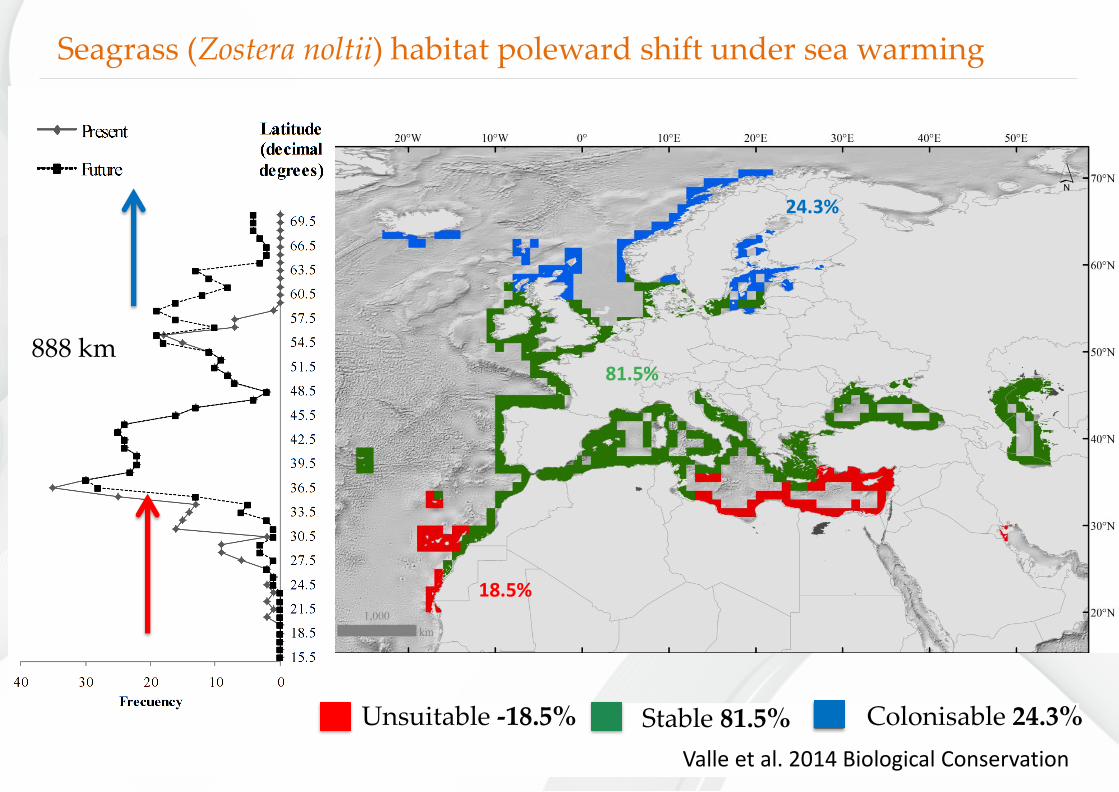
81.5%
18.5%
Colonisable 24.3%
Seagrass (Zostera noltii) habitat poleward shift under sea warming
Unsuitable -18.5% Stable 81.5%
888 km
24.3%
Valle et al. 2014 Biological Conservation
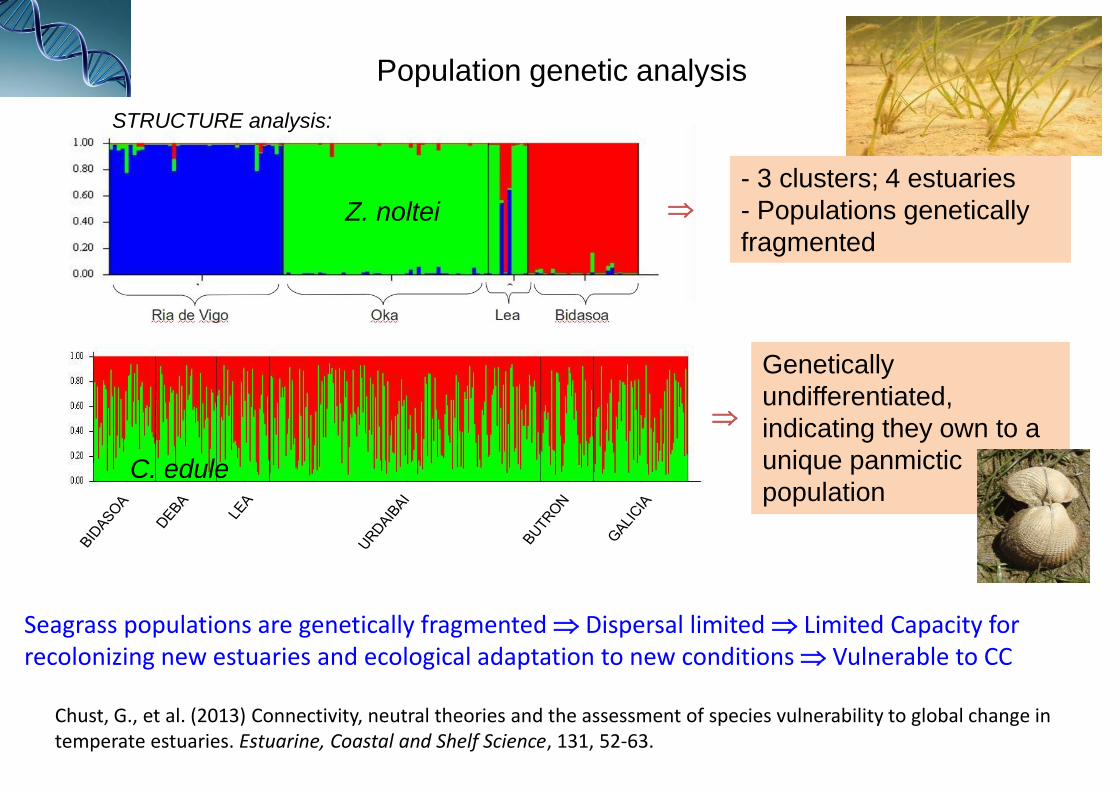
STRUCTURE analysis:
Z. noltei
Population genetic analysis
C. edule
Genetically
undifferentiated,
indicating they own to a
unique panmictic
population
- 3 clusters; 4 estuaries
- Populations genetically
fragmented
Chust, G., et al. (2013) Connectivity, neutral theories and the assessment of species vulnerability to global change in temperate estuaries. Estuarine, Coastal and Shelf Science, 131, 52-63.
Seagrass populations are genetically fragmented Dispersal limited Limited Capacity for recolonizing new estuaries and ecological adaptation to new conditions Vulnerable to CC
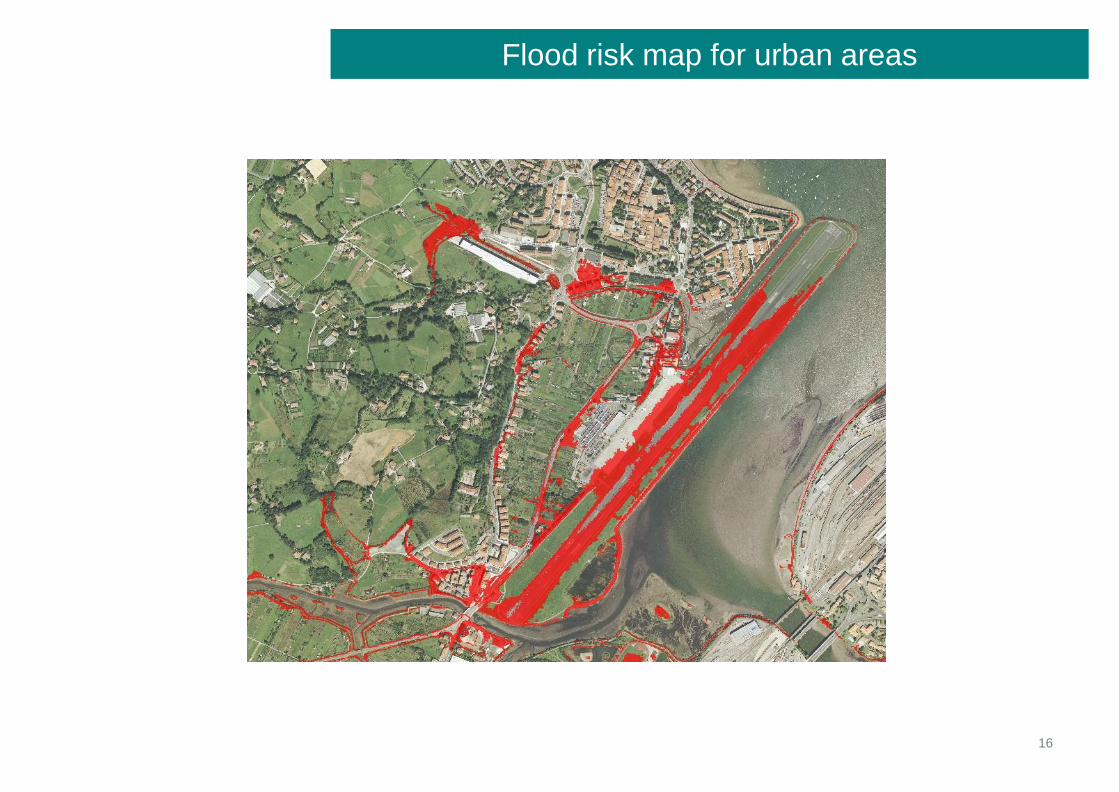
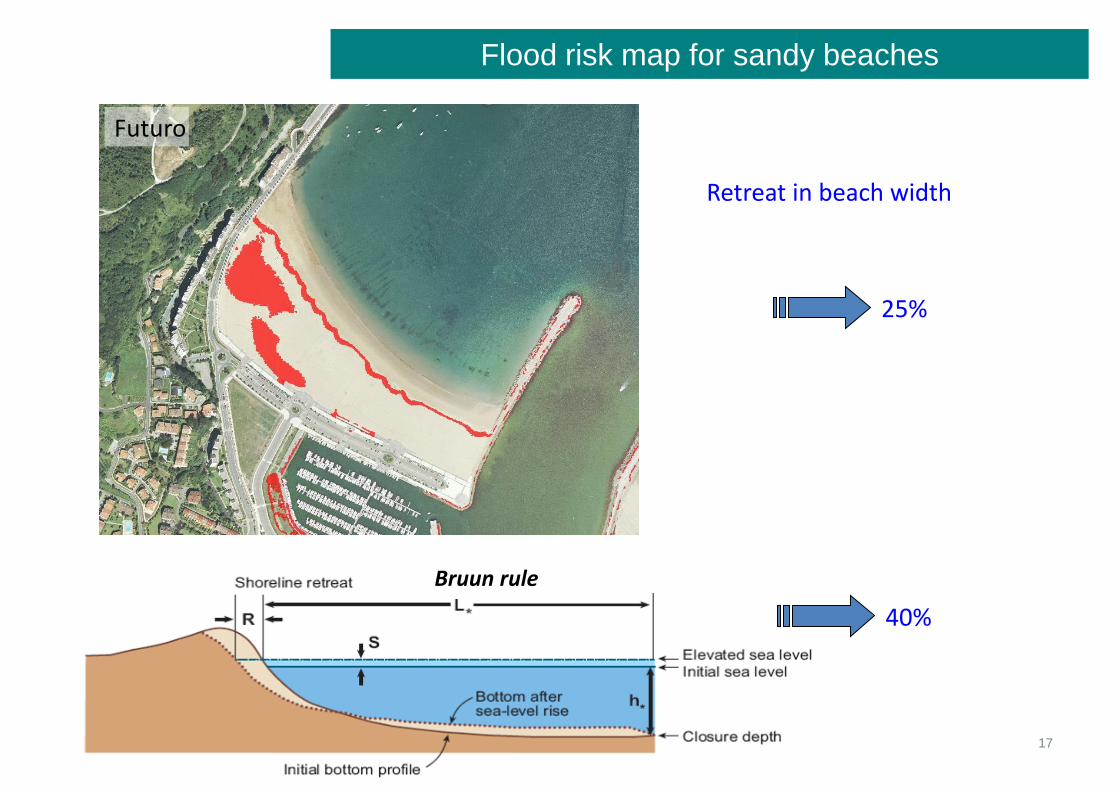
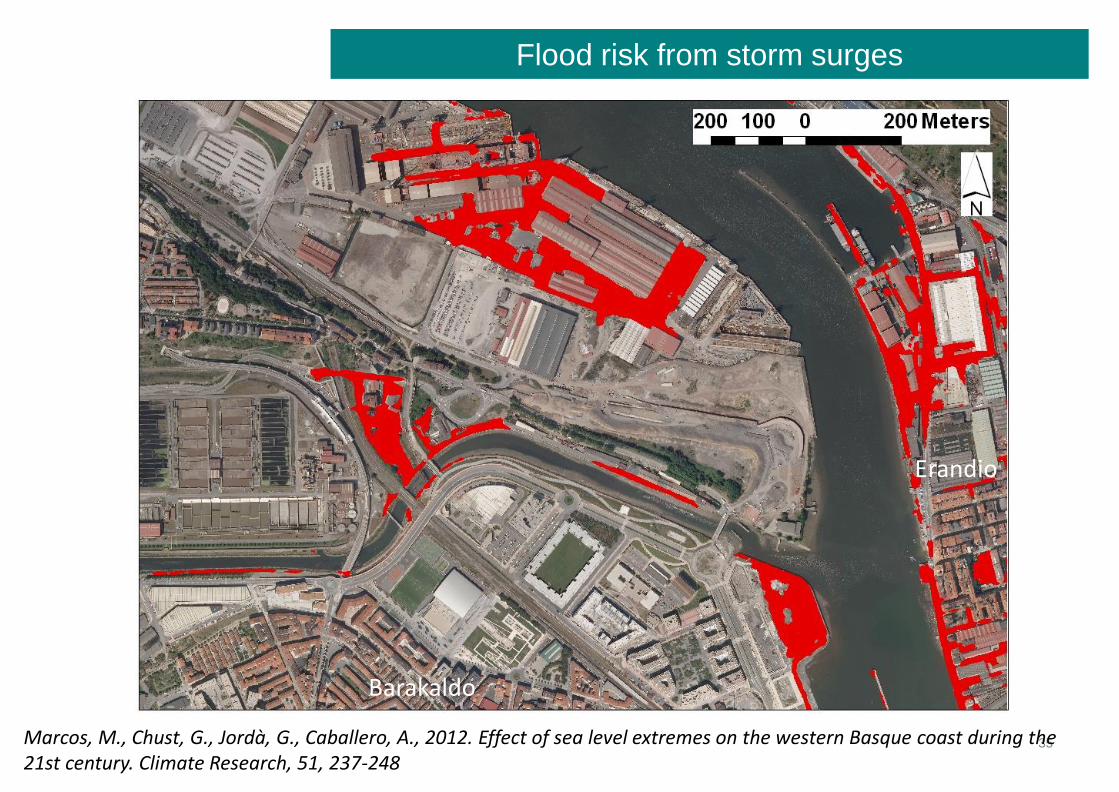
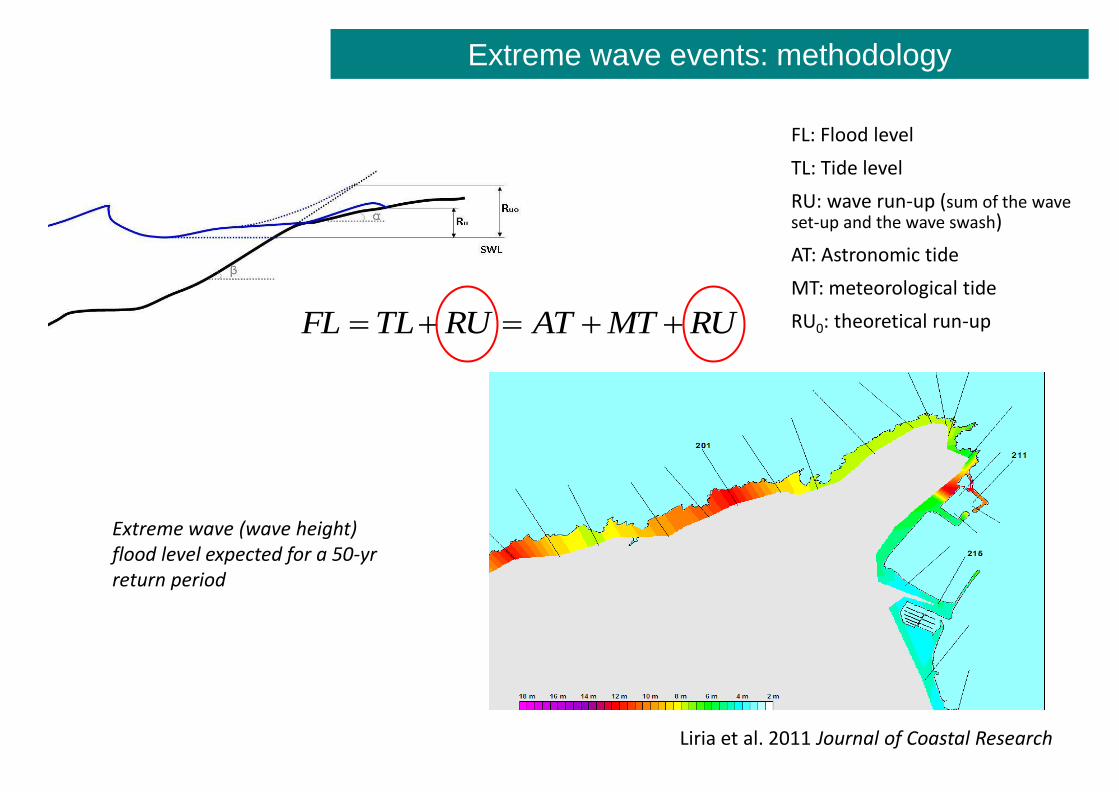
Flood risk map expected by 2050-2100 as a consequence of 50-yr return level Sea level rise + Storm surge 85 cm above Maximum Astron. tide
Marcos, M., Chust, G., Jordà, G., Caballero, A., 2012. Effect of sea level extremes on the western Basque coast during the 21st century. Climate Research, 51, 237-248
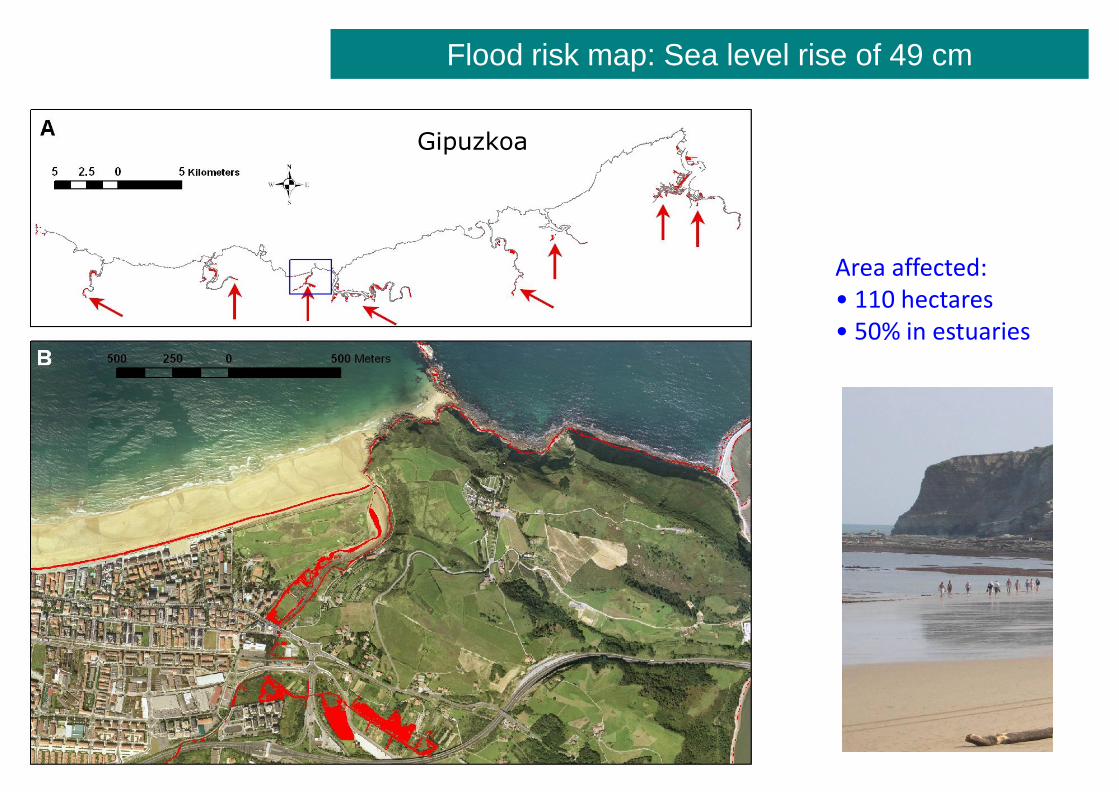
250 ha of the Basque coast is at risk of flood, concentrated within the estuaries (~50%)
Retreat of beaches on 25-40% of width
The habitat of intertidal species and salt-marshes can be reduced
Scenarios Impacts Adaptations
• Maintenance and rebuilding of coastal infrastructures
• Revision of drainage systems
• To promote coastal resilience such as protection, regeneration of dune plants and intertidal species and wetlands, sand stabilization, establish buffer zones
References • Chust et al. (2009). Human impacts overwhelm the effects of sea-level rise on Basque coastal habitats (N Spain) between
1954 and 2004. Estuarine, Coastal and Shelf Science 84:453-462.
• Chust et al. . 2010. Regional scenarios of sea level rise and impacts on Basque (Bay of Biscay) coastal habitats, throughout the 21st century. Estuarine, Coastal and Shelf Science 87:113-124.
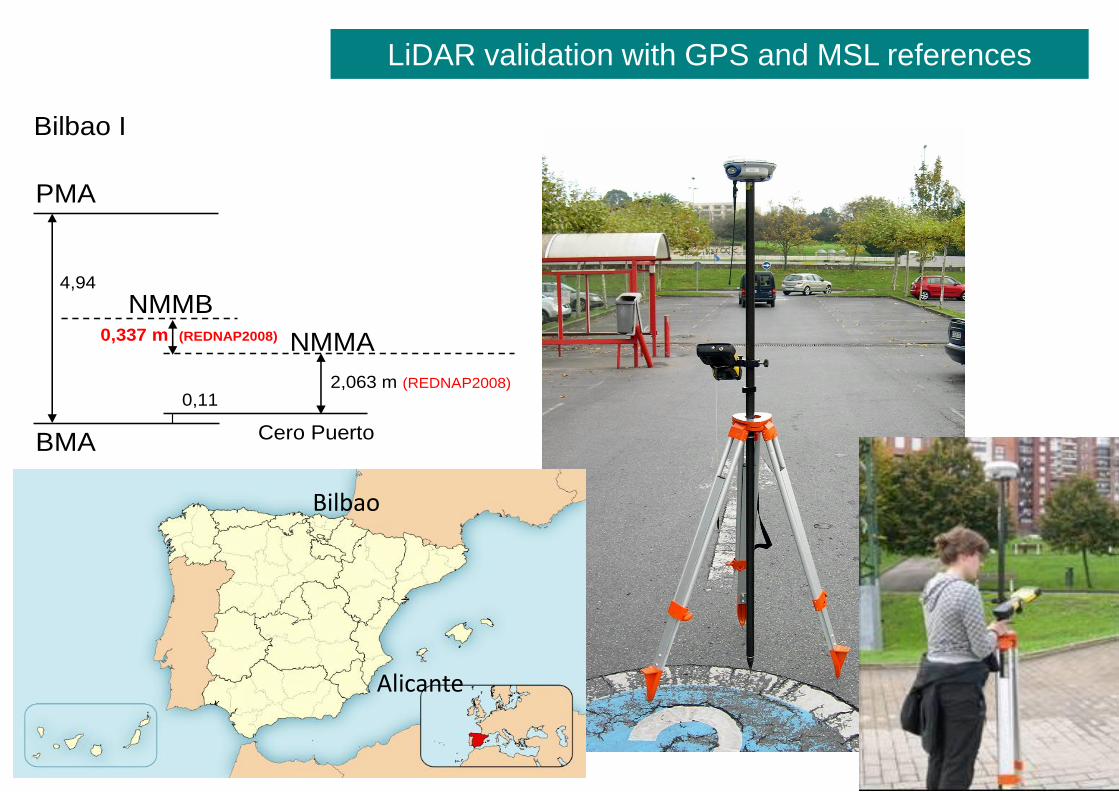
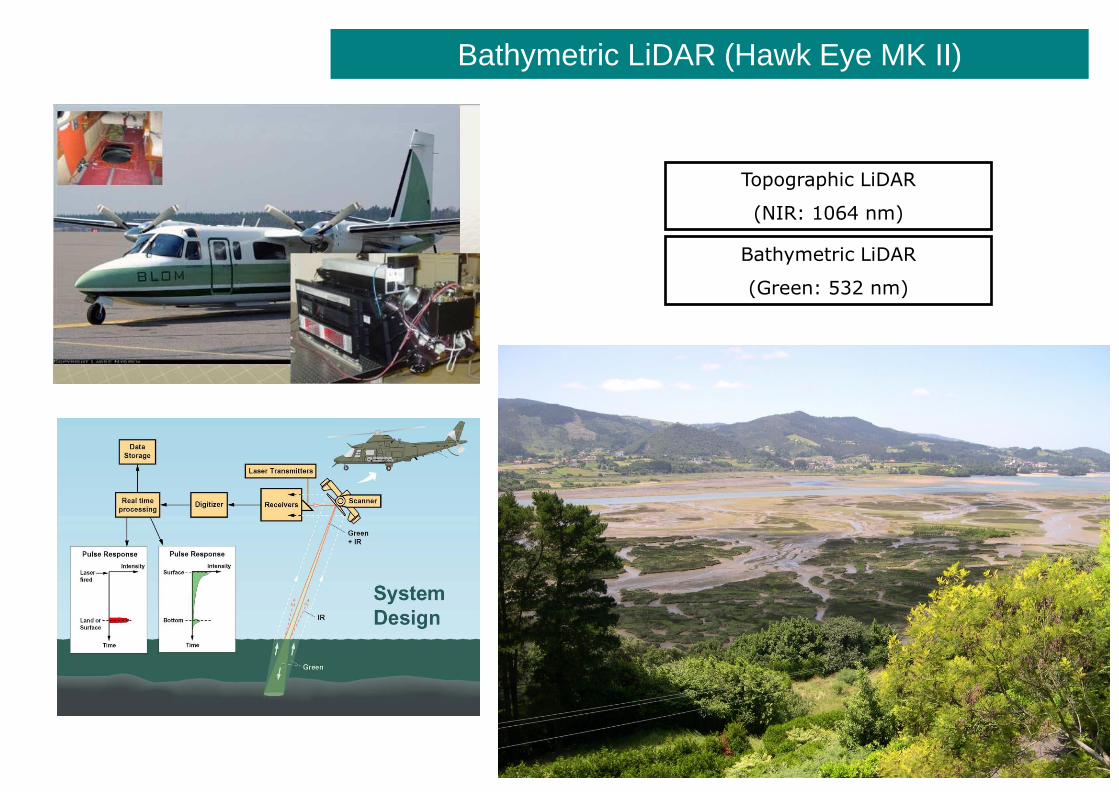
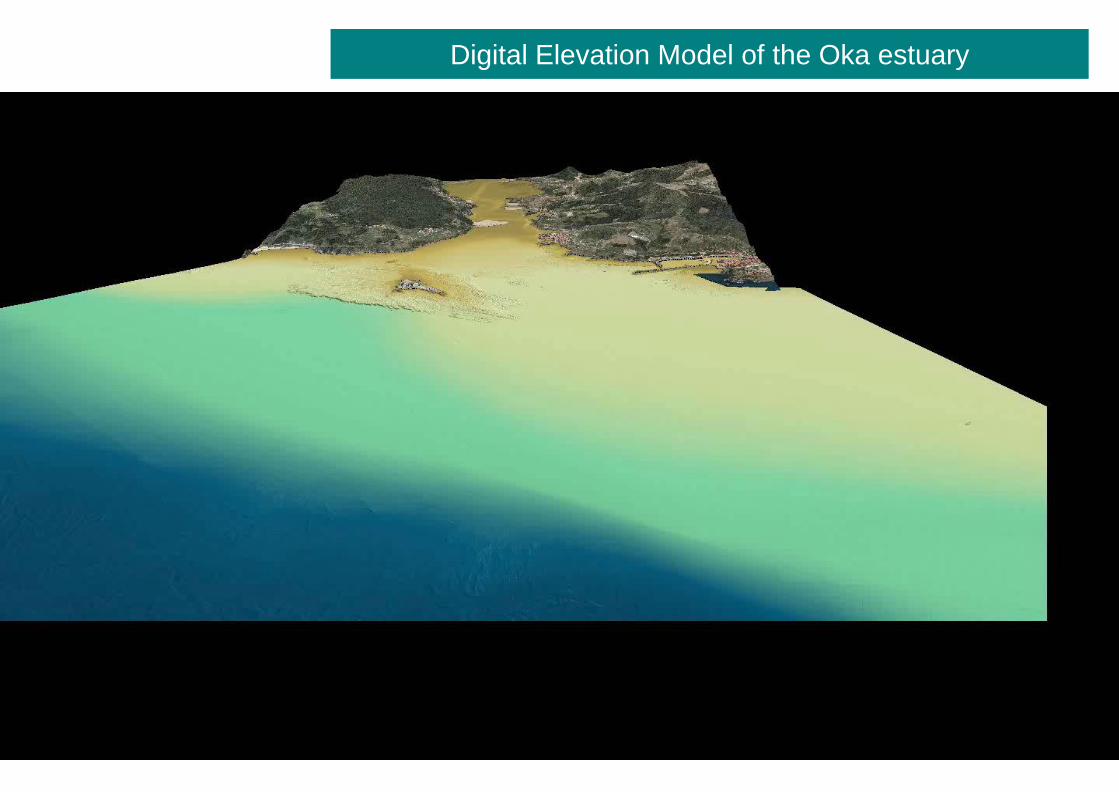
• Chust et al. 2010. Capabilities of the bathymetric Hawk Eye LiDAR for coastal habitat mapping: a case study within a Basque estuary. Estuarine, Coastal and Shelf Science 89: 200-213.
• Chust et al. (2011) Climate Change impacts on the coastal and pelagic environments in the southeastern Bay of Biscay. Climate Research 48:307–332.
• Liria et al. 2011. Extreme Wave Flood-Risk Mapping Within the Basque Coast. Journal of Coastal Research, SI 64.
• Valle et al., 2014. Projecting future distribution of the seagrass Zostera noltii under global warming and sea level rise. Biological Conservation 170.
Acknowledgements
• Gobierno Vasco (ETORTEK, proyecto K-Egokitzen I & II)
• Ministerio de Medio Ambiente y Medio Rural y Marino, Gobierno de España (Proyecto Ref.: 0.39/SGTB/2007/4.1)
• Agencia vasca del Agua (URA), Gobierno Vasco, proyecto « Inundabilidad de los estuarios vascos »