62
© Gauteng Department of Education 1 SECONDARY SCHOOL IMPROVEMENT PROGRAMME (SSIP) 2014 GRADE 12 SUBJECT: MATHEMATICAL LITERACY LEARNER NOTES (Page 1 of 62)

© Gauteng Department of Education
1
SECONDARY SCHOOL IMPROVEMENT
PROGRAMME (SSIP) 2014
GRADE 12
SUBJECT: MATHEMATICAL LITERACY
LEARNER NOTES (Page 1 of 62)
© Gauteng Department of Education
2
TABLE OF CONTENTS
SESSION TOPIC PAGE
1 DATA HANDLING 3 - 15
2 FINANCE Break-even analysis Small business
15 - 30
3 FINANCE Tariff systems 31 - 44
4 MEASUREMENT Conversions Use of formulae
45 - 62

© Gauteng Department of Education
3
SESSION 1 TOPIC: DATA HANDLING
LEARNER NOTES: • Data handling is the easiest section of Mathematical Literacy. • You can really get many marks in this section. • Know the terminology very well. • Practise these questions before an exam, to refresh your memory. • The biggest catch in these questions is when two sets of data is given in
the question. Be very careful to use the correct set of data when answering the questions.
SECTION A: TYPICAL EXAM QUESTIONS QUESTION 1: 14 Minutes (from NSC Nov 2013 Paper 1) Thandeka has a shop with a scrapbooking department and a toy department. She kept a record of the ages of the customers who visited the two departments on a particular day.
Ages of customers who visited the scrapbooking department 35 60 46 57 54 34 60 54 56 46 47 67 65 54 45 Ages of customers who visited the toy department
5 15 25 7 36 21 70 20 17 6 15 65 9 15
1.1 Arrange the ages of the customers who visited the toy department in
Scrapbooking is a hobby which involves cutting and pasting photos, pictures and other decorative items in a book
© Gauteng Department of Education
4
ascending order. (2) 1.2 Calculate the range of the ages of the customers who visited the toy department. (2) 1.3 Determine the modus of the ages of customers who visited the scrapbooking department. (2) 1.4 Calculate the mean (average) age of the customers who visited the scrapbooking department. (3) 1.5 The upper quartile of the ages of customers who visited the toy department is 25. List the ages of the customers who visited the toy department that are greater than the upper quartile. (2)
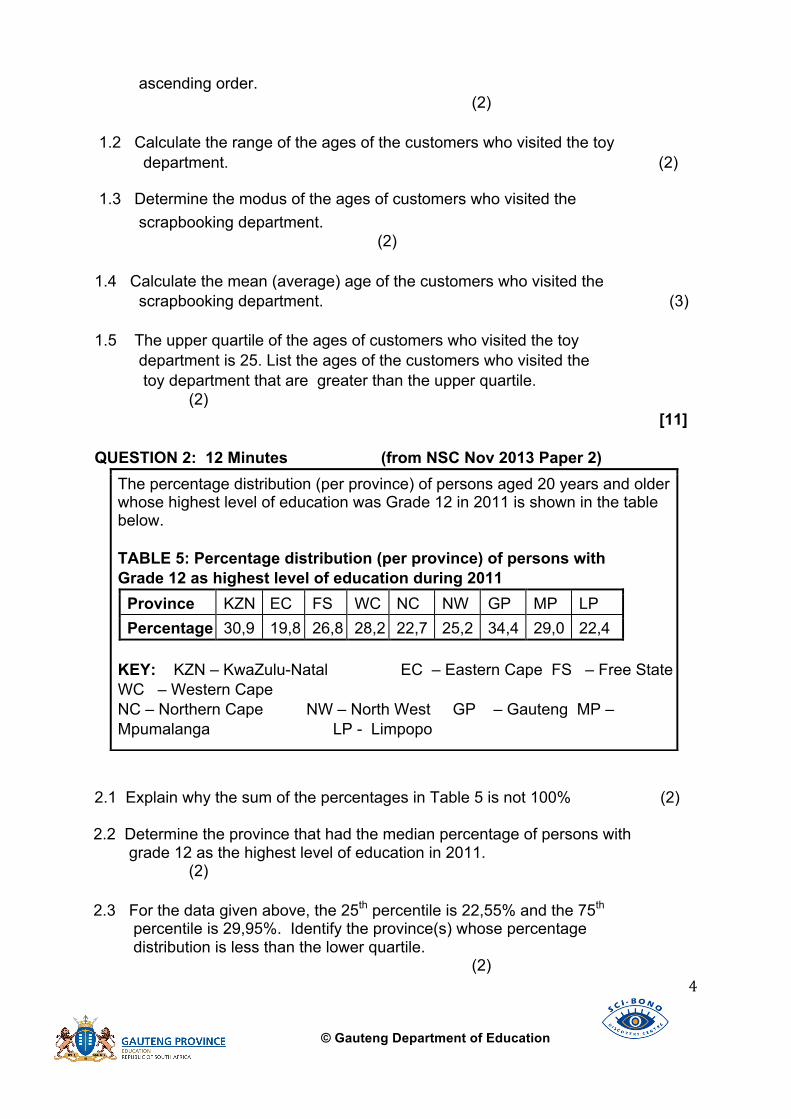
[11] QUESTION 2: 12 Minutes (from NSC Nov 2013 Paper 2)
2.1 Explain why the sum of the percentages in Table 5 is not 100% (2) 2.2 Determine the province that had the median percentage of persons with grade 12 as the highest level of education in 2011. (2) 2.3 For the data given above, the 25th percentile is 22,55% and the 75th percentile is 29,95%. Identify the province(s) whose percentage distribution is less than the lower quartile.
(2)
The percentage distribution (per province) of persons aged 20 years and older whose highest level of education was Grade 12 in 2011 is shown in the table below. TABLE 5: Percentage distribution (per province) of persons with Grade 12 as highest level of education during 2011
Province KZN EC FS WC NC NW GP MP LP Percentage 30,9 19,8 26,8 28,2 22,7 25,2 34,4 29,0 22,4
KEY: KZN – KwaZulu-Natal EC – Eastern Cape FS – Free State WC – Western Cape NC – Northern Cape NW – North West GP – Gauteng MP – Mpumalanga LP - Limpopo

© Gauteng Department of Education
5
2.4 Give a reason why each of the following types of graphs is NOT suitable to represent the above data: (a) a pie chart (2)
(b) a histogram (2) [10]
QUESTION 3: 17 minutes (from NSC Feb/Mar 2013 Paper 1)
3.1
Determine the sample size of the survey. (2)
3.2 How many learners did not watch any television during the week? (1) 3.3 Calculate the range of the time spent by the Grade 8 learners watching television. (2) 3.4 Write down the modal time the Grade 8 learners spent watching television. (2) 3.5 Determine the median time the Grade 8 learners spent watching
Television. (3) 3.6 Calculate the average (mean) time the Grade 12 learners spent watching television. (3) 3.7 One of the Grade 12 learners is randomly selected. Determine the
Mrs Botha conducted a survey each day for a week to determine the approximate number of minutes that her Grade 8 and Grade 12 learners watched television. She recorded the results (in minutes) of her survey as follows: GRADE 8 30 45 60 60 60 90 95 95 120 120 120 120 150 150 180 GRADE 12
0 30 30 30 40 45 45 50 60 60 60 60
60 150 150 180
© Gauteng Department of Education
6
probability that this learner spent 45 minutes daily watching television. (2) [15] QUESTION 4: 18 minutes (from NSC Feb/Mar 2013 Paper 2)
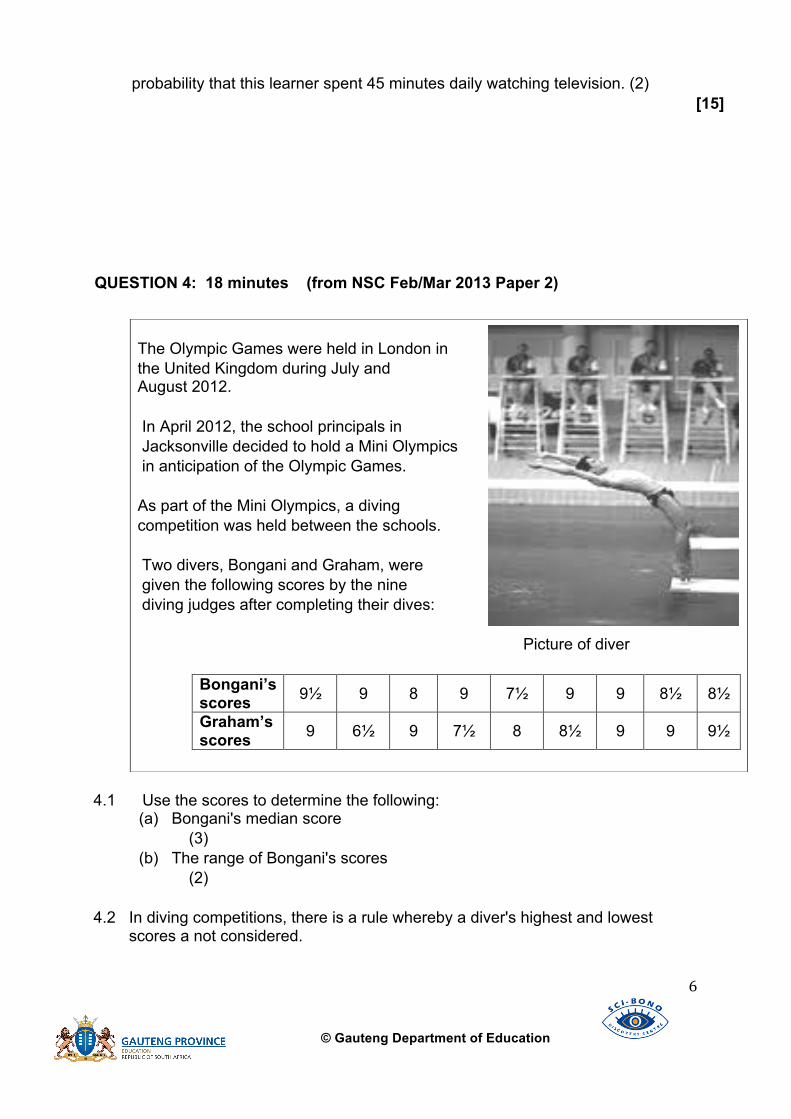
4.1 Use the scores to determine the following: (a) Bongani's median score (3) (b) The range of Bongani's scores (2) 4.2 In diving competitions, there is a rule whereby a diver's highest and lowest scores a not considered.
The Olympic Games were held in London in the United Kingdom during July and August 2012. In April 2012, the school principals in Jacksonville decided to hold a Mini Olympics in anticipation of the Olympic Games. As part of the Mini Olympics, a diving competition was held between the schools. Two divers, Bongani and Graham, were given the following scores by the nine diving judges after completing their dives:
Picture of diver
Bongani’s scores 9½ 9 8 9 7½ 9 9 8½ 8½
Graham’s scores 9 6½ 9 7½ 8 8½ 9 9 9½

© Gauteng Department of Education
7
(a) Give ONE valid reason why this rule is applied. (2)
(b) Determine, showing ALL calculations, which ONE of the two divers attained the higher mean score if the competition rule is applied. (8)
[15] SECTION B: CONTENT NOTES POPULATION: The entire group about which data is collected. SAMPLE: A collection of people that represent the population. ORDER (ARRANGE): Sort the data set in: ASCENDING ORDER: (smallest value to largest value) DESCENDING ORDER: (largest value to smallest value) RANGE: The largest data value MINUS the smallest data value. MEAN (AVERAGE): Add all the data values together and divide the answer by the NUMBER of data values. Always use the formula: 𝑴𝒆𝒂𝒏 = 𝒕𝒐𝒕𝒂𝒍 𝒐𝒇 𝒅𝒂𝒕𝒂 𝒗𝒂𝒍𝒖𝒆𝒔
𝒏𝒖𝒎𝒃𝒆𝒓 𝒐𝒇 𝒅𝒂𝒕𝒂 𝒗𝒂𝒍𝒖𝒆𝒔
MODE: The piece of data found MOST often. There can be more than one mode. MEDIAN: After the set is arranged in size order the MIDDLE-MOST value is the median. When the set has an UNEVEN number of data values, there is a data value in the middle. When the set has an EVEN number of data values, the median will be the MEAN of the middle TWO data values. QUARTILES: Quartiles divide the data into four equal parts. The MEDIAN is also Q2, sometimes called the 2nd Quartile. The LOWER QUARTILE Q1 is the middle data value when looking from the start of the arranged data set to Q2
Q1 is also the 25th percentile, sometimes called the 1st Quartile The UPPER QUARTILE Q3 is the middle value when looking from the median to the last data value. Q3 is also the 75th percentile, sometimes called the 3rd percentile. INTERQUARTILE RANGE: The difference between Q3 and Q1 . (Q3−Q1) This section represents the middle 50% of the data set.

© Gauteng Department of Education
8
PERCENTILES: Divides the data in 100 equal parts. Q1 is the 25th percentile Q2 is the 50th percentile Q3 is the 75th percentile SECTION C: HOME WORK QUESTION 1: 18 minutes (from NSC Nov 2012 Paper 2)
1.1 The range of the waiting times was 37 minutes and the mean (average) waiting time was 34 minutes.
(a) Calculate the missing value A, the longest waiting time. (2) (b) Hence, calculate the value of B. (4) (c) Hence, determine the median waiting time. (3)
1.2 The lower quartile and the upper quartile of the waiting times are 27 minutes and 41,5 minutes respectively. How many of the 16 customers had to wait in the queue for a shorter time than the lower quartile? (2)
1.3 Danny's previous records, for 16 customers on 7 February 2012, showed that the median, range and the mean (average) of the waiting times were 10 minutes, 5 minutes and 10 minutes respectively.
Compare the statistical measures relating to the waiting times on 7 and 14 February and then identify TWO possible reasons to explain the difference in these waiting times. (4)
[15]
On 14 February 2012 there was a queue of customers waiting to eat at Danny's Diner, a popular eating place in Matatiele. The time (in minutes) that 16 of Danny's customers had to wait in the queue is given below: 30 15 45 36 A 40 34 B B 42 26 32 38 35 41 28 B is a value greater than 20.

© Gauteng Department of Education
9
QUESTION 2: 5 minutes (from NSC Feb/Mar 2012 Paper 2)
2.1 Determine the number of fish caught having a mass between the lower and upper quartiles. (2) 2.2 Which ONE of the following measures of central tendency (median, mean or mode) will change, if a twelfth fish with a mass of 1 462 g was also caught? (2)
[4] QUESTION 3: 14 minutes (from NSC Nov 2011 Paper 1) 3.1 What is the modal shoe size of the boys? (2) 3.2 Determine the median shoe size of the boys. (2) 3.3 Determine the median shoe size of the girls. (2) 3.4 Which shoe sizes are NOT worn by the boys? (2)
They went fishing during their camping trip and recorded the mass (in grams) of the eleven fish they caught, as shown below. 1 513 875 3 025 912 1 809 1 513 1 003 1 794 1 628 958 1 052 The following are statistical measures relating to the above data: Lower quartile = 958 g Upper quartile = 1 794 g Median = 1 513 g Mean = 1 462 g
The Swartberg High Fundraising Committee intends opening a school uniform shop in January 2012. They foresee that the shop will mainly be supported by the new Grade 8 learners. They surveyed a sample of Grade 8 learners in June 2011 to determine their shoe sizes.
SHOE SIZES OF BOYS: 5 5 5 6 6 6 6 6½ 6½ 6½ 7 7 7 7½ 8 8½ 9 10 11 SHOE SIZES OF GIRLS: 3½ 4 4 4½ 5 5 5 5 5 5½ 5½ 6 6 6 6 6 6 6½ 7 8
© Gauteng Department of Education
10
3.5. Write, as a ratio, the number of boys not wearing half sizes to the number of girls not wearing half sizes. (3)
[11]
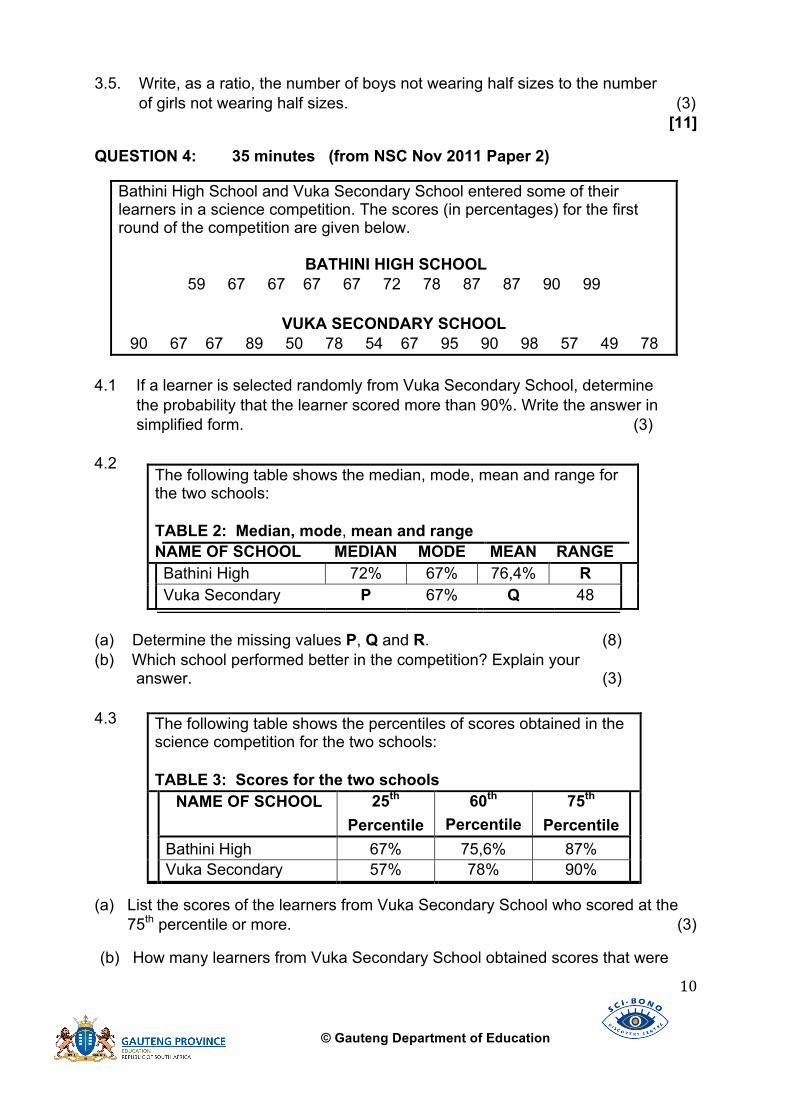
QUESTION 4: 35 minutes (from NSC Nov 2011 Paper 2)
4.1 If a learner is selected randomly from Vuka Secondary School, determine
the probability that the learner scored more than 90%. Write the answer in simplified form. (3)
4.2
(a) Determine the missing values P, Q and R. (8) (b) Which school performed better in the competition? Explain your
answer. (3) 4.3
(a) List the scores of the learners from Vuka Secondary School who scored at the 75th percentile or more. (3)
(b) How many learners from Vuka Secondary School obtained scores that were
Bathini High School and Vuka Secondary School entered some of their learners in a science competition. The scores (in percentages) for the first round of the competition are given below.
BATHINI HIGH SCHOOL 59 67 67 67 67 72 78 87 87 90 99
VUKA SECONDARY SCHOOL
90 67 67 89 50 78 54 67 95 90 98 57 49 78
The following table shows the median, mode, mean and range for the two schools: TABLE 2: Median, mode, mean and range NAME OF SCHOOL MEDIAN MODE MEAN RANGE
Bathini High 72% 67% 76,4% R Vuka Secondary P 67% Q 48
The following table shows the percentiles of scores obtained in the science competition for the two schools: TABLE 3: Scores for the two schools NAME OF SCHOOL 25th
Percentile 60th
Percentile 75th
Percentile
Bathini High 67% 75,6% 87% Vuka Secondary 57% 78% 90%
© Gauteng Department of Education
11
less than the 25th percentile of Bathini High School? (2) [19] SECTION D: SOLUTIONS FOR SECTION A
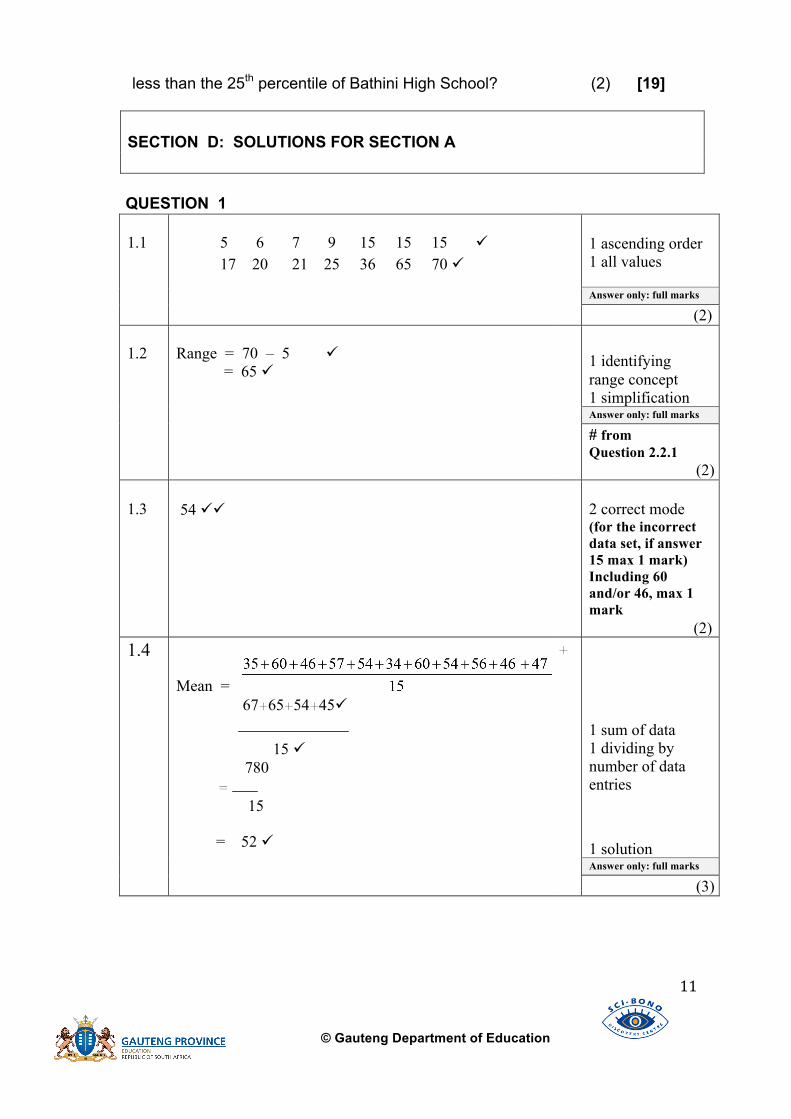
QUESTION 1 1.1
5 6 7 9 15 15 15 17 20 21 25 36 65 70
1 ascending order 1 all values
Answer only: full marks (2)
1.2
Range = 70 – 5 = 65
1 identifying range concept 1 simplification Answer only: full marks # from Question 2.2.1 (2)
1.3
54
2 correct mode (for the incorrect data set, if answer 15 max 1 mark) Including 60 and/or 46, max 1 mark (2)
1.4
Mean = 67+65+54+45
15
780 =
15 = 52
+
1 sum of data 1 dividing by number of data entries
1 solution Answer only: full marks
(3)

© Gauteng Department of Education
12
1.5
36; 65; 70
2 correct values (one or two values correct, 1 mark) Including an incorrect value max 1 mark
(2)
QUESTION 2 2.1
The percentages given represent the number of people with Grade 12 as a percentage of the number of people 20 years and older in each province and not nationally.
OR
Data is per province
2 acceptable explanation
(2)
2.2
The ascending order is 19,8 ; 22,4 ; 22,7 ; 25,2 ; 26,8 ; 28,2 ; 29,0 ; 30,9 ; 34,4
� Free State has the median percentage
OR The ascending order is
EC; LP; NC; NW; FS; WC; MP; KZN; GP � Free State has the median percentage
1 arranging in ascending order 1 province
OR 1 ascending order 1 province Correct answer only: full marks
(2) 2.3
Eastern Cape and Limpopo
1 EC 1 LP
(2)
2.4(a)
The percentages do not add up to 100%
OR
The degrees to not add up to 3600
OR
There are too many sectors
2 explanation
(2)

© Gauteng Department of Education
13
QUESTION 3 3.1
15 + 16 = 31
2 solution (2)
3.2
1 (one)
1 solution (1)
3.3
Range = (180 – 30) minutes = 150 minutes
1 concept of range 1 simplification (2)
3.4
120 minutes
2 simplification (2)
3.5
Median = 95 minutes
2 solution (2)
3.6
Mean = 0+30+30+30+40+45+45+50+60+60+60+60+60+150+150+180
16
=
= 65,63 minutes
1 adding 1 dividing by 16 1 simplification
(3)
2.4(b)
The histogram cannot be used since the data is qualitative
OR
The data is not continuous
OR Data is not given in class intervals
2 explanation
(2)

© Gauteng Department of Education
14
3.7
Probability (a learner watching TV for 45 minutes)
= 2 1
6 A
OR 1
8 OR 12,5 %
1 numerator 1 denominator
(2)
QUESTION 4 4.1 (a)
M
7 8 8 8 9 9 9 9 9 12
The median score = 9
1 arranging in order
2 correct identification
Answer only full marks
(3)
4.1 (b)
Range = 9 – 7 = 2
1 subtraction 1 simplification
Answer only full marks
(2)
4.2 (a)
To eliminate scores of judges who are biased. OR Eliminating the highest and lowest scores will have the effect that the mean is calculated without extreme values OR Any other valid, well-‐thought out opinion
2 opinion
OR
2 opinion
(2)
© Gauteng Department of Education
15
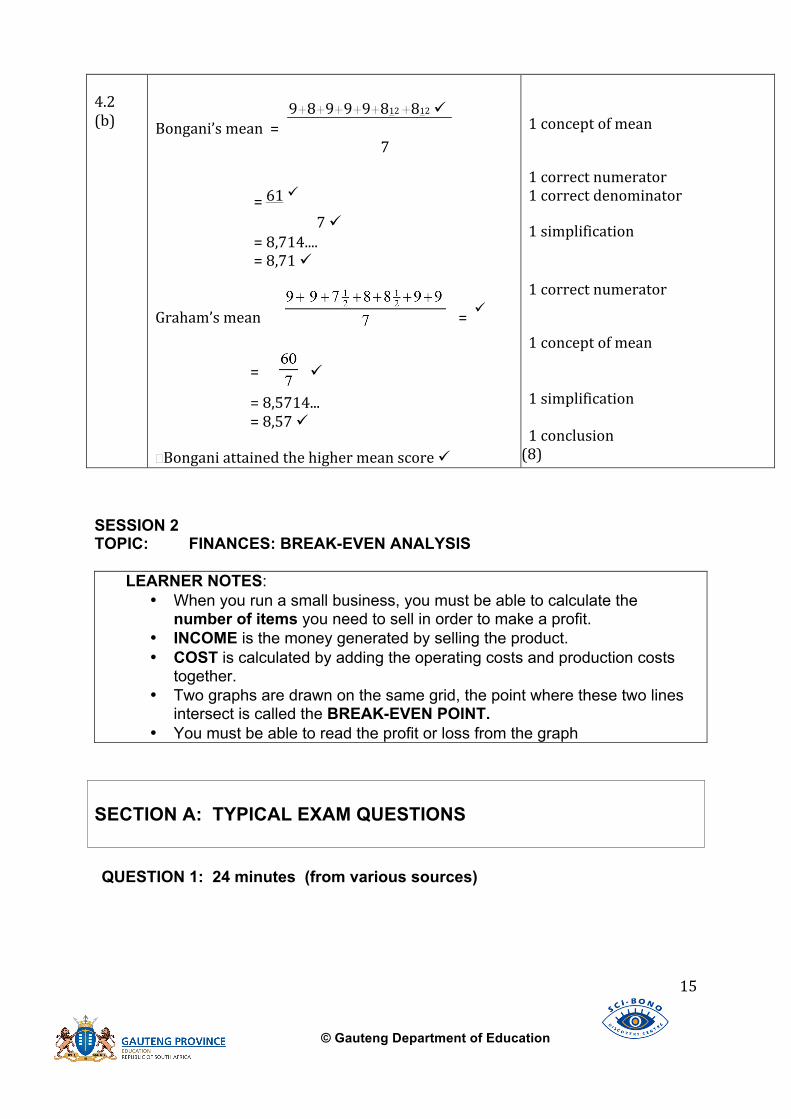
4.2 (b)
9+8+9+9+9+812 +812 Bongani’s mean =
7
= 61 7
= 8,714.... = 8,71
= Graham’s mean
=
= 8,5714... = 8,57 �Bongani attained the higher mean score
1 concept of mean 1 correct numerator 1 correct denominator 1 simplification 1 correct numerator 1 concept of mean 1 simplification 1 conclusion (8)
SESSION 2 TOPIC: FINANCES: BREAK-EVEN ANALYSIS
LEARNER NOTES: • When you run a small business, you must be able to calculate the
number of items you need to sell in order to make a profit. • INCOME is the money generated by selling the product. • COST is calculated by adding the operating costs and production costs
together. • Two graphs are drawn on the same grid, the point where these two lines
intersect is called the BREAK-EVEN POINT. • You must be able to read the profit or loss from the graph
SECTION A: TYPICAL EXAM QUESTIONS QUESTION 1: 24 minutes (from various sources)
© Gauteng Department of Education
16
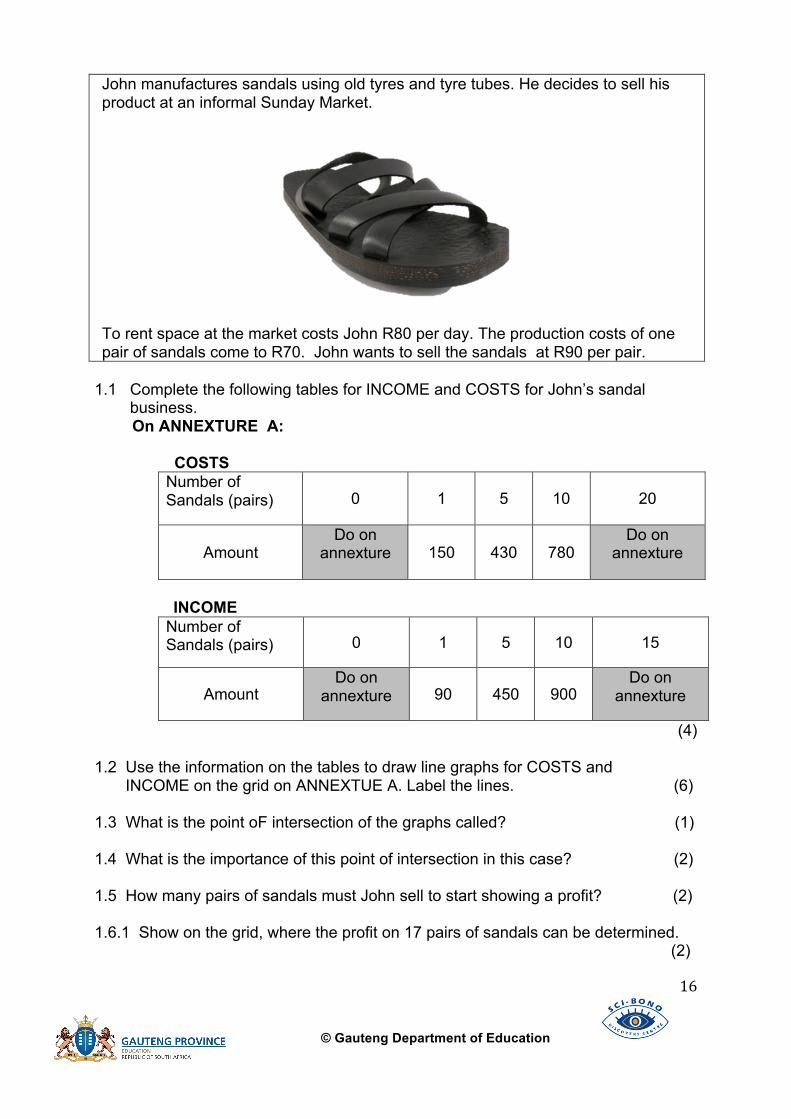
John manufactures sandals using old tyres and tyre tubes. He decides to sell his product at an informal Sunday Market.
To rent space at the market costs John R80 per day. The production costs of one pair of sandals come to R70. John wants to sell the sandals at R90 per pair.
1.1 Complete the following tables for INCOME and COSTS for John’s sandal business. On ANNEXTURE A: COSTS
Number of Sandals (pairs) 0 1 5 10 20
Amount Do on
annexture 150 430 780 Do on
annexture
INCOME
Number of Sandals (pairs) 0 1 5 10 15
Amount Do on
annexture 90 450 900 Do on
annexture
(4) 1.2 Use the information on the tables to draw line graphs for COSTS and INCOME on the grid on ANNEXTUE A. Label the lines. (6) 1.3 What is the point oF intersection of the graphs called? (1) 1.4 What is the importance of this point of intersection in this case? (2) 1.5 How many pairs of sandals must John sell to start showing a profit? (2) 1.6.1 Show on the grid, where the profit on 17 pairs of sandals can be determined. (2)
© Gauteng Department of Education
17
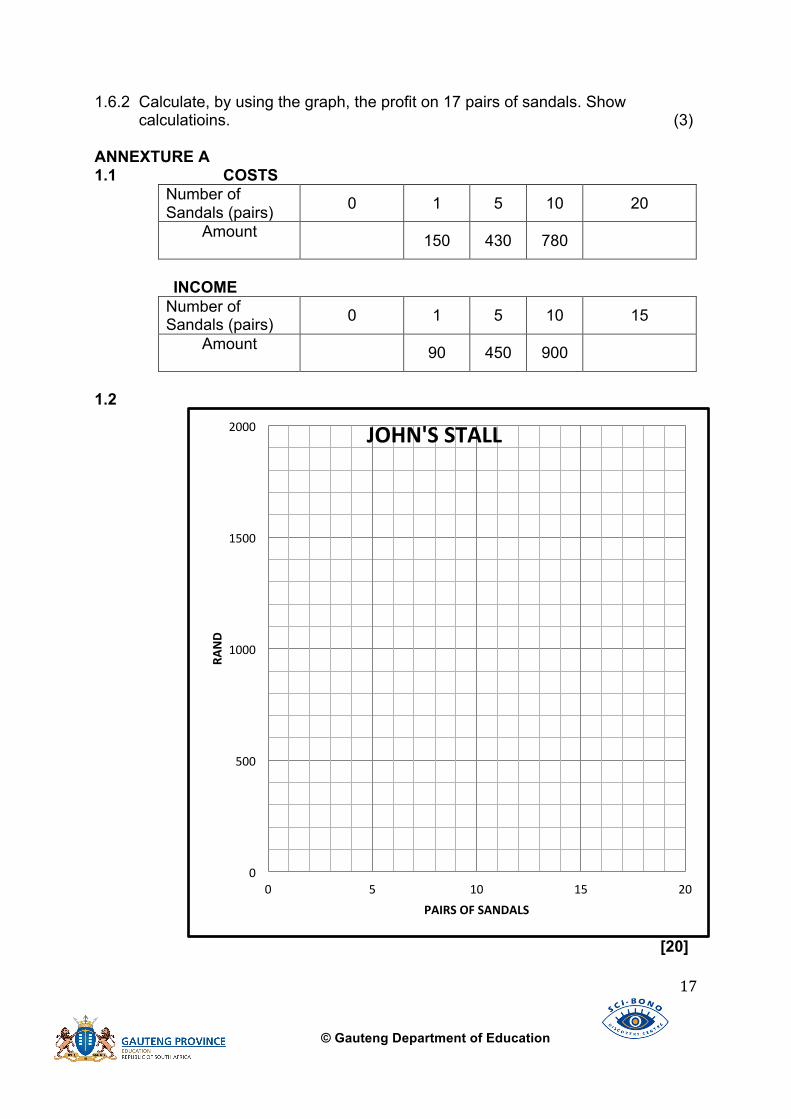
1.6.2 Calculate, by using the graph, the profit on 17 pairs of sandals. Show calculatioins. (3) ANNEXTURE A 1.1 COSTS
Number of Sandals (pairs) 0 1 5 10 20
Amount
150 430 780
INCOME
Number of Sandals (pairs) 0 1 5 10 15
Amount
90 450 900
1.2
[20]
0
500
1000
1500
2000
0 5 10 15 20
RAND
PAIRS OF SANDALS
JOHN'S STALL

© Gauteng Department of Education
18
QUESTION 2: 9 minutes (from NSC Nov 2012, paper 2)
2.1 Use the graph above to determine the exact number of items sold that will give a loss of R1 400. (3)
2.2 Mr Stanford stated that the company would break even if 40 items were sold at R137,50 each. Verify whether Mr Stanford's statement is correct or not. Show ALL the necessary calculations. (4)
[7]

© Gauteng Department of Education
19
QUESTION 3: 33 minutes (from NSC Feb/Mar 2009 paper 2) The Hospitality Studies department of Ses’fikile High School bakes brown bread in order to raise funds for the shortfall incurred in their day-‐to-‐day expenses. The school charges the Hospitality Studies department a fixed weekly cost of R400,00 for water and electricity The cost of producing one loaf of brown bread, including labour and ingredients, is R3,50. The brown bread is sold at R6,00 a loaf. 3.1 If one loaf of brown bread requires 450 g of flour, determine the maximum
number of loaves of brown bread that can be baked from a 12,5 kg bag of flour. (4)
3.2 The table below shows the weekly cost of making the bread.
TABLE 1: Weekly cost of making brown bread Number of loaves 0 40 80 120 160 B
300 Total cost (in rand) 400 540 680 A 960 1
240 1 450
The formula used to calculate the total cost per week is: Total cost per week = Fixed weekly cost + (number of loaves of bread × cost per loaf) Use the given formula to determine the values of A and B in TABLE 1. (4)
3.3 The table below shows the weekly income from selling the bread.
TABLE 2: Weekly income received from selling bread Number of loaves 0 40 120 150 D 250 300 Total income (in rand) 0 240 C 900 960 1
500 1 800
Determine the values of C and D in TABLE 2. (4)
3.4 Use the values from TABLE 1 and TABLE 2 to draw TWO straight line graphs on the same grid using ANNEXURE A, showing the total COST per week of making bread and the INCOME per week
© Gauteng Department of Education
20
from selling bread. Clearly label the graphs 'COSTS' and ‘INCOME'. (8)
3.5 Use the tables or the graph drawn on ANNEXURE A to answer the following questions.
3.5.1 How many loaves of bread must they sell to break even and describe what is happening at the break-even point? (3) 3.5.2 What income would they receive if 230 loaves were sold? (2) 3.5.3 Estimate the number of loaves baked if the total cost is R840. (2) 3.6 Determine, by calculation, whether Ses'fikile High School will make a profit or a loss if they bake 300 loaves of bread during the week, but only sell 250 of these loaves of bread. (5)
[32]

© Gauteng Department of Education
21
ANNEXURE A QUESTION 3.4
INCOME AND COSTS
Number of loaves of bread
Amount in rand
© Gauteng Department of Education
22
SECTION B: CONTENT NOTES Follow these steps when doing break-even point questions:
(1) Summarise the situation (2) Formulate equations for cost and income (3) Complete the table (4) Draw the graphs using the table (5) Analyse the graph
The graphs are always straight lines, BUT in the second homework question you will find a line that is not completely straight. Look out for questions which ask: ”How many products must be sold to start showing a profit.” The answer is NOT the break-even point, but actually the first integer AFTER the break-even point. START-UP COSTS: Costs that need to be paid before the business starts to operate, eg: stoves, fridges (small bakery); welding machine (burglar bar business). OPERATING COSTS: Costs that the business have to pay regularly while the business is operating. PRODUCTION COSTS: Costs that result directly from the production or supply or service. BREAK-EVEN POINT: Where income and costs are equal for a certain number of products. PROFIT: When the income is higher than the costs. (higher than the break-even point) LOSS: When the costs are higher than the income (the break-even point is not reached yet). Before the exams you must definitely practise these questions, as they often carry many marks.
© Gauteng Department of Education
23
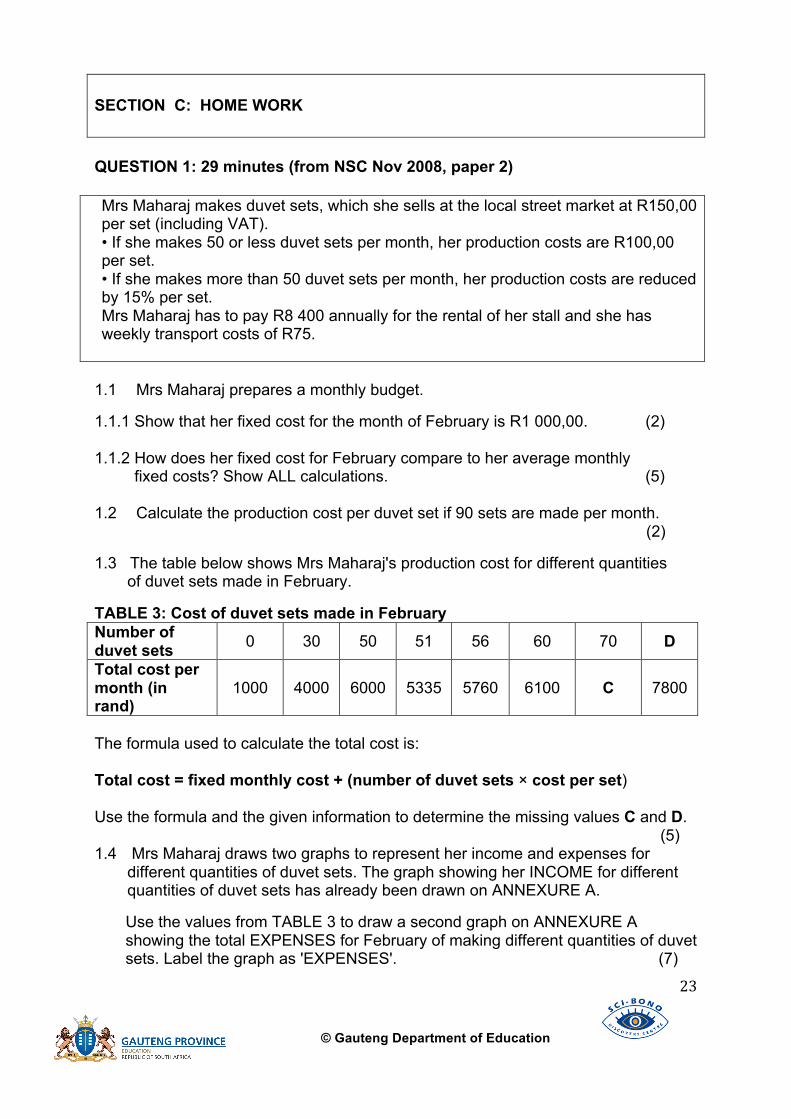
SECTION C: HOME WORK QUESTION 1: 29 minutes (from NSC Nov 2008, paper 2) Mrs Maharaj makes duvet sets, which she sells at the local street market at R150,00 per set (including VAT). • If she makes 50 or less duvet sets per month, her production costs are R100,00 per set. • If she makes more than 50 duvet sets per month, her production costs are reduced by 15% per set. Mrs Maharaj has to pay R8 400 annually for the rental of her stall and she has weekly transport costs of R75.
1.1 Mrs Maharaj prepares a monthly budget.
1.1.1 Show that her fixed cost for the month of February is R1 000,00. (2) 1.1.2 How does her fixed cost for February compare to her average monthly fixed costs? Show ALL calculations. (5) 1.2 Calculate the production cost per duvet set if 90 sets are made per month.
(2)
1.3 The table below shows Mrs Maharaj's production cost for different quantities of duvet sets made in February.
TABLE 3: Cost of duvet sets made in February Number of duvet sets 0 30 50 51 56 60 70 D
Total cost per month (in rand)
1000 4000 6000 5335 5760 6100 C 7800
The formula used to calculate the total cost is: Total cost = fixed monthly cost + (number of duvet sets × cost per set) Use the formula and the given information to determine the missing values C and D.
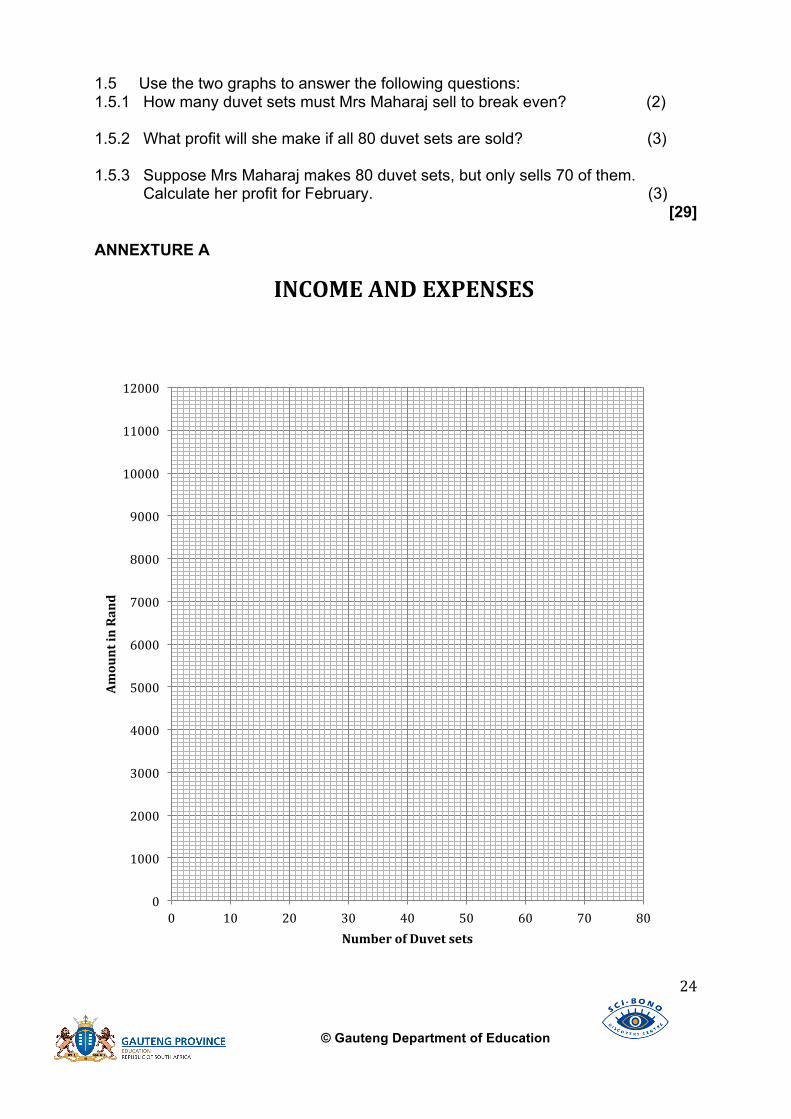
(5) 1.4 Mrs Maharaj draws two graphs to represent her income and expenses for
different quantities of duvet sets. The graph showing her INCOME for different quantities of duvet sets has already been drawn on ANNEXURE A.
Use the values from TABLE 3 to draw a second graph on ANNEXURE A showing the total EXPENSES for February of making different quantities of duvet sets. Label the graph as 'EXPENSES'. (7)
© Gauteng Department of Education
24
1.5 Use the two graphs to answer the following questions: 1.5.1 How many duvet sets must Mrs Maharaj sell to break even? (2) 1.5.2 What profit will she make if all 80 duvet sets are sold? (3) 1.5.3 Suppose Mrs Maharaj makes 80 duvet sets, but only sells 70 of them. Calculate her profit for February. (3)
[29] ANNEXTURE A
0
1000
2000
3000
4000
5000
6000
7000
8000
9000
10000
11000
12000
0 10 20 30 40 50 60 70 80
Amount in Rand
Number of Duvet sets
INCOME AND EXPENSES
© Gauteng Department of Education
25
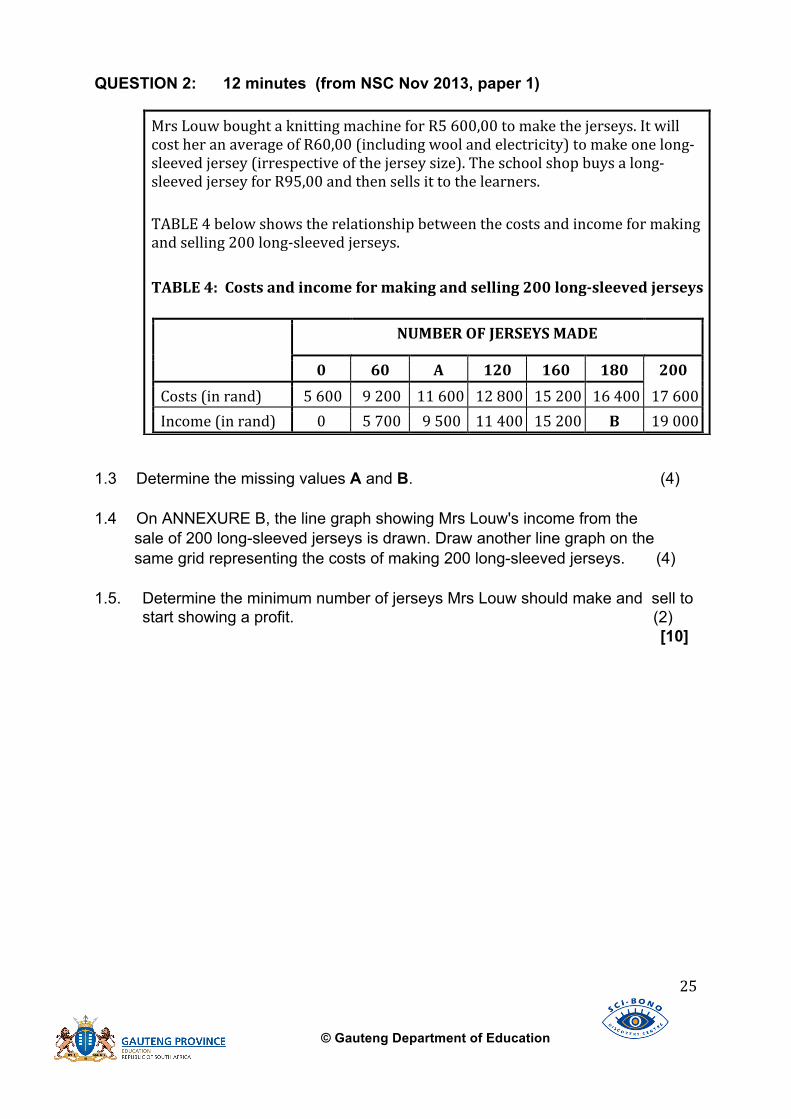
QUESTION 2: 12 minutes (from NSC Nov 2013, paper 1)
1.3 Determine the missing values A and B. (4) 1.4 On ANNEXURE B, the line graph showing Mrs Louw's income from the sale of 200 long-sleeved jerseys is drawn. Draw another line graph on the same grid representing the costs of making 200 long-sleeved jerseys. (4) 1.5. Determine the minimum number of jerseys Mrs Louw should make and sell to
start showing a profit. (2) [10]
Mrs Louw bought a knitting machine for R5 600,00 to make the jerseys. It will cost her an average of R60,00 (including wool and electricity) to make one long-‐sleeved jersey (irrespective of the jersey size). The school shop buys a long-‐sleeved jersey for R95,00 and then sells it to the learners. TABLE 4 below shows the relationship between the costs and income for making and selling 200 long-‐sleeved jerseys. TABLE 4: Costs and income for making and selling 200 long-‐sleeved jerseys
NUMBER OF JERSEYS MADE
0 60 A 120 160 180 200 Costs (in rand) 5 600 9 200 11 600 12 800 15 200 16 400 17 600 Income (in rand) 0 5 700 9 500 11 400 15 200 B 19 000

© Gauteng Department of Education
26
ANNEXTURE B TABLE 4: Costs for making and selling 200 long-sleeved jerseys
Number of jerseys made
0 60 A 120 160 180 200
Costs (in rand) 5 600 9 200 11 600
12 800
15 200
16 400
17 600
COSTS AND INCOME FOR MAKING 200 LONG-SLEEVED JERSEYS
Number of long-‐sleeved jerseys
Amount in rand

© Gauteng Department of Education
27
SECTION D: EXAM QUESTIONS SOLUTIONS QUESTION 1 – SESSION 2
1.1
80 1480
0 1350
1 1
1 1 (4)
1.2
INCOME starts in (0;0) INCOME goes to end of grid INCOME goes through (10;900) COST goes through (10;780) COST points connected COST both lines labelled
(6)
1.3 Break-‐even point 1
1.4 It is where costs and number of sandalsare equal 2
1.5 5 and more 2
1.6.1 On the graph at 17 pairs:
1
1
0
500
1000
1500
2000
0 5 10 15 20
RAND
PAIRS OF SANDALS
JOHN'S STALL
© Gauteng Department of Education
28
Or
On the graph shown:
1.6.2 1530 – 1270 AS PER DRAWN GRAPH
=R260
1 1 1
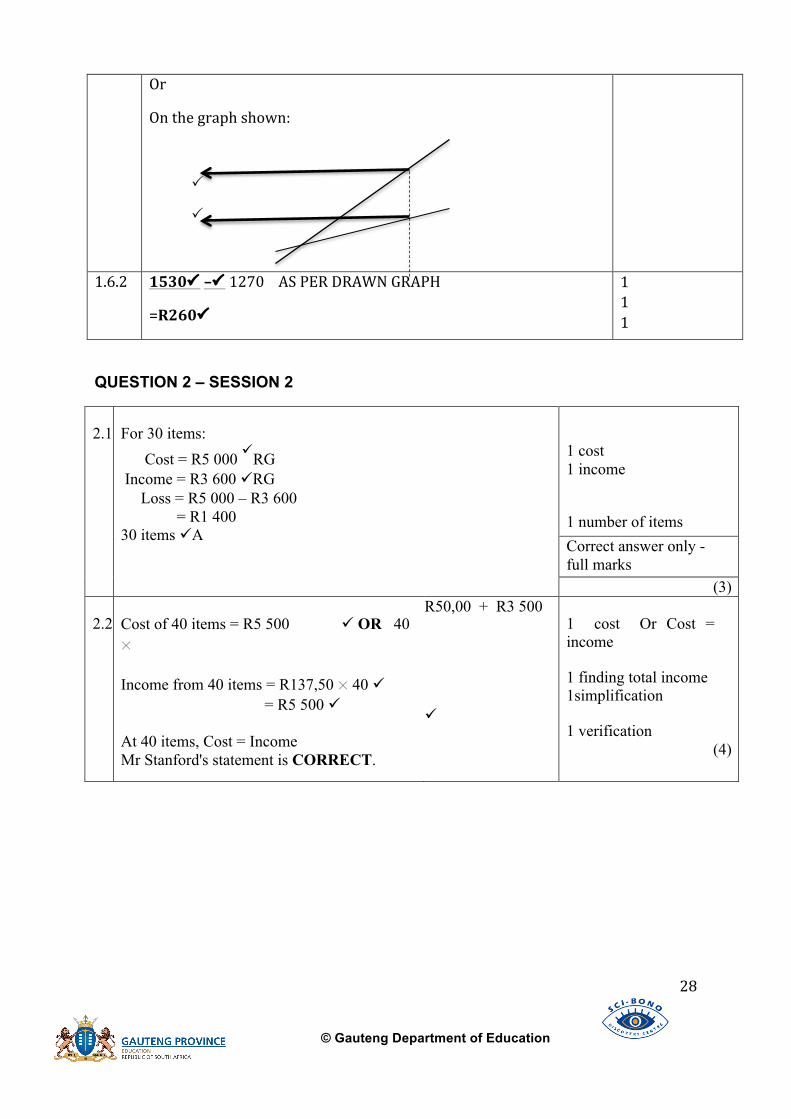
QUESTION 2 – SESSION 2
2.1
For 30 items: Cost = R5 000 RG Income = R3 600 RG Loss = R5 000 – R3 600 = R1 400 30 items A
1 cost 1 income 1 number of items Correct answer only - full marks
(3) 2.2
Cost of 40 items = R5 500 OR 40 × Income from 40 items = R137,50 × 40 = R5 500 At 40 items, Cost = Income Mr Stanford's statement is CORRECT.
R50,00 + R3 500
1 cost Or Cost = income 1 finding total income 1simplification 1 verification
(4)
© Gauteng Department of Education
29
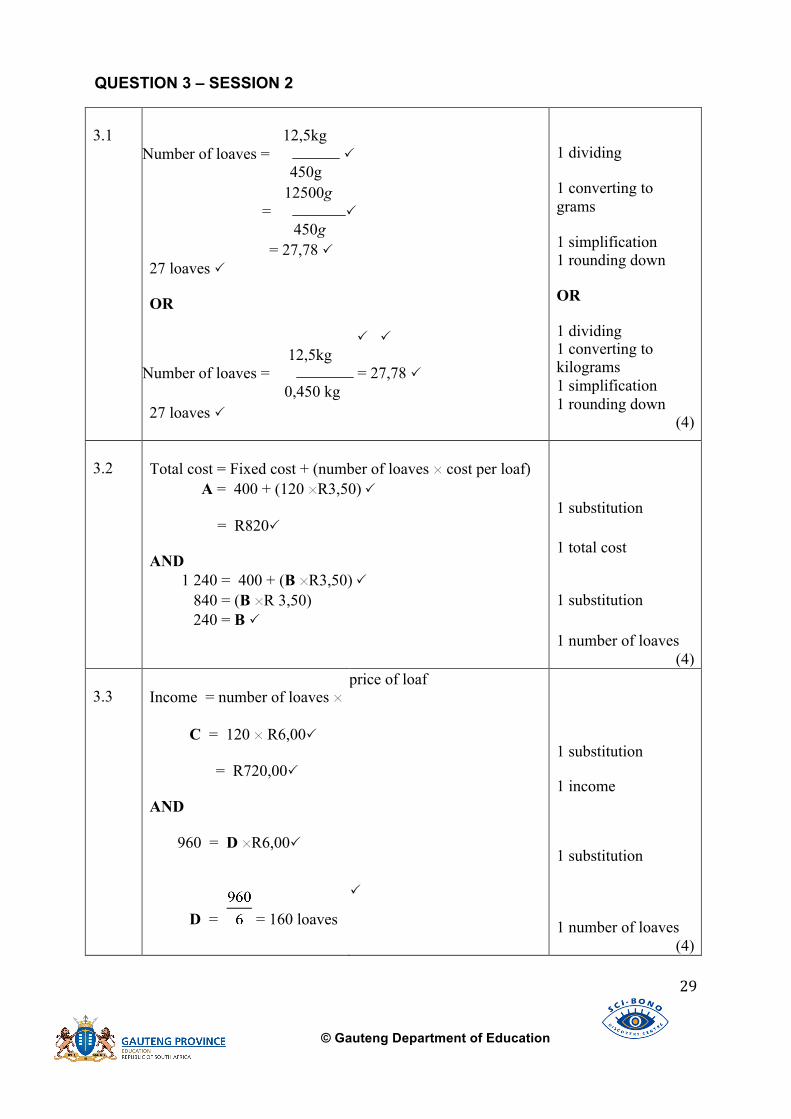
QUESTION 3 – SESSION 2
3.1
12,5kg
Number of loaves = 450g
12500g =
450g = 27,78 27 loaves OR
12,5kg
Number of loaves = = 27,78 0,450 kg
27 loaves
1 dividing 1 converting to grams 1 simplification 1 rounding down OR 1 dividing 1 converting to kilograms 1 simplification 1 rounding down
(4)
3.2
Total cost = Fixed cost + (number of loaves × cost per loaf) A = 400 + (120 ×R3,50) = R820 AND
1 240 = 400 + (B ×R3,50) 840 = (B ×R 3,50) 240 = B
1 substitution 1 total cost 1 substitution 1 number of loaves
(4) 3.3
Income = number of loaves × C = 120 × R6,00
= R720,00 AND 960 = D ×R6,00
D = = 160 loaves
price of loaf
1 substitution
1 income
1 substitution
1 number of loaves (4)
© Gauteng Department of Education
30
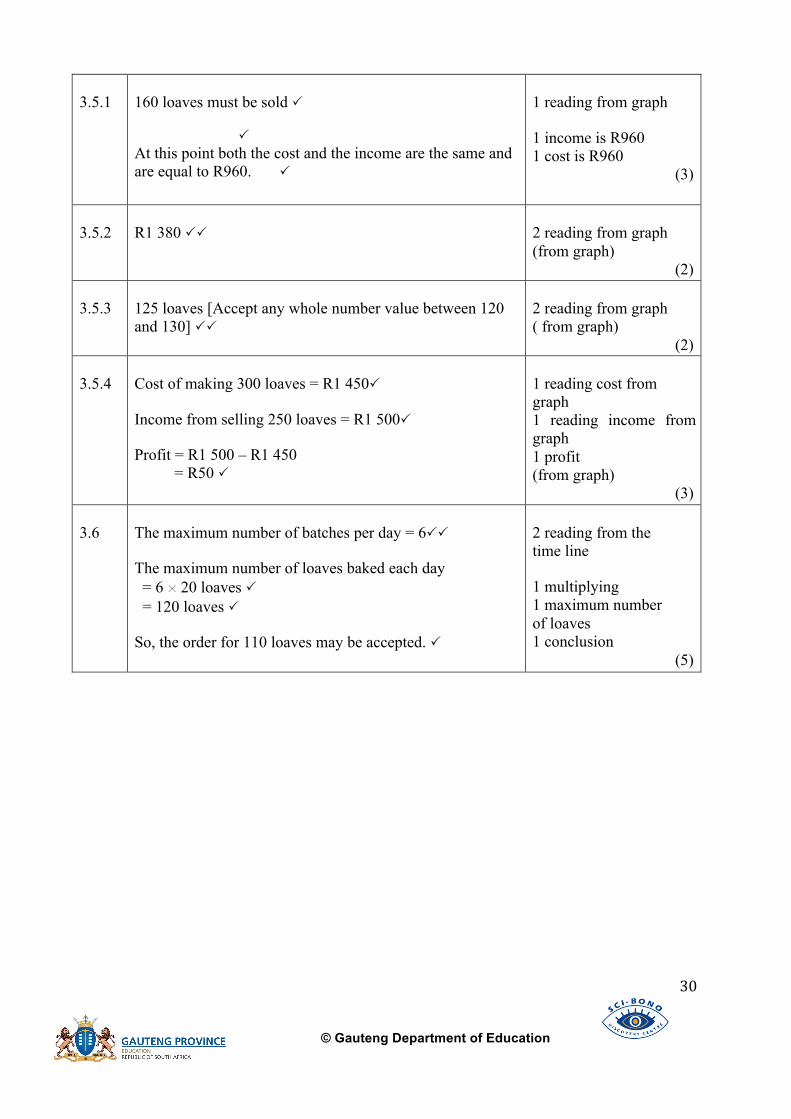
3.5.1
160 loaves must be sold At this point both the cost and the income are the same and are equal to R960.
1 reading from graph 1 income is R960 1 cost is R960
(3)
3.5.2
R1 380
2 reading from graph (from graph)
(2) 3.5.3
125 loaves [Accept any whole number value between 120 and 130]
2 reading from graph ( from graph)
(2) 3.5.4
Cost of making 300 loaves = R1 450 Income from selling 250 loaves = R1 500 Profit = R1 500 – R1 450 = R50
1 reading cost from graph 1 reading income from graph 1 profit (from graph)
(3) 3.6
The maximum number of batches per day = 6 The maximum number of loaves baked each day = 6 × 20 loaves = 120 loaves So, the order for 110 loaves may be accepted.
2 reading from the time line 1 multiplying 1 maximum number of loaves 1 conclusion
(5)

© Gauteng Department of Education
31
SESSION 3 TOPIC: FINANCES: TARIFF SYSTEMS
LEARNER NOTES: • One often has to make choices between different tariff systems to live
economically. • By using graphs you can easily SEE which choice to make. • These graphs are similar to the INCOME and COST graphs of session 2,
BUT now you are not determining profit or loss of a business, you are now using the graphs to find the BEST OPTION for yourself..
• You will draw two or MORE graphs on the grid, and where these lines INTERSECT, (the break-even points for the 2 lines involved), the situation depicted by the graphs has a “change”.
• Using this method you can determine which investment is the best, OR which cell phone contract is the best etc
SECTION A: TYPICAL EXAM QUESTIONS QUESTION 1: 34 minutes (from NSC NOV 2013 paper 2)
1.1 Interpret the horizontal part of the line graph for Option A (2) 1.2 Payment Option B starts at point P.
(a) Explain why point P is represented by an open circle on the graph. (2) (b) Describe in detail the cost of driving lessons if option B is used. (3)
1.3 The graphs intersect at points Q and R. Interpret the graphs at point Q. (2) 1.4 Zaheera budgeted R1 200 for her driving lessons. Explain which option would be better for:
© Gauteng Department of Education
32
(a) Zaheera (2) (b) Toni (2)
1.5 In an attempt to further reduce the total cost of her driving lessons, Zaheera asks a friend to teach her some basic driving skills. After a series of free lessons with her friend, she realises that she only requires 6 hours of lessons from a driving school.
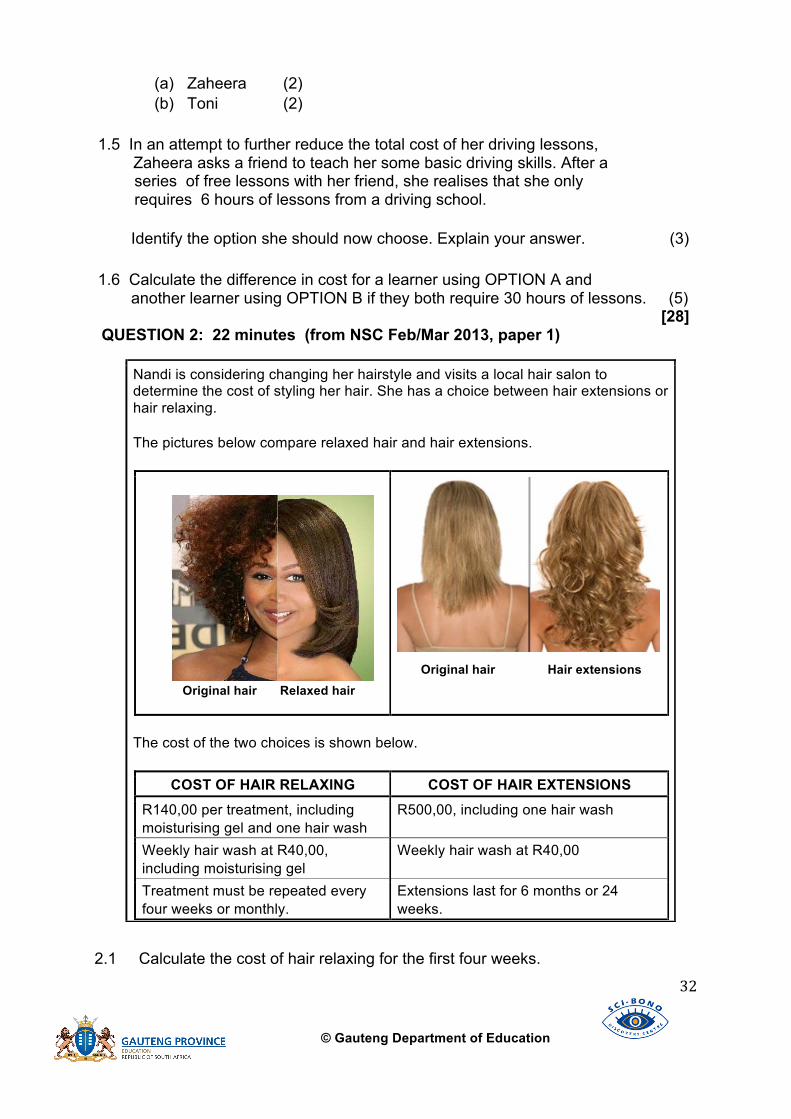
Identify the option she should now choose. Explain your answer. (3) 1.6 Calculate the difference in cost for a learner using OPTION A and another learner using OPTION B if they both require 30 hours of lessons. (5) [28] QUESTION 2: 22 minutes (from NSC Feb/Mar 2013, paper 1)
2.1 Calculate the cost of hair relaxing for the first four weeks.
Nandi is considering changing her hairstyle and visits a local hair salon to determine the cost of styling her hair. She has a choice between hair extensions or hair relaxing. The pictures below compare relaxed hair and hair extensions.
Original hair Relaxed hair
Original hair Hair extensions
The cost of the two choices is shown below.
COST OF HAIR RELAXING COST OF HAIR EXTENSIONS R140,00 per treatment, including moisturising gel and one hair wash
R500,00, including one hair wash
Weekly hair wash at R40,00, including moisturising gel
Weekly hair wash at R40,00
Treatment must be repeated every four weeks or monthly.
Extensions last for 6 months or 24 weeks.

© Gauteng Department of Education
33
Use the formula: Cost for the first four weeks (in rand) = 40 + (3 × cost of a hair wash)
(2) 2.2 Calculate the cost of hair extensions for the first four weeks. Use the formula: Cost for the first four weeks (in rand) = 500 + (3 × cost of a hair wash) (2) 2.3
a) Calculate the missing values A and B. (4) b) Which hairstyle will be cheaper over the first 21 weeks? (2) c) Calculate how much more Nandi will pay over a 37-week
period for relaxing her hair compared to wearing hair extensions. (2) 2.4 The graph showing the cost of hair relaxing over a period of 9 months is
given on ANNEXURE A. Draw a labelled line graph of the cost of hair extensions over a period of 37 weeks on ANNEXURE A. (6)
[20]
Nandi wants to convince her father that in the long run, the cost of hair extensions will be cheaper than the cost of hair relaxing. The accumulated cost for each choice over a 37-week period is given in the table below. TABLE 3: Comparison of accumulated costs after the first week of each month Time period (in weeks)
1 5 B 21 25 29 37
Accumulated cost of hair relaxing (in rand)
140 A 920 1 440 1 700 1 960 2 480
Accumulated cost of hair extensions (in rand)
500 660 980 1 300 1 920 2 080 2 400

© Gauteng Department of Education
34
ANNEXURE A QUESTION 2.3(d)
COMPARISON OF ACCUMULATED COSTS
Number of weeks
Cost in rand
© Gauteng Department of Education
35
SECTION B: CONTENT NOTES The steps for doing these questions are the same as for break-even point questions
(1) Summarise the situation (2) Formulate the equations (3) Complete the table (4) Draw graphs using the table (5) Analyse the situation by using the graphs
The points of intersection divide the area of the grid into REGIONS – on the grid these are bounded by the points of intersection. In these REGIONS different advantages and disadvantages for the graphs apply. To describe the regions you need to revise inequality notation and terminology:
< less than (always used for the first region) > more than (always used for the last region) 𝑏𝑒𝑡𝑤𝑒𝑒𝑛 (always used for the other regions)
Graphs in this section of the work do not always have to by straight lines, it can also be a curve. You need to know how to write down the coordinates of the points of intersection. Eg. (the x-value; the y-value). So when interpretation is asked, you first give the interval (eg: less than 25 days), and then state the best option (eg Contact A is the cheapest).
© Gauteng Department of Education
36
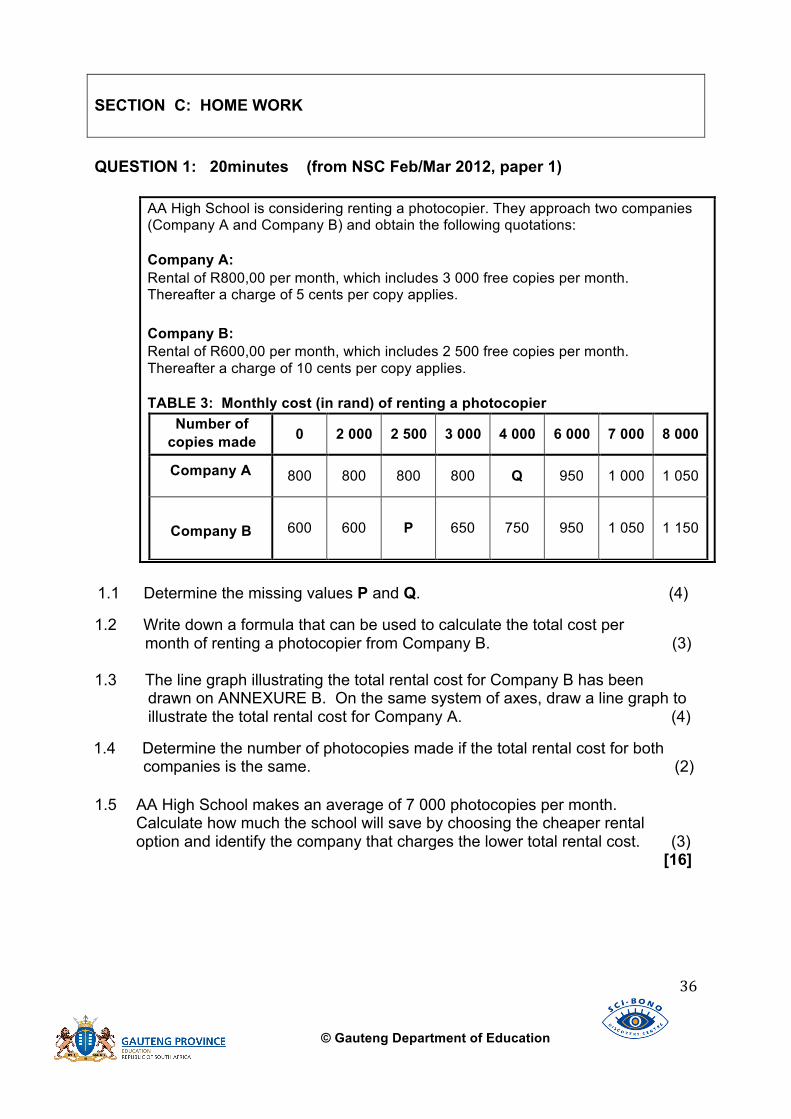
SECTION C: HOME WORK QUESTION 1: 20minutes (from NSC Feb/Mar 2012, paper 1)
1.1 Determine the missing values P and Q. (4)
1.2 Write down a formula that can be used to calculate the total cost per month of renting a photocopier from Company B. (3)
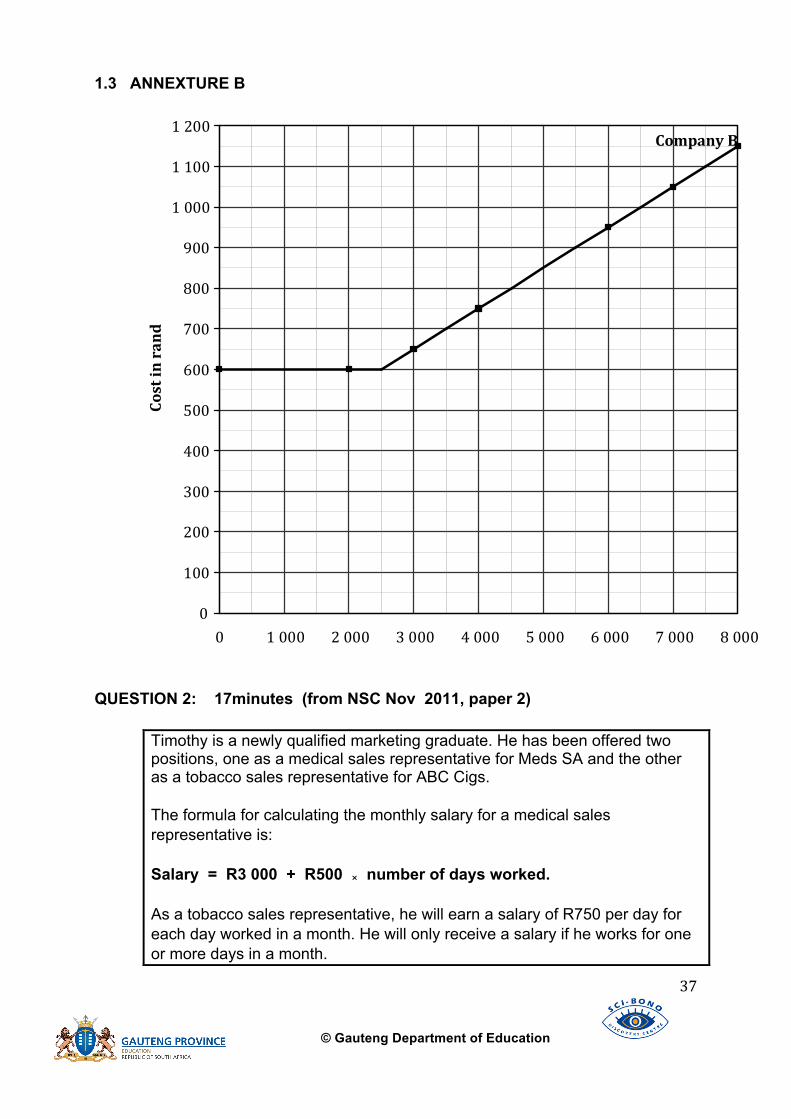
1.3 The line graph illustrating the total rental cost for Company B has been drawn on ANNEXURE B. On the same system of axes, draw a line graph to illustrate the total rental cost for Company A. (4)
1.4 Determine the number of photocopies made if the total rental cost for both companies is the same. (2) 1.5 AA High School makes an average of 7 000 photocopies per month.
Calculate how much the school will save by choosing the cheaper rental option and identify the company that charges the lower total rental cost. (3) [16]
AA High School is considering renting a photocopier. They approach two companies (Company A and Company B) and obtain the following quotations: Company A: Rental of R800,00 per month, which includes 3 000 free copies per month. Thereafter a charge of 5 cents per copy applies. Company B: Rental of R600,00 per month, which includes 2 500 free copies per month. Thereafter a charge of 10 cents per copy applies. TABLE 3: Monthly cost (in rand) of renting a photocopier
Number of copies made 0 2 000 2 500 3 000 4 000 6 000 7 000 8 000
Company A
800 800 800 800 Q 950 1 000 1 050
Company B
600 600 P 650 750 950 1 050 1 150
© Gauteng Department of Education
37
1.3 ANNEXTURE B
QUESTION 2: 17minutes (from NSC Nov 2011, paper 2)
Timothy is a newly qualified marketing graduate. He has been offered two positions, one as a medical sales representative for Meds SA and the other as a tobacco sales representative for ABC Cigs. The formula for calculating the monthly salary for a medical sales representative is: Salary = R3 000 + R500 × number of days worked. As a tobacco sales representative, he will earn a salary of R750 per day for each day worked in a month. He will only receive a salary if he works for one or more days in a month.
0
100
200
300
400
500
600
700
800
900
1 000
1 100
1 200
3 000 4 000 5 000 6 000 7 000 8 000 0 1 000 2 000
Cost in rand
Company B
© Gauteng Department of Education
38
2.1 Write down a formula that can be used to calculate the monthly salary of a tobacco sales representative. (2)
2.2 Draw TWO line graphs on the same grid on ANNEXURE A to represent the monthly salaries for both the positions of medical and tobacco sales representatives. Clearly label each graph. (8) 2.3 Use the graphs drawn on ANNEXURE A, or otherwise, to answer the
following.
(a) After how many working days will the two salaries be the same? (2) (b) Suppose Timothy worked at Meds SA for 18 days. How many days
would he have to work at ABC Cigs to earn the same salary? (2)
[14]

© Gauteng Department of Education
39
2.2 ANNEXTURE A
SECTION D: EXAM QUESTIONS SOLUTIONS
QUESTION 1
SALARIES FOR THE TWO POSITIONS
0
2 000
4 000
6 000
8 000
10 000
12 000
14 000
16 000
0 5 10 15 20 Number of days worked
Amount earned in rand

© Gauteng Department of Education
40
1.1
No change in the cost after 15 hours.
OR Constant cost from 15 hours onwards.
OR For 15 hours or more of driving lessons there is a fixed rate of R1 500.
2 correct description
(2)
1.2 (a)
No payment for zero lessons.
OR Payment will only be made once the driving lessons start.
2 correct description
(2)
1.2 (b)
• A learner driver pays a basic amount of R600 for the first two hours
• Then R50 per hour for every additional hour.
1 R600 1 time period 1 rate in rand
(3)
1.3
At point Q, both Options cost the same at the same time.
OR There were 10 hours of driving that cost R1 000 for both Options.
1 same cost 1 same time
OR 1 time 1 cost Accept " breakeven point " ONLY 1 mark
(2)
1.4 (a)
With Option B Zaheera will get 14 hours of driving lessons.
OR Zaheera must choose Option B to get 2 more hours of driving lessons than in Option A.
1 correct option 1 justification
(2)

© Gauteng Department of Education
41
1.4 (b)
Toni would benefit more from Option A. She still gets R1 200 but in a shorter time than Option B
OR Option A, she will have 2 hours to train someone else.
1 correct option 1 justification
(2)
1.5
Option A is cheaper for Zaheera.
OR She must choose Option A she will pay R600 for the driving lessons.
1 correct option 2 justification
(3)

© Gauteng Department of Education
42
1.6
Option A:
Cost for 30 hours = R1 500 Option B: Cost for 30 hours = R600 + (R50 per hour × 28 hours) = R600 + R1 400 = R2 000 � Difference in cost = R2 000 – R1 500 = R500
OR
Option A:
Cost for 30 hours = R1 500 Option B: Cost for 30 hours = R600 + (R100 per two hours × 14 two hour periods) = R600 + R1 400 = R2 000 � Difference in cost = R2 000 – R1 500 = R500
OR Option B: For 22 hours it costs R1 600
It is increasing with R100 every 2 hours � Extra cost = 4 × R100 = R400 Cost for 30 hours = R1 600 + R400 = R2 000 Option A:
Cost for 30 hours = R1 500 � Difference in cost = R2 000 – R1 500 = R500
1 cost option A 1 basic rate 1 rate multiplied by hours 1 cost 1 difference in cost
OR
1 cost option A 1 basic rate 1 rate multiplied by period 1 cost 1 difference in cost
OR
1 rate 1 extra cost 1 cost
1 cost option A
1 difference in cost

© Gauteng Department of Education
43
QUESTION 2 – SESSION 3 2.1
Cost for the first four weeks (in rand) = 140 + (3 × 40) = 260
1 substitution 1 simplification
(2)
2.2
Cost for the first four weeks (in rand) = 500 + (3 × 40) = 620
1 substitution 1 simplification
(2) 2.3(a)
A = R140 + R260 A = R400
= R400 OR 920 = 400 + B × 40
500 + 40 × (B – 1) = 980
520 = B × 40 OR 40 (B – 1) = 480
B = 13 B-‐1 =12 B = 13
OR
B=13
OR
140; 400; 660; 920; 1 180; 1 440; 1 700 So, B = 1 + 3 × 4 = 13
1 substitution 1 value of A
OR 2 reading from graph 1 substitution 1 value of B
OR 2 reading B from graph
OR 1 list of values 1 value of B
(4)
2.3(b)
Hair extensions
2 conclusion
(2) 3.3(c)
R2 480 – R2 400 = R80
1 correct values 1 simplification
(2)

© Gauteng Department of Education
44
3.3(d)
COMPARISON OF ACCUMULATED COSTS
1 (1 ; 500) 1 (25 ; 1 920) 1 (29 ; 2 080) 1 (37 ; 2 480) 1 joining the points 1 labelling the graph
(6)

© Gauteng Department of Education
45
SESSION 4 TOPIC: MEASUREMENT: CONVERSIONS USE OF FORMULAE
LEARNER NOTES: • In Mathematical Literacy most of the calculations are based on direct
proportion (when you buy MORE apples, you will pay MORE money) • These questions can sometimes be very short BUT remember when the
question is worth more than ONE mark, you are required to show STEPS. • Although some of the memoranda attached to your learner notes state you
can have all the marks for ANSWER ONLY, this changed with CAPS and there will no longer be all the marks given for “answer only”
• Any conversions in which the metric system is used, you must know the relationships from memory. So do learn these well.
• When doing conversion between different systems the conversion factors or tables will be given.
• Conversions are a basic skill and is used in finances, data, measurement and map work.
• When using formulae we have some definite rules. • A formula has a left hand side, an equal sign and a right hand side. • The complete formulA must be written down, and NOT only the right hand
side of the equation. • The substitution that has to be done, MUST be shown, the best is to
always write them in brackets. • Using CAPS a lot of formulae such as area and volume will not be given
any more and you will have to learn them by heart.
SECTION A: TYPICAL EXAM QUESTIONS QUESTION 1: 36 minutes (from NSC 2013 papers)
1.1 10 mℓ of sugar weighs 8 g. Calculate the weight of 245 mℓ of sugar. (2)
1.2 A few weeks after the swimming competition, an Australian tourist who had been a spectator at the competition deposited 1 500 Australian dollars (AUD$) into the club's bank account as a donation. The bank converted this amount to rand as R14 595,00. Calculate the exchange rate, in rand per AUD$, used by the bank. (2)
1.3 The scale used on the layout plan is 1 : 58. Calculate the actual length of the table on the layout plan if its scaled length is 2,26 cm. (2)
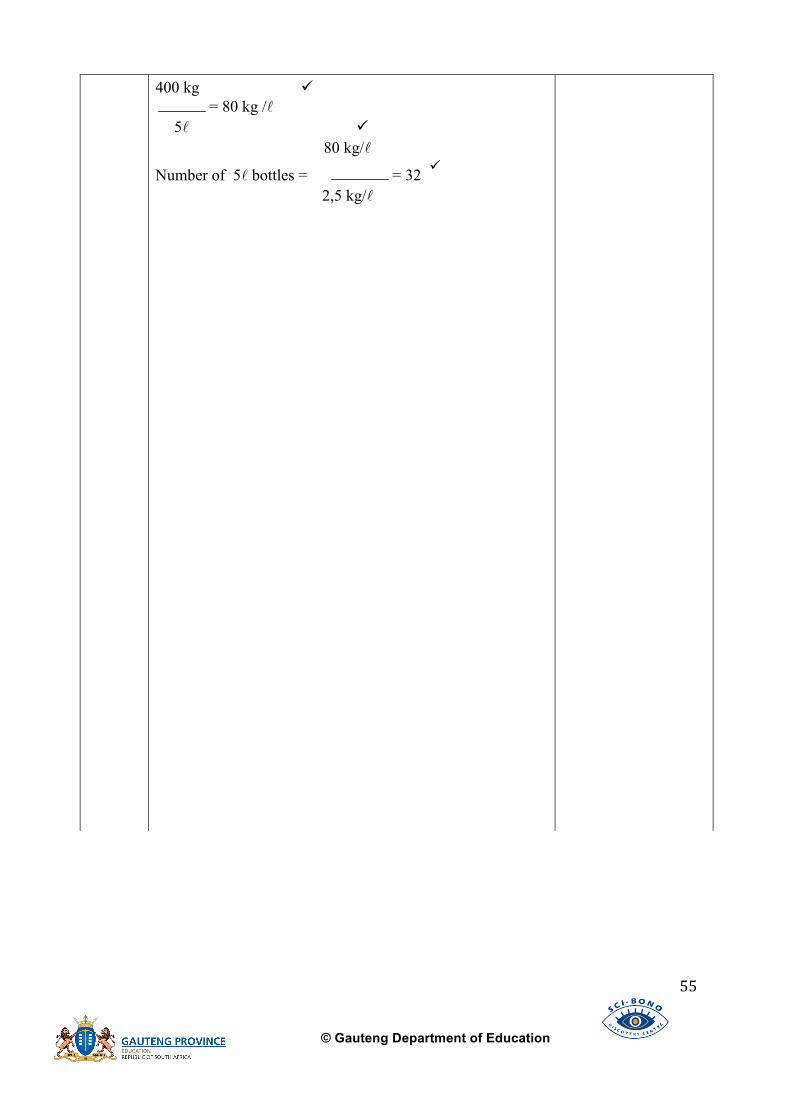
1.4 Approximately 2,5 kg of oranges are used to make 1 ℓ of juice. The juice is poured into 5 ℓ plastic bottles. Determine the number of 5 ℓ bottles of juice that can be made from 400 kg of oranges. (3)
© Gauteng Department of Education
46
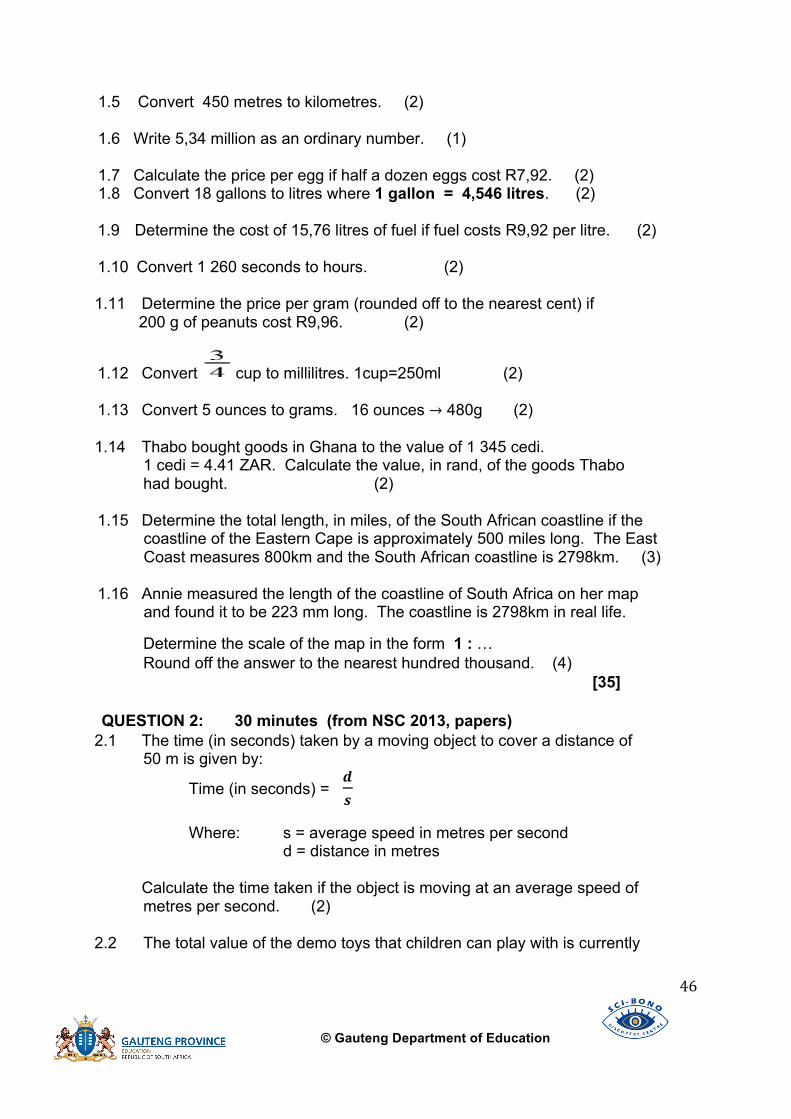
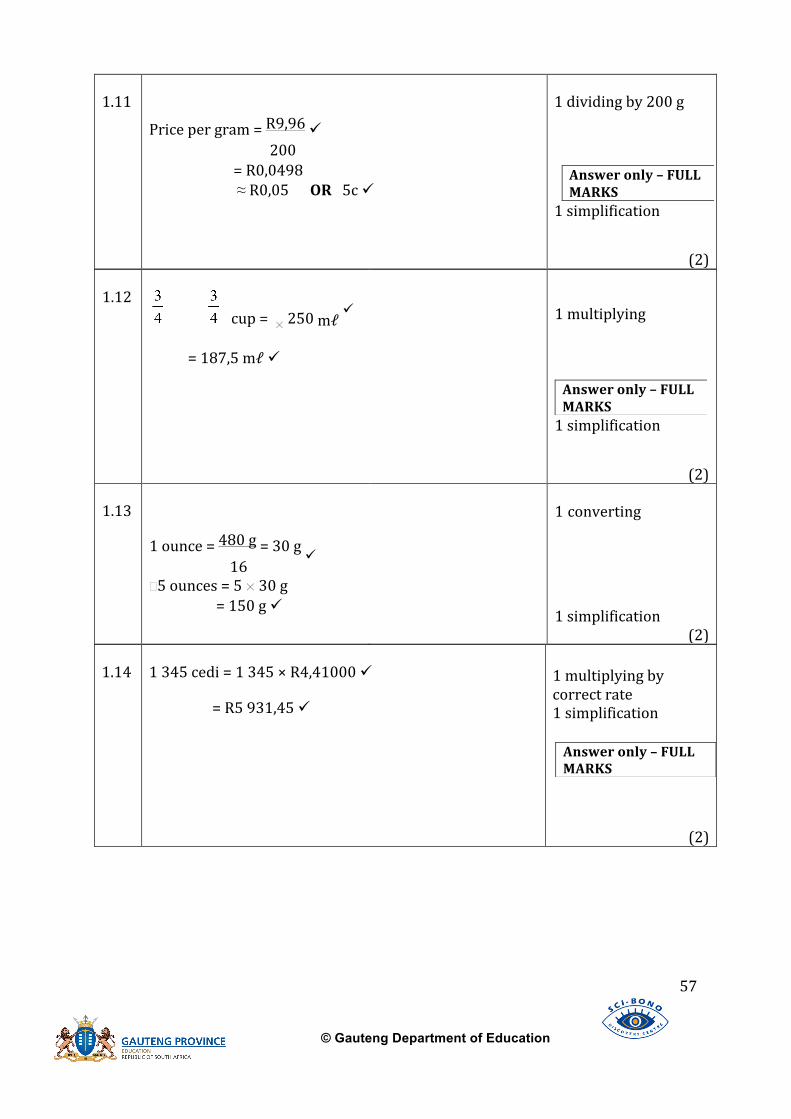
1.5 Convert 450 metres to kilometres. (2) 1.6 Write 5,34 million as an ordinary number. (1) 1.7 Calculate the price per egg if half a dozen eggs cost R7,92. (2) 1.8 Convert 18 gallons to litres where 1 gallon = 4,546 litres. (2) 1.9 Determine the cost of 15,76 litres of fuel if fuel costs R9,92 per litre. (2) 1.10 Convert 1 260 seconds to hours. (2) 1.11 Determine the price per gram (rounded off to the nearest cent) if 200 g of peanuts cost R9,96. (2)
1.12 Convert cup to millilitres. 1cup=250ml (2) 1.13 Convert 5 ounces to grams. 16 ounces → 480g (2)
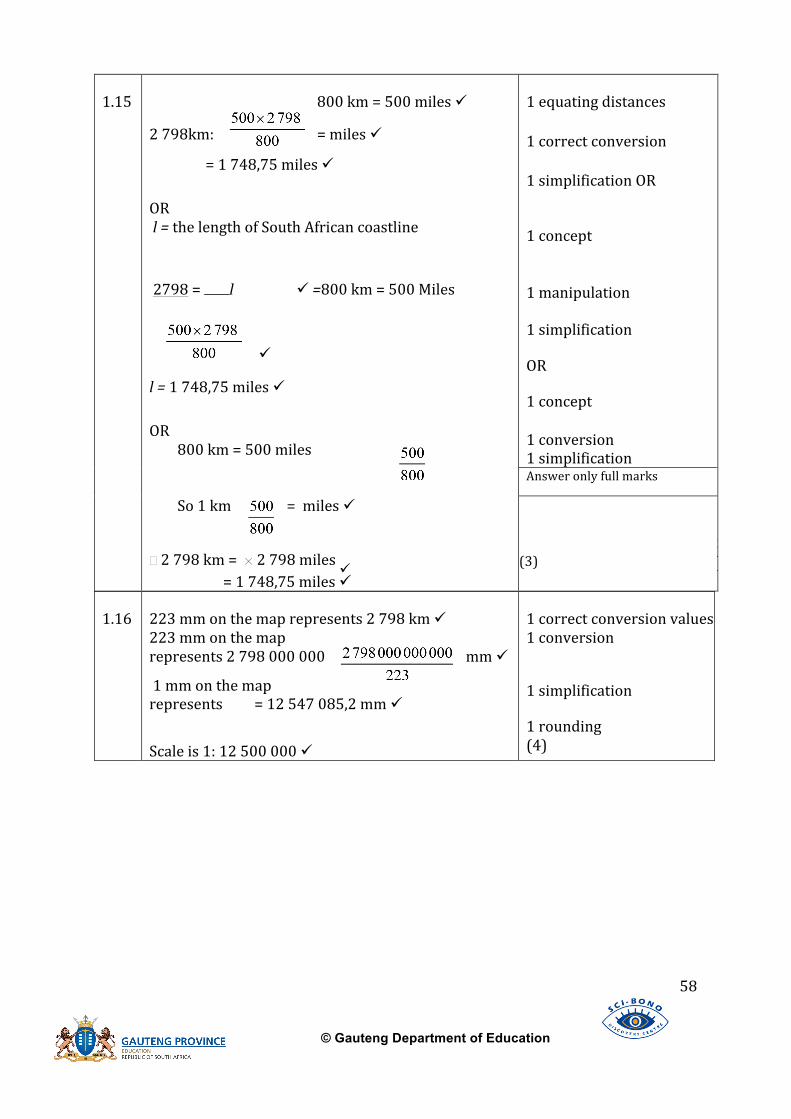
1.14 Thabo bought goods in Ghana to the value of 1 345 cedi. 1 cedi = 4.41 ZAR. Calculate the value, in rand, of the goods Thabo had bought. (2) 1.15 Determine the total length, in miles, of the South African coastline if the
coastline of the Eastern Cape is approximately 500 miles long. The East Coast measures 800km and the South African coastline is 2798km. (3)
1.16 Annie measured the length of the coastline of South Africa on her map and found it to be 223 mm long. The coastline is 2798km in real life.
Determine the scale of the map in the form 1 : … Round off the answer to the nearest hundred thousand. (4)
[35] QUESTION 2: 30 minutes (from NSC 2013, papers)
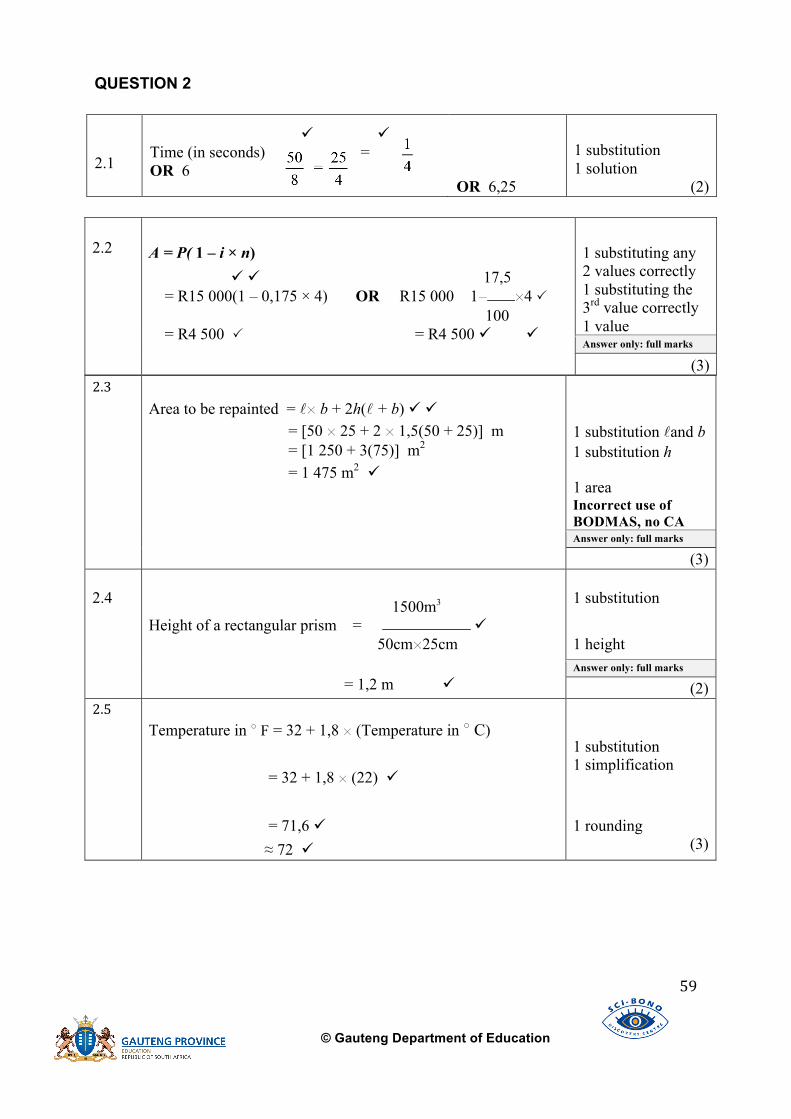
2.1 The time (in seconds) taken by a moving object to cover a distance of 50 m is given by:
Time (in seconds) = 𝒅𝒔
Where: s = average speed in metres per second
d = distance in metres
Calculate the time taken if the object is moving at an average speed of metres per second. (2) 2.2 The total value of the demo toys that children can play with is currently
© Gauteng Department of Education
47
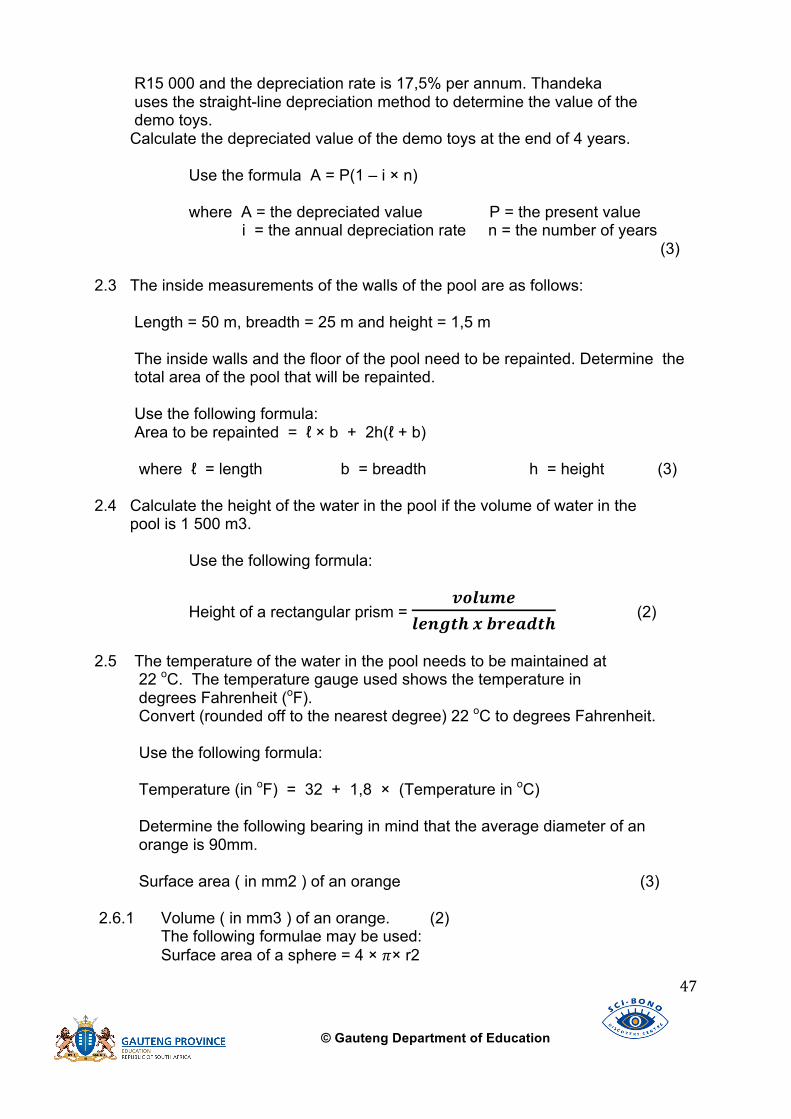
R15 000 and the depreciation rate is 17,5% per annum. Thandeka uses the straight-line depreciation method to determine the value of the demo toys. Calculate the depreciated value of the demo toys at the end of 4 years. Use the formula A = P(1 – i × n) where A = the depreciated value P = the present value i = the annual depreciation rate n = the number of years (3) 2.3 The inside measurements of the walls of the pool are as follows: Length = 50 m, breadth = 25 m and height = 1,5 m The inside walls and the floor of the pool need to be repainted. Determine the total area of the pool that will be repainted. Use the following formula: Area to be repainted = ℓ × b + 2h(ℓ + b) where ℓ = length b = breadth h = height (3) 2.4 Calculate the height of the water in the pool if the volume of water in the pool is 1 500 m3.
Use the following formula:
Height of a rectangular prism = 𝒗𝒐𝒍𝒖𝒎𝒆
𝒍𝒆𝒏𝒈𝒕𝒉 𝒙 𝒃𝒓𝒆𝒂𝒅𝒕𝒉 (2)
2.5 The temperature of the water in the pool needs to be maintained at 22 oC. The temperature gauge used shows the temperature in degrees Fahrenheit (oF). Convert (rounded off to the nearest degree) 22 oC to degrees Fahrenheit. Use the following formula: Temperature (in oF) = 32 + 1,8 × (Temperature in oC) Determine the following bearing in mind that the average diameter of an orange is 90mm. Surface area ( in mm2 ) of an orange (3) 2.6.1 Volume ( in mm3 ) of an orange. (2) The following formulae may be used: Surface area of a sphere = 4 × 𝜋× r2

© Gauteng Department of Education
48
2.6.2 Volume of a sphere = ×𝜋× r3 where 𝜋 = 3,14 and r = radius (3) 2.7 The cylindrical section of a basket has a height of 25 cm and a diameter of 30 cm. The space in the cylindrical basket not occupied by the oranges is 113 040 mm3. Franz states that a basket can hold at most 44 oranges. Verify, by showing ALL the necessary calculations, whether Franz's statement is correct. The following formula may be used: Volume of a cylinder = 𝜋 × r2 × h The average diameter of an orange is 90mm where 𝜋 = 3,14, r = radius and h = height (7) [28] SECTION B: CONTENT NOTES 1. CONVERSIONS
Try this method and you are guaranteed to always have conversions correct EXAMPLE Peter mixes cement. The mixture needs 13,1kg sand and 5,4kg cement. If he has 8kg of cement, how much sand must he put into the mixture?
METHOD WHAT TO DO 1. Write down the key to
your conversion 13,1kg sand →5,4 kg cement
2. Write down the other number BELOW the same name as in the 1st line
13,1kg sand →5,4 kg cement → 8kg cement
3. Take the last number you wrote down 8, multiply it with the number above-and-across from it 13,1 AND now divide by the number next to
÷ 13,1kg sand →5,4 kg cement × → 8kg cement
© Gauteng Department of Education
49
13,1 which is 5,4
4. What you find now is that you have an answer BUT it is on the WRONG side of your conversion. Therefor just write an = below the arrow and write the answer down again (the marker must be able to look at the last number to SEE that your answer is correct
13,1kg sand → 5,4 kg cement 19,41kg sand → 8kg cement = 19,41 kg sand
Remember the new CAPS syllabus does not supply formulae with questions as in the past. Key to conversions of Imperial systems will be given, BUT al the keys that has metric connotations must be known by memory. Also often used formula such as area and volume must be learned. 2. USING FORMULAE
• Always always write down the complete formula. • Even when a formula is given, the whole formula must be rewritten in the test
or exam. • When doing the substitution, do use brackets. • Formulae are usually for the calculation of something with a UNIT. Do write
down the units after the answer. It does not always count a mark, but sometimes it does, and you must not throw valuable marks away
SECTION C: HOME WORK QUESTION 1: 26 minutes (from NSC 2012 papers) 1.1 Convert 23,005 litres to millilitres. (2) 1.2 Determine the total price of 2,5 kilograms of meat costing R63,99 per kilogram. (2)
© Gauteng Department of Education
50
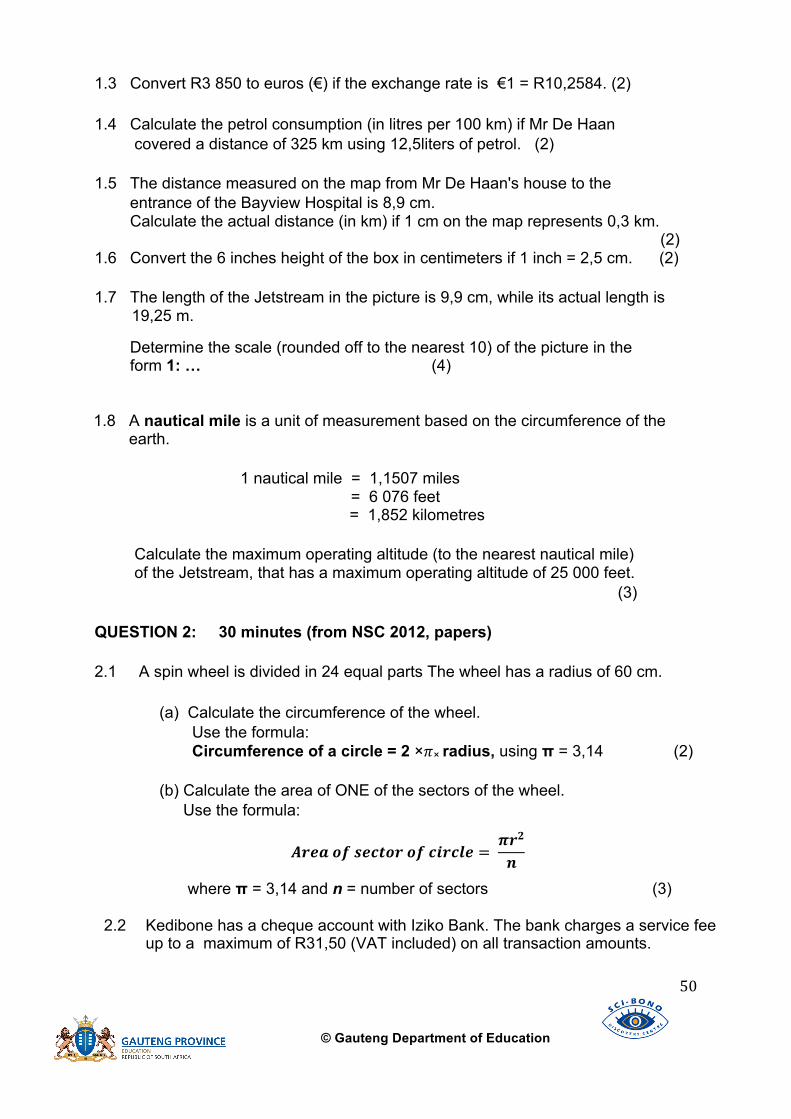
1.3 Convert R3 850 to euros (€) if the exchange rate is €1 = R10,2584. (2) 1.4 Calculate the petrol consumption (in litres per 100 km) if Mr De Haan covered a distance of 325 km using 12,5liters of petrol. (2) 1.5 The distance measured on the map from Mr De Haan's house to the entrance of the Bayview Hospital is 8,9 cm. Calculate the actual distance (in km) if 1 cm on the map represents 0,3 km. (2) 1.6 Convert the 6 inches height of the box in centimeters if 1 inch = 2,5 cm. (2) 1.7 The length of the Jetstream in the picture is 9,9 cm, while its actual length is
19,25 m.
Determine the scale (rounded off to the nearest 10) of the picture in the form 1: … (4) 1.8 A nautical mile is a unit of measurement based on the circumference of the earth. 1 nautical mile = 1,1507 miles = 6 076 feet = 1,852 kilometres Calculate the maximum operating altitude (to the nearest nautical mile) of the Jetstream, that has a maximum operating altitude of 25 000 feet. (3) QUESTION 2: 30 minutes (from NSC 2012, papers) 2.1 A spin wheel is divided in 24 equal parts The wheel has a radius of 60 cm.
(a) Calculate the circumference of the wheel. Use the formula: Circumference of a circle = 2 ×𝜋× radius, using π = 3,14 (2)
(b) Calculate the area of ONE of the sectors of the wheel. Use the formula:
𝑨𝒓𝒆𝒂 𝒐𝒇 𝒔𝒆𝒄𝒕𝒐𝒓 𝒐𝒇 𝒄𝒊𝒓𝒄𝒍𝒆 = 𝝅𝒓𝟐
𝒏
where π = 3,14 and n = number of sectors (3)
2.2 Kedibone has a cheque account with Iziko Bank. The bank charges a service fee up to a maximum of R31,50 (VAT included) on all transaction amounts.
© Gauteng Department of Education
51
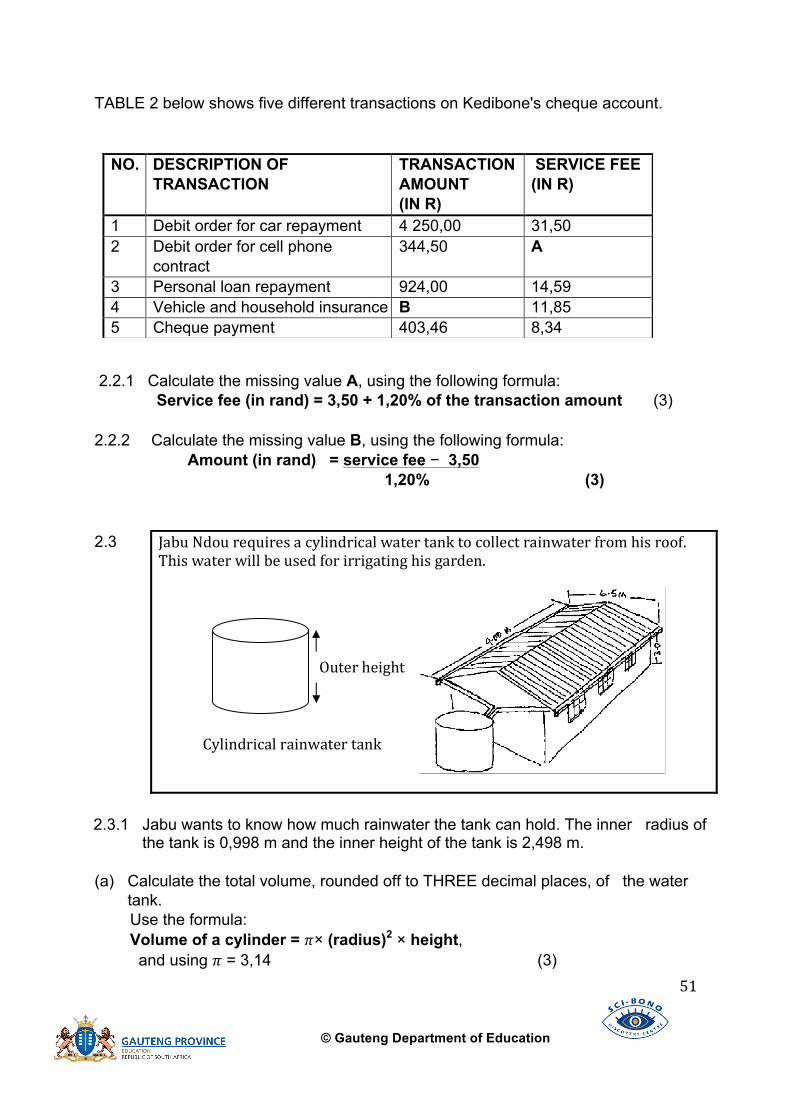
TABLE 2 below shows five different transactions on Kedibone's cheque account.
2.2.1 Calculate the missing value A, using the following formula: Service fee (in rand) = 3,50 + 1,20% of the transaction amount (3) (3) 2.2.2 Calculate the missing value B, using the following formula: Amount (in rand) = service fee − 3,50 1,20% (3) (3)
2.3.1 Jabu wants to know how much rainwater the tank can hold. The inner radius of the tank is 0,998 m and the inner height of the tank is 2,498 m. (a) Calculate the total volume, rounded off to THREE decimal places, of the water
tank. Use the formula: Volume of a cylinder = 𝜋× (radius)2 × height, and using 𝜋 = 3,14 (3) (3)
NO. DESCRIPTION OF TRANSACTION
TRANSACTION AMOUNT (IN R)
SERVICE FEE (IN R)
1 Debit order for car repayment 4 250,00 31,50 2 Debit order for cell phone
contract 344,50 A
3 Personal loan repayment 924,00 14,59 4 Vehicle and household insurance B 11,85 5 Cheque payment 403,46 8,34
Jabu Ndou requires a cylindrical water tank to collect rainwater from his roof. 2.3 This water will be used for irrigating his garden.
Cylindrical rainwater tank
Outer height
© Gauteng Department of Education
52
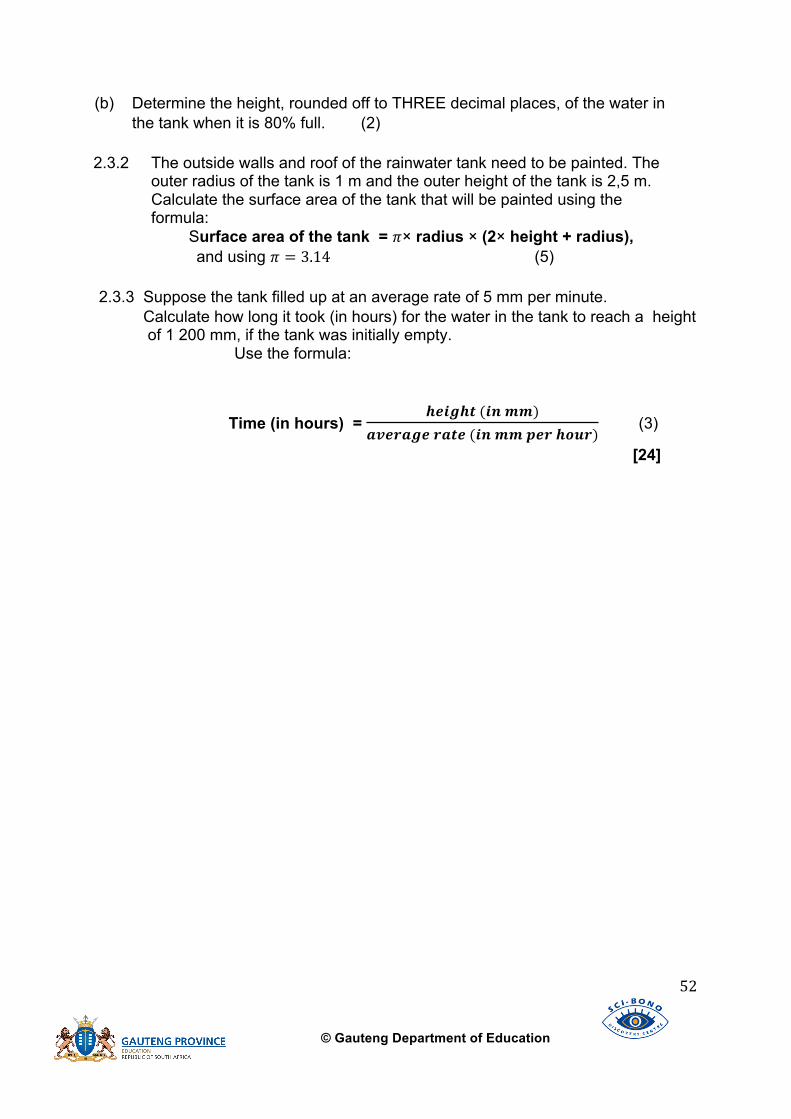
(b) Determine the height, rounded off to THREE decimal places, of the water in
the tank when it is 80% full. (2) 2.3.2 The outside walls and roof of the rainwater tank need to be painted. The outer radius of the tank is 1 m and the outer height of the tank is 2,5 m. Calculate the surface area of the tank that will be painted using the formula: Surface area of the tank = 𝜋× radius × (2× height + radius), and using 𝜋 = 3.14 (5) (5) 2.3.3 Suppose the tank filled up at an average rate of 5 mm per minute. Calculate how long it took (in hours) for the water in the tank to reach a height of 1 200 mm, if the tank was initially empty.
Use the formula:
Time (in hours) = 𝒉𝒆𝒊𝒈𝒉𝒕 (𝒊𝒏 𝒎𝒎)
𝒂𝒗𝒆𝒓𝒂𝒈𝒆 𝒓𝒂𝒕𝒆 (𝒊𝒏 𝒎𝒎 𝒑𝒆𝒓 𝒉𝒐𝒖𝒓) (3)
[24]
© Gauteng Department of Education
53
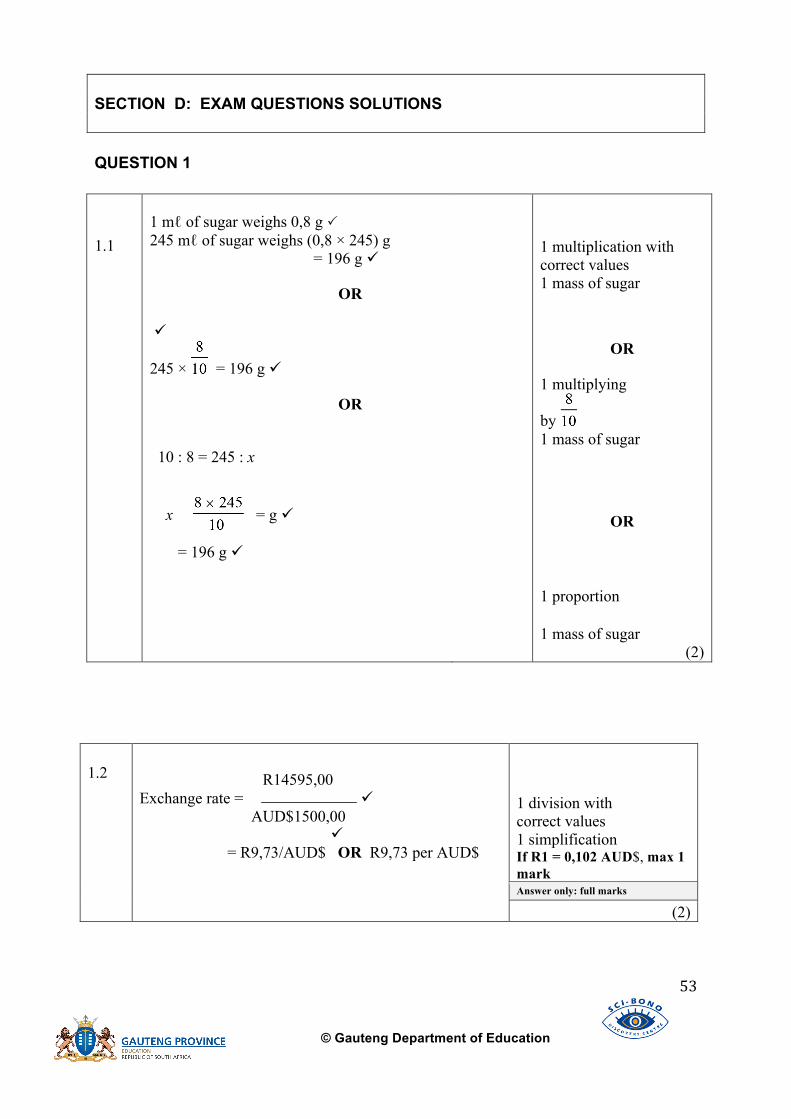
SECTION D: EXAM QUESTIONS SOLUTIONS QUESTION 1 1.1
1 mℓ of sugar weighs 0,8 g 245 mℓ of sugar weighs (0,8 × 245) g = 196 g
OR
245 × = 196 g
OR
10 : 8 = 245 : x
x = g
= 196 g
1 multiplication with correct values 1 mass of sugar
OR
1 multiplying
by 1 mass of sugar
OR 1 proportion 1 mass of sugar
(2) 1.2
R14595,00 Exchange rate =
AUD$1500,00 = R9,73/AUD$ OR R9,73 per AUD$
1 division with correct values 1 simplification If R1 = 0,102 AUD$, max 1 mark Answer only: full marks
(2)

© Gauteng Department of Education
54
1.3
Actual length = 2,26 cm × 58 = 131,08 cm OR 1,31 m OR 1310,8 mm
1 multiplying correct values 1 actual length If 1,31 or 1310,8 (without unit) max 1 mark
(2)
1.4
Amount of juice (in litres)
400 kg OR 2,5 kg makes 1 = 400kg 2,5 kg 400 kg makes
2,5kg/
= 160
= 160 Number of 5 bottles Number of 5 bottles 160 160 = = 5 5 = 32 = 32 OR 1 : 2,5 = x : 400 2,5x = 400
x =
x = 160
160 Number of 5 bottles =
5 = 32
OR 5 juice is made from 5 × 2,5 kg = 12,5 kg fruit
400kg � Number of 5 bottles =
12,5kg = 32
OR
1 dividing by 2,5 1 simplification
OR 1 using proportion 1 simplification 1 simplification
OR 1 mass of fruit 1 dividing by 12,5 1 simplification
OR 1 using proportion 1 dividing by 2,5 1 simplification
© Gauteng Department of Education
55
400 kg = 80 kg /
5 80 kg/
Number of 5 bottles = = 32
2,5 kg/

© Gauteng Department of Education
56
1.5
450 m = (450 ÷ 1 000) km
= 0,45 km
1 answer
(1)
1.6
5,34 million = 5,34 × 1 000 000
= 5 340 000
1 solution
(1)
1.7
R7,92 Price per egg =
6 = R1,32
1 dividing by 6 1 simplification Answer only full marks (2)
1.8
18 gallons = 18 × 4,546 litres = 81,83 litres
1 multiplying by
conversion factor
1 solution (2)
1.9
×100% Percentage decrease = = 8,66935.. % ≈ 8,67 %
1 correct formula 1 substitution 1 solution
(3) 1.10
= hours 1 260 seconds
hours OR 0,35 hours =
1 dividing by 3 600
1 simplification
(2)
Answer only – FULL MARKS
© Gauteng Department of Education
57
1.11
Price per gram = R9,96 200
= R0,0498 ≈ R0,05 OR 5c
1 dividing by 200 g
1 simplification
(2)
Answer only – FULL MARKS
1.12
cup = × 250 mℓ
= 187,5 mℓ
1 multiplying
1 simplification
(2)
Answer only – FULL MARKS
1.13
1 ounce = 480 g = 30 g
16 �5 ounces = 5 × 30 g = 150 g
1 converting
1 simplification (2)
1.14
1 345 cedi = 1 345 × R4,41000 = R5 931,45
1 multiplying by correct rate 1 simplification
(2)
Answer only – FULL MARKS
© Gauteng Department of Education
58
1.15
800 km = 500 miles
2 798km: = miles
= 1 748,75 miles
OR l = the length of South African coastline
2798 = l =800 km = 500 Miles
l = 1 748,75 miles
OR 800 km = 500 miles
So 1 km = miles
� 2 798 km = × 2 798 miles
= 1 748,75 miles
1 equating distances 1 correct conversion 1 simplification OR
1 concept 1 manipulation 1 simplification OR 1 concept 1 conversion 1 simplification
Answer only full marks
(3)
(3)
1.16
223 mm on the map represents 2 798 km 223 mm on the map represents 2 798 000 000 mm
1 mm on the map represents = 12 547 085,2 mm
Scale is 1: 12 500 000
1 correct conversion values 1 conversion 1 simplification 1 rounding (4)
© Gauteng Department of Education
59
QUESTION 2 2.1
Time (in seconds) = OR 6
OR 6,25
1 substitution 1 solution
(2) 2.2
A = P( 1 – i × n) 17,5 = R15 000(1 – 0,175 × 4) OR R15 000 1− ×4 100 = R4 500 = R4 500
1 substituting any 2 values correctly 1 substituting the 3rd value correctly 1 value Answer only: full marks
(3) 2.3
Area to be repainted = × b + 2h( + b) = [50 × 25 + 2 × 1,5(50 + 25)] m = [1 250 + 3(75)] m2 = 1 475 m2
1 substitution and b 1 substitution h 1 area Incorrect use of BODMAS, no CA Answer only: full marks
(3) 2.4
1500m3 Height of a rectangular prism =
50cm×25cm = 1,2 m
1 substitution
1 height Answer only: full marks
(2) 2.5
Temperature in ° F = 32 + 1,8 × (Temperature in ° C)
= 32 + 1,8 × (22)
= 71,6 ≈ 72
1 substitution 1 simplification
1 rounding (3)

© Gauteng Department of Education
60
2.6.1
Radius (in mm) = = 45
Surface area (in mm2) = 4 × 3,14 × 452
= 25 434
1 value of radius 1 substitution 1 simplification Accept 25 446,90 using π Using diameter max 2 marks NPR
Correct answer only: full marks
(3) 2.6.2
Volume (in mm3) = × 3,14 × 45 3 = 381 510
from 1.2.1
1 substitution 1 simplification
Accept 381 703,51
using π NPR Correct answer only: full marks
(2)

© Gauteng Department of Education
61
2.7
Radius of basket =
= 15 cm
Volume of basket = 3,14 × (15 cm)2 × 25 cm
= 3,14 × (150 mm)2 × 250 mm = 17 662 500 mm3
17662500mm3 −113040mm3
The number of oranges = 3 381510mm = 46
� Franz’s statement is not correct
OR
1 radius of basket 1 substitution 1 converting to mm 1 volume of basket Accept 17 671 458,68 using π 1 subtracting space
1 dividing by volume of an orange from 1.2.2 1 conclusion
OR

© Gauteng Department of Education
62
OR
Radius of basket = = 15 cm
2
Volume of basket = 3,14 × (15 cm) × 25 cm = 17 662,5 cm3
17662,5cm −113040mm The number of oranges = 381,51cm3 381510mm
17662,5cm3 −113,040cm3 =
3 381,51cm = 46 (46 > 44)
Franz’s statement is not correct
OR
Radius of basket = = 15 cm
Volume of basket = 3,14 × (15 cm)2 × 25 cm
= 3,14 × (150 mm)2 × 250 mm = 17 662 500 mm3 Space in the basket for oranges (in mm3) = 17 662 500 – 113 040 = 17 549 460 Space occupied by oranges (in mm3)
= 381 510 mm2 × 44 = 16 786 440 mm2
( there is space for more oranges) Franz’s statement is not correct
1 value of radius 1 substitution 1 volume of basket Accept 17 671,46 using π 1 dividing by volume of an orange 1 subtracting space 1 converting to cm 1 conclusion
OR 1 radius of basket 1 substitution
1 converting to mm 1 volume of basket 1 subtracting space 1 calculating the space occupied by the oranges 1 conclusion
Correct conclusion only: 1 mark
(7)


