WORLD BANK TECHNICAL PAPER NUMBER 71 SECTORAL LIBRARY Reservoir Sedimentation WTP71 Impact, Extent, and Mitigation September 1987 K. Mahmood *396 *M25 FILE C .-. Public Disclosure Authorized Public Disclosure Authorized Public Disclosure Authorized Public Disclosure Authorized
Transcript
WORLD BANK TECHNICAL PAPER NUMBER 71
SECTORAL LIBRARY
Reservoir Sedimentation WTP71
Impact, Extent, and Mitigation September 1987
K. Mahmood
*396
*M25 FILE C .-.
Pub
lic D
iscl
osur
e A
utho
rized
Pub
lic D
iscl
osur
e A
utho
rized
Pub
lic D
iscl
osur
e A
utho
rized
Pub
lic D
iscl
osur
e A
utho
rized
RECENT WORLD BANK TECHNICAL PAPERS
No. 20. Water Quality in Hydroelectric Projects: Considerations for Planning in TropicalForest Regions
No. 21. Industrial Restructuring: Issues and Experiences in Selected Developed Economies
No. 22. Energy Efficiency in the Steel Industry with Emphasis on Developing Countries
No. 23. The Twinning of Institutions: Its Use as a Technical Assistance Delivery System
No. 24. World Sulphur Survey
No. 25. Industrialization in Sub-Saharan Africa: Strategies and Performance(also in French, 25F)
No. 26. Small Enterprise Development: Economic Issues from African Experience(also in French, 26F)
No. 27. Farming Systems in Africa: The Great Lakes Highlands of Zaire, Rwanda, and Burundi(also in French, 27F)
No. 28. Technical Assistance and Aid Agency Staff: Alternative Techniques for GreaterEffectiveness
No. 29. Handpumps Testing and Development: Progress Report on Field and Laboratory Testing
No. 30. Recycling from Municipal Refuse: A State-of-the-Art Review and Annotated Bibliography
No. 31. Remanufacturing: The Experience of the United States and Implications forDeveloping Countries
No. 32. World Refinery Industry: Need for Restructuring
No. 33. Guidelines for Calculating Financial and Economic Rates of Return for DFC Projects(also in French, 33F, and Spanish, 33S)
No. 34. Energy Efficiency in the Pulp and Paper Industry with Emphasis on Developing Countries
No. 35. Potential for Energy Efficiency in the Fertilizer Industry
No. 36. Aguaculture: A Component of Low Cost Sanitation Technology
No. 37. Municipal Waste Processing in Europe: A Status Report on Selected Materialsand Energy Recovery Projects
No. 38. Bulk Shipping and Terminal Logistics
No. 39. Cocoa Production: Present Constraints and Priorities for Research
No. 40. Irrigation Design and Management: Experience in Thailand
No. 41. Fuel Peat in Developing Countries
No. 42. Administrative and Operational Procedures for Programs for Sites and Servicesand Area Upgrading
No. 43. Farming Systems Research: A Review
No. 44. Animal Health Services in Sub-Saharan Africa: Alternative Approaches
No. 45. The International Road Roughness Experiment: Establishing Correlation andand a Calibration Standard for Measurements
No. 46. Guidelines for Conducting and Calibrating Road Roughness Measurements
No. 47. Guidelines for Evaluating the Management Information Systems of Industrial Enterprises
No. 48. Handpumps Testing and Development: Proceedings of a Workshop in China
No. 49. Anaerobic Digestion: Principals and Practices for Biogas Systems
No. 50. Investment and Finance in Agricultural Service Cooperatives
(List continues on the inside back cover.)
TO
WORLD BANK TECHNICAL PAPER NUMBER 71
Reservoir SedimentationImpact, Extent, and Mitigation
K. Mahmood
The World BankWashington, D.C.
The International Bank for ReconstrLctionand Development IHE W\ORLD BANK
1818 H Street, N.WWashington, D.C. 20433, U.S.A.
All rights reservedManufactured in thc United States of AmericaFirst printing September 1987
Tcchnical Papers are not formal pLubLlicatiolns of thec World Bank. and af-C Cil cLlatedto encourage discussion and commenit antd to commullicate the results of thc Bank'swork quickly to the development community: citatioln and the use of these pap.er sshould take account of their provisional chiaracter. The findlings, interpretatiois, andconclusions expressed in this paper are entirely thosc of thc autJor(s and should notbe attributed in any maniner to the VVorld Bank. to its affiliated organizations, or tomembers of its Board of Execuitvxe Directors or the COUlnttries thCe r epresent. Any m.apsthat accompany thc text have been p.repal-red solely for- the' Colnvlniece 1of readers; thedesignations and presentation of material in themii do not im plV thc expressioll of allyopinion whatsoever oni the part of the WVorld Banik. its affiliates, or its Boardn or membercountries conceriiing the legal status of any) Country. territory, city, or alca or of theauthorities thereof or concerning the delimitation (f its b5ouni;daries or its nationalaffiliation.
Because of the informality and to present the results of research \ ith thc leastpossible delay, the typescript has not been prepared in accordance ith thc Proceduresappropriate to formal printed texts, and tile Worldi1 Bank accepts no) respionsibility forerrors. The publication is supplied at a token charlge to defray part of the cost ofmanufacture and distrib1utioll.
The most recent World Bank putblicationis are desciribed in the catalog 'fezvP'tiblications, a newv edition of which is issued in thle sprinig and fall of eacih year. Tlecomnplete backlist of publications is shown ill the annual h1lex1 oI'Plfbhaionwls. whichicontains an alphabetical title list and indexes of subiects, authors, anid Coulitries antdregions; it is of value principally to libiraries and institutiolnal purchasers. The latestedition of eacih of these is available free of charge fromii the Publications Sales Unit,Department F. The World Bank. 1818 H Street. N.W. Washington. D.C. 20433, U.S.A.,or from Publications, The World Bank, oo, aJVCnuvLe d'1na, 75 i 1o Paris, France.
K. Mahmood is Professor of Enginicering at The George Washington University,Washington, D.C., and a consultant to the World Bank.
Library of Congress Cataloging-in-Publication DataMahmood, H.
Reservoir sedimentation.
(World Bank technical paper, ISSN 0253-7494no. 71)
Bibliography: p.1. Reservoir sedimentation. 2. Water resources
development. I. Title. II. Series.TD396.M37 1987 628.1'32 87-23003ISBN 0-8213-0952-8
ABSTRACT
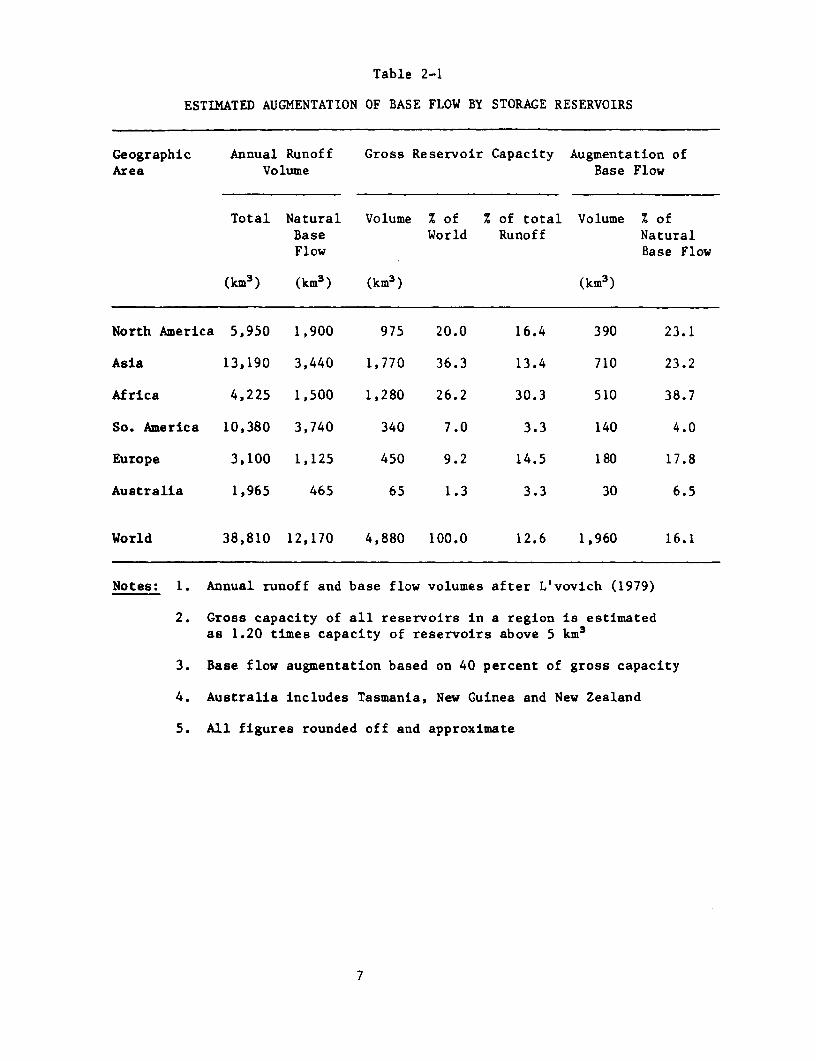
The role of storage reservoirs in water resource development is
described. It is pointed out that whereas the future demands will
require additions, the present capacity is being continually eroded
by siltation. It is estimated that on a world wide basis the
replacement cost of the capacity annually lost to siltation is
around $6 billion. The world picture of erosion and sediment yield
from drainage basins is reviewed to show that the world average
yield at ocean level is a modest 500 ppm, but large variations exist
and local values can be much higher due to natural conditions.
Human actions and natural events that further effect sediment yields
are illustrated with case histories. Physical phenomena related to
reservoir siltation are described to provide a basic understanding
of the problem. This is followed by a critical evaluation of
currently available predictive methods. Finally, a fairly complete
survey is presented of the design and operational strategies that
can be used to alleviate reservoir siltation. Important areas of
research and development are identified and it is recommended that
in view of the magnitude of this problem, a concerted effort should
be undertaken.
liii
ACKNOWLEDGEMENTS
This study has been sponsored by Agriculture and Rural
Department of the World Bank. It was partially supported by U.S.
National Science Foundation Research Grant No. CEE-8313603. The
writer expresses his deep appreciation to Guy LeMoigne, Irrigation
Advisor, the World Bank, for his encouragement during this study.
iv
TABLE OF CONTENTS
List of Figures vii
List of Tables viii
PREFACE ix
I INTRODUCTION 1
II MAGNITUDE OF THE PROBLEM 5
III EROSION AND SEDIMENTATION IN DRAINAGE BASINS 9
Weathering Processes 10Erosion 11Sediment Delivery Ratio 12World Wide Rates of Erosion and Delivery 15Human Impact on Sediment Yield 26Impact of Natural Events 29Measurement of Sediment Load 33Special Considerations 34
IV RESERVOIR SEDIMENTATION PROCESSES 35
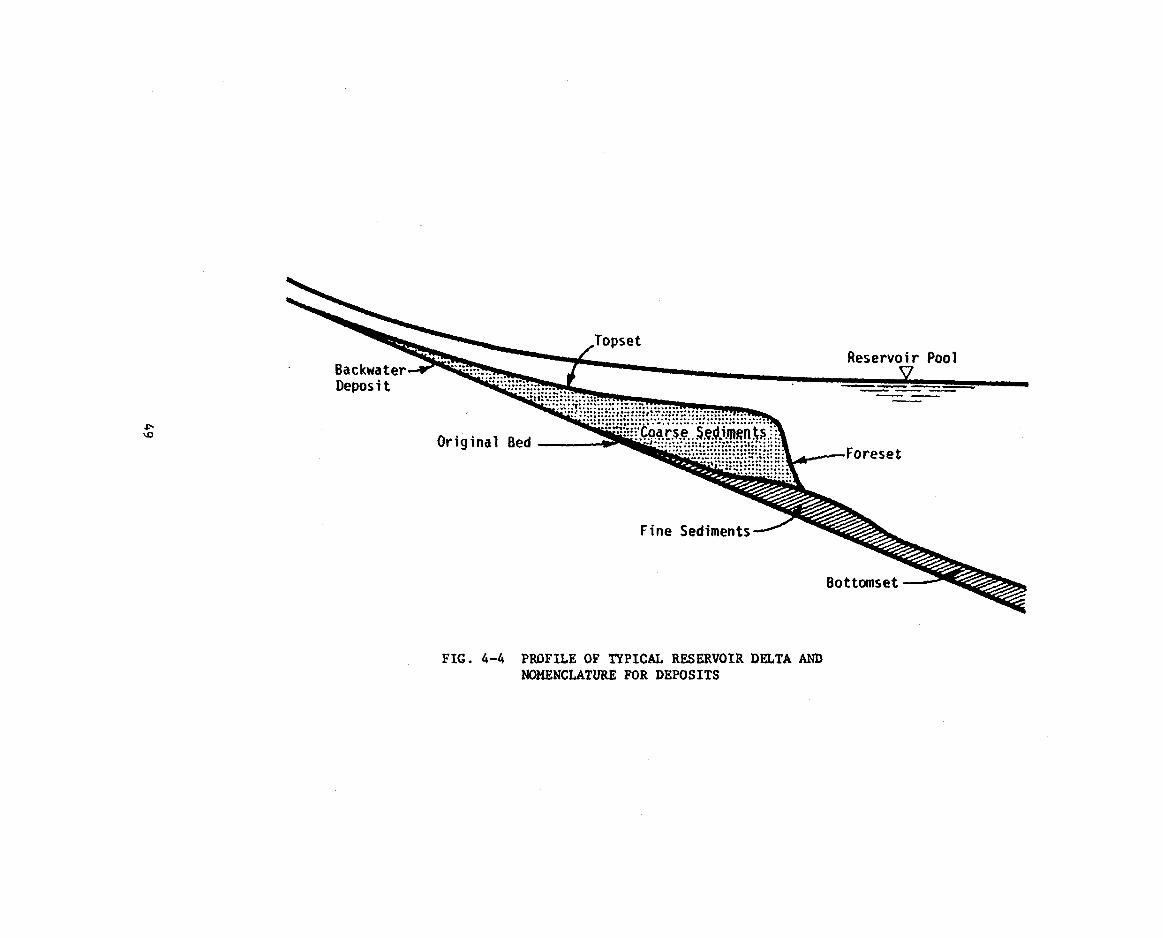
Sediment Size 35Entrainment 38Suspension 42Fine Material Load 43Bed Material Load 44Unit Weight of Deposits 45Delta Formation 48Fine Material Deposit 51Density Currents 51Erosion of Fine Material 55
V PREDICTIVE METHODS FOR RESERVOIR SEDIMENTATION 57
Trap Efficiency of Reservoirs 58Spatial Distribution of Deposits 60Mathematical Models 64Evaluation 68
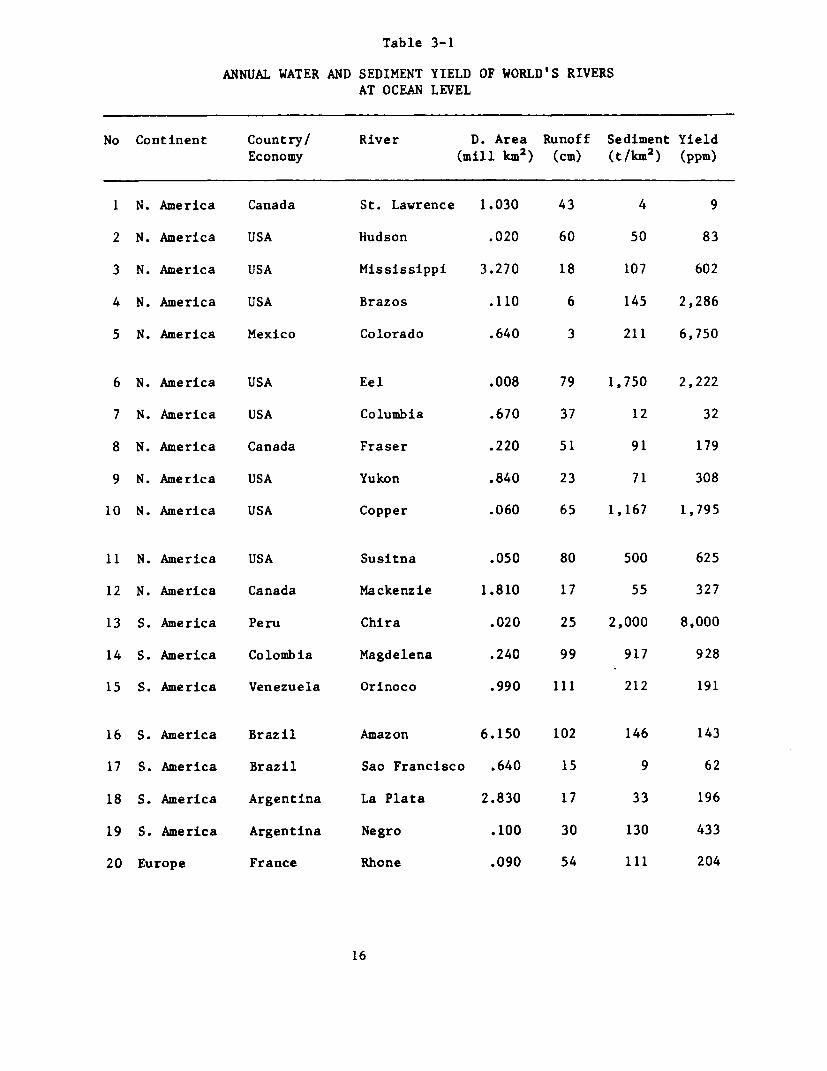
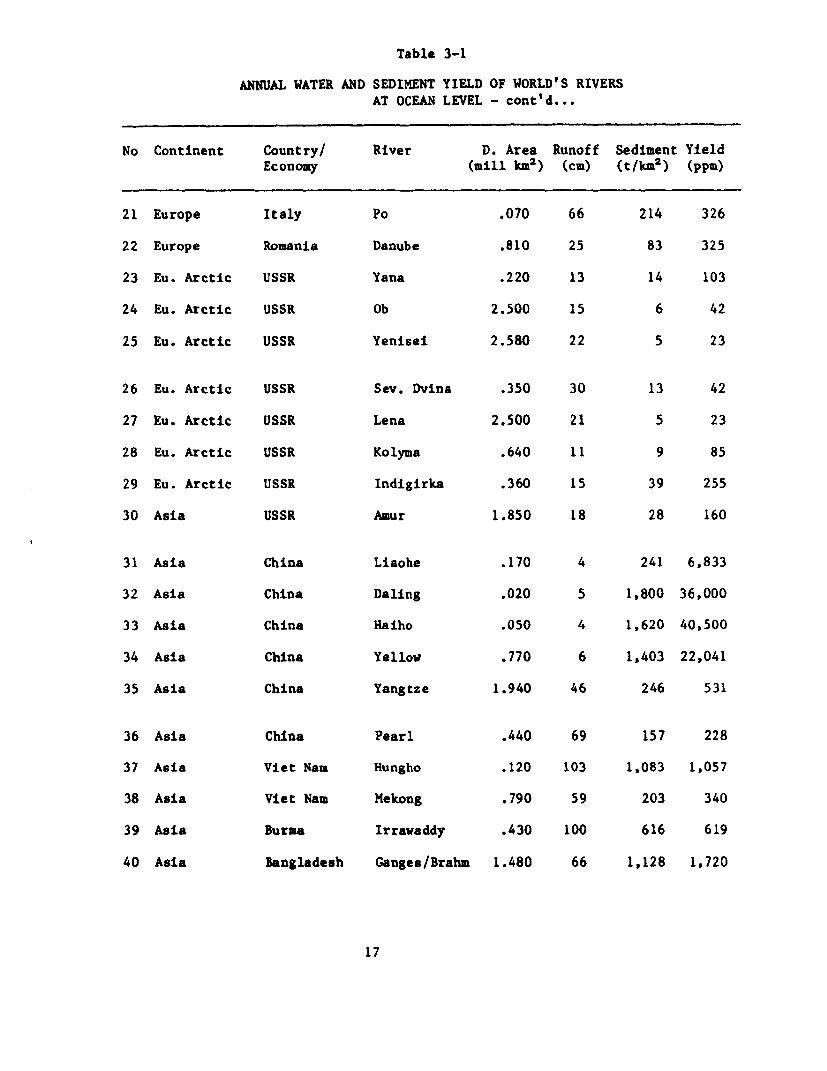
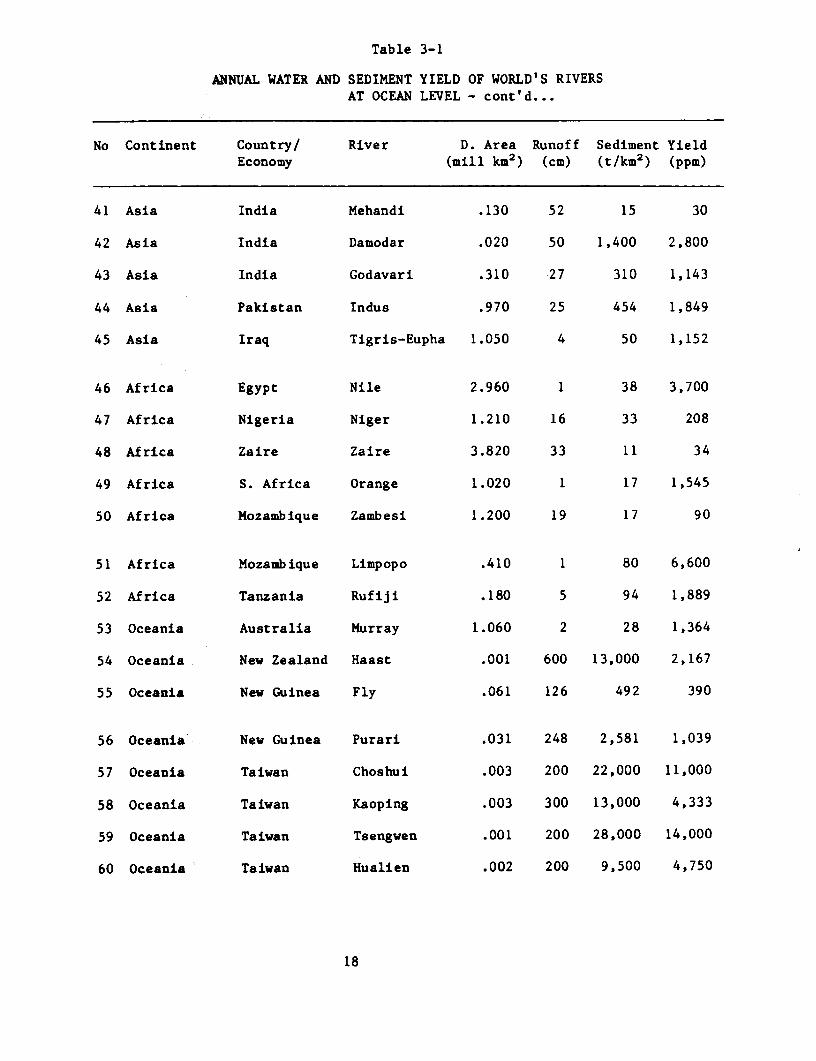
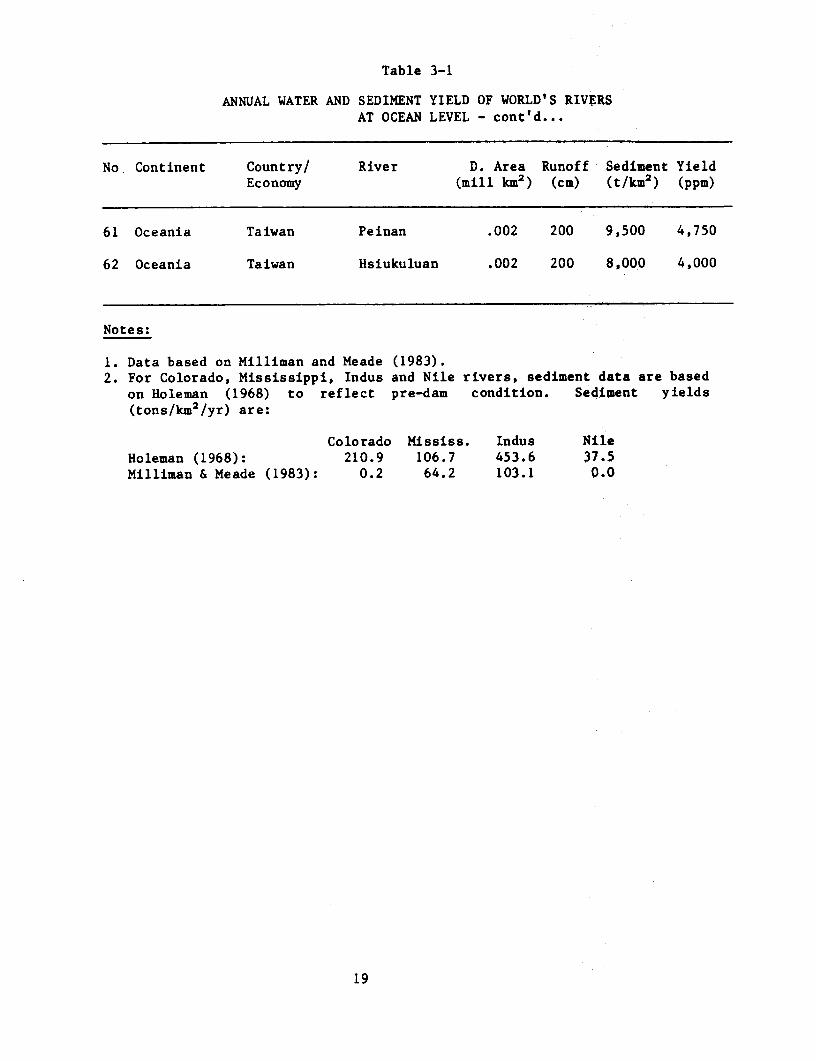
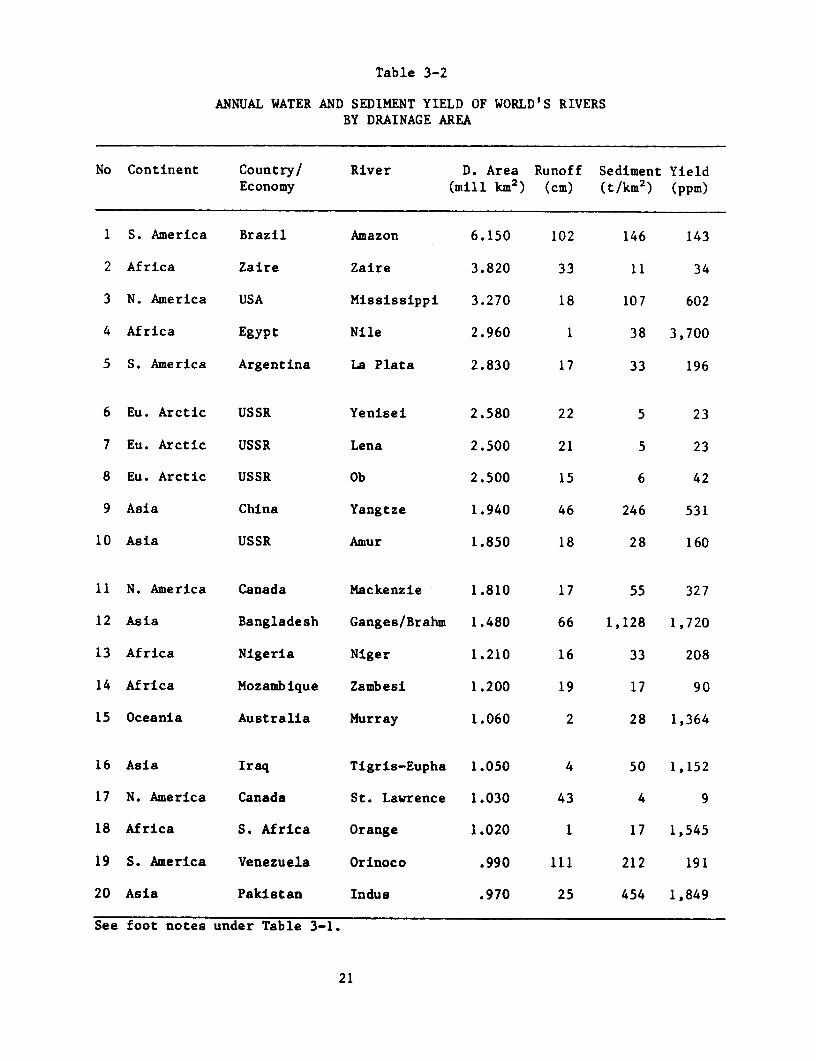
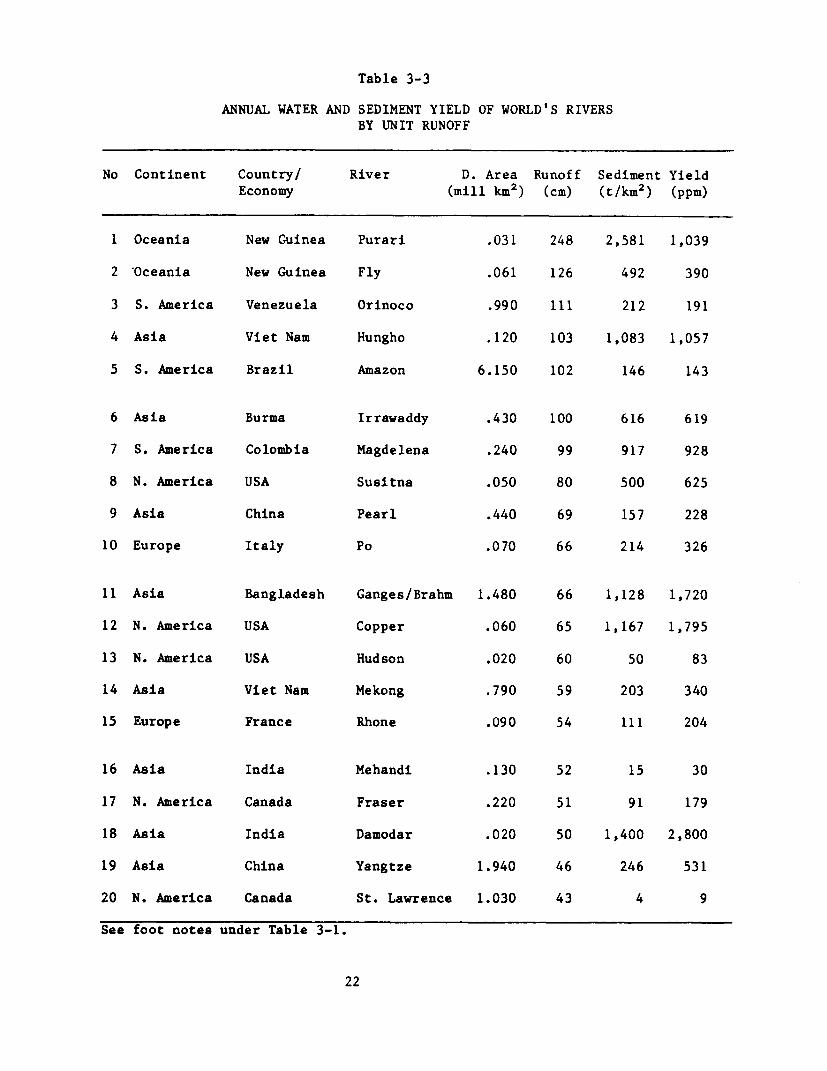
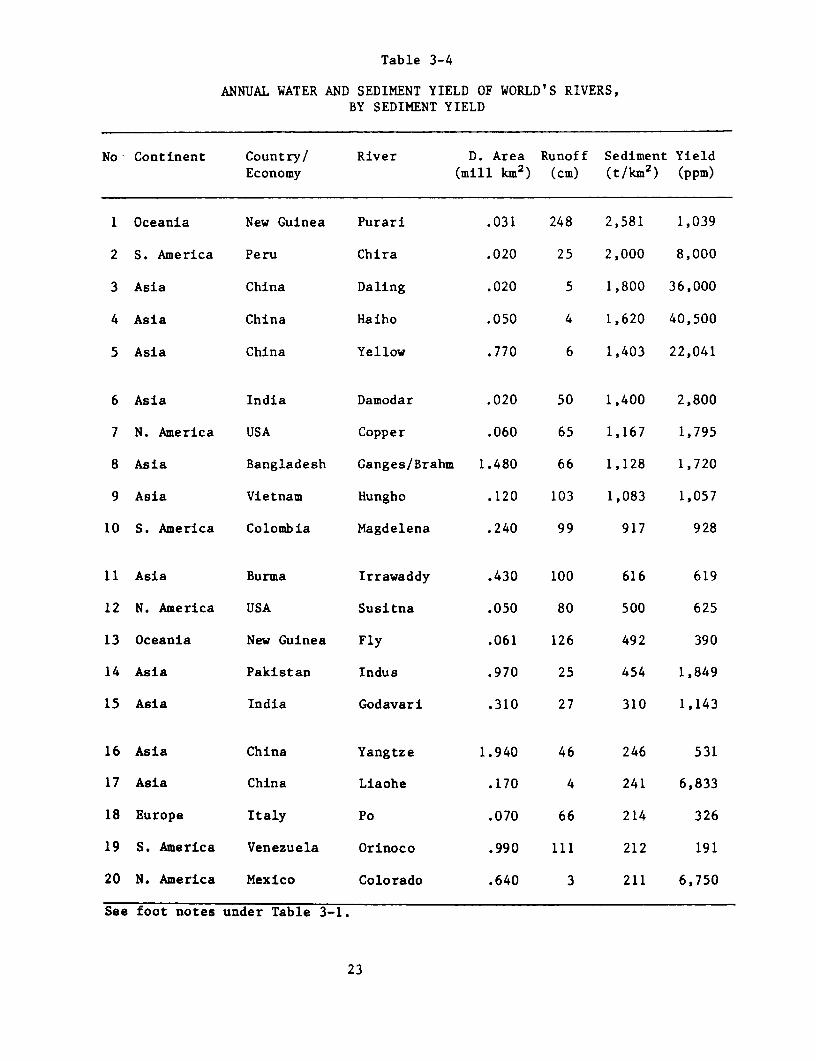
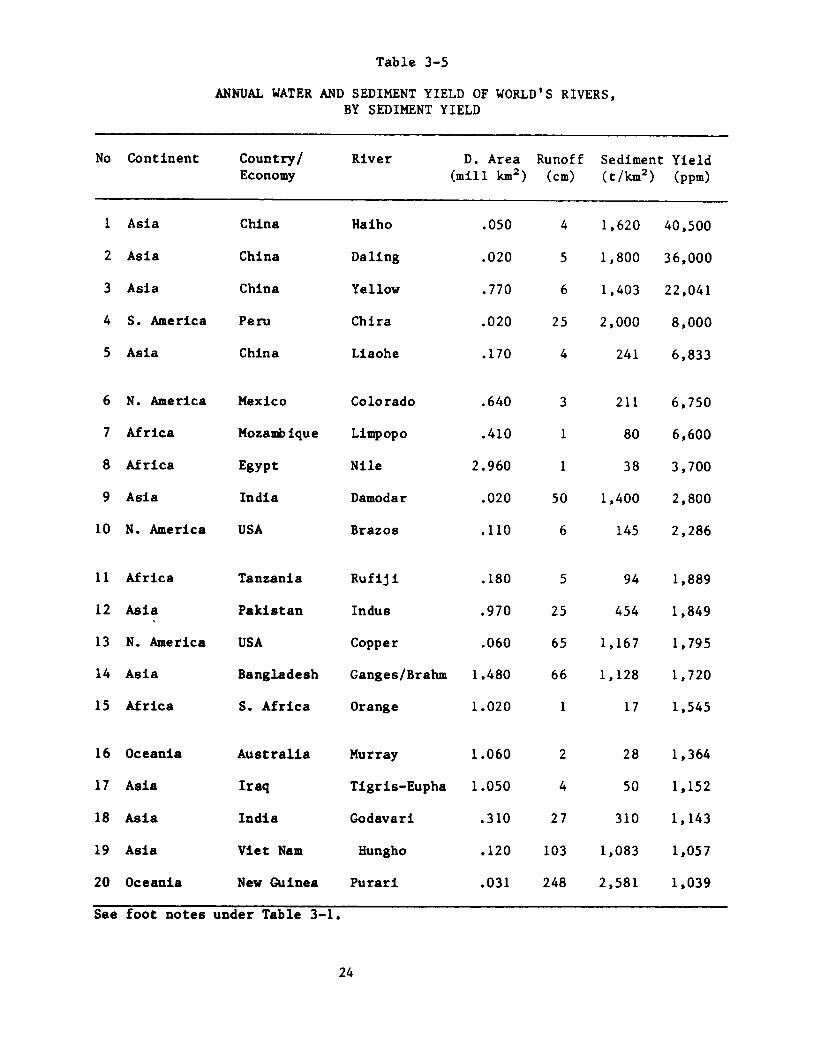
For comparative purposes, the top 20 basins ranked by drainage
area, unit runoff, sediment yield and sediment concentration are
listed in Tables 3-2 thru 3-5, respectively. In the ranking tables,
minor basins with areas less than 10,000 km2 have been excluded.
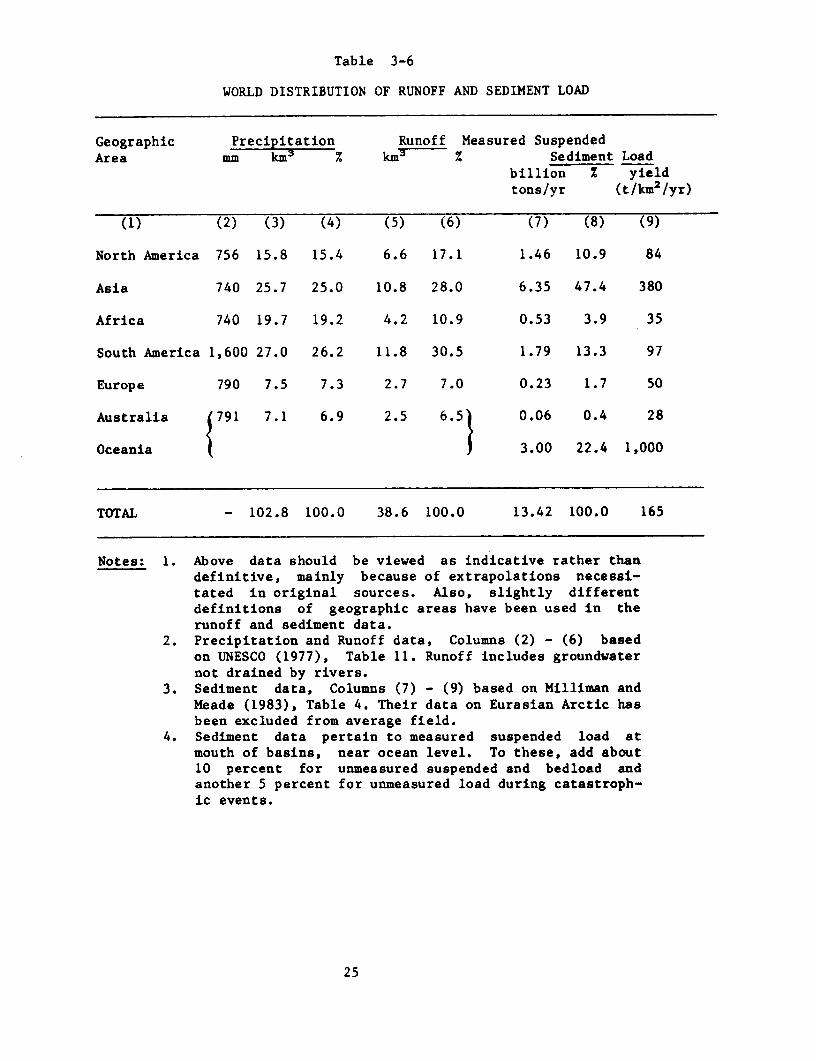
World-wide data on precipitation, unit runoff and sediment
yield for various geographic regions are summarized in Table 3-6.
Water data in this table are based on Table 11 of UNESCO (1977), and
the sediment data on Milliman and Meade (1983).
In viewing the sediment data in the above tables, it should be
noted that they are based on measured suspended loads near ocean
level and that about 15 percent should be added to these figures to
account for the unmeasured load and measurements missed during rare
events. Further, the data in Table 3-6 should be viewed as
indicative of world-wide distribution of relevant hydrologic para-
meters and not as definitive information. In the original sources,
used herein, extensive extrapolations have been made due to sparse-
ness of information and slightly different definitions of geographic
regions have been used in the runoff and sediment load data.
The above data show:
1. The largest amount of meteoric precipitation and runoff occurs
in South America, followed by Asia. However, the sediment
erosion rates in Asia are about four times larger. In fact,
Asia's sediment yield is more than twice of the world average.
2. The largest sediment yields occur in Oceania. For the smaller
basins in New Zealand, New Guinea and Taiwan, sediment yields
are 2-3 orders of magnitude larger than the world average.
3. The world-wide average yield is around 165 t/k=2/yr. With
additional 15 percent, see footnote 4 of Table 2, this would
20
Table 3-2
ANNUAL WATER AND SEDIMENT YIELD OF WORLD'S RIVERSBY DRAINAGE AREA
No Continent Country/ River D. Area Runoff Sediment YieldEconomy (mill kM2) (cm) (t/km2) (ppm)
1 S. America Brazil Amazon 6.150 102 146 143
2 Africa Zaire Zaire 3.820 33 11 34
3 N. America USA Mississippi 3.270 18 107 602
4 Africa Egypt Nile 2.960 1 38 3,700
5 S. America Argentina La Plata 2.830 17 33 196
6 Eu. Arctic USSR Yenisei 2.580 22 5 23
7 Eu. Arctic USSR Lena 2.500 21 5 23
8 Eu. Arctic USSR Ob 2.500 15 6 42
9 Asia China Yangtze 1.940 46 246 531
10 Asia USSR Amur 1.850 18 28 160
11 N. America Canada Mackenzie 1.810 17 55 327
12 Asia Bangladesh Ganges/Brahm 1.480 66 1,128 1,720
13 Africa Nigeria Niger 1.210 16 33 208
14 Africa Mozambique Zambesi 1.200 19 17 90
15 Oceania Australia Murray 1.060 2 28 1,364
16 Asia Iraq Tigris-Eupha 1.050 4 50 1,152
17 N. America Canada St. Lawrence 1.030 43 4 9
18 Africa S. Africa Orange 1.020 1 17 1,545
19 S. America Venezuela Orinoco .990 111 212 191
20 Asia Pakistan Indus .970 25 454 1,849
See foot notes under Table 3-1.
21
Table 3-3
ANNUAL WATER AND SEDIMENT YIELD OF WORLD'S RIVERSBY UNIT RUNOFF
No Continent Country/ River D. Area Runoff Sediment YieldEconomy (mill kM2) (cm) (t/km2) (ppm)
1 Oceania New Guinea Purari .031 248 2,581 1,039
2 Oceania New Guinea Fly .061 126 492 390
3 S. America Venezuela Orinoco .990 11l 212 191
4 Asia Viet Nam Hungho .120 103 1,083 1,057
5 S. America Brazil Amazon 6.150 102 146 143
6 Asia Burma Irrawaddy .430 100 616 619
7 S. America Colombia Magdelena .240 99 917 928
8 N. America USA Susitna .050 80 500 625
9 Asia China Pearl .440 69 157 228
10 Europe Italy Po .070 66 214 326
11 Asia Bangladesh Ganges/Brahm 1.480 66 1,128 1,720
12 N. America USA Copper .060 65 1,167 1,795
13 N. America USA Hudson .020 60 50 83
14 Asia Viet Nam Mekong .790 59 203 340
15 Europe France Rhone .090 54 111 204
16 Asia India Mehandi .130 52 15 30
17 N. America Canada Fraser .220 51 91 179
18 Asia India Damodar .020 50 1,400 2,800
19 Asia China Yangtze 1.940 46 246 531
20 N. America Canada St. Lawrence 1.030 43 4 9
See foot notes under Table 3-1.
22
Table 3-4
ANNUAL WATER AND SEDIMENT YIELD OF WORLD'S RIVERS,BY SEDIMENT YIELD
No Continent Country/ River D. Area Runoff Sediment YieldEconomy (mill km2) (cm) (t/km2) (ppm)
1 Oceania New Guinea Purari .031 248 2,581 1,039
2 S. America Peru Chira .020 25 2,000 8,000
3 Asia China Daling .020 5 1,800 36,000
4 Asia China Haiho .050 4 1,620 40,500
5 Asia China Yellow .770 6 1,403 22,041
6 Asia India Damodar .020 50 1,400 2,800
7 N. America USA Copper .060 65 1,167 1,795
8 Asia Bangladesh Ganges/Brahm 1.480 66 1,128 1,720
9 Asia Vietnam Hungho .120 103 1,083 1,057
10 S. America Colombia Magdelena .240 99 917 928
11 Asia Burma Irrawaddy .430 100 616 619
12 N. America USA Susitna .050 80 500 625
13 Oceania New Guinea Fly .061 126 492 390
14 Asia Pakistan Indus .970 25 454 1,849
15 Asia India Godavari .310 27 310 1,143
16 Asia China Yangtze 1.940 46 246 531
17 Asia China Liaohe .170 4 241 6,833
18 Europe Italy Po .070 66 214 326
19 S. America Venezuela Orinoco .990 111 212 191
20 N. America Mexico Colorado .640 3 211 6,750
See foot notes under Table 3-1.
23
Table 3-5
ANNUAL WATER AND SEDIMENT YIELD OF WORLD'S RIVERS,BY SEDIMENT YIELD
No Continent Country/ River D. Area Runoff Sediment YieldEconomy (mill kM2 ) (cm) (t/kM 2 ) (ppm)
1 Asia China Haiho .050 4 1,620 40,500
2 Asia China Daling .020 5 1,800 36,000
3 Asia China Yellow .770 6 1,403 22,041
4 S. America Peru Chira .020 25 2,000 8,000
5 Asia China Liaohe .170 4 241 6,833
6 N. America Mexico Colorado .640 3 211 6,750
7 Africa Mozambique Limpopo .410 1 80 6,600
8 Africa Egypt Nile 2.960 1 38 3,700
9 Asia India Damodar .020 50 1,400 2,800
10 N. America USA Brazos .110 6 145 2,286
11 Africa Tanzania Rufiji .180 5 94 1,889
12 Asia Pakistan Indus .970 25 454 1,849
13 N. America USA Copper .060 65 1,167 1,795
14 Asia Bangladesh Ganges/Brahm 1.480 66 1,128 1,720
15 Africa S. Africa Orange 1.020 1 17 1,545
16 Oceania Australia Murray 1.060 2 28 1,364
17 Asia Iraq Tigris-Eupha 1.050 4 50 1,152
18 Asia India Godavari .310 27 310 1,143
19 Asia Viet Nam Hungho .120 103 1,083 1,057
20 Oceania New Guinea Purari .031 248 2,581 1,039
See foot notes under Table 3-1.
24
Table 3-6
WORLD DISTRIBUTION OF RUNOFF AND SEDIMENT LOAD
Geographic Precipitation Runoff Measured SuspendedArea mm km3 km Sediment Load
billion Z yieldtons/yr (t/km 2 /yr)
(1) (2) (3) (4) (5) (6) (7) (8) (9)
North America 756 15.8 15.4 6.6 17.1 1.46 10.9 84
Asia 740 25.7 25.0 10.8 28.0 6.35 47.4 380
Africa 740 19.7 19.2 4.2 10.9 0.53 3.9 35
South America 1,600 27.0 26.2 11.8 30.5 1.79 13.3 97
Europe 790 7.5 7.3 2.7 7.0 0.23 1.7 50
Australia 791 7.1 6.9 2.5 6.5} 0.06 0.4 28
Oceania 3.00 22.4 1,000
TOTAL - 102.8 100.0 38.6 100.0 13.42 100.0 165
Notes: 1. Above data should be viewed as indicative rather thandefinitive, mainly because of extrapolations necessi-tated in original sources. Also, slightly differentdefinitions of geographic areas have been used in therunoff and sediment data.
2. Precipitation and Runoff data, Columns (2) - (6) basedon UNESCO (1977), Table 11. Runoff includes groundwaternot drained by rivers.
3. Sediment data, Columns (7) - (9) based on Milliman andMeade (1983), Table 4. Their data on Eurasian Arctic hasbeen excluded from average field.
4. Sediment data pertain to measured suspended load atmouth of basins, near ocean level. To these, add about10 percent for unmeasured suspended and bedload andanother 5 percent for unmeasured load during catastroph-ic events.
25
amount to about 190 t/km2/yr. The average sediment yield for
the measured rivers is 148 t/km2/yr and it corresponds to a
concentration of 425 ppm. With the additional 15 percent, the
measured concentration would be 490 ppm.
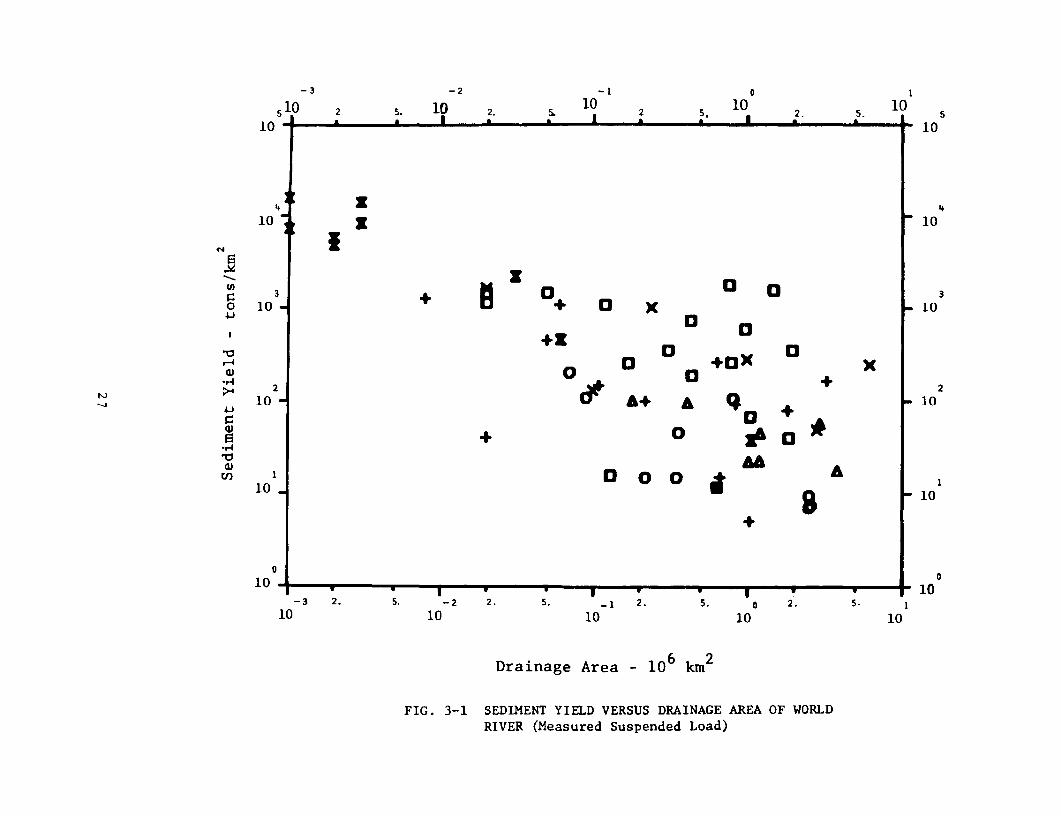
4. Of the measured parameters, sediment yield is most correlated
with drainage area (Fig. 3-1) The best-fit trendline between
sediment yield and drainage area would indicate a value of b in
Eq. (3.1) of around 0.8. Notwithstanding the different
climatic, pedologic, tectonic and land use conditions between
different basins, the sediment yield does appear to strongly
decline for larger basins.
5. Sediment concentration is inversely correlated with the unit
runoff. If unit runoff is looked at as an indicator of the
excess of precipitation over actual evapotranspiration, then a
small unit runoff would indicate aridity and, hence, poor
vegetal cover. For basins larger than 20,000 kM2, eight
largest concentrations (1,890 - 40,500 ppm) are associated with
runoff of 6 cm or less.
Human Impact on Sediment Yield
Within the zonal distributions mentioned above, human actions
have made their impact on sediment yield. Over the last century or
two, a great deal of world's forests have been cleared for
agricultural and urbanization needs. Agricultural activity along
with strip mining and other large construction projects, increases
the on-site erodibility of soil by loosening it and destroying its
protective layer. Studies in the U.S. show that conversion of forest
land to row cropping can increase on-site erosion by a factor of
100-1,000 and from pasture land to construction of about 200
(Mahmood, 1977).
26
-3 -2 -I 0 I
510 2 5. 10 2. 10 2 5 10 2. 10
10* p I p
4 z10 z 10
0 i10 10 10 0 10
'-4 01X (1) 0 0 2
>4~ ~~~~~Dang Ara+ A m
102 3-1 10
10R ( Ss Load) 1010- V Y ,1DringeAra006km
FIG. 3-1 SEDIMENT YIELD VERSUS DRAINAGE AREA OF WORLDRIVER (Measured Suspended Load)
Accelerated erosion has serious implications for water quality;
agricultural productivity and channel flooding. In the context of
reservoir sedimentation, unless the disturbance is made over large
areas, their impact is generally small. As illustrated by the Coon
Creek basin, referred to earlier, sediment storage within the basin
results in long time lags between the inception of a disturbance and
the arrival of its effect at the mouth of basin. Two major areas of
disturbance in the world are the plain's region of Europe and U.S.A.
In both cases, large scale conversion of forest land to agriculture
has made a measurable impact on sediment yield. According to
Strakhov (1967), mechanical denudation measured at basin mouths has
been increased by a factor of 3 to 5 in these two regions.
All of man's activities, however, do not increase sediment
yield. Large storage reservoirs significantly decrease and, many a
time, totally eliminate the sediment load downstream. There are
three major examples of this effect on Colorado, Nile and Indus
Rivers.
Dramatic reduction in the sediment load of Colorado River - one
of the muddiest major rivers in the U.S., has occurred as a conse-
quence of Hoover Dam. This has been documented by Meade and Parker,
(1985), from the analysis of suspended sediment discharge at Yuma,
Arizona where the river leaves the U.S. According to them, the
sediment discharge in this river has declined from 135 million
tons/yr of Holeman's estimate to its current value of 0.1 million
tons/yr. Similarly, River Nile, that used to transport about 110
million tons/yr of sediment at its delta, is virtually free of
sediment, as a result of the completion of High Aswan Dam in 1964.
River Indus in Pakistan, which used to deliver about 440 million
tons/yr, now delivers only about 100 million tons/yr due to the
construction of: two major dams (Mangla, 1965 and Tarbela, 1974), a
number of low diversion dams (barrages) and an increased transfer of
water and sediment into the irrigation canal system.
28
The case of Missouri-Mississippi river system is even more
illustrative. In this case, the construction of six major dams in
the Missouri basin (Gavins Point, the most downstream one, completed
in 1953), coupled with extensive channel stabilization along the
whole river, mainly for navigation and flood control purposes, has
reduced the sediment discharge to the Gulf of Mexico to one-half of
what it was in 1953. The contribution of channel bank erosion to
sediment yield can be rather large. In Sacramento River,
California, 60 percent of the total sediment inflow of 12.7 million
tons/year has been estimated to come from streambank erosion (Sing,
1986). The effect of channel stabilization is that the valley
deposit which can be reworked by the nascent river are no more
available as a sediment source.
Impact of Natural Events
Sediment production from a basin is a discontinuous process. It
is usually associated with rainfall events. Floods, earthquakes,
volcanos and mudflows are some of the other events that cause
unusually large amounts of sediment production. In recent times, all
of these have been documented in various parts of the world.
New Madrid Earthquake: Between December, 1811 and February,
1812, the greatest earthquake in the continental U.S was experienced
near New Madrid in South Missouri. There were three major shocks and
many aftershocks. The one in 1874 was large enough to be felt as far
away as 500 km. The area of greatest shaking was about 100,000 km2.
Large scale bank caving and fissuring introduced an undetermined,
but major quantities of sediment in Mississippi. Both Winkely
(1977) and Walters (1975) believe that, as a result of New Madrid
Earthquake, the sediment loading of Mississippi was significantly
increased, and the channel morphology was changed because of that.
29
Kosi River Mudflow: Sapt Kosi is the third largest river
emanating from the Himalayan Range. It is exceeded in size only by
Indus and Brahamaputra Rivers. Kosi watershed extends across the
Himalayan range into the Tibetan Plateau and it has the distinction
of draining Mount Everest, Kinchunchunga and Makato. This river has
three main tributaries, Sun Kosi, Arun and Tamur. Arun, which draws
about 58 percent of the catchment extends northward into the Tibet
Plateau. Precipitation in Kosi watershed comprises both rainfall
(89%) and snowfall (11%). About 80-85 percent of total annual rain-
fall occurs during monsoon months of June - August. Between June
and September, the runoff amounts to 85 percent and the sediment
load about 98 percent of the annual value (Mahmood, 1981).
Regular stream gaging and rainfall measurements on Kosi were
started in 1947 and 1948, respectively, at Barahkshtra in the
foothills. Details of sediment sampling procedures used in Kosi
gaging are not documented. The writer's investigation in 1979
revealed that up to a discharge of 15,000 m3/s, a single suspended
load sample was obtained at 0.6 times the flow depth below the water
surface, and at higher stages dip samples from the surface were
being used. At the gaging site, the river is a confined channel with
steep gradient and high velocities. Under these conditions, most of
the sand size load will be uniformly distributed in the channel
depth, but some underestimation of sediment load is likely.
Himalayas are geologically young and abound in seismic activi-
ty. It is estimated (Chaudhry, H.M, 1973) that about two percent of
the total annual global energy release takes place in the Himalayan
region. Two of the world's worst earthquakes, in terms of lives
lost, occurred in Assam in 1897 and 1950, not far from the Kosi
catchment. Kathmandu earthquake of 1934, which levelled most of the
city was reportedly centered 120 km off Barahkhstra gaging site.
30
At the gaging site, Kosi has a drainage area of 59,000 km2 with
an average annual runoff of 53,000 Mm3. The average annual sediment
yield based on measured suspended sediment is about 2,800 t/km2 of
which about 16 percent is coarse sand; 29 percent medium sand and 55
percent is silt and clay. The average annual measured concentration
is 3,110 ppm.
On the night of June 23-24, 1980, after three days of heavy
rainfall, a major landslide occurred in the catchment of Tamur, the
eastern tributary. The slide blocked Yangma Khola, a tributary of
Tamur. The blockage was naturally breached in the early hours of
June 24 and the impounded water and sediment were released in Tamur.
About 130 kms downstream of the original slide, the first effect of
the event was noticed at about mid-day. In two hours the water
level rose by 3.6 m and the flow carried (Revio, 1980) "... huge
quantities of debris, logs, animal carcasses and about four
bodies..." By about 15:15, the water level dropped by 1.5 m and
debris was almost completely absent. Between 15:30 and 15:45, the
level rose again, but this time, the flow seemed to be of a viscous
fluid. The surface was greasy smooth with loud rumbling and
grinding noise. Boulders, as large as 150 tons were moving in the
shallow side of the channel section rather easily. Samples taken at
this stage showed a sediment content of 80 percent by volume with
particle sizes 10 mm and under with 23 percent lying below 0.075 mm.
The solids were non-plastic, with a specific gravity of 2.68 and a
liquid limit of 17.5%. The velocity of flow was 10 m/sec during the
initial rise and 6-7 m/sec during the flood flow. The writer flew
over the effected catchment and Kosi River channel during October
1980. From aerial and field inspections of deposits, he estimated
that the mudflow transported between 55-65 million tons of sediment
over a period of about 14 hours. This is equivalent to 36 percent
of the annual load or five times the average monthly load for the
month of June.
31
Eruption of Mount St. Helens: Mount St. Helens in Southwestern
Washington, erupted on May 18, 1980. As a result, mudflows developed
in the main drainage channels. (Cummans, 1981). It has been
estimated that following the eruption, a massive debris avalanche
deposited about a billion tons of rock, ice and other materials in
the upper 17 miles of the North Fork Toutle River Valley. Following
the avalanche, a mudflow developed which deposited about 50 million
tons of sediment in Cowlitz River channel. It has been estimated
(Meade and Parker, 1985) that in the first four months after
eruption, about 140 million tons of suspended sediment were
deposited by the Cowlitz River into the Columbia River. In the last
few years, this has diminished to about 30 million tons/year. As a
result of Mount St. Helen's eruption, the sediment yield of
Columbia River has currently increased to 40 million tons/year from
the pre-eruption value of 10 million tons/yr.
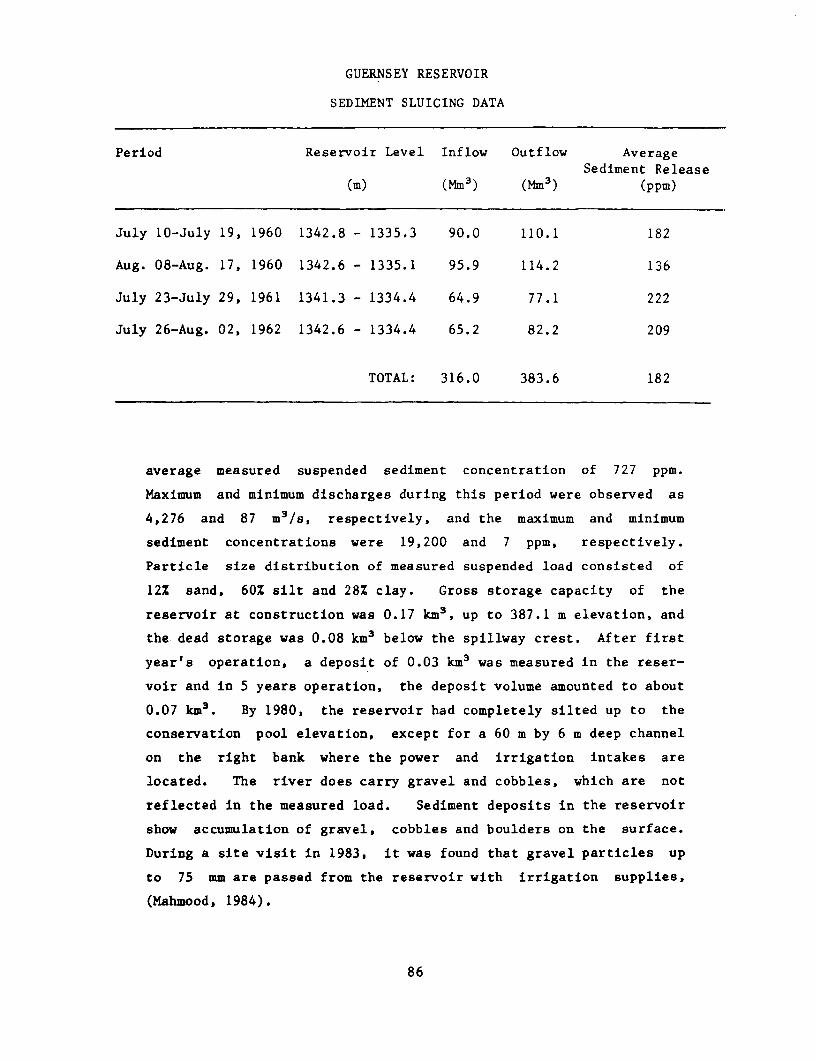
Sediment load in rivers, generally increases as a power
function of discharge. Disproportionately larger quantities of
sediment are, therefore, transported during high flow than the low
flows. Meade and Parker (1985) estimate that in the coterminous
United States, about one-half of the annual sediment load is
transported during 5-10 days flow. Flood flows are also caused by
hurricanes, and the above named authors estimate that hurricane
induced floods in Juniata, Delaware and Eel rivers transported 3-10
years of average sediment load in a matter of 10 days. Schumm
(1977) cites accelerated denudation in New Guinea where the
earthquakes of 1970 triggered debris avalanches that denuded slopes
over 60 km2 and resulted in an almost instantaneous denudation of
11.5 cm compared to the regional normal rate of 20 cm/1000 yrs.
32
Measurement of Sediment Load
As shown above, a great deal is understood about the weather-
ing, erosion and transport processes that contribute to the sediment
load in river basins. Regional average information and short-term
average sediment yields are usually available in major basins.
However, they are not adequate for the sedimentation design of
storage reservoirs. Sediment loads contributed by infrequent events
alone are sufficient to undo many estimates based on short-term
data. The writer was actively involved in the design of remedial
sediment control works for Chattra Main Canal offtaking from Kosi
River in Nepal. The design was at a fairly advanced stage when the
mudflow of June, 1980 occurred. In addition to the problem of
sudden, extreme sediment load, the mudflow caused a major change in
the alignment and bed level of the river channel. As a result, a
substantial revision of designs became necessary and was carried
out. The mudflow in Kosi had not been anticipated and the previous
10 years of sediment data had no record of similar events.
It is customary and necessary to measure sediment loads at or
near the proposed sites of storage reservoirs. Sediment measure-
ments are made in conjunction with water discharge measurements.
Standard practice for these measurement has been outlined in various
U.S. Geological Survey Publications. Guy (1969, 1970) and Guy and
Norman (1970) present a useful summary of basic sedimentation
concepts, measurement procedures and laboratory methods needed for
sediment load measurements in rivers. Site data for sediment load
are invaluable. Ideally, one would like to have data for a period,
at least, equal to about one-half the project life. However, except
in fairly developed water resources systems, or in special cases
where the project formulation has dragged on for decades, such data
are not available. In these circumstances, one has to be content to
use whatever data and ancillary information can be collected. It is
rare that a project implementation has been voided for lack of
33
adequate sediment load data. In all cases and, especially, when
sediment load records are inadequate, specialist help in the inter-
pretation of data and estimation of long-term average sediment loads
is invaluable.
Special Considerations
Some general principles can be formulated about the collection
and analysis of sediment load data for reservoir design. Hydrologic
series in arid and semi-arid climates show larger variability than
in the humid climates. Given similar circumstances, a longer
sediment load data base will be required in the former climates.
Experience with the sediment load transported by floods indicates
that, in case of limited resources, it is better to carry out more
frequent measurements during high flows than the low flows. Efforts
should be made to measure the extreme flow events, if one is lucky
enough to experience them before the construction stage.
Anthropogenic changes and natural events in a basin can alter
past trends. In large basins, man's actions will usually have
relatively milder impact on reservoir sedimentation than the natural
events. In the sedimentation design of storage reservoirs,
contributions from earthquakes, volcanos, mudflows and hurricanes
are especially relevant and should be investigated. Generally, the
seismic activity at the project site is studied for other design
considerations, such as the stability of embankment and foundation
and, hurricanes are investigated in the estimation of design floods.
The sediment production by mudflows is not normally included in the
design studies and is likely to be ignored. This should be given
special attention. Techniques, such as geomorphic analysis of
drainage basins, should be used to define the extent and magnitude
of hillslope instability and to check estimates derived from gaging
data.
34
CHAPTER IV
RESERVOIR SEDIMENTATION PROCESSES
Sediment load carried by a flow will drop out if the transport
capacity of flow is diminished. In general, the capacity of a given
flow decreases with a reduction of its velocity. As a river enters
the reservoir, the cross-sectional area of flow is increased, the
average velocity is decreased and sediment load starts dropping out.
The order in which different sediment sizes settle down and the
location of deposits depends on three physical phenomena--cessation
of drag force on particles rolling along the stream bed (bedload);
reduction in turbulence level which determines the capacity of flow
to maintain sediment suspension and, development of density
currents. In all of these, the physical size of sediment particle
plays an important role. Once the sediment particles have settled
out of flow, they assume a certain initial density which is also a
function, of particle size. The density of deposits is an important
variable because a given mass of sediment will occupy a larger share
of the storage volume if its density is low. This chapter presents
basic information about the properties of sediment, entrainment and
transport of sediment by flow and the processes of deposition in
storage reservoirs.
Sediment Size
The range of particle sizes found in nature is rather large--
fraction of a micron for clay to large boulders a few meters across.
From the viewpoint of reservoir sedimentation, however, the range of
interest varies from clay to gravel as the mass rate of transport
associated with larger particles is insignificant.
35
The following descriptive names are used to classify different
size fractions of sediments:
Gravel: 64 mm - 2 mm
Sand: 2 mm - 62 microns
Silt: 62 microns - 4 microns
Clay: 4 microns - 0.24 microns
This nomenclature was initially adopted by American Geophysical
Union in 1947 and is accepted as a standard terminology in sedimen-
tation engineering. Further sub-classes, each covering a two-fold
range of size, have also been established within the above and they
are based on adjectives, such as, coarse, medium or fine. In some
parts of the world, slightly different size ranges have been conven-
tionally used, especially to describe the sub-classes. For example,
the lower size limit for sand may be given as 75 microns, and that
for clay as 5.5 microns. This discrepancy is not overly critical in
the interpretation of sediment load data, provided the distribution
of total load amongst all the classes is available.
It is difficult to describe the size of a sediment particle by
a single linear dimension due to variations of its shape. Various
'sizes" have been used in sedimentation engineering and its allied
disciplines. However, in sedimentation engineering, two sizes are
most commonly used: sieve size, which is the side length of
smallest square sieve opening through which the particle will pass,
and fall diameter, which is the diameter of a sphere with a specific
gravity of 2.65 that will have the same terminal fall velocity in
quiescent water at 24°C as the original particle. Sieve diameters
are more commonly used for sand and gravel, mainly because of the
wide-spread use of sieving in size analysis. The fall diameter can
be looked at as a hydraulic behavioral size, for it represents the
combined effect of a number of variables, such as, specific gravity,
size, shape and texture of particle. In suspended mode of sediment
36
transport, the behavioral size is more relevant, and empirical
curves have been developed to translate the sieve diameter of water
borne sediments to fall diameter for given shape factors (Federal
Inter-Agency Sedimentation Project, 1957).
The fall velocity of a sediment particle is, generally,
described in terms of its terminal value when falling in quiescent
water. Although direct measurements have not been made, it is
generally agreed on the basis of theoretical considerations and some
indirect evidence that the fall velocity of a given sediment
particle will be smaller in turbulent fluids than in quiescent ones.
In the case of a spherical particle, the terminal fall velocity can
be determined by equating the gravitational force with the fluid
drag to yield
w - 4/3 . [(S - 1)gD]I/C (4.1)g ~~D
where, w - fall velocity, S - specific gravity, g - gravitational
acceleration, D - diameter and C , the drag coefficient is aD
function of fall velocity Reynold Number
C = f [R] (4.2)D
R - w D/v (4.3)
where, v - kinematic viscosity of the fluid and function f [.1 has
to be empirically determined. Only when R < 0.1 (D roughly less
than 50 microns), theoretical value of C isD
C - 24 /R . (4.4)D
The fall velocity decreases with particle size, but in the sand
to clay size range, it decreases at a much faster rate than Eq.
(4.1) would indicate. For example, when the particle size reduces
37
by one-fiftieth from 250 to 5 microns, the fall velocity reduces by
1/500, mainly due to the increase in C . For practical computations,
Eq. (4.4) can be applied to the silt and clay size range. For sands,
curves developed by Federal Inter-Agency Sedimentation Project
(1957) are available. However, the following empirical equation
developed by Rubey (1933) will also yield acceptable values.
g(Sg- 1)D3+ 36 92_ 6v
w = . (4.5)
D
All of the variables in Rubey's Equation should be expressed in
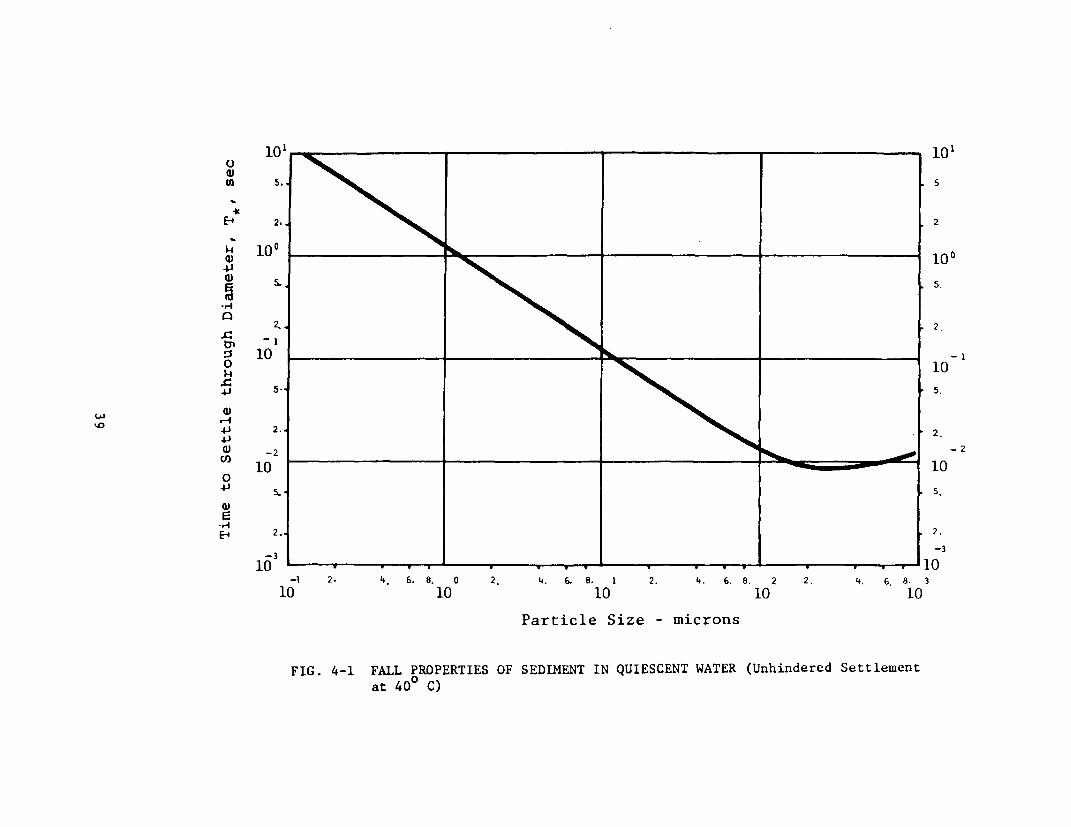
consistent units. The writer likes to express the fall velocity in
terms of parametric time, T , which is time in seconds taken by a
sediment particle to fall through its own diameter. The variation
of T with sediment particle size over a range of 0.1 to 1000
microns is shown in Fig. 4-1. In the very fine-to-coarse sand
range, the value of T is around 0.008 sec. For 1 micron clay
particle, T* is slightly more than 1 sec.
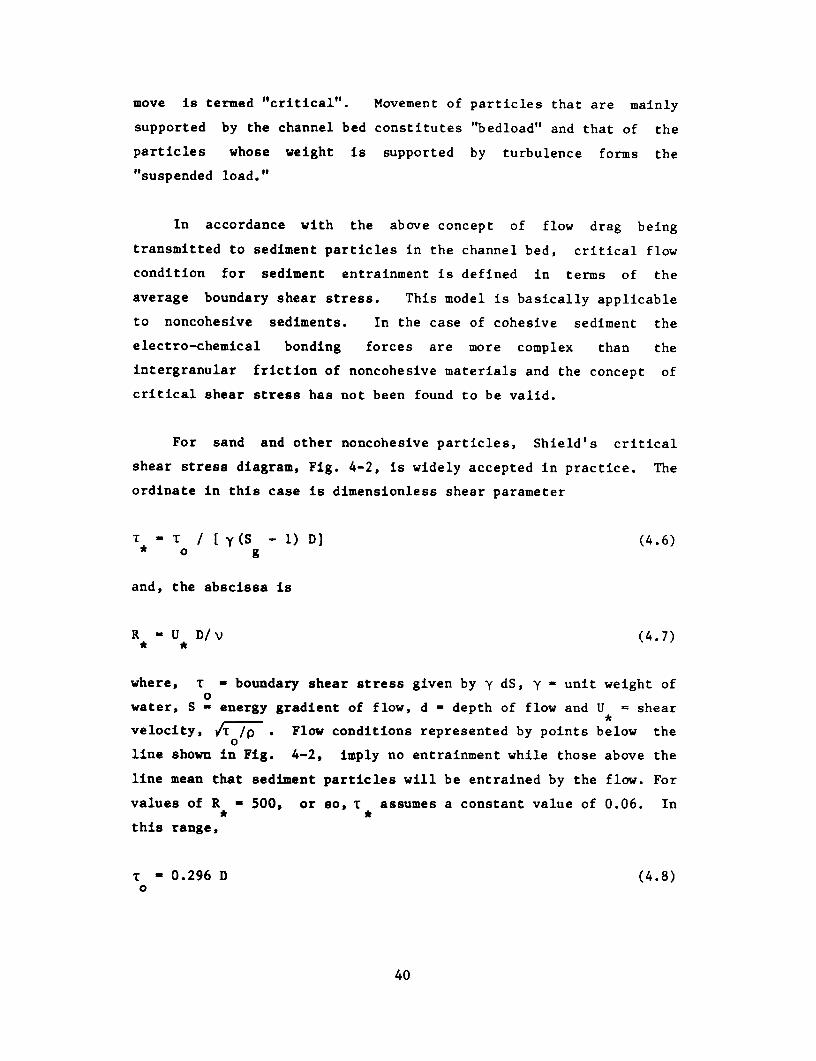
Entrainment
In smooth boundary flows, the frictional drag emanates from the
shear stress exerted on the solid boundary. In alluvial channel
flows with bed forms, part of the drag comes from the shear force
and the remainder from pressure drag on the bed forms. The shear
force is transmitted to individual particles which start to move if
the force is large enough to overcome their frictional resistance.
The movement of individual grains on the bed is not continuous. It
is punctuated by rest periods and the average rate of travel of
particles is much slower than the velocity of flow. As the flow
rate and the boundary shear stress increase further, the sediment
particles are lifted into the flow where they are supported by the
vertical component of turbulence and they move at the velocity of
surrounding fluid. Flow condition when the particles just start to
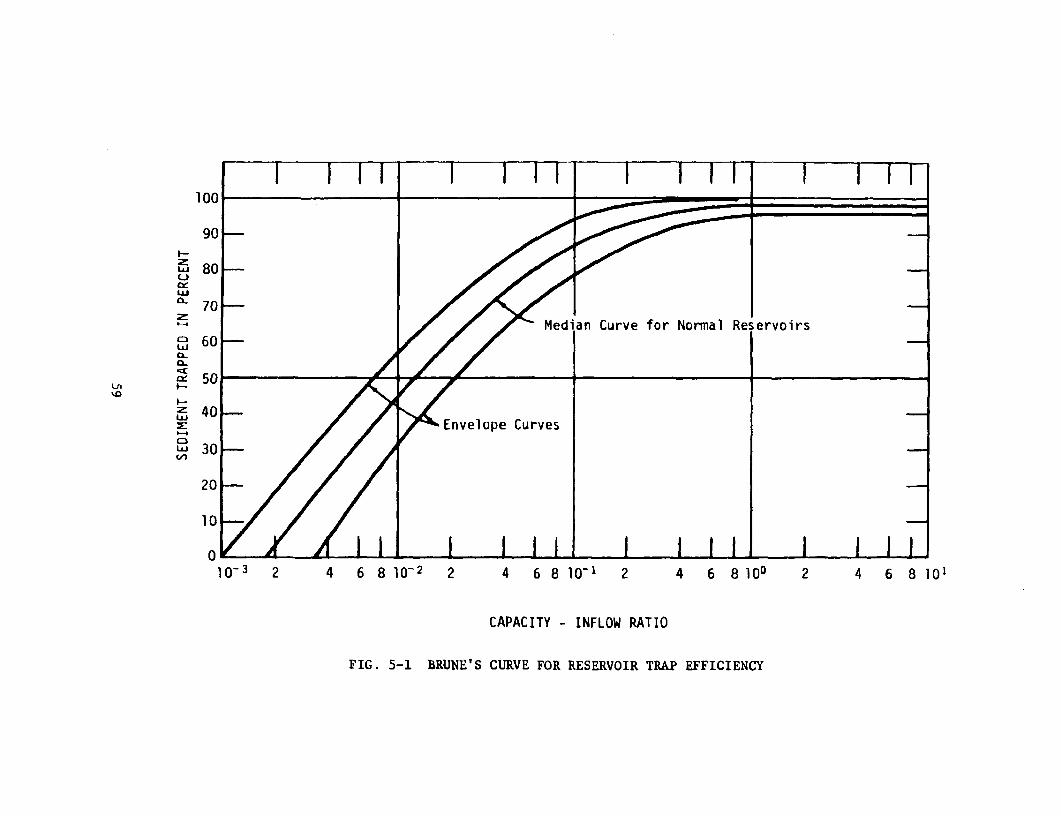
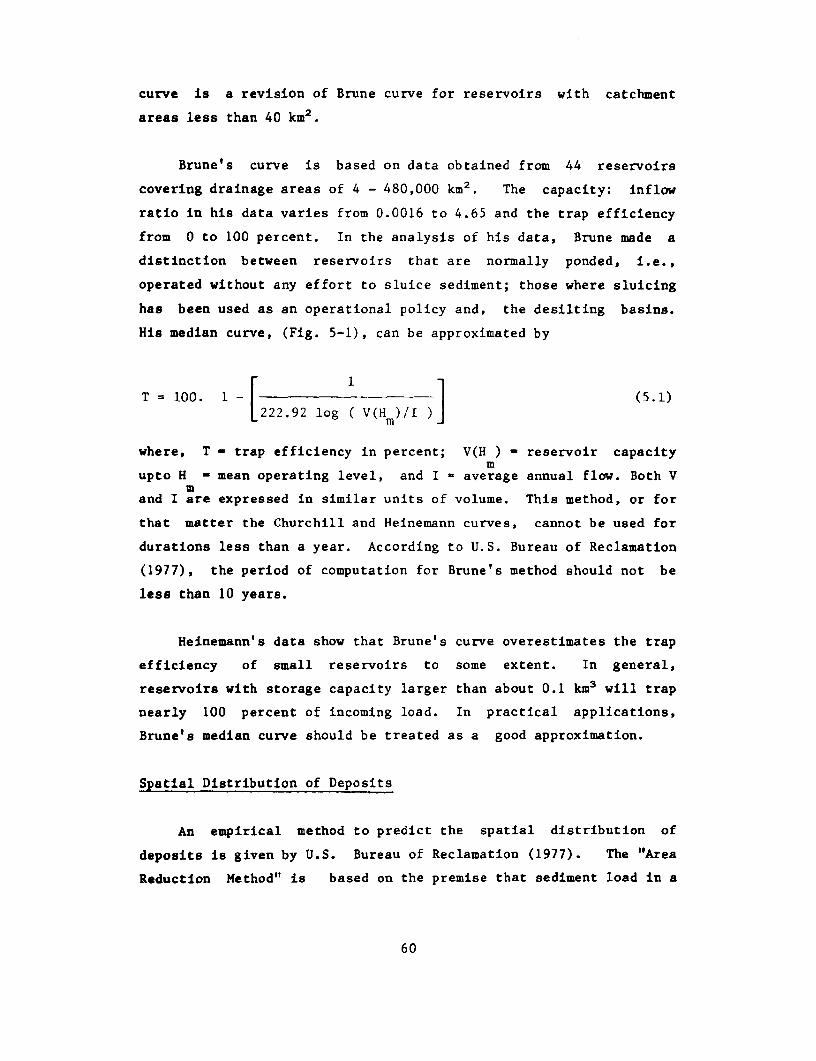
FIG. 5-1 BRUNE'S CURVE FOR RESERVOIR TRAP EFFICIENCY
curve is a revision of Brune curve for reservoirs with catchment
areas less than 40 km2.
Brune's curve is based on data obtained from 44 reservoirs
covering drainage areas of 4 - 480,000 km2 . The capacity: inflow
ratio in his data varies from 0.0016 to 4.65 and the trap efficiency
from 0 to 100 percent. In the analysis of his data, Brune made a
distinction between reservoirs that are normally ponded, i.e.,
operated without any effort to sluice sediment; those where sluicing
has been used as an operational policy and, the desilting basins.
His median curve, (Fig. 5-1), can be approximated by
T = 100. r 1 (5.1)1222.92 log ( V(H )/I (.
where, T - trap efficiency in percent; V(H ) - reservoir capacitym
upto H - mean operating level, and I - average annual flow. Both Vm
and I are expressed in similar units of volume. This method, or for
that matter the Churchill and Heinemann curves, cannot be used for
durations less than a year. According to U.S. Bureau of Reclamation
(1977), the period of computation for Brune's method should not be
less than 10 years.
Heinemann's data show that Brune's curve overestimates the trap
efficiency of small reservoirs to some extent. In general,
reservoirs with storage capacity larger than about 0.1 km3 will trap
nearly 100 percent of incoming load. In practical applications,
Brune's median curve should be treated as a good approximation.
Spatial Distribution of Deposits
An empirical method to predict the spatial distribution of
deposits is given by U.S. Bureau of Reclamation (1977). The "Area
Reduction Method" is based on the premise that sediment load in a
60
narrow reservoir will travel farther, because the average velocity
of flow will be higher than in a wide reservoir. Moreover, a steep,
narrow reservoir has a better chance of developing density currents
than one that is wide and flat. This qualitative reasoning is used
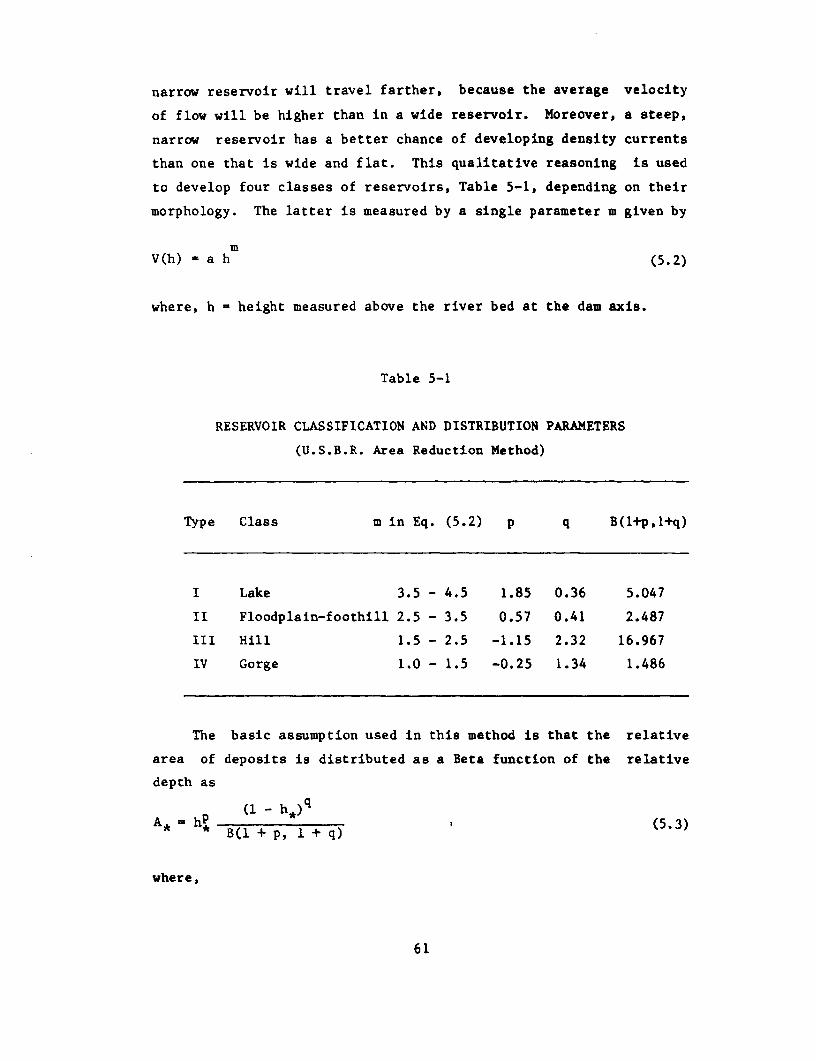
to develop four classes of reservoirs, Table 5-1, depending on their
morphology. The latter is measured by a single parameter m given by
mV(h) - a h (5.2)
where, h - height measured above the river bed at the dam axis.
Table 5-1
RESERVOIR CLASSIFICATION AND DISTRIBUTION PARAMETERS
(U.S.B.R. Area Reduction Method)
Type Class m in Eq. (5.2) p q B(1+p,1+q)
I Lake 3.5 - 4.5 1.85 0.36 5.047
II Floodplain-foothill 2.5 - 3.5 0.57 0.41 2.487
III Hill 1.5 - 2.5 -1.15 2.32 16.967
IV Gorge 1.0 - 1.5 -0.25 1.34 1.486
The basic assumption used in this method is that the relative
area of deposits is distributed as a Beta function of the relative
depth as
(1 - h*) q
* B(l + p, l + q)
where,
61
A (h *) A ' (5.)Af
ref
h h (5.5)H
B(.,.) = Beta function, parameters p and q are functions of
reservoir class, See Table 5-1, A(h) surface area of deposit at
elevation h, A 5 parametric area of deposit and, H - value of href c
for the active conservation pool level. The vertical distribution
of volume of deposit, V is a function of h, asd
h
Vd(h) f dA(y) dy ; h4L H (5.6)
0
and, the total volume of deposits upto the active conservation level
is V (H ). The value of parameter A can be computed from thed c ref
fact that for the level of deposit at the dam axis, the surface area
of deposit is equal to the surface area of the reservoir itself.
This condition is expressed as
Vd (Hc Vd(h) 1 |d( o)
H A(h ) A*(h* ) L:(H;)
where, h - height of deposit at the dam axis and h h /H . Both0 *0 0 c
the left and right hand sides of Eq. (5.7) represent the average
height of deposits above h , taken as the prismatic volume above0
A(h ) and, expressed as a fraction of H . The left hand side is ao c
function of reservoir morphology and h and, the right hand side is0
a function of parameters, p and q and h . Eq. (5.7) is solved by
trial and error for h . The corresponding value of A is obtained*0 *o
from Eq. (5.3) and of A from Eq. (5.4). Values of A are thenref *
62
calculated for other values of h* and the volume of deposits from
bed upward is computed by numerical integration. A step by step
procedure for the above method based on graphs of Beta functions is
given in U.S. Bureau of Reclamation (1977).
Reservoir pool level is a fluctuating quantity. The
distribution given by the area reduction method is based on the
volume accumulated upto the top of active conservation pool. A part
of deposit, related to the sediment inflow during floods, will be
located above the active conservation level, H . This has to bec
separately estimated and the above method applied to the balance
distributed between O L h 4 H . The proportion of total depositc
above H will be larger for reservoirs that have a greater componentc
of storage capacity allocated to flood control and this may sometime
reduce the utility of area reduction method inasmuch as it does not
treat the volume of deposit above Hc
The area-reduction method has been based on data obtained from
30 reservoirs. It does not account for temporary or prolonged
reservoir drawdown brought about as an operational necessity or as
a deliberate sediment sluicing operation. Also, it does not
consider the sediment size distribution as a factor in the problem.
In practice, these conditions can be accounted for by shifting the
computed reservoir class in Table 5-1 upward or downward. For
example, if the fine material constitutes a large component of the
sediment load, or if the reservoir experiences considerable
drawdown, its class should be shifted downward.
Frequently, a reservoir will not have a unique value of m for
its entire depth. In such cases, the reservoir class in Table 5-1
is selected on the basis of m value in the segment where most of the
deposit will occur. A problem in selecting the reservoir class is
also experienced in compound reservoirs. The only recourse in that
case is to use some judgment in selecting the reservoir class and to
63
apportion the volume of deposit to each segment of the reservoir
(Dorough, 1986).
This method is to be applied to the distribution of deposits
accumulated over long periods, such as a few decades and not for the
year-to-year accumulation. Application of the method to reservoirs
that significantly differ in design, operation and sediment
characteristics from those used in its derivation may yield
substantially inaccurate results.
Mathematical Models
Mathematical analysis of sedimentation transients is based on
the premise that the dynamic action of flow acting through sediment
transport is the driving force and sediment deposit (or scour) takes
place due to the spatial variations in the transport rate. As the
sediment transients move at a much small rate compared to the celer-
ity of water waves, the discharge can be considered to be steady
during the time interval used to compute scour/deposition [e.g.,
Mahmood, (1975), Chen, et al (1975)]. Given this simplification, the
govern-ing equations for the sediment transient are
Equations of Motion:
-3 Q I Q 2 ~~~~~~~~~~~~~(5.8)at (gA )+ x (g +Y
Equation of Continuity of the Bed Material:
aG ac a a (5.9)b + s + (C A) + p*- (B z) =0
3x 3x at s at d
where, Q - discharge; g - gravitational acceleration; A - area of
cross section; y - water surface elevation; S - energy gradient;
64
G = bed load; G = suspended load; C average spatial sedimentb s sconcentration in the cross-section; p* = density of sediment in the
bed; B = the deformable bed width; z = bed elevation; x = distanced
along the channel bed measured in the downstream direction and, t -
time.
Eqs. (5.8) and (5.9) form a set of hyperbolic equations. They
require two supplementary equations. One relating S and the other
relating sediment transport quantities: G , G and C , to the flowb s s
and sediment size values. For uniqueness, they also require the
initial conditions and boundary conditions to be specified. In
reservoir sedimentation, the accuracy of initial conditions is not
very critical because they are overtaken by the deposition process.
At the downstream end, hydrograph of reservoir pool elevation
provides appropriate boundary condition and at the upstream end, the
discharge and sediment inflow hydrographs provide the necessary
boundary conditions. The model results are very sensitive to the
sediment inflow boundary condition and to the accuracy of
supplementary equations used to compute sediment transport
quantities.
The above equations constitute a one-dimensional representation
of sediment transients. They can be solved by one of the finite
difference schemes. In implicit formulations (e.g., Mahmood and
Ponce, 1976), that solve the two equations simultaneously over the
total space domain, the numerical stability problems are much
smaller but, the development of computer program is more expensive.
In a simple, sequential-explicit formulation, the dynamic Eq. (5.9)
is first reduced to steady nonuniform flow by dropping out the
unsteady term. It is solved by backwater computation methods and is
followed by the calculation of bed level changes through Eq. (5.10).
The advantage is a rather simple solution algorithm but numerical
stability considerations will require small time steps. Total
computational time, however, may or may not be larger than the
65
implicit method. Other advantages of this method are that any
sediment transport function, irrespective of its complexity can be
used in the computer analysis and channel networks can be easily
handled.
Another consideration in mathematical modeling of reservoir
sedimentation is that because of strong hydraulic sorting of
sediment sizes in reservoirs, bookkeeping of sediment deposit is to
be maintained by various grain size fractions at different
elevations in the deposit. This is necessary to realistically model
the reentrainment of deposits under lower pool elevations and is
especially critical if the size distribution of sediment is such
that an armor layer may develop during sediment reentrainment phase.
Such a bookkeeping is much easier done with the sequential-explicit
algorithms. The most popular and commonly available program pack-
age, based on this algorithm, is U.S Army Corps of Engineers' HEC-6
program (1977). HEC-6 provides for bookkeeping of deposits by
various particle size classes and any sediment transport function
appropriate to the conditions at a site can be built into it. This
model has been adapted to the special conditions at proposed
Kalabagh Dam for investigations relating to Project Planning Report,
executed under the World Bank supervision (Pakistan WAPDA, 1984).
A major difficulty in the application of available reservoir
sedimentation models arises from the fact that none of the available
bed material load functions has been tested on deep reservoirs flows
or for the degree of nonuniformity of flow experienced in large
reservoirs. Toffaleti's method (1969), among all of the available
functions, is based on the largest range of flow depths but even
that falls short of the depth found in large reservoirs. The bed
material load functions are, also, deficient in their treatment of
fine material load (Chapter IV). In most sandbed rivers, this is a
serious handicap because 50 percent or more of the total load in
these streams lies in clay-silt size range. In general, the bed
66
transient models will adequately simulate the sedimentation
processes over the delta but downstream of that their reliability is
questionable. These difficulties have given rise to another type of
models that treat the reservoirs as desilting basins.
Hurst and Chao (1975) abandoned the one-dimensional transient
model in their planning studies for Tarbela Dam. Instead, they
adopted Camp's (1944) trap efficiency curves for desilting basins.
Such a model will most likely succeed in the early life of
reservoirs that do not experience significant drawdown. When the
delta has formed in the reservoir and at least part of the reservoir
flow is of riverine type, the method will fail because desilting
basin models, such as Camp's, are based on the assumption that the
lower boundary of the basin is an absorbing boundary with no
reentrainment. The operational experience at Tarbela shows that
Hurst and Chao's analysis grossly under-estimated the streamwise
progression of delta. The actual delta crest after 9 years operation
was located about 12 miles upstream of the dam instead of 30 miles
predicted by their model. This is directly attributable to the
afore mentioned reason.
A sediment diffusion model has been used by Merrill (1980) to
simulate the sedimentation in three reservoirs in Nebraska and
Illinois in which 90 percent of sediment load consists of clay-silt
sizes. This model is based on two dimensional diffusion equation
solved by an explicit numerical scheme. The reservoir is divided
into cells of similar area in plan and incoming sediment load is
routed through these cells from the inlet to the outlet. The
diffusion constant is a key parameter of the problem and it was
empirically computed from the available reservoir sedimentation
data. The conceptual approach of Merrill's study is appropriate and
it shows that diffusion type models can be applied to reservoir
sedimentation where the primary sediment load is in clay-silt range
and reentrainment of deposits is not present. At present (1986),
67
realistic values of sediment diffusion coefficient in reservoir
flows are not available and the erosion functions for silt and
clays, that are important in fine material dominant streams are not
sufficiently known.
Evaluation
Reservoir sedimentation is a complex phenomenon in the sense
that definitive knowledge on many of its physical processes is not
available. Examples of processes that strongly influence the form
and location of deposits but which cannot be predicted with
sufficient certainty are: three dimensional nature of flow; chemical
regimes and stratification in the reservoir; three dimensional
features of density currents; flocculation of clays; fall properties
of flocs and, threshold conditions as well as rate of reentrainment
of fine material deposits.
Two primary inputs to the reservoir, water discharge and
sediment load, naturally vary from year to year and in certain
cases, catastrophic events in a catchment may impose unprecedented
loading, far different from the average. The use of a reservoir is
bound to undergo some change during its lifetime and more
importantly, economic factors may evolve in the future with a
consequent shift in the project objectives. Under these
circumstances, predictive methods in reservoir design analysis can
only be expected to provide a statistically averaged answer based on
the present perception of the future. In the actual future,
csubstantial deviations from the present predictions may occur
because, there is no control on the magnitude and sequence of future
inputs and, future operation policies may differ from those assumed
at the design stage.
68
With the increasing age of world reservoirs, their problem of
siltation is currently in the fore front. There is a greater
emphasis on prolonging the life of reservoirs both in the design of
new projects and in the operation of existing structures. Predictive
methods are needed to evaluate the performance of measures such as
sediment sluicing and flushing used to alleviate the rate of
reservoir sedimentation. Also, there are new areas of concern such
as the particle size distribution of sediment carried by flow
releases that were not quantitatively treated in the past. The
evaluation of empirical and mathematical modeling techniques has to
be viewed in this context.
The essential difference between the empirical and mathematical
modeling techniques for reservoir sedimentation lies in their scope.
The empirical techniques are simple and mostly graphic. They are
expected to yield an approximate answer. They do not require
advanced technical skills or computers in their application. Hence,
they are relatively inexpensive to use. Empirical models cannot be
used to predict the time-dependent behavior of reservoirs within a
yearly cycle or even, over a few years. Also, they are not suitable
for special operational conditions applicable to mitigative measures
discussed in Chapter VI.
The mathematical models, on the other hand, are broader in
scope. They require specialist technical inputs and computational
skills and more importantly, they require considerably greater data
inputs. They are, consequently, two to three orders of magnitude
more expensive than the empirical methods. In contrast with their
empirical counterparts, properly developed and calibrated
mathematical models can be used to analyze time-dependent behavior
of reservoirs, including special conditions imposed by sediment
sluicing and flushing operations (See, Chapter VI). At the current
(1986)'state of-the-art, mathematical models are based on hydraulic
resistance and sediment transport functions that have been derived
69
from open channel flow. Their applicability to the deep flow in
storage reservoirs has not been investigated so far. Bed material
type transport functions derived from channel flows are not expected
to apply to the fine material load which is the dominant fraction
and which plays an important role in reservoirs. The lack of know-
ledge on the reentrainment of clays after they have initially
deposited in reservoirs and the sensitivity of density current
formation to thermal and chemical regimes of impounded waters, also,
makes the results of present day mathematical models approximate to
an extent.
Many small projects, cannot bear the cost of detailed
investigations by mathematical models and will have to rely on the
empirical models. On most of the large projects, engineering
investigations, involving simultaneous applications of different
mathematical models for various components of the problem and some
original investigations will be found to be economically
justifiable. There is a need to improve the accuracy of both the
empirical methods and mathematical models. This is discussed in
Chapter VII.
70
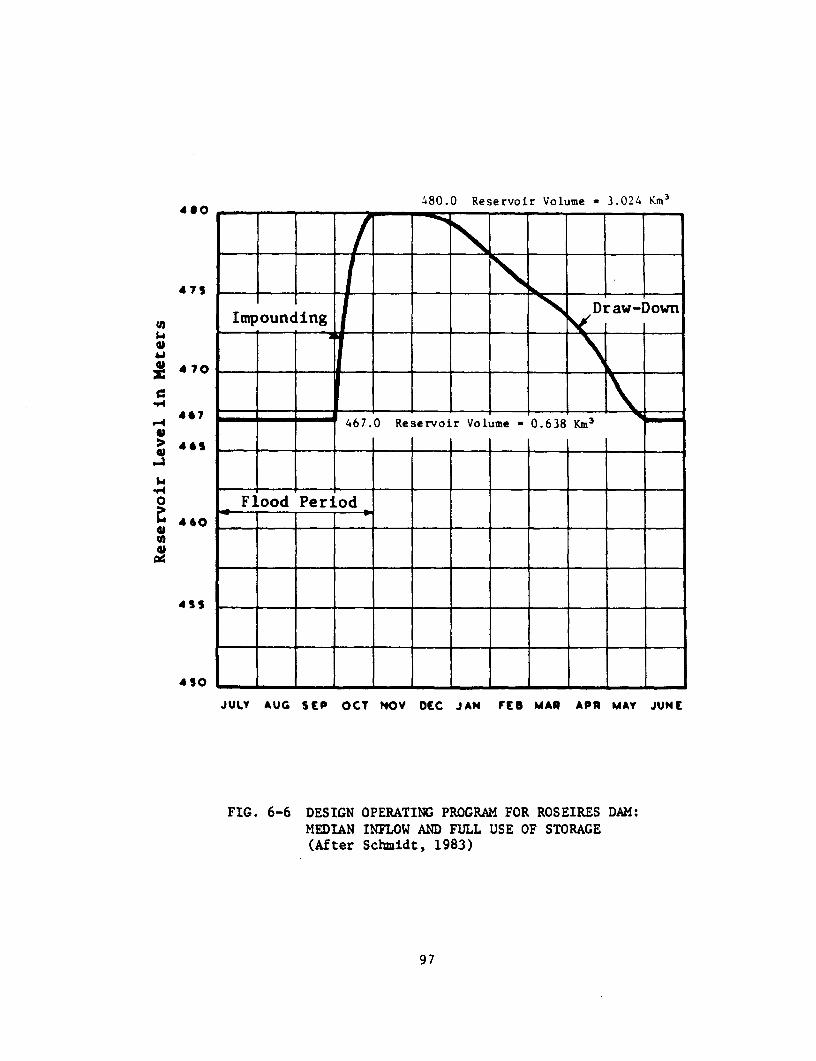
CHAPTER VI
MITIGATION OF RESERVOIR SILTATION
Loss of reservoir storage to siltation is the primary concern
in this monograph. Reservoirs have other sediment related impacts
on the river channel upstream and downstream, such as retrogression
of river bed level on the downstream side and the aggradation and
flooding on the upstream side. Some of these adverse effects are
also mitigated if the accumulation of sediment within the reservoir
is reduced. For example, if the incoming load is flushed through,
the channel deterioration is ameliorated to a large extent. In this
chapter, the mitigation of loss of storage to sediment accumulation
remains to be the main concern. Benefits accruing to other areas
will, however, be identified where applicable.
The methods for controlling reservoir sedimentation can be
divided into three categories. The first category consists of
methods that reduce sediment inflow into the reservoirs. These are:
control of sediment generation through watershed management; reten-
tion of sediment in debris basins before the river enters the reser-
voir and, bypassing sediment. The second category consist of
methods that use hydraulics of flow to reduce the accumulation of
load that has entered the reservoir. Sediment flushing operations,
sediment sluicing through specially designed reservoir operation
policies and release of density currents belong to this category.
The third category consists of hydraulic dredging of existing
sediment deposits. All of these methods have been tried to some
extent and, generally, none of them will provide a complete
mitigation. These methods, their scope and limitations are discussed
in the following.
71
Watershed Management
Intuitively, the first method of reducing reservoir siltation
would be to reduce sediment yield from the basin upstream of the
reservoir by watershed management. Such a scheme would involve
afforestation, land use change and construction of micro structures
to control gulley erosion and to trap sediment. The forests are an
indispensable component of world's ecological system. As such,
watershed management as a means to provide sediment control in
reservoirs always finds strong moral support. Facts, on the other
hand do not support its efficacy, as far as reservoirs are
concerned.
The world average for sediment load concentration is less than
500 ppm, (See Chapter III, page 26). This is almost an ideal
situation for reservoirs. With this concentration, a storage built
with a gross volume equal to mean annual flow will lose less than
0.04 percent of volume to siltation each year, compared to about 1
percent of the estimated average rate of siltation of world dams.
Consideration of sediment load in world rivers in Chapter III has
shown that high concentrations of sediment are largely associated
with climatic, tectonic and geological factors. The effectiveness of
human actions in controlling these processes is doubtful. There is
the additional factor of watershed acting as a strong low pass
filter which dampens the space and time variations of sediment
generation within the basin. Coon Creek data (Chapter III--Human
Impact on Sediment Yield) appear to support the conclusion one would
draw from the physical processes operative in drainage basins, that
over periods of engineering or economic interest, the sediment
yields are largely unaffected by watershed management. The
sediment sources within the basin, including its hillslopes, valley
floors and river channels will amply make up for whatever reduction
of erosion can be effected by watershed control. A case in point is
Mangla watershed in Pakistan, where an extensive watershed
72
management project was initiated before the construction of dam.
Mangla Dam is a multipurpose, 112 m high earth-rockfill dam on
Jhelum River in Pakistan with a crest level of 376.1 m. The design
maximum reservoir elevation is 374.3 m, the top of conservation pool
is at elevation 366.4 m and that of the dead capacity at 317.0 m.
The total storage capacity of the reservoir to elevation 374.3 is
9.47 km3; usable capacity from elevation 317.0 to 366.4 is 6.58 km3
and the dead capacity is 0.67 km3. The catchment area of Mangla is
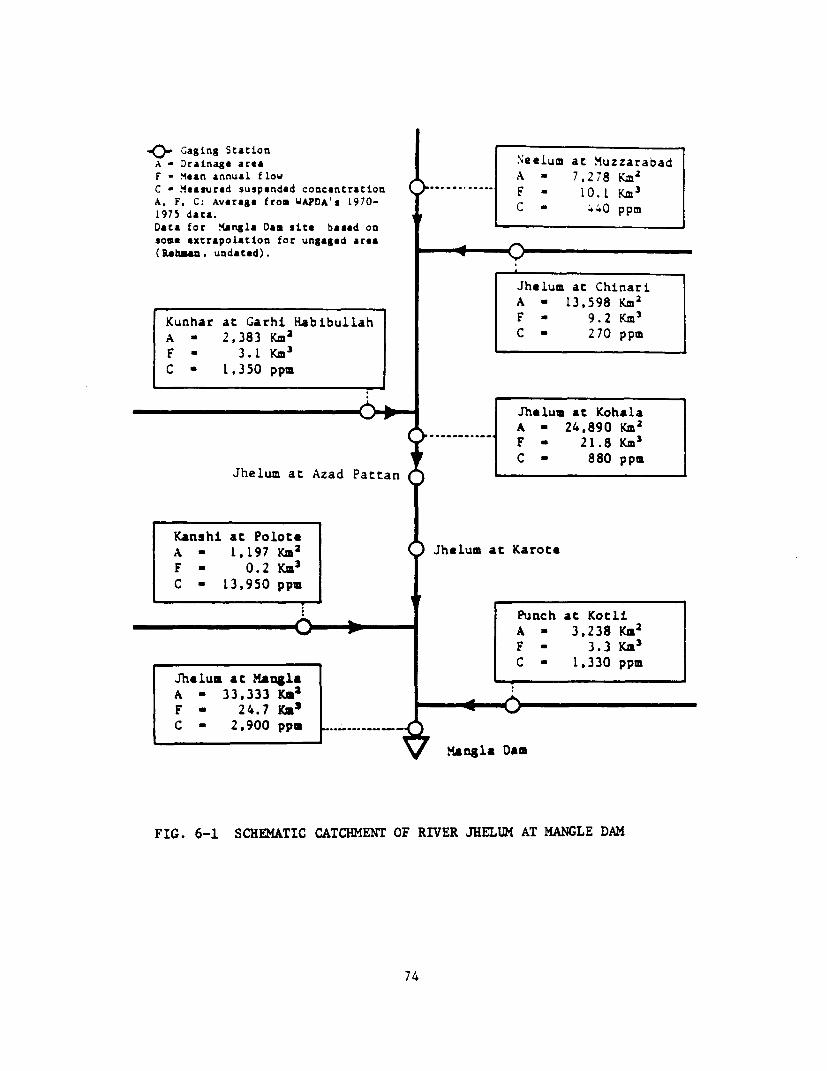
33,333 km 2 . A schematic of Mangla catchment, including gaging
stations, is shown in Fig. 6-1. Also shown in this figure are sub-
catchment areas, their mean annual flow and measured suspended load
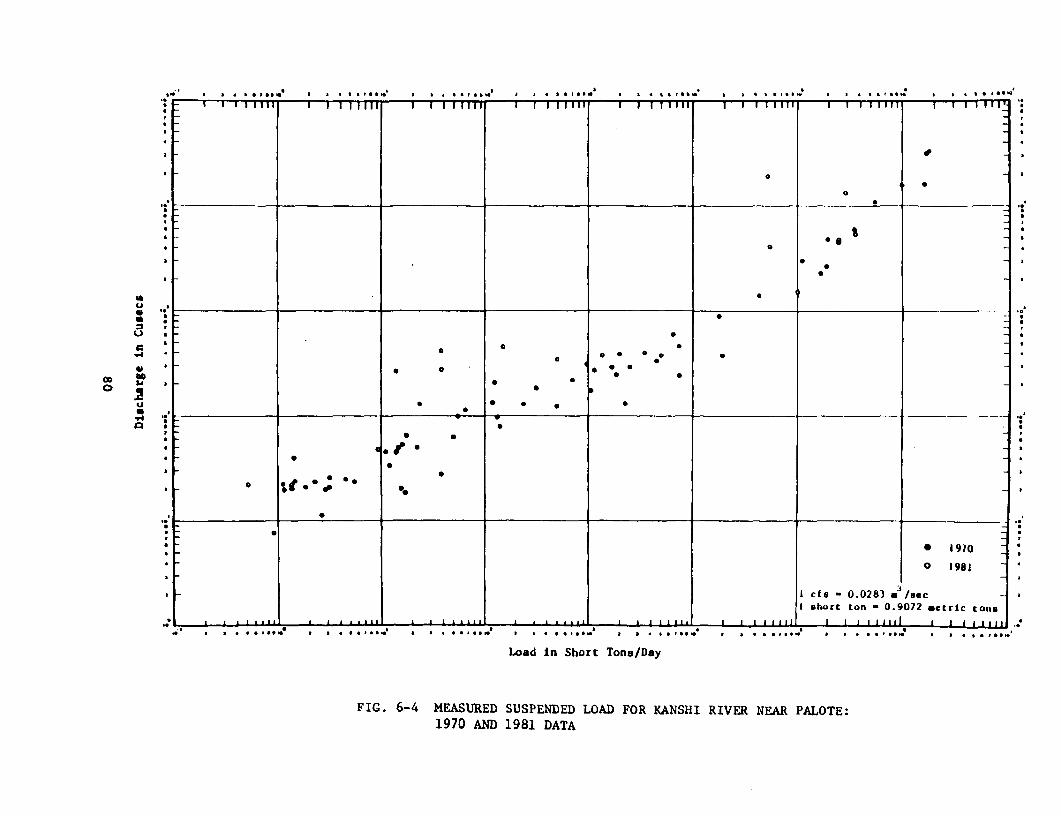
concentration for WAPDA's 1970-75 data (Rehman, A., undated).
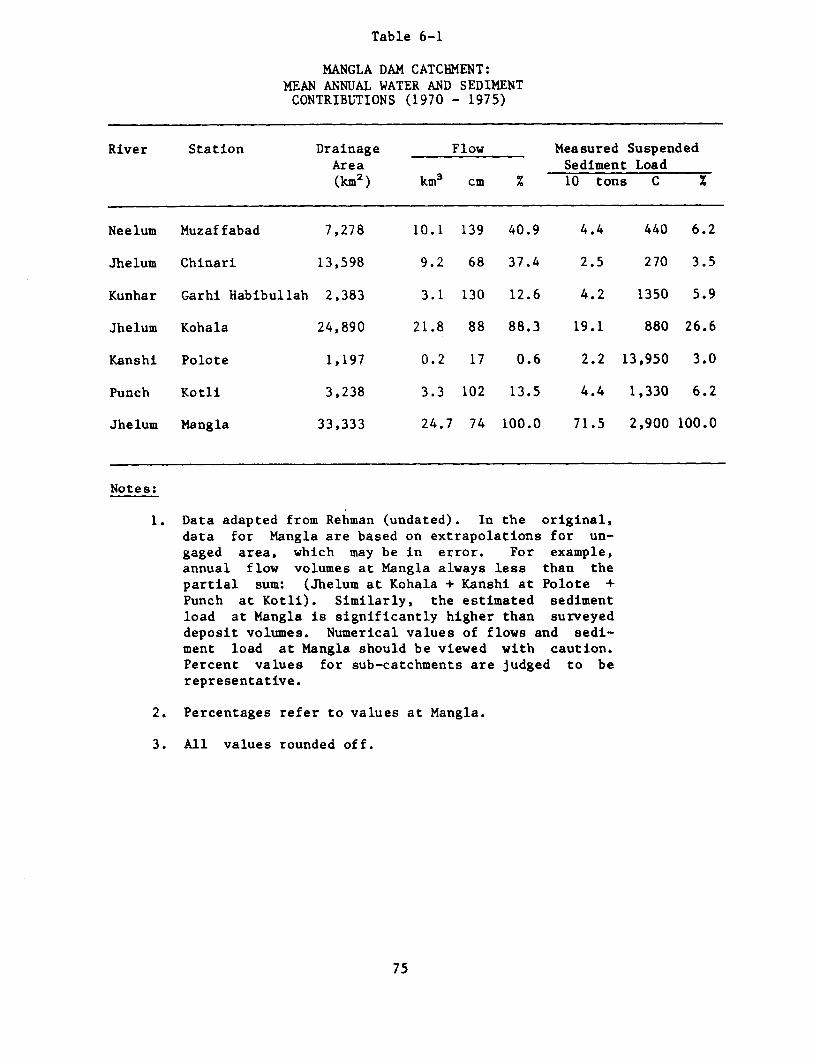
Relevant data for sub-catchments are tabulated in Table 6-1. It is
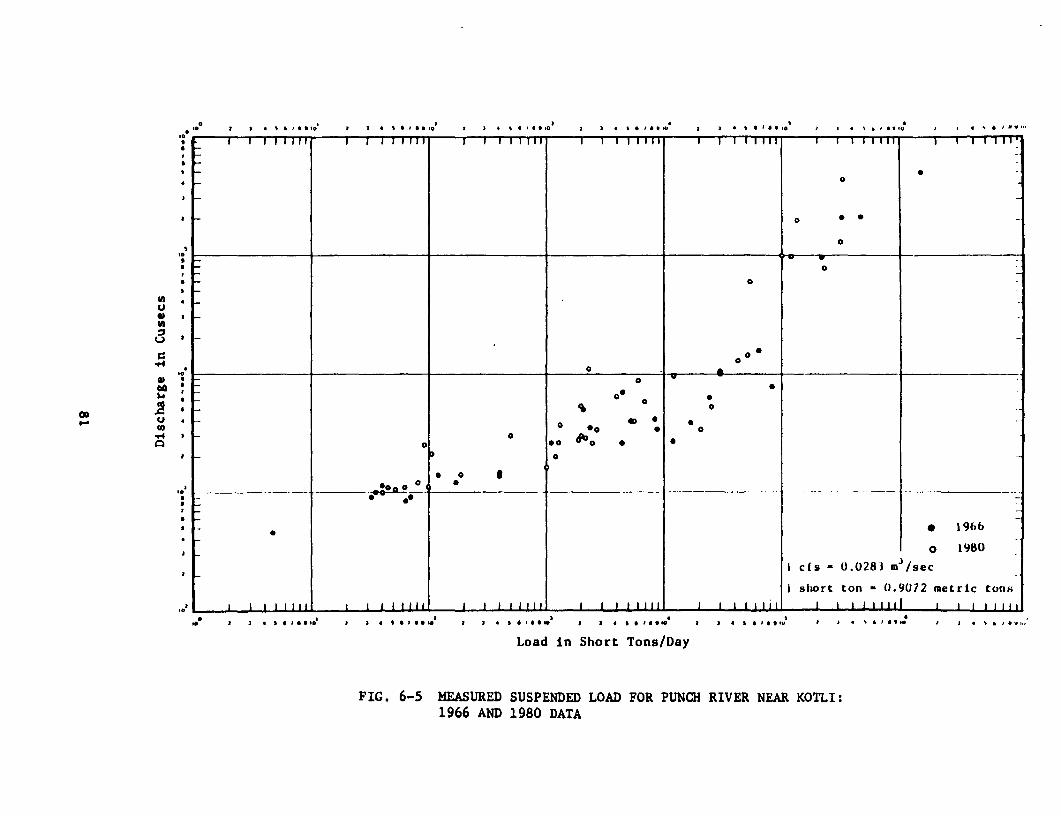
seen that of the gaged streams, Kanshi River brings in the highest
concentration of sediment followed by Kunhar and Punch, both of
which have roughly equal concentrations. The main sediment
contribution of 73.4 percent comes from area below Kohala which
contributes only 11.7 percent of flow volume.
Two reservoir sedimentation surveys were carried out in Mangla
reservoir during 1970 and 1973. They measured average annual deposit
of 0.037 km3. According to its design operation, the reservoir is
filled up in late August when most of the heavy sediment
concentration has passed. Field inspections have shown no backwater
deposits at the reservoir inlets. Power inlets are located about 31
m above the original river bed. Sediment concentrations have been
periodically measured in the power flow and generally average about
25 ppm. Larger concentrations associated with high river flows have
been measured up to 430 ppm (river flow - 11,160 m3/sec; reservoir
level - 365m). They are, probably, associated with weak density
currents. The average trap efficiency of the reservoir is estimated
to be around 99 percent.
73
..Q.. Gaging StationA - Drainage area Neelum at MuzzarabadF - Mean annual flow A a 7,278 Km2
C - Measured suspended concentration F - 10.1 Km3A. F. C: Average from WAPDA's 1970- C a 440 ppm1975 data.Data for Mangla Dam site based onsome extrapolation for ungaged area(Rehmam, undated).
Jhelum at ChinariA - 13,598 Km2
Kunhar at Garhi Habibullah F - 9.2 Km3
A a 2,383 Km2 C - 270 ppmF - 3.1 Km33
C - 1,350 ppm
L Jhelum at KohalaA - 24,890 Km2
,hu a A_a_ a F a 21.8 KM3
C a 880 ppmJhelum at Azad Pattan t
Kanshi at PoloteA - 1.197 Km2 Jhelum at KaroteF - 0.2 KM3
C - 13,950 ppm
Punch at Kotli_0= A - 3.238 Km2
F - 3.3 KM 3
C - 1,330 ppmJhelum at ManglaA - 33,333 Km2F a 24.7 KM3 0C - 2,900 ppm _ ....
mangla Dam
FIG. 6-1 SCHEMATIC CATCHMENT OF RIVER JHELUM AT MANGLE DAM
74
Table 6-1
MANGLA DAM CATCXMENT:MEAN ANNUAL WATER AND SEDIMENT
CONTRIBUTIONS (1970 - 1975)
River Station Drainage Flow Measured SuspendedArea Sediment Load(kM2) km3 cm % 10 tons C x
1. Data adapted from Rehman (undated). In the original,data for Mangla are based on extrapolations for un-gaged area, which may be in error. For example,annual flow volumes at Mangla always less than thepartial sum: (Jhelum at Kohala + Kanshi at Polote +Punch at Kotli). Similarly, the estimated sedimentload at Mangla is significantly higher than surveyeddeposit volumes. Numerical values of flows and sedi-ment load at Mangla should be viewed with caution.Percent values for sub-catchments are judged to berepresentative.
2. Percentages refer to values at Mangla.
3. All values rounded off.
75
A brief description of various sub-catchments at Mangla Dam
(Pakistan WAPDA, 1961) follows:
River Neelum rises at about 5,200 m elevation and has a
gradient of about 1.86 percent in 240 km length. A significant
part of its runoff originates in the glaciers and permanent
snow fields of Nanga Parbat Massif. Mean annual precipitation
in its catchment is about 150 cm.
River Kunhar rises at an elevation of about 4,270 m. Glaciers
and small ice fields of Kaghan with mountain peaks around 5,000
m elevation, are an important source of its water supply. In
its upper 130 km, the river has a slope of about 1.89 percent.
Mean annual precipitation in its catchment is about 150 cm.
River Jhelum at Chinari passes through a number of lakes in
Kashmir Valley where it loses most of its sediment load. In
the last 130 kms, it has a gradient of about 0.62 percent.
Mean annual precipitation in this catchment is around 120 cm.
Kanshi River rises in gravel uplands at an elevation of about
760 m. It has an average gradient of about 0.47 percent.
Average annual precipitation in this catchment is around 95 cm.
Punch River rises at an elevation of about 3,050 m. Over a
length of about 130 km, it has a gradient of about 1.89 per-
cent.
A watershed management project was prepared for Mangla in 1959.
This comprised two sub areas. An area of 7,640 kM2, in the lower
catchment, considered to be the most serious sediment contributor,
was selected for priority treatment. This area was photographed and
mapped for land use and capability. Another area of about 7,800 km2
covering the northern tributaries of Neelum and Kunhar was
76
considered to be less serious and it was not photographed. Most of
the rocks in the study area are inherently erodible--from the uncon-
solidated loess to the limestones and schists which have suffered
continual disturbance by earth movement. The overall geologic
erosion is judged to be high due to precipitous hill slopes. The
vegetal cover, even at high altitudes, has been disturbed by human
activity, to an extent that it is ineffective against erosion. In
the priority area, good protective forest covers less than one
percent of the area.
The management project comprising a large number of structural
and non-structural measures in the priority area, started in 1959-60
with the primary objective of reducing the sediment load at Mangla.
It was anticipated that as a result of the project, sediment load at
Mangla will reduce by about 30 percent, with most of the reduction
effected in the loads contributed by Kanshi and Punch Rivers. The
project also aimed at ameliorating local environmental conditions
and improving productivity. The 30-year project has been phased
into a seven-year demonstration phase (1959 - 1966), followed by a
23-year operation phase. Estimated total cost of project, up to
1988, is Rs 339.3 millions.
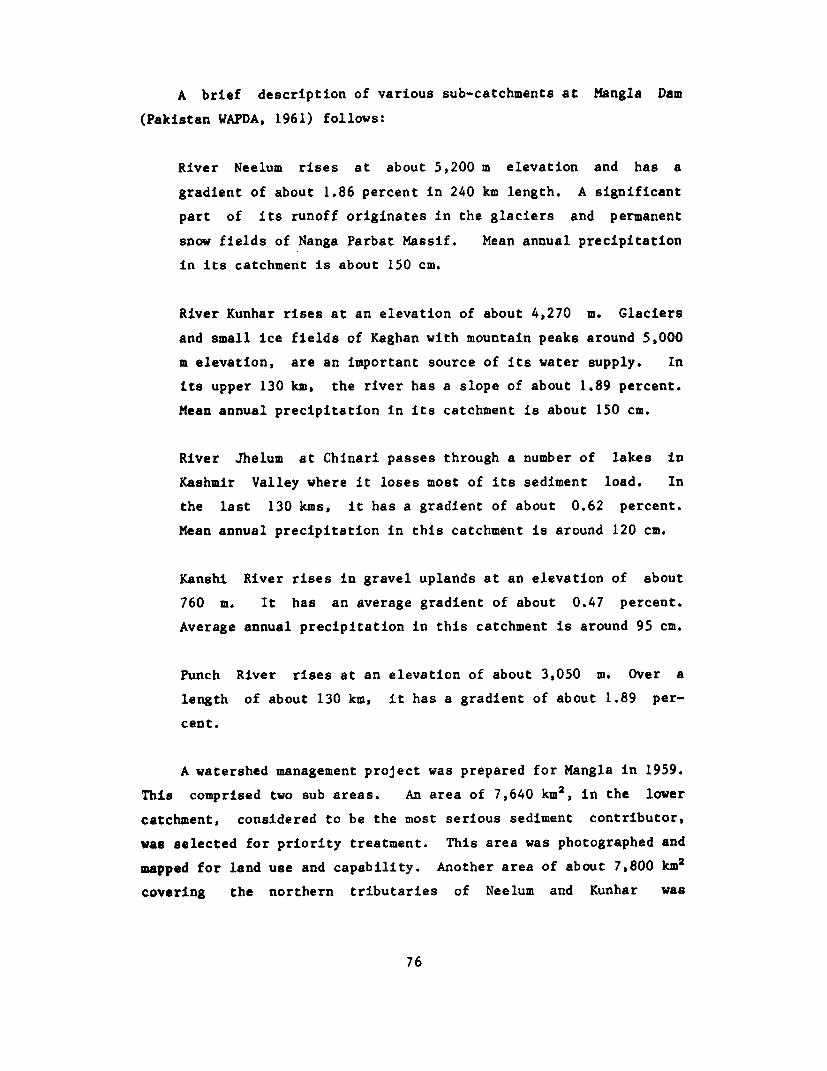
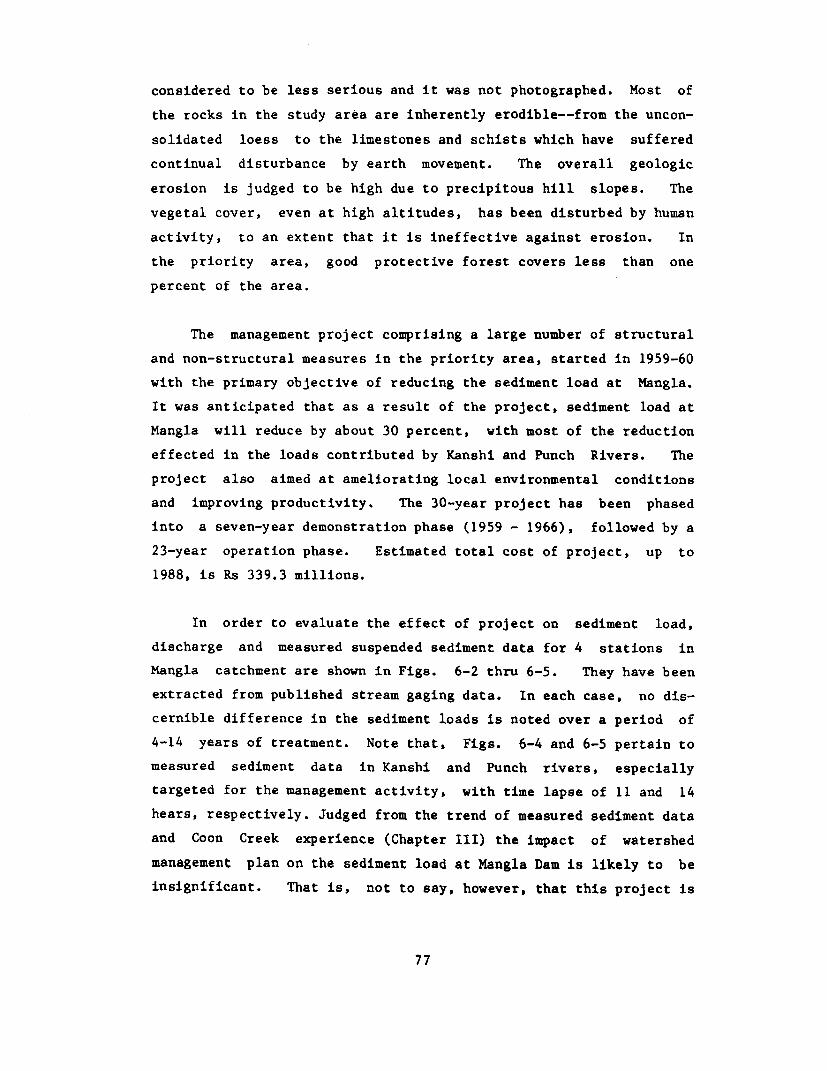
In order to evaluate the effect of project on sediment load,
discharge and measured suspended sediment data for 4 stations in
Mangla catchment are shown in Figs. 6-2 thru 6-5. They have been
extracted from published stream gaging data. In each case, no dis-
cernible difference in the sediment loads is noted over a period of
4-14 years of treatment. Note that, Figs. 6-4 and 6-5 pertain to
measured sediment data in Kanshi and Punch rivers, especially
targeted for the management activity. with time lapse of 11 and 14
hears, respectively. Judged from the trend of measured sediment data
and Coon Creek experience (Chapter III) the impact of watershed
management plan on the sediment load at Mangla Dam is likely to be
insignificant. That is, not to say, however, that this project is
FIG. 6-3 MEASURED SUSPENDED LOAD FOR JHELUM RIVER AT KAROT:1969 AND 1979 DATA
.0B S 8 * * *p**U S | a a ChC S C a CISI. U I * hC a e*@ a . .b .. af ^* a * C |*II . a .a I*. . a a9t a %*., ., ,,,, ,,11 ,,,, ,, ,,,,,,, ,, ,,,,,,, ,- 111111 I 1111 """ '111 ' """11 ' ' ""'1 '
* i * a-1gi
I. _________ _I cfs 0.0283 a3/ec - .
I sbort ton - 0.9072 metric totnc
Load in Short Tons/Day
FIG. 6-4 MEASURED SUSPENDED LOAD FOR KANSHI RIVER NEAR PALOTE:1970 AND 1981 DATA
eo a a , s , * * ^,,' a X s * 3 * * oa I 3 4 1 3 I 0 1 ,*
*o I I iiiiil I I 11111) I I 111111 I I 111111 I I I Illil1 I I 1 111t11 , ,, ,,,,,
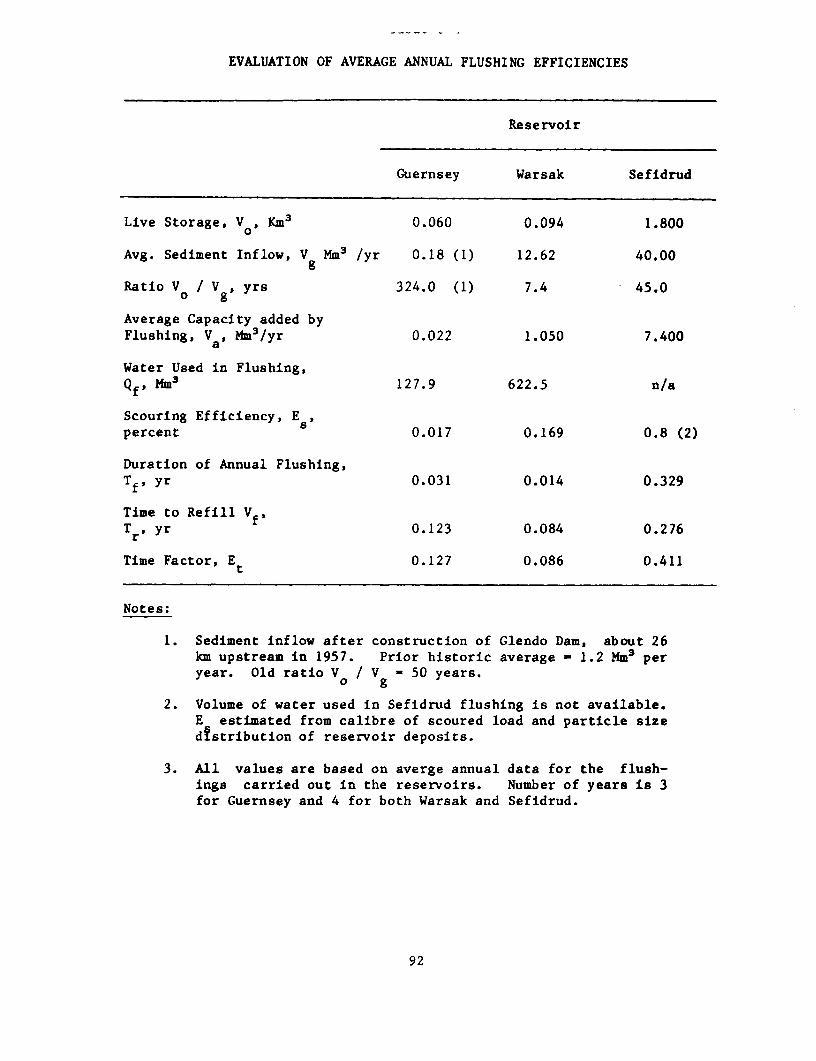
Duration of Annual Flushing,Tfs yr 0.031 0.014 0.329
Time to Refill Vf5Tr, yr 0.123 0.084 0.276
Time Factor, Et 0.127 0.086 0.411
Notes:
1. Sediment inflow after construction of Glendo Dam, about 26km upstream in 1957. Prior historic average - 1.2 Mm3 peryear. Old ratio VO / Vg - 50 years.
2. Volume of water used in Sefidrud flushing is not available.E estimated from calibre of scoured load and particle sized!stribution of reservoir deposits.
3. All values are based on averge annual data for the flush-ings carried out in the reservoirs. Number of years is 3for Guernsey and 4 for both Warsak and Sefidrud.
92
Judging from value of E , it appears that increasing the durationt
T , under the present conditions, would be most beneficial forf
Warsak, Guernsey and Sefidrud, in that order.
The flushing operations, by releasing sediment load to the
downstream river channel will tend to counter the retrogression set
in by the impoundment to some extent. However, due to the sudden
release of large sediment slugs, channel blockage may take place and
create problem of flooding and channel deterioration over the short
run. On the upstream side, the flushing operation will tend to clear
the backwater deposits to some extent. If the bedload comprises
gravel, this action will be limited by the development of an armor
layer. There are other problems related to flushing, such as, the
abrasion caused by high sediment concentrations and possible
blockage of outlet gates by sediment deposits. The former will
require special abrasion resistant treatment for the outlet
structure and possibly, periodic repairs. To prevent the blockage
of gates, special protective devices should be built. A siphon inlet
to cope with the blockage problem has been provided in Santo Domingo
Reservoir (Krumdieck and Chamot, 1979).
Sediment Sluicing
in contrast with sediment flushing, sediment sluicing is an
operational design, in which the main sediment load coming into a
reservoir is released along with the flow-mostly before it can
settle down. The earliest and perhaps the most successful example
of sediment sluicing is the Old Aswan Dam on Nile River in Egypt.
Aswan Dam (Assiouti, 1986, Leliavsky, 1960) was originally
built as a single purpose regulation structure during 1898 - 1902 to
provide summer irrigation supplies to the Middle Egypt. The struc-
tural height of the dam was 38.8 m, with a length of 1.95 km and a
storage capacity of 1.06 km3 . At that time, the mean annual flow of
93
Nile at Aswan was estimated to be 84 km3. The design of Aswan Dam
was predicated on the principle that the sediment load of the river
has historically formulated the main fertilizer of Egypt and that it
should not be held back in the dam. This led to a pattern of
operation that allowed the flood flow to be passed through without
significant heading up, till most of the heavy sediment concentra-
tion in the river has passed. The measure was a gage height of 88 m
at a location of 15 km downstream. The reservoir was filled in
about 3 months with nearly clear water, which was then used over
the next 4 months till the beginning of next year's flood. To allow
the flood waters to be passed unobstructed through the dam, about
2,000 m 2 of sluice gates opening were provided near the river bed.
The design proved to be successful and the dam was twice raised--in
1912 and 1933.
After the last raising, the structural height of the dam
increased to 52.80 m, design reservoir level was raised from the
original elevation 106 m to 121 m, the length increased to 2.14 km
and the storage capacity to 5.6 km3. The increased capacity made it
necessary to start impoundment, somewhat earlier--at the reference
gage height of 90.5 m. In the final design, the dam had 180 sluices
in four groups with their sill levels at the river bed elevations of
87.65, 92.00, 96.00 and 100.00 m, respectively. The sluices, with a
total cross sectional area of 2,240 m2, were kept fully open during
flood months of July, August and September. They could pass about
6,000 m3/s during normal flood or more than twice this flow rate
during a high flood. The sluices were closed in October, and the
reservoir was filled to elevation 121 m. This was held constant
from January to April when the river flow was sufficient to meet
irrigation requirements. The storage was used upto elevation 100 m
from May to Mid-July. With this regulation, the amount of siltation
measured in the reservoir was insignificant. In 1960, the construc-
tion of a power house was completed and hydropower generation
started at the dam. For power, the minimum reservoir level was
94
raised to at elevation 105 m. In 1964, High Aswan Dam with a
storage capacity of 157 km3 was completed about 6 km upstream of the
old dam and the reservoir level at Old Aswan Dam was lowered. In
1986, a second power house, Aswan II Power Plant has been completed
at the Old Dam (Ministry of Electricity and Energy, Egypt, undated)
to maximize the power production from the releases at High Dam.
With the completion of the new power house, 92 of the original
sluices have been plugged with concrete and the reservoir level has
been lowered to elevation 110 m. During the last construction, it
was noticed that about 200,000 m3 of sediment deposit existed in
front of the dam and was cleared by dredging. As the High Dam has
completely cutoff the sediment supply to old dam, the old pattern of
sediment sluicing is no longer relevant.
Essentially, the same principle of sediment sluicing was
adopted in the design of Roseires Dam on Blue Nile in Sudan. This
dam, completed in 1966, has a structural height of 68 m and a length
of 13.5 km (Ministry of Irrigation and Hydro-electric Power,
undated). The central concrete section, 1 km long, has 5 deep
sluices 10.5 m high by 6.0 wide placed at an invert level of 435.5
m, which is the river bed level in the main channel. Away from the
deep sluices, an overflow spillway is provided with a crest level of
463.7 m. This has 10 radial gates 12.0 m high by 10.0 m wide. The
design reservoir level is 480.0 m. At this level, the lake is 75 km
long and it has a gross storage capacity of 3.0 km3. Live storage
capacity to elevation 467 m is 2.4 km3. In a second stage, the
design reservoir level will be raised to 490.0 with a gross storage
capacity of 7.4 km3.
Average annual flow in Blue Nile is about 50 km3 at the site.
The average flood peak is 6,300 m3/sec and the maximum recorded
flood during 60-year record is 10,800 m3/s. The design flood capa-
city of sluices and spillway is 18,750 m3/s. The structures can
pass 6,400 m3/s at a reservoir level of 467.0 m.
95
Average annual suspended sediment load at Roseires Dam is
around 121 million tons (2500 ppm). The estimated density of depo-
sits is 1.4 ton/mr3 so that the corresponding volume of reservoir
deposits would be around 87 Mm3. Sediment load during floods is
high and is reported to be 0.44 percent by volume on the average.
After the recession of peak, the average concentration falls to 0.24
and then 0.13 percent by volume.
Proposed reservoir operation program for the Roseires Dam is
shown in Fig. 6-6 for a median year. For 4 months, including the
flood months of July, August and September, the reservoir is main-
tained at elevation 467. The filling to elevation 480 m takes place
during the month of October and by end-May, the reservoir has fallen
to elevation 467 again.
Roseires Dam was completed in 1966 and the power house was
commissioned in 1971. A complete drawdown was attained in 1970. In
the original design, the trap efficiency of the reservoir was esti-
mated to be about 16 percent.
Reservoir surveys (Schmidt, 1983) in 1981 showed that the loss
of capacity during 15 years amounted to 0.55 km3 of dead storage
below elevation 467 and 0.65 km3 of usable storage between elevation
467 and 480. This amounts to an average annual loss of gross sto-
rage of 1.65 percent and a trap efficiency of 46 percent. The
complete drawdown of 1970 has vitiated the average trap efficiency
data, and the actual value would be somewhat higher. If the sedi-2.5
ment load is assumed to vary as Q , a reasonable assumption, the
weighted average reservoir level for the average year works out to
467.8. The corresponding value of capacity: inflow ratio is 0.014,
which give the Brune's value of trap efficiency of 57 percent. This
should be close to the long-term prognosis for Roseires Dam. If the
design method of operation is not followed and the reservoir level
is also maintained at elevation 480 m during June through September,
96
480.0 Reservoir Volume - 3.024 Km34 80 -0
Draw-DownImpounding __ _
*40
r-4 467 ~~~467.0 Reser-voir Volume 0.638 KM3
>S _4____ ___GD
0 Flood Perio
4sO _ ___ _
4 SO t - - - I I - - I
JULY AUG SEP OCT NOV DEC JAN FES MAR APR MAY JUNE
FIG. 6-6 DESIGN OPERATING PROGRAM FOR ROSEIRES DAM:MEDIAN INFLOW AND FULL USE OF STORAGE(After Schaidt, 1983)
97
the weighted average reservoir level would be close to 480 m, with
Brune's trap efficiency of 83 percent. The sluices and the
operation schedule are, thus, seen to save about 3.6 Mm3 of deposit
per year.
The efficacy of sediment sluicing obtained at Roseires Dam is
not as high as that at the Old Aswan Dam. The key to this
difference, lies in the greater width of reservoir at the Roseires
Dam. A comparison between relevant data of the two dams is given in
Table 6-5. It is seen that the ratio of reservoir width to maximum
height (at the top of conservation pool) at Roseires Dam is five
times larger than that at Old Aswan. At Roseires, even when the
reservoir is operated at a lower level, a great deal of sediment
load carried by the flood flows would deposit on the overbank area,
which is not effected by the sluicing operation. This shows that
reservoir morphology is an important variable in the design of
sediment sluicing.
Another important factor in the design and implementation of
sediment sluicing type of operation is the confidence with which the
flow hydrograph can be predicted at the dam site. The operators
will always have a fear that they might miss the opportunity to fill
the reservoir if they wait too long and thus there will be a
tendency to start filling the reservoir sooner than they should.
Comparing the location of Roseires and Aswan dams, this problem must
have been relatively minor at the latter due to its downstream
location in the basin.
Density Currents
Density currents, if they develop in a reservoir, are an
attractive method of ejecting high concentration of fine material.
In general, the width of deposits as well as the depth of flow
increases as the flow approaches the dam. The top level of deposit
98
Table 6-5
COMPARISON OF ASWAN AND ROSEIRES DAMS
Old Aswan Roseires
River Bed Level, m 87.5 435.5
Conservation pool level, m 121.0 480.0
Height of Conservation Poolabove river bed, H, m 33.5 44.5
Mean Annual Flow, km3 84. 50.
Capacity at Conservation Pool, km3 5.6 3.0
Capacity: Inflow 0.067 0.060
Annual Sediment Load, Mm3 80.0 86.6
Dam Length, L, km 2.14 13.50
L/H 63.9 303.4
Measured Trap Efficiency, percent 0. 46.
99
is also irregular across the width and a deep channel may exist in
the deposit on one or both banks of the reservoir. Also, thermal
stratifications, if existing, will be more pronounced close to the
dam itself. All these factors introduce some uncertainty about the
path that will be followed by the density current, so that it is
necessary to provide multi-level, multiple outlets for aspiration of
density currents. As pointed out by Bell (1942) tapping a density
current requires more elaborate monitoring of thermal and salinity
related stratification of reservoirs than has been done in the past.
To an extent, an advanced stage of deposits within the reser-
voir works against the development of density current because, the
slope of deposits is smaller than the original bed of the river.
Development and behavior of density currents is an area where both
laboratory and prototype research can be very productive. This is
discussed, along with other research needs in Chapter VII.
Sediment Dredging
The second most popular suggestion in dealing with reservoir
sedimentation is that of sediment dredging. Cost of the dredging by
present day techniques, which have been developed for river and
harbor conditions is, however, strongly unfavorable. The cost of
conventional dredging alone, without the additional cost of
providing disposal areas and containment facilities, varies from $2
- 3 per m3. The cost of replacement of storage on the other hand is
about $0.12 - 0.15 per m3. If dredged waste cannot be delivered to
the downstream river channel, the cost of dredging will become even
higher and the economic comparison more unfavorable.
Mechanical excavation of small reservoirs in urban setting is
commonly practiced. In this case, the cost and availability of land
for replacement structures is a major consideration and the waste
can be used for industrial or landfill purposes so that, mechanical
100
removal of deposits including haulage of waste by trucks is found to
be economical.
In the conventional dredging methods, a major part of the cost
goes in pumping the sediment-water mixture. In reservoirs,
substantial hydraulic heads are available between the upstream pool
and downstream river level. It should, therefore, be possible to
develop newer dredging techniques for storage reservoirs that
combine dust-pan type dredging with the potential energy of the
reservoir to convey the dredged slurry downstream. A commercial
system, that uses cutter heads, is presently available (Roveri,
1984). The price of this system will vary with location, but it
may be about 3 - 4 times the cost of storage replacement indicated
above. Most likely, there will be hydraulic, sedimentation and
structural problems associated with large heads exceeding 100 m.
As the demand for combating reservoir sedimentation grows,
technological innovations will certainly evolve and will make
hydraulic dredging an economically viable solution in large reser-
voirs. Of all the possible alternatives, hydraulic dredging can
restore the maximum amount of storage because it can treat overbank
deposits which flushing and sluicing cannot handle in wide reser-
voirs. Also, this method under a continuous operation mode, can be
used to stabilize the location of delta within the reservoir.
Hydraulic dredging can also be used to clear the backwater deposits,
thereby mitigating the flooding and water loss problems causes by
coarse material deposits.
The scouring efficiency, E (Eq 6.3), for hydraulic dredging5
will lie between 0.25 and 0.50 percent which is much better than
that possible with prolonged hydraulic flushing. It will take a
smaller amount of water to remove a unit volume of deposits by
dredging than by flushing.
101
CHAPTER VII
SUMMARY AND RESEARCH NEEDS
This monograph has been prepared to present a review of
reservoir sedimentation--its worldwide extent, impacts, methods of
prediction and alternatives available to mitigate the problem. A
summary of the main conclusions is given herein. It is followed by
a brief statement of need for research and development in the
subject area.
Summary
1. One of the principal aims of water resource development is to
augment the base flow in rivers. This can be economically and
reliably achieved by storage reservoirs.
2. At this time (1986), the gross volume of storage reservoirs in
the world is around 4,900 km2 or roughly 13 percent of the
total annual runoff. This storage is being used to augment the
base flow by about 16 percent.
3. Construction of storage reservoirs saw a major growth in the
1950's. In the two decades of 50's and 60's, the gross
capacity of world reservoirs increased by 25 times. Reservoir
construction will continue to expand due to the increasing
demand for base-flow augmentation. It is estimated that by the
turn of the century, useable storage in the world will have to
increase by about 2.5 fold.
4. Geologic erosion is a part of the drainage process. In the
context of storage reservoirs, clastic material--the product of
geologic erosion, often enhanced by human actions, is a grave
102
liability.
5. The world reservoirs are losing storage capacity to
sedimentation at an average annual rate of about 1 percent, or
about 50 km2 per year. The cost of replacement for this loss
is modestly estimated at $6 billion per year. The weighted
average age of reservoir storage capacity in the world is
about 22 years. The magnitude of capacity already lost is very
large.
6. Genesis of clastic sediment load lies in the process of
weathering. Worldwide zones of weathering have been developed
and they show tht it is most active in the tropics and much
less so in the temperate zone. Within various zones of
weathering, climatic, geologic and tectonic factors cause large
variations.
7. Weathering only prepares the parent rock for erosion. Water,
as the most important agent, entrains and then transports the
product to the basin outlet. Rate of erosion from a basin is
strongly influenced by factors that add to the erosive power of
rainfall, such as higher relief, more intense rainfall, sparse
vegetal cover, tectonic disturbance and man's actions that
destroy the vegetal cover and loosen the soil.
8. Not all of the clastic material eroded from a basin appears at
its outlet. A drainage basin acts as a strong low-pass filter
and it dampens space and time variations in the rate of ero-
sion. Delivery ratio is a measure of the proportion of eroded
material that appears at the outlet. Large basins typically
deliver less than 10 percent of the eroded material. Rest of
the material is stored on hillslopes, in the valleys and within
stream channels. To an extent, the sediment load delivered from
a basin is delimitated by the carrying capacity of the
103
channels.
9. Average worldwide delivery of sediment load from basins amounts
to less than a concentration of 500 ppm. However, large varia-
tions exist. Among major basins with drainage area larger than
10,000 kM2, the three largest concentrations of sediment vary
from 22,000 - 40,000 ppm., and they are all located in China.
Among various geographic regions, Oceania produces the largest
yield (about 1,000 t/km2/yr) followed by Asia (380 t/km2/yr),
whereas, the world average is about 165 t/km2/yr. The lowest
sediment yield, 28 t/kM2/yr, is reported in Australia due to
its aridity, and the next higher, 38 t/km2/yr, in Africa due to
its smaller surface runoff. Two most significant variables
correlating with sediment yield are the basin area and unit
runoff. Sediment delivery decreases roughly with 0.8 power of
drainage area and it sharply increases when the unit runoff
falls below 6 cm.
10. Human action can both increase and decrease sediment yield from
a basin. Agriculture and other activities that loosen the soil
increase sediment yield. Plain areas in Europe and USA may be
experiencing 3 - 5 times higher rates of erosion due to large
scale conversion of forest land to agricultural use. Reser-
voirs constructed by man, drastically decrease sediment yield
from basins. Channel stabilization also decreases sediment
yield by preventing erosion and reentrainment of valley
storage. Sediment delivery by Colorado River has diminished
from 135 to 0.1 million tons per year due to the construction
of storage reservoirs. In River Nile, 110 million tons/year
has been almost completely cutoff by High Aswan Dam and for
River Indus, it has declined from 440 to 110 million tons/year.
In Mississippi-Missouri System, the construction of dams and
channel stabilization works has decreased the sediment load by
about 50 percent.
104
11. Natural events, such as earthquakes, tectonic disturbancesc and
volcanos can produce abnormally high sediment loads. Sediment
load generated by New Madrid earthquake (1811 - 1812) in
Missouri had a long-term impact on Mississippi River. A single
mud-flow developing in a small sub-catchment of Kosi River in
Nepal contributed about one-third of the average annual sedi-
ment load within a period of 14 hours. Mount St. Helen's
eruption has increased the sediment yield of Columbia River by
4-fold.
12. It is customary and necessary to measure sediment load at or
near the proposed storage sites. Many a time, sediment load
measurements are not available for sufficient duration.
Specialist help is needed to develop reliable estimates.
13. Simply stated, the sediment load carried by a river is
deposited in the reservoir because the transport capacity of
flow diminishes with decreasing velocity.
14. Sediment load can be divided into two broad categories, depend-
ing on its particle size. The fine material load comprises
particles of silt and clay and, bed material load the coarser
particles. This distinction was originally made necessary by
sediment transport theories. It is even more valid in reser-
voir sedimentation. The dry density of fine material is, at
least initially, much smaller than that of sand, so that the
same mass of clay and silt will occupy a much larger volume of
storage than would sand and gravel. The fine material also
becomes highly erosion resistant with increasing age of deposit.
15. Most rivers carry more fine than bed material load. Worldwide
average for fine material may be around 50 percent. Methods to
predict average dry density of reservoir deposits are
available. However, individual deposits will show large
105
variations.
16. Reservoir deposits can be described, in terms of the process of
deposition, as backwater deposits, delta deposits and bottom-
set deposits. The backwater deposits cause problems, such as,
flooding in channel upstream of reservoir and non-beneficial
water use by phreatophytes. Delta deposits and bottom-set
deposits directly curtail the storage capacity of reservoirs.
17. Density currents develop in storage reservoirs when flow with
large sediment concentration plunges below the surface and then
flows as a distinct layer up to the reservoir. They can be used
to aspirate their load through the outlets. Sediment load
transported by density currents is mostly the fine material.
Density currents have been observed in Lake Mead and some other
reservoirs. Analytical and model study results on the behavior
of density currents are available. Prototype measurements are
sporadic and few.
18. Predictive methods are available for the trap efficiency of
reservoirs; dry density of deposits an-' -patial distribution of
deposits within the reservoir. These methods can be divided
into two classes. The empirical methods are inductive methods
based on data observed from actual storages. Analytical methods
are mostly mathematical models that use equation of motion for
the flow and mass conservation equation for the sediment load.
Empirical methods are simple and use commonly available data.
Accuracy expected from these is around 10 percent under
favorable conditions. Their scope is, however, limited. For
example, they cannot be used to analyze sediment flushing or
sluicing operations or the particle size distribution of depo-
sits. Mathematical models are broader in scope, but they
require more detailed data as well as skilled manpower and
computers. Existing mathematical models are one-dimensional
106
and they are based on sediment transport theories developed in
rivers and canals. Experience shows that two or three mathema-
tical models may be necessary to simulate various aspects of
reservoir sedimentation. At the present state-of-the-art, it
is not possible to predict micro details of sedimentation in
reservoirs.
19. Given the magnitude of reservoir siltation in the world, the
key question is what can be done to mitigate it. A number of
methods have been tried in the past. They can be divided into
three classes: methods that aim to control the sediment inflow
into the reservoirs; those which try to hydraulically remove
the sediment load that has already entered the reservoir and,
finally, the dredging of existing deposits.
20. Watershed management is commonly suggested to reduce the sedi-
ment yield from a basin. While, watershed management is a noble
activity, it cannot be very useful in alleviating reservoir
sedimentation. The reason is that drainage basins store about
90 percent of eroded material, which remains available for
reentrainment even after further erosion is completely cutoff.
Data from a small basin in the U.S. and from Mangla watershed
support this conclusion.
21. Debris dams are used to dam up one or more tributaries that
contribute large sediment loads. In general, due to economy of
scale, it is cheaper to provide additional storage within the
main reservoir. In special cases, where mountainous streams
contribute coarse material that may cause serious problems by
backwater deposits, debris dams will be found to be useful.
22. Sediment bypassing can be easily practiced in off-channel
storages. It has also been successfully used in small
irrigation reservoirs. At other sites, they would require a
107
bold and innovative design that has not yet been attempted.
Sediment bypassing would be difficult to achieve in streams
that carry large content of fine material.
23. Sediment flushing is the practice of hydraulically eroding and
discharging existing deposits in reservoirs. To be effective,
it requires that the reservoir is drawn down for long periods
of time. Theoretical consideration show that sediment flushing
will not effect the overbank deposits and its efficacy may be
reduced where even a few years old clay and silt deposits
exists. New parameters defining scouring efficiency and time
factor are introduced. They will provide a convenient tool to
evaluate flushing operations. Two considerations will always
govern sediment flushing. The amount of storage water and
duration that can be exclusively devoted to flushing, and the
value of time factor E . With the time factor less than 1,t
flushing can be carried out annually and will yield a cumcula-
tive improvement in storage volume. With a value greater than
1, the storage is bound to decrease from year to year in spite
of flushing.
24. Sediment sluicing is an operational design in which the bulk of
sediment load is released with the flow and only sediment free
water is stored. It is the only method that resulted in a
deposit free reservoir at Old Aswan Dam. However, in this
method, the storage capacity is limited to a small fraction of
the annual runoff and the reservoir operation is limited to a
part of the year. Effectiveness of sluicing operation also
depends on the reservoir morphology. Old Aswan Dam was success-
fully designed and operated to store the river flow at the tail
end of the flood season, when it is nearly sediment free. Same
design principle was adopted At Roseires Dam, but it has
resulted in an average trap efficiency of 46 percent. The
difference between Roseires and Old Aswan reservoirs is that
108
the former is much wider than the latter and accumulates large
amount of sediment deposit in overbank areas that are not
effected by sluicing.
25. Density currents, where they form, can be trapped to release
fine material load. This requires a number of multiple level
outlets. Exploitation of density currents also requires a more
detailed monitoring of the reservoir than has been practiced so
far.
26. Dredging of existing deposits is commonly suggested to reclaim
the storage lost to sediment deposits. At this time (1986),
conventional hydraulic dredging is about 20 times more
expensive than the cost of storage replacement and is not
economically viable. However, if the potential energy made
available by the dam is used to obviate pumping costs, the
dredging can become viable. At least, one commercial method is
available whose cost may become competitive in the future.
Research Needs
As a result of the preceding review, a number of research and
development problems suggest themselves. They are listed below in
the order of their appearance in the preceding chapters.
Sediment Yield Sediment load carried by the flow is the
primary variable that determines the rate of sedimentation in a
reservoir. This is also the first area where research is needed to
improve our understanding of processes involved in the generation
and delivery of sediment from large basins. The role of sediment
sources and sinks has not been studied in large basins and the
effect of watershed management practices has not been critically
evaluated by controlled experiments. Prototype research on the fate
of eroded material in its journey to the outlet and the efficacy of
109
both structural and non-structural measures is needed. This research
will enhance the possibility of controlling sediment yield from the
drainage basins. A likely candidate for this research is the water-
shed management project area at Mangla Dam. This area has already
been mapped, its relevant historic data on sediment load and land
use are available and, an administrative infrastructure exists at
site.
Sediment Diffusion in Deep Flows For want of any better
information, the sediment transport and deposition functions used in
the mathematical modeling of reservoirs are those developed from
laboratory flumes, canals and rivers. Most likely, the decay of
turbulence intensity significantly changes these processes in deep
reservoirs. This would be especially true of the silt and clay
particles, that dominate the sediment load in rivers. Measurements
of flow field and sediment concentration profiles in large reser-
voirs are needed to develop appropriate hydraulic and sedimentation
functions.
Sediment Reentrainment Sediment flushing is a useful method to
rid of the existing deposits. It becomesimore attractive when the
silting up of a reservoir has reached an advanced stage. In the
future, it will find a wider use as sedimentation of world reser-
voirs becomes worse. The efficacy of flushing depends on the rate
with which the deposits can be reentrained by the flow. Existing
knowledge, mostly gained from laboratory studies and theoretical
investigations, suggests that rate of reentrainment in reservoirs
will be strongly effected by the clay content of deposits; mineralo-
gy of clays and the chemical regime of water. For sand particles,
the rate of reentrainment depends on the velocity distribution
within the reservoir and especially, that near the bed. The flow in
reservoirs is strongly nonuniform, much more so than can be expected
in streams. Processes of and relating to reentrainment of deposits
have not been investigated in reservoirs. Prototype research in
110
this area will be highly rewarding.
Density Currents In the future, reservoirs will be monitored
and operated to manage their thermal, salinity and sediment content
in addition to the water flows. Theoretical aspects of density
currents have been primarily developed from laboratory studies.
Their validation on prototype structures has not been attempted so
far. Field data on sediment related density currents are scarce.
Research on the formation, behavior and fate of density currents in
reservoirs is needed. The results will be directly useful in
alleviating the rate of sedimentation of existing reservoirs and
will help in planning and design of future structures.
Empirical Methods Currently available empirical methods for
the prediction of trap efficiency and distribution of deposits are
20-30 years old. In the meantime, an extensive data base has
developed on the gross behavior of reservoirs. Theoretical under-
standing of reservoir siltation has also improved in this period.
Empirical methods will continue to be used to provide preliminary
analysis for the large and the final analysis for small projects.
The time is now right to develop a second generation of empirical
methods with expanded scope and improved accuracy.
Mathematical Models Presently available mathematical models
for reservoir siltation are patterned after channel flow models. In
general, the hydraulic and sedimentation processes in reservoirs are
strongly three-dimensional and stratification can have a major
effect on these processes. Due to their speed, declining costs of
computer use and their potential to predict micro details, mathema-
tical models will find much greater use in the future planning,
design and operation of reservoirs. A need exists to develop more
comprehensive mathematical models than the present one-dimensional
variety.
111
I
REFERENCES
Armatov, K.F., Kroshkin, A.N., and Bystrov, N.N., 1974. SedimentReservoirs in the Channels of Small Mountain Rivers, (EnglishTrans), Soviet Hydrology, Selected Papers, AGU, Issue No. 3.
Assiouti, I.M., 1986, "History and Operation of Old Aswan Dam,Egypt," personal communication, Cairo University, Cairo,.
Bell, H.S., 1942a. Stratified Flow in Reservoirs and its Use inPrevention of Silting, Miscellaneous Publication No. 491, USDA.
---, 1942, "Density Currents as Agents for Transporting Sediments,"Journal of Geology, Vol. 50, 1942.
Benjamnin, T.B., 1968, "Gravity Currents and Related Phenomena,"Journal of Fluid Mechanics, Vol. 31, Part 2.
Camp. T.R., 1944, Discussion of Paper No. 2218, Effects ofTurbulence on Sedimentation, by W.E. Dobbins, Trans. ASCE, Vol.109.
Chaudhry, H.M., 1973, Earthquake Occurrence in the Himalayan Regionand the New Tectonics, Proceedings, Seminar on Geodynamics of theHimalayan Region, National Geophysical Research Institute,Hyderabad, India.
Chaudhry, M.R., 1982, Flushing Operations of Warsak ReservoirSediment, Paper No. 454, Proceeding, Pakistan Engineering Congress,Vol. 58, Lahore.
Chen, Y.H., Holly, F.M., Mahmood, K., and Simons, D.B., 1975."Transport of Material by Unsteady Flow," Vol. I, Chapter 8,Unsteady Flow in Open Channels (Eds: K. Mahmood and V. Yevjevich),Water Resources Publications, Fort Collins, CO.
Churchill, M.A., 1947, Discussion of "Analysis and Use of ReservoirSedimentation Data," by L.C. Gottschalk, Proceedings of FederalInteragency Sedimentation Conference, Denver, CO.
Cummans, J., 1981, Mudflows Resulting from the May 18, 1980 Eruptionof Mount St. Helens, Washington, U.S. Geological Survey Circular850-B, Alexandria VA, 1981.
Dorough, W.G., 1986, "Practical Problems in Using Area-Reduction-Method," personal communication, U.S. Army Engineer District, U.S.Army Corps of Engineers, Omaha, Nebraska.
Emmett, W.W., and Leopold, L.B., 1963, Downstream Pattern ofRiverbed Scour and Fill, Paper No. 46, Proceedings of the FederalInter-Agency Sedimentation Conference, Miscellaneous PublicationNo. 970, USDA, Washington, D.C.
113
Emmett, W.W., Myrick, R.M., and Meade, R.H., 1980. Field DataDescribing the Movement and Storage of Sediment in East Fork River,Wyoming, USGS Open-File Report 80-1189, Denver, Colo.
Farhoodi, J., 1985, Sediment Flushing at Sefidrud Reservoir,Proceedings Second International Workshop on Alluvial RiverProblems, University of Roorkee, India.
Federal Inter-Agency Sedimentation Project, Some Fundamentals ofParticle Size Analysis, Report No. 12, U.S. Government PrintingOffice, Washington, D.C.
Foley, M.G., and Sharp, R.P., 1976, General Scour and Fill along aStream Reach, California Institute of Technology, Pasadena, Ca.,(NTIS No. AD-A025 771).
Geza, Bata, and Bogich, K., 1953, Some Observations On DensityCurrents in the Laboratory and in the Field, Proceedings, MinnesotaInternational Hydraulics Convention, IAHR-ASCE, Minneapolis, MN.
Goodland, R., Environmental Aspects of Hydroelectric Power and WaterStorage Projects (with special reference to India), Paper presentedto International Seminar, Environmental Impact Assessment of WaterResources Projects, University of Roorkee, India, 1985.
Guy, H.P., 1969, Laboratory Theory and Methods for SedimentAnalysis, Techniques of Water Resources Investigations, USGS,Washington, DC.
of Water Resources Investigations, USGS, Washington, D.C.
Guy, H.P., and Norman, V.W., 1970, Field Methods for Measurement ofFluvial Sediment, Techniques of Water Resources Investigations,USGS, Washington, D.C.
Harleman, D.R.F., 1961, "Stratified Flow," Section 26,Handbook of Fluid Dynamics, V.L. Streeter, Editor-in-Chief, McGraw-Hill Book Company.
Harrison, A.S.,December 1983, Deposition at the Heads of Reservoirs,U.S. Army corps of Engineers, Missouri River Division, MRD SedimentSeries, No. 31.
Harrison, A.S., and Mellema, W.J., 1982, Sedimentation Aspects ofthe Missouri River Dams, Q54, R15, Proceedings, ICOLD, Rio deJaneiro, Brazil.
Heinemann, H. G., October 1981, "A New Sediment Trap EfficiencyCurve for Small Reservoirs," Water Resources Bulletin, Vol. 17,No. 5.
Holeman, J.N., August 1968, "The Sediment Yield of Major Rivers ofthe World," Water Resources Research, Vol 4, No. 4.
114
Howard, C.S., 1953, Density Currents in Lake Mead, Proceedings,Minnesota International Hydraulics Convention, IAHR-ASCE,Minneapolis, MN.
Hurst, A.J., and Chao, P.C., September 3-5, 1975, SedimentDeposition Model for Tarbela Reservoir, Proceedings Symposium onModeling Techniques, Modeling '75, Waterways, Harbors and CoastalEngineering Division, ASCE.
Jansen, R.B., 1980, Dams and Public Safety, A Water ResourcesTechnical Publication, U.S. Department of Interior, Water and PowerResources Service, (USBR) Denver, CO.
Jia-Hua, F., February 1960, " Experimental Studies on DensityCurrents," Scientia Sinica, Vol. IX, No. 2.
Kao, T.W., May 1977, "Density Currents and Their Applications,"Journal of Hydraulic Engineering, ASCE, Vol. 103, No. HY5.
Keulegan, G.H., 1944, "Laminar Flow at the Interface of TwoLiquids," Research Paper 1591, Journal of Research, National Bureauof Standards, Vol. 32.
--- ! November 1949, "Interfacial Instability and Mixing inStratified Flows," Journal of Research, National Bureau ofStandards, Vol. 43.
Krumdieck, A., and Chamot, P., December 1979, Sediment Flushing atthe Santo Domingo Reservoir, Water Power and Dam Construction.
Kuenen, H., Ph and Migliorini, C.I., 1950, Turbidity Currents as aCause of Graded Bedding, The Journal of Geology, Vol. 58, No. 2.
Lane, E.W., and Koelzer, V.A., 1943, Density of Sediment Depositedin Reservoirs, Report No. 9, Federal Interagency SedimentationProject, St. Anthony Falls Hydraulics Lab, Minneapolis, MN.
Lara, J.M., and Pemberton, E.L., 1965, Initial Unit Weight ofDeposited Sediments, Froceedings Federal Interagency. SedimentationConference ARS, Misc. Publication No. 970, USDA, Washington, DC.
Leliavsky, S., 1960, Irrigation and Hydraulic Design, Vol. III,Chapman and Hall, London.
L'Vovich, M.I., 1979, World Water Resources and Their Future,(English Translation Editor: Nace, R.L.), American GeophysicalUnion.
Mahmood, K., 1975, Mathematical Modeling of Morphological Transients inSand-bed Channels, Proceedings 16th Congress, IAHR, Vol 2. Sao PauloBrazil.
115
Considerations, Prepared for 1975 National Water ResourceAssessment, USDA (D.W. Gottlieb and Associates).
Series No. 19, U.S. Army Engineer Division, Missouri River, Corps ofEngineers, Omaha, NE.
note prepared for the World Bank.
Manual, MRD Series No. 26, U.S. Army Engineer Division, MissouriRiver, Corps of Engineers, Omaha, NE.
Programmer's Manual, MRD Series No. 27, U.S. Army Engineer Division,Missouri River, Corps of Engineers, Omaha, NE.
U.S.AID, Islamabad, Pakistan.
Mahmood, K., and Akhtar, A.B., 1962, Artificial Cut-Off at IslamHeadworks, Paper No. 352, Annual Proceedings, West PakistanEngineering Congress, Lahore.
Mahmood, K., Dorough, W.G., and Tarar, R.N., 1979, Verification ofSediment Transport Functions on Alluvial Channel Data, Proceedings,Symposium on the Mechanics of Alluvial Channels, Lahore, Pakistan.
Mahmood, K., and Haque, M.I.,1985, Boundary Shear Stress Measurementand Analysis, Proceedings, Third US-Pakistan Binational Symposium onMechanics of Alluvial Channels, Lahore, Pakistan.
Mahmood, K., and Ponce, V.M., April 1976, Mathematical Modeling ofSedimentation Transients in Sand-Bed Channels, Technical Report CER75-76-KM-VMP-28, Engineering Research Center, Colorado StateUniversity, Fort Collins, CO.
McHenry, J.r., and Hawks, Paul H., 1965, Measurement of SedimentDensity with Gamma Probes, Proceedings Federal InteragencySedimentation Conference, ARS, Publication No. 970, USDA,Washington, D.C.
McHenry, J.R., Hawks, P.H., Harmon, W.C., Kelly, W. J., Gill, A.C.,and Heinemann, H.G., September 1971, Determination of SedimentDensity with a Gamma Probe: A Manual of Theory, Operation andMaintenance for Technical Operations Model 497, ARS 41-183, USDA.
Meade, R.H., and Parker, R.S., 1985, Sediment in Rivers of theUnited States, National Water Summary 1984, U.S.G.S. Water SupplyPaper 2275, Washington, D.C.
Meade, R.H., Dunne, T, Richey, J.E., Santos, U.M., April 1985, andSalala, E., "Storage and Remobilization of Suspended Sediment in theLower Amazon River of Brazil," Science, Vol. 228.
Mermal, T.W., 1970, Progress of Dam Construction in the World, World DamsToday '70, The Japan Dam Association, Tokyo.
116
Merrill, W.M., April 1980, Simulation of Reservoir and LakeSedimentation, Kansas Water Research Institute, University ofKansas.
Middleton, G.V., August 1966, Experiments on Density and TurbidityCurrents, Canadian Journal of Earth Sciences, Vol. 3, No. 4.
Milliman, J.D., and Meade, R.H., January 1983, "World-wide Deliveryof River Sediments to Ocean," Journal of Geology, Vol. 91, No. 1.
Ministry of Electricity and Energy, undated, "Aswan II Power Plant,"Arab Republic of Egypt, Cairo.
Ministry of Irrigation and Hydro-Electric Power, undated, "RoseiresDam," Khartoum, Sudan.
Pakistan Water and Power Development Authority (WAPDA) ManglaWatershed Management Study, Vol. I, 1961.
Partheniades, E., 1972, Results of Recent Investigations On Erosionand Deposition of Cohesive Sediments, Chapter 20, Sedimentation -Symposium to Honor Professor H.A. Einstein, Ed. H.W. Shen, FortCollins, CO.
Rana, S.A., Simons, D.B., and Mahmood, K., 1973, "Analysis of SedimentSorting in Alluvial Channels," Journal of Hydraulics Division, ASCE,Vol. 99, No. HY11.
Rehman, A., undated, "Life of Mangla Reservoir--Ways and Means ofImprovement," mimeographed note, Dams Monitoring Organization,Pakistan WAPDA, Lahore.
Revio, B., June 1980, "Tamur Flood," mimeographed note; GeneralDirectorate of Hydrology and Irrigation, Kathmandu, Nepal.
Robbins, L.G., 1976, Suspended Sediment and Bed Material Studies onthe Lower Mississippi River, U.S. Army Engineer District, Vicksburg,MS.
Roveri, E., 1984, "Geolidro System," Parma, Italy, personalcommunication.
Rubey, W.W., 1933, "Settling Velocities of Gravel, Sand and Silt,"American Journal of Science, Vol. 25.
Savage, S.B., and Brimberg, J., 1975, "Analysis of PlungingPhenomena in Water Reservoirs," Journal of Hydraulic Research, Vol.13, No. 2,
117
Schiff, J.B., and Schonfeld, J.C., 1953, Theoretical Considerationson the Motion of Salt and Fresh Water., Proceedings, MinnesotaInternational Hydraulics Convention, IAHR-ASCE, Minneapolis, MN.
Schmidt, G., 1983, "Siltation Experience on Roseires Dam," Coyne etBellier, Paris, personal communication.
Schumm, S.A., The Fluvial System, 1977, John Wiley and Sons, NewYork.
Sing, E.F., 1986, River Sediment Budget, Proceedings Fourth FederalInter-Agency Sedimentation Conference, Las Vegas, Nevada.
Strakhov, N.M., 1967. Principles of Lithogenesis, Vol. I (EnglishTr. by Fitzsimmons, J.P.), Consultants Bureau, New York.
Toffaleti, F.B., January 1969, "Definitive Computations of SandDischarge in Rivers, Journal of Hydraulic Engineering,ASCE, Vol. 95,No. HYI.
Trimble, S.W., May 1983, "A Sediment Budget for Coon Creek Basin inthe Driftless Area, Wisconsin, 1853-1977," American Journal ofScience, Vol. 283.
UNESCO, 1977, Atlas of World Water Balance, 1977, Korzoun, V.I.,Editor-in-Chief, Paris.
UNESCO, 1978, World Water Balance and Water Resources of the Earth,Leningrad
U.S. Army Corps of Engineers, July 1965, Operation Manual for theRadioactive Sediment Density Probe, U.S. Army Engineer District,Omaha, NE.
--- , March 1977, Scour and Deposition in Rivers and Reservoirs, HEC-6, User's Manual, Hydrologic Engineer Center, Davis, CA.
U.S. Bureau of Reclamation, 1977, Design of Small Dams, Denver, CO.
Walters, W.H., Jr., 1975, Regime Changes of the Lower MississippiRiver, M.S. Thesis, Colorado State University, Fort Collins, CO.
Williams, G.P., and Wolman, M.G., 1984, Downstream Effects of Damson Alluvial Rivers, USGS Professional Paper 1286, Washington D.C.
Winkely, B.R., 1977, Man-Made Cut-Offs on the Lower MississippiRiver, Conception, Construction and River Response, PotamologyInvestigations, Report 300-2, U.S. Army Engineer District,Vicksburg, MS.
Yih, S-H., 1965, Dynamics of Non-Homogeneous Fluids, Macmillan, NewYork.
118
DISTRIBUTORS OF WORLD BANK PUBLICATIONS
ARGENTINA FRANCE KENYA SPAIN
Carlos Hirsch. SRL Worid Bank Publications Afnca Book Service )E.A.I Ltd. Mundi-Prensa Libros, S.A