Working Paper APRIL 2019 184 www.younglives.org.uk Self-efficacy, Agency and Empowerment During Adolescence and Young Adulthood in Ethiopia, India, Peru and Vietnam Patricia Espinoza Revollo and María José Ogando Portela
Transcript
Wo
rkin
g P
aper
APRIL 2019
184
www.younglives.org.uk
Self-efficacy, Agency and Empowerment During
Adolescence and Young Adulthood in Ethiopia, India,
Peru and VietnamPatricia Espinoza Revollo and María José Ogando Portela
Self-efficacy, Agency and Empowerment During Adolescence and Young Adulthood in Ethiopia, India, Peru and Vietnam
Patricia Espinoza Revollo and María José Ogando Portela
A catalogue record for this publication is available from the British Library. All rights reserved. Reproduction, copy, transmission, or translation of any part of this publication may be made only under the following conditions:
• with the prior permission of the publisher; or
• with a licence from the Copyright Licensing Agency Ltd., 90 Tottenham Court Road, London W1P 9HE, UK, or from another national licensing agency; or
• under the terms set out below.
This publication is copyright, but may be reproduced by any method without fee for teaching or non-profit purposes, but not for resale. Formal permission is required for all such uses, but normally will be granted immediately. For copying in any other circumstances, or for re-use in other publications, or for translation or adaptation, prior written permission must be obtained from the publisher and a fee may be payable.
Young Lives, Oxford Department of International Development (ODID), University of Oxford,
Queen Elizabeth House, 3 Mansfield Road, Oxford OX1 3TB, UK
SELF-EFFICACY, AGENCY AND EMPOWERMENT DURING ADOLESCENCE AND YOUNG ADULTHOOD IN ETHIOPIA, INDIA, PERU AND VIETNAM
3
Contents The authors 4 Acknowledgements 4 Summary 51. Introduction 62. From agency and self-efficacy to empowerment of adolescents
and young adults 73. Data and methods 8
3.1. Measurement of agency and self-efficacy 93.2. Descriptive statistics 11
4. Emergence and evolution of gender gaps in agency and self-efficacy 134.1. Gender gaps in agency and self-efficacy 134.2. The importance of context: growing up in urban or rural areas 164.3. Correlates of agency and self-efficacy at age 15 and 22 19
5. Conclusion 20 References 22 Appendix 24
SELF-EFFICACY, AGENCY AND EMPOWERMENT DURING ADOLESCENCE AND YOUNG ADULTHOOD IN ETHIOPIA, INDIA, PERU AND VIETNAM
4
The authors Patricia Espinoza Revollo is the Deputy Head of Research at Oxfam GB. Previously she
worked as a Quantitative Research Officer at Young Lives. Her research agenda covers inequality, stratification and social mobility, and child and youth development, with a focus on gender inequalities in low- and middle-income countries. Her recent research has explored
the development of psychosocial competencies throughout childhood, children’s time use and children’s paid and unpaid work, and causes and consequences of early marriage. She coordinated the design and implementation of the Young Lives 2016 round of data collection
in Ethiopia, India, Peru and Vietnam.
María José Ogando Portela is a Young Lives Associate whose research focuses on
education, psychosocial well-being and violence against children. She currently leads the research portfolio of Fab Inc, a boutique consultancy in international education. She spent
two years in Rwanda as an ODI Fellow in the National Institute of Statistics of Rwanda (NISR). From 2011 to 2015 she worked with Young Lives as a Research Assistant and survey coordinator of the fourth round of the quantitative surveys in Ethiopia, and in the
development of the fifth round. She holds an MSc in Statistics from the London School of Economics and a BA in Economics from Universidad Iberoamericana in Mexico City.
Acknowledgements We would like to thank Abhijeet Singh for his initial methodological guidance on this paper. We are grateful to Gina Crivello and Cath Porter for reviewing and providing comments on
earlier drafts. We would also like to thank Graham Bray for his support and long-lasting commitment to Young Lives research.
SELF-EFFICACY, AGENCY AND EMPOWERMENT DURING ADOLESCENCE AND YOUNG ADULTHOOD IN ETHIOPIA, INDIA, PERU AND VIETNAM
5
Summary This working paper examines gender gaps in empowerment and the timing of their emergence through adolescence and young adulthood for two cohorts of children living in Ethiopia, India, Peru and Vietnam. It uses longitudinal data from Young Lives on two psychosocial competencies – self-efficacy and agency – associated with the notion of empowerment.
In all four countries, gaps in self-efficacy emerge in late adolescence, widening particularly between the ages of 15 and 19 and favouring boys. The results are more heterogeneous for agency; gaps widen between the ages of 12 and 15 and favour boys in Ethiopia and India, and girls in Peru and Vietnam. However, for the latter, the gaps close or even reverse in favour of boys by age 22. Our analysis pays special attention to the sub-national context: whether young people grow up in urban or rural areas. We find important gaps for rural girls, who show the lowest levels of agency and self-efficacy across the four countries. Finally, we explore the relationship between background characteristics and these two measures in mid-adolescence and young adulthood (ages 15 and 22). We find that these outcome measures correlate positively with the socio-economic level of the household in which they were born and grew up.
About Young Lives
Young Lives is an international study of childhood poverty, following the lives of 12,000 children in four countries (Ethiopia, India, Peru and Vietnam) over 15 years. www.younglives.org.uk
The views expressed are those of the authors. They are not necessarily those of, or endorsed by, the University of Oxford, Young Lives, DFID or other funders.
SELF-EFFICACY, AGENCY AND EMPOWERMENT DURING ADOLESCENCE AND YOUNG ADULTHOOD IN ETHIOPIA, INDIA, PERU AND VIETNAM
6
1. Introduction Gender equality has been and still is at the core of the development agenda. Despite great progress in recent years in different domains, such as school enrolment, there are still many crucial aspects of life in which women and girls have consistently worse outcomes than men and boys. The need to solve this issue is reflected in Sustainable Development Goal 5. SDG5 aims to achieve gender equality and empower all women and girls by 2030 through specific targets covering the elimination of all forms of violence and harmful practices, recognising the value of unpaid care and domestic work, ensuring women’s equal opportunities for leadership at all levels of decision-making, and undertaking reforms that give women equal rights to economic resources, among others (United Nations n.d.). This working paper focuses on gender-based differences in self-reported agency and self-efficacy, two direct measures of empowerment, for boys and girls during adolescence and young adulthood, and aims to document the ages at which gaps emerge, the contexts (national and sub-national) in which they are more likely to occur and the conditions that make young people feel more or less empowered. We approach this analysis from a comparative perspective by looking at four low- and middle-income countries (LMICs), thus accounting for cultural heterogeneity, and differential gender-related attitudes and social norms.
Data used in this paper come from Young Lives, a longitudinal dual-cohort study which has followed 12,000 children in Ethiopia, India, Peru, and Vietnam over 15 years. The data are uniquely suitable for the paper’s purpose as they include comparable psychosocial measures administered repeatedly to children since the age of 8. Thus, the data enable a comparable investigation of gender-based differences in agency and self-efficacy at different periods of childhood up to young adulthood. Rich background information, in addition, allows for an in-depth assessment of the different channels though which gender gaps might emerge.
Three patterns stand out from our analysis. First, gender gaps in perceptions of self-efficacy emerge in late adolescence, widening particularly between ages 15 and 19 and favouring boys. The results are heterogenous for agency; gaps widen between ages 12 and 15 and favour boys in Ethiopia and India, but girls in Peru and Vietnam. However, for the latter, the gaps close or even reverse in favour of boys by age 22. Second, looking at whether young people grow up in urban or rural areas, we find that rural girls show the lowest levels of agency and self-efficacy across the four countries. Interestingly, girls in urban areas show similar or even higher levels of agency and self-efficacy than boys who live in urban and rural areas. This highlights the importance of context in shaping notions of empowerment. Third, exploring the relationship between background characteristics and these two measures in mid-adolescence and young adulthood (ages 15 and 22), we find that our outcome measures are positively correlated with the socio-economic level of the household where they were born and grew up, especially with the caregivers’ level of education and household wealth.
The paper is structured as follows. Section 2 focuses on making the link between agency, self-efficacy and empowerment and justifying the use of the two psychosocial competencies in Young Lives to explore empowerment of young people in the four countries. Section 3 presents the data, including a descriptive exploration of the variables used in the analysis. Section 4 contains the main analysis; it first describes the extent of gender gaps in self-efficacy and agency scales as the children age. Then, it examines how the gender gaps are more or less acute once the sub-national context is taken into account and, finally, examines early correlates of differential self-efficacy and agency between boys and girls. Section 5 concludes.
SELF-EFFICACY, AGENCY AND EMPOWERMENT DURING ADOLESCENCE AND YOUNG ADULTHOOD IN ETHIOPIA, INDIA, PERU AND VIETNAM
7
2. From agency and self-efficacy to empowerment of adolescents and young adults While empowerment has been defined in many ways in different studies, what seems
consistent is the emphasis on agency and on gaining the ability to make meaningful choices (Donald et al. 2017). Kabeer (1999: 437) provides a useful definition that captures what is
common across different definitions: empowerment is ‘the expansion in people’s ability to make strategic life choices in a context where this ability was previously denied to them.’ This conceptualisation highlights two distinct elements: (1) the idea that empowerment relates to a
process and, hence, naturally involves change; and (2) the importance of agency and choice – individuals ought to be active participants in the process of change. Indeed, agency is at the heart of most conceptualisations of empowerment as it encompasses the ability to
formulate strategic and purposeful choices, control resources and make decisions that affect important life outcomes.
The process of empowerment (and the exercise and expansion of agency) involves a crucial component which forms the conditions under which choices are made: resources.1 In much
of the literature, resources are considered the catalysts of empowerment, the crucial
‘enabling factors’ that foster the process of empowerment. Examples of resources are education, land ownership, employment, health, and so on. Although many empirical studies have used these resource-type variables as proxies for empowerment (also called indirect
measures of empowerment), there is growing recognition of many associated problems both conceptually and empirically, such as overlooking the exercise of control and choice and the fact that these assets translate into agency differently for different individuals (Alkire 2008).
Moving from the conceptualisation to the measurement of empowerment (and agency) is a
difficult task. One of the major difficulties is that the notion of empowerment is multidimensional. It can be exercised in multiple areas of life and at different levels: the economic, socio-cultural, familiar/interpersonal, political and psychological, and at the
household, community, or state level (Samman and Santos 2009). Even though an advance in agency in one domain or level may enhance agency in others, this may not always be the case. For example, a woman may be ‘fully empowered as a wife and mother, but [then be]
excluded from the labour force by social conventions’ (Alkire 2008: 11). In addition to these indirect measures, direct measures of empowerment – which are increasingly becoming more common in empirical studies – make an attempt to articulate more comprehensive
frameworks. The most common measures focus on decision making (in different domains), freedom of movement, power relations, access and control of resources, among others. However, as pointed out by Donald et al. (2017), commonly used conceptualisations and
measures still fail to capture the psychological dimension – recognised as a crucial aspect of
1 At an institutional level, empowerment also depends on the structure of opportunity, which refers to the broader context
(institutional, social and political) of formal and informal rules and norms within which individuals (or groups) pursue their interests. It is what allows agents to become effective.
SELF-EFFICACY, AGENCY AND EMPOWERMENT DURING ADOLESCENCE AND YOUNG ADULTHOOD IN ETHIOPIA, INDIA, PERU AND VIETNAM
8
empowerment. Indeed, Diener and Biswas-Diener (2005) contend that the most important
aspect of empowerment is not objective power but feelings of power, of competence and desire to act.
The measurement of empowerment (or agency) among young people is a fuzzier terrain and
raises a number of conceptual issues (Samman and Santos 2009). As children’s agency is
embedded within the confines of their households, measuring their empowerment in terms of freedom of movement, control over resources, or decision-making seems inappropriate. Instead, measures related to their perceived capabilities of reaching specific goals, improving
their situation in life, making plans for their future, or to deal with adversity are more pertinent indicators of their agency.
In this paper, we take a step forward in this direction by examining the process of
empowerment for boys and girls from adolescence through young adulthood using
longitudinal data for two psychosocial scales: generalised self-efficacy and agency.
3. Data and methods We use data from the Young Lives longitudinal study – which has followed 12,000 children in
Ethiopia, India (the states of Andhra Pradesh and Telangana), Peru and Vietnam over 15
years – to explore gender gaps in agency and self-efficacy during adolescence and early adulthood. The study has two cohorts of children in each country born seven years apart: a Younger Cohort of 2,000 children born in 2001/02 and an Older Cohort of 1,000 children born
in 1994/95. Each survey round was conducted every three or four years, which means that children from both cohorts were interviewed at similar ages (see Figure 1). This unique design allows us to have sequenced information at ages 8, 12, 15, 19 and 22 and to carry out
inter-cohort comparisons for ages 12 and 15. Children were sampled from 20 clusters in each country. Even though the samples are not statistically representative of the national populations – as poorer regions were over-sampled – comparisons with nationally
representative datasets (DHS, LSMS, and so on) show that they reflect the heterogeneity of ethnicity and religion as well as living standards in each of the study countries (Escobal and Flores 2008; Kumra 2008; Nguyen 2008; Outes-Leon and Sánchez 2008).2
2 DHS stands for Demographic and Health Surveys, and LSMS for Living Standards Measurement Study.
SELF-EFFICACY, AGENCY AND EMPOWERMENT DURING ADOLESCENCE AND YOUNG ADULTHOOD IN ETHIOPIA, INDIA, PERU AND VIETNAM
9
Figure 1. Young Lives study
To date, Young Lives has conducted five rounds of data collection gathering information on
multiple aspects of children’s well-being and development, including information on their households (socio-economic level, composition, household members’ education and health, and so on) and on the communities where they live. At the individual (child) level, the study
has collected complete information on education histories, anthropometry, aspirations, use of time and, particularly relevant for this paper, information on different psychosocial competencies, including agency and self-efficacy.
3.1. Measurement of agency and self-efficacy
In this paper we focus on two psychosocial competencies that act as direct measures of
empowerment: agency and self-efficacy. While having great overlap, the two scales measure
slightly different concepts. Agency is related to the ‘locus of control’ or an individual’s perception of the link between their behaviour and its consequences (Rotter 1966) in specific domains. Those with high internal locus of control believe that outcomes are a result of their
efforts or behaviour (Maddux 1991). The specific scale in Young Lives is based on an existing scale of locus of control developed by Rotter (1966) and Bandura (1993). The measure was adjusted to be relevant for children and makes reference to children’s specific life domains
such as school, work and time use. The scale consists of the following five statements:
• If I try hard, I can improve my situation in life.
• I like to make plans for my future studies and work.
Young Lives longitudinal data collected in 4 countries: Ethiopia, India (Andhra Pradesh and Telangana), Peru, Vietnam
Age: 8 12 15 19 22
OLD
ER C
OH
OR
T
Following 1,000 children
Children at same age atdifferent time points
Round 12002
Household and child survey
Plus thematic sub-studies and school surveys
Round 22006
Qual 12007
Qualitative data collection
Qual 22008
Qual 32011
Qual 42014
Round 32009
Round 42013
Round 52016
Age: 1 5 8 12 15
YOU
NG
ER C
OH
OR
T
Following 2,000 children
SELF-EFFICACY, AGENCY AND EMPOWERMENT DURING ADOLESCENCE AND YOUNG ADULTHOOD IN ETHIOPIA, INDIA, PERU AND VIETNAM
10
• Other people in my family make all the decisions about how I spend my time.
• If I study hard at school, I will be rewarded by a better job in the future.
• I have no choice about the work I do – I must work.
The self-efficacy measure is based on the generalised self-efficacy scale developed by Schwarzer and Jerusalem (1995) and is tailored to ‘assess a general sense of perceived self-
efficacy with the aim to predict coping with [adversity and] daily hassles … and adaptation to different kinds of stressful life events’ in various domains of human functioning. The ten items comprising the scale are:
• I can always manage to solve difficult problems if I try hard enough.
• If someone opposes me, I can find the means and ways to get what I want.
• It is easy for me to stick to my aims and accomplish my goals.
• I am confident that I could deal efficiently with unexpected events.
• Thanks to my resourcefulness, I know how to handle unforeseen situations.
• I can solve most problems if I invest the necessary effort.
• I can remain calm when facing difficulties because I can rely on my coping abilities.
• When I am confronted with a problem, I can usually find several solutions.
• If I am in trouble, I can usually think of a solution.
• I can usually handle whatever comes my way.
The scales were measured on a four and five-point Likert-type scale.3 Items within a scale
were recoded to be measured in the same direction such that a greater value in the coded
answer represents a better outcome (i.e. more agency; more self-efficacy), with item refusals or ‘DK=don’t know’ responses set to missing values. Items were standardised to z-scores (with a mean of 0 and standard deviation of 1) and scales were constructed by averaging all
relevant z-scores across the non-missing dimensions within each cohort, round and country. Standardising each item allows us to position an individual in relation to others in the sample (Dawis 2000; Fischer and Milfont 2010). Consequently, when combining several items in a
scale, what we obtain is the overall level (and relative position) of each individual within the scale.4 We followed this standardisation procedure for scale construction, which is common
when the researcher aims to explore which factors influence certain outcomes (Fischer and
Milfont 2010); for this paper, how psychosocial outcomes (related to empowerment) vary with gender. Information for the agency scale was collected in survey Rounds 2 to 5, while information for self-efficacy was introduced in Round 4 and collected again in Round 5.5
Table 1 summarises the information for both psychosocial scales available in Young Lives by cohort, age and survey round.
3 Except Round 2 data from Peru, which was collected using a three-point Likert-type scale.
4 This results in the scales having a mean of zero and a standard deviation of about 0.5. Note that averaging all z-scores does not means the scale tends to N(0,1).
5 The selection, adaptation and validation of the psychosocial scales introduced in Round 4 are in Yorke and Ogando Portela (2018). Psychosocial competencies collected in previous rounds are analysed in Dercon and Krishnan (2009).
SELF-EFFICACY, AGENCY AND EMPOWERMENT DURING ADOLESCENCE AND YOUNG ADULTHOOD IN ETHIOPIA, INDIA, PERU AND VIETNAM
11
Table 1. Psychosocial competencies
Cohort Round Age Agency Self- efficacy
Younger Cohort R3 8 ! –
R4 12 ! !
R5 15 ! !
Older Cohort R2 12 ! –
R3 15 ! –
R4 19 ! !
R5 22 ! !
How are both measures correlated? As noted, while agency and self-efficacy are related
competencies, they measure different realms of human functioning. The agency scale focuses on specific domains, such as work and school and reflects locus of control or perceived ‘actual’
abilities (i.e. I have no choice about the work I do; my family makes all the decisions about how I spend my time); the self-efficacy scale, on the other hand, focuses on goal-setting, effort investment, persistence in the face of barriers, and recovery from setbacks. Their degree of
interdependence reflected in the correlation coefficient between both measures (Table 2)6 is positive and significant – this is that more agency is associated with more self-efficacy – but not strong (i.e. less than 0.5), suggesting that they measure slightly different constructs.
Table 2. Correlation coefficients between the agency and self-efficacy scales, by gender
Males Females Males Females
Ethiopia Peru
Age 12 (Younger Cohort) 0.21* 0.26* Age 12 (Younger Cohort) 0.24* 0.29*
Age 15 (Younger Cohort) 0.30* 0.33* Age 15 (Younger Cohort) 0.42* 0.35*
Age 19 (Older Cohort) 0.34* 0.23* Age 19 (Older Cohort) 0.29* 0.42*
Age 22 (Older Cohort) 0.23* 0.34* Age 22 (Older Cohort) 0.31* 0.44*
India Vietnam
Age 12 (Younger Cohort) 0.31* 0.15* Age 12 (Younger Cohort) 0.22* 0.30*
Age 15 (Younger Cohort) 0.33* 0.35* Age 15 (Younger Cohort) 0.26* 0.31*
Age 19 (Older Cohort) 0.30* 0.35* Age 19 (Older Cohort) 0.21* 0.27*
Age 22 (Older Cohort) 0.20* 0.24* Age 22 (Older Cohort) 0.32* 0.35*
Note: * Significant at 1% level.
3.2. Descriptive statistics
Table 3 provides descriptive statistics (mean and standard deviation) of the set of
background characteristics of children and their families used in our analysis. Summary statistics of time-variant variables, such as age of the child (in months), and household size
are provided for each survey round. We also account for their variability during modelling. We fix other time-variant variables such as birth order, household wealth (measured by a composite index), locality and maternal education at the earliest round of data collection (with 6 Correlation coefficients in Table 2 are drawn separately for the sample of boys and girls in each cohort and for Rounds 4 and 5
of the surveys (when data are available for both scales).
SELF-EFFICACY, AGENCY AND EMPOWERMENT DURING ADOLESCENCE AND YOUNG ADULTHOOD IN ETHIOPIA, INDIA, PERU AND VIETNAM
12
the exception of maternal education which is fixed at Round 2), to examine the effect of initial
socio-economic and demographic conditions in shaping agency and self-efficacy (and to guard against reverse causality).
Table 3 shows that gender is balanced in the four country samples. With the exception of
Peru, the majority of each sample are located in rural areas, reflecting the population
distribution. Peru and Vietnam have significantly higher levels of maternal education than Ethiopia and India. Households in Ethiopia had the lowest levels of wealth at the beginning of the study and were also the largest in terms of household members.7 The smallest
households were in Vietnam. Where both the Younger and the Older Cohort samples differ is in the index child’s birth order: Younger Cohort children in Ethiopia are on average the third child in the household, and the second in the other countries. On the other hand, Older
Cohort children in Ethiopia are on average the fourth child born in the household and the second or third in the other countries.
Table 3. Means and standard deviations of variables used in analysis
Ethiopia India Peru Vietnam
Mean St. Dev. Mean St. Dev. Mean St. Dev. Mean St. Dev.
Notes: a The wealth index is a composite measure based on housing quality, consumer durables and basic services. b Asked as highest grade completed and coded into years of education.
7 Wealth is measured by a composite index that includes housing quality, access to services and ownership of consumer durables.
SELF-EFFICACY, AGENCY AND EMPOWERMENT DURING ADOLESCENCE AND YOUNG ADULTHOOD IN ETHIOPIA, INDIA, PERU AND VIETNAM
13
4. Emergence and evolution of gender gaps in agency and self-efficacy
4.1. Gender gaps in agency and self-efficacy
The following figures present the means of our outcome variables at different age points
disaggregated by gender. T-test results on the equality of these means are shown in Table A1 in the Appendix for reference.
Figure 2 explores gender differences for the self-efficacy measure. It is noteworthy that in all
countries, except in Vietnam for the Younger Cohort children, boys have higher self-efficacy than girls at all ages. In Vietnam, girls have higher self-efficacy than boys at ages 12 and 15,
though this difference is not statistically significant. Strikingly, from age 19 – the age that for many coincides with the transition to higher education, labour market, or marital life – without exception young men have significantly more self-efficacy than young women. Though very
slightly, the gaps seem to have a tendency to close at the age of 22 in all countries except Vietnam. The jump in the levels of self-efficacy between the ages of 15 and 19 – observed for the Younger Cohort – suggest that certain life transitions might be driving the emergence
of a significant gap in this measure between boys and girls. We explore some of the most important transitions in detail in Box 1 and Box 2.
Figure 2. Mean scores of self-efficacy for boys and girls, by age and cohort
SELF-EFFICACY, AGENCY AND EMPOWERMENT DURING ADOLESCENCE AND YOUNG ADULTHOOD IN ETHIOPIA, INDIA, PERU AND VIETNAM
14
The agency indicator, on the other hand, presents more heterogeneous differences between
boys and girls across countries and ages (Figure 3). In Peru and Vietnam, differences in agency are in favour of girls consistently from the age of 12, but then the difference becomes not statistically significant at the age of 22 for Peru and even reverts in favour of boys in
Vietnam. In India, on the other hand, boys and girls start with similar levels of agency at the age of 12 but the gap widens in favour of boys thereafter.8 Somewhat similarly, in Ethiopia the gaps are mostly in favour of boys, though the differences are not always statistically
significant.
The inter-cohort comparisons, which we are able to conduct for our agency measure for the
ages of 12 and 15, show important and positive changes for younger generations in Ethiopia and India. In these countries, gaps between 12-year-old boys and girls in 2006 are very
similar to those for 12 year olds in 2013. However, the gaps get smaller for 15 year olds in 2016 in relation to the gaps for 15 year olds in 2009. We note, however, that the decreasing gap in India is due to a decrease in boys’ level of agency rather than an increase in that of
girls. Inversely, the situation worsens for boys in the younger generation as gaps in agency levels favouring girls open up further for 15 year olds in the Younger Cohort in Vietnam: while 15-year-old girls in 2009 already had more agency than boys, by 2016 the difference has
become even wider. Peru displays similar gaps across cohorts, with both girls and boys having decreasing levels of agency at a similar rate.
Figure 3. Mean scores of agency for boys and girls, by age and cohort
8 The only visible gap favouring girls in India at the age of 12 (see Figure 3) in the Younger Cohort sample is not statistically
SELF-EFFICACY, AGENCY AND EMPOWERMENT DURING ADOLESCENCE AND YOUNG ADULTHOOD IN ETHIOPIA, INDIA, PERU AND VIETNAM
15
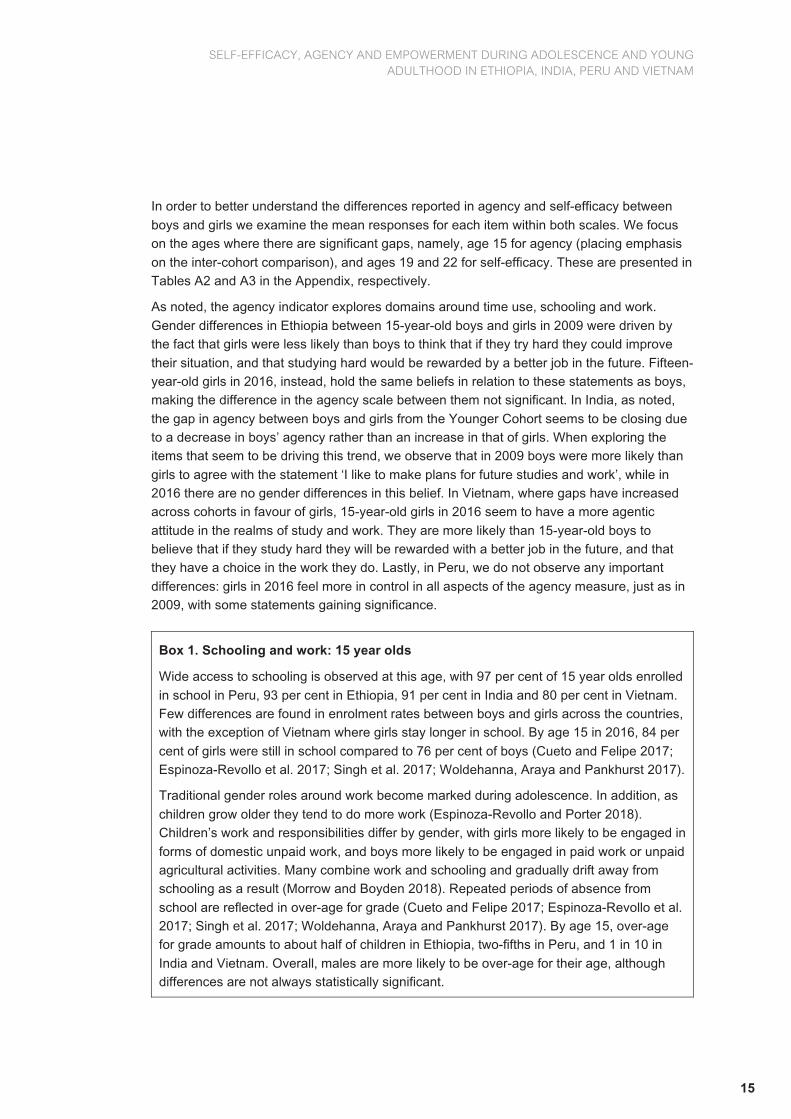
In order to better understand the differences reported in agency and self-efficacy between
boys and girls we examine the mean responses for each item within both scales. We focus on the ages where there are significant gaps, namely, age 15 for agency (placing emphasis
on the inter-cohort comparison), and ages 19 and 22 for self-efficacy. These are presented in Tables A2 and A3 in the Appendix, respectively.
As noted, the agency indicator explores domains around time use, schooling and work.
Gender differences in Ethiopia between 15-year-old boys and girls in 2009 were driven by the fact that girls were less likely than boys to think that if they try hard they could improve
their situation, and that studying hard would be rewarded by a better job in the future. Fifteen-year-old girls in 2016, instead, hold the same beliefs in relation to these statements as boys, making the difference in the agency scale between them not significant. In India, as noted,
the gap in agency between boys and girls from the Younger Cohort seems to be closing due to a decrease in boys’ agency rather than an increase in that of girls. When exploring the items that seem to be driving this trend, we observe that in 2009 boys were more likely than
girls to agree with the statement ‘I like to make plans for future studies and work’, while in 2016 there are no gender differences in this belief. In Vietnam, where gaps have increased across cohorts in favour of girls, 15-year-old girls in 2016 seem to have a more agentic
attitude in the realms of study and work. They are more likely than 15-year-old boys to believe that if they study hard they will be rewarded with a better job in the future, and that they have a choice in the work they do. Lastly, in Peru, we do not observe any important
differences: girls in 2016 feel more in control in all aspects of the agency measure, just as in 2009, with some statements gaining significance.
Box 1. Schooling and work: 15 year olds
Wide access to schooling is observed at this age, with 97 per cent of 15 year olds enrolled
in school in Peru, 93 per cent in Ethiopia, 91 per cent in India and 80 per cent in Vietnam. Few differences are found in enrolment rates between boys and girls across the countries, with the exception of Vietnam where girls stay longer in school. By age 15 in 2016, 84 per
cent of girls were still in school compared to 76 per cent of boys (Cueto and Felipe 2017; Espinoza-Revollo et al. 2017; Singh et al. 2017; Woldehanna, Araya and Pankhurst 2017).
Traditional gender roles around work become marked during adolescence. In addition, as
children grow older they tend to do more work (Espinoza-Revollo and Porter 2018). Children’s work and responsibilities differ by gender, with girls more likely to be engaged in
forms of domestic unpaid work, and boys more likely to be engaged in paid work or unpaid agricultural activities. Many combine work and schooling and gradually drift away from schooling as a result (Morrow and Boyden 2018). Repeated periods of absence from
school are reflected in over-age for grade (Cueto and Felipe 2017; Espinoza-Revollo et al. 2017; Singh et al. 2017; Woldehanna, Araya and Pankhurst 2017). By age 15, over-age for grade amounts to about half of children in Ethiopia, two-fifths in Peru, and 1 in 10 in
India and Vietnam. Overall, males are more likely to be over-age for their age, although differences are not always statistically significant.
SELF-EFFICACY, AGENCY AND EMPOWERMENT DURING ADOLESCENCE AND YOUNG ADULTHOOD IN ETHIOPIA, INDIA, PERU AND VIETNAM
16
Gender differences in the aggregated index of self-efficacy are reflected consistently in the
individual statements. Very strikingly, in nearly all countries at age 19, girls lie behind boys in their perceptions of all the different statements of self-efficacy, with differences being statistically significant for most statements in Ethiopia and India.
Box 2. Life transitions at ages 19 and 22
Schooling
In Vietnam we observe the greatest proportion of children still in school at ages 19 and 22, with 78 per cent of young adults in school and considerably more girls than boys. In
Ethiopia, only 59 per cent of 19 year olds were still in education, with far more girls (66 per cent) still in school than boys (56 per cent). However, by age 22, this was reversed and slightly more men (38 per cent) were still in school compared to women (34 per
cent). In India, half of the sample was in school at age 19, with boys more likely to be in school than girls (57 per cent versus 41). In Peru, 86 per cent of children had or were still completing secondary school at 19, while 16 per cent had left school without obtaining
this qualification. There were no differences between males and females. By age 22, 8 in 10 had completed secondary school and around two-fifths of males and females had completed or were pursuing higher education.
Combining work and study
At age 19, children commonly combined work and study. Overall, across all countries a considerably higher proportion of boys combined both activities compared to girls, and also more boys worked if they were not in school. This trend continues at age 22, when a
notably higher proportion of girls are found neither studying nor working (generally those transitioning into marriage).
Marriage
In Ethiopia and Peru, around 1 in 10 girls were married or living with a partner at age 19. In Vietnam, this was 2 in 10 girls. In India, however, the transition to marriage starts
earlier for a larger proportion of girls, having taken place for two-thirds of girls this age. By age 22, in Ethiopia 32 per cent of girls were married compared to only 7 per cent of boys. In Peru, 50 per cent of girls were married or cohabiting compared to 18 per cent of boys.
Similarly, in Vietnam 43 per cent of girls were married or cohabiting compared to 19 per cent of boys. In India, married girls represented 56 per cent of the sample and married boys only 11 per cent.
Sources: Prudhvikar et al. 2017; Sánchez and Pazos 2017; Espinoza-Revollo et al. 2018; Woldehanna, Araya and Pankhurst 2018.
4.2. The importance of context: growing up in urban or rural areas
While the previous section highlighted important differences in the patterns of self-efficacy
and agency between boys and girls across countries, in this section we focus on examining differences at the sub-national level. As noted, the notion of empowerment is strongly determined by social institutions and ideological systems. With this in mind, here we explore
SELF-EFFICACY, AGENCY AND EMPOWERMENT DURING ADOLESCENCE AND YOUNG ADULTHOOD IN ETHIOPIA, INDIA, PERU AND VIETNAM
17
the extent to which the gender gaps observed previously are driven or exacerbated by where
young people live, whether in urban or rural areas.9
Figure 4 shows the differences in self-efficacy by gender and location. Table A5 in the
Appendix shows the cross-table for differences among location and gender groups and corresponding t-tests. In Ethiopia, the differences between boys and girls observed at age 12
are driven by the low levels of self-efficacy for rural girls. At age 15 the gaps close, indicating a great improvement in rural girls’ self-efficacy between these ages. For the Older Cohort, at age 19, girls in both urban and rural areas show lower self-efficacy in relation to boys, who
present no difference whether they come from rural or urban areas. In India, 12-year-old boys and girls in urban areas show similar levels of self-efficacy and significantly higher levels than their counterparts in rural areas (who also have similar self-efficacy between
them). Similarly to Ethiopia, the gaps close at age 15. The trends in the Older Cohort are noteworthy. The gender gaps observed in Figure 2, which largely favoured boys, are also driven mainly by the low levels of self-efficacy of rural girls. Note that, at ages 19 and 22,
urban girls have similar levels of self-efficacy as urban boys and significantly higher self-efficacy than rural boys. Indeed, at age 22, the largest difference in self-efficacy is between rural and urban girls. In Peru, rural girls in both the Younger and Older Cohorts present the
lowest level of self-efficacy, though Older Cohort girls tend to increase their self-efficacy between the ages of 19 and 22, closing the gap with urban boys. Finally, in Vietnam, 12-year-old urban girls present significantly higher self-efficacy than rural boys, however this gap
closes at age 15. For the Older Cohort, girls, whether in urban or rural areas, have lower levels of self-esteem than boys. Interestingly, while the self-efficacy of urban boys at age 19 was the highest and significantly higher than their rural counterparts, the trend decreases
until reaching a similar level at age 22.
Overall, the figures highlight an important rural/urban divide in terms of reported self-efficacy
which stresses the importance of social norms in the construction of notions of empowerment. In this specific case, the notion of being able to respond well to unforeseen circumstances,
cope with adversity and difficulties and find solutions. Within this divide, girls from rural areas are the most disadvantaged, showing the lowest levels of self-efficacy in all countries.
9 For reference, in Table A4 we include the difference in means with t-test between rural and urban areas for our two measures.
SELF-EFFICACY, AGENCY AND EMPOWERMENT DURING ADOLESCENCE AND YOUNG ADULTHOOD IN ETHIOPIA, INDIA, PERU AND VIETNAM
18
Figure 4. Mean scores of self-efficacy for boys and girls in urban and rural locations, by age and cohort
We conduct a similar exercise for the agency index in Figure 5, and present the figures in
Table A6 in the Appendix. The rural/urban divide is again evident in all counties except for Vietnam. As the agency index refers to specific domains in children’s lives (schooling, work
and time use), the differences between young people’s perceptions of their locus of control between urban and rural areas are not surprising. Adolescents and young adults in rural areas spend significantly more time working (in paid and unpaid activities, in and outside the
household) and significantly less time in school and studying outside school (Espinoza and Porter 2018). The figure reveals that the gender gaps favouring boys in Ethiopia and India (observed in Figure 3) are driven mainly by urban boys, and that the gaps favouring girls in
Peru and Vietnam are driven by girls living in urban areas. Three trends are worth highlighting. First, in India, 12-year-old boys have the lowest score in the agency index, but from age 15 they reach the highest and remain in that situation until the age of 22. Second,
urban boys in Vietnam have the lowest scores throughout ages 12 to 19 and increase abruptly at age 22, reaching the highest value in relation to the other groups. Third, in Peru, urban girls show the highest scores throughout the 10-year period covered, with rural girls
showing a tendency to decrease in their agency scores, reaching the lowest among the four groups at age 22.
SELF-EFFICACY, AGENCY AND EMPOWERMENT DURING ADOLESCENCE AND YOUNG ADULTHOOD IN ETHIOPIA, INDIA, PERU AND VIETNAM
19
Figure 5. Mean scores of agency for boys and girls in urban and rural locations (Older Cohort), by age
4.3. Correlates of agency and self-efficacy at age 15 and 22
In this section we explore some of the household and child characteristics associated with our two empowerment measures, focusing on the sample children from both cohorts at ages
15 and 22. Many factors shape individuals’ perceptions of their capabilities and locus of control and it is beyond the scope of this paper to present a causal analysis. However, Young Lives’ longitudinal data allows us to explore some background or contextual characteristics
that shape these self-perceptions and, hence, shape notions of empowerment. Among these, we focus on household characteristics, including location, wealth status, maternal education and household size. To guard against reverse causality we fix time-variant information on
socio-economic status at the initial survey round (2002). We also control for child characteristics including sex (our focus variable), age (in months), birth order, and ethnicity or mother tongue. Our specific interest is to examine which initial factors shape the level of self-
efficacy and agency in mid-adolescence and young adulthood. We run ordinary least squares (OLS) regressions with cluster-robust standard errors. In Tables A7 to A10 in the Appendix we provide detailed results for the four countries.
With respect to our focus variable, results from the OLS regressions produced similar results
to the comparison of means between males and females (Table A1), which corroborates the importance of gender as it does not lose significance after controlling for the set of covariates listed above. Interestingly, the location variable (i.e. whether the child lived in an urban site in
2002) loses significance in all the regressions, except in Peru where being from an urban location is associated with higher agency at the ages of 15 and 22. The loss of significance in the other countries signals a high correlation between location and the rest of the socio-
SELF-EFFICACY, AGENCY AND EMPOWERMENT DURING ADOLESCENCE AND YOUNG ADULTHOOD IN ETHIOPIA, INDIA, PERU AND VIETNAM
20
The examination of the rest of the correlates shows that initial socio-economic status –
measured through mother’s education or household’s wealth – matters in shaping agency and self-efficacy at both ages 15 and 22, with some heterogeneity across countries. This is particularly evident in India and Peru, and to a lesser extent in Ethiopia and Vietnam. In
Ethiopia, children whose caregivers have more than eight grades of schooling show higher levels of agency and self-efficacy at both ages 15 and 22. The education gradient is also evident in India and Peru, where children whose caregivers have attained post-secondary
education show higher agency and self-efficacy at age 15, and higher agency at 22 in India and higher self-efficacy in Peru compared to children whose parents have never been in school. In Vietnam, on the other hand, the coefficient for caregivers having more than eight
years of education is only significant for the agency indicator at ages 15 and 22. In all the countries, being in the top wealth tercile is associated with higher levels of agency at ages 15 and 22. Interestingly, however, in Ethiopia, India, and Vietnam, wealth is not associated with
self-efficacy at any age. This suggests that individuals’ locus of control in the domains of work, study and time use (our agency measure) is shaped by the material conditions where they grow up. Dercon and Krishnan (2009) arrive at a similar conclusion in a study of Older
Cohort 12 year olds. Finally, the variables related to ethnicity present heterogeneous results across countries, indicators and ages. For instance, Amharic-speaking young adults show less agency and self-efficacy at age 22 in relation to other-language speaking 22 year olds,
while speaking Oromo is associated with less agency, consistently at ages 15 and 22.
5. Conclusion In this working paper, we provide an overview of gender differences in two measures directly
related to empowerment and that are more conceptually appropriate for young people: agency and self-efficacy. We exploit the Young Lives dataset, which allows us to look at these two measures over a period of 10 years, from early adolescence to early adulthood
across four low- and middle-income countries: Ethiopia, India, Peru and Vietnam.
We observe that gender gaps emerge at different ages and sometimes in opposite directions
when considering both measures. In terms of the self-efficacy index, which captures the self-belief in one’s own ability to cope with unexpected events and daily hassles, the gaps are all in favour of boys across the four countries, expect for Vietnam at ages 12 and 15. The
largest gap happens at the ages of 19 and 22, when boys show significantly more self-efficacy than girls. This suggest that life transitions between ages 15 and 19 may be affecting the way girls think of themselves as being resourceful to cope with unforeseen circumstances
or difficulties.
In the measure of agency, which measures locus of control in the domains of work,
education, and time use, we find mixed results. The gaps work in favour of boys in Ethiopia and India, and in favour of girls in Peru and Vietnam during adolescence until they close up
in young adulthood. An inter-cohort comparison of 15 year olds in 2009 and 2016 shows that the situation might be changing for younger generations: the gap between 15-year-old boys and girls in 2016 is smaller in Ethiopia and India than it was in 2009, but it is larger in
Vietnam – in favour of girls. Peru does not show significant changes between the two cohorts at the age of 15.
SELF-EFFICACY, AGENCY AND EMPOWERMENT DURING ADOLESCENCE AND YOUNG ADULTHOOD IN ETHIOPIA, INDIA, PERU AND VIETNAM
21
For both measures we further examined the effect of living in an urban or rural area and find
that much of the gaps are driven by the low levels of self-efficacy of girls from rural areas. Indeed, urban girls have, in some cases, similar or higher levels of self-efficacy than urban and rural boys, respectively. Similarly, in agency, the gaps in favour of boys observed in
Ethiopia and India, and in favour of girls in Peru and Vietnam, are largely driven by those living in urban areas. These findings highlight the importance of the social context and its normative underpinnings to shape notions of empowerment.
Finally, we explored the background circumstances that shape these two measures at the
ages of 15 and 22 and find that caregivers’ level of education and household wealth are positively associated with both agency and self-efficacy – though with some heterogeneity in their significance across countries. For the specific case of wealth, we see an important and
consistent association with agency across the four countries at both ages 15 and 22. The fact that the material condition of the household is positively associated with agency, and that agency has been found to be associated with later outcomes, suggests that this is a
mechanism for the perpetuation of gender inequality.
While the analysis in this paper does not infer causality, the systematic gender and location
gaps and associations are suggestive of when, where, and how gender gaps could be tackled. As more information is now available for the Young Lives children, further research
can examine the impacts in relation to access to the labour market or decision-making processes in the household.
SELF-EFFICACY, AGENCY AND EMPOWERMENT DURING ADOLESCENCE AND YOUNG ADULTHOOD IN ETHIOPIA, INDIA, PERU AND VIETNAM
22
References Alkire, S. (2008) Concepts and Measures of Agency, OPHI Working Paper 9, Oxford:
University of Oxford.
Bandura, A. (1993) ‘Perceived Self-Efficacy in Cognitive Development and Functioning’,
Educational Psychologist 28.2: 117–148.
Cueto, S., and C. Felipe (2017) Education and Learning: Preliminary Findings from the 2016
Young Lives Survey (Round 5): Peru, Young Lives Round 5 Fact Sheets, Oxford: Young Lives.
Dawis, R. (2000) ‘Scale Construction and Psychometric Considerations’, in H.E. Tinsley and
S.D. Brown (eds.) Handbook of Applied Multivariate Statistics and Mathematical Modeling, 65-94, San Diego, CA: Academic Press.
Dercon, S., and P. Krishnan (2009) ‘Poverty and the Psychosocial Competencies of Children:
Evidence from the Young Lives Sample in Four Developing Countries’, Children Youth and Environments 19.2: 138–163.
Diener, E., and R. Biswas-Diener (2005) ‘Psychological Empowerment and Subjective Well-
being’, in D. Narayan (ed.) Measuring Empowerment: Cross-disciplinary Perspectives, 125-
140, Washington, DC: World Bank.
Donald, A., G. Koolwal, J. Annan, K. Falb, and M. Goldstein (2017) Measuring Women’s
Agency, World Bank Policy Research Working Paper 8148, Washington, DC: World Bank.
Escobal, J., and E. Flores (2008) An Assessment of the Young Lives Sampling Approach in
Peru, Technical Note 3, Oxford: Young Lives.
Espinoza-Revollo, P., L. Benny, L.T. Duc, and N.T.T. Hang (2017) Education and Learning:
Preliminary Findings from the 2016 Young Lives Survey (Round 5): Vietnam, Young Lives Round 5 Fact Sheets, Oxford: Young Lives.
Espinoza-Revollo, P., L. Benny, L.T. Duc, and N.T.T. Hang (2018) Youth Transitions: Skills,
Work, and Family Formation. Preliminary Findings from the 2016 Young Lives Survey (Round 5): Vietnam, Young Lives Round 5 Fact Sheet, Oxford: Young Lives.
Espinoza-Revollo, P., and C. Porter (2018) Evolving Time Use of Children Growing Up in
Ethiopia, India, Peru and Vietnam, 2006-2016, Working Paper 180, Oxford: Young Lives.
Fischer, R., and T.L. Milfont (2010) ‘Standardization in Psychological Research’, International Journal of Psychological Research 3.1: 88–96.
Kabeer, N. (1999) ‘Resources, Agency, Achievements: Reflections on the Measurement of
Women's Empowerment ’, Development and Change 30.3: 435-64.
Kumra, N. (2008) An Assessment of the Young Lives Sampling Approach in Andhra
Pradesh, India, Technical Note 2, Oxford: Young Lives.
Maddux, J. (1991) ‘Self-Efficacy’, in C.R. Snyder and D.R. Forsyth (eds.) Handbook of Social
and Clinical Psychology: The Health Perspective. New York: Pergamon Press.
SELF-EFFICACY, AGENCY AND EMPOWERMENT DURING ADOLESCENCE AND YOUNG ADULTHOOD IN ETHIOPIA, INDIA, PERU AND VIETNAM
23
Morrow, V. and J. Boyden (2018) Responding to Children’s Work: Evidence from the Young
Lives Study in Ethiopia, India, Peru and Vietnam, Young Lives Summative Report, Oxford: Young Lives.
Nguyen, N.P. (2008) An Assessment of the Young Lives Sampling Approach in Vietnam,
Technical Note 4, Oxford: Young Lives.
Outes-Leon, I., and A. Sánchez (2008) An Assessment of the Young Lives Sampling
Approach in Ethiopia, Technical Note 1, Oxford: Young Lives.
Prudhvikar, R., R. Singh, S. Galab, P. Mukherjee, and R. Kesarwani (2017) Youth
Transitions: Skills, Work, and Family Formation. Preliminary Findings from the 2016 Young Lives Survey (Round 5): United Andhra Pradesh, Young Lives Round 5 Fact Sheet, Oxford: Young Lives.
Rotter, J.B. (1966) ‘Generalized Expectancies for Internal Versus External Control of
Reinforcement’, Psychological Monographs: General and Applied 80.1: 1–28.
Samman, E., and M.E. Santos (2009) 'Agency and Empowerment: A Review of Concepts,
Indicators and Empirical Evidence.' Background Paper for the 2009 Human Development Report in Latin America and the Caribbean. Oxford: Oxford Poverty and Human
Development Initiative, University of Oxford.
Sánchez, A., and N. Pazos (2017) Youth Transitions: Skills, Work, and Family Formation.
Preliminary Findings from the 2016 Young Lives Survey (Round 5): Peru, Young Lives Round 5 Fact Sheet, Oxford: Young Lives.
Schwarzer, R., and M. Jerusalem (1995) 'The General Self-Efficacy Scale (GSE).'
https://userpage.fu-berlin.de/health/engscal.htm (accessed 8 August 2018).
Singh, R., P. Prudhvikar Reddy, S. Galab, and P. Mukherjee (2017) Education and Learning: Preliminary Findings from the 2016 Young Lives Survey (Round 5): India. Young Lives
Round 5 Fact Sheet, Oxford: Young Lives.
United Nations (n.d.) 'Sustainable Development Goals Goal 5: Achieve Gender Equality and
Empower All Women and Girls', www.un.org/sustainabledevelopment/gender-equality (accessed 6 August 2018).
Woldehanna, T., M. Araya, and A. Pankhurst (2017) Education and Learning: Preliminary
Findings from the 2016 Young Lives Survey (Round 5): Ethiopia, Young Lives Round 5 Fact Sheets, Oxford: Young Lives.
Woldehanna, T., M. Araya, and A. Pankhurst (2018) Youth Transitions: Skills, Work, and
Family Formation. Preliminary Findings from the 2016 Young Lives Survey (Round 5): Ethiopia, Young Lives Round 5 Fact Sheets, Oxford: Young Lives.
Yorke, L. and M.J. Ogando Portela (2018) Psychosocial Scales in the Young Lives Round 4
Survey: Selection, Adaptation and Validation, Technical Note 45, Oxford: Young Lives.
SELF-EFFICACY, AGENCY AND EMPOWERMENT DURING ADOLESCENCE AND YOUNG ADULTHOOD IN ETHIOPIA, INDIA, PERU AND VIETNAM
24
Appendix
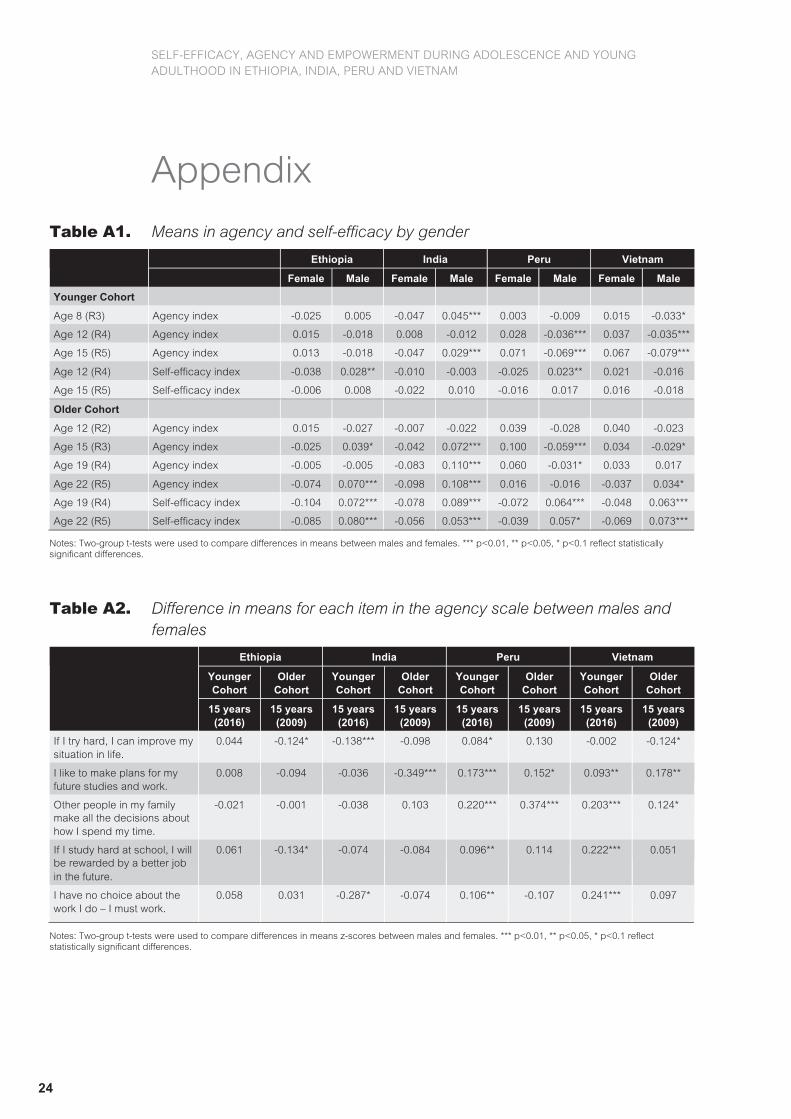
Table A1. Means in agency and self-efficacy by gender
Ethiopia India Peru Vietnam
Female Male Female Male Female Male Female Male
Younger Cohort
Age 8 (R3) Agency index -0.025 0.005 -0.047 0.045*** 0.003 -0.009 0.015 -0.033*
Age 12 (R4) Agency index 0.015 -0.018 0.008 -0.012 0.028 -0.036*** 0.037 -0.035***
Age 15 (R5) Agency index 0.013 -0.018 -0.047 0.029*** 0.071 -0.069*** 0.067 -0.079***
Age 12 (R4) Self-efficacy index -0.038 0.028** -0.010 -0.003 -0.025 0.023** 0.021 -0.016
Age 15 (R5) Self-efficacy index -0.006 0.008 -0.022 0.010 -0.016 0.017 0.016 -0.018
Older Cohort
Age 12 (R2) Agency index 0.015 -0.027 -0.007 -0.022 0.039 -0.028 0.040 -0.023
Age 15 (R3) Agency index -0.025 0.039* -0.042 0.072*** 0.100 -0.059*** 0.034 -0.029*
Age 19 (R4) Agency index -0.005 -0.005 -0.083 0.110*** 0.060 -0.031* 0.033 0.017
Age 22 (R5) Agency index -0.074 0.070*** -0.098 0.108*** 0.016 -0.016 -0.037 0.034*
Age 19 (R4) Self-efficacy index -0.104 0.072*** -0.078 0.089*** -0.072 0.064*** -0.048 0.063***
Age 22 (R5) Self-efficacy index -0.085 0.080*** -0.056 0.053*** -0.039 0.057* -0.069 0.073***
Notes: Two-group t-tests were used to compare differences in means between males and females. *** p<0.01, ** p<0.05, * p<0.1 reflect statistically significant differences.
Table A2. Difference in means for each item in the agency scale between males and females
Ethiopia India Peru Vietnam
Younger Cohort
Older Cohort
Younger Cohort
Older Cohort
Younger Cohort
Older Cohort
Younger Cohort
Older Cohort
15 years (2016)
15 years (2009)
15 years (2016)
15 years (2009)
15 years (2016)
15 years (2009)
15 years (2016)
15 years (2009)
If I try hard, I can improve my situation in life.
I have no choice about the work I do – I must work.
0.058 0.031
-0.287* -0.074 0.106** -0.107 0.241*** 0.097
Notes: Two-group t-tests were used to compare differences in means z-scores between males and females. *** p<0.01, ** p<0.05, * p<0.1 reflect statistically significant differences.
SELF-EFFICACY, AGENCY AND EMPOWERMENT DURING ADOLESCENCE AND YOUNG ADULTHOOD IN ETHIOPIA, INDIA, PERU AND VIETNAM
25
Table A3. Difference in means for each item in the self-efficacy scale between males and females
Items Ethiopia India Peru Vietnam
19 years 22 years 19 years 22 years 19 years 22 years 19 years 22 years
I can always manage to solve difficult problems if I try hard enough.
Notes: Two-group t-tests were used to compare differences in means z-scores between males and females. *** p<0.01, ** p<0.05, * p<0.1 reflect statistically significant differences.
Table A4. Means in agency and self-efficacy by location
Ethiopia India Peru Vietnam
Rural Urban Rural Urban Rural Urban Rural Urban
Younger Cohort
Age 12 Agency index -0.064 0.117 *** -0.028 0.080 *** -0.149 0.062 *** -0.018 0.079 **
Age 15 Agency index -0.051 0.088 *** -0.031 0.074 *** -0.138 0.064 *** -0.037 0.122 ***
Age 12 Self-efficacy index -0.029 0.047 * -0.050 0.133 *** -0.099 0.045 *** -0.006 0.036
Age 15 Self-efficacy index -0.008 0.021 -0.015 0.026 -0.122 0.057 *** 0.001 -0.016
Older Cohort
Age 12 Agency index -0.031 0.042 0.005 -0.080 -0.059 0.023 0.015 -0.014
Age 15 Agency index -0.012 0.049 -0.022 0.131 *** -0.073 0.044 * 0.008 -0.011
Age 19 Agency index -0.050 0.087 *** -0.032 0.158 *** -0.189 0.075 *** 0.024 0.032
Age 22 Agency index -0.007 0.021 -0.045 0.163 *** -0.175 0.054 *** -0.021 0.074
Age 19 Self-efficacy index -0.016 0.002 -0.059 0.214 *** -0.209 0.063 *** -0.008 0.061
Age 22 Self-efficacy index 0.009 -0.011 -0.045 0.138 *** -0.135 0.058 ** -0.005 0.012
More than eight grades 0.158* 0.213** 0.217*** 0.148**
(0.082) (0.079) (0.055) (0.068)
Wealth terciles (ref: bottom tercile)
Middle tercile 0.036 0.024 0.035 0.045
(0.080) (0.061) (0.077) (0.054)
Top tercile 0.221* 0.115 0.210** 0.126
(0.118) (0.105) (0.076) (0.075)
Household size 0.002 0.014** -0.011 0.017*
(0.008) (0.006) (0.009) (0.009)
Number of children born before -0.001 0.005 0.020** 0.000
(0.007) (0.006) (0.007) (0.007)
Age in months 0.003 0.002 -0.001 -0.001
(0.004) (0.004) (0.006) (0.003)
Ethnicity (ref: other)
Amhara -0.030 -0.206 -0.159** -0.294***
(0.105) (0.125) (0.063) (0.068)
Oromo -0.203* 0.011 -0.181** -0.060
(0.103) (0.106) (0.076) (0.074)
Tigrian -0.164 -0.150 -0.129 -0.101*
(0.108) (0.118) (0.085) (0.053)
Constant -0.483 -0.413 0.258 0.134
(0.712) (0.844) (1.630) (0.841)
Observations 1,755 1,755 770 770
Adjusted R-squared 0.058 0.048 0.052 0.083
Notes: OLS = Ordinary least squares. Robust standard errors, in parentheses, are clustered at the cluster level. Asterisks indicate *** p<0.01, ** p<0.05, * p<0.1.
SELF-EFFICACY, AGENCY AND EMPOWERMENT DURING ADOLESCENCE AND YOUNG ADULTHOOD IN ETHIOPIA, INDIA, PERU AND VIETNAM
28
Table A8. OLS regressions on psychosocial competencies (India)
Number of children born before -0.043*** -0.032** -0.024*** -0.011
(0.012) (0.013) (0.007) (0.009)
Child's age (in months) 0.005 0.009** 0.001 0.006*
(0.004) (0.004) (0.003) (0.003)
Caste (ref: other classes)
Belongs to Scheduled Caste 0.009 0.020 0.078 -0.111**
(0.040) (0.032) (0.061) (0.044)
Belongs to Scheduled Tribe 0.112 -0.006 0.318*** -0.054
(0.074) (0.089) (0.091) (0.085)
Belongs to Backward Class -0.043 0.002 0.010 -0.045
(0.042) (0.034) (0.048) (0.048)
Constant -1.039 -1.644** -0.386 -1.621
(0.748) (0.739) (0.823) (0.946)
Observations 1,870 1,870 909 909
Adjusted R-squared 0.047 0.013 0.110 0.029
Notes: OLS = Ordinary least squares. Robust standard errors, in parentheses, are clustered at the cluster level. Asterisks indicate *** p<0.01, ** p<0.05, * p<0.1.
SELF-EFFICACY, AGENCY AND EMPOWERMENT DURING ADOLESCENCE AND YOUNG ADULTHOOD IN ETHIOPIA, INDIA, PERU AND VIETNAM
29
Table A9. OLS regressions on psychosocial competencies (Peru)
Primary to secondary 0.200*** 0.181*** -0.005 0.183**
(0.058) (0.056) (0.131) (0.065)
Higher education 0.315*** 0.242*** 0.129 0.237**
(0.049) (0.065) (0.130) (0.092)
Wealth terciles (ref: bottom tercile)
Middle tercile 0.027 0.048 0.053 0.196***
(0.022) (0.032) (0.070) (0.066)
Top tercile 0.151*** 0.153*** 0.193** 0.210**
(0.049) (0.039) (0.070) (0.087)
Household size 0.005 -0.005 -0.007 -0.004
(0.007) (0.007) (0.013) (0.011)
Number of children born before 0.014** -0.004 -0.021 -0.002
(0.006) (0.006) (0.014) (0.013)
Child's age (in months) 0.005 0.001 -0.000 -0.001
(0.003) (0.004) (0.005) (0.007)
Mother tongue (ref: other)
Spanish -0.096* 0.009 0.105* 0.060
(0.053) (0.145) (0.051) (0.074)
Quechua -0.068 0.054 0.203* 0.129**
(0.053) (0.146) (0.098) (0.053)
Constant -1.044* -0.354 -0.157 -0.221
(0.589) (0.653) (1.253) (1.727)
Observations 1,771 1,772 561 561
Adjusted R-squared 0.078 0.042 0.055 0.034
Notes: OLS = Ordinary least squares. Robust standard errors, in parentheses, are clustered at the cluster level. Asterisks indicate *** p<0.01, ** p<0.05, * p<0.1.
SELF-EFFICACY, AGENCY AND EMPOWERMENT DURING ADOLESCENCE AND YOUNG ADULTHOOD IN ETHIOPIA, INDIA, PERU AND VIETNAM
30
Table A10. OLS regressions on psychosocial competencies (Vietnam)
Number of children born before -0.031** -0.012 -0.017 -0.004
(0.012) (0.013) (0.013) (0.011)
Child's age (in months) -0.002 0.002 0.002 0.003
(0.004) (0.003) (0.005) (0.005)
Ethnicity (ref: minority groups)
Majority Kinh 0.178** 0.128** 0.147 0.074
(0.081) (0.052) (0.090) (0.060)
Constant 0.219 -0.429 -0.936 -1.005
(0.813) (0.505) (1.428) (1.230)
Observations 1,875 1,875 823 822
Adjusted R-squared 0.101 0.023 0.081 0.031
Notes: OLS = Ordinary least squares. Robust standard errors, in parentheses, are clustered at the cluster level. Asterisks indicate *** p<0.01, ** p<0.05, * p<0.1.
Self-efficacy, Agency and Empowerment During Adolescence and Young Adulthood in Ethiopia, India, Peru and Vietnam
This working paper examines gender gaps in empowerment and the timing of their emergence through adolescence and young adulthood for two cohorts of children living in Ethiopia, India, Peru and Vietnam. It uses longitudinal data from Young Lives on two psychosocial competencies – self-efficacy and agency – associated with the notion of empowerment.
In all four countries, gaps in self-efficacy emerge in late adolescence, widening particularly between the ages of 15 and 19 and favouring boys. The results are more heterogeneous for agency; gaps widen between the ages of 12 and 15 and favour boys in Ethiopia and India, and girls in Peru and Vietnam. However, for the latter, the gaps close or even reverse in favour of boys by age 22. Our analysis pays special attention to the sub-national context: whether young people grow up in urban or rural areas. We find important gaps for rural girls, who show the lowest levels of agency and self-efficacy across the four countries. Finally, we explore the relationship between background characteristics and these two measures in mid-adolescence and young adulthood (ages 15 and 22). We find that these outcome measures correlate positively with the socio-economic level of the household in which they were born and grew up.
www.younglives.org.uk
About Young Lives
Young Lives is an international study of childhood poverty, involving 12,000 children in four countries over 15 years. It is led by a team in the Department of International Development at the University of Oxford in association with research and policy partners in the four study countries: Ethiopia, India, Peru and Vietnam.
Through researching different aspects of children’s lives, we seek to improve policies and programmes for children.
Young Lives Partners
Young Lives is coordinated by a small team based at the University of Oxford, led by Professor Jo Boyden.
• Ethiopian Development Research Institute, Ethiopia
• Pankhurst Development Research and Consulting plc, Ethiopia
• Centre for Economic and Social Studies, Hyderabad, India
• Save the Children India
• Sri Padmavathi Mahila Visvavidyalayam (Women’s University), Andhra Pradesh, India
• Grupo de Análisis para el Desarollo (GRADE), Peru
• Instituto de Investigación Nutricional, Peru
• Centre for Analysis and Forecasting, Vietnamese Academy of Social Sciences, Vietnam
• General Statistics Office, Vietnam
• Oxford Department of International Development, University of Oxford, UK
Contact:Young LivesOxford Department of International Development,University of Oxford,3 Mansfield Road,Oxford OX1 3TB, UKTel: +44 (0)1865 281751Email: [email protected]: www.younglives.org.uk