22
Sensitivity analyses for the CAFE policy scenarios Markus Amann, Janusz Cofala, Chris Heyes, Zbigniew Klimont, Wolfgang Schöpp, Fabian Wagner
| Date post: | 19-Dec-2015 |
| Category: |
Documents |
| View: | 220 times |
| Download: | 2 times |

Sensitivity analyses for the CAFE
policy scenarios
Markus Amann, Janusz Cofala, Chris Heyes, Zbigniew Klimont, Wolfgang Schöpp, Fabian Wagner

Sensitivity analysesQuestions
1. Are ambition levels for different environmental problems balanced?
2. How would alternative health impact theories change the results?
3. How would national energy and agricultural projections change the optimization outcome?
4. How do uncertainties in agricultural projections influence the results?
5. How would exclusion of further road measures change the results?
6. How would additional measures for ships change the outcomes?

Sensitivity analysis 1
Are ambition levels for different environmental problems balanced?
Approach:• Compare outcomes of
– Optimization for health targets only– Optimization for environmental targets only– Joint optimization

Sensitivity analysis 1
Costs for health and environmental targets
0
10
20
30
40
MTFR Case "C" Case "B" Case "A" CLE
Billion Euro/year
PM optimized Joint without PM Joint optimization
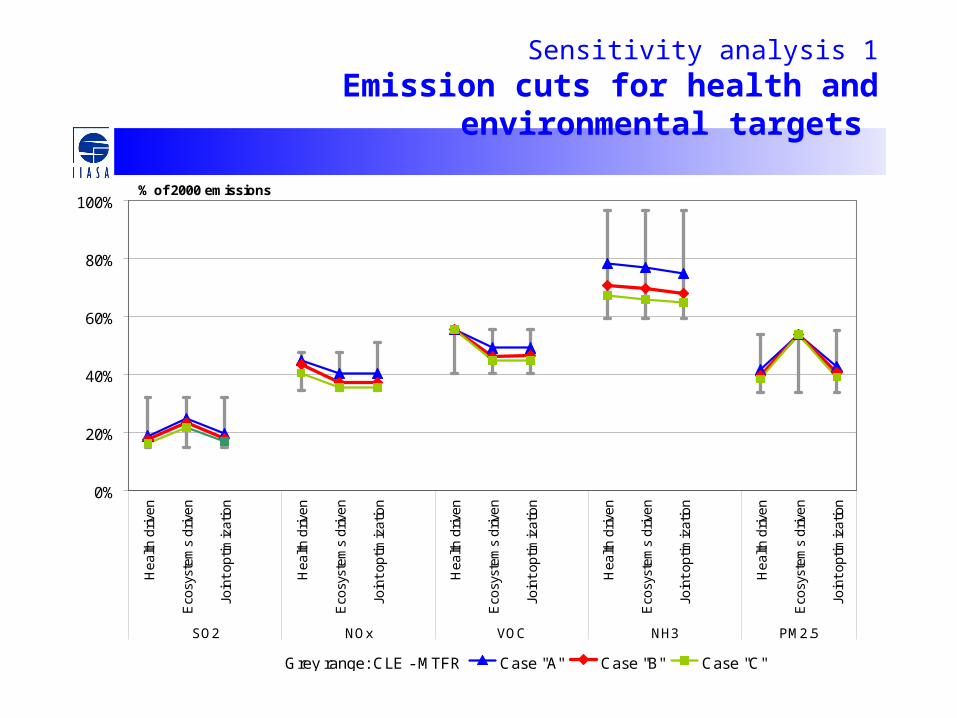
Sensitivity analysis 1
Emission cuts for health and environmental targets
0%
20%
40%
60%
80%
100%
Hea
lth d
riven
Eco
syst
ems
driv
en
Join
t op
timiz
atio
n
Hea
lth d
riven
Eco
syst
ems
driv
en
Join
t op
timiz
atio
n
Hea
lth d
riven
Eco
syst
ems
driv
en
Join
t op
timiz
atio
n
Hea
lth d
riven
Eco
syst
ems
driv
en
Join
t op
timiz
atio
n
Hea
lth d
riven
Eco
syst
ems
driv
en
Join
t op
timiz
atio
n
SO2 NOx VOC NH3 PM2.5
% of 2000 emissions
Grey range: CLE - MTFR Case "A" Case "B" Case "C"
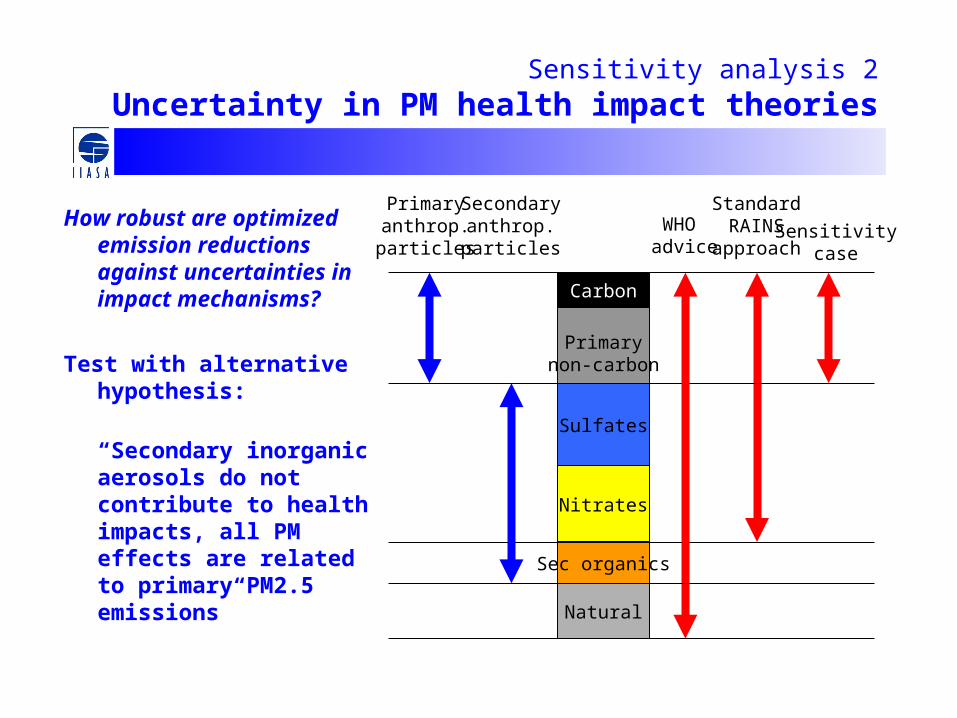
Sensitivity analysis 2
Uncertainty in PM health impact theories
How robust are optimized emission reductions against uncertainties in impact mechanisms?
Test with alternative hypothesis:
“Secondary inorganic aerosols do not contribute to health impacts, all PM effects are related to primary PM2.5 emissions” Natural
Sec organics
Nitrates
Sulfates
Carbon
Primarynon-carbon
StandardRAINS
approachSensitivity
case
WHO advice
Primaryanthrop.particles
Secondaryanthrop.particles

Sensitivity analysis 2
Sensitivity case
• Approach – Achieve same relative improvement in mortality estimated for
CLE based on “primary PM only” theory – or, expressed alternatively:
– Reduce primary PM2.5 concentrations by the same percentage as total PM2.5 would be reduced in reference case
• Two optimization runs:1. Targets for health (PM) only
2. For all targets simultaneously

Sensitivity analysis 2
Control costs for alternative impact theories
0
10
20
30
40
Standard approach Primary PM only Standard approach Primary PM only
Health only optimized Multi-effect optimization
Billion Euros/year
Case "A" Case "B" Case "C" MTFR

Sensitivity analysis 2A
Optimization for health targets only
0%
20%
40%
60%
80%
100%
"Prim
ary
PM
only
"
Sta
ndar
dap
proa
ch
"Prim
ary
PM
only
"
Sta
ndar
dap
proa
ch
"Prim
ary
PM
only
"
Sta
ndar
dap
proa
ch
"Prim
ary
PM
only
"
Sta
ndar
dap
proa
ch
"Prim
ary
PM
only
"
Sta
ndar
dap
proa
ch
SO2 NOx VOC NH3 PM2.5
% of 2000 emissions
Grey range: CLE - MTFR Case "A" Case "B" Case "C"

Sensitivity analysis 2B
Joint optimization for all targets
0%
20%
40%
60%
80%
100%
"Prim
ary
PM
only
"
Sta
ndar
dap
proa
ch
"Prim
ary
PM
only
"
Sta
ndar
dap
proa
ch
"Prim
ary
PM
only
"
Sta
ndar
dap
proa
ch
"Prim
ary
PM
only
"
Sta
ndar
dap
proa
ch
"Prim
ary
PM
only
"
Sta
ndar
dap
proa
ch
SO2 NOx VOC NH3 PM2.5
% of 2000 emissions
Gray range: CLE - MTFR Case "A" Case "B" Case "C"

Sensitivity analysis 3
How robust are optimized emission reductions against alternative assumptions on economic/energy/agricultural development?
40%
60%
80%
100%
120%
140%
Belgium Denmark Finland France Italy Portugal Sweden UK CzechRepublic
Slovenia
With climate measures No further climate measures National projection
• National energy and agricultural projections are available for 10 countries
• However, these do not comply with Kyoto obligations
Sensitivity analysis 3
National energy and agricultural projections
• Two aspects:– How would optimization results (“emission ceilings”)
change based on the national projections?– What about the feasibility/costs of emission ceilings, if
the underlying baseline projection does not materialize?
• Approach:– Joint optimization with national projections for same
target setting rules (gap closures and relative YOLL improvement recalculated for new space between CLE and MTFR)
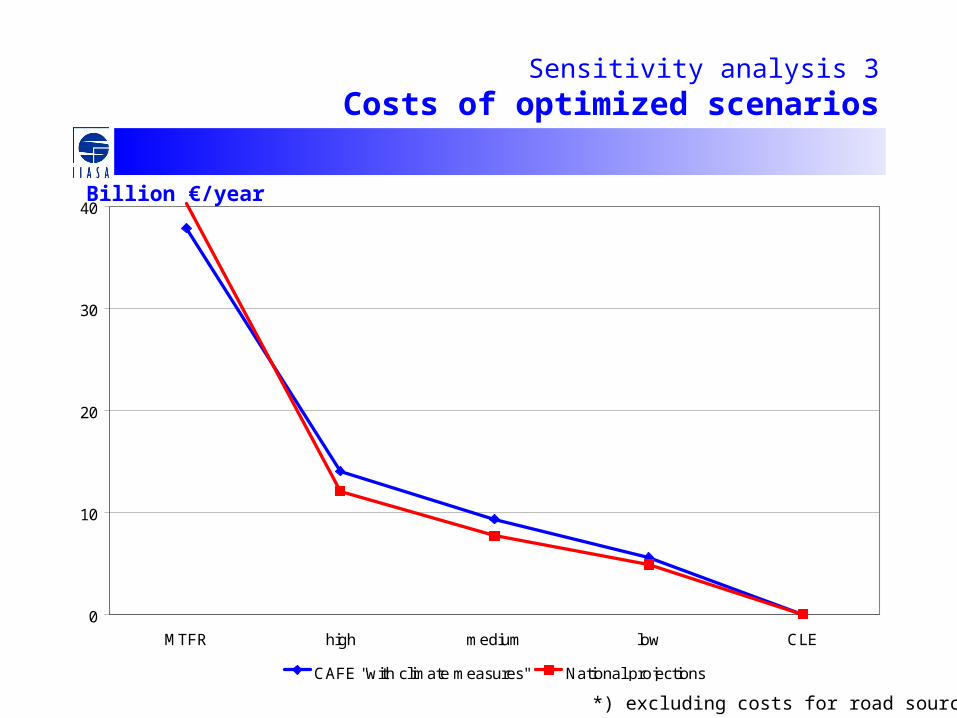
Sensitivity analysis 3
Costs of optimized scenarios
0
10
20
30
40
MTFR high medium low CLE
CAFE "with climate measures" National projections
Billion €/year
*) excluding costs for road sources

Sensitivity analysis 3
SO2 emissions
0%
20%
40%
60%
80%
100%
120%
Au
stri
a
Be
lgiu
m
Cyp
rus
Cze
ch R
ep
.
De
nm
ark
Est
on
ia
Fin
lan
d
Fra
nce
Ge
rma
ny
Gre
ece
Hu
ng
ary
Ire
lan
d
Ita
ly
La
tvia
Lith
ua
nia
Lu
xem
bo
urg
Ma
lta
Ne
the
rla
nd
s
Po
lan
d
Po
rtu
ga
l
Slo
vaki
a
Slo
ven
ia
Sp
ain
Sw
ed
en
UK
EU
-25
% of emissions in 2000
PRIMES projections Case "A" Case "B" Case "C"
National projections Case "A" Case "B" Case "C"
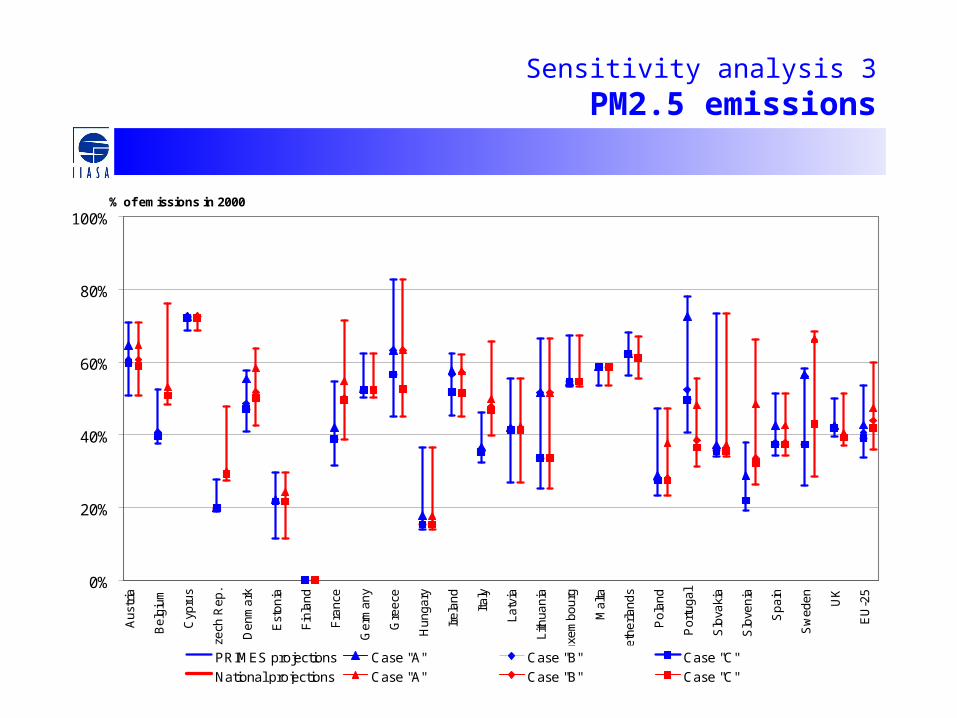
Sensitivity analysis 3
PM2.5 emissions
0%
20%
40%
60%
80%
100%
Au
stri
a
Be
lgiu
m
Cyp
rus
Cze
ch R
ep
.
De
nm
ark
Est
on
ia
Fin
lan
d
Fra
nce
Ge
rma
ny
Gre
ece
Hu
ng
ary
Ire
lan
d
Ita
ly
La
tvia
Lith
ua
nia
Lu
xem
bo
urg
Ma
lta
Ne
the
rla
nd
s
Po
lan
d
Po
rtu
ga
l
Slo
vaki
a
Slo
ven
ia
Sp
ain
Sw
ed
en
UK
EU
-25
% of emissions in 2000
PRIMES projections Case "A" Case "B" Case "C"
National projections Case "A" Case "B" Case "C"

Sensitivity analysis 4
Are there potential biases in the results for the agricultural sector?
• Uncertainties in agricultural projections• Potential implications of the CAP reform• Implications of the IPPC Directive• Implications of the Nitrate Directive• Recent information on emission control measures

Sensitivity analysis 4
Implications on compliance costs
Annual costs in 2020
Lower estimate Higher estimate
billion €/yr % billion €/yr %
Original estimate of the compliance costs to reach “Case B” targets
3.77 3.77
CAP reform -0.46 -12% -0.46 -12%
Implementation of the IPPC directive -0.60 -16% -0.85 -23%
Updated cost information on manure management
-0.60 -16% -0.60 -16%
Sub-total cost reduction -1.66 -44% -1.91 -51%
Compliance costs for Case “B” taking into account all uncertainties
2.11 1.86

Sensitivity analysis 5
How would cost-optimal emission reductions change if no further measures were taken for road emissions (i.e., no Euro-5 and Euro-6 for diesel vehicles)?
Approach:• Optimization for same environmental targets without the further measures
for road emissions
Results:• Environmental improvements of Cases B and C cannot be achieved without
further road measures

Sensitivity analysis 5
Costs for achieving the Case “A” targets
0
1000
2000
3000
4000
5000
6000
7000
With further road measures Sensitivity case without further road measures
Billion Euros/year
Power plants Industry DomesticRoad transport Inland shipping Conversion and waste treatmentAgriculture (Cases “B” and “C” cannot be achieved without road measures)
Sensitivity analysis 6
How would further NOx controls for ships change the optimal emission reductions for land-based sources?
Measures contained in baseline:• EU sulfur proposal as in Common Position (1.5% S in North
Sea, Baltic and EU seas, 0.1% in harbors, new MARPOL NOx standards, state-of-art for new ships)
Approach:• Optimization for same environmental targets with further
measures for ships • Assumed additional measure: Slide valve retrofits for low
speed engines (28 million €/year)

Sensitivity analysis 6
Control costs with NOx measures for ships
CAFE scenario
without ship measures
Sensitivity case with “medium ambition” measures for ships
Costs for land-based
sources
Costs for land-based
sources
Costs for ships
Total costs
Cost difference
Case “A” 5923 5783 28 5811 -112
Case “B” 10679 10492 28 10520 -159
Case “C” 14852 14499 28 14527 -325
Conclusions
• Multi-effect optimization increases robustness against uncertainties in health impact mechanisms
• CAFE policy scenarios are driven by health and ecosystems targets
• Optimized emission reductions are sensitive against future levels of coal use. Robustness against national energy projections needs further attention (and more robust national projections!)
• Costs for the agricultural sector are most likely overestimated
• Substituting control of road emissions with further measures from stationary sources is not cost-effective
• Control of marine ship emissions is cost-effective


