*e-mail: [email protected]Recebido: 15/11/2010 / Aceito: 02/07/2011 Sensitivity improvement of GMI magnetic and pressure transducers for biomedical measurements Eduardo Costa da Silva, Luiz Antônio Pereira de Gusmão, Carlos Roberto Hall Barbosa, Elisabeth Costa Monteiro*, Fernando Luiz de Araújo Machado Abstract This work presents an experimental study aiming the sensitivity optimization of Giant Magnetoimpedance (GMI) sensors, by means of properly choosing the values of their conditioning parameters. The optimized GMI sensors, together with the development of improved transduction electronic circuits, can lead to the sensitivity enhancement of GMI biomedical, pressure and magnetic transducer prototypes, previously developed by the research group at LaBioMet, PUC-Rio. Those prototypes are, respectively, aimed at the measurement of arterial pulse waves and the localization of magnetic foreign bodies inserted in the human body. Thus, the experimental characterization of GMI ribbon-shaped samples (Co 70 Fe 5 Si 15 B 10 ) was performed, as a function of the external magnetic field, including the experimental evaluation of the asymmetric GMI effect (AGMI). The parameters that affect the behavior of the GMI samples were experimentally analyzed, such as the DC level (0 mA to 100 mA) and frequency (100 kHz to 10 MHz) of the excitation current, as well as the samples length (1 cm, 3 cm, 5 cm and 15 cm). The conditioning parameters, experimentally identified, that optimize the GMI samples sensitivity lead to a maximum specific sensitivity of 0.84 W·Oe –1 ·cm –1 (8400 Ω ·T –1 ·cm –1 ). A new electronic circuit was developed for conditioning and reading of the GMI samples, which directly contributed to the performance enhancement of both transducers. The electronic circuits developed were evaluated supposing the operation of the GMI samples in their most sensitive region. Comparing to previously developed prototypes, the optimum sensitivity achieved for the new configuration of the GMI magnetic transducer increased about 9 times (from 0.12 mV/nT to 1.08 mV/nT), and the sensitivity of the modified pressure transducer increased approximately 7 times (from 1 mV/Pa to 7 mV/Pa). Keywords Metrology, Giant magnetoimpedance, Sensor, Transducer, Biomedical engineering, Biometrology. Aumento da sensibilidade de transdutores GMI de campo magnético e pressão para medições biomédicas Resumo Este trabalho apresenta um estudo experimental objetivando a otimização da sensibilidade de sensores GMI (Magnetoimpedância Gigante), por meio da escolha adequada dos valores de seus parâmetros de condicionamento. A otimização do condicionamento dos sensores GMI e o aperfeiçoamento dos circuitos eletrônicos utilizados resultaram em aumento na sensibilidade dos protótipos de transdutores biomédicos GMI, de pressão e magnético, anteriormente desenvolvidos pelo grupo de pesquisa do LaBioMet, PUC- Rio. Estes protótipos são, respectivamente, destinados à medição da onda de pulso arterial e à localização de corpos estranhos magnéticos inseridos no corpo humano. Realizou-se a caracterização experimental de amostras GMI (Co 70 Fe 5 Si 15 B 10 ) em forma de fita, em função do campo magnético externo, incluindo a avaliação experimental do efeito GMI assimétrico (AGMI). Os parâmetros que afetam o comportamento das amostras GMI foram experimentalmente analisados, tais como o nível CC (0 mA a 100 mA) e frequência (100 kHz a 10 MHz) da corrente de excitação, assim como a dependência em relação ao comprimento das amostras (1 cm, 3 cm, 5 cm e 15 cm). Os parâmetros de condicionamento, experimentalmente identificados, que otimizam a sensibilidade das amostras GMI, determinaram uma sensibilidade específica máxima de 0,84 W·Oe –1 ·cm –1 (8400 Ω ·T –1 ·cm –1 ). Um novo circuito eletrônico foi desenvolvido para o condicionamento e leitura das amostras GMI, o qual contribuiu diretamente para a melhoria de desempenho de ambos os transdutores. O circuito eletrônico desenvolvido foi avaliado supondo a operação das amostras GMI em suas regiões de maior sensibilidade. Comparando os novos resultados com os obtidos com os protótipos anteriormente desenvolvidos, a sensibilidade ótima alcançada pela nova configuração do transdutor magnético GMI representou um aumento de cerca de 9 vezes (de 0,12 mV/NT para 1,08 mV/nT), e a sensibilidade do transdutor de pressão foi elevada em aproximadamente 7 vezes (de 1 mV/Pa para 7 mV/Pa). Palavras-chave Metrologia, Magnetoimpedância gigante, Sensor, Transdutor, Engenharia biomédica, Biometrologia. Artigo Original DOI: 10.4322/rbeb.2011.007 Volume 27, Número 2, p. 79-89, 2011
Sensitivity improvement of GMI magnetic and pressure transducers for biomedical measurements
Eduardo Costa da Silva, Luiz Antônio Pereira de Gusmão, Carlos Roberto Hall Barbosa, Elisabeth Costa Monteiro*, Fernando Luiz de Araújo Machado
Abstract This work presents an experimental study aiming the sensitivity optimization of Giant Magnetoimpedance (GMI) sensors, by means of properly choosing the values of their conditioning parameters. The optimized GMI sensors, together with the development of improved transduction electronic circuits, can lead to the sensitivity enhancement of GMI biomedical, pressure and magnetic transducer prototypes, previously developed by the research group at LaBioMet, PUC-Rio. Those prototypes are, respectively, aimed at the measurement of arterial pulse waves and the localization of magnetic foreign bodies inserted in the human body. Thus, the experimental characterization of GMI ribbon-shaped samples (Co70Fe5Si15B10) was performed, as a function of the external magnetic field, including the experimental evaluation of the asymmetric GMI effect (AGMI). The parameters that affect the behavior of the GMI samples were experimentally analyzed, such as the DC level (0 mA to 100 mA) and frequency (100 kHz to 10 MHz) of the excitation current, as well as the samples length (1 cm, 3 cm, 5 cm and 15 cm). The conditioning parameters, experimentally identified, that optimize the GMI samples sensitivity lead to a maximum specific sensitivity of 0.84 W·Oe–1·cm–1 (8400 Ω ·T–1·cm–1). A new electronic circuit was developed for conditioning and reading of the GMI samples, which directly contributed to the performance enhancement of both transducers. The electronic circuits developed were evaluated supposing the operation of the GMI samples in their most sensitive region. Comparing to previously developed prototypes, the optimum sensitivity achieved for the new configuration of the GMI magnetic transducer increased about 9 times (from 0.12 mV/nT to 1.08 mV/nT), and the sensitivity of the modified pressure transducer increased approximately 7 times (from 1 mV/Pa to 7 mV/Pa).Keywords Metrology, Giant magnetoimpedance, Sensor, Transducer, Biomedical engineering,
Biometrology.
Aumento da sensibilidade de transdutores GMI de campo magnético e pressão para medições biomédicas
Resumo Este trabalho apresenta um estudo experimental objetivando a otimização da sensibilidade de sensores GMI (Magnetoimpedância Gigante), por meio da escolha adequada dos valores de seus parâmetros de condicionamento. A otimização do condicionamento dos sensores GMI e o aperfeiçoamento dos circuitos eletrônicos utilizados resultaram em aumento na sensibilidade dos protótipos de transdutores biomédicos GMI, de pressão e magnético, anteriormente desenvolvidos pelo grupo de pesquisa do LaBioMet, PUC-Rio. Estes protótipos são, respectivamente, destinados à medição da onda de pulso arterial e à localização de corpos estranhos magnéticos inseridos no corpo humano. Realizou-se a caracterização experimental de amostras GMI (Co70Fe5Si15B10) em forma de fita, em função do campo magnético externo, incluindo a avaliação experimental do efeito GMI assimétrico (AGMI). Os parâmetros que afetam o comportamento das amostras GMI foram experimentalmente analisados, tais como o nível CC (0 mA a 100 mA) e frequência (100 kHz a 10 MHz) da corrente de excitação, assim como a dependência em relação ao comprimento das amostras (1 cm, 3 cm, 5 cm e 15 cm). Os parâmetros de condicionamento, experimentalmente identificados, que otimizam a sensibilidade das amostras GMI, determinaram uma sensibilidade específica máxima de 0,84 W·Oe–1·cm–1 (8400 Ω ·T–1·cm–1). Um novo circuito eletrônico foi desenvolvido para o condicionamento e leitura das amostras GMI, o qual contribuiu diretamente para a melhoria de desempenho de ambos os transdutores. O circuito eletrônico desenvolvido foi avaliado supondo a operação das amostras GMI em suas regiões de maior sensibilidade. Comparando os novos resultados com os obtidos com os protótipos anteriormente desenvolvidos, a sensibilidade ótima alcançada pela nova configuração do transdutor magnético GMI representou um aumento de cerca de 9 vezes (de 0,12 mV/NT para 1,08 mV/nT), e a sensibilidade do transdutor de pressão foi elevada em aproximadamente 7 vezes (de 1 mV/Pa para 7 mV/Pa).Palavras-chave Metrologia, Magnetoimpedância gigante, Sensor, Transdutor, Engenharia biomédica,
Biometrologia.
Artigo OriginalDOI: 10.4322/rbeb.2011.007Volume 27, Número 2, p. 79-89, 2011
IntroductionThe Laboratory of Biometrology (LaBioMet) of PUC-Rio has been working on the development of magnetic and pressure transducers based on the Giant Magnetoimpedance effect (GMI), aimed at biomedical applications (Cavalcanti et al., 2005, 2006; Louzada et al., 2006, 2007; Monteiro, 2007; Pompéia et al., 2008; Silva et al., 2009a,b). The GMI samples used as sensor elements were supplied by a scientific collaboration with the Physics Department of Federal University of Pernambuco (UFPE). All these developments concerning biomedical measurement systems have been performed in compliance with the fundamental principles of biometrology (Monteiro, 2007), that requires the biomeasurement innovation researches to implement their efforts to incorporate the characteristics of non-invasiveness, innocuity, high accuracy, low-cost of fabrication and operation, and also low-complexity for operation.
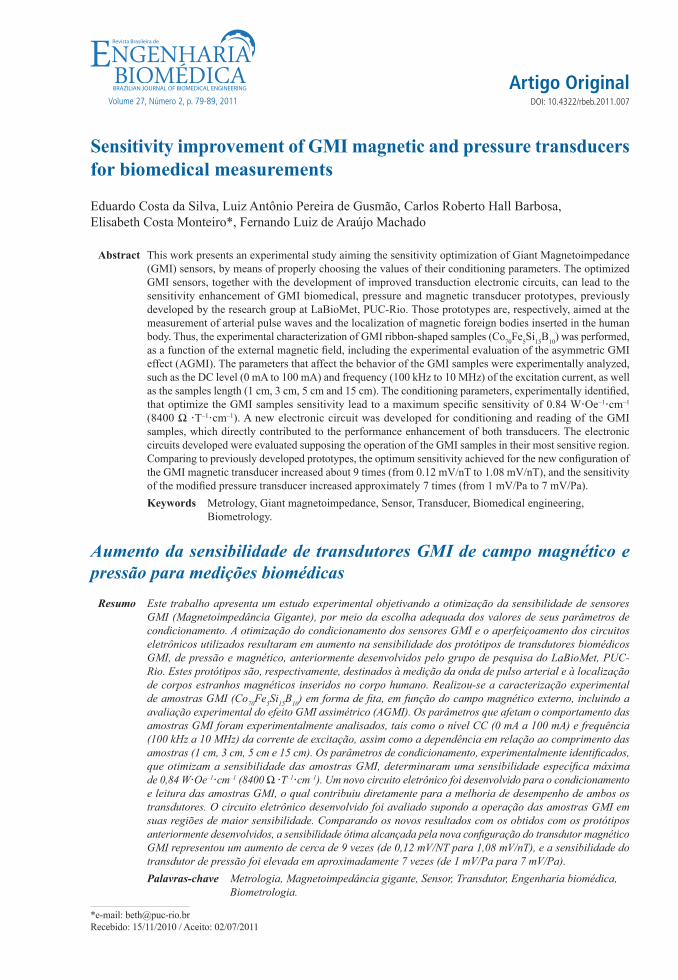
The GMI transducers previously developed at LaBioMet consist of a magnetic field detector for localization of magnetic foreign bodies inserted in the human body (Cavalcanti et al., 2005, 2006; Pompéia et al., 2008), with a sensitivity of 0.12 mV/nT (using two GMI ribbons of 15 cm each); and a pressure transducer for arterial pulse waves measurement, with a sensitivity of 1 mV/Pa (using two GMI ribbons of 3 cm each) (Louzada et al., 2006, 2007). The prototype of the magnetic transducer and the magnetic field measured, as a function of the excitation current frequency, are shown in Figure 1. On the other hand, the prototype of the pressure transducer and the carotid arterial pulse wave measured are shown in Figure 2.
Although a good sensitivity has already been achieved with the previously developed GMI magnetic field transducer (Pompéia et al., 2008), which is better than that observed in Hall effect sensors and comparable to the sensitivity of fluxgate sensors, its main intended application is based on a technique that the LaBioMet group developed using the high-cost and most sensitive magnetometer, the SQUID (Superconducting Quantum Interference Device) (Monteiro et al., 2000). This technique has been successfully applied to six patients, in which hypodermic and sewing needles were located and removed in surgeries with 10 to 30 minutes of duration, thus reducing the surgery duration by a factor of five (Monteiro et al., 2000). Despite the success of the technique, the costs involved with SQUID fabrication and operation (mainly due to need of liquid Helium handling) make it prohibitive to be systematically applied on the whole healthcare community. Therefore, efforts to improve the sensitivity
Figure 1. GMI magnetometer a) partial ring shaped prototype with GMI ribbons fastened; b) complete prototype with the excitation coils; c) transducer output signal as a function of the magnetic field (H) for different frequencies of the current.
Rev. Bras. Eng. Biom., v. 27, n. 2, p. 79-89, jun., 2011Braz. J. Biom. Eng., 27(2), 79-89, June 2011Silva EC, Gusmão LP, Barbosa CRH, Monteiro EC, Machado FLA80
of a low-cost device as GMI magnetometers may allow the clinical introduction of this important non-invasive, innocuous and accurate pre-surgical foreign body localization diagnostic technique.
On the other hand, considering the fact that the pressure transducer previously developed in the LaBioMet uses the phenomenon of Giant Magnetoimpedance (GMI) as an intermediary block in the transduction process (Louzada et al., 2007), improvements on the GMI magnetometers sensitivity would also contribute to an evolution of this system for its intended biomedical applications on the arterial pulse wave recording and the measurement of the arterial pulse wave velocity.
In the present work, experimental and simulated studies were performed to increase the sensitivity and to reach better resolution values of these previously developed biomedical transducers based on the GMI effect. In order to maximize the sensitivity of GMI sensor elements, experimental measurements were performed to study the set of parameters that affect the GMI sensor elements sensitivities (frequency and amplitude of the AC excitation current, length of the
GMI ribbons and the polarization magnetic field). The influence of the asymmetric GMI effect (AGMI), induced by DC currents, in the behavior of the samples has also been analyzed. An electronic circuit was developed to excite the sensor elements and to read the variations of the impedance magnitude of the GMI samples. In this paper, the section “Methods” has two subsections, “GMI Sensors Characterization”, which describes the experimental procedures performed to analyze the behavior of the GMI samples as a function of the parameters of interest, and “Improved GMI biomedical transducers”, which describes the design of the developed GMI transducers and the methodology used to simulate the transducers behavior. The methodology applied to evaluate the uncertainties presented on the results is also explained throughout this section. The section “Results and Discussion” is also divided in two subsections, “GMI Sensors Characterization”, which presents the results related to the GMI sensors optimization and comments about the obtained results, and “Improved GMI biomedical transducers”, which presents the results concerning the sensitivity of the newly developed electronic
Figure 2. GMI pressure transducer a) opened prototype without the electronic circuit; b) complete prototype; c) the carotid arterial pulse signal obtained with the GMI transducer.
Rev. Bras. Eng. Biom., v. 27, n. 2, p. 79-89, jun., 2011Braz. J. Biom. Eng., 27(2), 79-89, June 2011 GMI transducers for biomedical measurements 81
circuits and calls attention to the increase on the sensitivity of the new GMI transducers. Finally, the “Conclusion” summarizes the main results and points out future trends.
GMI effectThe importance of GMI in the world’s scientific scenery has been increasing, and several laboratories are accomplishing promising results in several application areas. A recent example was the award of the 2007 Nobel Prize in Physics to the researchers Albert Fert and Peter Grünberg, who discovered the giant magneto-resistance, GMR (Fert, 2007; Grünberg, 2007). The Giant Magnetoimpedance effect started to be studied intensely in the 1990s. The first results obtained in such studies were interpreted as a variation of the Giant Magnetoresistance effect (GMR), whose experimental behavior is examined by the application of a continuous current in the presence of a continuous magnetic field. The GMR effect only considers the variation of the resistance, and the phenomenon is explained by the change in the motion of the electrons when their spin is affected by the orientation of a magnetization (Fert, 2007). However, experiments accomplished with samples of amorphous ferromagnetic alloys, using alternating current, have shown a variation of the resistive part as well as of the reactive part with respect both to the external magnetic field and to the frequency of the applied current. Hence, the name GMI.
In general, the impedance of a conductor depends on the distribution of the current inside the material. When the frequency increases, it is common for the current to concentrate in the surface of the conductor. In magnetic materials, the value of the current skin depth depends not only on the applied current amplitude and frequency value, but on the conductor geometry and on its magnetic permeability, which can vary with the magnetic field application. This implies that, in samples of high permeability materials, even with moderate frequencies, a variation of the conductors impedance with the value of the applied magnetic field can be expected (Gonçalves et al., 2006).
In the GMI effect, the alternating current applied along the sample length creates a transverse magnetic field (hac). This field magnetizes the material, increasing its permeability. The permeability grows until the external magnetic field (H) becomes sufficiently high to rotate the magnetic domains of the sample along its direction. The permeability dependence with the magnetic field and with the current modifies the skin depth of the current inside the material and, consequently, the impedance of the sample (Hauser et al., 2001; Knobel and Pirota, 2002;
Machado and Rezende, 1996; Mahdi et al., 2003; Pirota et al., 2002). Ribbons and wires of soft amorphous ferromagnetic alloys of the series Co75-xFexSi15B10, which present low magnetorestriction, exhibit the giant magnetoimpedance (GMI) phenomenon.
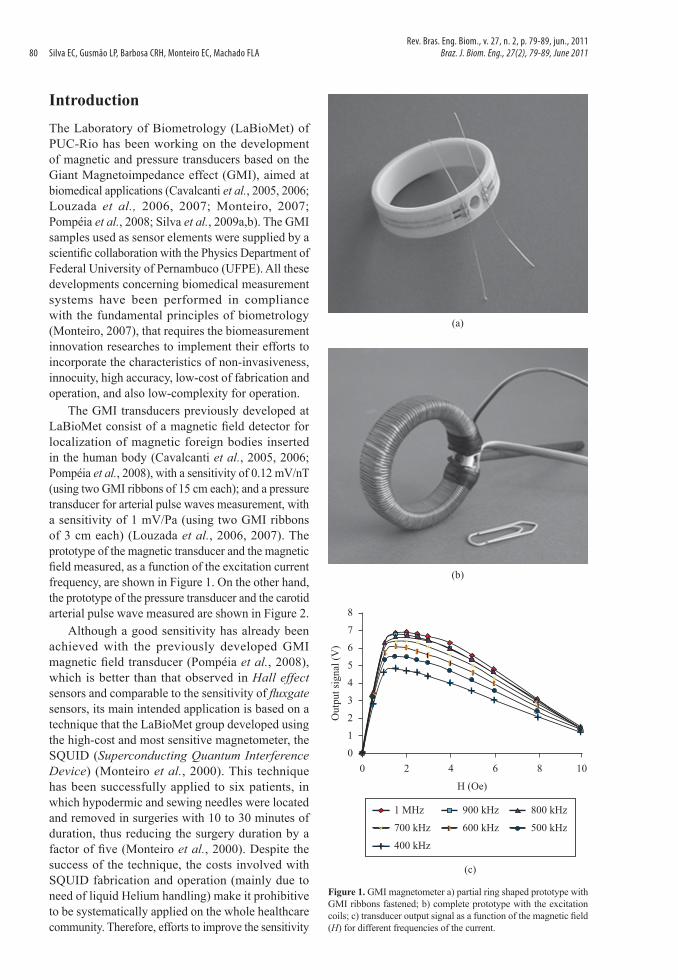
The present research focus on a particular case of GMI named Longitudinal Magnetoimpedance (LMI). The phenomenon of LMI is induced through the application of an alternating current (I) along the length of a ribbon (or wire), which is submitted to an external magnetic field (H) parallel to it. The potential difference (V) is then measured between the borders of the ribbon, as shown in Figure 3.
Using the phasorial description of the AC tension and current, as well as arbitrating the phase of the current (φI) as zero, the impedance of the sample can be calculated as
V
I
jj j
jV e V
Z e Z eII e
φφ φ
φ= = = (1)
Thus, the complex impedance Z of the GMI samples can be defined in terms of its two components, the real, related to the resistive part R, and the imaginary, related to the reactive part X.
Z R jX= + (2)
where
cos and sinR Z X Z= φ = φ (3)
As it was previously said, the GMI effect is actually a result of the skin depth (δ) dependency with the magnetic transversal permeability (mt), which varies not only with the external magnetic field that is applied to the sample, but also with the frequency and intensity of the current that passes through it. Then, generically, in agreement with the literature (Knobel and Pirota, 2002; Machado and Rezende, 1996), it can be defined as
-(1- ).2
1(1- )2
1-i t
LZ ie δ
=ωσδ (4)
and
Figure 3. Typical measurement of the GMI effect: the difference of potential (V) between the extremities of a GMI sample, submitted to an excitation current (I), as a function of the magnetic field (H).
Rev. Bras. Eng. Biom., v. 27, n. 2, p. 79-89, jun., 2011Braz. J. Biom. Eng., 27(2), 79-89, June 2011Silva EC, Gusmão LP, Barbosa CRH, Monteiro EC, Machado FLA82
12 t
c
δ = pωµ σ (5)
where L is the length and t is thickness of the ribbon, ω is the frequency of the current and σ is the conductivity of the material.
AGMI effectThe GMI curves, which indicate the variation of the impedance with the external magnetic field (H), are usually symmetrical in relation to this field. However, it has been noticed that certain conditions favor the emergence of an asymmetry in those curves, denominated Asymmetric Giant Magnetoimpedance, or AGMI effect, characterized by an increase of one of the peaks, or valleys, with a decrease of the other, in the |Z|xH curves. In spite of the fact that not all causes of AGMI are well known, three factors are highlighted in the literature: a) asymmetry due to DC current; b) asymmetry due to AC magnetic field and c) asymmetry due to “exchange bias” (Kim et al., 1999; Machado et al., 1999; Makhnovskiy et al., 2000).
As presented in the subsequent sections, on the present study the AGMI effect was induced by overlapping a DC biasing current to the alternating current (AC) used in the GMI measurements.
Methods
GMI sensors characterizationThe GMI ribbons were placed in the center of a Helmholtz Coil, as shown in Figure 4, in order to be excited by a magnetic field longitudinal to the direction of the current that flows through them. Also, the ribbon-coil set was positioned in a way to guarantee that the magnitude of the earth magnetic field was transversal to the ribbons, in order to minimize its influence in the measurements (the GMI ribbons used are of the LMI type, characterized by a very low sensitivity to transversal fields).
It should be noted that oersted (Oe) is a magnetic field unit, of the CGS System, widely used in papers related to GMI effect. However, the SI (International System of Units) unit of magnetic field is ampere per meter (A/m), which can be converted to oersteds using: 1 Oe ≈ 79.58 A/m. Besides that, in magnetism, the sensitivities are usually expressed in terms of the SI unit of magnetic flux density, tesla (T), which can be directly converted to oersteds knowing that, in vacuum, 1 Oe is numerically equal to 10–4 T.
The magnitude and phase readings were accomplished by an LCR meter (Agilent, 4285A), which was also responsible for both AC and DC
stimulation of the ribbons. The variation of the magnetic field generated by the Helmholtz Coil was controlled by a DC current source (ICEL, PS-4000), according to
308 9 10 [ ]5 5
NI NIH OeRR
−µ= ≈ × (6)
where H is the magnetic field in the center of the Helmholtz coils, N the number of coils, I the current that flows through the coils and R the radius of the coils.
The Helmholtz Coils have 48 coils and a radius of 15 cm, yielding
[ ] 2.877 [ ]H Oe I A= × (7)
It should be highlighted, as depicted in Figures 5 and 6, that negative field values (H) indicate that the current that flows through the ribbon has the same direction of the field generated by the Helmholtz Coil, and for positive field values the opposite occurs.
All the measurements were made in Co70Fe5Si15B10 ribbon-shaped alloys with an average thickness of 60 mm and an average width of 1.5 mm. It was observed that variations of the amplitude of the AC current, used to excite the analyzed GMI ribbons, around the value of 15 mA, did not affect the GMI behavior significantly. Thus, for all analysis herein presented that parameter was kept in 15 mA. Studies have been accomplished with the described GMI ribbon, analyzing the influence of the excitation current DC level (0 mA to 100 mA) and frequency (100 kHz to 10 MHz). Also, it has been investigated how the ribbon length (1 cm, 3 cm, 5 cm and 15 cm) affects the sensitivity and which is the best biasing magnetic field.
The impedance magnitude measurements of the GMI samples, analyzed during the characterization
Figure 4. Block diagram of the system used in the experimental characterization of the ribbon-shaped GMI samples. The LCR meter generates the excitation current that flows through the GMI samples and reads its impedance magnitude and phase. The Helmholtz pair generates a controllable DC magnetic field to excite the GMI samples. The samples length is oriented perpendicularly to the Earth magnetic field, aiming to minimize the influence of Hearth on the measurements.
Rev. Bras. Eng. Biom., v. 27, n. 2, p. 79-89, jun., 2011Braz. J. Biom. Eng., 27(2), 79-89, June 2011 GMI transducers for biomedical measurements 83
studies, were performed by the LCR meter 4285A, Agilent. The uncertainty of the impedance magnitude measurements of the samples, Uz, is directly attributed to the impedance magnitude uncertainty of the LCR meter, which is defined in its operational manual as
(%) ( )z n c tU A A K= ± + × (8)
where An is the component of the uncertainty due to the equipment intrinsic characteristics, Ac is the cable length factor and Kt is the temperature factor.
The temperature factor Kt is equal to one in the range of 18 °C to 28 °C. The measurements were always performed within this temperature range, then it can be admitted that Kt = 1. On the other hand, for impedance magnitudes below 5 kΩ, Ac is given by
(%)15
mc
fA = (9)
where fm is the frequency, in MHz, used to excite the sample.
Then, knowing that all of the experimental measurements of the impedance magnitudes of the GMI sensors returned values between 10 mΩ and 100 Ω, the parameter An is defined as
2
2(%) % 3%30
100 0.02% 0.1%30
mn
m
m
fA N
fZ
= + × +
+ ×
(10)
where |Zm| is the absolute value of the measured impedance in ohms and N2 is a frequency-dependent factor which can be equal to 0.15 (frequencies between 75 kHz and 3 MHz) or to 0.38 (frequencies above 3 MHz).
Supposing a Gaussian distribution, the standard uncertainty uz is
(%)( )
2m z
zZ U
u×
W = (11)
The standard uncertainty of the magnetic field (uH) generated by the Helmholtz pair is dependent of the
Figure 5. Impedance magnitude of a GMI ribbon in function of the external magnetic field. The bias current is [ 80 + 15 sin (2p·f·t) ] mA, where the frequencies (f) are shown in the figure. The frequency dependency is analyzed for four different lengths: a) 1 cm, b) 3 cm, c) 5 cm and d) 15 cm.
Rev. Bras. Eng. Biom., v. 27, n. 2, p. 79-89, jun., 2011Braz. J. Biom. Eng., 27(2), 79-89, June 2011Silva EC, Gusmão LP, Barbosa CRH, Monteiro EC, Machado FLA84
standard uncertainty of the DC current source, which is equal to ±3.25 mA. Then, supposing, by simplicity, that the geometric configuration of the Helmholtz Coils are satisfactorily close to the one considered on the theoretical model and knowing that the relation between the current and the magnetic field generated by the Helmholtz Pair is given by equation (7), uH is expressed as
( ) 2.877 ( ) 9.35H Iu Oe u A mOe= ± × ≅ ± (12)
Thus, the expanded uncertainty UH, for a confidence level of 95.45%, is
2 18.70H HU u mOe= × ≅ ± (13)
Finally, the length of the GMI samples was measured by a ruler with a resolution of 1 mm, and, assuming a rectangular distribution, the standard uncertainty of the GMI ribbons length uL can be defined as about 0.29 mm.
Improved GMI biomedical transducersIn order to simulate the behavior of the transducers, the GMI ribbons were electrically modeled. The
modeling approach consisted, basically, in applying to Equation 3 the data set experimentally obtained during the characterization of the GMI samples. Hence, all GMI ribbons were modeled as a resistive component in series with an inductance. Thus, the sensitivity of the GMI transducers (magnetic and pressure) – comprising the GMI ribbons and their respective electronic circuit – has been computationally evaluated by means of a SPICE program.
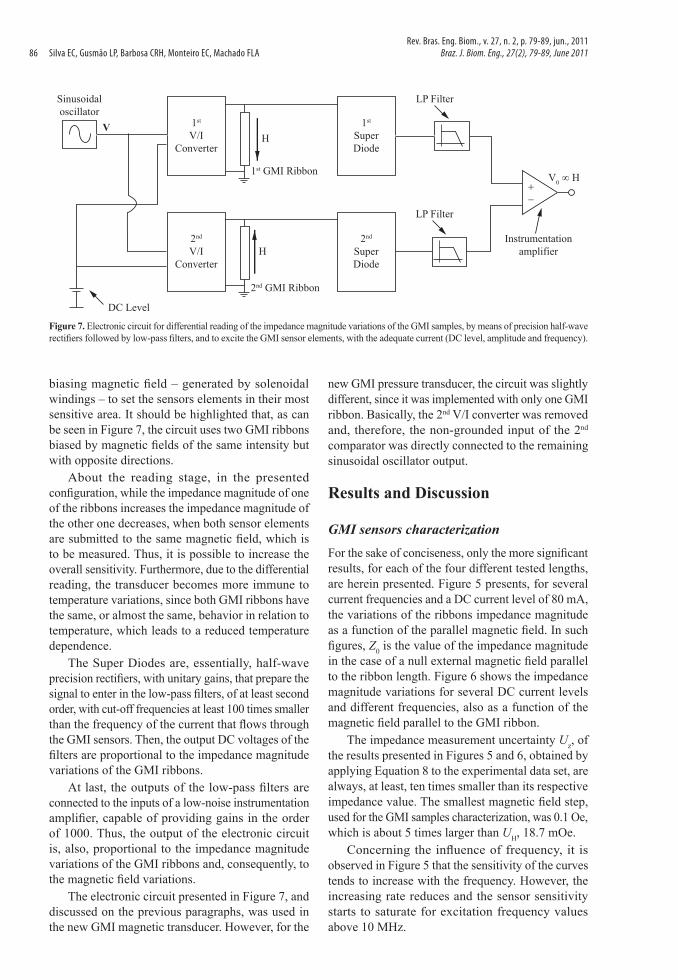
The developed electronic circuit is capable of reading the impedance magnitude variations of the sensor elements (ribbon-shaped GMI samples) and of delivering the proper biasing current, i.e., adjusting the amplitude, frequency and DC level of the current that flows through the GMI ribbons. This circuit is shown in Figure 7.
The sinusoidal oscillator generates a voltage signal with the adequate frequency, and the DC voltage level is produced by a voltage regulator. These DC and AC voltages are transformed in a current signal with the desired amplitude and DC level by means of the V/I converters.
Then, the generated current flows through the GMI ribbons, which are submitted to an external
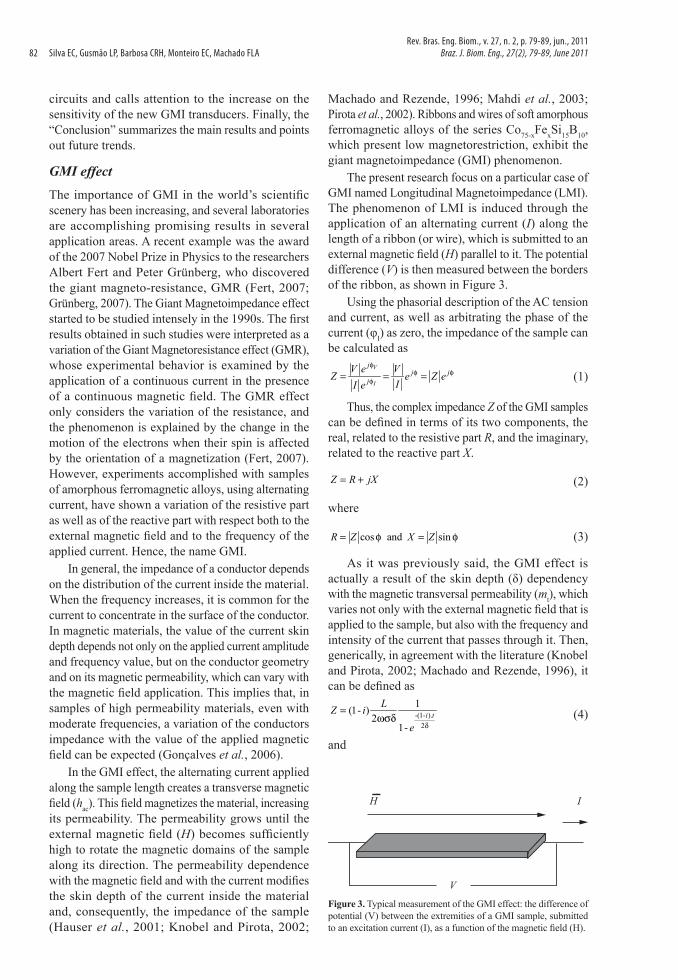
Figure 6. Impedance magnitude of a GMI ribbon in function of the external magnetic field. The bias current is [IDC + 15 sin (2p·f·t)] mA, where the DC current levels (IDC) are shown in the figure. The DC dependency is analyzed for four different lengths: a) 1 cm (f = 100 kHz), b) 3 cm (f = 5 MHz), c) 5 cm (f = 100 kHz) and d) 15 cm (f = 10 MHz).
Rev. Bras. Eng. Biom., v. 27, n. 2, p. 79-89, jun., 2011Braz. J. Biom. Eng., 27(2), 79-89, June 2011 GMI transducers for biomedical measurements 85
biasing magnetic field – generated by solenoidal windings – to set the sensors elements in their most sensitive area. It should be highlighted that, as can be seen in Figure 7, the circuit uses two GMI ribbons biased by magnetic fields of the same intensity but with opposite directions.
About the reading stage, in the presented configuration, while the impedance magnitude of one of the ribbons increases the impedance magnitude of the other one decreases, when both sensor elements are submitted to the same magnetic field, which is to be measured. Thus, it is possible to increase the overall sensitivity. Furthermore, due to the differential reading, the transducer becomes more immune to temperature variations, since both GMI ribbons have the same, or almost the same, behavior in relation to temperature, which leads to a reduced temperature dependence.
The Super Diodes are, essentially, half-wave precision rectifiers, with unitary gains, that prepare the signal to enter in the low-pass filters, of at least second order, with cut-off frequencies at least 100 times smaller than the frequency of the current that flows through the GMI sensors. Then, the output DC voltages of the filters are proportional to the impedance magnitude variations of the GMI ribbons.
At last, the outputs of the low-pass filters are connected to the inputs of a low-noise instrumentation amplifier, capable of providing gains in the order of 1000. Thus, the output of the electronic circuit is, also, proportional to the impedance magnitude variations of the GMI ribbons and, consequently, to the magnetic field variations.
The electronic circuit presented in Figure 7, and discussed on the previous paragraphs, was used in the new GMI magnetic transducer. However, for the
new GMI pressure transducer, the circuit was slightly different, since it was implemented with only one GMI ribbon. Basically, the 2nd V/I converter was removed and, therefore, the non-grounded input of the 2nd comparator was directly connected to the remaining sinusoidal oscillator output.
Results and Discussion
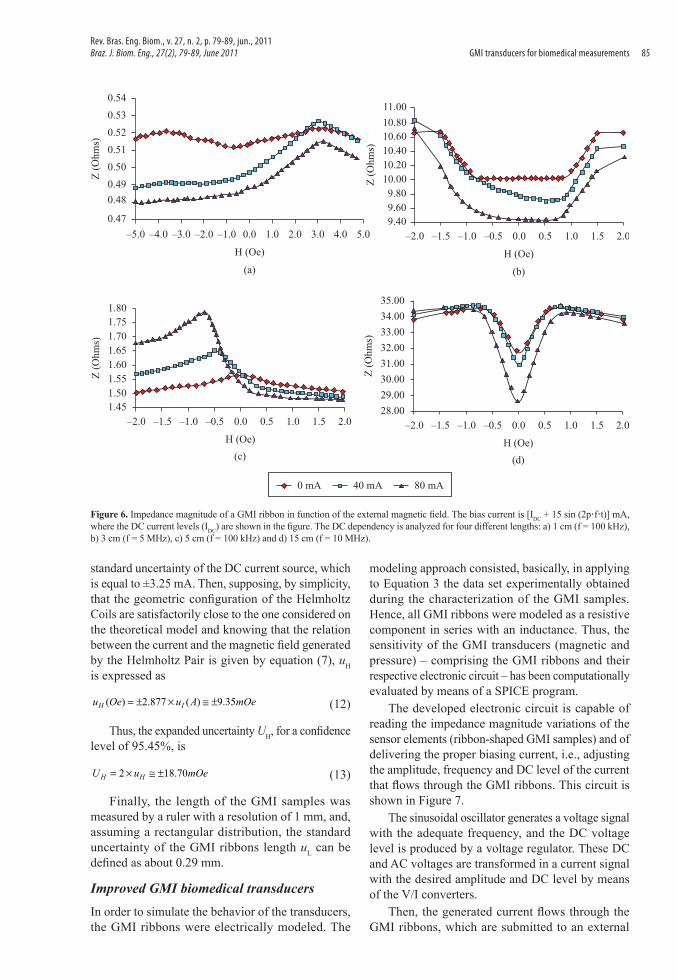
GMI sensors characterizationFor the sake of conciseness, only the more significant results, for each of the four different tested lengths, are herein presented. Figure 5 presents, for several current frequencies and a DC current level of 80 mA, the variations of the ribbons impedance magnitude as a function of the parallel magnetic field. In such figures, Z0 is the value of the impedance magnitude in the case of a null external magnetic field parallel to the ribbon length. Figure 6 shows the impedance magnitude variations for several DC current levels and different frequencies, also as a function of the magnetic field parallel to the GMI ribbon.
The impedance measurement uncertainty Uz, of the results presented in Figures 5 and 6, obtained by applying Equation 8 to the experimental data set, are always, at least, ten times smaller than its respective impedance value. The smallest magnetic field step, used for the GMI samples characterization, was 0.1 Oe, which is about 5 times larger than UH, 18.7 mOe.
Concerning the influence of frequency, it is observed in Figure 5 that the sensitivity of the curves tends to increase with the frequency. However, the increasing rate reduces and the sensor sensitivity starts to saturate for excitation frequency values above 10 MHz.
Figure 7. Electronic circuit for differential reading of the impedance magnitude variations of the GMI samples, by means of precision half-wave rectifiers followed by low-pass filters, and to excite the GMI sensor elements, with the adequate current (DC level, amplitude and frequency).
Rev. Bras. Eng. Biom., v. 27, n. 2, p. 79-89, jun., 2011Braz. J. Biom. Eng., 27(2), 79-89, June 2011Silva EC, Gusmão LP, Barbosa CRH, Monteiro EC, Machado FLA86
In Figure 6 it is observed that the addition of a DC level to the AC excitation current can increase the impedance magnitude sensitivity of the GMI samples, inducing the asymmetric giant magnetoimpedance (AGMI).
The length variation of the GMI ribbons affects, in a nonlinear way, the impedance magnitude dependence in function of the frequency, Figure 5, and the DC level, Figure 6, of the excitation current. It is observed that there is a length for which the specific sensitivity (sensitivity per unit of length) achieves its optimum value and, contrary to what might be expected, the optimum sensitivity does not occur in the longer analyzed length. The length measurements uncertainty UL, 0.5 mm, is 5% of the smallest length analyzed (1 cm).
The presented graphs (Figures 5 and 6) show that the magnitude characteristics are affected by all of the analyzed parameters: ribbon length, DC level and frequency. Table 1 presents the GMI ribbons maximum sensitivity, for each one of the tested lengths, and considering only their respective best conditioning parameter combination (i.e., the optimal applied current and the optimal biasing field). The higher specific sensitivity (0.84 W·Oe–1·cm–1, i.e. 8,400 W·T–1·cm–1) was achieved with the 5 cm ribbon.
The observed improvement in the sensitivity of the GMI effect sensor, with the increase of the frequency and DC level of the conditioning current, tends to saturate for values of DC current above 80 mA and for frequencies above 10 MHz. The sensitivity increases with the length of the samples, however the specific sensitivity of impedance magnitude does not necessarily improves with the increase of the ribbon length, since, among the analyzed lengths, the one for which the specific sensitivity has shown its maximum
value was 5 cm and not 15 cm. The AGMI effect, induced by DC currents, significantly altered the morphology of the GMI curves as a function of the magnetic field, being considered as a key conditioning factor in the improvement of the impedance magnitude sensitivity of the GMI sensors.
Improved GMI biomedical transducersThe results of the sensitivity comparison between the previous prototypes and the current ones are shown in Table 2.
The high impedance magnitude sensitivities obtained, associated with structural changes in the transducers configuration, allowed for the improvement of the sensitivities of both prototypes. the magnetic transducer for localization of needles inserted in the human body was increased by a factor of 9 (from 0.12 mV/nT to 1.08 mV/nT), by using 2 GMI ribbons of 15 cm each as sensor elements. On the other hand, the sensitivity of the pressure transducer for measurement of arterial pulse waves was increased by a factor of 7 (from 1 mV/Pa to 7 mV/Pa), by using 1 GMI ribbon of 5 cm.
ConclusionsThis work presented an experimental study for optimization of conditioning parameters of GMI sensors and its implementation on GMI biomedical, pressure and magnetic, transducers prototypes previously developed in LaBioMet at PUC-Rio (Louzada et al., 2007; Pompéia et al., 2008).
In conclusion, by optimizing the impedance magnitude characteristics of GMI sensors and by developing better reading and conditioning electronic circuits, the present study allowed increasing the
Table 1. Optimal magnitude sensitivity by ribbon length.
Ribbon length(cm)
Applied current(mA)
Sensitivity(W·Oe–1)
Specific sensitivity(W·Oe–1·cm–1)
1 80 + 15 sin (2p10ΜHz t) 0.09 0.093 80 + 15 sin (2p10MHz t) 1.42 0.47 5 80 + 15 sin (2p10MHz t) 4.20 0.8415 80 + 15 sin (2p10MHz t) 11.59 0.77
ribbon length Magnetic transducer 0.12 mV/nT 30 cm 1.08 mV/nT 30 cmPressure transducer 1 mV/Pa 6 cm 7 mV/Pa 5 cm
Rev. Bras. Eng. Biom., v. 27, n. 2, p. 79-89, jun., 2011Braz. J. Biom. Eng., 27(2), 79-89, June 2011 GMI transducers for biomedical measurements 87
sensitivity (at least seven times) and reaching better resolution values in relation to previous developed magnetic field and pressure GMI transducer prototypes. The newly developed GMI magnetic transducer for localization of needles inserted in the human body achieved a sensitivity of 1.08 mV/nT, and the new GMI pressure transducer for measurement of arterial pulse waves achieved a sensitivity of 7 mV/Pa.
The research group at LaBioMet/PUC-Rio is presently working on studies aiming at further increasing the sensitivity of the GMI magnetic sensor by means of investigating the behavior of another GMI impedance component, its impedance phase, which has not yet been used or studied by other research groups (Silva et al., 2011). The GMI transducers implementations, until now described in the literature, are always based on the impedance magnitude component. The characterization procedures herein presented for the optimization of the impedance magnitude GMI component must also be accomplished in order to achieve optimally conditioned impedance phase of GMI sensor elements.
AcknowledgmentsWe would like to thank the Brazilian funding agencies CNPq, FAPERJ and FINEP for the support and supplied resources.
ReferencesCavalcanti FMP, Gusmão LAP, Barbosa CRH, Monteiro EC, Gonçalves LAP, Machado FLA. Characterization of a Magnetic Field Transducer based on the GMI Effect. In: IMEKO World Congress: Proceedings of the 18th IMEKO World Congress; 2006; Rio de Janeiro. Rio de Janeiro: Letra Capital; 2006. p. 1-4.
Cavalcanti FMP, Gusmão LAP, Barbosa CRH, Monteiro EC, Gonçalves LAP, Machado FLA. Development of a Low Intensity Magnetic Field Transducer for Biomedical Application based on the Giant Magnetoimpedance Effect. In: Joint International IMEKO TC1+TC7 Symposium: Proceedings of the 11th Joint International IMEKO TC1+TC7 Symposium; 2005; Ilmenau. Ilmenau, Germany, 2005. p. 1-4.
Fert A. The origin, development and future of spintronics. Nobel Lecture [Internet]. 2007 Dec [cited 2010 Dec 18]; 22 p. Available from: http://nobelprize.org/nobel_prizes/physics/laureates/2007/fert_lecture.pdf
Gonçalves LAP, Soares JM, Machado FLA, De Azevedo WM. GMI effect in the low magnetostrictive CoFeSiB alloys. Physica B. 2006; 384:152-54.
Grünberg P. From spinwaves to giant magneto magnetoresistence (GMR) and beyond. Nobel Lecture [Internet]. 2007 Dec [cited 2010 Dec 18]; 17 p. Available from: http://nobelprize.org/nobel_prizes/physics/laureates/2007/grunberg_lecture.pdf
Kim CG, Jang KJ, Kim HC, Yoon SS. Asymmetric giant magnetoimpedance in field-annealing Co-based amorphous ribbon. Journal of Applied Physics. 1999; 85:5447-49. http://dx.doi.org/10.1063/1.369971
Knobel V, Pirota KR. Giant magnetoimpedance concepts and recent progress. Journal of Magnetism and Magnetic Materials. 2002; 242:33-40. http://dx.doi.org/10.1016/S0304-8853(01)01180-5
Louzada DR, Barbosa CRH, Gusmão LAP, Cavalcanti FMP, Monteiro EC, Machado FLA. Desenvolvimento de transdutor de pressão de alta sensibilidade, baseado no fenômeno de magnetoimpedância gigante, para aplicação biomédica. In: Congresso Brasileiro de Engenharia Biomédica: Anais do 20º Congresso Brasileiro de Engenharia Biomédica; 2006; São Pedro, Brazil. Rio de Janeiro: Sociedade Brasileira de Engenharia Biomédica; 2006. p.1-4.
Louzada DR, Monteiro EC, Gusmão LAP, Barbosa CRH. Arterial pulse waves non-invasive measurement using a GMI pressure transducer. In: Latin American Congress on Biomedical Engineering: Proceedings of the 4th Latin American Congress on Biomedical Engineering; 2007; Isla Margarita, Venezuela. Berlin: Springer-Verlag; 2007. p. 1-4.
Machado FLA, Rezende SM. A theoretical model for the giant magnetoimpedance in ribbons of amorphous soft-ferromagnetic alloys. Journal of Applied Physics. 1996; 79:6958-60. http://dx.doi.org/10.1063/1.361945
Mahdi AE, Panina L, Mapps D. Some new horizons in magnetic sensing: high-Tc SQUIDs, GMR and GMI materials. Sensors Actuators A. 2003; 105(3):271-85. http://dx.doi.org/10.1016/S0924-4247(03)00106-7
Makhnovskiy DP, Panina LV, Mapps DJ. Asymmetric magnetoimpedance in as-cast CoFeSiB amorphous wires due to ac bias. Applied Physics Letters. 2000; 77:121-3. http://dx.doi.org/10.1063/1.126896
Monteiro EC, Barbosa CRH, Lima EA, Ribeiro PC, Boechat P. Locating steel needles in the human body using a SQUID magnetometer. Physics in Medicine and Biology. 2000; 45(8):2389-402. http://dx.doi.org/10.1088/0031-9155/45/8/323
Monteiro, EC. Biometrologia: confiabilidade nas biomedições e repercussões éticas. Metrologia e Instrumentação. 2007; 6:6-12.
Pirota KR, Knobel M, Gomez-Polo C. Recent experiments and models on giant magnetoimpedance. Physica B. 2002; 320:127-34. http://dx.doi.org/10.1016/S0921-4526(02)00665-8
Pompéia F, Gusmão LAP, Barbosa CRH, Monteiro EC, Gonçalves LAP, Machado FLA. Ring shaped magnetic field transducer based on the GMI effect. Measurement
Rev. Bras. Eng. Biom., v. 27, n. 2, p. 79-89, jun., 2011Braz. J. Biom. Eng., 27(2), 79-89, June 2011Silva EC, Gusmão LP, Barbosa CRH, Monteiro EC, Machado FLA88
Silva EC, Gusmão LAP, Monteiro EC, Barbosa CRH. Characterization of the Magnitude Impedance of Ribbon-Shaped GMI Samples and their use in Transducers aimed at Biomedical Applications. In: International Conference on Advanced Materials: Proceedings of the 11th International Conference on Advanced Materials; 2009; Rio de Janeiro, Brazil. Rio de Janeiro: Sociedade Brasileira de Pesquisa em Materiais; 2009a. p. 1.
Silva EC, Gusmão LAP, Barbosa CRH, Monteiro EC. Método computacional automatizado de ajuste de curvas a dados experimentais. In: Congresso Brasileiro de Metrologia: Anais do 5º Congresso Brasileiro de Metrologia; 2009; Salvador, Brasil. Rio de Janeiro: Sociedade Brasileira de Metrologia; 2009b. p. 1-5.
Silva EC, Gusmão LAP, Barbosa CRH, Monteiro EC, Machado FLA. High sensitivity giant magnetoimpedance (GMI) magnetic transducer: magnitude versus phase sensing. Measurement Science & Technology. 2011; 22(3):1-9. http://dx.doi.org/10.1088/0957-0233/22/3/035204
Authors
Eduardo Costa da Silva, Carlos Roberto Hall Barbosa, Elisabeth Costa Monteiro Programa de Pós-graduação em Metrologia, Laboratório de Biometrologia – LaBioMet, Pontifícia Universidade Católica do Rio de Janeiro – PUC-Rio, Rua Marquês de São Vicente, 225, Gávea, CEP 22451-900, Rio de Janeiro, RJ, Brasil
Luiz Antônio Pereira de Gusmão Departamento de Engenharia Elétrica, Pontifícia Universidade Católica do Rio de Janeiro – PUC-Rio, Rua Marquês de São Vicente, 225, Gávea, CEP 22451-900, Rio de Janeiro, RJ, Brasil
Fernando Luiz de Araújo Machado Departamento de Física, Universidade Federal de Pernambuco – UFPE, Av. Prof. Moraes Rego, 1235, Cidade Universitária, CEP 50670-901, Recife, PE, Brasil
Rev. Bras. Eng. Biom., v. 27, n. 2, p. 79-89, jun., 2011Braz. J. Biom. Eng., 27(2), 79-89, June 2011 GMI transducers for biomedical measurements 89