ibm.com/redbooks Service Level Management Using IBM Tivoli Service Level Advisor and Tivoli Business Systems Manager Edson Manoel Kimberly Cox Eswara Kosaraju Matt Roseblade Alex Shafir Venkat Surath Eduardo Tanaka Brian Watson Integrate Tivoli Business Systems Manager and Tivoli Service Level Advisor Map business service management to service level management Achieve proactive service level management
Transcript
ibm.com/redbooks
Service Level Management Using IBM Tivoli Service Level Advisor and Tivoli Business Systems Manager
Edson ManoelKimberly Cox
Eswara KosarajuMatt Roseblade
Alex ShafirVenkat Surath
Eduardo TanakaBrian Watson
Integrate Tivoli Business Systems Manager and Tivoli Service Level Advisor
Map business service management to service level management
This edition applies to IBM Tivoli Business Systems Manager V3.1, IBM Tivoli Service Level Advisor V2.1, IBM Tivoli Enterprise Console V3.9, and IBM Tivoli Monitoring for Transaction Performance V5.3 products.
Note: Before using this information and the product it supports, read the information in “Notices” on page ix.
Note: This book is based on a pre-GA version of a product and may not apply when the product becomes generally available. We recommend that you consult the product documentation or follow-on versions of this redbook for more current information.
This information was developed for products and services offered in the U.S.A.
IBM may not offer the products, services, or features discussed in this document in other countries. Consult your local IBM representative for information on the products and services currently available in your area. Any reference to an IBM product, program, or service is not intended to state or imply that only that IBM product, program, or service may be used. Any functionally equivalent product, program, or service that does not infringe any IBM intellectual property right may be used instead. However, it is the user's responsibility to evaluate and verify the operation of any non-IBM product, program, or service.
IBM may have patents or pending patent applications covering subject matter described in this document. The furnishing of this document does not give you any license to these patents. You can send license inquiries, in writing, to: IBM Director of Licensing, IBM Corporation, North Castle Drive Armonk, NY 10504-1785 U.S.A.
The following paragraph does not apply to the United Kingdom or any other country where such provisions are inconsistent with local law: INTERNATIONAL BUSINESS MACHINES CORPORATION PROVIDES THIS PUBLICATION "AS IS" WITHOUT WARRANTY OF ANY KIND, EITHER EXPRESS OR IMPLIED, INCLUDING, BUT NOT LIMITED TO, THE IMPLIED WARRANTIES OF NON-INFRINGEMENT, MERCHANTABILITY OR FITNESS FOR A PARTICULAR PURPOSE. Some states do not allow disclaimer of express or implied warranties in certain transactions, therefore, this statement may not apply to you.
This information could include technical inaccuracies or typographical errors. Changes are periodically made to the information herein; these changes will be incorporated in new editions of the publication. IBM may make improvements and/or changes in the product(s) and/or the program(s) described in this publication at any time without notice.
Any references in this information to non-IBM Web sites are provided for convenience only and do not in any manner serve as an endorsement of those Web sites. The materials at those Web sites are not part of the materials for this IBM product and use of those Web sites is at your own risk.
IBM may use or distribute any of the information you supply in any way it believes appropriate without incurring any obligation to you.
Information concerning non-IBM products was obtained from the suppliers of those products, their published announcements or other publicly available sources. IBM has not tested those products and cannot confirm the accuracy of performance, compatibility or any other claims related to non-IBM products. Questions on the capabilities of non-IBM products should be addressed to the suppliers of those products.
This information contains examples of data and reports used in daily business operations. To illustrate them as completely as possible, the examples include the names of individuals, companies, brands, and products. All of these names are fictitious and any similarity to the names and addresses used by an actual business enterprise is entirely coincidental.
COPYRIGHT LICENSE: This information contains sample application programs in source language, which illustrates programming techniques on various operating platforms. You may copy, modify, and distribute these sample programs in any form without payment to IBM, for the purposes of developing, using, marketing or distributing application programs conforming to the application programming interface for the operating platform for which the sample programs are written. These examples have not been thoroughly tested under all conditions. IBM, therefore, cannot guarantee or imply reliability, serviceability, or function of these programs. You may copy, modify, and distribute these sample programs in any form without payment to IBM for the purposes of developing, using, marketing, or distributing application programs conforming to IBM's application programming interfaces.
The following terms are trademarks of other companies:
Java and all Java-based trademarks and logos are trademarks or registered trademarks of Sun Microsystems, Inc. in the United States, other countries, or both.
Microsoft, Windows, Windows NT, and the Windows logo are trademarks of Microsoft Corporation in the United States, other countries, or both.
Intel, Intel Inside (logos), MMX, and Pentium are trademarks of Intel Corporation in the United States, other countries, or both.
UNIX is a registered trademark of The Open Group in the United States and other countries.
Linux is a trademark of Linus Torvalds in the United States, other countries, or both.
Other company, product, and service names may be trademarks or service marks of others
Peregrine ServiceCenter is a trademark of Peregrine.
x Service Level Management
Preface
Traditional availability management focuses on managing the state of IT resources at a component level, without the context of the required service necessary to support vital business functions. As IT organizations mature and focus more on meeting business objectives, they recognize the value of providing sustained levels of availability. They also improve service quality that is consistent with business objectives and cost constraints.
Managing IT costs requires repeatable and measurable processes such as the best practices for service level management (SLM) documented in the IT Infrastructure Library (ITIL). Central to the ITIL best practices are the service management processes. These are subdivided into the core areas of service support (day-to-day operation and support) and service delivery (long-term planning and improvement).
This IBM® Redbook takes a top-down approach that starts from the business requirement to improve service management. This includes the need to align IT services with the needs of the business, to improve the quality of the IT services delivered, and to reduce the long-term cost of service provision. It focuses on how clients accomplish this by implementing SLM processes supported by IBM Tivoli Service Level Advisor and IBM Tivoli Business Systems Manager. The approach used in this book leverages Tivoli® and non-Tivoli monitoring sources. IBM Tivoli Monitoring for Transaction Performance, IBM Tivoli Monitoring, and various IBM Tivoli Monitoring PACS, along with Peregrine ServiceCenter, serve as interface points to provide the end-user perspective of service delivery.
For IT managers and technical staff who are responsible for providing services to their customers, use this IBM Redbook as a practical guide to SLM with IBM Tivoli products. It takes you from a general outline of SLM to specific implementation examples of banking and trading that incorporate the Tivoli monitoring products.
The key elements that are addressed in this redbook are:
� Organizational considerations for implementing the ITIL processes
� Identifying which services or business functions will be used for the initial deployment
� Determining the metrics and monitoring sources required for operational and service level agreements (SLA) definition and evaluation, including business schedules and maintenance periods
� Leveraging IBM Tivoli Business Systems Manager for configuration and availability management of services
� Peregrine ServiceCenter for service desk in a component-level for SLA, as well as managing service incidents in real-time
� The value of understanding the impact of end-user response time on service delivery
� Managing end-to-end services that include mainframe and distributed components
� Improving service delivery with proactive service management using predictive analysis and operational status alerts
� Providing ongoing executive-level status, and on-demand reporting
� The next steps for expanding the deployment using the ITIL continuous improvement process approach
� Overall business value attained through the implementation of these processes and tools
The team that wrote this redbookThis redbook was produced by a team of specialists from around the world working at the International Technical Support Organization (ITSO), Austin Center.
Edson Manoel is a software engineer at IBM working in the ITSO, Austin Center, as a Senior IT Specialist in the systems management area. Prior to joining the ITSO, Edson worked in the IBM Software Group, Tivoli Systems, and in IBM Brazil Global Services Organization. He was involved in numerous projects in designing and implementing systems management solutions for IBM Clients and Business Partners. Edson holds a Bachelor of Science degree in applied mathematics from Universidade de Sao Paulo, Brazil.
Kimberly Cox is an IBM Certified IT Specialist with IBM Software Services for Tivoli. She joined IBM in 1998. She has six years of field experience and her current area of expertise is the architecture and deployment of IBM Tivoli Business Systems Manager/Distributed. She holds a master degree in computer science and engineering from Pennsylvania State University.
Eswara Kosaraju is an advisory software engineer for the IBM Tivoli Software Group in Research Triangle Park, North Carolina. He joined IBM in 1999. He holds a master degree in science and technology in engineering physics from Regional Engineering College, Warangal, India.
xii Service Level Management
Matt Roseblade is a services consultant with the PAN-EMEA Services for Tivoli Software based in the United Kingdom (UK). He has worked for IBM for nine years and has four years of experience in working with IBM Tivoli Business Systems Manager on engagements throughout Europe. Prior to working for IBM Software Group, Matt worked for IGS SSO leading a team responsible for the systems management of IBM and outsourced z/OS® systems across EMEA. During his 14 years in IT, Matt has acquired 12 years experience in system management disciplines on the mainframe.
Alex Shafir is an advisory software engineer with the IBM Tivoli Software Group in Research Triangle Park, North Carolina. He has been working with IBM Tivoli Business Systems Manager since 1997 and joined IBM in 2000. He has over 30 years of IT experience in both technical and management positions. He has been involved in SLM, capacity planning, and performance management since 1984. He holds master degree in electrical engineering from Polytechnical Institute, Riga, Latvia.
Venkat Surath is a senior IT specialist, as well as an IBM Certified IT Specialist, and part of IBM Software Services for Tivoli Americas. He holds a master degree in computer science from Illinois Institute of Technology, Chicago. Upon graduation, he joined Communications Products Division, IBM Research Triangle Park, NC in 1983 as a software engineer developing network management software. In 1997, he joined Tivoli Services North America and provides Tivoli Business Systems Management services. His areas of expertise include IBM Tivoli Business Systems Manager (Distributed) and Tivoli Monitoring for Transaction Performance.
Eduardo Tanaka is a software engineer for the IBM Software Group, Tivoli Division in Research Triangle Park, North Carolina. He worked nine years in UNIX® server hardware and software development and management for a Brazilian company. Then, in 1990, he joined IBM where he served as the development, function and system test team leader for various system and network management products. He holds a degree in electronic engineering from the Instituto Tecnologico de Aeronautica in Brazil.
Brian Watson is a consulting IT specialist from Tivoli Services, EMEA North Region, IBM Software Group. He has worked for IBM for over three years, has over 25 years of IT experience in both public and private sectors, and specializes in systems management. He was one of the first people to be ITIL certified in 1995, and has successfully completed many large and complex systems management projects including implementations of IBM Tivoli Business Systems Manager.
Preface xiii
Front row (left to right): Matt Roseblade, Kimberly Cox, and Venkat Surath; back row: Edson Manoel, Eswara Kosaraju, Eduardo Tanaka, Alex Shafir, and Brian Watson
Thanks to the following people for their contributions to this project:
Peer van Beljouw Ruth van OuwerkerkABN AMRO Bank, Netherlands
Budi Darmawan Morten MoellerITSO, Austin Center
Rosalind RadcliffeBSM Integration Architect, IBM Software Group, Raleigh
Eduardo PatrocinioTivoli SWAT Team, IBM Software Group, Raleigh
Jayne T. ReganService Level Advisor Development Manager, IBM Software Group, Raleigh
Michael D. TabronTivoli Service Level Advisor Interaction Designer, IBM Software Group, Raleigh
Joe BelnaShawn ClymerSubhayu ChatterjeeTSLA Development team, IBM Software Group, Raleigh
xiv Service Level Management
Gareth HollTSLA L2 Support, IBM Software Group, Raleigh
Tom OdefeyTBSM SVT Specialist, IBM Software Group, Raleigh
Tony BheITM SVT Specialist, IBM Software Group, Raleigh
Jon O. AustinJohn IrwinYoichiro IshiiTivoli Customer Programs, IBM Software Group, Raleigh
Become a published authorJoin us for a two- to six-week residency program! Help write an IBM Redbook dealing with specific products or solutions, while getting hands-on experience with leading-edge technologies. You'll team with IBM technical professionals, Business Partners and/or customers.
Your efforts will help increase product acceptance and customer satisfaction. As a bonus, you'll develop a network of contacts in IBM development labs, and increase your productivity and marketability.
Find out more about the residency program, browse the residency index, and apply online at:
Chapter 1. Introduction to service level management
This chapter introduces service level management (SLM). It also outlines an approach to the management of the business-oriented delivery of IT services that this book details in later chapters.
Refer to Appendix A, “Service management and the ITIL” on page 447, for details about the organization and activities of SLM and the contributing IT management disciplines.
1.1 Service level management overviewThe goal of maximizing profits drives change as well as innovation. It often involves the use of IT to gain a competitive advantage in selling a company’s products and services. To achieve their goals, business units partner with an IT organization to implement technology projects and thus become IT customers.
Accordingly, IT organizations are hired by business units to provide technology services. Therefore, they must meet their requirements for those services. In today’s cost-conscious environment, IT organizations are under pressure to reduce costs even as they must deliver a higher level of service to increasingly well informed users.
Why service level management?For this reason, customer perception of the availability and performance of these services drives customer satisfaction. As a service provider, an IT organization must be able to demonstrate and guarantee quality of service to its customers.
However, IT management has often struggled to measure delivered services while reconciling such measurements with the perceived quality of this delivery. To solve this problem, IT organizations are deploying SLM that includes contracts between IT and its clients that specify the client expectations, IT’s responsibilities, and the compensation that IT will provide if the goals are not met.
The main factors for driving interest to SLM are:
� Complexity: A dramatic increase in the number of applications, their importance, and demand on IT infrastructure
� Dissatisfaction: Increasing user sophistication and growing dissatisfaction among users with service that they receive from IT
� Better technology: More mature technology that can provide end-to-end measurement, reporting, and management at a reasonable cost and offer more simple process
What is service level management?SLM is a means for the lines of business (LOB) and IT organization to explicitly set their mutual expectations for the content and extent of IT services. It also allows them to determine in advance the steps to take if these conditions are not met. The concept and application of SLM allows IT organizations to provide a business-oriented, enterprise-wide service by varying the type, cost, and level of service for the individual LOB.
4 Service Level Management
According to the highly popular, process-based methodology IT Infrastructure Library (ITIL), SLM is the process of negotiating, documenting, agreeing and reviewing business service requirements and targets, within service level requirements and agreements between service providers and their customers. These relate to the measurement, monitoring, reporting, reviewing, and continuous improvement of service quality as delivered by the IT organization to the business.
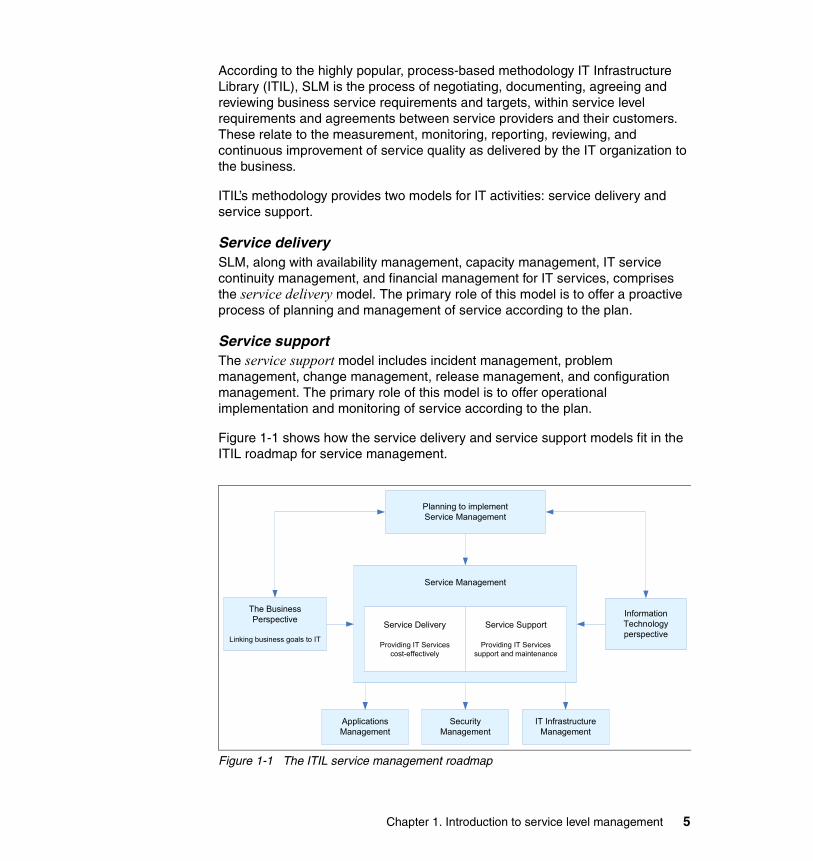
ITIL’s methodology provides two models for IT activities: service delivery and service support.
Service deliverySLM, along with availability management, capacity management, IT service continuity management, and financial management for IT services, comprises the service delivery model. The primary role of this model is to offer a proactive process of planning and management of service according to the plan.
Service supportThe service support model includes incident management, problem management, change management, release management, and configuration management. The primary role of this model is to offer operational implementation and monitoring of service according to the plan.
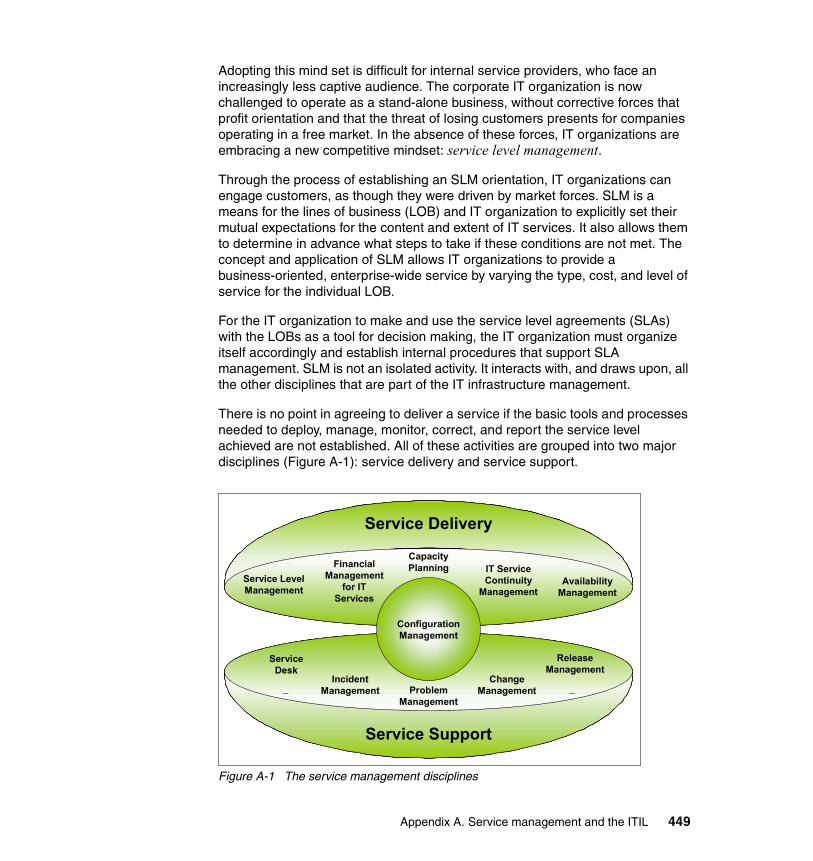
Figure 1-1 shows how the service delivery and service support models fit in the ITIL roadmap for service management.
Figure 1-1 The ITIL service management roadmap
Planning to implement Service Management
The Business Perspective
Linking business goals to IT
Information Technology perspective
Applications Management
Security Management
IT Infrastructure Management
Service Management
Service Delivery
Providing IT Services cost-effectively
Service Support
Providing IT Services support and maintenance
Chapter 1. Introduction to service level management 5
According to the ITIL, SLM relates to the other aforementioned disciplines as follows:
� Supported by availability management, IT service continuity management, capacity management, problem management, and configuration management
� Provides information to incident management and change management
� Monitored via financial management for IT services, incident management, capacity management, and availability management
� Supports application management, business processes, and event management
SLM is the disciplined, proactive methodology. Procedures are used to ensure that adequate levels of service are delivered to all IT users in accordance with business priorities and at an acceptable cost. Service levels typically are defined in terms of availability, responsiveness, integrity, and security delivered to users of the service.
Pros and cons of service level managementAlthough the duration and scale of SLM implementations may vary, both large and small corporations can capitalize on the benefits of SLM. They do so by choosing the components that are most appropriate to their specific SLM needs.
Implementing SLM requires time and effort. It is difficult to rationalize allocation of IT resources to this project if IT is already working with limited resources. In addition, IT clients sometimes abuse the SLM processes, especially when they aim for unreasonable or unattainable service level commitments.
However, this should not stop IT management from developing SLM, which can be equally important for both business units and an IT organization. SLM increases the efficiency of an IT organization and introduces a financial incentive and penalty system for service delivery.
Indeed, the rising popularity of SLM testifies to its value. For an IT organization, the effective SLM is often a matter of survival particularly if its mission is to operate as a business. The product of an IT organization is the service it delivers to business units.
For an IT organization, providing quality services is not enough. The service must consistently be of the same high quality both in actual delivery and in the eyes of the users of the services. SLM supports IT organizations to improve the quality of the services provided and the quality of the services as it is perceived by the users of IT services. Refer to Appendix A, “Service management and the
6 Service Level Management
ITIL” on page 447, for a definition of quality of services and how it is perceived by users and customers of IT services.
Both an IT organization, as a seller, and a business unit, as a buyer, need a contract that clearly defines both the capabilities and limitations of this process. For reasons of customer satisfaction and cost control, the product must meet the specifications of this contract.
1.2 Service level management benefitsBusinesses need to respond quickly to market demands and seek to maximize profits. These goals often result in a high volume of change for IT organizations. Every IT organization has an objective to align its goals with business requirements and to better support business needs. They use SLM to ensure that scarce IT resources are prioritized to focus on key business requirements.
By implementing SLM, IT organization can achieve many of their goals. However, they must overcome many challenges to ensure that the SLM program is successful.
GoalsThe goals of SLM are:
� Understand and meet the requirements of customers and end users� Use resources efficiently, effectively, and provide value for money� Improve continuously through a process of learning and growth� Use internal process to generate added value for customers and survive� Establish a business-like relationships between the customer and supplier
ChallengesThe challenges of SLM are:
� Divergent views of business and IT organizations� Diversity of organization business areas� Changing the mind set from products and systems to services� Perception of IT (historically not always good)� Unknown components, dependencies, and ownership� Poor quality management information and metrics� Unable to justify investment or assess risk� No measure of proof of improvement� Coping with infrastructure complexity� Providing consistent and stable services
Chapter 1. Introduction to service level management 7
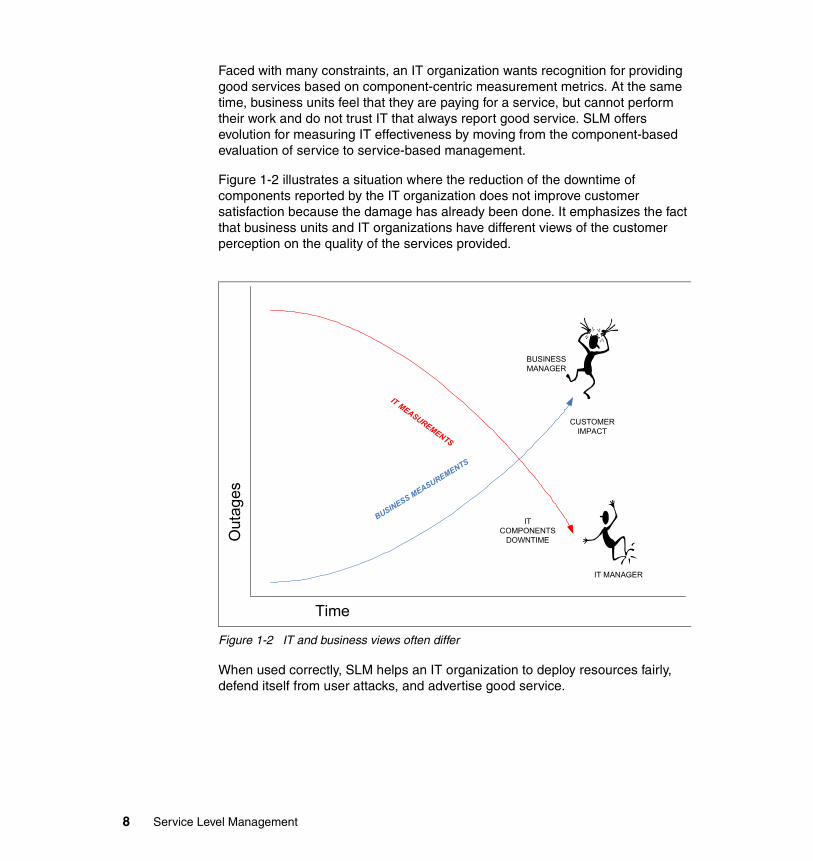
Faced with many constraints, an IT organization wants recognition for providing good services based on component-centric measurement metrics. At the same time, business units feel that they are paying for a service, but cannot perform their work and do not trust IT that always report good service. SLM offers evolution for measuring IT effectiveness by moving from the component-based evaluation of service to service-based management.
Figure 1-2 illustrates a situation where the reduction of the downtime of components reported by the IT organization does not improve customer satisfaction because the damage has already been done. It emphasizes the fact that business units and IT organizations have different views of the customer perception on the quality of the services provided.
Figure 1-2 IT and business views often differ
When used correctly, SLM helps an IT organization to deploy resources fairly, defend itself from user attacks, and advertise good service.
Out
ages
Time
BUSINESS MEASUREMENTS
IT MEASUREMENTS
IT MANAGER
BUSINESS MANAGER
CUSTOMER IMPACT
IT COMPONENTS
DOWNTIME
8 Service Level Management
How can SLM help IT to deploy resource fairly?
� Client satisfaction
SLM necessitates IT management to initiate a dialog with business units to understand the requirements for service. It also forces business units to clearly state their requirements and expectations. Improved client satisfaction is the main benefit of SLM, which ensures it through negotiated SLAs, established benchmarks for service measurement, and continuing dialog through reporting and reviews.
� Managing expectations
SLM makes it possible to avoid an expectation creep of rising levels of IT clients’ undocumented expectations. Undocumented users’ requirements and expectations levels usually lead to expectations staying ahead of service that is being delivered. SLAs document negotiated requirements and establish expectations. They also serve as brakes when users want higher levels of service than IT committed to deliver.
� Resource regulations
SLM provides a mechanism for governing IT resources. It allows IT to reject demands for resources to applications that unfairly tie up resources, and therefore, regulate workload based on business priorities. SLM helps to avoid capacity problems by providing early warning of SLAs being violated. Additional equipment might be required to support IT commitments.
� Cost control
SLM helps IT to determine, through dialog with users, the level of service required and to determine the acceptable capacity and staffing it needs to provide. SLM can demonstrate that desirable service is not always affordable and can impact costs through moderating user demands for higher levels of service. It allows IT to explain the financial impact of higher levels of service and avoid the unnecessary cost by forcing users to justify the additional cost.
SLM helps to change relationships between business units and IT from a negative acceptance of IT as a necessary evil to viewing IT as an asset in executing their mission. When the clear service objectives are documented and negotiated measurement reporting is in place, IT has the means to manage its resources as well as user dissatisfaction.
BenefitsIn summary, the benefits of SLM are:
� IT service designed to meet agreed requirements� Clearly defined roles (activities, responsibilities, and authority)� Measurable, realistic SLAs for improved customer and supplier relationships� Balances service requirements against the costs
Chapter 1. Introduction to service level management 9
� Reduces risk of unpredictable demand and capacity problems� Helps identify service weaknesses � Allows underpinning of supplier management� Provides basis for charging and measuring value� Establishes an improvement baseline
1.3 Service level management componentsTo create and maintain SLM, IT managers need well defined processes, proven tools, a dedicated effort, and a business wide commitment. SLM shifts IT management perspective away from technology and toward the demands of the business and user experiences. It introduces new methods and procedures as well as makes enhancements to the old ones.
SLM focuses on the management of an IT service in support of a specific business process. An IT service includes applications and infrastructure resources used by this business process. Management includes planning, monitoring, and reporting. SLM uses SLAs to identify service and determine its management criteria.
SLM is a process that is supported by several other processes, including performance and availability management. Both performance and availability management processes are essential for monitoring SLAs. However, an understanding of end-user perspectives through synthetic transactions and communications with users is also critical. Accordingly, monitoring of performance and availability must be adjusted to account for user experiences.
For this reason, IT operations must incorporate end-user experiences and business function knowledge into the management IT infrastructure and applications. In addition, IT support must incorporate business requirements into the asset management, change management, and incident management.
The following sections introduce four SLM components that are essential for implementing a successful SLM program.
� Processes� Documentation� People� Tools
10 Service Level Management
1.3.1 ProcessesThe functions in SLM can be divided as follows:
� Identify users’ expectations and define parameters for service.
Ideally, IT must identify all of the business processes that must be managed. In practice, it is acceptable to select the critical business processes during the first stages of the SLM process implementation and then incorporate additional business processes as the SLM process mature. The IT organization can work with business owners to pinpoint the elements of these business processes. They can define service parameters such as end-user expectations of service, participating IT application and infrastructure components, and metrics for measuring service levels.
� Assess service capabilities and negotiate service agreements.
First an IT organization must have a clear understanding of service expectations, composition of service elements, and service level measurement metrics. Then it must collect data and assess its current capabilities for meeting a customer’s expectation of service levels. After studying current capabilities for delivering all services required and indentifying opportunities for improvement, IT management is ready to talk with customers about the service levels that it can provide.
IT should avoid technical terminology and describe services and expectations in a manner that is understandable to its customers. At the same time, IT should fully understand what service levels it can deliver and achieve agreement from its customers on service levels measurement and reporting criteria. IT must document negotiated expectations and measurements metrics as well as agreed upon acceptable service levels values.
� Manage to meet service level objectives (SLOs).
IT must align its processes to proactively monitor, measure, and manage against negotiated SLAs. Accordingly, IT must develop SLOs to meet SLA obligations for underlying IT components, measure actual values against SLOs, and associate the measured status against the SLAs.
Upon recognition of service level degradation (preferably through real-time alerts), IT can immediately start finding a problem and restoring service to acceptable levels as defined by SLAs. If the problem is serious, IT may also notify users so they can avoid affected services and calls to the help desk.
SLAs that relate to IT operations and support (OLAs) recognize component issues quickly and evaluate their measurements prior to their impact on SLAs and IT customers. IT must come up with monitoring processes, measurement metrics, and automation that allow prompt responses to problems by technical staff in addition to reporting an OLA’s status to management.
Chapter 1. Introduction to service level management 11
SLM uses reporting to communicate overall service level performance to IT and business management. Effective reporting should show IT performance against service-level commitments (successes and failures). It can be used together with financial incentives to improve IT processes and users behavior.
� Continue service refinement and improvement.
The SLM process should always be examined for process effectiveness, service changes, and reporting accuracy. Customer expectations change as business processes grow and new applications and users are added. As monitoring technology improves, IT can expand metrics that measure component performance and customer satisfaction. IT must periodically re-evaluate the services it provides.
Service improvement is a continuous process that allows IT to add more value, adjust to new realities, justify new technology, and often derive more revenue. The same can be said about the SLM process that needs continuous improvement to gain the trust of business owners, improve efficiency through automation, and effectiveness through a better understanding of business-to-IT relationships.
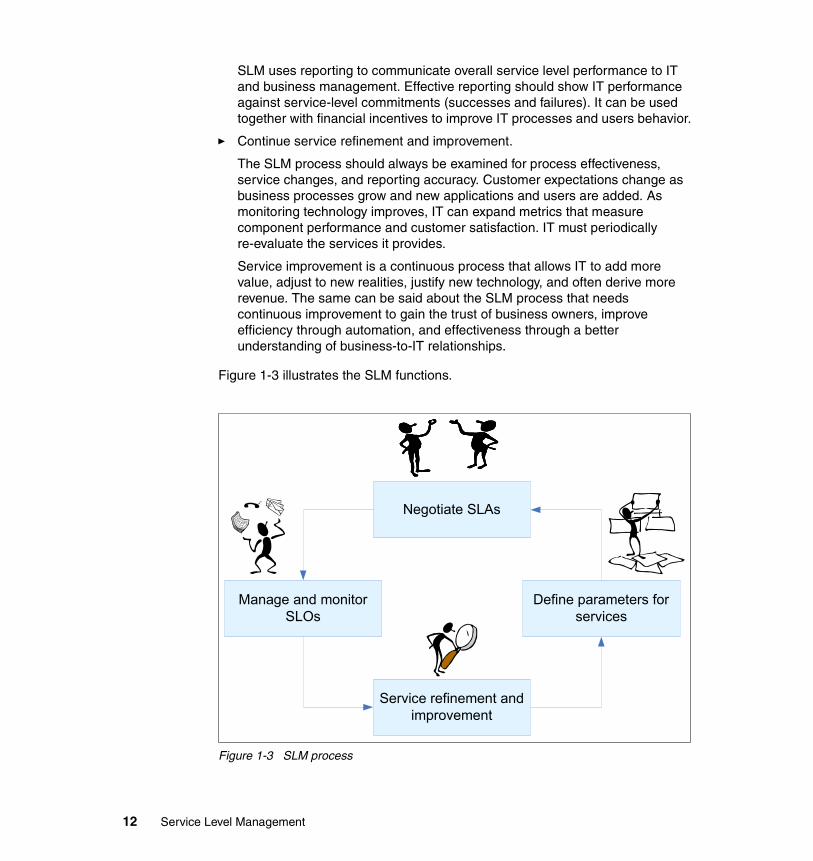
Figure 1-3 illustrates the SLM functions.
Figure 1-3 SLM process
Manage and monitor SLOs
Negotiate SLAs
Service refinement and improvement
Define parameters for services
12 Service Level Management
1.3.2 DocumentationBecause SLM relies on several parties involved in defining the processes, negotiations, penalties, and so on, documentation is a must. The following documents support SLM:
� Service level agreements
An SLA is an agreement between business units (the customer) and IT organization (the service provider). It describes the service and service level measurement metrics, defines the approval and reporting process, and identifies the primary users. It can also include financial terms and conditions.
SLAs provide a mechanism for establishing accountability for both IT and their customers for the provided service levels which are negotiated and agreed to based upon business requirements, priority, and cost. SLA measurements must be directly aligned with customer expectations. SLAs are the basis for service level evaluation and improvement processes that include periodic reviews and adjustments if needed.
� Operational level agreements
An operational level agreement (OLA) is an internal agreement that shout be established between all business and IT groups prior to the execution of an SLA. The OLA establishes specific requirements that each IT group needs to meet in support of service levels and make them accountable for their contribution to the overall improvement of service levels.
Well-defined OLAs show IT management which areas have more impact on service levels, where to focus attention and financial rewards, and how each group can contribute if business requirements require a change of SLAs.
� Underpinning contract
IT should establish underpinning contracts (UCs) for any service provided by external service providers and vendors. UCs add accountability for external component of service levels in the same way as OLAs account for the internal components of service levels.
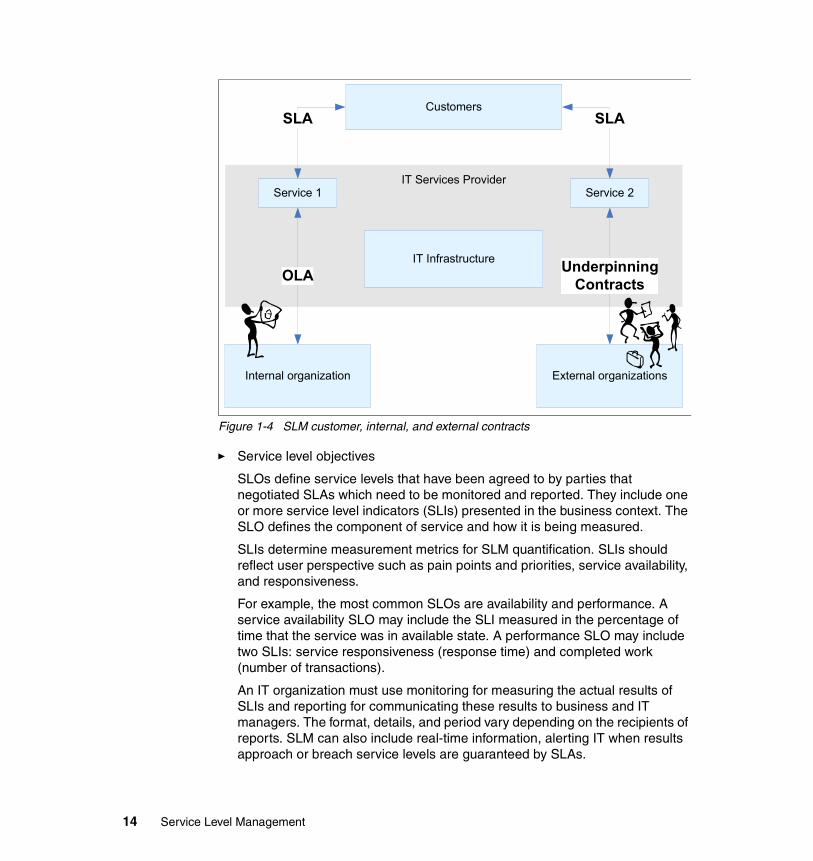
IT can use the contractual agreements that they have with their third-party vendors and feed the pertinent data into the SLM process. As service levels need to be changed, IT may need to re-negotiate external contracts with vendors and modify the UCs. Figure 1-4 illustrates the flow of customer, internal, and external contracts.
� Service catalog
The service catalog provides a place to document all services provided to the customers and to record such details as key features, components, charges, and dependencies for each service.
Chapter 1. Introduction to service level management 13
Figure 1-4 SLM customer, internal, and external contracts
� Service level objectives
SLOs define service levels that have been agreed to by parties that negotiated SLAs which need to be monitored and reported. They include one or more service level indicators (SLIs) presented in the business context. The SLO defines the component of service and how it is being measured.
SLIs determine measurement metrics for SLM quantification. SLIs should reflect user perspective such as pain points and priorities, service availability, and responsiveness.
For example, the most common SLOs are availability and performance. A service availability SLO may include the SLI measured in the percentage of time that the service was in available state. A performance SLO may include two SLIs: service responsiveness (response time) and completed work (number of transactions).
An IT organization must use monitoring for measuring the actual results of SLIs and reporting for communicating these results to business and IT managers. The format, details, and period vary depending on the recipients of reports. SLM can also include real-time information, alerting IT when results approach or breach service levels are guaranteed by SLAs.
IT Services ProviderService 1 Service 2
IT Infrastructure
Customers
OLA UnderpinningContracts
SLA SLA
External organizationsInternal organization
14 Service Level Management
� Service improvement program
SLM is a continuous process that includes service level improvement and SLM improvement activities. IT should never be satisfied with current level of service even if it satisfies its obligations to customers.
IT should develop a service improvement program and document a service quality plan. This plan should include how to maintain awareness of changing business objectives, cost-effectively add new technology, improve daily operations, and expand SLIs and reporting to match user perception of service as much as possible.
1.3.3 PeopleThe SLM process requires the involvement of people at various levels within business and IT organizations. The request for service improvements often starts with the head of a business unit or a senior executive who begins demanding more consistent service and accountability from IT. IT management may respond with tactical improvements but may be forced to implement the SLM program.
SLM is a collaborative effort. Its implementation includes a number of people in dedicated or supporting roles. Responsibility for overall management of the SLM program is most likely to be assigned to a senior IT executive.
IT may also assign a dedicated project manager and a dedicated service level manager. The project manager is responsible for implementing the SLM project. A service level manager is active throughout the entire implementation phase as well as after the phase. This person also coordinates ongoing management and improvement programs. In their effort, both the project manager and the service level manager need support from line managers of IT and business groups.
The SLM team must include representatives from both business units and IT service delivery and may require some assistance from consultants. However, SLM is primarily an IT effort as it is IT who must handle the technical aspects of the SLM implementation, deployment, and operation. The SLM program must have an executive sponsor who provides funding for the program and is ultimately responsible for the success of the SLM program.
For more details about the roles and responsibilities of the people involved in implementing SLM, see 2.2.1, “Identifying roles and responsibilities” on page 26.
1.3.4 ToolsWhile developing the SLM plan, the IT organization must choose tools to enable the SLM process that is being developed. Depending on the selected measurement metrics and the service composition of related IT resources, these
Chapter 1. Introduction to service level management 15
tools support monitoring of the chosen service indicators and user experiences. They also provide analytical capabilities and aggregation for reporting.
In addition, IT must organize the collected data and make it accessible to everybody with a stake in the SLM process. Analytics and reporting must present this data in a manner that aligns the service views of both IT and their customers, allowing them to reconcile the customers’ perception of service with the service levels delivered by IT.
IT wants to understand how resource performance and availability affects service levels and what adjustments are needed to improve service. Customers want to make sure that IT delivers availability and responsiveness to the critical applications that they use for automating their business processes. When their business process is impacted, they want IT to accurately report it so they can impose the negotiated penalties on IT.
SLM is a hot topic, and many companies have made claims that their products provide SLM solutions. Some products are specifically designed for SLM. Others offer only aspects of monitoring capabilities but still market their products as SLM solutions.
When implementing SLM, IT should choose the following tools to meet their design specifications:
� Monitoring tools to provide the measurement metrics they need to collect
� Reporting tools that process the data being captured and satisfy all levels of report recipients
� Analytical tools that provide aggregation and analysis of the collected SLM data in a manner that offers fast recognition of business impact and proactive response
� Administration tools that improve the productivity of SLM operators and users as well as provide the integration of monitoring, reporting, and analytical tools
This book introduces solutions provided by IBM, which include a wide range of products that can monitor a variety of distributed and mainframe servers, databases, transactions, networks, Web servers and end-user experiences.
In addition, IBM offers analytical products in SLM space that provide the real-time integrated event console, event correlation, business service management (BSM), and proactive SLM. All these products accept data from the majority of today’s monitoring products.
16 Service Level Management
1.4 Business service management approach to service level management
The philosophy of managing services in a business context is receiving more traction with IT organizations that are trying to improve relations with their customers. These same organization are also trying to overcome historical challenges such as customer perception and the increasing complexity of technology. Understanding how shared infrastructure resources are being used by business processes significantly improves the ability of business and IT executives to negotiate, measure, and evaluate service contracts.
Many IT organizations are turning to BSM solutions to facilitate a business-defined view of IT-delivered services. BSM solutions provide facilities and analytics that enable IT to manage service levels with the business consumer for a specific business process to ensure that the SLA associated with this process is fulfilled.
Why business service management?Earlier this chapter introduced SLM as the management of IT resources to deliver the required service at the required level of quality. BSM allows IT to incorporate business knowledge into the service management process and to translate data from traditional infrastructure and application management tools into business-level representations.
BSM relies on IT organizations that work with business units to map resource-to-service relationships and organize them into structures that depict and visualize the components of IT infrastructure as well as automate components of the business process based on the knowledge of their relationships. Accordingly, with BSM, IT management and business executives can reconcile their perspective of IT performance. This is because BSM can report both real-time status and historical service-level compliance for each business function supported by IT.
What is business service management?BSM is a service management application that aligns IT operations with business processes. Therefore, it allows business functions to receive maximum leverage from IT resource management.
BSM solutions enable real-time management of events and service levels based on knowledge of their relationships to an IT service provided to a business entity responsible for a business process.
BSM provides IT with a set of algorithms and visualizations that IT must incorporate in its SLM processes. It is designed to display and report the service
Chapter 1. Introduction to service level management 17
delivery health and business impact of IT based on performance and availability of IT resources. The visualization of BSM runs on federated event and monitoring data as well as business and IT relationship data.
The four aspects of BSM are:
� It consists of identifying the components of a business system.� It involves measuring the performance and availability of those components.� It ensures that the components are performing within SLOs.� It alerts to any deviation or potential deviation from SLOs.
The concepts behind BSM include:
� Resources are components of IT infrastructure.
� Business transaction is a group of IT resources supporting a particular IT workload.
� Business system is a group of resources that supports a business goal.
� Business process is composed of some automated (IT services based) and some manual steps.
� When policy data or service level information is attached to a business system, it turns into an IT service.
� IT service can be perceived as a collection of IT resources that make up the automated part of the business process.
1.4.1 Convergence of business service management and service level management
With BSM, an IT organization gains insight into a business process. It can use this insight to design SLM based on the aforementioned relationship structures that we call business systems. A business system is a representation of a group of diverse but interdependent enterprise resources that are used to deliver specific business functionality.
Business systems allow flexible and automated arrangements of IT resources into models of services that IT provides to automate business functions. Together, they represent what we call the Business/IT knowledge base that is an important element of the SLM methodology.
As a result of a joint effort to develop the Business/IT knowledge base, an IT organization and business units have a framework for SLA that allows them to:
� Identify all components of a service
� Create SLA and OLA contracts based on business systems
� Measure resource performance and availability by business systems
18 Service Level Management
� Get service violation and trend alerts for any deviation or potential deviation from the SLO
� Ensure that services are performing within the SLO
The Business/IT knowledge base provides the foundation for BSM and SLAs. In reality, BSM allows IT to decompose business processes into IT systems and document the negotiated service levels in SLAs to be managed by BSM via monitoring and analytics organized by business systems.
BSM accepts data from a variety of performance and event data sources that monitor IT resources. The BSM analystics then consume this data to determine business systems status and understand its business impact.
Figure 1-5 demonstrates that business systems are a cornerstone for establishing service levels and managing IT resources based on business objectives for IT services.
Figure 1-5 Business system organizes IT resources and other business systems
A successful SLM program that aims to solve user perception issues should establish a common understanding between business units and an IT organization on service delivery and quality of service measurements. As outlined earlier, the BSM approach to SLM helps this effort by collecting business knowledge and exposing the use of resources by services. This makes SLA contracts and measurement metrics more meaningful to both IT and business units.
ServiceServiceBusiness Systems
Service
Business SystemsBusiness
SystemsTheBusiness
The Technology
Business Services
- banking- trading- e-commerce
IT Services
- databases- web servers- banking application- application support- development
Business Systems
Business Systems
Business Systems
Business Systems Management
Service Level Management
OLASLAUnderpinningContracts
Historical Reporting
Business viewsContextual alerting
Incident resolution
prioritization
Real time monitoring
Chapter 1. Introduction to service level management 19
1.5 Improving service level management through integration
SLM is the continuous process of measuring, reporting, and improving the quality of agreed upon service that an IT organization provides to the business. This requires that an IT organization clearly understands each service it provides, its business importance and priority, who consumes this service and how, and the IT resources are used. Such information is usually dispersed and requires a significant effort from IT to obtain and organize it a meaningful way that can expose business use IT resources.
As demonstrated earlier, you can use BSM to compose and refine services from related resource and business systems objects.
Service compositions defined by BSM allow IT to design SLAs and service level measurement criteria in an integrated manner and provide:
� Improved effectiveness of SLAs
When a IT organization uses the same definitions of services for aggregating monitored data, service management, and service evaluation, it can significantly improve the effectiveness of SLAs and make investigations of SLA violations more productive.
� Improved effectiveness of communication
Through a set of federated monitoring data and views, IT can use service compositions to effectively communicate with users (while developing and reporting SLAs) and to prioritize management of incidents.
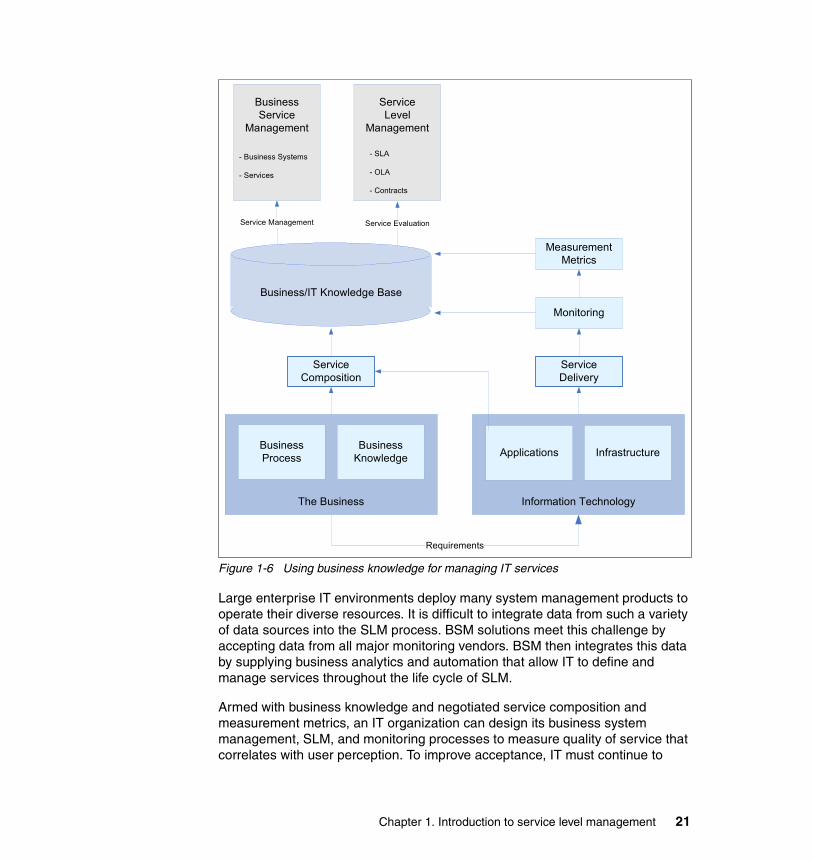
Figure 1-6 presents a high-level view of integrating monitoring, service management, and service evaluation around service compositions.
Management of IT resources within the context of the business services they provide includes:
� Automatic discovery of IT resources and their relationships� Automation for constructing services and business systems� Detections of incidents for IT resources in a service context� Determination of service status and business impact of incidents� Warehousing of historical data for IT resources and services� Service level evaluation and alerting in service context� Reporting service health and service level compliance with SLAs
20 Service Level Management
Figure 1-6 Using business knowledge for managing IT services
Large enterprise IT environments deploy many system management products to operate their diverse resources. It is difficult to integrate data from such a variety of data sources into the SLM process. BSM solutions meet this challenge by accepting data from all major monitoring vendors. BSM then integrates this data by supplying business analytics and automation that allow IT to define and manage services throughout the life cycle of SLM.
Armed with business knowledge and negotiated service composition and measurement metrics, an IT organization can design its business system management, SLM, and monitoring processes to measure quality of service that correlates with user perception. To improve acceptance, IT must continue to
Monitoring
Business/IT Knowledge Base
Measurement Metrics
Service Level
Management
- SLA
- OLA
- Contracts
The Business
Business Process
Business Knowledge
Information Technology
Applications Infrastructure
Service Management
Service Composition
Service Delivery
Requirements
Service Evaluation
Business Service
Management
- Business Systems
- Services
Chapter 1. Introduction to service level management 21
refine the service composition and measurement metrics until they become transparent to business units.
1.6 Scope of this bookAs outlined in this chapter, there are many aspects to SLM. One of the main objectives is to relate the definition of service to the perception of IT users and business unit management. The quality of services delivered to these users is judged according to users’ ability to use services effectively and cost-efficiently when required by their job functions.
Although IT managers place a high priority on meeting this objective, the task of reporting on quality of service that users accept as matching their experiences is often hit and miss. The BSM approach (outlined earlier in this chapter) to SLM offers significant improvements in this area by making business to IT relationships more factual and transparent through several implementation steps.
The topics in this book are structured to guide you through analysis of SLM and its planning aspects to detail implementation of BSM, SLM, and monitoring integration approach using Tivoli products. They include a summary of improvement opportunities for each topic. The remainder of this book is divided into the following chapters:
� Chapter 2, “General approach for implementing service level management” on page 23, describes a generic approach for SLM implementation, following the ITIL process improvement model as close as possible.
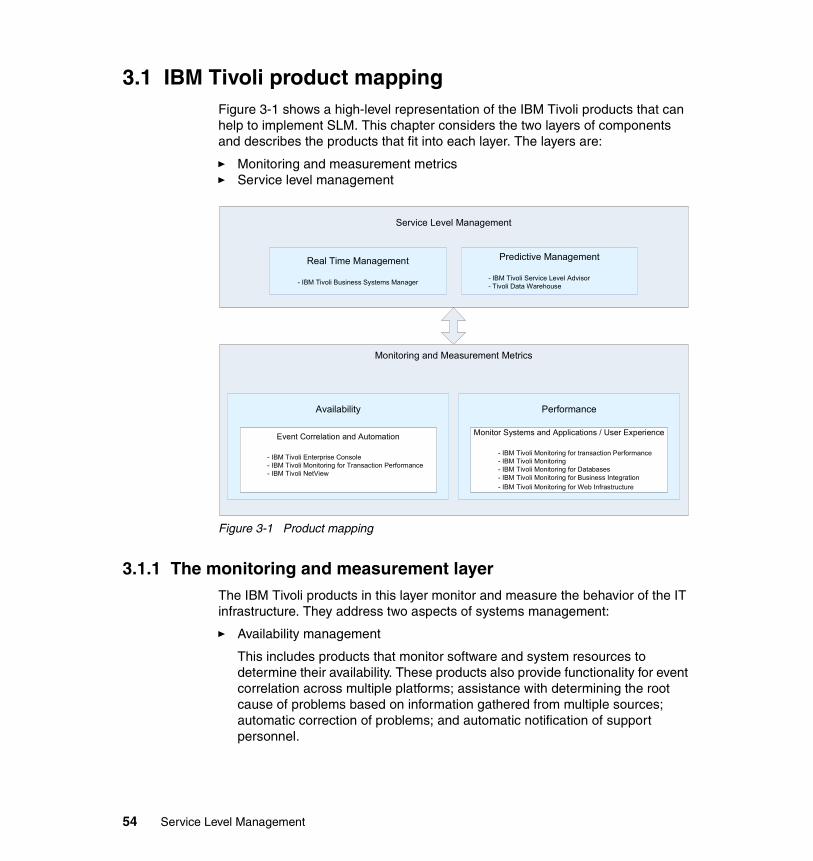
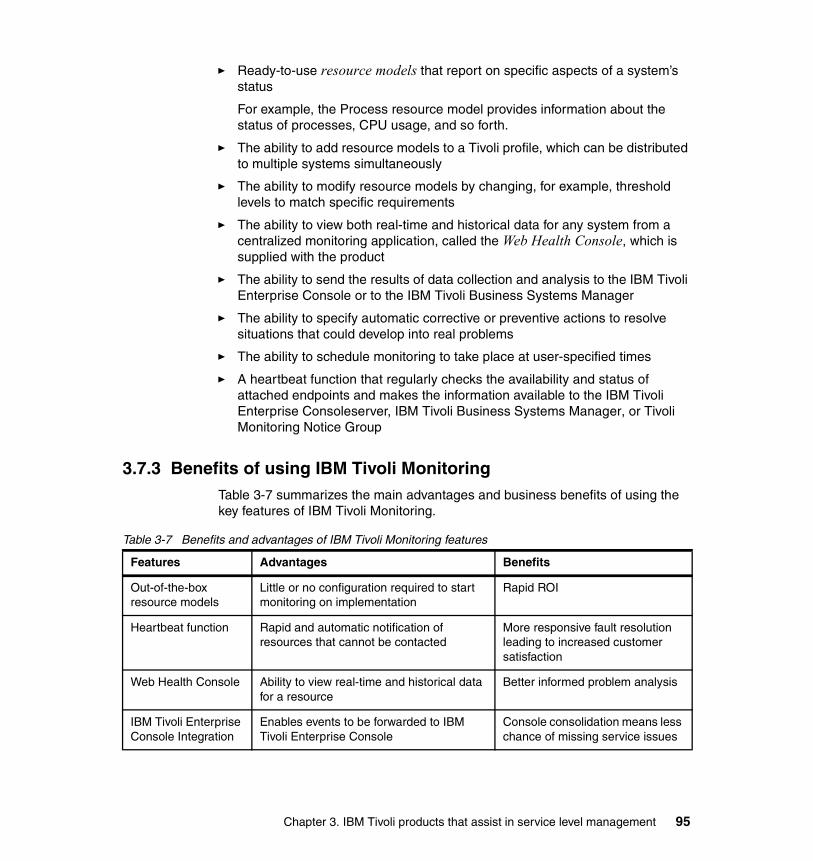
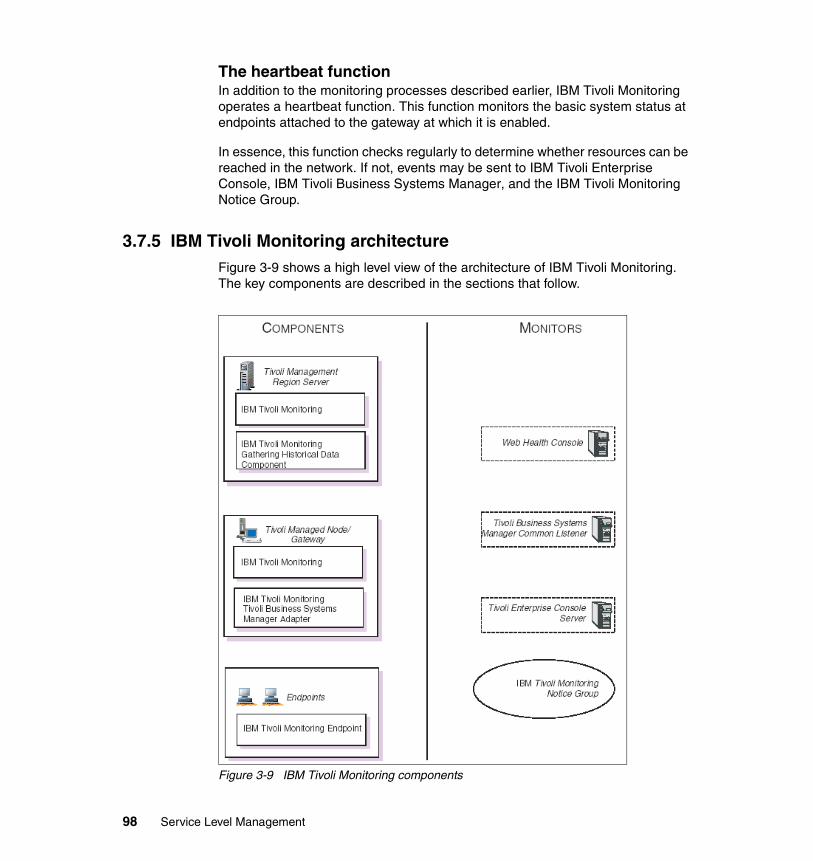
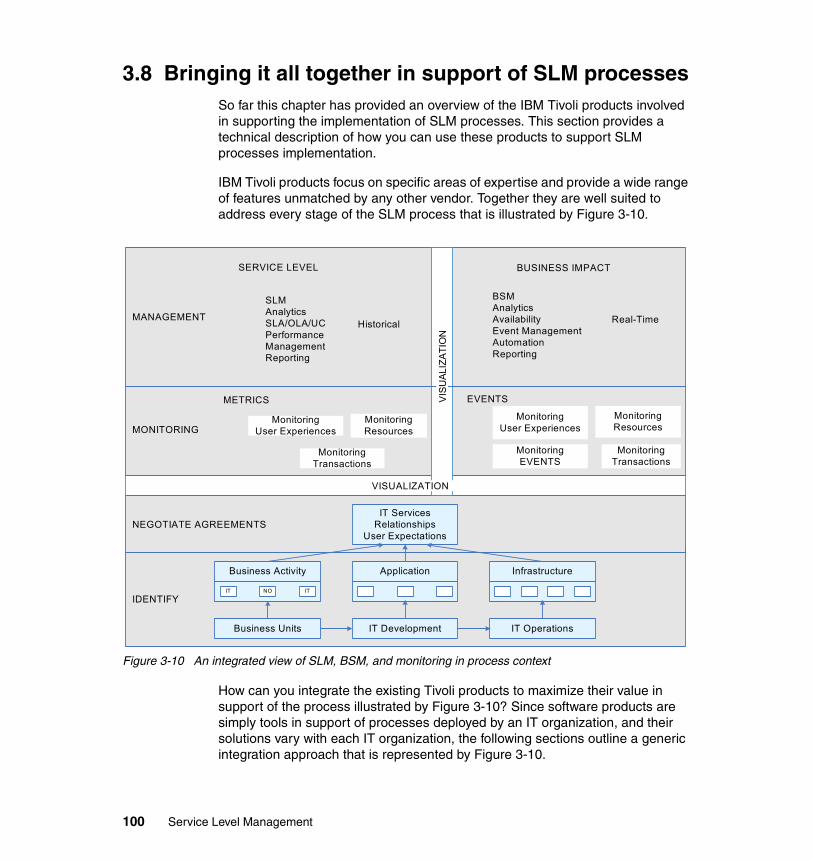
� Chapter 3, “IBM Tivoli products that assist in service level management” on page 53, provides an overview of the IBM Tivoli products that support SLM processes.
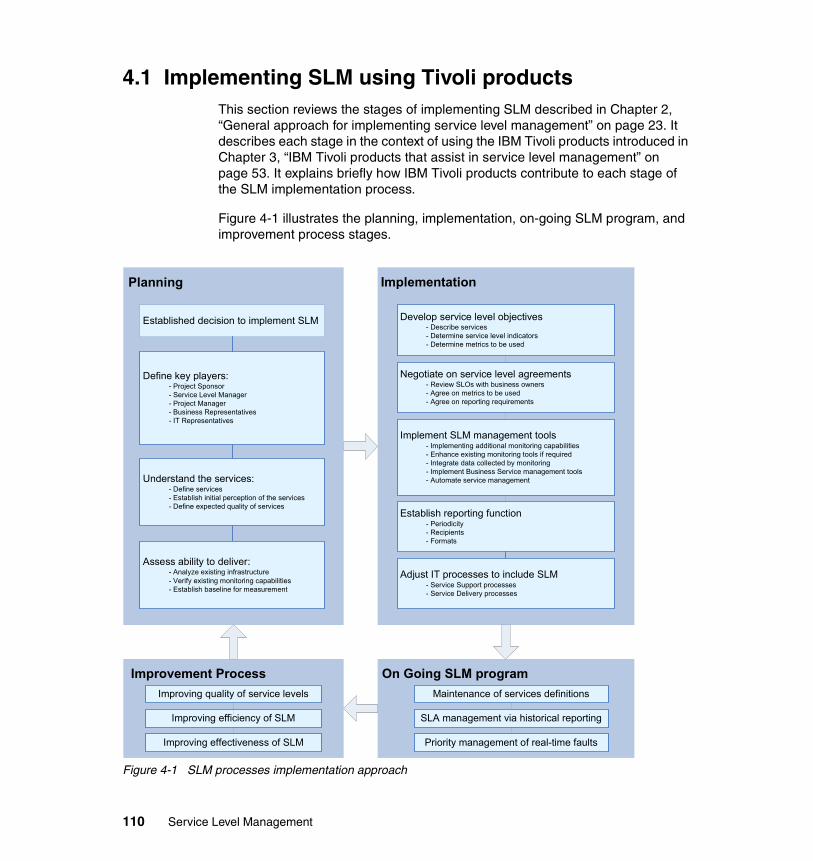
� Chapter 4, “Planning to implement service level management using Tivoli products” on page 109, outlines the planning and implementation of SLM and BSM through the integration of several IBM Tivoli products.
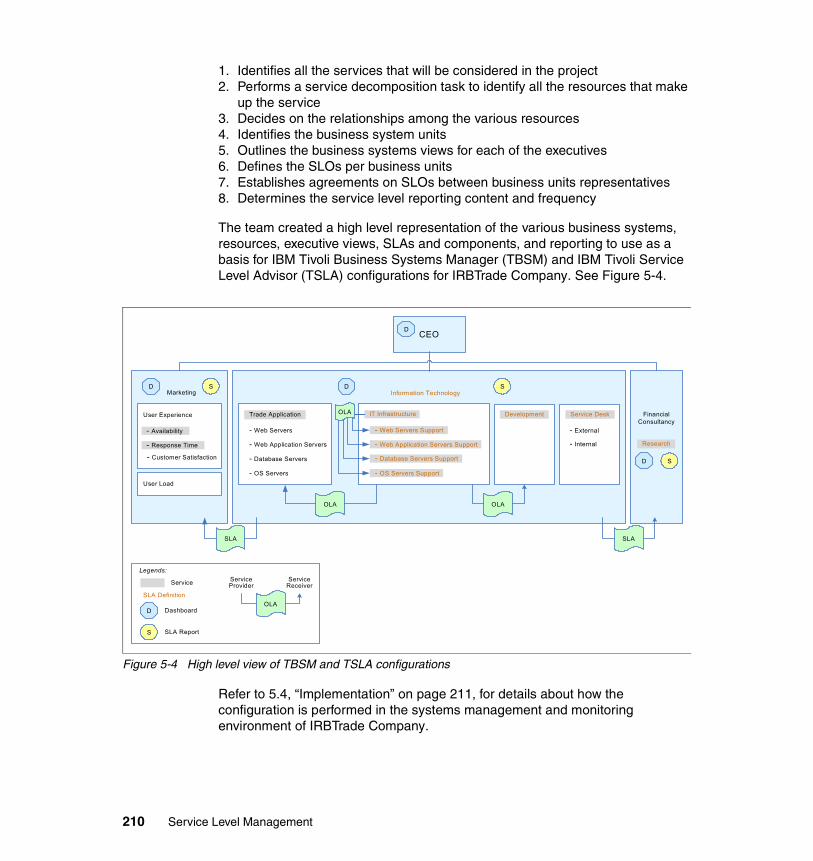
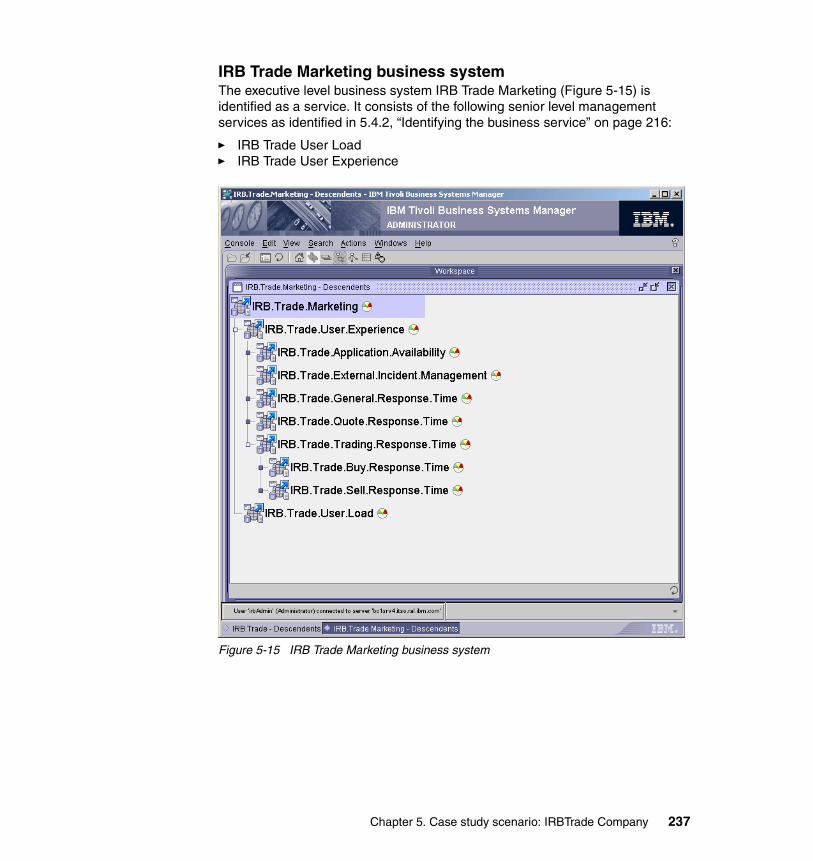
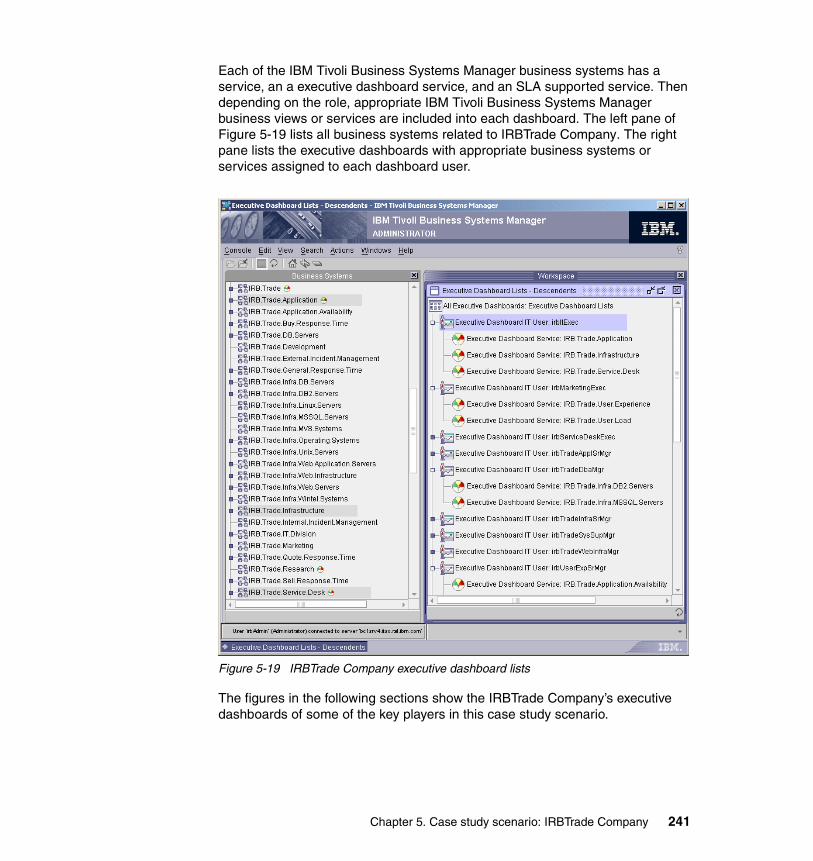
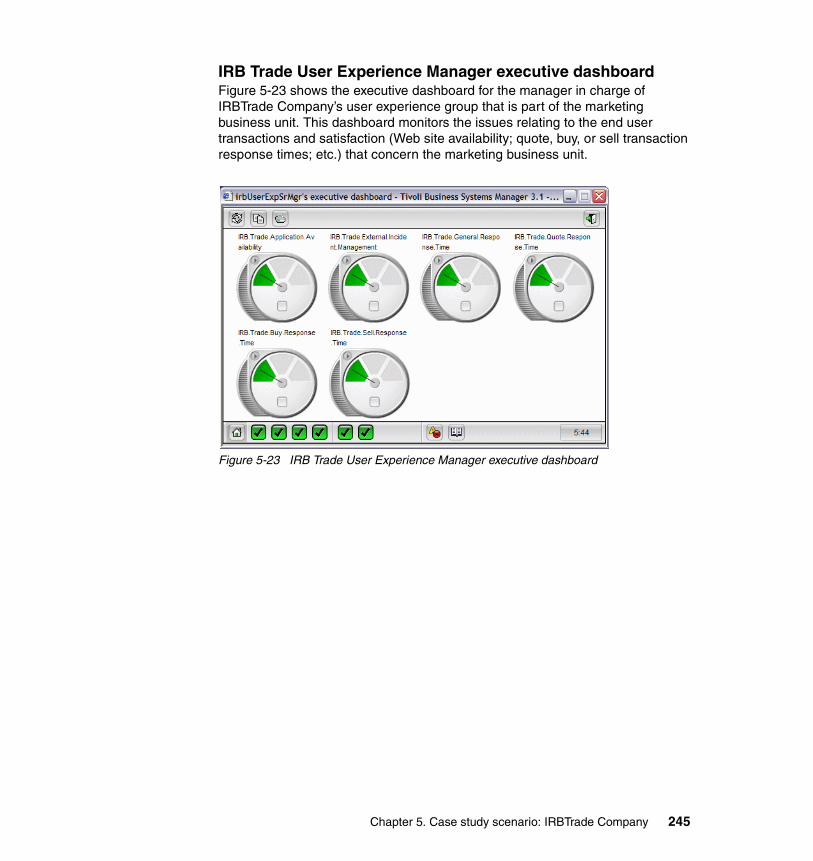
� Chapter 5, “Case study scenario: IRBTrade Company” on page 197, provides a test case of the SLM program implemented to manage the distributed environment for a trading company.
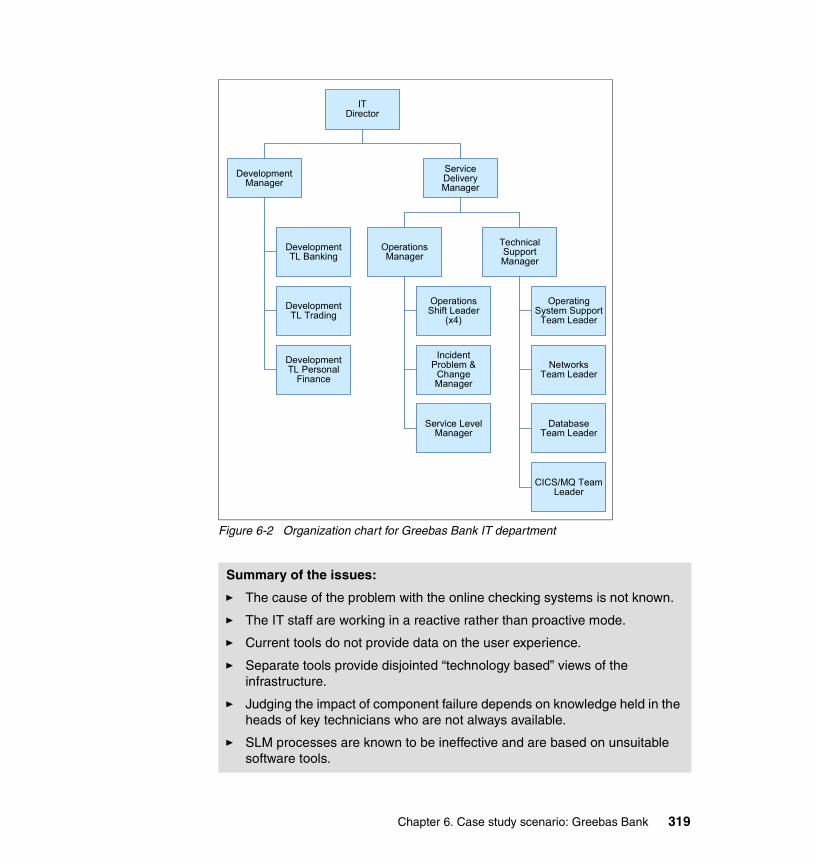
� Chapter 6, “Case study scenario: Greebas Bank” on page 315, provides a test case of the SLM implementation of enterprise management (mainframe and distributed) for a bank.
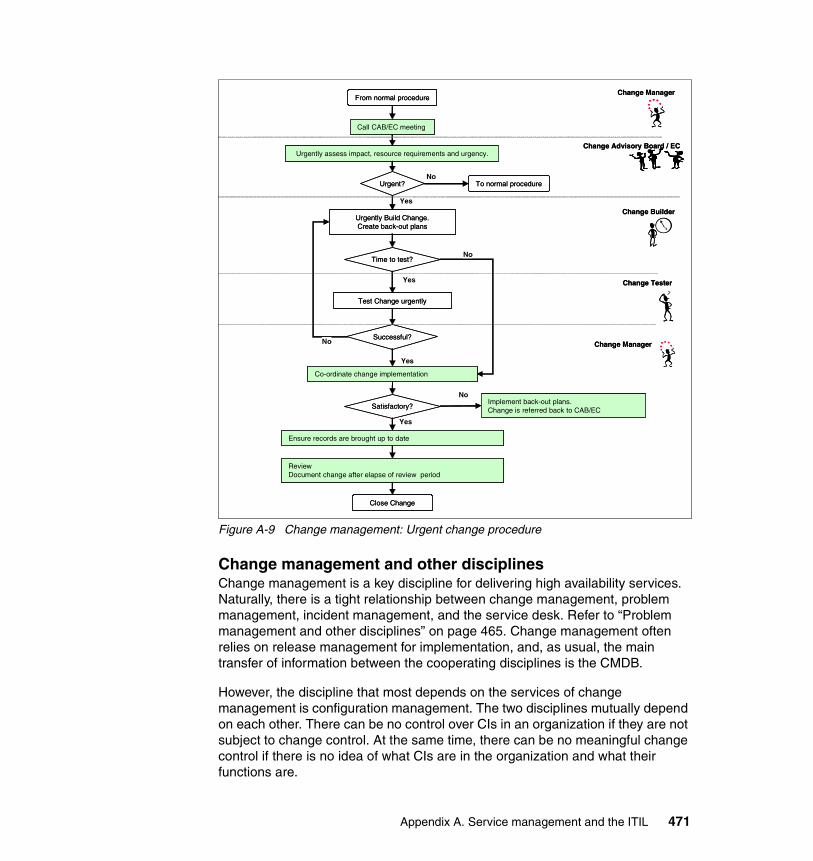
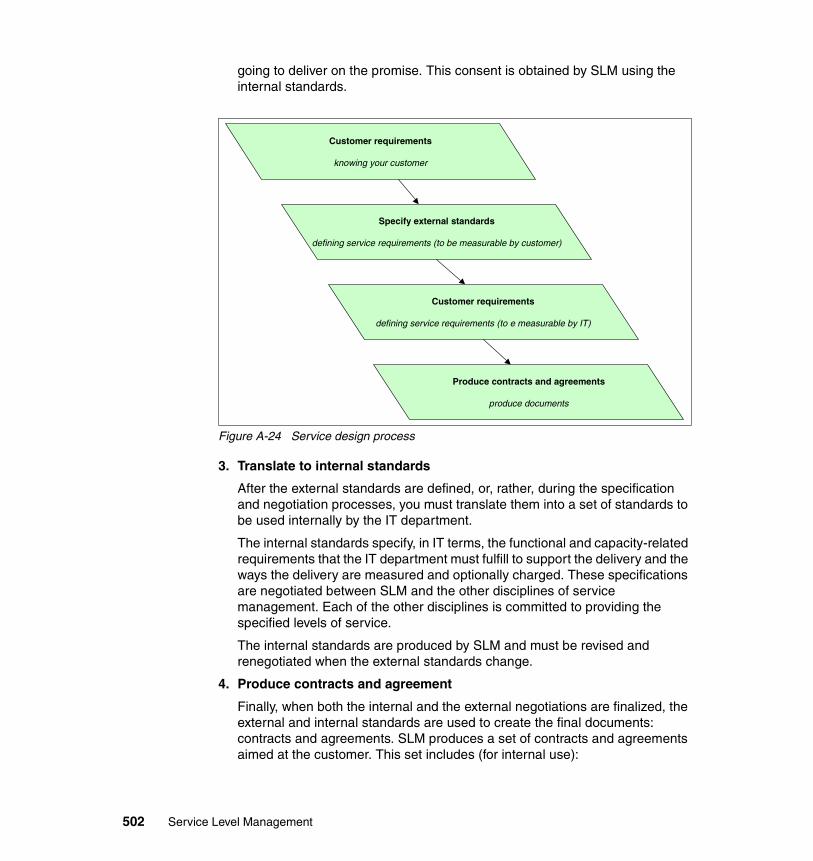
� Appendix A, “Service management and the ITIL” on page 447, discusses the various components and definitions behind Service Management in ITIL terms. It is designed as a reference for Anyone involved in the SLM process.
22 Service Level Management
Chapter 2. General approach for implementing service level management
Service level management (SLM) is an important initiative. It requires the participation and support of many resources. A successful implementation has an established business need, commitment from all those involved, and funding to ensure adequate resources and tools for completion. It requires a strategy and a flexible plan for negotiating, implementing, and maintaining service level agreements (SLAs).
The typical motivation for SLM is the need to improve IT service delivery as perceived by customers. In many cases, the team responsible for IT service delivery does not have all the information required to meet the needs of the business. As a result, IT delivers and reports on top quality service, while business units experience service that is perceived to be of a low quality. SLM provides a means to overcome this challenge, providing the many benefits described in 1.2, “Service level management benefits” on page 7.
Executive management commitment for SLM is essential since the goal of aligning IT and business requires an organization-wide commitment from both business and IT representatives. It takes hard work and discipline to implement SLM. Simply providing funding is not enough. Executive management can
facilitate commitment during the entire SLM planning and implementation cycle by continually motivating the change and leading by example.
This chapter describes a generic approach (Figure 2-1) for implementing SLM after a decision to do so is established. This methodology starts with a planning phase, continues on to implementation, and concludes with on going management and improvement of the overall process. It follows the IT Infrastructure Library (ITIL) process improvement model.
Figure 2-1 SLM processes implementation approach
Planning
Established decision to implement SLM
Define key players:- Project Sponsor- Service Level Manager- Project Manager- Business Representatives- IT Representatives
Understand the services:- Define services- Establish initial perception of the services- Define expected quality of services
Assess ability to deliver:- Analyze existing infrastructure- Verify existing monitoring capabilities- Establish baseline for measurement
Implementation
Develop service level objectives- Describe services- Determine service level indicators- Determine metrics to be used
Negotiate on service level agreements- Review SLOs with business owners- Agree on metrics to be used- Agree on reporting requirements
Implement SLM management tools- Implementing additional monitoring capabilities- Enhance existing monitoring tools if required- Integrate data collected by monitoring- Implement Business Service management tools- Automate service management
Adjust IT processes to include SLM- Service Support processes- Service Delivery processes
On Going SLM programMaintenance of services definitions
SLA management via historical reporting
Priority management of real-time faults
Improvement ProcessImproving quality of service levels
Improving efficiency of SLM
Improving effectiveness of SLM
24 Service Level Management
Chapter 1, “Introduction to service level management” on page 3, introduces the four key components of SLM: people, processes, documentation and tools. This chapter identifies and discusses each of these components in more detail.
2.1 A look at the ITIL process improvement modelAn organization may already have some elements of SLM established and operational. Therefore, the approach taken in this chapter to present a method for SLM implementation is one of process improvement. This chapter applies the ITIL process improvement model to an SLM implementation.
ITIL process improvement model is summarized by asking the following questions in the order presented:
1. Where do we want to be?
This question provides the vision and objectives for an SLM implementation. It is answered by having a clear definition of provided services, determining the current perception of quality of the services being provided, and defining the desired quality of the services to be provided to customers. These topics are addressed in 2.2, “Planning for service level management implementation” on page 26.
2. Where are we now?
Perform a thorough assessment of the existing IT infrastructure’s ability to deliver the defined services, and its existing monitoring capabilities. After this task is completed, perform a gap analysis of both the IT infrastructure and the monitoring capabilities so that IT can deliver services with the expected level of quality required by the business and expected by the customers. These topics are also addressed in 2.2, “Planning for service level management implementation” on page 26.
3. How do we get where we want to be?
Based on the information gathered from the previous two questions, an IT organization prepares service level objectives (SLOs), constructs SLAs, and negotiates them with customers. This is also the time when additional IT infrastructure, monitoring tools, or both should be put in place. Most importantly, adjustments to existing IT processes to accommodate SLM are performed. These topics are addressed in 2.3, “Implementing service level management” on page 35.
4. How do we know we have arrived?
When the implementation is complete, hold review sessions to ensure that all specified goals were met. Also discuss how to resolve unmet goals. Establish quality management for IT services and SLM process improvement programs
Chapter 2. General approach for implementing service level management 25
at this time. These topics are also addressed in 2.3, “Implementing service level management” on page 35.
2.2 Planning for service level management implementation
This section describes the planning activities that lead to a successful SLM implementation. The desired output items of this phase are:
� A carefully chosen team capable and committed to implementing SLM
This team should include the project manager and service level manager roles to keep deployment participants on track and communicating regularly.
� A thorough understanding of the services to be managed
To accomplish this, collect information from both the business and technical perspectives and then have the service level manager mediate it. Business owners provide an overview of the major functions and an understanding of user demand. The IT service delivery organization provides detailed information about the components that make up the services that support the business functions. Identify current perception of the quality of the identified services and the desired quality level of those services.
� An assessment of the ability to deliver services based on the expected level of quality
This includes an understanding of the current capabilities of the IT infrastructure to deliver services to the quality expected by the business owners. Consider users’ current perception of service levels in this assessment. Based on this assessment, improvements to the IT infrastructure may be required.
Define a high-level design that provides an assessment of the existing monitoring capabilities and additional monitoring tools and processes at this time. This forms a baseline for measurement of expected quality of services.
To some, all of this preparation may seem time consuming. However, it leads to clearer objectives, which in turn, contributes to project success.
2.2.1 Identifying roles and responsibilitiesSLM requires the participation and support of many different organizations of a business. It is important to clearly define the roles and responsibilities of the people involved and to then identify the specific people to take on these roles. It is also important to involve all team members from the start of the project and to
26 Service Level Management
facilitate regular deployment checkpoint meetings. This ensures that everyone has a consistent level of information throughout the deployment.
Choosing the correct people is critical. Whoever is chosen must represent the views of the decision makers from both IT and business organizations and have the final word on the SLM implementation plan.
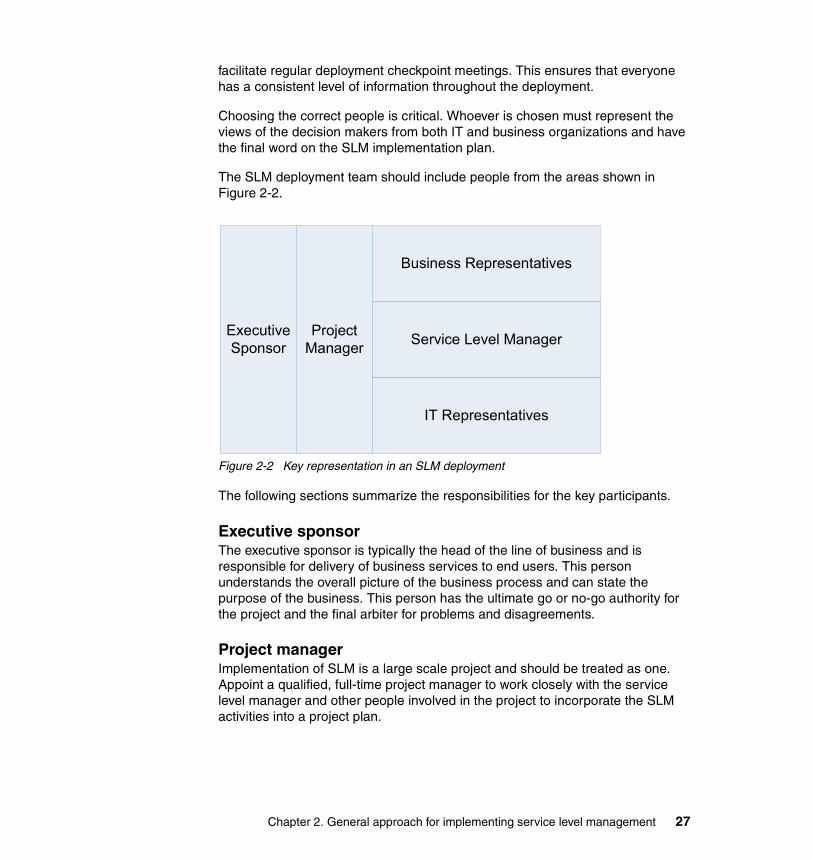
The SLM deployment team should include people from the areas shown in Figure 2-2.
Figure 2-2 Key representation in an SLM deployment
The following sections summarize the responsibilities for the key participants.
Executive sponsorThe executive sponsor is typically the head of the line of business and is responsible for delivery of business services to end users. This person understands the overall picture of the business process and can state the purpose of the business. This person has the ultimate go or no-go authority for the project and the final arbiter for problems and disagreements.
Project managerImplementation of SLM is a large scale project and should be treated as one. Appoint a qualified, full-time project manager to work closely with the service level manager and other people involved in the project to incorporate the SLM activities into a project plan.
ExecutiveSponsor
ProjectManager
Business Representatives
Service Level Manager
IT Representatives
Chapter 2. General approach for implementing service level management 27
Service level managerThis is an important role and has the primary responsibility of project ownership. When an SLM project is owned by a service level manager, it is more likely to be effective and successfully produce the benefits that were intended.
This person acts as a liaison between the business and IT units, ensuring that IT understands the business requirements and that the business units clearly state them. As such, the person or persons fulfilling this role must have either the appropriate seniority within the organization, or have clear, visible support from upper management from both IT and business organizations.
Additional responsibilities for the service level manager include:
� Creating and owning the SLM people structure within the organization
� Presenting the plan for SLM to all of the groups involved
� Describing how SLM will impact each group
� Describing how each group can contribute to a successful implementation
This includes the risks and costs involved. The more complex the plan is, the higher the cost is (more servers, more people hours).
� Asking each group for support, involvement, and agreement
� Establishing a regular service level review process with both the customer and the IT provider
� Negotiating and maintaining the SLAs with the customer
� Negotiating and maintaining the OLAs with the IT provider
� Analyzing and reviewing service performance regularly against SLAs and OLAs, leading to adjustments as appropriate
� Creating and disseminating regular reports on service performance and achievement
� Coordinating temporary changes to required service levels
Business representativesThe primary responsibility for this role is to explain the overall and component-wise picture of the business. Business services may include a number of services that require IT support. Therefore, performance of business owners depends on IT performance. Business owners understand their service well but may not understand what comprises an IT service. In large environments, this can be several people, one for each operational unit. A secondary responsibility for this role is to keep the SLM implementation business-oriented.
28 Service Level Management
IT representativesThere are many responsibilities for this role, and they are typically fulfilled by more than one person. The responsibilities include:
� Providing systems management information such as hardware and operating systems, network infrastructure, application monitoring tools, and so on
� Describing the IT components of the business service
� Providing information about the day-to-day operation of the business components
� Providing feedback from customers to the overall SLM implementation process
This is typically the service desk or customer support group with a primary line of communication to the service users.
� Providing the business impact of problem and change management
� Taking on the role of technical lead for the tools used in an SLM implementation
This group should have or be ready to learn the skills required to deploy the actual tools to be used, as described in 2.3.3, “Implementing service level management tools” on page 38.
2.2.2 Understanding the servicesThe purpose of the activities described in this section is to improve the delivery of services to customers. You cannot do this without a clear understanding of what customers want and what they are getting now. This section establishes a high-level definition of the requirements.
When understanding the service, the people identified in 2.2.1, “Identifying roles and responsibilities” on page 26, should participate in the activities described in this section. Most of the information comes from the business representatives, who understand what needs to be provided in terms of services to meet the needs of the customers. The information also comes from the IT representatives, who understand what it takes in terms of IT resources to support the business processes. The business representatives provide the functions of the services. The IT representatives provide information about the underlying IT components of the service. The service level manager, who understands both business and technical aspects, is an important participant as well.
One way to obtain the required information is to arrange interviews with the right people, to feed back what was said, and check that you understand it correctly before moving on to the next stage. Another way to obtain the information is to
Chapter 2. General approach for implementing service level management 29
have moderated discussions with multiple people so that information and expectations can be level set among the business and IT participants.
Defining servicesFor the purpose of this redbook, a service is defined as a logical grouping of IT systems and applications that together deliver one or more functions to one or more users. From the IT perspective, it is a set of applications that serve a specific business objective with each application comprising of components made of IT resources. From the business perspective, a service is the mapping of IT resources to business processes.
According to the ITIL, a service is the IT system or systems that enable customers and users to implement business processes. For more information about the ITIL definition, see the SLM chapter in the ITIL Service Delivery book. This chapter also introduces and encourages the use of a service catalog.
A high-level example definition of a service is as simple as this:
� My service is online banking.� My service is a travel reservation system.� My service is a payroll system.
To complete the definition of the service, you must now have an understanding of the underlying IT components that make up the service. Typically, a component represents a machine or an application with multiple event sources mapping to it. It is important to know what applications make up the components and how these applications relate to other applications, including dependencies. The following list provides suggestions to assist in defining the business service:
� Business information
– List the functions provided by the service. You may have to speak about applications if the concept of service is unfamiliar.
– Describe the relationships between the functions. Provide a schematic that describes how each function is integrated to create the service. The schematic may include a business flow diagram.
� Technical information
– Name the applications or components that deliver the service.– State the purpose of each application or component.
Note: It is possible for a service to be made up of other services. For example, online banking can be a service that is made up of services for checking balances, depositing funds, withdrawing funds, and so on.
30 Service Level Management
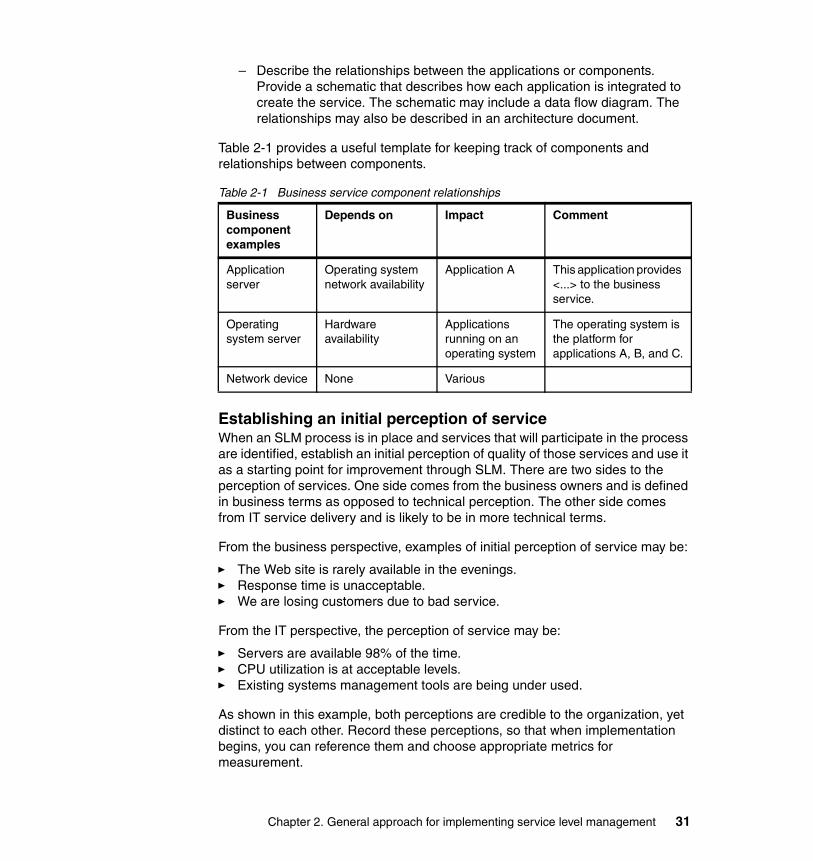
– Describe the relationships between the applications or components. Provide a schematic that describes how each application is integrated to create the service. The schematic may include a data flow diagram. The relationships may also be described in an architecture document.
Table 2-1 provides a useful template for keeping track of components and relationships between components.
Table 2-1 Business service component relationships
Establishing an initial perception of serviceWhen an SLM process is in place and services that will participate in the process are identified, establish an initial perception of quality of those services and use it as a starting point for improvement through SLM. There are two sides to the perception of services. One side comes from the business owners and is defined in business terms as opposed to technical perception. The other side comes from IT service delivery and is likely to be in more technical terms.
From the business perspective, examples of initial perception of service may be:
� The Web site is rarely available in the evenings.� Response time is unacceptable.� We are losing customers due to bad service.
From the IT perspective, the perception of service may be:
� Servers are available 98% of the time.� CPU utilization is at acceptable levels.� Existing systems management tools are being under used.
As shown in this example, both perceptions are credible to the organization, yet distinct to each other. Record these perceptions, so that when implementation begins, you can reference them and choose appropriate metrics for measurement.
Business component examples
Depends on Impact Comment
Application server
Operating systemnetwork availability
Application A This application provides <...> to the business service.
Operating system server
Hardware availability
Applications running on an operating system
The operating system is the platform for applications A, B, and C.
Network device None Various
Chapter 2. General approach for implementing service level management 31
The following list provides suggestions to assist in establishing the initial perception of service:
� Usage information
– Number of users of the service
– If applicable, a breakdown of function usage by company employees, business partners, the general public, etc.
– Patterns or hours of usage, including peak times
– How users access the service (Internet, intranet, extranet, legacy 3270 screens, etc.)
� The deficient and favorable points of current IT service delivery and how they are communicated to the IT organization
� The challenges faced by the business, including what is on the horizon by way of new or updated services
� Current issues with the business service functions
Table 2-2 provides a useful template for keeping track of usage information.
Table 2-2 Business service usage and perception
Establishing the expected and desired quality of serviceAt this stage of the planning phase of SLM implementation, the business owners may define the expectation of quality of the services to be provided to customers and users. Expectations to the quality of services can be motivated by several points, for example:
� Retain the existing customer base and attract new customers.� Cultivate customer loyalty.� Prove superior service against competition.
Expected quality of service also has an IT perspective, which is likely to be:
� Align the IT organization with the business views.� Increase visibility of improvements being done.� Maximize potential of systems management tools.
Feature Time of day Number of users
Method of access or type of user
Perception
TransactionA Morning <num> Intranet Good
TransactionB Noon <num> Internet Slow
TransactionC Evening <num> <method> Poor
TransactionD Midnight <num> <method> Excellent
32 Service Level Management
Record these expectations, so that you can address them during the assessment phase. Depending on the expectations to the quality of services, you can expect changes and improvements to the existing IT infrastructure.
Define the desired quality of services objectives that make sense, are measurable, and are achievable. This helps to define the success criteria of the entire SLM implementation.
2.2.3 Assessing the ability to deliverAfter you understand the service, assess the current operational environment by examining the IT infrastructure, and the existing and planned monitoring capabilities. This brings everyone to the same page and establishes a baseline for measurement. When this is completed, you may begin the implementation.
While information is collected, keep in mind the initial perception of service and the expected quality of service. The goal is to understand the components that provide the business service. It is also to understand the current IT infrastructure’s capabilities to deliver the services to the expected and desired quality. IT components are at a granular level and should be described in terms of specific applications, servers, and hardware. Management of the service is in terms of monitoring tools and can include specific monitoring thresholds.
Earlier this book described the business functions that made up the business service. This section breaks down these functions to help you understand how the IT resources affect them. It looks into the specific applications that are used to provide the function. It also looks at the network, hardware, and operating systems that run the applications.
Analyzing the existing infrastructureInsufficient capacity of the IT infrastructure to deliver services often leads to bottlenecks, performance problems, and, loss of availability, all of which contribute to degrading service delivery. Business components were identified in 2.2.2, “Understanding the services” on page 29. Now you must map these business components to IT components and verify the monitoring environment. Since several IT components make up the service, the capacity of each component must be balanced to the capacity of the other components. Capacity management processes must be in place to have a precise evaluation of the capabilities of the IT infrastructure.
This is a crucial step toward negotiating SLAs. SLM processes require the assessment of the IT infrastructure capacity needs to accommodate the customer requirements that will be recorded in SLAs. After SLAs are negotiated, SLM processes set the targets for the IT infrastructure to deliver, and capacity
Chapter 2. General approach for implementing service level management 33
management processes can report on the performance and throughput achievements for SLA evaluation.
Assessing the existing monitoring capabilitiesReview existing monitoring capabilities and upgrade them as necessary. Ideally you must do this ahead of, or in parallel with, the drafting of SLAs, so that monitoring can be in place to assist with the validation of proposed targets.
It is essential that monitoring matches the customer’s true perception of the service. Unfortunately this is often difficult to achieve. For example, monitoring individual IT resources, such as a server, does not guarantee that the service will be available to the customer. Without monitoring all IT resources in the end-to-end service, you cannot see a true picture.
Monitoring tools collect information about IT resources using predefined measurement metrics. Metrics are the standard of measurement or a measurable quantity, associated with guaranteed service levels to create SLOs. Metrics evaluate performance, availability, or utilization of IT resources, such as transaction response time, CPU, and disk utilization.
When implementing SLM, IT should choose the following tools to meet their design specifications:
� Identify measurement metrics required to measure the IT resources that make up the services.
� Use monitoring tools to provide the measurement metrics that need to be collected.
� Use reporting tools that process the data being captured and satisfy all levels of report recipients.
� Use analytical tools that provide aggregation and analysis of the collected SLM data in a manner that offers fast recognition of business impact and proactive response.
� Use administration tools that improve the productivity of the SLM operators and users as well as provide the integration of monitoring, reporting, and analytical tools.
Compare this list to the existing system management and monitoring tools already in place in the IT infrastructure.
In addition, organize the monitoring data collected by such tools and make it accessible to everybody with a stake in the SLM process. Analytics and reporting tools must be able to present this data in a manner that aligns the service views of both IT and their customers, allowing them to reconcile the customers’ perception of service with the service levels delivered by IT.
34 Service Level Management
IT wants to understand how resource performance and availability affects service levels and what adjustments are needed to improve service. Customers want to make sure that IT delivers availability and responsiveness to the critical applications that they use for automating their business processes. When their business process is impacted, they want IT to accurately report it so they can impose the negotiated penalties on IT.
Define a high-level design that provides an assessment of the existing monitoring capabilities as well as additional monitoring tools and processes. This forms a baseline for measurement of expected quality of services.
2.3 Implementing service level managementA successful implementation of the SLM strategy relies on the ongoing communication between an IT organization and business units. SLAs provide business representatives and the IT department with a common language to discuss goals, responsibilities, and management issues relating to IT services.
The planning stage produces a high-level design of the proposed SLM solution. It is based on an understanding of user demands and an IT assessment of feasibility to meet customers’ requirements for services. As a result, the implementation stage begins with the detailed design for this solution that defines the SLOs and outlines the solution deployment plan.
Based on this high-level design, an IT organization prepares SLOs, constructs SLAs, and negotiates them with users. At the same time, the IT organization begins the implementation of additional tools and makes adjustments to IT processes as required to support new functions.
2.3.1 Developing service level objectivesAn IT organization manages service levels based upon objectives outlined by SLAs. IT drafts SLOs based on business requirements and an IT organization’s assessment of its capabilities. Then it seeks approval from its customers through negotiation.
The starting point for SLAs is the business stating what IT services they need for the business to operate effectively. This may include both the minimum acceptable levels and the desirable levels. The IT department has to assess its capabilities to deliver at this level and negotiate with the customers.
Important: Do not include anything in an SLA unless you can effectively monitor and measure it at a commonly agreed point.
Chapter 2. General approach for implementing service level management 35
Achieving, or even approaching, the desirable level may require additional investment and may need to be addressed by a service improvement program. The negotiation stage is likely to be iterative.
SLOs are specifications of a metric that is associated with a guaranteed level of service that is defined in an SLA. The metric by which SLOs are defined, are often called service level indicators (SLIs).
From a business perspective, the most important objective is the availability and responsiveness of the service that IT provides to the business. Typically, IT responds to these business requirements by quantifying availability and performance:
� Availability: The percentage of the evaluation period when service was in an available state
� Performance: Usually represented by two SLIs such as responsiveness or speed and throughput or volume
Additional SLOs may include accuracy (whether the service does what it is supposed to do), cost, security, number of incidents, time-to-repair, etc. SLOs must meet the following criteria before you can include them in SLAs:
� Attainable: The objective is worthless if IT will never be able to meet it.
� Measurable: The objective is worthless if it cannot be measured.
� Understandable: Reported statistics must relate to the user experience.
� Meaningful: The objective must be relevant to all parties.
� Controllable: Do not include objectives that cannot be controlled.
� Affordable: The objective may require additional funding that sponsors are not willing to provide. Additional budget allocation is a business-level decision.
� Mutually acceptable: One party cannot simple dictate the terms of the agreement.
When developing an SLO, an IT organization needs to carefully select measurement metrics that are indicative of this SLO. For example, measuring availability from a user’s perspective is not a simple task. If an application is up and running, it does not mean that users can use it. If IT measures the availability of resources, it does not guarantee that this represents the actual user experience.
There is no perfect solution to this problem. Nevertheless an IT organization must use SLIs that can be directly measured. SLAs must document each chosen SLI that will represent each of the SLOs and specify its data source.
36 Service Level Management
2.3.2 Negotiating on service level agreementsSLOs set up the standards for measurements and determine requirements for monitoring tools. However, before they become a part of an SLA contract, an IT organization must settle with the business units on a mutual understanding of the SLOs and their targets.
In the process of negotiating SLAs, an IT organization and its customers exchange information and seek reasonable service level targets. The business units must clearly communicate their requirements and explain the business impact if the proposed service is not acceptable. IT must clearly communicate their assessment of the attainable service levels, the proposed SLOs, and their limitations, as well as explain the costs associated with offering a higher level of service.
When these negotiations are completed, IT must document the agreed upon SLOs and SLIs. Other components of the negotiated SLA may include:
� Term: Typically one to two years
� Scope: Business description, user locations, transaction volume, service hours
� Limitations: Transaction throughput, concurrent users, funding, etc.
� Remedies: Clearly defined penalties for non-performance; defined bonuses for delivering better than expected services
� Optional services: Current or future at additional cost
� Exclusions: Clear identification of what is excluded from this SLA
� Service variations: Different levels at different times, maintenance periods, etc.
� Reporting: Relevant, well understood list of all reports
� Administration: Description of ongoing effort and responsibilities
� Reviews: Validation of SLAs, SLM process, negotiate exceptions every six months
� Revisions: New SLAs possibly required for technology, workload, staffing, etc.
� Approvals: Assigned authority to approve changes and new SLAs
Chapter 2. General approach for implementing service level management 37
2.3.3 Implementing service level management toolsWhen planing for the SLM implementation, an IT organization performs an analysis of the existing management tools while assessing its capability to provide the measurements as required by the proposed SLAs. Any gaps in management tools must be investigated and further addressed as part of the SLO development and SLA negotiation activities.
Chapter 1, “Introduction to service level management” on page 3, introduces tools as one of four components of SLM. When implementing SLM, an IT organization must apply a strategy for the implementation of management tools based on goals for its SLM program, requirements for SLA measurements, IT culture and processes, and the overall benefits and cost of implementation.
The effectiveness of the SLM management tools depends on how they are applied and how the right combination differs with each organization. Typically, an IT organization wants to reuse existing tools and add more tools as required. Simply having tools is not enough. They need to be applied correctly, which means they must be integrated into a solution.
Typically, SLM uses a combination of traditional primary data collectors that capture data directly from the managed environment and secondary data collectors that extract data from primary data collectors. In addition, SLM needs data from monitoring tools that can simulate user experiences.
Implementing service level management monitoringIT organization implements monitoring tools as required to manage the hardware and software components it operates: network management tools, performance management tools, incident management tools, etc. These management tools gather data for a range of purposes, one of which is SLM where focus is on monitoring the state and performance of IT services. We previously defined a service as a set IT resources used in enabling a business process.
IT resources can be further grouped into a number of physical domains. Each physical domain is comprised of many subcomponent elements. The following list includes some of the major domains:
This simplistic view of IT domains does not account for the fact that each of these domains represents a number of different technologies integrated into complex configurations that can be managed by a variety of tools. However, when these domains are taken together, they control the quality of service. Therefore, it is necessary to install products for monitoring each domain.
From a functional perspective, SLM monitoring of the IT domains should include event monitoring, performance monitoring, usage monitoring, security monitoring, etc. In our illustration of a generic SLM implementation in this chapter, we do not address the specific monitoring tools. However, the following chapters demonstrate an example of SLM implementation using IBM Tivoli products.
The primary challenge before an IT organization, when it initiates the SLM program, is the question of which products to install and how to integrate them into the most suitable SLM solution. After IT completes the planning and the SLA negotiation phases, it usually has a clear understanding of the tools it needs to implement to support SLAs. It has already decided to acquire missing tools. When additional products are required, installing, customizing, and integrating the new products into the existing system management solution can be a significant part of the SLM implementation effort.
Since service can traverse multiple SLM domains, an IT organization must be able to view and evaluate the collected domain monitoring data for each supported service. In addition, SLM necessitates monitoring of user experiences of the delivered service through use of transaction monitors that can generate transactions and record their execution.
Implementing business service management toolsWith the SLM focus on service specific monitoring, an IT organization is forced to change its approach to organizing the data it collected from monitors. It must now expose the relationships of IT components to business process components and aggregate the monitoring data in a way that shows its impact on a company’s business.
Chapter 1, “Introduction to service level management” on page 3, introduces the business service management (BSM) approach and the way to incorporate it into SLM. BSM solutions are designed to improve the effectiveness of SLM through a variety of views, analytics, and automation.
The implementation of BSM is a complex project that takes time and resources, but it simplifies and improves the ongoing management of IT events and service levels in the context of their impact on business. The topic of BSM implementation and its role in improving SLM are covered in greater detail in the remaining chapters of this book.
Chapter 2. General approach for implementing service level management 39
2.3.4 Establishing a reporting functionService level reporting provides IT with a way to communicate the value and quality of its services. Reports are provided in formats that have been documented by SLAs and, therefore, are well understood by business managers. In addition to reporting service level performance, IT can use these reports to proactively address service difficulties.
The reports must be simple and focus on the specific requirements of SLAs. This includes reporting achieved SLOs based on actual values of SLIs. The SLA should include a list of reports that IT intends to use for reporting on SLA compliance. For each report, the SLA should document the content, data sources, service level metrics, distribution, and frequency.
In developing reports, an IT organization must categorize recipients based on their area of interest and responsibility. The requirements for each category may differ in perspective, presentation format, frequency, focus, and the granularity of information.
IT should tailor reports to the recipient level and report only information that customers can understand. However, IT should also keep the supporting information and make it available when customers request to examine the data more closely.
The three major categories of SLA report recipients are:
� Executive management
Executives want to see how IT provides value to their business and how the quality of IT services affects business efficiency (including cost of degraded service in real dollars and lost opportunities). As a consequence, the executive reports must be highly summarized and outline the quality of IT service experienced internally by business units and externally by customers and business partners. In addition, executive management should understand the impact and cost of degraded services.
These reports should use graphs and charts to communicate the overall assessment of the achieved service levels and relate their impact on business performance. Any experienced service difficulties should be explained with references to the support documentation as necessary.
� Business management
Business units are interested in understanding how the quality of IT service helps them to achieve their business goals and the impact and cost of degraded service. The service level reports should relate the quality of IT delivered service to the volume of business transactions, staff productivity and customers satisfaction. It is not an easy undertaking. When reporting the
40 Service Level Management
improved service levels, IT must relate this improvement to increase in business volumes, improved productivity, and better customer satisfaction.
The same can be said about service outages and degradation. IT needs to demonstrate their impact on business performance and costs.
� IT management
The service reports that IT distributes to business management should also be reviewed by all levels of IT management. This helps IT managers to understand how component failures and performance degradation affect service levels and impact business performance.
In addition, IT management should receive the traditional technology reports that report the outages and performance degradation of resources as well as the response time and volume of application transactions. Using time as a correlation factor for both technology and service level reports, IT managers can gain knowledge regarding how the technology area that they manage affects the overall quality of IT delivered services.
In addition to the SLA historical reporting (daily detailed reports, weekly summaries, monthly overviews, quarterly business summaries), an IT organization should implement the real-time alerting and proactive notification of customers and IT staff.
It is important for real-time alerting of service outages and degradation to show the components that cause the impact, which business users are affected, and communicate business impact. As explained in Chapter 1, “Introduction to service level management” on page 3, BSM is well suited to perform this function.
2.3.5 Adjusting IT processes to include service level managementWhen planning for the SLM implementation, an IT organization must review its management processes and identify any adjustments needed to satisfy the requirements of its new mission.
This provides an opportunity for IT to improve its responsiveness to business considerations as well as to improve its operation. Using the business knowledge it acquired during the SLM planning stage, IT can become more proactive in managing resources and establish priorities for its fault management process.
As IT implements new monitoring and management tools, it needs to revise the operational procedures and documentation, staff new functions, and train operation personnel. In addition, IT should use the SLM rollout as an opportunity to improve the existing management practices in the following areas.
Chapter 2. General approach for implementing service level management 41
Event managementBSM provides facilities that allow consolidation of all enterprise events and provide a single point for event management based on business priorities. This increases the value and productivity of the IT operation and service desk personnel. It also prompts IT to establish a control center function that will be responsible for managing events.
Availability managementSLM facilitates the transition from management of IT components to management of IT services and changes the metrics for measuring availability. When the underlying IT resources experience problems or become unavailable, the service may still perform satisfactory if resources are duplicated.
The focus of BSM on service state management significantly improves the understanding of services. It offers more robust capabilities to determine service states based on rules governing the impact of events received by the underlying resources.
Capacity management Monitoring the performance of IT physical domains, defined in 2.3.3, “Implementing service level management tools” on page 38, is a well established discipline in the majority of IT organizations. When implementing SLM, an IT organization requires additional aggregations of collected performance information to meet SLA obligations for reporting on the service level performance.
Important: There are some key benefits of well implemented event management processes. For example, IT management and business executives can evaluate the immediate business impact of IT events and understand how they affect SLA compliance. IT operations can prioritize fault management.
Important: When managing availability, an IT organization must focus on identifying critical events for each service that by definition impact this service availability. IT operations can significantly improve the availability of IT services through the proactive management of critical events.
Important: With BSM facilitating the mapping of resource-to-service relationships, an IT organization can improve its performance management processes by prioritizing the management of IT resources based on their business value. This approach also applies to proactively planning for additional capacity when service levels are in danger.
42 Service Level Management
Change managementAn IT organization uses the change management process to evaluate the impact of requested changes and, therefore, to reduce risk of pending requests. Both SLM and BSM can significantly boost the effectiveness of any change management process by supplying the criteria for risk evaluation, provided by SLAs, and facilitating impact visualization provided by BSM.
Incident managementSome SLAs include SLOs for measuring service desk responsiveness and IT handling of faults. Service levels may include a time value for problem escalations and a mean-time-to repair value. Every IT organization has some variation of an incident reporting system and escalation procedures.
BSM improves event management and incident recording. It provides capabilities for a proactive management of resources in need of repair. It often offers a bidirectional interface to a number of help desk solutions. Business focus of SLM and BSM enables an IT organization to improve its incident management process through timely recognition of faults, better understanding of their impact, and added value of SLA reporting.
Cost managementSLM uses SLAs as a mechanism for governing use of IT resources to ensure that IT services are performing according to the SLA specifications. Customers become aware of cost implications while negotiating SLAs.
An IT organization must balance service cost with service delivery. As the service provider, IT should use service pricing as the mechanism for accounting for resource usage by business units. However, both resource accounting and services charges become a contentious issue between IT and business units.
Important: An IT organization must adjust its change management process to evaluate implications of the requested changes on agreed service levels and understand their business impact.
Important: When implementing SLM, IT needs to integrate its manual processes and the help desk solution it uses for incident management with SLAs and BSM.
Important: When implemented, both SLM and BSM should have input into the cost management process. This enables an IT organization to establish the regulation of resource use based on business value and improve communication with business units when applying charges for services.
Chapter 2. General approach for implementing service level management 43
Application support Many enterprises have centralized all application development activities and infrastructure management activities under one IT organization. The scenarios in Part 2, “Case study scenarios” on page 195, use this model. IT development organizations typically develop and support such applications.
Application support staff work for IT development management and interface with both business and IT support departments. For this reason, application support people can greatly contribute to SLA development, while greatly benefitting from the SLM and BSM implementation.
Application support staff typically are well aware of the business process that IT is automating with its applications. The development organization often possesses the knowledge of service parameters such as the number of expected users, the expected response time, etc. In addition, the development organization may provide its own instrumentation to assist in managing performance of the applications that it implemented in support of business.
However, application support staff often lacks the knowledge of IT infrastructure and rely on IT support and operation staff when researching user problems.
2.4 Ongoing service level management programThe SLM implementation program has supplied documentation, management tools, and SLOs to measure against. An IT organization has also completed review of its processes, identified the required adjustments, and established management reporting in support of SLAs.
Now, the success of the SLM implementation hinges on the ongoing program of reporting, management, and improvements that aim to establish more trust between an IT organization and business units. SLAs provide a vehicle for communications and an instrument for management. IT must use both proactively in the ongoing effort to satisfy the SLM objectives through the following program of:
� Maintenance of service definitions� SLA management via historical reporting� Priority management of real-time faults
Important: Application support people must be included in both the planning and implementation of the SLM and BSM programs. They should be involved in the design of service compositions for both SLM and BSM and should provide further input during their ongoing application support activities.
44 Service Level Management
2.4.1 Maintenance of service definitionsAs mentioned earlier, while planning for SLM, an IT organization must decompose business processes into IT services. Through interviews, IT obtains the required knowledge and uses it to define services by creating business views of IT resources.
The SLM planning stage provides definitions of services and identifies the IT resource associations for each service. The initial business views of IT resources are created during the SLM implementation stage manually or automatically.
Business views are an important IT asset that must be protected and continuously updated. An IT organization must allocate resources to administer and continuously refine business views. This effort may vary depending on the SLM scope, tools, and the implementation strategy.
Follow these few recommendations for ongoing management of business views of IT resources:
� Implement in phases. Begin simple and expand. Refine as necessary.
� Visualize the obtained knowledge of IT physical resources and their dependencies.
� Visualize the obtained knowledge of business process components.
� Construct business views by mapping business process components and IT resources.
� While defining a business view, consider only IT resources that are important for this business view.
� While defining a business view, always understand what it is for and who is going to use it.
With the right tools, an IT organization can significantly improve the productivity of administering business views and their value for both IT and business units. BSM tools are designed to facilitate the creation and ongoing maintenance of business views as well as the rule-based dynamic mapping and management of relationships. Chapter 4, “Planning to implement service level management using Tivoli products” on page 109, addresses the use of business views in IBM Tivoli products in greater detail.
Note: It is critical to accurately represent business use of IT resources in IT environments where the IT resource configurations and workloads change rapidly. An IT organization must address this issue through automatic discovery of dynamic changes in business-to-resource relationships based on policy rules.
Chapter 2. General approach for implementing service level management 45
The ongoing administration of business views includes the following activities:
� Adding new business views upon requests from the IT change management team
� Adjusting business views upon addition of new resources� Deleting business views that are no longer needed� Ongoing maintenance of business views
2.4.2 Service level agreement management via historical reportingManual processes for producing SLA reports are labor intensive, time consuming, and prone to error so most organization want to automate SLA reporting. They do this by using custom reporting applications, but these are expensive to build and maintain. The best solution is to use off-the-shelf tools that can be configured to gather the required information and produce SLA reports automatically.
When negotiated, deploy SLAs for continuous monitoring and reporting. During the SLM implementation stage, an IT organization deploys monitoring tools that collect the negotiated measurement data from all IBM Tivoli Monitoring components that are covered by SLAs.
When deployed, monitor and report on SLAs in a timely fashion. The SLA terms include the time and frequency of reporting (for example within five business days of the first of each month, the end of each month, etc). Reporting metrics include daily or hourly summaries depending on the collection cycle.
SLA management relies on data deriving from multiple sources. This can either be collated via customized procedures (which are difficult and expensive to produce and maintain) or collected centrally with a mechanism such as the Tivoli Data Warehouse as discussed in Chapter 3, “IBM Tivoli products that assist in service level management” on page 53.
The goal of the SLA management is to report the status of services and their compliance to SLA agreements. Frequency of reporting may vary with the organization and user perception of the current service.
Here are a few examples of reporting requirements:
� Both business and IT executives may want to review their set of reports at least once a month.
� Business executives may want to be notified every time that the service level for their SLAs is breached.
� An IT director may want to be copied on all notifications to business executives and receive notifications of any trends toward violation within some future period (usually the next 24 or 48 hours).
46 Service Level Management
Without automation, ongoing SLA management often fails to deliver the intended value despite of the well planned and well executed implementation. It is unacceptable for business executives when an IT organization takes several weeks to consolidate technical reports into a combined view of service.
2.4.3 Priority management of real-time faultsIn the process of planning and implementing SLM, an IT organization defines services that it provides to automate business processes and documents the objectives for SLM in the SLAs contracts. According to the ITIL, SLM is the continuous process of measuring, reporting, and improving the quality of services but not specifically addressing the management part.
You can assume that ITIL’s focus is on the traditional management cycle through historical reporting and reviews for managing SLAs that we addressed in 2.2.2, “Understanding the services” on page 29. Service definitions provide alignment of IT resources and business processes that they support, enabling management of IT resources based on their business value.
The status of IT resources changes dynamically as they change state and receive normal and abnormal events. The ability of IT operations to handle the resolution of abnormal events (faults) hinges on the knowledge of their impact on business processes. Through understanding business value of IT resources, IT operations can manage real-time faults based on business priorities.
SLM state management should consider several factors before deciding the final state of each service, such as state and priority of the service components, importance of events and number of occurrences, recovery from faults through resource pooling, scheduled outage due maintenance, components being repaired, and so on.
An improvement in fault management by operations has a direct impact on service levels that are measured by the following SLIs:
� Service availability: Better definition of availability and more granular measurement improve quality of service levels.
� Component repair time: Faster recognition of problems and better understanding of their impact allow accelerated repairs and improved IT performance.
� Service desk responsiveness: Better understanding of faults, their priority, and impact allow better communication with users and improve their satisfaction.
Chapter 2. General approach for implementing service level management 47
� Cost of support: Better understanding of faults, their priority, and impact can significantly increase productivity of control center personnel and IT support staff.
Fault management by business priorities also improves quality of IT operations, increases productivity of root cause analysis, and provides more visibility of IT value.
Ongoing management for the effective priority management of real-time faults is not practical without BSM tools. The remaining chapters of this book provide detailed examples of priority management of real-time events by IBM Tivoli products.
2.5 Continuous improvement A central theme for the service level manager is continuous improvement of the implemented SLM processes. The improvement process for SLM must reflect the fact that business and IT requirements change constantly, users expectations tend to rise over time, and quality improvement must be proactive rather than reactive.
2.5.1 Improving quality of service levelsThe process of improving service levels begins by reviewing the deployment. It is followed by a continuous tuning effort and the periodic adjustment of SLAs to reflect business and IT changes.
Deployment review sessionThe planning and installation team must review the completeness and accuracy of service levels. The team must analyze the problems that impacted service levels but were not captured by tools. It must also adjust service definitions and measurement thresholds and investigate the need for additional monitors.
Ongoing improvement through tuningAn IT organization is likely to implement an ongoing effort to tune its definitions of services, measurement metrics, metrics data collection, automation policies, and performance of IT resources. In addition, IT can initiate a service level improvement program that is a more formal project to implement improvement actions derived from periodic reviews.
The initial rollout of SLM often includes a few important but simple SLAs. This is followed by a continuous expansion of SLAs, which in turn results in new requirements for service definitions, measurement metrics, and monitoring tools.
48 Service Level Management
IT management should work with business executives to immediately address any issues of user distrust of the reported service levels and use these issues as an opportunity for additional tuning.
Periodic reviews of service levelsBased on the ITIL definition, the ongoing service level improvement process includes periodic reviews of service achievements and maintenance of SLAs. The service level manager is responsible for facilitating this effort.
Analyze the results of ongoing monitoring and reporting service levels and periodically review them with customers. This is the appropriate time to discuss the service achievements and trends, issues of service perception, as well as opportunities for improvement.
Also review the existing SLAs periodically for service completeness and accuracy, as well as the relevance of targeted measurements and objectives.
2.5.2 Improving efficiency of service level management SLM interacts with other IT processes while providing business-oriented service. For more information, see Chapter 1, “Introduction to service level management” on page 3. The efficiency of SLM is determined by the level of its integration with other IT processes (including tools and skills) and the maturity of its program.
A natural maturation process of an IT organization that initiated SLM program involves the following stages:
� Evolution of monitoring (from component based to end-user experience based and then to service based)
� Management of service levels to reduce user impact of service degradations
� Proactive fault management based on business value
� Control service in an automated fashion to proactively detect and correct problems
� Proactive prediction of future business requirements and the associated resources that are e necessary to support business with the appropriate levels of service
� Integration of service management tools to enable IT users to decompose their business processes, automatically discover all supporting IT components, and review the quality of delivered service
Chapter 2. General approach for implementing service level management 49
2.5.3 Improving effectiveness of service level management For IT, taking a proactive approach is the best way to improve the effectiveness of its SLM program. An IT organization must recognize the fact that user expectations and business requirements will continue to increase over time. Another important factor for a proactive approach to SLM is that IT can sustain, rather than repair, service levels, so that:
� External customer revenue, cost-savings, customer satisfaction (corporate image) can be sustained.
� IT can be more efficient and plan problem fixes in a controlled and orderly fashion based on business needs rather than react to the next or what appears to be the biggest problem.
� Customers and internal clients are more loyal.
� SLA penalties are reduced.
Proactive improvement of service level management processAfter SLAs are in place, the SLM process acquires the service levels to strive for. However, simply reacting to problems and reporting the achieved service levels is the wrong approach. Only proactive improvement can guarantee continuous achievement of service levels. SLM includes the proactive development of the right policies, procedures, organizational structures, and personnel skills to improve service level quality and to ensure that business processes are not affected by any service difficulties.
Continuous improvement of the SLM process must focus on improving relationships with users while adding value to business processes through IT services. Every component of SLM must be examined regularly for improvement opportunity, and any improvement must be proactively communicated to users.
It is the responsibility of the service level manager to ensure that corrective actions are proactively developed and executed for all identified improvements. The service level manager plays the central role in facilitating improvement for all aspects of SLM operation. Activities include improving understanding of business processes, improving and calibrating SLAs, driving improvements in technology and operations, and improving communications with users.
Through a proactive approach to SLM, an IT organization can increase its credibility and receive more cooperation from business units.
Proactive response to business changesEvery service level manager must proactively seek information from users about pending changes in the existing business processes and communicate this information to IT management, so it can adjust IT resources as needed.
50 Service Level Management
IT must investigate any deviations in the existing service levels. If it finds that service violations resulted from changes in business volumes or user behavior, IT must proactively communicate its findings to business units and renegotiate service levels as necessary.
IT must also integrate the rollout of new business applications with its change management process and generate change requests for new service definitions and SLOs before deploying these applications in production.
Proactive management of service levelsChange is a constant factor in both business and IT environments. Maintaining a high quality of service requires a significant effort from any IT organization. It must anticipate the impact of changes while proactively improving its management of the existing SLAs, regulating resources, and managing user expectations.
Earlier this chapter addressed the service level improvement activities such as the ongoing tuning, the periodic reviews, and the service improvement program. The focus of this proactive effort is to ensure the most effective management of the existing SLAs to meet and even exceed the negotiated service levels.
Another aspect that contributes to the improvement of service levels involves the optimization of services, regulation of resources, fault management, performance tuning, etc. When executed proactively, these operational activities allow IT to maximize resource use in support of SLAs and improve service levels.
Improvement in service levels may lead to increased user expectations of service. A proactive approach to service level improvements allows an IT organization to market its achievements in maximizing the service levels that can be attained at current costs, and manage user expectations.
Proactive integration of tools and processesSLM allows an IT organization to integrate a number of ITIL processes while applying business knowledge to managing IT infrastructure. Appendix A, “Service management and the ITIL” on page 447, describes service management in great detail. The ITIL processes and the tools to support them continue to evolve. Most companies still have significant integration issues with available commercial products while trying to use these products for SLM.
IT must proactively research new technologies and enhance its practices based on the experience of others. IT organization should always look for new solutions that provide better alignment between the IT organization and business units that are more suitable for SLM. These solutions must provide more intelligent analytics, a broader scope of data sources, and visualization of business and IT components and their relationships.
Chapter 2. General approach for implementing service level management 51
Most management solutions today typically require a significant customization. Integrating them with IT processes to provide SLM is a difficult and laborious effort. Chapter 1, “Introduction to service level management” on page 3, introduces a business-oriented approach for managing IT services or BSM and the value of its integration with SLM. A proactive approach of process and tools integration around a single set of service definitions can significantly improve the efficiency and the effectiveness of any SLM program.
The remainder of this book demonstrates, via detailed examples and case studies, an SLM solution design that involves monitoring IT resources, monitoring of user experiences, event correlation as well as BSM automation, analytics, and reporting. Two test cases describe the integration of eight Tivoli products in support of two different SLM initiatives.
52 Service Level Management
Chapter 3. IBM Tivoli products that assist in service level management
Chapter 2, “General approach for implementing service level management” on page 23, provides a generic approach to implementing service level management (SLM) processes. This chapter describes the key IBM Tivoli products used to implement them. It includes high level descriptions of the following products and how they integrate to provide an SLM solution:
� IBM Tivoli Business Systems Manager V3.1� IBM Tivoli Service Level Advisor V2.1� Tivoli Data Warehouse V1.2� IBM Tivoli Monitoring for Transaction Performance V5.3� IBM Tivoli Enterprise Console V3.9� IBM Tivoli Monitoring V5.2
3.1 IBM Tivoli product mappingFigure 3-1 shows a high-level representation of the IBM Tivoli products that can help to implement SLM. This chapter considers the two layers of components and describes the products that fit into each layer. The layers are:
� Monitoring and measurement metrics� Service level management
Figure 3-1 Product mapping
3.1.1 The monitoring and measurement layerThe IBM Tivoli products in this layer monitor and measure the behavior of the IT infrastructure. They address two aspects of systems management:
� Availability management
This includes products that monitor software and system resources to determine their availability. These products also provide functionality for event correlation across multiple platforms; assistance with determining the root cause of problems based on information gathered from multiple sources; automatic correction of problems; and automatic notification of support personnel.
Service Level Management
Monitoring and Measurement Metrics
Real Time Management
- IBM Tivoli Business Systems Manager
Predictive Management
- IBM Tivoli Service Level Advisor- Tivoli Data Warehouse
Availability
Event Correlation and Automation
- IBM Tivoli Enterprise Console- IBM Tivoli Monitoring for Transaction Performance- IBM Tivoli NetView
Performance
Monitor Systems and Applications / User Experience
- IBM Tivoli Monitoring for transaction Performance- IBM Tivoli Monitoring- IBM Tivoli Monitoring for Databases- IBM Tivoli Monitoring for Business Integration- IBM Tivoli Monitoring for Web Infrastructure
54 Service Level Management
The IBM products directly relevant to SLM are:
– IBM Tivoli NetView® Family– IBM Tivoli Enterprise™ Console– IBM Tivoli Monitoring for Transaction Performance
� Performance management
This includes products that measure the internal performance of systems and applications. They also provide information about the experience of end- users. The functionality includes continuous monitoring and recording of information, raising alerts when thresholds are exceeded, and gauging user experience by making response time measurements and running synthetic transactions. These products can monitor hardware databases and applications.
The IBM products directly relevant to SLM are:
– IBM Tivoli Monitoring for Transaction Performance– IBM Tivoli Monitoring– IBM Tivoli Monitoring for Database– IBM Tivoli Monitoring for Business Integration– IBM Tivoli Monitoring for Web Infrastructure
3.1.2 The service level management layerThis layer contains components to enable organizations to closely align IT with business goals, meet service level commitments, ensure peak business service performance, and reduce support and licensing costs. They also help customers to focus limited resources on the most important areas of the business.
The products in this layer address two aspects of systems management:
� Real-time management
This includes products to evaluate the health of business functions in near-real time to alert operational personnel of service failures or degradation. The relevant product in this group is IBM Tivoli Business Systems Manager.
� Predictive management
This includes products to collect performance and availability metrics and compare them with service level objectives (SLO). The relevant products are:
– IBM Tivoli Service Level Advisor– Tivoli Data Warehouse
Chapter 3. IBM Tivoli products that assist in service level management 55
3.2 IBM Tivoli Business Systems ManagerIBM Tivoli Business Systems Manager is part of the IBM’s business service management (BSM) portfolio of products that provides intelligent management software to enable businesses to optimize their operational agility. For more information about IBM Tivoli Business Systems Manager, refer to IBM Tivoli Business Systems Manager Getting Started Guide, SC32-9088
3.2.1 Business goalsTypical business goals addressed by IBM Tivoli Business Systems Manager are:
� Aligning IT operations with business priorities to maximize business value� Optimizing IT resources to help manage costs� Maximizing efficiency to drive productivity and revenue� Optimizing service availability to achieve enhanced customer satisfaction
3.2.2 High level description and main functionsIBM Tivoli Business Systems Manager is a near real-time, event-driven systems management product. It can manage and monitor systems, applications, middleware and other related systems management components in a business context. Traditional systems management tools focus on technology and deliver only fragmented views of the health of the enterprise infrastructure. IBM Tivoli Business Systems Manager works in conjunction with IBM and third-party systems management tools to analyze the impact of faults and outages on business services.
IBM Tivoli Business Systems Manager provides your operations technicians with a view of IT infrastructure components as they relate to your overall business. It also provides your executives with a high level view of the status of critical services in your organization.
Main functionsThe main functions of IBM Tivoli Business Systems Manager are:
� Console consolidation
IBM Tivoli Business Systems Manager provides a consolidated view of systems management information derived from a wide range of existing IT management solutions and IT platforms. In doing so, it enables you to maintain the value of existing tools while reducing complexity. For a full list of supported platforms and systems management tools, see IBM Tivoli Business Systems Manager Getting Started Guide, SC32-9088. This list includes:
56 Service Level Management
– Distributed systems products
• IBM Tivoli Enterprise Console® 3.7.1 or later• IBM Tivoli NetView Version 7.1 or later• IBM Tivoli Monitoring Version 5.1 or later• IBM Tivoli Monitoring for Database, Application, Business Integration,
Web Infrastructure, and Collaboration• IBM Tivoli Monitoring for Transaction Performance Version 5.1 or later• BMC Patrol Version 3.4• Computer Associates Unicenter TNG Versions 2.1, 8 2.2, and 2.4• NetIQ AppManager Server Version 4.02• Hewlett-Packard Openview Network Node Manager for Solaris and
HP/UX
– z/OS products
• IBM Tivoli System Automation for z/OS Version 2.3• IBM Tivoli NetView for z/OS Version 5.1• IBM Tivoli Workload Scheduler for z/OS Version 8.1 or later• IBM Tivoli OMEGAMON® products• Various third-party schedulers and other systems management
products from BMC, Computer Associates and Allen Systems Group
� Monitoring from a business services perspective
IBM Tivoli Business Systems Manager provides monitoring capability for a complex combination of system resources across multiple platforms. As a result, it provides views that reflect the business services being provided across the enterprise.
� Executive awareness of service status
By providing executive dashboards that reflect the status of business services, IBM Tivoli Business Systems Manager provides executives in your organization with a clear and simple view of the status of their key business services.
� Impact analysis and critical path management
IBM Tivoli Business Systems Manager provides views that clearly show the impact of faults in the infrastructure on business services. In doing so, it facilitates prioritization of fault resolution effort based on business impact. It also helps with the identification of single points of failure.
� Root cause analysis
The various views and reports available in IBM Tivoli Business Systems Manager can be used to assist the process of root cause analysis. The Business Impact view shows resources that are affected by a fault and their relation to the resource with the fault. Also the Event View displays the events that triggered the resource state change.
Chapter 3. IBM Tivoli products that assist in service level management 57
� Reporting
IBM Tivoli Business Systems Manager provides standard reports out of the box. It also provides a process to export systems management data to the Tivoli Data Warehouse for analysis.
� Basing service level agreements (SLAs) on business services
The close coupling of IBM Tivoli Business Systems Manager with Tivoli Data Warehouse and IBM Tivoli Service Level Advisor enables construction of SLAs based on the availability of business systems using out-of-the-box interfaces.
� Visibility of SLA breaches and trends
The Tivoli Data Warehouse and IBM Tivoli Service Level Advisor interfaces also enables SLA breaches and trends to be made visible in executive dashboard views.
� Resource discovery
IBM Tivoli Business Systems Manager includes several tools to assist in discovery of resources present in an enterprise to reduce implementation time and costs. See “Resource discovery” on page 61.
3.2.3 Benefits of using IBM Tivoli Business Systems ManagerTable 3-1 summarizes the advantages and business benefits of using the key features of Tivoli Business Systems Manager.
Table 3-1 Benefits and advantages of Tivoli Business Systems Manager features
Features Advantages Benefits
Provides business context for IT, enables greater accountability to business user needs, and improves ability to prioritize and optimize
Allows IT staff to view IT resources in the context of critical business services and prioritize actions based on business impact and make intelligent trade-offs
Provides a business context for IT; enables greater accountability to business user needs; improves ability to prioritize and optimize
Shows the relationship between applications
Allows IT staff to make intelligent trade-offs, to easily spot inefficiencies and problems, and to quickly diagnose the root cause of complex failure scenarios
Increases availability (uptime) of critical business systems
Automatically discovers and builds graphical views of applications
Allows for the placement of discovered resources into containers that represent critical business systems and applications
Speeds implementation time; reduces errors; ensures currency and accuracy of management view
58 Service Level Management
3.2.4 Key concepts in IBM Tivoli Business Systems ManagerTo understand Tivoli Business Systems Manager, you must be familiar with the following concepts:
� Business systems� Business system views� Work spaces� Resource discovery� Event processing and propagation
Business systemsImagine a Web-based insurance application. The infrastructure for the service may consist of a set of applications running on UNIX and Microsoft® Windows® 2000 servers. Some may be outside the company intranet and others behind firewalls, legacy mainframe database systems, miscellaneous load balancers and other network devices, and diverse other components. Together they deliver the service that customers know as Online Insurance.
A IBM Tivoli Business Systems Manager business system is a logical container or folder that is populated with resources representing IT components. In this example, IBM Tivoli Business Systems Manager represents Online Insurance as a business system that contains icons that represent the resources that deliver the service.
Business systems can be created manually from the console, automatically by giving IBM Tivoli Business Systems Manager a set of rules, or via Extensible Markup Language (XML) files. For full details, see Chapter 4, “Planning to implement service level management using Tivoli products” on page 109.
There are three aspects of a business system:
� Resources: The group of resources that provide the business function� Relationships: The hierarchical relationship between the resources� Propagation rules: The method of dealing with events that affect the
resources
Dynamically adjusts the business system view for components added, modified, or deleted
Automatically keeps the business system view up-to-date by avoiding the problem of manual entry leading to obsolete information displays
Reduces errors and improves productivity
Features Advantages Benefits
Chapter 3. IBM Tivoli products that assist in service level management 59
Business systems may be built for different purposes, for example:
� Service based: A business system that contains a set of applications and other resources that support a service such as internet banking
� Department based: A business system that contains all resources supporting the accounting department
� Technology based: A business system that contains all UNIX servers in the enterprise
� Geographically based: A business system that contains all applications for the Europe, Middle East, Africa (EMEA) region
Business system viewsIBM Tivoli Business Systems Manager displays business systems in business system views. These are used to monitor the availability of resources and the service as a whole. They also helps to visualize the hierarchical relationships between the components.
There are several types of business system views for different purposes. They represent the information about business systems in different ways.
� Tree view: Displays resources in a tree format
� Hyperview: Displays resources in an navigable elliptical view with a selected resource as the launch point
You can use this view to quickly navigate complex business systems using the mouse.
� Table view: Displays resources in a table and provides sorting and filtering options
� Topology view: Displays representations of the relationships between resources
IBM Tivoli Business Systems Manager can provide users with views appropriate to their responsibilities. It is a simple matter to configure one view for a specific user, such as the manager of the Web services group, and a different one for a group of users, such as the internet banking support team.
60 Service Level Management
Work spacesThe IBM Tivoli Business Systems Manager systems administrator can design different work spaces for users. The workspace setup determines what individual users will see when they log on.
The systems administrator must design work spaces carefully to reflect the roles of the people using them. They must also focus the attention of support staff on the most important business services. A help desk may need a work space that includes a business system view based on the physical organization of systems and applications. But a CIO may want a work space that shows all the business processes in the enterprise, at a lower level of detail than the help desk.
Resource discoveryBefore IBM Tivoli Business Systems Manager can monitor a resource, it must be aware of its existence, understand what type of resource it is, and know where it belongs in the enterprise. Even a medium-sized enterprise contains too many resources to record manually, so IBM Tivoli Business Systems Manager provides several mechanisms for discovering resources:
� Bulk discovery: This runs as a batch job on z/OS systems. It also sends information about discovered resources to the IBM Tivoli Business Systems Manager database where Load/Discover scheduled jobs are run to complete the processing.
A similar bulk discovery process is provided for Tivoli Workload Scheduler for z/OS, and for distributed systems resources instrumented with monitors. They communicate through the IBM Tivoli Business Systems Manager common listener interface, including IBM Tivoli NetView and CA Unicenter TNG.
� Rediscovery: This is similar to bulk discovery, except that resources already in the database are ignored. It is essentially a delta discovery.
� Auto discovery: When enabled, this process automatically discovers certain types of resources, including DB2®, IMS™, and CICSPlex® resources.
Similar script-driven processes are available to drive delta discoveries for resources instrumented though the common listener interface and the set of IBM Tivoli Monitoring products.
� Discovery by event: This process discovers resources that were not previously identified from messages and exceptions sent to IBM Tivoli Business Systems Manager. If an event is received for an unknown resource, the discovery process creates the resource and posts the event to it.
Chapter 3. IBM Tivoli products that assist in service level management 61
Event processing and propagationChapter 4, “Planning to implement service level management using Tivoli products” on page 109, describes how IBM Tivoli Business Systems Manager processes events in detail. Events are sent to IBM Tivoli Business Systems Manager from both z/OS and distributed systems environments:
� z/OS events are forwarded to IBM Tivoli Business Systems Manager via the Source/390 address space on the z/OS machines.
� Distributed systems events are passed to IBM Tivoli Business Systems Manager via the Tivoli Enterprise Console or common listener interface.
When an event is forwarded to IBM Tivoli Business Systems Manager, it is associated with the resource representing the object in the real-world that gave rise to it, for example a CICS® transaction. The resource is included in one or more business systems that form a hierarchy of folders representing services.
The IBM Tivoli Business Systems Manager propagation engine then examines the priority of the event and compares it with the tolerance rates set for the resource. If the tolerance rate is exceeded, the propagation engine takes escalation action by sending a further event (called a child event) to the parent objects in the hierarchy. This process continues iteratively until all escalation steps are considered. This process is called event propagation. It is the key component of IBM Tivoli Business Systems Manager’s ability to assess the business impact of events.
3.2.5 IBM Tivoli Business Systems Manager architectureFigure 3-2 shows a simplified architecture diagram for Tivoli Business Systems Manager. For more information, see IBM Tivoli Business Systems Manager Getting Started Guide, SC32-9088.
62 Service Level Management
Figure 3-2 Tivoli Business Systems Manager flowchart
IBM Tivoli Business Systems Manager serversIBM Tivoli Business Systems Manager is implemented on a set of Intel® servers running Windows 2003 or Windows 2000. The exact number of physical servers required depends on the size and type of enterprise being managed.
IBM Tivoli Business Systems Manager Installation and Configuration Guide, SC32-9089, provides guidance on hardware and software prerequisites and physical placement of the following logical servers:
� Database server: This is based on the Microsoft SQL Server and hosts the IBM Tivoli Business Systems Manager data repository.
� History server: Actions and events from IBM Tivoli Business Systems Manager are regularly archived to this server for reporting and auditing purposes. Using a separate server for reporting improves the performance of the main database server and speeds up production of reports.
z\OS
TBSM Servers
TivoliManagementRegion
Source/390
Host IntegrationServer
Event HandlerServer
PropagationServer Database
Server
HistoryServer
ConsoleServer
Common ListenerService
AgentListener
Tivoli DataWarehouse
Web Console
Console
Distributed DataSource.
( Netview, ITM)Task Server TEC
Event Enablement
Web ConsoleServer
Health MonitorServer
Tivoli NetViewfor z\OS
Health MonitorClient
Chapter 3. IBM Tivoli products that assist in service level management 63
� Console server: This supports IBM Tivoli Business Systems Manager Clients using the Java™ console.
� Propagation server: This performs impact analysis on events received by IBM Tivoli Business Systems Manager to determine what business systems are affected. Events are propagated to higher level business system objects in accordance with the business system hierarchy and propagation rules.
� Event handler server: This processes events coming to IBM Tivoli Business Systems Manager from z/OS environments if these are being managed.
� Host integration server: This is required if IBM Tivoli Business Systems Manager is to process events from z/OS machines that do not have TCP/IP communications protocol installed. It handles Systems Network Architecture (SNA)-based communications used on legacy systems. In practice, most client implementations of Tivoli Business Systems Manager do not require this service.
� Web Console application server: This supports clients accessing IBM Tivoli Business Systems Manager with a Web browser-based console. The Web console provides many of the views available to users of the Java console and is suitable for many types of users.
� Health monitor server: This monitors the health and availability of the other IBM Tivoli Business Systems Manager servers and their related components.
3.3 IBM Tivoli Data WarehouseTivoli Data Warehouse provides a central repository in which you can store data about your IT infrastructure, including network devices and connections, desktops, hardware, software, events, and other information. Stored data is subsequently analyzed and used to produce reports about the behavior of IT components and services.
For more information about Tivoli Data Warehouse, refer to Introduction to Tivoli Data Warehouse, SG24-6607.
Important: Tivoli Data Warehouse is not an independent product. It is delivered free with all Tivoli Data Warehouse-enabled applications. All enabled Tivoli source applications are shipped with the necessary Tivoli Data Warehouse components to import their data into the central data warehouse.
64 Service Level Management
3.3.1 Business goalsTypical business goals addressed by Tivoli Data Warehouse are to:
� Provide a cost-effective means of storing systems management information
� Provide a basis for analyzing the IT infrastructure to achieve the best business value
� Provide a basis for SLA reporting
3.3.2 High level description and main functionsUsing Tivoli Data Warehouse, you can store, in one place, data about your IT infrastructure, including network devices and connections, desktops, hardware, software, events, and other information. Depending on the data stored, you can analyze your IT costs, performance, and other trends across your enterprise. You can also show the value and return on investment (ROI) of Tivoli and IBM software. And you can use it to identify areas where you can be more effective.
Moving data from operational data stores into a data warehouse keeps them running efficiently while preserving historical data for analysis over longer periods of time. Tivoli Data Warehouse comes with database optimizations for the efficient storage of large amounts of historical data and fast access to data for analysis and report generation, and the infrastructure and tools necessary for maintaining the data in the warehouse. Tools include the Tivoli Data Warehouse application, IBM DB2 Universal Database™ Enterprise Edition, IBM DB2 Data Warehouse Center, and IBM DB2 Warehouse Manager.
Tivoli Data Warehouse uses an open architecture to store, aggregate, and correlate historical data. This enables you to include data from your own applications and third-party systems management products as well as data from IBM Tivoli products.
If your enterprise supports multiple customers, you can keep the data in a single data warehouse, but restrict access rights so that customers can see and work with only their own data and reports. You can also restrict access rights at the level of an individual.
Crystal Enterprise Professional V.9 is included for production of reports. You can also analyze your data using any product that performs online analytical processing (OLAP), planning, trending, analysis, accounting, or data mining. The user interfaces are available only in English, French, German and Japanese. However reports can be translated into other languages as listed in Installing and Configuring Tivoli Data Warehouse version 1.2, GC32-0744-02.
Chapter 3. IBM Tivoli products that assist in service level management 65
Main functionsThere are four main functions within Tivoli Data Warehouse.
� Importing data from source applications: This involves running a source Extract-Transform-Load (ETL) program, commonly referred to as an ETL1, to move operational data from the source location into the central data warehouse. Data is condensed as this is done.
� Preparing data for use in reporting: This involves running a target ETL program, commonly known as an ETL2, to prepare data and move it into a data mart ready for use by the target reporting application.
� Design and production of reports: Apart from producing simple reports, this is done using the functionality of the reporting or business intelligence tools rather than the Tivoli Data Warehouse itself.
� Housekeeping: Various housekeeping jobs are run to maintain the database and archive old data at a predetermined point.
Many IBM Tivoli products are delivered with warehouse enablement packs (WEPs), which provide the ETLs needed for the previously listed processes. The concepts of ETLs and data marts are explained further in 3.2.4, “Key concepts in IBM Tivoli Business Systems Manager” on page 59.
3.3.3 Benefits of using Tivoli Data WarehouseTable 3-2 summarizes the advantages and business benefits of using the key features of Tivoli Data Warehouse.
Table 3-2 Benefits and advantages of Tivoli Data Warehouse features
Features Advantages Benefits
Central repository for systems management data
Can correlate and analyze data from various monitors in one place
Added value through cross-platform, business oriented reports based on an end-to-end view of the enterprise
Data consolidation Reduced data storage costs and easier data management; a common data model
Cost savings and data consistency for reporting purposes
Open, proven, and out-of-the box interfaces for many IBM Tivoli products
No need to develop data extraction programs
Cost savings through reduced interface development and testing costs
Being built on a relational database management system (RDBMS) architecture provides a high degree of scalability
Data warehouse can handle data for large enterprises
The warehouse can grow with the organization
66 Service Level Management
3.3.4 Key concepts in Tivoli Data WarehouseTo understand Tivoli Data Warehouse, you need to be familiar with the concepts of ETL programs and data marts.
ETL programsETL programs process data in three steps.
1. Extract: Data is extracted from the data source.
2. Transform: Data is validated, transformed, aggregated, and cleansed so that it fits the required format.
3. Load: The processed data is loaded into the target database.
In Tivoli Data Warehouse, there are two types of ETLs whose operation is shown in the diagram in Figure 3-3.
� Central warehouse ETL: Otherwise known as a source ETL or ETL1, this ETL extracts the data from the source applications and loads it into the central data warehouse.
� Data mart ETL: Otherwise known as target ETL or ETL2, this ETL loads data into data marts and is discussed in the next section.
Ability to use many analysis and reporting tools
Provides the ability to use the reporting tool of choice for the organization
Flexibility and standardization
Out-of-the-box reports for IBM Tivoli applications
Standard reports delivered with IBM Tivoli applications may be sufficient for many purposes
Reduced cost of designing and producing standard reports
Integration with IBM Tivoli Service Level Advisor
Out-of-the-box interface enables rapid development of SLAs based on data in the warehouse
Rapid development of SLAs
Built-in security Ability to segregate data for different customers using out-of-the-box functionality
Ability to use one data warehouse for multiple customers to reduce costs and maintenance
Features Advantages Benefits
Chapter 3. IBM Tivoli products that assist in service level management 67
Figure 3-3 Tivoli Data Warehouse ETLs
Data martsAlthough it is possible to run a query against the entire central data warehouse, this is inefficient because of the large volume and range of data that builds up over time. Instead, data is prepared in advance for use in target applications, such as Crystal Reports, and placed in a data mart.
A data mart is a subset of the historical data that satisfies the needs of a specific department, team, or customer. It is optimized for interactive reporting and data analysis. The format of a data mart is specific to the reporting or analysis tool you plan to use. Each application that provides a data mart ETL creates its data marts in the appropriate format.
The data mart ETL extracts a subset of historical data from the central data warehouse that contains data tailored to and optimized for a specific reporting or analysis task. The data mart ETL is also known as target ETL or ETL2.
3.3.5 Tivoli Data Warehouse architectureFigure 3-4 shows the high level architecture of the Tivoli Data Warehouse in diagram form.
Although Tivoli Data Warehouse can be implemented on the z/OS platform, most implementations are on distributed systems platforms. Only these are discussed in this redbook. For further information about the various possible configurations, see Implementing Tivoli Data Warehouse V 1.2, SG24-7100.
Data Source ETL1
Data MartsData MartsReporting
Data Marts
Central DataWarehouse(schema)
ETL2
Service Level Advisor
SLAData Marts
ETL2
Web-based Reports
Data Source ETL1
Data MartsData MartsReporting
Data Marts
Central DataWarehouse(schema)
ETL2
Service Level Advisor
SLAData Marts
ETL2
Web-based Reports
68 Service Level Management
Figure 3-4 Reporting with Tivoli Data Warehouse
Tivoli Data Warehouse is implemented on a set of Intel or UNIX servers. The exact number of physical servers required depends on the size and type of the enterprise that is being managed. Tivoli Data Warehouse Release Notes Version 1.2, SC32-1399, provides guidance about hardware and software prerequisites, as well as the physical placement of the logical servers.
Figure 3-4 gives an overview of the Tivoli Data Warehouse 1.2 architecture and supported software components. The architecture can be comprised of the following elements:
� Tivoli Data Warehouse Control Center Server� One or more central data warehouse databases� One or more data mart databases� IBM DB2 warehouse agents and agents sites� Crystal Enterprise server
The following sections explain each of these elements in detail.
Central DataWarehouse Data MartData MartData MartData MartStar Schema
Data MartData MartData MartData MartStar Schema
DB2 UDB EE & DB2/390
Applications’Data Store
WM Agent
ETL1ETL2
Web-based Reports
AIX,Sun Solaris, NT/2K, MVS
AIX,Sun Solaris, HP-UX,NT/2K, OS/390, Turbo,
RedHat and SuSE Linux
IE 5.5 SP2 & 6.0Netscape 6.2.3
TDW 1.2 Control Center
Web Server
CrystalEnterprise
Server
Win NT/2000/2003
Win NT/2000
IBM HTTP ServerIIS v4 & v5
iPlanetLotus Domino
Crystal ePortfolio
Data Mart
Chapter 3. IBM Tivoli products that assist in service level management 69
Tivoli Data Warehouse Control Center ServerThe control center server is the system that contains the control database for Tivoli Data Warehouse. It is the system from which you manage your data. The control database contains metadata for both Tivoli Data Warehouse and for the warehouse management functions of IBM DB2 Universal Database Enterprise Edition. There can only be one control server in a Tivoli Data Warehouse 1.2 deployment.
Source databasesA source databases holds operational data to be loaded into the Tivoli Data Warehouse environment. Typically, the source databases are application specific and their number is likely to increase for a Data Warehouse installation.
Most Tivoli products provide a WEP, which makes application-specific data available in a source database. This can be a dedicated warehouse source database since it is coming with IBM Tivoli Monitoring. Or it can be an interface to the application’s built in database as provided for IBM Tivoli Storage Manager or IBM Tivoli NetView. A WEP for Tivoli products also includes the means to upload data from the source database to the central data warehouse, minimizing the efforts for data collection.
Central data warehouseThe central data warehouse is a set of IBM DB2 databases that contains the historical data for your enterprise. You can have up to four central data warehouse databases in a Tivoli Data Warehouse 1.2 deployment.
Data martsA separate set of IBM DB2 databases contains the data marts for your enterprise. Each data mart contains a subset of the historical data from the central data warehouse that satisfies the analysis and reporting needs of a specific department, team, customer, or application. You can have up to four data mart databases in a Tivoli Data Warehouse 1.2 deployment. Each data mart database can contain the data for multiple central data warehouse databases.
A WEP for a Tivoli application provides all necessary means to fill data marts with their specific data.
70 Service Level Management
Warehouse agents and agent sitesThe warehouse agent is the component of IBM DB2 Warehouse Manager that manages the flow of data between data sources and targets that are on different computers. By default, the control center server uses a local warehouse agent to manage the data flow between operational data sources, central data warehouse databases, and data mart databases. You can optionally install the warehouse agent component of IBM DB2 Warehouse Manager on a computer other than the control center server.
Typically, you place an agent on the computer that is the target of a data transfer. That computer becomes a remote agent site, which the Data Warehouse Center uses to manage the transfer of Tivoli Data Warehouse data. This can speed up the data transfer and reduce the workload on the control server.
Crystal Enterprise ServerCrystal Enterprise Professional for Tivoli replaces completely the Reports Interface of Tivoli Enterprise Data Warehouse (TEDW) 1.1. It gives a new mechanism for obtaining the reports provided by the WEPs. The installation and configuration of a Crystal Enterprise environment is mandatory before you begin installing Tivoli Data Warehouse 1.2. Tivoli Data Warehouse 1.2 supports only the full stand-alone installation of Crystal Enterprise. In the full stand-alone installation, Crystal Enterprise is installed on a single computer that is already running as a Web server.
Crystal Enterprise depends on a number of software components that must be up and running prior to its installation.
� Operating systems
– Windows NT®– Windows 2000– Windows 2003
� Internet browser
– Internet Explorer– Netscape Navigator
� Web servers
– IBM HTTP Server– Microsoft IIS– iPlanet Enterprise Server– Lotus® Domino®
Chapter 3. IBM Tivoli products that assist in service level management 71
3.4 IBM Tivoli Service Level AdvisorIBM Tivoli Service Level Advisor provides SLM capabilities for enterprise organizations that need to measure, manage, and report on availability and performance aspects of their internal IT infrastructure. The SLM capabilities of IBM Tivoli Service Level Advisor complement the performance and availability measurement functions of other Tivoli products, such as IBM Tivoli Monitoring for Transaction Performance and IBM Tivoli Business Systems Manager.
For more information about IBM Tivoli Service Level Advisor, refer to Introducing IBM Tivoli Service Level Advisor, SG24-6611. This section provides a basic overview of the product, its components, and functions as needed to understand and implement Business Service Management.
3.4.1 Business goalsTypical business goals addressed by IBM Tivoli Service Level Advisor are:
� Provision of SLAs that are meaningful to businesses
� Automation of SLA report production to reduce costs and provide timely report delivery
� Provision of a mechanism to resolve disagreements on SLA achievement
� Provision of early warning of trends toward SLAs being breached
3.4.2 High level description and main functionsTivoli Enterprise Monitoring and Business System monitoring tools usually store their availability and performance data in their own databases. This data is then moved into the Tivoli Data Warehouse using ETLs as explained in 3.3.4, “Key concepts in Tivoli Data Warehouse” on page 67.
After all the source ETLs have written the latest data into the central data warehouse, the IBM Tivoli Service Level Advisor ETL moves a subset of this data into the SLM measurement data mart. Here it can be processed and analyzed against defined SLOs.
For example, an SLA can be based on response-time measurements against a Web application. IBM Tivoli Monitoring for Transaction Performance measures the response time of the Web site, breaking the service into associated sub-applications that complete a service transaction. Data is moved to the Tivoli Data Warehouse database, from where IBM Tivoli Service Level Advisor can extract and analyze it using its built in data-collector interface. It can then determine long-term trends. It can also generate reports showing violations, or trends toward violations, of guaranteed levels of service.
72 Service Level Management
IBM Tivoli Service Level Advisor helps IT service delivery organizations to increase the business value of their delivered service by providing the ability to understand and measure service level attainment within their organization.
This service level understanding helps to:
� Maintain productivity and customer satisfaction� Verify end user service levels� Analyze historical data to predict future service levels� Manage costs, and improve planning by assuring offered services� Measure, manage, and report on availability and performance � Automate SLM based on SLOs� Evaluate service delivery based on business schedules � Provide Web-based customer reports
IBM Tivoli Service Level Advisor depends on the collected performance and availability data from a variety of monitoring and performance tools to deliver SLA reports and SLA trends identification. Figure 3-5 illustrates the flow of data.
Figure 3-5 Data flow in the IBM Tivoli Service Level Advisor
Service level management life cycle with IBM Tivoli Service Level AdvisorSLM is an ongoing process. Both the service provider and customer must adjust the SLOs to achieve the best service level with reasonable costs and efforts regularly.
ITSLA Database
ITSLA Measurement
Data Mart
ITSLA Database
Server
SLMServer
SLM Reports Server
SLM Task
Drivers
TDW Central
Warehouse
Source Applications Environment
Source Appl 1
Source Appl N
Source Appl 2
ITSLA Environment
Source ETL N
Source ETL 1
Source ETL 2
Process ETL
Registration ETL
Chapter 3. IBM Tivoli products that assist in service level management 73
IBM Tivoli Service Level Advisor supports the full life cycle of the SLM process:
1. Creating the SLA 2. Monitoring and reporting the Service Level3. Delivery and reviewing of SLA reports4. Ongoing refinement of SLA agreements
IBM Tivoli Service Level Advisor offers easy-to-use interfaces, quick and easy customization of features, and default values where appropriate. It is delivered with several additional IBM applications that support the functionality:
� IBM DB2 Universal Database (DB2 UDB) Enterprise Edition: This database is used to store measurement data.
� IBM Tivoli Service Level Advisor warehouse enablement packs (also known as warehouse packs): This includes ETL routines both for collecting data from the central data warehouse and writing data back into the central data warehouse for use by other applications.
� IBM WebSphere® Application Server: This is used by IBM Tivoli Service Level Advisor as the operating environment for the administrative user interface and the reporting interface.
3.4.3 Benefits of using IBM Tivoli Service Level AdvisorTable 3-3 emphasizes the features of the IBM Tivoli Service Level Advisor, while focusing on the advantages and benefits associated with them.
Table 3-3 The IBM Tivoli Service Level Advisor summary
Features Advantages Benefits
Automated SLA evaluation
Eliminates the process of manually reviewing and correlating component-level reports against customer SLAs
Improves IT resource productivity, and reduces education and training costs required to support component SLM products
IBM patent-pending trend analysis
Identifies IT service delivery problems before they occur, allowing you to take action to maintain service levels rather than simply report them
Maintains customer productivity and satisfaction with the services they depend on to meet business objectives
Manage service level definition and business schedules across existing IT infrastructure
Leverages existing systems management applications, and associates service delivery with business operations
Provides business-level management of IT infrastructure and increases ROI of existing systems management tools
Flexible, Web-based reporting
Identifies problem areas, providing executive summary, and detailed operations status of SLAs
Helps communicate the business value of IT resources and can justify cost expenditures
74 Service Level Management
3.4.4 Key concepts in IBM Tivoli Service Level AdvisorTo understand IBM Tivoli Service Level Advisor, you need to be familiar with the concepts of offerings, realms, and customers. For a full explanation of these concepts, see Creating SLAs with IBM Tivoli Service Level Advisor 2.1, SC32-1247.
OfferingsAn offering is a template used to describe a service, with agreed service levels, that forms the basis for SLAs in which it is ultimately included. Offerings can be differentiated to provide service level choices to customers, such as Gold, Silver, and Bronze services, or any other naming convention that suggests a unique level of service.
An offering is associated with a business schedule that is defined with one or more schedule periods. Each schedule period is associated with a unique schedule state, such as peak, prime, standard, off hours, and others. Each of these states can be configured to represent a unique level of service for that schedule period. As a result, you can offer a wide range of service levels in your offering, while also providing for scheduled outages for maintenance or other downtime activities.
Realms and customersIBM Tivoli Service Level Advisor provides mechanisms called realms and customers to segregate data to ensure that reporting information is made available only to the appropriate people.
RealmsThe highest level of segregation is called a realm. A realm contains one or more customers. For example, you may create a realm for all customers in the United States and another realm for customers in Europe. You might also create a realm for customers in a particular line of business within your organization or another grouping that makes sense for your enterprise. Customers can be associated with more than one realm.
Tivoli Data Warehouse Provides open, extensible aggregation point for all systems management data (including non-Tivoli data), and cross-domain reporting
Leverages business intelligence tools for data mining, and provides an open interface to include additional monitoring data in SLAs
Features Advantages Benefits
Chapter 3. IBM Tivoli products that assist in service level management 75
CustomersThe second level of segregation is called a customer. A customer must be associated with at least one realm. When SLAs are defined in IBM Tivoli Service Level Advisor, they are associated with both realms and customers.
When IBM Tivoli Service Level Advisor users are given access to reporting functionality, they are given permission to access specific realms and customers. They are unable to view data related to realms or customers for which they have not been granted permissions.
3.4.5 IBM Tivoli Service Level Advisor architectureFigure 3-6 shows the high level architecture of the IBM Tivoli Service Level Advisor. The components are described in the following paragraphs. We recommend that you install the components of IBM Tivoli Service Level Advisor inside a firewall if possible.
Figure 3-6 IBM Tivoli Service Level Advisor architecture
76 Service Level Management
The SLM serverThe SLM server performs the main functions necessary for SLM, including:
� Processing SLAs
� Scheduling and performing evaluation and trend analysis of measurement data
� Storing the results of the analysis
� Notifying of violations or trends toward violations of SLAs
SLM reports The report servlets use the functions of the IBM WebSphere Application Server to obtain SLA results data and generate summary reports in the form of tables and graphs that can be displayed in a Web browser. The enterprise can use these servlets to create customized Web pages for customers, displaying results of evaluation and trend analyses, such as:
� Actual level of service provided� Number of SLA violations� Trends toward future violations
SLM administration server The SLM administration server provides a Web-based interface in a WebSphere environment for:
� Creating offerings and SLAs
� Specifying schedules and defining peak times and other schedule states (such as standard, prime, off hours, and others) for varying levels of service
� Specifying how often evaluation and trend analysis should be performed
� Specifying breach values for metrics associated with offerings
� Managing active SLAs
IBM Tivoli Service Level Advisor databasesIBM Tivoli Service Level Advisor depends on three main databases for its operation:
� The central data warehouse database from Tivoli Data Warehouse� The SLM database� The SLM measurement data mart
Chapter 3. IBM Tivoli products that assist in service level management 77
The central data warehouse database The central data warehouse database component of Tivoli Data Warehouse serves as the main repository for historical data that is used by applications such as IBM Tivoli Service Level Advisor. Tivoli Data Warehouse is the source for resource related data. It is also where the various Tivoli performance and availability monitoring applications send their data for long-term storage.
The SLM database The SLM database serves several purposes:
� Stores information from Tivoli Data Warehouse that defines possible combinations of resources and metrics that are available to the customer to be used in SLAs
� Stores information specific to the definition and management of schedules, offerings, customers, realms, and SLAs.
� Stores the results of the analysis and trend evaluation processes, when SLOs are compared to expected results
From this information, the customer can view summarized reports that indicate how well services are being delivered.
The SLM measurement data martThe SLM measurement data mart is the database that contains a subset of the measurement data from Tivoli Data Warehouse that is of interest to IBM Tivoli Service Level Advisor in the evaluation and reporting of SLA conformance. It is updated on a regular basis with the latest metric data from Tivoli Data Warehouse.
3.5 IBM Tivoli Monitoring for Transaction PerformanceIBM Tivoli Monitoring for Transaction Performance is a centrally managed suite of software components. These components monitor the availability and performance of Web-based services and Microsoft Windows applications.
For more information of IBM Tivoli Monitoring for Transaction Performance, refer to IBM Tivoli Monitoring for Transaction Performance Administrator’s Guide Version 5.3, GC32-9189. This section provides a basic overview of the product, its components, and functions as needed to understand and implement BSM.
78 Service Level Management
3.5.1 Business goalsIBM Tivoli Monitoring for Transaction Performance typically addresses these business goals:
� Improving customer satisfaction by being aware of the client user experience and resolving issues quickly
� Improving the analysis of faults in applications to enable more rapid repairs
� Providing measurements based on application response times and availability to use in SLAs
3.5.2 High level description and main functionsIBM Tivoli Monitoring for Transaction Performance captures detailed performance data for all of your on demand business transactions. You can use this software to perform the following on demand business management tasks:
� Monitor transactions: You can monitor every step of an actual customer transaction as it passes through the complex array of hosts, systems, and applications:
– Web and proxy servers– Web application servers – Database management systems– Legacy back-office systems and applications
� Simulate customer transactions: While mimicking the behavior of real users performing standard tasks, you can collect performance data that helps you assess the health of your on demand business components and configurations under different conditions and at different times.
� Reporting: You can produce comprehensive real-time reports that display recently collected data in a variety of formats and from a variety of perspectives. By integrating with Tivoli Data Warehouse, you can store collected data for use in historical analysis and long-term planning.
� Notification of performance issues: You can receive prompt automated notification of performance problems either directly through a console or by integration with IBM Tivoli Enterprise Console and IBM Tivoli Business Systems Manager.
� Root cause analysis: You can quickly isolate the source of performance problems as they occur, so that you can correct those problems before they produce expensive outages and lost revenue.
Chapter 3. IBM Tivoli products that assist in service level management 79
3.5.3 Benefits of using IBM Tivoli Monitoring for Transaction Performance
Table 3-4 summarizes the main advantages and business benefits of using the key features of IBM Tivoli Monitoring for Transaction Performance.
Table 3-4 Benefits of IBM Tivoli Monitoring for Transaction Performance features
3.5.4 Key concepts in IBM Tivoli Monitoring for Transaction Performance
To understand IBM Tivoli Monitoring for Transaction Performance, you must be familiar with the concepts of Application Response Measurement (ARM), record and playback, and Java 2 Platform, Enterprise Edition (J2EE), monitoring. For a full explanation about these concepts, see IBM Tivoli Monitoring for Transaction Performance Administrator’s Guide, GC32-9189.
Application Response MeasurementThe ARM application programming interface (API) is the key technology used by IBM Tivoli Monitoring for Transaction Performance to capture transaction performance information. The ARM standard describes a common method for integrating enterprise applications as manageable entities. It allows users to extend their enterprise management tools directly to applications, creating a
Features Advantages Benefits
Robotic synthetic transactions
Provides a view of the experience of real application users
Enables early identification and resolution of service shortcomings
Transaction decomposition
Goes beyond the “black box” view of an application to understand the component causing service issues; support staff needs to know less about the application architecture to identify root causes
Faster identification and resolution of problems with application availability and performance
IBM Tivoli Enterprise Console integration
Enables events to be forwarded to the IBM Tivoli Enterprise Console and acted on by operators
Console consolidation means there is less chance of missing service issues
IBM Tivoli Business Systems Manager integration
Enables the business impact of events to be assessed and to enable escalation
Ensures focus on the most important issues based on the business impact of a fault
Tivoli Data Warehouse integration
Enables long-term storage of performance and availability data and supports the use of data in SLAs created with IBM Tivoli Service Level Advisor
Reduced data storage costs and the creation of meaningful SLAs
80 Service Level Management
comprehensive end-to-end management capability that includes measuring application availability, application performance, application usage, and end-to-end transaction response time. The ARM API defines a small set of functions that can be used to instrument an application to identify the start and stop of important transactions.
IBM Tivoli Monitoring for Transaction Performance provides an ARM engine to collect the data from ARM instrumented applications. This is a multithreaded application implemented as the tapmagent that exchanges data though an IPC channel, using the libarm library, with ARM instrumented applications. Data is collected and aggregated to generate useful information. It is correlated with other transactions, and then thresholds are checked against policies. Data is forwarded to the management server and placed into the database for reporting purposes.
IBM Tivoli Monitoring for Transaction Performance Version 5.3 also provides a generic ARM component for more transaction monitoring coverage. The generic ARM capability enables you to monitor custom ARM-instrumented applications.
The ARM engine notifies the IBM Tivoli Monitoring for Transaction Performance Management Server of transaction violations, new edge transactions appearing, and edge transaction status changes.
The following paragraphs provide an overview of the transaction correlation provided by IBM Tivoli Monitoring for Transaction Performance. For additional information, including instrumenting applications using ARM, see the IBM Tivoli Monitoring for Transaction Performance Administrator’s Guide Version 5.3, GC32-9189.
ARM correlation is the method by which parent transactions are mapped to their respective child transactions across multiple processes and multiple servers. Each IBM Tivoli Monitoring for Transaction Performance component is automatically ARM-instrumented and generates a correlator. The initial root/parent or edge transaction is the only transaction that does not have a parent correlator. From there, IBM Tivoli Monitoring for Transaction Performance can automatically connect parent correlators with child correlators to trace the path of a distributed transaction through the infrastructure. It provides the mechanisms to easily visualize this through the topology views.
Note: ARM instrumentation does not support a 63Cbit Java Virtual Machine (JVM).
Chapter 3. IBM Tivoli products that assist in service level management 81
IBM Tivoli Monitoring for Transaction Performance implements the following ARM correlation mechanisms:
� Parent-based aggregation: This process collects transaction performance data on the parent of a subtransaction and displays transaction performance relative to its path. This provides the ability to monitor the connection points between transactions. It also monitors path-based transaction performance across farms of servers providing the same function.
� Policy-based correlators: A portion of the correlator is used to pass a unique policy identifier within the correlator. The associated policy controls the amount of data collected and the thresholds associated with that data.
� Instance and aggregated performance statistics: This provides both additional metrics and a complete and exact trace of the path taken by a specific transaction.
� Parent performance initiated trace: The trace flag within the ARM correlator is used by the agent in the trace field for transactions that are performing outside of their threshold. This provides for the dynamic collection of instance data across all systems where this transaction executes.
� Sibling transaction ordering: This is the ability to determine the order of execution of a set of child transactions relative to each other.
� Aggregated correlation: IBM Tivoli Monitoring for Transaction Performance carries out aggregated correlation. This provides a summary of a transaction over a period of time rather than a record for each and every instance of a transaction.
Record and playback Record and playback records Web transactions and Microsoft Windows applications, which you can play back to assess transaction performance and availability. Performance data helps determine if a transaction is performing as expected and exposes problem areas of your Web and application environment.
IBM Tivoli Monitoring for Transaction Performance provides two playback components. Each is paired with an application that records transactions.
� Synthetic Transaction Investigator (STI) Recorder and STI: The STI Recorder records a sequence of steps for a Web transaction, such as searching for information or purchasing an item from an online supplier. An STI playback policy instructs the STI component to play back the recorded transaction and collect performance data.
� Rational® Robot and Generic Windows: The Rational Robot, which is provided with IBM Tivoli Monitoring for Transaction Performance but installed as a separate application, records actions in a Microsoft Windows application.
82 Service Level Management
The Generic Windows component plays back a Rational Robot recording to provide timing measurements.
J2EE instrumentationIBM Tivoli Monitoring for Transaction Performance provides enhanced J2EE instrumentation capabilities. The collection of ARM data generated by J2EE applications is invoked from the management server and is controlled by user-configured policies. The monitoring policy is then distributed to the management agent.
The transactions to monitor are specified using edge definitions, for example, the first URI invoked when using the application. It is possible to define the level of monitoring for each edge. To monitor a J2EE application server, the computer must be running the IBM Tivoli Monitoring for Transaction Performance Agent. A single IBM Tivoli Monitoring for Transaction Performance agent can monitor multiple J2EE application servers on the management agent’s host. IBM Tivoli Monitoring for Transaction Performance J2EE monitoring uses Java byte-code insertion (BCI).
3.5.5 IBM Tivoli Monitoring for Transaction Performance architectureThe IBM Tivoli Monitoring for Transaction Performance management server is a J2EE application deployed onto the WebSphere Application Server platform. A high level view of the architecture is provided in Figure 3-7.
IBM Tivoli Monitoring for Transaction Performance has the following physical components:
� Management server: This server provides the services and user interface needed for centralized management.
� Management agent: These agents are installed on computers across the environment to run discovery operations and collect performance data for monitored transactions.
� Store and forward management agent: This component enables transfer of data across firewalls.
� ARM engine: This component handles internal systems management data passed from business applications that have been ARM instrumented.
The following sections explain each of these components further.
Chapter 3. IBM Tivoli products that assist in service level management 83
Figure 3-7 IBM Tivoli Monitoring for Transaction Performance architecture
The management serverThe management server is the control center for the IBM Tivoli Monitoring for Transaction Performance installation. It is shared by all IBM Tivoli Monitoring for Transaction Performance components. The management server collects information from and provides services to deployed management agents.
Deployed as a standard IBM WebSphere Application Server Enterprise Archive (EAR) file, the management server provides the following functions:
� User interface: This interface is accessed via a browser and has many uses including:
– Creating and scheduling policies to instruct monitoring components to collect performance data
– Establishing acceptable performance metrics or thresholds, defining notifications for threshold violations and recoveries
– Viewing reports and system events
– Managing schedules
84 Service Level Management
� Real-time reports: This interface is also accessed by a browser and provides graphical displays of performance data collected by the monitoring and playback components. There are reports to help you assess the performance and availability of your Web sites and Microsoft Windows applications.
� Event generation: Application events are generated when performance thresholds are exceeded; system events are generated for system errors and notifications. Events can be viewed and event severities configured to decide what action will to be taken when they are generated. The management server can send e-mail notification to specified recipients, run a specified script, or forward selected event types to the IBM Tivoli Enterprise Console or as Simple Network Management Protocol (SNMP) traps.
� Storage of policies and data: The management server controls a set of databases that store policy information, events, and performance data collected by management agents.
� Communication with management agents: The management server uses Web services and the Secure Sockets Layer (SSL) to communicate with the management agents. ARM data is uploaded to the management server from management agents at regularly scheduled intervals (the upload interval). By default, the upload interval is once per hour.
The management agentManagement agents, based on Java Management Extensions (JMX), are installed on computers across your environment. Management agents provide the following functions:
� Discovery: This enables automatic identification of incoming Web transactions that may need to be monitored.
� Listening and playback monitoring: A management agent can have listening and playback components installed that run policies at scheduled times. The management agent sends any events generated during a listening or playback operation to the management server, where event information is made available in event views and reports.
� ARM engine for data collection: A management agent uses the ARM API to collect performance data. Each of the listening and playback components is instrumented to retrieve the data using ARM standards.
� Policy implementation: When a discovery, listening, or playback policy is created, an agent group is assigned to run the policy. You define agent groups to include one or more management agents that are equipped to run the same policy. For example, if you want to monitor the performance of a consumer banking application that runs on several WebSphere application servers, each of which is associated with a management agent and a J2EE monitoring component, you can create an agent group named All J2EE
Chapter 3. IBM Tivoli products that assist in service level management 85
Servers. All of the management agents in the group can run a J2EE listening policy that you create to monitor the banking application.
� Threshold checking: When performance thresholds in listening or playback policies are exceeded, the management agent sends events to the management server. Events can be set for transactions, and in many cases, for the subtransactions within a transaction. This is one step in an overall transaction.
Store and forward management agentStore and forward can be implemented on one or more management agents (typically only one) to handle firewall situations.
Store and forward management agents perform these firewall-related tasks:
� Enabling point-to-point connections between management agents and the management server
� Enabling management agents to interact with store and forward as though store and forward were a management server
� Routing requests and responses to the correct target
� Supporting SSL communications
� Supporting one-way communications through firewall
The ARM engine When you install and configure a management agent, the ARM engine is automatically installed as part of the management agent. The ARM engine and ARM API comply with the ARM 2.0 and 4.0 specifications. The ARM specification was developed to meet the challenge of tracking performance through complex, distributed computing networks.
ARM provides a way for business applications to pass information about the subtransactions they initiate in response to service requests that flow across a network. This information can be used to calculate response times, identify subtransactions, and provide additional data to help you determine the cause of performance problems.
The Generic ARM component (new in Version 5.3 of IBM Tivoli Monitoring for Transaction Performance) enables you to monitor the performance of any ARM 2.0- or 4.0-instrumented application. You can monitor both ARM-instrumented
Important: Store and forward cannot work with proxies. In general, you need one store and forward management agent for each firewall that has to be traversed.
86 Service Level Management
products from independent software vendors (ISV) or custom in-house applications. The Generic ARM component can also detect and monitor custom metrics that are recorded from these ARM instrumented applications.
All transaction data collected by the Quality of Service, J2EE, STI, and Generic Windows monitoring components of IBM Tivoli Monitoring for Transaction Performance is collected by ARM.
3.6 IBM Tivoli Enterprise ConsoleIBM Tivoli Enterprise Console provides a focal point for events coming from monitoring products installed in a distributed systems environment. It is usually associated with implementation of Tivoli Framework products but can also handle event information sent using the SNMP.
For more information about IBM Tivoli Enterprise Console, refer to IBM Tivoli Enterprise Console User’s Guide 3.9, SC32-1235.
3.6.1 Business goalsIBM Tivoli Enterprise Console typically addresses these business goals:
� Increasing efficiency of operations staff by providing a single event console� Reducing operational costs by automating fixes to common problems� Providing an effective and automated incident escalation solution
3.6.2 High level description and main functionsThe IBM Tivoli Enterprise Console product is a rule-based event management application. It integrates system, network, database, and application management to help ensure the optimal availability of the IT resources in an enterprise.
The main functions of the IBM Tivoli Enterprise Console are:
� To provide a centralized, global view of your computing enterprise
� To collect, process, and automatically respond to common management events, such as a database server that is not responding, a lost network connection, or a successfully completed batch processing job
� To act as a central collection point for alarms and events from a variety of sources, including those from other Tivoli software applications, Tivoli partner applications, custom applications, network management platforms, and relational database systems
Chapter 3. IBM Tivoli products that assist in service level management 87
� To forward appropriate events to the IBM Tivoli Business Systems Manager to enable it to determine the business impact of faults
The Tivoli Enterprise Console product helps you effectively process the high volume of events in an IT environment by:
� Prioritizing events by their level of importance
� Filtering redundant or low-priority events
� Correlating events with other events from different sources
� Determining who should view and process specific events
� Initiating automatic corrective actions, when appropriate, such as escalation notification, and opening trouble tickets
� Identifying hosts and automatically grouping events from the hosts that are in maintenance mode in a predefined event group
3.6.3 Benefits of using IBM Tivoli Enterprise ConsoleTable 3-5 summarizes the main advantages and business benefits of using the key features of IBM Tivoli Enterprise Console.
Table 3-5 Benefits of IBM Tivoli Enterprise Console features
Features Advantages Benefits
Event filtering Events requiring no further action are not displayed on the console
Operators can focus on the significant events
Event correlation Operators focus on the cause of faults rather than the symptoms
More rapid fault resolution
Automatic escalation
Significant faults that are not noticed or not yet worked on are escalated automatically
Improvement in service availability
IBM Tivoli Business Systems Manager Integration
Enables the business impact of events to be assessed and escalated
Ensures focus on the most important issues based on the business impact of a fault
Tivoli Data Warehouse integration
Enables long-term storage of performance and availability data and supports the use of data in SLAs created with IBM Tivoli Service Level Advisor
Reduced data storage costs and the creation of meaningful SLAs
88 Service Level Management
3.6.4 Key concepts of event groups in IBM Tivoli Enterprise ConsoleTo understand IBM Tivoli Enterprise Console, you need to be familiar with the concepts of event groups. This section introduces you to event groups. However, you can find a detailed explanation in IBM Tivoli Enterprise Console Installation Guide Version 3.9, SC32-1233.
An event group is a configured logical area of responsibility that is used to notify users that an event matching a specified set of criteria has occurred. An administrator configures event groups using the Java version of the event console. For example, if your network contains a group of computers that are used for critical work, you may want to create an event group that receives events for these critical computers. This logical grouping of events is an event group.
To define an event group, you must specify the selection criteria for the events in the group. This data constitutes an event group filter. An event group filter can include any event attribute except for extended or customer-defined attributes.
Table 3-6 lists some of the more commonly used attributes for event group filtering.
Table 3-6 Attributes for event group filtering
Attribute name Description
Event class Specifies the class of the event, as assigned by the event source that forwards the event
Origin Identifies the protocol address or host name of a host from which you want to receive events
Severity Specifies the severity of the event from Unknown, through Harmless to Fatal
Source Specifies the type of application that created the event
Status The status of the event, which could have various states including Open, Closed, and Acknowledged
Chapter 3. IBM Tivoli products that assist in service level management 89
3.6.5 IBM Tivoli Enterprise Console architectureA high level view of the architecture of IBM Tivoli Enterprise Console is provided in Figure 3-8. The key components are described in the sections that follow.
Figure 3-8 IBM Tivoli Enterprise Console architecture
The IBM Tivoli Enterprise Console event server The event server is at the heart of the IBM Tivoli Enterprise Console. It provides a centralized location for the management of events in a distributed environment.
The event server processes input from event consoles and updates the event database. Event consoles read data from the event database and see the latest status of events as they are updated. The event server evaluates events against a set of rules to determine if it should automatically perform any predefined tasks
90 Service Level Management
or modify the event. If human intervention is required, the event server notifies the appropriate operator. The operator performs the required tasks and then notifies the event server when the condition that caused the event is resolved.
Incoming are events given a unique number and time stamped as they are entered into the event database. They are then evaluated by the rule engine. If the rule engine is busy, events are buffered and evaluated later. Rules include action to be taken when an event meets the specified rule conditions. This helps to reduce the amount of interpretation and responses required by operators. For example, a particular event may be known to trigger one or more instances of another event. In such a case, a rule can be used to automatically downgrade the severity of the event or close events that are known to be caused by the triggering event.
The event server can use rules to delay responses to an event. This may be use to deal with self-correcting faults to prevent an operator from needlessly responding to a problem that will shortly go away. Rules can be used, for example, to attempt to restart a router and give an operator a low-severity notice. If the attempts to restart the router within a designated time period fail, a rule can specify that attempts to retry be cancelled and that a higher-severity notice be sent to an operator. If an operator does not respond to an event after a specified period of time, the event server can take additional actions including sending an e-mail, paging the operator, or sending an e-mail notice to an alternate contact.
You can use the predefined rules that the Tivoli Enterprise Console product provides, or you can create your own. For full information about the predefined rules, see IBM Tivoli Enterprise Console Rule Set Reference Version 3.9, SC32-1282. You can find information about creating your own rules in IBM Tivoli Enterprise Console Rule Developer’s Guide Version 3.9, SC32-1234.
A rule can specify the following actions among others:
� Correlating events� Responding automatically to events, such as running an application or script� Delaying responses to events� Escalating events� Modifying event attributes� Modifying attributes of other events� Preventing duplicate events from being displayed� Dispatching Tivoli or other administrative actions on resources� Reevaluating a set of events� Discarding an event� Generating a new event� Forwarding an event to another event server
Chapter 3. IBM Tivoli products that assist in service level management 91
IBM Tivoli Enterprise Console Event databaseThe Tivoli Enterprise Console product uses an external RDBMS to store the large amount of event data that is received. The RDBMS Interface Module (RIM) component of the Tivoli Management Framework is used to access the event database.
IBM Tivoli Enterprise Console user interface serverThe user interface (UI) server provides communication services between the event consoles and the event server. It automatically updates the event database when, for example, an operator acknowledges an event.
The UI server also provides a set of commands that enable an operator to change any event attribute, list the events in a specific event group, and display a message on the operator’s desktop.
IBM Tivoli Enterprise Console Event consoleAn event console provides the graphical user interface (GUI) used by operators to view and respond to events. IBM Tivoli Enterprise Console product provides two versions of the event console, a Java version and a Web version. Certain tasks require the Java console, but either version can be used to manage events.
The event console provides a window for monitoring events based on event groups. An event group is a set of events that meets certain filter criteria.
The Java event consoleKey features of the Java event console include:
� Tivoli secure logon for added security
� Event information directly retrieved by each event console from the database for high performance and scalability
� Configurable refresh rate
� Ability to run third-party or custom scripts and applications from the event console
� Ability to run predefined tasks
� Ability to configure automated tasks to run when a particular event is received by the event console
� Ability to view more help information about an event in a Web page
� Automatic resolution of conflicts, for example, should two operators simultaneously attempt to change the status of an event
92 Service Level Management
� Support of multiple views:
– Configuration view to configure the event consoles
– Summary chart view to show a high-level overview of the health of resources represented by an event group
– Priority view showing event groups are represented by buttons with the status indicated by color
The Web event consoleThis is used to manage events from your Web browser and provides many of the functions available in the Java console. The Web version of the event console organizes the tasks that you can perform in a portfolio, which is titled My Work.
IBM Tivoli Enterprise Console event adapterAn event adapter is a process that typically resides on the same host as a managed source and monitors the source for events.
For example, if you want to monitor the Windows event log, you would install the Windows event log adapter on the host. When an event adapter receives information from its source, the adapter formats the information and forwards it to the event server for interpretation and response.
You can configure an event adapter to discard selected events instead of forwarding them all to the event server to reduce network traffic and event server workload.
Tivoli Event Integration FacilityThe Tivoli Event Integration Facility is a toolkit that expands the types of events and system information that you can monitor. You can use it to develop your own adapters that are tailored to your network environment and your specific needs.
Tivoli Enterprise Console gatewayThe Tivoli Enterprise Console gateway receives events from TME® and non-TME adapters and forwards them to an event server. The Tivoli Enterprise Console gateway provides the following benefits:
� Greater scalability, which allows you to manage sources with less software running on the endpoints
� Improved performance of the event server
� Simple deployment of adapters and updates
� Event correlation and filtering closer to the sources decreasing the amount of network traffic
Chapter 3. IBM Tivoli products that assist in service level management 93
Adapter Configuration FacilityThe Adapter Configuration Facility provides a GUI to configure and distribute TME adapters. You can use the Adapter Configuration Facility to create profiles for adapters and set adapter configuration and distribution options.
Tivoli NetViewIBM Tivoli NetView provides the network management function for the IBM Tivoli Enterprise Console product. It monitors the status of network devices and automatically filters and forwards network-related events to IBM Tivoli Enterprise Console.
3.7 IBM Tivoli MonitoringIBM Tivoli Monitoring provides automated monitoring of essential IT system resources. For more information about IBM Tivoli Monitoring, refer to IBM Tivoli Monitoring User’s Guide version 5.1.2, SH19-4569-03.
3.7.1 Business goalsTypical business goals addressed by IBM Tivoli Monitoring are:
� Provision of high quality services� Proactive monitoring of services� Making the best value of the IT infrastructure
3.7.2 High level description and main functionsIBM Tivoli Monitoring applies pre-configured best practices to the automated monitoring of essential IT system resources. The application detects bottlenecks and other potential problems, provides for the automatic recovery from critical situations, and eliminates the need for system administrators to scan manually through extensive performance data.
IBM Tivoli Monitoring integrates seamlessly with other Tivoli availability solutions, including IBM Tivoli Business Systems Manager and IBM Tivoli Enterprise Console. It was previously called Tivoli Distributed Monitoring (Advanced Edition). Most features of IBM Tivoli Monitoring can be used as supplied, or modified using the GUI or command line interface (CLI) provided.
The main features of Tivoli Monitoring are:
� An off-the-shelf solution for monitoring Windows, UNIX, Linux®, and OS/400® systems, with data collection and problem analysis performed locally
94 Service Level Management
� Ready-to-use resource models that report on specific aspects of a system’s status
For example, the Process resource model provides information about the status of processes, CPU usage, and so forth.
� The ability to add resource models to a Tivoli profile, which can be distributed to multiple systems simultaneously
� The ability to modify resource models by changing, for example, threshold levels to match specific requirements
� The ability to view both real-time and historical data for any system from a centralized monitoring application, called the Web Health Console, which is supplied with the product
� The ability to send the results of data collection and analysis to the IBM Tivoli Enterprise Console or to the IBM Tivoli Business Systems Manager
� The ability to specify automatic corrective or preventive actions to resolve situations that could develop into real problems
� The ability to schedule monitoring to take place at user-specified times
� A heartbeat function that regularly checks the availability and status of attached endpoints and makes the information available to the IBM Tivoli Enterprise Consoleserver, IBM Tivoli Business Systems Manager, or Tivoli Monitoring Notice Group
3.7.3 Benefits of using IBM Tivoli MonitoringTable 3-7 summarizes the main advantages and business benefits of using the key features of IBM Tivoli Monitoring.
Table 3-7 Benefits and advantages of IBM Tivoli Monitoring features
Features Advantages Benefits
Out-of-the-box resource models
Little or no configuration required to start monitoring on implementation
Rapid ROI
Heartbeat function Rapid and automatic notification of resources that cannot be contacted
More responsive fault resolution leading to increased customer satisfaction
Web Health Console Ability to view real-time and historical data for a resource
Better informed problem analysis
IBM Tivoli Enterprise Console Integration
Enables events to be forwarded to IBM Tivoli Enterprise Console
Console consolidation means less chance of missing service issues
Chapter 3. IBM Tivoli products that assist in service level management 95
3.7.4 Key concepts in IBM Tivoli MonitoringTo understand IBM Tivoli Monitoring, you need to be familiar with the concepts presented in the following sections.
Resource modelsIn IBM Tivoli Monitoring terminology, a resource model is defined as “the logical modeling of one or more resources, along with the logic on which cyclical data collection, data analysis, and monitoring are based.” In practical terms, a resource model is a pre-built set of rules for monitoring a resource using IBM Tivoli Monitoring that is installed, for example on a server that may take corrective action or send an event if an exception condition is detected.
IBM Tivoli Monitoring provides a range of out-of-the box, predefined resource models to specify which resource data is accessed from the system at runtime and how this data is processed. For example, the Process resource model obtains data related to processes running on the system. Performance data is automatically collected by the resource model and processed by an appropriate algorithm to determine whether the system is performing to your expectations.
Generally, you can use the resource model default values and still obtain useful data. However, if necessary, you can customize the resource models to suit your requirements or even build your own resource models using the IBM Tivoli Resource Model Builder.
For details about the resource models supplied with the product, see IBM Tivoli Monitoring Version 5.1.2 Resource Model Reference Guide, SH19-4570-03. For guidance about creating resource models, see IBM Tivoli Resource Model Builder Version 1.1.3 User’s Guide, SC32-1391-02.
Cycles and thresholdsResource models run on a cyclical basis. A resource model installed at an endpoint gathers data at regular intervals, known as cycles. The duration of a cycle is the cycle time. A resource model with a cycle time of 60 seconds gathers
IBM Tivoli Business Systems Manager Integration
Enables the business impact of events to be assessed and to enable escalation
Ensures focus on the most important issues based on the business impact of a fault
Tivoli Data Warehouse Integration
Enables long-term storage of performance and availability data and supports the use of data in SLAs created with IBM Tivoli Service Level Advisor
Reduced data storage costs and the creation of meaningful SLAs
Features Advantages Benefits
96 Service Level Management
information every 60 seconds. The data collected is a snapshot of the status of the resources specified in the resource model. Each of the supplied resource models has a default cycle time, which you can modify.
Each resource model defines one or more thresholds. A threshold is a named property of the resource with a default value that you can modify in the customization phase. Typically, the value specified for a threshold represents a significant reference level of a performance-related entity. If the level is exceeded or not reached, the operator or system administrator should be notified.
IndicationsEach resource model generates an indication if certain conditions implied by the resource model’s thresholds are not satisfied in a given cycle. Each resource model has its own algorithm to determine which combinations of thresholds should generate an indication.
Indications may be generated in any one of the following circumstances:
� A single threshold is exceeded: For example, in the Windows Process resource model, the Process High CPU indication is generated when the High CPU Usage threshold is exceeded.
� A combination of two or more thresholds are exceeded: For example, in the Windows Logical Disk resource model, a High Read Bytes per Second indication is generated when both the following thresholds are exceeded:
– The amount of bytes transferred per second (being written or read) exceeds the High Bytes per Second threshold.
– The percentage of time that the selected disk drive spends for read or write requests exceeds the High Percent Usage threshold.
Occurrences and holesIBM Tivoli Monitoring resource models do not look only for conditions that exceed thresholds once. They can also look for a pattern of repeats over time. An occurrence is the term used to refer to a cycle during which an indication occurs for a given resource model. A hole is the term used to refer to a cycle during which an indication does not occur for a given resource model.
Resource models can compare a series of measurements with a given pattern of occurrences and holes to determine whether further action is needed. This approach provides much greater flexibility and avoids precipitate raising of events. This is explained in great detail with examples in IBM Tivoli Monitoring Version 5.1.2 Resource Model Reference Guide, SH19-4570-03.
Chapter 3. IBM Tivoli products that assist in service level management 97
The heartbeat functionIn addition to the monitoring processes described earlier, IBM Tivoli Monitoring operates a heartbeat function. This function monitors the basic system status at endpoints attached to the gateway at which it is enabled.
In essence, this function checks regularly to determine whether resources can be reached in the network. If not, events may be sent to IBM Tivoli Enterprise Console, IBM Tivoli Business Systems Manager, and the IBM Tivoli Monitoring Notice Group.
3.7.5 IBM Tivoli Monitoring architectureFigure 3-9 shows a high level view of the architecture of IBM Tivoli Monitoring. The key components are described in the sections that follow.
Figure 3-9 IBM Tivoli Monitoring components
98 Service Level Management
The IBM Tivoli Monitoring Base componentInstall this component on the Tivoli management region server and on all gateways with endpoints that you want to monitor. It provides a GUI and a CLI that are available at both the server and gateway. You can control all functions of the product from either node. And you can configure the component to operate the heartbeat function for all endpoints directly attached to the system on which it is installed.
IBM Tivoli Monitoring Web Health ConsoleThe Web Health Console is the Web-based graphical interface for Tivoli Monitoring. It allows you to view real-time information about a specific problem and check the status (or health) of a set of endpoints. You can use the Web Health Console to work with real-time data or with historical data that was previously logged to a local database.
IBM Tivoli Monitoring Endpoint componentThe endpoint component, which requires a Tivoli management agent, performs the resource management through one or more resource models that are distributed to the endpoint with a Tivoli Monitoring profile. The endpoint component is installed automatically when a Tivoli Monitoring profile is distributed to the endpoint for the first time.
The IBM Tivoli Monitoring TBSM AdapterThis component feeds discovery information and IBM Tivoli Monitoring events to the IBM Tivoli Business Systems Manager.
The Gathering Historical Data componentThis component enables IBM Tivoli Monitoring to use Tivoli Decision Support for Server Performance Prediction (Advanced Edition). It uses data collected by specific IBM Tivoli Monitoring resource models to populate a database on the Tivoli server where it is installed. The collected data is aggregated every 24 hours and added to the IBM Tivoli Monitoring database.
The Tivoli Data Warehouse Support componentThis component enables the integration of IBM Tivoli Monitoring with Tivoli Data Warehouse. Getting data into the Tivoli Data Warehouse enables production of more sophisticated data analysis and the potential of using IBM Tivoli Monitoring data in SLAs with the use of IBM Tivoli Service Level Advisor.
Chapter 3. IBM Tivoli products that assist in service level management 99
3.8 Bringing it all together in support of SLM processesSo far this chapter has provided an overview of the IBM Tivoli products involved in supporting the implementation of SLM processes. This section provides a technical description of how you can use these products to support SLM processes implementation.
IBM Tivoli products focus on specific areas of expertise and provide a wide range of features unmatched by any other vendor. Together they are well suited to address every stage of the SLM process that is illustrated by Figure 3-10.
Figure 3-10 An integrated view of SLM, BSM, and monitoring in process context
How can you integrate the existing Tivoli products to maximize their value in support of the process illustrated by Figure 3-10? Since software products are simply tools in support of processes deployed by an IT organization, and their solutions vary with each IT organization, the following sections outline a generic integration approach that is represented by Figure 3-10.
The integration approach addresses the following elements:
� Service definitions� Real-time monitoring� Historical monitoring� Fault management� SLA reporting and alerting� Problem and change management
3.8.1 Service definitionsSLM requires an IT organization to establish service definitions by cataloging IT services and identifying resources used by each IT service. Service definitions must reflect the actual relationships between IT services and resources.
The real benefit of IBM Tivoli Business Systems Manager comes from the ability to create collections of resources that represent business systems, such as key business processes and applications. Tivoli Business Systems Manager discovers IT resources and relationships and allows an IT organization to construct business systems and map resources and associated events to business systems.
Tivoli Business Systems Manager uses two different methods to discover resources and their relationships as they exist in the real world. The first method is a set of explicit discovery routines that periodically scan a particular environment and return the components within that environment. The second method listens for and processes incoming events that signal new resources within the environment and then performs resource creation.
Tivoli Business Systems Manager object model maps discover resources and their relationships hierarchically as they exist in an IT infrastructure. This physical resource pool becomes the source for business system construction that enables management by business services. The Tivoli Business Systems Manager object model includes definitions for many of the thousands of different resource types that can be found within an IT infrastructure. Tivoli Business Systems Manager model can be extended to include additional resource types.
Business systems can contain any type of resources and be organized in any manner that suits user needs. For example, business systems can model resources within a service, application, geography, area of responsibility, etc. They can be converted into services as required and made available for executive dashboard views and SLA alerting. For information about business systems construction, see 4.2.2, “Basic business system building” on page 119.
Tivoli Business Systems Manager provides facilities for off-loading business system information to Tivoli Data Warehouse and later to IBM Tivoli Service
Chapter 3. IBM Tivoli products that assist in service level management 101
Level Advisor. This information includes business system hierarchical structures and the actual time for each of six states for every business system. IBM Tivoli Service Level Advisor operates based on service offerings that are defined manually and have a set of metrics that is linked to the service while it is created.
3.8.2 Real-time monitoringTivoli Business Systems Manager accepts data from a a variety of sources including most industry monitoring products. In addition, it accepts data from major scheduling packages, including Tivoli Workload Scheduler. Tivoli Business Systems Manager supports both distributed and mainframe data sources.
Tivoli distributed monitors communicate with Tivoli Business Systems Manager either through IBM Tivoli Enterprise Console or directly. Tivoli distributed products monitor resource changes and respond by sending predefined events to IBM Tivoli Enterprise Console. Through IBM Tivoli Enterprise Console rules, these events are then forwarded to Tivoli Business Systems Manager via an agent listener.
Tivoli Business Systems Manager also instrumented many adapters for monitoring products that monitor instrumented environments and send resource changes directly to Tivoli Business Systems Manager via a common listener.
Monitoring products for distributed platforms deploys several techniques to capture resource changes and generate real-time events, such as log scanning adapters, SNMP managers, and IBM Tivoli Monitoring resource models. Each event is preclassified and assigned the alert state and priority.
Tivoli Business Systems Manager also provides an OS/390® adapter for monitoring mainframe environments. It can communicate to Tivoli Business Systems Manager either via IP or SNA protocols. It supports several data feeds such as z/OS, IMS, CICS, DB2, SA/390 automation, storage, WebSphere, network, and batch. The OS/390 adapter can capture console messages and timer based polling events and generate predefined Tivoli Business Systems Manager events.
Important: The practical approach to Tivoli Business Systems Manager and IBM Tivoli Service Level Advisor integration involves the IBM Tivoli Service Level Advisor service offering structures modeled on Tivoli Business Systems Manager services. Therefore, Tivoli Business Systems Manager business system data can be used for more accurate measurement of availability for each defined service offering while IBM Tivoli Service Level Advisor can notify the corresponding Tivoli Business Systems Manager service of the pending SLA violation and trending alerts.
102 Service Level Management
3.8.3 Historical monitoringIn addition to sending real-time events to Tivoli Business Systems Manager, IBM Tivoli monitoring products collect measurement data. Each monitoring product stores its data in the product database and periodically transfers this historical data into Tivoli Data Warehouse using their WEPs. Tivoli Data Warehouse is a Tivoli product that offers a centralized database for all Tivoli product data. The schemes of this database are open and published. Systems management data from non-Tivoli products can also be integrated.
As described in 3.3, “IBM Tivoli Data Warehouse” on page 64, the central data warehouse database uses a generic schema that is the same for all applications. As new components or new applications are added, more data is added to the database. However, no new tables are added in the schema. Historical data, stored in Tivoli Data Warehouse, is aggregated as well as correlated and can be used for reporting by many third-party tools.
The latest Tivoli Business Systems Manager WEP provides three enablement options:
� IBM Tivoli Service Level Advisor integration � Tivoli Data Warehouse reporting � IBM Tivoli Service Level Advisor integration and Tivoli Data Warehouse
reporting
Although the Tivoli Business Systems Manager WEP includes programs in support of all three options, the sequence in which the program runs depends on which option is selected. Tivoli Business Systems Manager WEP includes both source and target ETLs. The source ETL loads Tivoli Business Systems Manager data, such as managed resource, events, alert state changes, notes and state transition measurements of business systems, into the central data warehouse database. The target ETL retrieves this data and loads it into the GTM schema in the datamart database.
Tivoli Business Systems Manager provides two options for reporting historical data via the same set of reports:
Important: Tivoli Business Systems Manager expands real-time event monitoring into real-time monitoring of resource states. It adds value by processing incoming events and recognizing their impact on the state of the corresponding resources. Using the business systems constructs and propagation rules, Tivoli Business Systems Manager combines the states of related resources and allows real-time monitoring of services.
Chapter 3. IBM Tivoli products that assist in service level management 103
� Tivoli Business Systems Manager history server and reporting system that provide Tivoli Business Systems Manager ASP reports
� Reports available using the Tivoli Data Warehouse reporting interface: Crystal Enterprise Professional for Tivoli
Tivoli Business Systems Manager information in the central data warehouse database is also used by IBM Tivoli Service Level Advisor to generate SLA reports. IBM Tivoli Service Level Advisor uses a set of ETLs to extract data from the central data warehouse database to the SLM measurement data mart database for further analysis and reporting. For details about Tivoli Data Warehouse and IBM Tivoli Service Level Advisor data sources, see Chapter 4, “Planning to implement service level management using Tivoli products” on page 109. Each data source has a unique code that identifies the product with which it is associated.
3.8.4 Fault managementTivoli Business Systems Manager processes real-time events that are captured from a variety of data sources, stores them in the Tivoli Business Systems Manager database, and posts the appropriate alerts to the corresponding physical resources. Each incoming event has a predefined alert state and priority and is identified with the specific resource instance.
Events affect the state of a resource. Tivoli Business Systems Manager propagates state changes upward to affect the resource’s parents and to facilitate the determination of the status of Business views. Propagation is implemented by generating a child event to parent resources. Tivoli Business Systems Manager can regulate propagation through a number of propagation rules. For details about propagation scenarios, see Chapter 4, “Planning to implement service level management using Tivoli products” on page 109.
Tivoli Business Systems Manager provides several technologies to visualize resources, business systems, events, relationships, and impact. Tivoli Business Systems Manager supports three types of consoles: Java Console, Web Console, and Executive Console. Each view and console is designed to add value in a particular way. When combined together, they deliver a powerful mechanism for real-time fault management.
Important: Tivoli Data Warehouse facilitates an integration of historical data from Tivoli and third-party products through a centralized database and a set of supported WEP. The main task is to install and schedule these WEPs. Since the size of a database depends on the size of the IT enterprise, it is critical to plan runs and estimate timings for each WEP.
104 Service Level Management
Tivoli Business Systems Manager is designed to manage events in the SLM context through automatic alert propagations to prebuilt and dynamically constructed business systems and services. Tivoli Business Systems Manager events are preclassified by the resource class, alert state, priority, and event type. Most of the defaults can be customized via a GUI, and new resource classes and events can be added. For details about Tivoli Business Systems Manager events and their classification, refer to IBM Tivoli Business Systems Manager Administrator’s Guide, SC32-9085.
Tivoli Business Systems Manager provides management facilities, but a customer’s preparedness plays a significant role in achieving effective fault management. Some of the preparation activities are:
� Identify which events can cause outages; tune Tivoli Business Systems Manager red defaults
� Identify which events can cause degradation; tune Tivoli Business Systems Manager yellow defaults
� Consider business impact when constructing business systems
� Customize alert propagation rules to maximize alert management
� Find the best use of available views to match operational processes
Customers need to classify faults. Tivoli Business Systems Manager red alerts, particularly of critical or high priority, can be classified as faults. Tivoli Business Systems Manager yellow alerts, and perhaps some red alerts of medium and low priorities, can be classified as warnings.
Before rolling out Tivoli Business Systems Manager for production, do some preparation. Continuous adjustments and operational training help to improve the effectiveness of fault management and reduce the impact on service levels.
3.8.5 SLA reporting and alertingEvaluation of SLAs is one of the main functions of the IBM Tivoli Service Level Advisor product. IBM Tivoli Service Level Advisor automates service level assessment against the predefined thresholds and recognizes when SLAs are breached or about to be breached. In addition, IBM Tivoli Service Level Advisor
Important: A potential outage needs to be fixed as soon as possible to keep SLA attainment. Faults may arrive at a rapid rate and operators must respond to problems based on business impact. Prioritizing faults can greatly improve operators productivity and reduce problem investigation time. Effective use of event, impact, and topology views to evaluate events and their impact are essential to efficient fault management.
Chapter 3. IBM Tivoli products that assist in service level management 105
provides management reports about the actual service levels, SLA violation statistics, and trends toward SLA violations.
IBM Tivoli Service Level Advisor depends on the collected performance and availability data from a variety of monitoring and performance tools. This data is stored in the SLM measurement data mart, but all analysis and evaluation results are stored in the SLM database. You can retrieve the analysis data and summarize it into reports that you can view using a Web browser.
The SLM report console provides a colorful high level summary report that is displayed in table form, showing totals of trends and violations across the reporting period, grouped by realms and customers. Clicking the table cells invokes accompanying color charts and additional tables of summary information about trends and violations, key operations information, and specific details about particular customers and SLAs. For more details, refer to IBM Tivoli Service Level Advisor SLM Reports, SC32-1248.
IBM Tivoli Service Level Advisor analyzes data that is obtained from Tivoli Data Warehouse according to a predefined schedule. This data is evaluated for violations and trends toward future violations of the agreed upon levels of service. Notifications of violations and trends are sent automatically by a way of e-mail, SNMP traps, or IBM Tivoli Enterprise Console events.
IBM Tivoli Service Level Advisor performs evaluation of the aggregate data collected from Tivoli Data Warehouse against predefined breach values (for each metric and schedule state periods) to determine if service levels are being maintained. (If the breach value is violated, IBM Tivoli Service Level Advisor generates the violation event.) For example, the breach value defined for total is compared to the sum of all hourly values reported over the entire evaluation period. Accordingly, the breach value for maximum or minimum is compared to the lowest or highest single hourly value.
IBM Tivoli Service Level Advisor uses a linear algorithm or exponential stress detection algorithm to analyze existing measurement data and to predict trends toward violations. Both algorithms are active and evaluate the same data for trends according to their methods of evaluation. Due to the iterative estimations and calculations used by the exponential stress detection algorithm, no graphical trend line associated with this algorithm is displayed with graph data. Trend lines that are displayed with graphs are associated with the linear algorithm only.
If the predicted value approaches the breach value and if the value is predicted to exceed the breach value by either the linear or the exponential stress detection algorithm, then a trend detection event is reported. If there is an outstanding trend detection event, and the current evaluation value is significantly away from the breach value, a trend cancel event is reported. However, if a violation occurs after the trend detection event, a trend cancel event is never reported.
106 Service Level Management
IBM Tivoli Business Systems Manager V3.1 introduced the Executive View console, which provides a dashboard approach to presenting a service status to executives. Optionally, a service can show status information for IBM Tivoli Service Level Advisor as the Secondary Impact Information (SII) indicator. SII indicators do not follow the “normal” Tivoli Business Systems Manager status propagation rules. The status of an SLA SII alert is shown by a symbol rather than by a color.
IBM Tivoli Service Level Advisor can send SLA trend and violation events to IBM Tivoli Enterprise Console where they are trapped by a IBM Tivoli Enterprise Console rule and forwarded to Tivoli Business Systems Manager via the event enablement and the agent listener. SLA alerts are posted to the corresponding service object and can be viewed in executive console as secondary impact indicators. In addition, SLA alerts can be forwarded automatically to people on the notification list via IBM Tivoli Enterprise Console e-mail and paging facilities.
3.8.6 Problem and change managementTivoli Business Systems Manager provides an integration function to create and track problem tickets. This includes opening and maintaining problem tickets that are stored and processed within a problem management application and automatically creating problem tickets when certain types of messages or exceptions are generated. Another area of integration is creating and tracking change requests.
The Tivoli Business Systems Manager integration function is implemented using request processors. A request processor is any program or script that can process command line input parameters, read a text-based input file containing data passed from the Tivoli Business Systems Manager integration function, and create a text-based output file with the results received from the problem or change management system integrated with Tivoli Business Systems Manager.
The following types of request processors can be used:
� Problem request processor: This is any request processor that implements interfaces for entering data and generating requests to create, query, search, find, retrieve, and update problem tickets. The Tivoli Business Systems Manager problem integration function displays the menu options for the BSM
Important: The actual evaluation takes place automatically when the IBM Tivoli Service Level Advisor ETL completes its operation of moving the most recent measurement data from the data warehouse into the SLM measurement data mart. However, IBM Tivoli Service Level Advisor also enables additional advanced settings for intermediate evaluations, frequency of trend analysis, and logging messages for missing data.
Chapter 3. IBM Tivoli products that assist in service level management 107
problem ticket processing. Then it transfers control to the user-written program for integration with user’s problem management application.
� Change request processor: This implements interfaces for entering data and generating requests to create, query, search, find, retrieve, and update change requests. The Tivoli Business Systems Manager change integration function displays the menu options for the Tivoli Business Systems Manager change request processing. Then it transfers control to the user-written program for integration with user’s change management application.
� Automatic ticket request processor: This is any request processor written by users that can process command line input parameters, read a text-based input file containing the data passed from the Tivoli Business Systems Manager automatic ticket integration function, and create a text-based output file to contain problem ID returned from the problem management application.
The automatic ticket integration function differs from the problem and change integration functions within the Tivoli Business Systems Manager product. It does not have a console interface. Its sole function is to create problem tickets and optionally generate automatic notifications by pager or e-mail.
The automatic ticket integration function interacts with a user’s request processor when message or exception events are sent to Tivoli Business Systems Manager. All events are processed by the automatic ticket integration function based on predefined automatic ticket event rules that provide criteria for passing the matched events to the request processor.
When Tivoli Business Systems Manager console is set up to work with problem and change managements systems, the user can perform the following tasks:
� Create, find, update, and close problem tickets
Two types of create are supported (from the context menu of a resource and from an ownership note)
� Create, find, update, and close change requests
Important: Tivoli Business Systems Manager provides integration functions and request processors for problem, change, and automatic ticketing. Users must develop their own customized programs that can interface their change and problem management systems. Most problem and change management applications provide some type of APIs. After a Tivoli Business Systems Manager request is processed, interface programs must return control to the Tivoli Business Systems Manager exit point and provide notification of results.
108 Service Level Management
Chapter 4. Planning to implement service level management using Tivoli products
The starting point for this chapter is that a decision has been made to implement service level management (SLM) in accordance with IT Infrastructure Library (ITIL) recommendations. Also IBM Tivoli Business Systems Manager and IBM Tivoli Service Level Advisor are used as key parts of the overall solution.
The chapter was written from the perspective of an IT consultant assigned to plan and implement a solution. It covers the following topics:
� An overview of the SLM process introduced in Chapter 2, “General approach for implementing service level management” on page 23, with each stage described in the context of IBM Tivoli products
� In-depth technical overview of the IBM Tivoli products that are used for SLM
� In-depth technical description of selected new features of IBM Tivoli Business Systems Manager V3.1 and IBM Tivoli Service Level Advisor V2.1 that are exploited for SLM
� Brief overview of additional IBM Tivoli products that are used for SLM
4.1 Implementing SLM using Tivoli productsThis section reviews the stages of implementing SLM described in Chapter 2, “General approach for implementing service level management” on page 23. It describes each stage in the context of using the IBM Tivoli products introduced in Chapter 3, “IBM Tivoli products that assist in service level management” on page 53. It explains briefly how IBM Tivoli products contribute to each stage of the SLM implementation process.
Figure 4-1 illustrates the planning, implementation, on-going SLM program, and improvement process stages.
Figure 4-1 SLM processes implementation approach
Planning
Established decision to implement SLM
Define key players:- Project Sponsor- Service Level Manager- Project Manager- Business Representatives- IT Representatives
Understand the services:- Define services- Establish initial perception of the services- Define expected quality of services
Assess ability to deliver:- Analyze existing infrastructure- Verify existing monitoring capabilities- Establish baseline for measurement
Implementation
Develop service level objectives- Describe services- Determine service level indicators- Determine metrics to be used
Negotiate on service level agreements- Review SLOs with business owners- Agree on metrics to be used- Agree on reporting requirements
Implement SLM management tools- Implementing additional monitoring capabilities- Enhance existing monitoring tools if required- Integrate data collected by monitoring- Implement Business Service management tools- Automate service management
Adjust IT processes to include SLM- Service Support processes- Service Delivery processes
On Going SLM programMaintenance of services definitions
SLA management via historical reporting
Priority management of real-time faults
Improvement ProcessImproving quality of service levels
Improving efficiency of SLM
Improving effectiveness of SLM
110 Service Level Management
4.1.1 PlanningDuring the planning stage, you should become familiar with the capabilities and features of the IBM Tivoli products that are available to you. You must also become familiar with any new products and revise perceptions of existing and installed products. What may now be an under-used event monitor may well become a key tool in SLM. This idea is explored further in “Understanding the services” on page 111 and “Implementing additional monitoring” on page 113.
Defining the key playersEstablish the providers and customers of SLM. Establish who will use SLM tools and their roles. When the users and roles are established, map them to the users and roles provided in IBM Tivoli Business Systems Manager and IBM Tivoli Service Level Advisor. The IBM Tivoli Business Systems Manager and IBM Tivoli Service Level Advisor user roles are described further in 4.2.6, “IBM Tivoli Business Systems Manager roles in an SLM context” on page 132. Practical application of these roles is detailed in the Part 2, “Case study scenarios” on page 195.
Understanding the servicesUnderstanding the services is a key part of SLM implementation. It is also particularly important to the IBM Tivoli Business Systems Manager implementation. See Chapter 2, “General approach for implementing service level management” on page 23, “Business process-based IBM Tivoli Business Systems Manager business systems” on page 122, and “Data gathering and business system decomposition” on page 134.
Assessing the ability to deliverIt is important to analyze the infrastructure to assess its capability for providing the services defined in the previous steps. It is also important to know the kind of applications that can monitor various variables of that infrastructure. Refer to Chapter 3, “IBM Tivoli products that assist in service level management” on page 53, for a brief description about some of the Tivoli monitoring applications that are available.
At this point, you can define a initial target for the level of service. For example, a service level agreement (SLA) for service A states that it has to be available for 99% of the time with a reporting period of one month. Review this initial target regularly because working toward an obviously unreachable target is unrewarding. You can use IBM Tivoli Service Level Advisor to gather basic metrics for this service. As new feeds and processes are introduced, you can change the SLA to suit the organization’s ability to deliver.
Chapter 4. Planning to implement service level management using Tivoli products 111
4.1.2 ImplementationThe implementation phase is when you install new Tivoli products and review existing Tivoli and other systems management products for SLM.
Developing service level objectivesAfter you understand the services, you can begin to define service level objectives (SLOs) for them. You define the SLOs in terms of the information available from the infrastructure. This means that you must base the objectives on what can be measured by the tools that are available. For this reason, review SLO definitions as new monitors are introduced. A new monitor can bring in new metrics that enable a different measurement of a service to be taken. Therefore, we recommend that you review the SLOs.
You can different types of metrics: external and internal. When developing SLOs, it is important to differentiate between internal and external metrics.
External metrics are defined in the SLA contract. They are visible to the customer. An example of an external metric is Overall Response Time of Service.
Internal metrics are accessory metrics from system monitors that can be used by the service provider in a proactive manner to ensure that the contract is being met. Internal metrics are not shown to the customer and are not part of the SLA contract. An example of an internal metric is Response time of DB2 Databases used by the Application.
Negotiate on service level agreementsAfter you develop the SLOs, negotiate the SLA. As in any negotiation, it is important that you have all the information available for this important step. The most important information is the current level of the service based on the metrics that were chosen in the previous step. You obtain this information by evaluating the historical data.
Assuming that the monitor applications have been collecting information from the infrastructure for some time, you can use the IBM Tivoli Service Level Advisor function to retrospectively see how you are doing.To see how to implement this, refer to 4.4.1, “Building SLAs in IBM Tivoli Service Level Advisor” on page 156.
After the negotiation, you may want review and adjust the SLA that was created.
112 Service Level Management
Implementing additional monitoringThis is an extremely critical stage and prerequisite for SLM. It covers the following tasks:
� Increase the rollout of existing systems management tools to cover gaps in monitoring.
The business process decomposition may reveal gaps in monitoring. Ensure whether these can be filled by your existing systems management tools.
� Re-assess, re-invent and exploit existing systems management solutions to cover gaps in monitoring.
This is an extension of the previous task. Most systems management tools have features and functions that are not exploited. Re-assess all the existing systems management tools to see if further exploitation can be done to cover the monitoring gaps.
� Review and re-engineer existing systems management solutions to ensure event quality.
IBM Tivoli Business Systems Manager and IBM Tivoli Service Level Advisor can only be as good as the information that is sent to them. If every event, trivial or critical, sent by the monitors is marked as critical, then there is no way to truly assess the business impact of the events. Every business system is marked as critical, and the management of the business processes will be essentially blind.
It is imperative that events sent from the monitors reflect the true severity of the event on the component, conform to message ID standards and, ideally, have a corresponding goodness event to close the original event if the bad situation no longer applies. It is often substantial work to standardize events, but it is a necessary work if SLM is to be successful.
� Implement new IBM Tivoli Monitoring products to cover gaps in monitoring.
Some of the monitoring gaps may not be covered by the existing systems management skills or products. Use IBM Tivoli Monitoring products to cover the remaining gaps. Examples are:
– IBM Tivoli Monitoring– IBM Tivoli Monitoring for Database– IBM Tivoli Monitoring for Business Integration– IBM Tivoli Monitoring for Web Infrastructure
These products measure the internal performance of systems and applications. The functionality includes continuous monitoring and recording of information, raising alerts when thresholds are exceeded, and gauging user experience by making response time measurements. These products can monitor hardware databases and applications.
Chapter 4. Planning to implement service level management using Tivoli products 113
� Implement IBM Tivoli Monitoring for Transaction Performance to provide user-experience monitoring.
User experience monitoring is key to providing an end-to-end view of a service. Implementing and exploiting IBM Tivoli Monitoring for Transaction Performance is explained in 4.5.1, “IBM Tivoli Monitoring for Transaction Performance” on page 190, and in Part 2, “Case study scenarios” on page 195.
Implementing SLM analytical and automation toolsThis is the actual implementation stage of IBM Tivoli Business Systems Manager and IBM Tivoli Service Level Advisor. In this stage, you also implement any required supporting tools such as Tivoli Data Warehouse and IBM Tivoli Enterprise Console (TEC). Details of implementation are covered in Part 2, “Case study scenarios” on page 195.
Establishing a reporting functionReports in this solution are on demand. You can request them to see the status of the services at any point in the evaluation period.
The main task here is to define the various users and the access they have to the information in the solution. For details about how to do this, see “Reports” on page 164. After you create the users, check the available IBM Tivoli Service Level Advisor reports to ensure that the users can see what they need to see.
For examples of the views that are available to the various users and roles, see Part 2, “Case study scenarios” on page 195.
Adjusting IT processes to include SLMSometimes it is necessary to revise operational processes and practices to ensure that SLM data is accurate. An example of this is to ensure that the state of the system or application is not considered during maintenance period because it may affect its over all availability.
Another example is to revise the change process as required. This ensures that the SLM tools are included in the scope of changes so that business systems and SLAs can be changed accordingly.
4.1.3 Ongoing SLM programThis task covers continuous monitoring, reporting, and reviewing of the SLAs. The main idea here is to be proactive and identify possible problems in the infrastructure before they impact the SLA at the end of the evaluation period.
114 Service Level Management
Many IBM Tivoli Service Level Advisor capabilities can be used for this.
� Trends toward violations
IBM Tivoli Service Level Advisor calculates trending toward violations for any metric selected to be part of an SLA. It analyzes the data for the metric and sends a trend event when the algorithm detects that the data shows a linear or stress exponential trend that may violate within a predetermined interval. See Chapter 5, “Case study scenario: IRBTrade Company” on page 197, for an example.
� Intermediate evaluations
These evaluations are done more frequently than the report one. A common situation is a monthly evaluation and a daily intermediate evaluation. With this, the IT organization can check everyday on the status of the various services it is providing and take action while it is possible to affect the SLA at the end of the month. For details about this function, refer to Part 2, “Case study scenarios” on page 195.
� Adjudication
In some situations, some violations will happen in conditions that, according to the SLA contract, can be adjudicated. An example of this is when the number of users, who are using a certain application, exceeds what was in the contract, so the violation for the month can be adjudicated. Refer to “Adjudication” on page 170 for details.
4.1.4 Improvement processSLM is a continuous process, and improvement opportunities do not end.
Reviewing service requirements changesAs mentioned earlier, it is important that changes to the environment are reflected in the SLM tools. You can use IBM Tivoli Business Systems Manager to enhance change requests and should be closely involved in planning service changes. By using the Business Impact view on an object within IBM Tivoli Business Systems Manager, it is possible to see every business process that can be affected by the change and manage the change accordingly.
Changes to services that require new components to be added should ensure that the new components are added to the IBM Tivoli Business Systems Manager business system before or when the change becomes active. If a new component is added before it becomes live, use the IBM Tivoli Business Systems Manager Maintenance function to suppress event propagation from the object while it is in test. This function is described in IBM Tivoli Business Systems Manager Administrator’s Guide, SC32-9085.
Chapter 4. Planning to implement service level management using Tivoli products 115
Decommissioning resources is not reflected in IBM Tivoli Business Systems Manager. A decommissioned object remains in the business system and no longer receives events. These decommissioned objects from business views have no effect on continued IBM Tivoli Business Systems Manager function. They can be cleaned up as a maintenance function to avoid having too many decommissioned objects.
You can use Automatic Business Systems (ABS) and Extensible Markup Language (XML) Business System building to ensure that changes to the service are reflected in IBM Tivoli Business Systems Manager. Failure to reflect service changes in IBM Tivoli Business Systems Manager reduces the effectiveness of SLM. Continued failure compromises SLM and renders the monitoring and metrics useless.
Reviewing and adjusting SLOs and SLAsAn SLA should have a periodic SLA review defined into the SLA contract. During the periodic review period, you can make time changes to the SLA to accommodate changes to the service without distorting the measurements. Examples of changes include:
� Changing breach values to accommodate new needs
This can be the result of a review, where more powerful resources were requested and the breach values were changed to reflect a higher level of service. For details, see Part 2, “Case study scenarios” on page 195.
� Metrics
Review the metrics that make up the SLO so that the value of the SLO is more tangible to the receiver of the service.
� Maintenance period
Set up new maintenance periods. You must change the schedule to accommodate new maintenance dates. See “Maintenance schedule” on page 175.
� Making adjustments
Replacements and improvements to resources may be necessary to maintain or reach the desired adequate level of service. Also, there may be cases when the service levels desired are unrealistic based upon the existing infrastructure and costs. In this case, adjust SLAs accordingly. To implement this, see “Changes to service level agreements” on page 169.
116 Service Level Management
Improving the SLM processesThe SLM process includes continuous evaluation and improvement. Areas of improvement include:
� Changing the intermediate evaluation frequency� Reducing the time to implement a change that can affect the SLA evaluation
outcome� Changing the number of people monitoring the SLAs� Adjusting separate SLA responsibilities per business unit� Creating customized Microsoft Excel reports� Adding more internal metrics to improve diagnostics, trends, or management
4.2 IBM Tivoli Business Systems Manager V3.1IBM Tivoli Business Systems Manager is IBM’s core business systems management product. This section introduces IBM Tivoli Business Systems Manager and provides a high-level overview of some IBM Tivoli Business Systems Manager concepts and features. It also provides in-depth examples of several IBM Tivoli Business Systems Manager features now in Version 3.1.
IBM Tivoli Business Systems Manager provides a common management console for users and roles across the enterprise from operations, through technical specialists and service management right up to executives. It provides operations with a view of system components as they relate to the business. It also provides service management and executives with a high level view of the status of predefined services across the enterprise.
IBM Tivoli Business Systems Manager receives systems management information from a large range of monitoring products on both z/OS and distributed systems. Plus it integrates with TEC and most IBM Tivoli Monitoring products to provide the ability to build consolidated views of the enterprise.
IBM Tivoli Business Systems Manager uses data structures called business systems. Business systems are built from objects defined to IBM Tivoli Business Systems Manager. Objects represent instances of the enterprise hardware and software components. Business systems can be built as models of actual business processes.
Systems management tools pass events to IBM Tivoli Business Systems Manager. These events are mapped to the actual object affected by, or that is issuing, the event. If the object is a component of a business process and it is built into a business system, then the received event is overlaid onto the object in the business system. This gives operations a graphical representation of the business process and the context of the event that is affecting it.
Chapter 4. Planning to implement service level management using Tivoli products 117
An event that affects a core business process causes the business system to be overlaid with a red or yellow icon (see following section) indicating the impact on the business process of the event. A similar event that affects a non-critical component does not light up the business system. Because IBM Tivoli Business Systems Manager graphically shows the event in the correct context, you can judge the impact and direct resolution efforts accordingly.
4.2.1 Propagation, alerts, and eventsEvents posted to IBM Tivoli Business Systems Manager set the receiving object to have an alert state and priority. An alert state of an object is its color: red, yellow, or green. Priority of an object is an indication of its severity. The range and order of oriorities is:
� Critical� High� Medium� Low� Ignore� Inherit from event
The default priority for objects is inherit from event. This causes the object to be overlaid with the alert state and priority carried by the received event. Where many exceptions are sent to an object, the object’s alert state and priority are set by the highest received event.
The combination of alert state and priority means that IBM Tivoli Business Systems Manager can have many different event types. The practical range of events that are used by IBM Tivoli Business Systems Manager is from low yellow to critical red. Each different alert state and priority combination in the practical range can be treated differently by individual objects in IBM Tivoli Business Systems Manager.
The Alert State and Priority of an object determine the propagation of events sent to it. Propagation is the process of overlaying received events onto an object and, if required, sending the event further up the business system tree. If the event is propagated up the tree, then it is considered to be a child event to the objects further up the tree. Propagation settings are customizable at object level. See “Resource level propagation” on page 136 for more details.
IBM Tivoli Business Systems Manager has two types of events that it can post to objects: messages and exceptions. Messages are state changes. A object can be only in one state at a time, such as Up. A stage change changes the state of the object so that it becomes another state, such as Abended. Similarly only one message can apply to an object at any time. Message are often, but not exclusively, state change events that set the status of the object. Messages are
118 Service Level Management
never cleared but are overlaid with other messages of the same or greater priority. For example, a high red message is overlaid with a high green message, sending the affected object to a green alert state.
Exceptions are more flexible. Any number of exceptions can apply to a single object. Most events from system management tools are posted as exceptions by IBM Tivoli Business Systems Manager. Exceptions are not overlaid by other exceptions unless the exception has an identical exception ID. In that case, the exception count increments. Outstanding exceptions can be cleared automatically when the problem is resolved by sending the same exception with the exception text of OK. For details about message and event handling, see IBM Tivoli Business Systems Manager Administrator’s Guide, SC32-9085.
4.2.2 Basic business system buildingThis section discusses the available methods of building business systems.
Drag and DropDrag and Drop business system creation is quick and easy to use. However large and complex business systems are time consuming to build using Drag and Drop. Up to 20 objects can be dragged and dropped at one time.
Drag and Drop is a good method for building complex business systems in environments where naming standards cannot be relied upon (see the following section). However Drag and Drop Business Systems do not automatically update for newly discovered objects and present a constant maintenance overhead.
Drag and Drop business systems have their uses. We recommend that, for production implementations where the currency of business systems is critical, use ABS and XML for business system building.
Automatic Business SystemsAutomatic Business Systems (ABS) has been available in IBM Tivoli Business Systems Manager since Version 2.1. IBM Tivoli Business Systems Manager V3.1 contains extra enhancements for ABS that allows it to exploit the new features of IBM Tivoli Business Systems Manager V3.1 such as resource level propagation and executive dashboard.
ABS requires you to know the design of the business system up front because configuration is required to define ABS builds. ABS relies heavily on attribute naming conventions and cannot be easily achieved if naming standards are not consistent.
Chapter 4. Planning to implement service level management using Tivoli products 119
ABS-created business systems are dynamically built and populated with all qualifying existing objects as defined in the ABS rules. Maintenance is especially low for keeping business systems up to date since newly discovered and created objects are automatically placed in business systems by ABS.
For instructions on using ABS, see IBM Tivoli Business Systems Manager Administrator’s Guide, SC32-9085.
XMLXML-built business systems are a new component introduced in IBM Tivoli Business Systems Manager V3.1. This feature allows business systems to be built and updated using XML and to be extracted and backed up as XML files.
The XML method was not used for this IBM Redbook. You can learn more about this method in IBM Tivoli Business Systems Manager Administrator’s Guide, SC32-9085.
4.2.3 Best practices for business system buildingBuilding effective business systems is an iterative process. The best practice is to use ABS, XML, or both wherever possible to reduce maintenance overhead. Business system building can produce a brief performance overhead on the IBM Tivoli Business Systems Manager system. This is normally minimal and not noticeable to IBM Tivoli Business Systems Manager users. However, use consideration when implementing large ABS or XML business systems since the initial business system population may impact users.
Business systems can be nested up to six levels, the maximum. Fewer levels are better since extra nesting levels increases the propagation workload. We recommend that you do not nest a business system under another copy of the same business system.
Business system names are important. ABS uses business system names as the main reference for building business system structures. Duplicated business system names cause unpredictable ABS results.
Business System ShortcutsIn previous versions of IBM Tivoli Business Systems Manager, you could produce many copies of the same business system and make a business system a child of it. This was an undesirable situation that created many performance problems. In IBM Tivoli Business Systems Manager V3.1, Business System Shortcuts (BSS) are introduced to control the number of copies of business systems.
120 Service Level Management
BSS are copies of a parent business system. The objects in the BSS are the same objects as in the parent business system. They are not duplicates.
Most of the properties of the parent BSS are inherited by the BSS, but you can change these properties in the BSS. If you change the parent’s properties, then the change is reflected in the children BSSs. You can unlink the properties of a child BSS and change them to suit the requirements placed upon the BSS. If required, you can relink the child’s properties back to the parent so that the child has the parent’s properties once again.
Some properties are not inherited by the child BSS. A business system that is defined as an Executive View Service does not automatically pass on this property to a child BSS.
We used BSS to allow different propagation rules to apply to the same business system so that different roles can get different information from the same business system structure. Chapter 6, “Case study scenario: Greebas Bank” on page 315, offers more information about exploiting BSS.
4.2.4 IBM Tivoli Business Systems Manager business system typesIBM Tivoli Business Systems Manager supports two types of business systems: technology based and business process based. Both types are identical in behavior but differ in ease of build and use.
Technology-based IBM Tivoli Business Systems Manager business systemsThe simplest business system to build in IBM Tivoli Business Systems Manager is a technology-based business system. It contains objects of the same object type, representing one technology, such as CICS regions, Windows 2000 servers, or DB2 databases.
Figure 4-2 shows an example of a technology-based business system. It is simply built by including all required CICS region objects under the parent BSV folder. This is done by using ABS rules, XML BSV definition, or Drag and Drop. Technology-based business systems are particularly easy to build using ABS because they are built by including all instances of the same object type regardless of the name. This process can be done for any technology tower that exists as an object type within the IBM Tivoli Business Systems Manager (TBSM) database.
Chapter 4. Planning to implement service level management using Tivoli products 121
Figure 4-2 Example of technology-based TBSM business system view
Business process-based IBM Tivoli Business Systems Manager business systemsA business process-based IBM Tivoli Business Systems Manager business system has a more complex construction than the technology-based business system. It is effectively a model of a real business process with all IBM Tivoli Business Systems Manager objects representing all the monitored components of the real business process.
122 Service Level Management
Figure 4-3 shows a schematic diagram of a business process business system. It shows the business process broken down into functions and the functions broken down into applications. The applications are made up of aggregations of technologies, such as servers and databases. Underneath the aggregation layer is the technology layer that represents the actual hardware and software. The monitors layer shows the feeds that go into IBM Tivoli Business Systems Manager. It does not represent components of the IBM Tivoli Business Systems Manager business system.
Figure 4-3 Business process-orientated business system
One of the most challenging parts of IBM Tivoli Business Systems Manager implementation is correctly identifying the components that make up the business process. Processes for gathering the necessary business process information are discussed in Chapter 2, “General approach for implementing service level management” on page 23, and in “Data gathering and business system decomposition” on page 134.
Chapter 4. Planning to implement service level management using Tivoli products 123
This type of business system can be built by using ABS. However the objects within scope must conform to naming standards so that they can be correctly placed by ABS. You can use XML to build the business system. This method is especially effective if you can obtain an XML extract of the component from a federation of monitoring databases or some other repository that contains details about the business process. Figure 4-4 shows an example of a business process-based business system. For clarity, this view is only partially-expanded.
Figure 4-4 View of business process-based business system
124 Service Level Management
4.2.5 IBM Tivoli Business Systems Manager views in an SLM contextIBM Tivoli Business Systems Manager has many different views available to users. This section discusses the most popular views and how you can use them in the context of SLM.
Tree viewThe IBM Tivoli Business Systems Manager tree view is the base view of IBM Tivoli Business Systems Manager. The Business Systems view and All Resources view are in tree format and all business systems open as a tree view by default.
The tree view is useful for the administrator to manipulate logic within the business system structure. The tree view is less useful for operational management of the components in the business system. Refer to Figure 4-4 to see the partially-expanded tree view of a business system.
Event ViewerFor users to quickly use and understand IBM Tivoli Business Systems Manager, the tree view can be enhanced with the IBM Tivoli Business Systems Manager Event Viewer. Figure 4-5 shows the IBM Tivoli Business Systems Manager Event Viewer for CICS events.
Figure 4-5 Using the IBM Tivoli Business Systems Manager Event Viewer
The IBM Tivoli Business Systems Manager Event Viewer shows events in the linear way similar to traditional systems management tools. This enables users to use IBM Tivoli Business Systems Manager quickly, without having to change working practices to adapt to IBM Tivoli Business Systems Manager. Note that, in Figure 4-5, the columns were resized and rearranged to make the view of
Chapter 4. Planning to implement service level management using Tivoli products 125
events more user friendly. From this view, users can take ownership of events, close out unnecessary events, and see who owns existing events.
HyperviewHyperview is a dynamic, real-time view of an exploded business system. This view offers a quick overview of a business system. Because the hyperview always centralizes on a click of a user’s mouse, it is a volatile view and can accidently obscure events in the hyperview.
Figure 4-6 shows a hyperview for a business system. The default for hyperview is a minimum alert state of green. This means that every object is shown. We recommend that you change this default because the console display becomes too busy.
Figure 4-6 Hyperview set to show the minimum alert state of green
126 Service Level Management
Topology viewThe topology view is automatically built from business systems. It can be used to display a business system and its components or simply the high level icon for the business system.
Where the hyperview is volatile, the topology view is static. Both views are real time and display events as they are received.
Figure 4-7 shows the same business system as shown earlier, but this one shows the general topology view. This option is available to show all details as in the hyperview, but the icons shrink as the view expands and the desktop becomes more difficult to use.
Figure 4-7 Topology view of business system: Not all detail enabled
Chapter 4. Planning to implement service level management using Tivoli products 127
IBM Tivoli Business Systems Manager also provides complex topology views for some mainframe feeds, such as CICS, IMS, and DB2. Technical support teams can use these views. For IBM Tivoli Business Systems Manager V3.1, IMS and DB2 topologies are new and the CICS topology view no longer requires CICSplex to be implemented. See Figure 4-8.
Figure 4-8 Sample IMS topology view
For details about exploiting the IBM Tivoli Business Systems Manager topology view, see IBM Tivoli Business Systems Manager Administrator’s Guide, SC32-9085.
Work spacesThe IBM Tivoli Business Systems Manager console can consist of several windows that contain any or all of the previously mentioned views. The IBM Tivoli Business Systems Manager administrator typically creates a set of views that are suitable for a role such as an operator or a database specialist. The administrator then saves the set of views in a work space. A work space can be assigned to specific operator and restricted operator IDs so that only these users can see the views. The administrator can also set work spaces to open on console startup.
Most IBM Tivoli Business Systems Manager windows examples in this document show work spaces. Figure 4-9 shows an example work space set up for three
128 Service Level Management
business systems using an Event Viewer in another window overview of all three business systems.
Figure 4-9 Sample work space using three topology views and Event Viewer
Web ConsoleFor IBM Tivoli Business Systems Manager 3.1, the Web Console was redesigned and introduces improved authentication using IBM WebSphere. It is a functional Web console based on Java that can be used by defined users to manage business systems and events. Some Java console functions, such as hyperview and the topology view, are not replicated in the Web Console. However, business system management is still easily achieved without these features.
The Web Console introduces the Critical Watch List (CWL).This is an administrator-defined list of business systems and individual resources that are kept on the user’s Web Console. From the CWL, a user can see events that are
Chapter 4. Planning to implement service level management using Tivoli products 129
posted to a business system and can drill down, assess the business impact and take ownership of the event. Actions taken on the Web Console are reflected in all other console types so that, for example, an event owned by a Web Console user, shows as being owned in the Java console and the executive dashboard.
Figure 4-10 shows a sample Web Console showing a CWL for a user with the operator role.
Figure 4-10 IBM Tivoli Business Systems Manager Web Console
Executive dashboardThe executive dashboard is a new concept for IBM Tivoli Business Systems Manager 3.1. The executive dashboard is designed to inform senior managers of overall service status without providing technical detail that is not necessary to that level of user.
An executive dashboard user can be notified of service status and SLA status but is not notified of problems and incidents that are not impacting the business process. The user can see that a business process is impacted and that the causing incident is being owned and managed. The user can also see when an SLA is trending toward violation and when an SLA is violated.
The executive dashboard enables senior management to be aware of business process status without forcing unnecessary training and information onto them.
130 Service Level Management
The executive dashboard is a non-intrusive console that can run minimized on a desktop. It is Web-based and accessible via a Uniform Resource Locator (URL) and does not require any code installation on the desktop.
There are two levels of executive dashboard user: executive and IT executive. The executive-level user is shown only the highest level of alerts and sees only non-technical messages. The IT executive-level user is expected to be used by more technically-aware managers. Therefore IBM Tivoli Business Systems Manager provides more technical detail to supplement the high-level alerting given to the executive-level user.
Figure 4-11 shows an executive dashboard that is seen by both executive and IT executive users.
Figure 4-11 Executive dashboard: One service in yellow status
Chapter 4. Planning to implement service level management using Tivoli products 131
Figure 4-12 shows the different information made available to each user. The dashboard on the left is for the executive user and shows service status. The dashboard on the right is for the IT executive and shows details about the affected resource.
Figure 4-12 Comparison of drill-down information available to each role
4.2.6 IBM Tivoli Business Systems Manager roles in an SLM contextIBM Tivoli Business Systems Manager V3.1 has the following user roles available. Each role has privileges and functions that enable users to perform the responsibilities assigned to them. The available roles are:
� Super administrator� Administrator� Operator� Restricted operator� IT executive� Executive
For a full list of functions and privileges available to each role, see IBM Tivoli Business Systems Manager Administrator’s Guide, SC32-9085.
The following section discuss the roles in an SLM context. This is explored further in the practical scenarios covered in Part 2, “Case study scenarios” on page 195.
Administrator and super administratorThe IBM Tivoli Business Systems Manager administrator roles are not directly relevant to SLM. That is, administrator users are responsible for administering IBM Tivoli Business Systems Manager views and users rather than SLM.
IT Executive UserExecutive User
132 Service Level Management
However, the administrator role is responsible for developing the business systems and views used by other roles to aid SLM.
Super administrators can create and administer CWLs for the Web Console and the equivalent in Java Console, which is Critical Resource Lists (CRL). CRLs are not widely used but are detailed in IBM Tivoli Business Systems Manager Administrator’s Guide, SC32-9085. The administrator cannot perform this task. Other than this, the two roles are identical.
The IBM Tivoli Business Systems Manager administrator should work closely with the IBM Tivoli Service Level Advisor administrator. This is so that the definition of IBM Tivoli Business Systems Manager Services as IBM Tivoli Service Level Advisor Services can be properly coordinated. See “Marking an IBM Tivoli Business Systems Manager business system as a service” on page 187 for more details.
OperatorThe operator is responsible for monitoring the whole or parts of the enterprise. This person needs to see all severities of events that affect components of the enterprise. It is good practice to send only events for service level managed resources to operators. Sending events from non-SLM resources can be distracting to operations and divert attention from SLM resources.
If a system has an SLA, send events to operations so that the system and the SLA can be managed. If a system has no SLA, then operations should not spend effort on resolving events for it.
Restricted operatorThe restricted operator is the same as the operator with additional restrictions. That is the restricted operator cannot view all business systems nor add resources to their own CRLs.
IT executives and executivesIT executives are IBM Tivoli Business Systems Manager roles created especially for SLM. This user ID is an executive Web Console user. Therefore, this person receives IBM Tivoli Service Level Advisor events overlaid onto the relevant IBM Tivoli Business Systems Manager business system.
The executive IT user receives service status from the business system icon and IBM Tivoli Service Level Advisor statuses for the service on the IBM Tivoli Service Level Advisor icon. They receive detail about the impact of an event as well as the event itself.
Chapter 4. Planning to implement service level management using Tivoli products 133
The executive user also receives service status from IBM Tivoli Business Systems Manager and IBM Tivoli Service Level Advisor. However this user does not receive details about events.
See “Executive dashboard” on page 130 for details and examples about the executive dashboards.
4.2.7 Understanding your servicesIBM Tivoli Business Systems Manager requires models of real business processes to be built as business systems. To do this successfully, the business processes should have all details made known and, wherever possible, be fully monitored. This section extends the discussions started in Chapter 2, “General approach for implementing service level management” on page 23, about gathering the necessary information to build a business system.
Data gathering and business system decompositionFigure 4-3 on page 123 shows a schematic for a business system. To build a business system, the IBM Tivoli Business Systems Manager customer must know the information about the structure of the business process. This information must be made available to the IBM Tivoli Business Systems Manager administrator so that this person can build the business system.
Many business process owners do not know enough about the components that make up their business, and a cycle of business process decomposition has to be performed. This process is not quick or simple and often relies on interviewing many people to extract the necessary information across all of the technologies. See Chapter 2, “General approach for implementing service level management” on page 23, for more details about this process.
Some work must be done and the information made available to partially map and model a business process. It is possible to have a partially-complete business system that enhances management of a business process. Although this situation is not ideal, 80% of a business system is far better than no business system at all. The components that are in the IBM Tivoli Business Systems Manager Business System still receive events and show the effect of the event upon the business process.
The problem is that not all of the business process is represented in IBM Tivoli Business Systems Manager. Therefore, there is a risk of a service-impacting event not being reported to IBM Tivoli Business Systems Manager. This can
Note: These user IDs do not have access to the other IBM Tivoli Business Systems Manager consoles.
134 Service Level Management
damage the credibility of both IBM Tivoli Business Systems Manager and the BSM approach. However, using IBM Tivoli Business Systems Manager with the awareness that not all the business process is covered still gives great value for the parts of the business process that are covered by IBM Tivoli Business Systems Manager.
Monitoring gaps can be overcome by using customer-experience software, such as IBM Tivoli Monitoring for Transaction Performance, to report on the end-to-end performance of the business process. It is important that the remaining components of the business system are discovered and defined to IBM Tivoli Business Systems Manager as soon as possible. See “Implementing additional monitoring” on page 113 for an overview of the methods to fill in the gaps.
Enhancing monitoringBusiness process decomposition frequently shows monitoring gaps. These occur when some components of the business process are not under the control of a systems management tool or organization. This is a common occurrence that is difficult to quickly overcome. It can be possible to plug gaps with existing systems management tools and then integrate them into IBM Tivoli Business Systems Manager. However often there are going to be gaps in the end-to-end monitoring of the business process.
It can be argued that an early benefit of IBM Tivoli Business Systems Manager is that it drives the customer to discover gaps in their monitoring. Regardless of the BSM tool that is used, gaps in the monitoring of a business process are undesirable and should be closed as soon as possible. For large monitoring gaps, a delay to IBM Tivoli Business Systems Manager implementation should be considered while the gaps are filled.
There are situations where a large part of the business process is not monitored because it is outside of the remit of the customer. A common example of this is when the network is out sourced. It is not desirable to bring network monitoring back in house for IBM Tivoli Business Systems Manager, because then both the network providers and the IBM Tivoli Business Systems Manager users monitor the network.
If you prefer to have end-to-end monitoring and want to include the network, we recommend that you use IBM Tivoli Monitoring for Transaction Performance V5.3 to replay transactions and measure the network latency. Any severe network latency in the sample transactions can be reported to IBM Tivoli Business Systems Manager. For details about IBM Tivoli Monitoring for Transaction Performance network latency measurements, see IBM Tivoli Monitoring for Transaction Performance V5.3 Administrator’s Guide, GC32-9189.
Chapter 4. Planning to implement service level management using Tivoli products 135
4.2.8 Using IBM Tivoli Business Systems Manager 3.1 features for the benefit of SLM
Of the many new features in IBM Tivoli Business Systems Manager V3.1, two of the most useful ones for effective SLM are resource level propagation (RLP) and percentage-based thresholding (PBT).
Resource level propagationRLP is a new feature of IBM Tivoli Business Systems Manager V3.1. In previous versions of IBM Tivoli Business Systems Manager, propagation threshold changes affected every instance of an object type. In IBM Tivoli Business Systems Manager V3.1, RLP is available and can be used to change the propagation behavior at object level rather than at type level.
RLP allows an administrator to set exception and child event thresholds for individual object instances. An administrator can use it to ensure that propagation behavior can be controlled at object level so that a business system can be customized exactly to suit requirements.
When RLP is carried out, the administrator sets the RLP settings for child events for an object so that the events from objects further down the tree do not propagate onto the object. This is explained in “Defining rules for the scenario” on page 140.
Figure 4-13 shows an example of RLP definitions for the child events of an object named ATM Network. The definitions allow propagation for these situations:
� Propagate any yellow event.� Propagate the seventh low red event received from child objects.� Propagate the fifth medium red event received from child objects.� Propagate the third high red event received from child objects.� Propagate all critical events.
136 Service Level Management
Figure 4-13 RLP set for red child events only
Percentage-based thresholdingWith the PBT method, a group of immediate, weighted, child resources are monitored by rules. When a percentage of these resources have an alert state (such as red), a preconfigured event is sent to the parent object where the PBT rules are set.
PBT rules are triggered when the following formula is satisfied:
%age_Min =< ((Alert_Weight / All_Weight) x 100 ) =< %age_Max
In this formula, note the following explanation:
� %age_Min: The lower limit of the PBT rule percentage range
� Alert_Weight: The total weight of resources in the desired alert state (for example, red)
� All_Weight: The weight of all resources in the scope of the PBT rule
� %age_Max: The upper limit of the PBT rule percentage range
Chapter 4. Planning to implement service level management using Tivoli products 137
A simple illustration is where four objects are covered by a rule. The objects each have a weight of 25 and the rule has to fire when three of the objects are red. Three red objects is 75%, so the rule fires when 75% of the objects are red. We set the range from 51% to 76% so that the rule doesn’t fire when two or four objects are red. This gives us the following values:
� %age_Min = 51 (more than two reds)� Alert_Weight = 75 (three reds)� All_Weight = 100 (all four resources)� %age_Max = 76 (less than four reds)
The formula is:
51 =< ((75 / 100) x 100) =< 76 TRUE
If only two objects were red, then the formula is:
51 =< ((50 / 100) x 100) =< 76 FALSE
For a practical run through PBT, see 4.2.9, “Using PBT and RLP to manage high availability scenarios” on page 139, and Chapter 6, “Case study scenario: Greebas Bank” on page 315.
Before you can use PBT, you must enable it for use by the IBM Tivoli Business Systems Manager Administrator. You do this using the Administrator Preferences option (see Figure 4-14). After PBT is enabled, you see the Propagation tab in an object’s properties window.
138 Service Level Management
Figure 4-14 Enabling resource level propagation
4.2.9 Using PBT and RLP to manage high availability scenarios
Using PBT and RLP together enables the administrator to customize business systems to suit specific user roles and preferences. Chapter 5, “Case study scenario: IRBTrade Company” on page 197, and Chapter 6, “Case study scenario: Greebas Bank” on page 315, detail a practical exploitation of these features to control which role sees which event in a business system.
As an introduction to RLP and PBT, we provide a simple scenario where we use RLP and PBT together to manage a set of high-availability servers. In this scenario, there is a business system of four servers. The servers function together as high availability load-sharing servers. All four servers perform the same role. However peak throughput of work on the servers is equal only to two
Chapter 4. Planning to implement service level management using Tivoli products 139
servers running at full capacity. The extra servers are provided for redundancy and service resiliency and to spread the workload across the all servers.
Due to the over capacity of the servers, up to two servers can be impacted by red events before there is a likelihood of the service being degraded. If three servers are impacted, there is a risk of service degradation because all the work is likely to be performed by one server. If all four servers are impacted, the service is severely impacted and possibly down.
In this scenario, we use RLP to ensure the following criteria:
� Any red or yellow objects: Show alerts on affected objects.� Up to two red or four yellow objects: Don’t propagate to the PBT Demo
business system.� Three red objects: Propagate a yellow alert to PBT Demo.� Four red objects: Propagate a red alert to PBT Demo.� Remove PBT alerts when only two red alerts remain on objects.
This scenario demonstrates two desired event behaviors that are now possible with IBM Tivoli Business Systems Manager V3.1:
� Managing redundant groups � Sending a yellow event from receiving red events
Figure 4-15 PBT Demo business system
Defining rules for the scenarioTo set up the necessary RLP and PBT settings to satisfy the previous scenario, you follow these stages as explained in the following sections:
1. Set RLP to stop child events from propagating.2. Create PBT rules for four red objects and three red objects.3. Create a clearing rule for two red objects.
Set PBT and RLP againstthis business system
140 Service Level Management
Setting RLP to stop child events from propagatingFrom the redundancy business system, you go to the Redundancy Properties window and click Child Events in the left panel, as shown in Figure 4-16. Then you set all thresholds to 100. In doing so, the threshold far exceeds the number of child objects and so it is never reached. This stops events from the child objects propagating up to this business system and beyond.
Figure 4-16 Using RLP to stop child event propagation
Usually, you must set the RLP at the level directly above the objects that are to be manipulated by RLP. If we set RLP at the PBT Demo business system, then the only child events that can propagate to this business system would have a priority of Critical.
Creating PBT rules for four red objects and three red objectsYou must set the PBT threshold rules at one level above the objects that are affected by the PBT rules because the scope of the PBT rules is the objects in the next level down the tree. In this case, you set the rules against the redundancy business system.
Chapter 4. Planning to implement service level management using Tivoli products 141
You start with the easiest rule to define, which is to send a red event when all four objects are red. Each object represents 25% of the total, so the percentage criteria to satisfy this rule is to have between 76% and 100% of in-scope red. The rule only fires when all four objects are red. See Figure 4-17.
It is equally correct for this rule to specify 100% as both the minimum and maximum percentage. However, for more complex PBT rules, it helps to ensure that the rules cover all situations so that all percentages are covered. As the math becomes more complex, the need to ensure that all percentages are covered by rules increases.
Figure 4-17 Rule 1: Severe impact
142 Service Level Management
This rule sends a critical red event when its criteria is satisfied. The event is posted against the redundancy business system object. Because this event is posted against the actual object, it is not a child event and so is not affected by the RLP settings done previously. The RLP settings only affect child events. The posted event is also propagated to the PBT Demo business system as desired.
The second rule covers the situation of three red child objects. The percentage range of this rule is between 51% and 75%, so it fires only when three of the four objects have a red event against them. See Figure 4-18. Three red events cause a yellow event to be posted to the redundancy business system object and up to PBT Demo as desired.
Figure 4-18 Rule 2: Service degraded
Chapter 4. Planning to implement service level management using Tivoli products 143
The ability to send a yellow event on receipt of red child events adds a lot of flexibility to IBM Tivoli Business Systems Manager. It also enables a lower severity event to be sent when the service is, for example, degraded but still available and working.
Creating a clearing rule for two red objectsThe third rule is to clear out the PBT-generated alerts when the situation of three or four red objects no longer occurs. Clearance can happen either when the events are owned or when the events are cleared by a green status event being sent to the objects. See Figure 4-19.
Figure 4-19 Rule 3: Clearing PBT-generated alerts
144 Service Level Management
Although some of the objects may have an outstanding red status, the green status is posted to the top-level business system because enough components are available and the business process is no longer impacted.
Figure 4-20 shows the completed Propagation properties for the redundancy business system. All of the child objects have an equal weight of 100, so they are included in the PBT calculations. The three rules described earlier are set and now the business system is ready to manage this high availability scenario.
Figure 4-20 Redundancy business system: Properties
Testing the scenarioYou send an event to each of the objects. Two objects receive low priority yellow events. Two objects receive high-priority red events.
Chapter 4. Planning to implement service level management using Tivoli products 145
The rules dictate that two reds do not cause propagation to the top-level business system. They also prevent propagation of any number of yellow events to the top-level business system. Without the rules, the red and yellow events would propagate to the PBT Demo business system. Figure 4-21 shows that the rules are holding. In this case, the RLP rules and the third PBT rule are in use.
Figure 4-21 Two reds, two yellows: No PBT events
A third red event is sent to the objects in the business system. This causes PBT rule 2 to fire. This rule is set to trigger when there are three red objects in the business system and to propagate a yellow event up to the high-level business system. Figure 4-22 shows how this happens.
146 Service Level Management
Figure 4-22 Three reds: PBT rule 2 fired, yellow event sent
Chapter 4. Planning to implement service level management using Tivoli products 147
A fourth red event is sent, so PBT rule 1 is triggered and sends a red event to the PBT Demo business system. This is shown in Figure 4-23.
Figure 4-23 Four reds: PBT rule 1 fired, red event sent
148 Service Level Management
When two of the events are owned, PBT rule 3 is triggered as, in this case, the alerts have been cleared from the objects. This sets them to a green status and so PBT Rule 3 is eligible to fire. Figure 4-24 shows this.
Figure 4-24 Events owned: PBT events cleared
Compare Figure 4-24 and Figure 4-25 where the alerts are not cleared from the owned events, so the objects stay red and PBT rule 1 is still in effect.
Attention: The option to clear alerts from resources when taking ownership can be set globally by the IBM Tivoli Business Systems Manager Administrator using Administrator Preferences. By default, the alert is left posted against the resource. The user can override this in the Take Ownership window. The administrator can change the default to clear all alerts and can remove the override option from the Take Ownership window.
Chapter 4. Planning to implement service level management using Tivoli products 149
Figure 4-25 Events owned: PBT events not cleared
4.3 Tivoli Data Warehouse V1.2Tivoli Data Warehouse enables IBM Tivoli Business Systems Manager data to pass to IBM Tivoli Service Level Advisor. It is the standard data store for Tivoli products. This section presents an overview about Tivoli Data Warehouse. It also discusses how IBM Tivoli Business Systems Manager data is stored in Tivoli Data Warehouse and how that data is extracted for use by IBM Tivoli Service Level Advisor.
Tivoli Data Warehouse is used to store, aggregate, and correlate the data from various monitoring applications. A typical data warehouse environment involves
150 Service Level Management
source and target databases. Such an environment enables the monitoring applications to run independently of each other. Data is moved from the source database to Tivoli Data Warehouse database using extract, transform and load (ETL) steps.
Since the monitoring applications used in this solution provide warehouse enablement packs (WEP), we deploy them for collecting monitoring and measurement data into the Tivoli Data Warehouse environment. Each application has a unique code identifying the application data in Tivoli Data Warehouse. The main task is to schedule the execution of these WEPs.
The data must be stored, aggregated, correlated from the source application databases into the data warehouse datamart databases. Therefore, it is essential for these WEPs to complete its run before the next cycle. The size of the databases in Tivoli Data Warehouse depends on the size of the IT enterprise.
IBM Tivoli Service Level Advisor mines data from Tivoli Data Warehouse. Therefore, you must schedule the WEPs. This enables IBM Tivoli Service Level Advisor ETL runs after the completion of all the ETLs for the monitoring applications to provide data to IBM Tivoli Service Level Advisor, including IBM Tivoli Business Systems Manager. If an organization has monitoring applications, you must install WEPs of these applications on the control center of the Tivoli Data Warehouse. Refer to the documentation provided to install these WEPs. The planning gives an estimated time to run each of these WEPs. Table 4-1 provides timing estimates.
Table 4-1 Monitoring applications with estimated runtime
Schedule the WEP of each application according to the estimated times. Set the WEP to run in test mode to confirm the estimated times. When you know the times, schedule the WEP accordingly and then move its steps into production mode. Similarly, plan and test the runtime for the WEP of IBM Tivoli Business Systems Manager.
Monitoring application Estimated daily run time
IBM Tivoli Monitoring for Web Infrastructure V5.1.2: WebSphere 15 minutes
IBM Tivoli Monitoring for Web Infrastructure V5.1.2: Apache Server 15 minutes
IBM Tivoli Monitoring for Databases V5.1.0: DB2 35 minutes
IBM Tivoli Monitoring for Transaction Performance V5.3 20 minutes
IBM Tivoli Monitoring for Web Infrastructure V5.1.2: OS Pack 40 minutes
Peregrine Service Center 10 minutes
Chapter 4. Planning to implement service level management using Tivoli products 151
Frequency of ETL runsThe frequency of ETL runs depend on the frequency of data collection by source monitoring applications. If a source application collects data at the end of each day, then the WEPs, including the IBM Tivoli Service Level Advisor WEP, can be scheduled to run every day.
We recommend that you schedule the ETL to cover the least granular of the source applications. For example, if IBM Tivoli Monitoring for Transaction Performance is scheduled to collect data into its database at 4 a.m. every day, and IBM Tivoli Monitoring for Operating Systems is scheduled to collect data into its database every four hours starting at 00:00 hours, then the first ETL can be scheduled to run every four hours starting at 00:30 hours or every day at 4:30 hours. Other ETLs are scheduled to run subsequently. Scheduling the ETL this way ensures that all the data is extracted, transformed, and loaded into the central data warehouse (CDW) database with minimum performance issues.
Using the IBM Tivoli Service Level Advisor ETL to extract Tivoli product data from Tivoli Data WarehouseAs we explain in Chapter 3, “IBM Tivoli products that assist in service level management” on page 53, IBM Tivoli Service Level Advisor uses a set of ETL steps to extract data from CDW database into SLM databases. The ETL steps in IBM Tivoli Service Level Advisor are grouped into four processes.
Figure 4-26 displays the four ETL processes for IBM Tivoli Service Level Advisor with msrc_cd value DYK. The details for each process are:
� DYK_m00_Initiate_Process: This process is not to be scheduled. It is supposed to be run only once after migrating from previous versions of IBM Tivoli Service Level Advisor.
� DYK_m05_Populate_Registration_Datamart_Process: This process extracts the resource definition data-type components, measurement types, attributes, etc. from the CDW to the SLM database.
� DYK_m10_Populate_Measurement_Datamart_process: This process extracts the measurement data of the resources from CDW to the SLM database.
� DYK_m15_Purge_Measurement_Datamart_process: This process prunes the aging measurement data periodically.
152 Service Level Management
Figure 4-26 ETL processes for IBM Tivoli Service Level Advisor WEP
The DYK_m05_Populate_Registration_Datamart_Process is referred as Registration ETL. The Registration ETL extracts the measurement type, component type data, and corresponding rules from the CDW to the SLM database. This also extracts the components, its attributes, and other relation into the SLM database. This data helps in defining the service levels objectives and SLAs. By default, the Registration ETL does not extract any data of the available data types from CDW until they are enabled. Before you run this step, you must enable specific source applications in IBM Tivoli Service Level Advisor.
To determine the available types of data in the CDW, connect to the central warehouse database (twh_cdw) database from a DB2 command window and may execute a select command as follows:
db2 connect to twh_cdw user <db2_Inst_Owner_ID> using <db2_Inst_Owner_PW>db2 select * from twg.msrc
Chapter 4. Planning to implement service level management using Tivoli products 153
This command has output similar to what is shown in Example 4-1.
Example 4-1 Contents of the twg.msrc table
MSRC_CD MSRC_PARENT_CD MSRC_NM ------- -------------- -----------------------------------------------------AMX Tivoli IBM Tivoli Monitoring AMY AMX IBM Tivoli Monitoring for Operating Systems BWM Tivoli IBM Tivoli Monitoring For Transaction Performance 5.2CTD AMX IBM Tivoli Monitoring for Databases: DB2 DYK - IBM Tivoli Service Level Advisor 2.1 Data ConsumerEVENTS - Events GWA AMX IBM Tivoli Monitoring for Web Infrastructure, Version 5.1.0: Apache HTTP ServerIZY AMX IBM Tivoli Monitoring for Web Infrastructure, Version 5.1.0: WebSphere Application ServerMODEL1 - Tivoli Common Data Model V1 SDESK1 - Service DeskSHARED - Shared SNMP - Simple Network Management Protocol Tivoli - Tivoli Application
For example, if SLAs must be defined using data from IBM Tivoli Monitoring for Operating Systems, then a value in the MSRC_CD column for that source application must be enabled in IBM Tivoli Service Level Advisor. To do this, from the IBM Tivoli Service Level Advisor server machine, follow these steps:
1. Launch a command window and change the directory to the location of the IBM Tivoli Service Level Advisor installation (C:\TSLA for example).
2. Run the following command for your system:
– For Windows
slmenv.bat
– For UNIX
. ./slmenv.sh
3. Run the command:
scmd etl getApps
This lists the applications that were added as shown in Example 4-2.
154 Service Level Management
Example 4-2 List of source applications added by default
Measurement Source Code: BWM Application Name: Tivoli Web Services Manager Flag: NMeasurement Source Code: APF Application Name: Tivoli Application Performance Management Flag: NMeasurement Source Code: DMN Application Name: Distributed Monitoring Classic Edition Flag: NMeasurement Source Code: GTM Application Name: Tivoli Business System Manager Flag: NMeasurement Source Code: ECO Application Name: Tivoli Enterprise Console Flag: NMeasurement Source Code: MODEL1 Application Name: Tivoli Common Data Model v1 Flag: NMeasurement Source Code: AMW Application Name: IBM Tivoli Monitoring Flag: N
4. If the required source application is not listed, then enable the data sources using the codes as listed in Example 4-1. Add and enable the codes that apply.
The process here is the same for all the other source applications for which the SLAs are to be created. Some applications may use the Tivoli Common Data Model whose msrc_cd is MODEL1. This is documented in each individual WEP document. Check forTWG.MsmtTyp table. If it says MODEL1 in the msrc_cd column, then enable MODEL1.
The DYK_m10_Populate_Measurement_Datamart_process is also referred as Process ETL. This process extracts the measurement data that is related to the components and measurement types that were extracted in the previous ETL process. This data is then evaluated for the existing SLAs.
Assuming that the runtime of the IBM Tivoli Business Systems Manager WEP is 15 minutes, schedule the IBM Tivoli Service Level Advisor WEP for two hours
Chapter 4. Planning to implement service level management using Tivoli products 155
and 30 minutes after the first WEP is scheduled. This ensures that IBM Tivoli Service Level Advisor obtains all the information from Tivoli Data Warehouse database. This avoids the SLA not being evaluated because the evaluation of the data is tied with the completion of the IBM Tivoli Service Level Advisor WEP.
4.4 IBM Tivoli Service Level Advisor V2.1In complex IT environments, business applications depend on the availability and performance of IT resources. It is important to define the various SLOs of these business applications. IBM Tivoli Service Level Advisor provides the ability to define the SLOs of the business applications. SLOs typically contain various metrics such as availability of an application and server and response time of a transaction. These metrics are all measured over a predetermined period of time as agreed in the SLA between the provider and receiver of the service.
IBM Tivoli Service Level Advisor analyzes the data provided to Tivoli Data Warehouse by various monitoring applications for the resources hosting the various business applications. IBM Tivoli Service Level Advisor uses the data to calculate the status of the service levels. Then if necessary, IBM Tivoli Service Level Advisor escalates the service level status of the business applications in case of a violation or trending toward violation.
SLOs of the various resources can be mapped to a business application or system. The service provider can show the service levels of any application.
4.4.1 Building SLAs in IBM Tivoli Service Level AdvisorThis section explains how to create SLAs in IBM Tivoli Service Level Advisor. The resource base to access all the information needed to build an SLA is the business services defined in IBM Tivoli Business Systems Manager. The tasks to create an IBM Tivoli Business Systems Manager-based SLA are:
1. Ensure that data from all monitoring applications, including IBM Tivoli Business Systems Manager data, is in the IBM Tivoli Service Level Advisor database.
2. Define schedules for IBM Tivoli Service Level Advisor.
3. Create and publish a service offering.
4. Create an SLA and assign the offering to it.
156 Service Level Management
Defining the schedulesThe day is divided into various periods to meet the criticality of the business. For example, the banking hours are from 9 a.m. to 5 p.m., Monday through Friday. We define periods to define higher SLOs during this period.
In another example, for online banking, it is critical to be operational every day. However, the response times for the transactions can vary depending on the time of the day. You can define periods to reflect this scenario as illustrated in Figure 4-27 for the banking business schedule.
Figure 4-27 Banking business schedule
In IBM Tivoli Service Level Advisor, you can define two of types schedules: auxiliary and business schedules. The periods defined in auxiliary schedules take precedence over the periods defined in a business schedule.
Auxiliary schedules are used to define the schedule periods that are common to all the business units in the organization. For example, you can include the holidays of the organization where the service levels of the objectives don’t matter. Similarly, to define a maintenances period, auxiliary schedules are used as well. You can include one or more auxiliary schedules in a business schedule, but auxiliary schedules cannot contain an auxiliary or a business schedule.
Enabling hourly evaluation in IBM Tivoli Service Level AdvisorIBM Tivoli Service Level Advisor supports the evaluation of the SLOs to be run every hour, two hours, three hours, four hours, six hours, eight hours, daily, weekly, and monthly. By default only daily, weekly, and monthly intervals are supported. For hourly evaluations supported, run the following command from IBM Tivoli Service Level Advisor environment-enabled command window:
scmd mem showHourlyFrequencyIntervals enable
Creating SLOs with an hourly frequency depends on the source monitoring application data collected and extracted into the CDW database within that frequency. If you do not consider these items, you may receive unwanted results.
Chapter 4. Planning to implement service level management using Tivoli products 157
Building an offeringWe need a lot of information to build an offering. We concentrate on two items since they are less obvious than the other information. For a full, practical walk-through of defining an offering, see Chapter 5, “Case study scenario: IRBTrade Company” on page 197, and Chapter 6, “Case study scenario: Greebas Bank” on page 315. The two items are:
� How to select the right resource type � How to select the evaluation and intermediate evaluation frequencies
Selecting the resource typeThrough the business system view in IBM Tivoli Business Systems Manager, you see which components support a given service. For example, in Figure 4-28, you see the resources that support the Online Accounts service.
Figure 4-28 TBSM business view showing resources that support services
158 Service Level Management
We monitor a metric of either one business system or a component inside it. With this information, use the following steps to define the resource type to select in the IBM Tivoli Service Level Advisor offering.
1. Knowing the metric and the type of the component, know which application is used to monitor it. If this application is not installed yet, install it and its WEP. Then enable it inside. Refer to Getting Started with IBM Tivoli Service Level Advisor, SC32-0834-03.
2. Look in the application’s Warehouse Enablement Pack Implementation Guide, which you can find in the application CD that contains the WEPs. Go to the directory that contains the WEPs (should contain the acronyms wep, tdw, tedw, etl, etc.). Then go down through the directories until you find the doc directory. This one contains the document.
3. In the document, look for the following tables:
– Measurement type (table MsmtTyp)– Component measurement rule (table MsmtRul)
4. Look either for a metric in the MsmtTyp table or a component type in the MsmtRul table. If you start from the MsmtTyp table, you should see the MsmtTyp_ID (first column) of the metric you selected and the corresponding Comp_Typ_CD in the MsmtRul table.
Sometimes more than one CompTyp_CD may correspond to a given metric. Choose the one that you want to monitor. At the end of this step, you should have a component type (CompTyp_CD column in the MsmtRul table).
5. Find the Component Type (table CompTyp) table. With the CompTyp_CD information, find the corresponding CompTyp_Nm. This is the resource type that you should type into the IBM Tivoli Service Level Advisor offering.
In the case that you have more than one component type in the previous step, this table can help you decide which one to choose, because it gives you more information about each of the component types.
For example, with IBM Tivoli Business Systems Manager, if you go to the MsmtRul table in the enablement guide, you see only one component type, BUSINESS_SYSTEM. This translates to Business System in the CompTyp table. This is the resource to choose when selecting the resource during the offering creation. IBM Tivoli Monitoring for Transaction Performance is another simple case. In the enablement guide, the MsmtRul table has only one component type, BWM_TX_NODE, that translates to Transaction Node in the CompTyp table.
As another example, suppose that you want to use, as part of an SLA, the CPU utilization of one of our servers. IBM Tivoli Monitoring can collect this metric, specifically using IBM Tivoli Monitoring for Operating Systems. In the enablement guide, look at the MsmtTyp, search for the word CPU somewhere in the metric, and select the Percent of time that the CPU is idle for example. This corresponds
Chapter 4. Planning to implement service level management using Tivoli products 159
to MsmtTyp_ID 47. In the MsmtRul table, 47 corresponds to AMY_CPU. In CompTyp table, AMY_CPU is a system processor. Use this as a resource inside the offering.
In a third example, you want the number of HTTP sessions as the metric. You can collect this metric by the IBM Tivoli Monitoring for WEB Infrastructure. In the enablement guide, in the MsmtTyp table, choose the Number of concurrently live servlet sessions (load) metric. This is MsmtTyp_ID 15. In the MsmtRul table, 15 corresponds to IZY_SERVLET_SESS. In CompTyp table, IZY_SERVLET_SESS is the IBM WebSphere servlet session.
During the creation of the offering in IBM Tivoli Service Level Advisor, in the Select Resource Type pane (Figure 4-29), select one entry in the tree on the left. Then the resource types are displayed in the table on the right. The resource type that you want for the offering may already appear in the table in the left panel. This happens, for example, in the case where the resource type is of business systems and transaction node.
Figure 4-29 Select Resource Type table
160 Service Level Management
For System Processor, notice that it does not appear in the table. To enable it, select Host Monitored by IBM Tivoli Monitoring. This shows a table with three pages. If you advance to the last page, you see the System Processor resource type as shown in Figure 4-30.
After you select a resource type, click Next and then click Add. Then you reach the Select Metrics page. From here, you follow the steps that are presented in Part 2, “Case study scenarios” on page 195.
Figure 4-30 System processor resource type
Chapter 4. Planning to implement service level management using Tivoli products 161
Selecting the evaluation frequencyThe evaluation frequency depends on the reporting period that was defined in the signed SLA. It is usually monthly, but can be weekly or even a daily.
If intermediate evaluations are used, the minimum evaluation frequency that can be used depends on the variables discussed in “Defining the schedules” on page 157. Intermediate evaluations, by default, have only daily frequency. They can also be of hourly frequency, but hourly frequency should be enabled. Assume that the minimum evaluation frequency is every four hours and the evaluation frequency is monthly. In this case, the intermediate evaluation frequency is daily.
Building SLAsThis section explains how to select a service, how to select a resource, and how to select the SLA Start Date when creating the SLA in IBM Tivoli Service Level Advisor. For a full walk-through of the SLA definition, refer to Part 2, “Case study scenarios” on page 195.
Selecting the serviceOn the Select Service page, associate the SLA to the business service that describes the service the SLA is monitoring. In this case, the name of the service is the same as the business system in IBM Tivoli Business Systems Manager.
Define the business system in IBM Tivoli Business Systems Manager as a service to allow the association of an SLA to it. Refer to “Marking an IBM Tivoli Business Systems Manager business system as a service” on page 187 to do this. Then, run the IBM Tivoli Business Systems Manager WEP. Also run both IBM Tivoli Service Level Advisor Registration ETLs (Populate Registration and Populate Measurement) to make the information about the newly-created service available on the Select Service page.
For example, assume that you are creating an SLA for the Online Accounts business system shown in Figure 4-28 on page 158. On the Select Services page, you select the Online Accounts service as shown in Figure 4-31.
162 Service Level Management
Figure 4-31 Online Accounts service
Selecting the resourceThere are two ways to define resources in IBM Tivoli Service Level Advisor: dynamic and static. In the case of a dynamic list of resources, we define a set of filters and any resources that match the filters are used to calculate that specific SLO. If a new resource is added that matches the filters, this new resource is also included in the SLO calculation.
Static resources are selected using filtering criteria. There are no automatic additions to the resources that are selected, even if the new resource matches the filter.
Chapter 4. Planning to implement service level management using Tivoli products 163
SLA Start DateYou are required to specify the SLA Start Date when creating the SLA. The SLA Start Date can be useful in the following cases:
� If the SLA that is being created is to be started in the future
For example, if the SLA must start on a future date, set the start date accordingly. Then the evaluation of this SLA only starts from the date that was set in the future.
� Evaluate using historical data
Set the SLA start date to start in the past. This can help to validate the SLOs set for the resource using the existing infrastructure.
For example, if you set the SLA start date in the past, then using the existing monitoring data, the SLA evaluates up until the most recent ETL run. This gives you an idea about the SLA results. This may help you to determine if the SLO of that resource can be met using the existing resource. This option is viable only if the information is available in the Tivoli Data Warehouse.
� Different time zones
During the creation of the SLA, you can set the time zone of this SLA along with the start date. This sets the start time of the SLA in a different time zone, if required.
4.4.2 Supporting SLM with IBM Tivoli Service Level AdvisorThis section explains how to take advantage of some of the IBM Tivoli Service Level Advisor features to help support our SLM strategy. The examples in this section assume that the SLAs defined in Chapter 6, “Case study scenario: Greebas Bank” on page 315, are already created. That chapter also contains samples of reports that are used to measure SLM.
ReportsIn IBM Tivoli Service Level Advisor, the reports are on demand. This means that you, at any time, can obtain any report of what is currently happening with the SLAs. Depending on the type of user that is accessing the reports and its attributes, all the SLAs or a subset of them are available for viewing.
The type of reports that are available depend on the variables listed in the following sections.
Tip: When defining dynamic resources, select the Preview current evaluation filters option in the Filter Resources window to see the resources that currently match the filters.
164 Service Level Management
Types of usersThere are three types of report users: operator, executive, and customer. This is particularly important when creating the various report users.
Figure 4-32 shows the relationship among the various IBM Tivoli Service Level Advisor report users. Provider of services can be the internal IT department or an application service provider. Recipient of services can be the various lines of business inside an enterprise or the users of application services from the applications service provider. In either case, there is an SLA between the provider and the recipient of services. The report of this and other SLAs is the objective of each user according to each one’s perspective.
Figure 4-32 Report users relationship
The operator and the executive belong to the provider organization. They are responsible to provide services to the customer. AN SLA exists between the executive and the customer. The executive is responsible for the service, but the operator is the one who takes care of the day-to-day operations to guarantee the service level.
Therefore, the operator needs maximum details to diagnose any problems. The executive needs a high level idea of all the services provided, and the customer needs only the information about his or her own SLAs.
The following two objects in IBM Tivoli Service Level Advisor are important when dealing with reports:
� Customers are the recipients of service. In an operational level agreement (OLA), customers can help to distinguish the various internal providers of a service or in a underpinning contract to designate the external provider of service.
SLA
Customer
Recipient of Services
Executive
Operator
Provider of Services
Chapter 4. Planning to implement service level management using Tivoli products 165
� Realms are sets of customers. Realms can be used to group customers functionally, geographically, etc. For an example, refer to Chapter 6, “Case study scenario: Greebas Bank” on page 315.
When creating report users, one way to restrict what the user can see is to limit the information of the SLAs only to the ones that belong to a specific customer or realm. This is particularly useful when the user type is customer. The reason is because you don’t want customers to have access to other customer’s data. You may also want to assign operators for certain set of customers or realms.
When creating customers and realms, take all of this in consideration. The user can have three different types of views as summarized in Table 4-2. The external view cannot see internal-only metrics. It is a good view for a customer user type, because customers should not see OLA metrics used to support the SLA. Also this view allows restriction by customers or realms. Customers should not have information about other customers. The unrestricted view is for operators and managers who are responsible for all the services provided by the IT department or by the service provider. The restricted view can be used when IT operators or managers are responsible for part of the services or the infrastructure and you want to restrict the information to which each one can have access.
Table 4-2 Available views
You create the users using the IBM Tivoli Service Level Advisor command line interface (CLI) as shown in this example:
This command creates a report user called BankingExecutive with an external view. This user is a customer type of user and is restricted to viewing reports of the customer Banking. Refer to Command Reference for IBM Tivoli Service Level Advisor, SC32-0833-03, for details about this CLI.
Types of reportsMany types of reports are available to IBM Tivoli Service Level Advisor report users. Table 4-3 lists the reports that are available to each user type. These reports include all the SLAs to which a particular user can have access.
Views Can view all? Can view internal only metrics?
Value in the addUser CLI
Unrestricted Yes Yes 1
Restricted No, restricted to customer/realm Yes 2
External No, restricted to customer/realm No 3
166 Service Level Management
Table 4-3 Available reports by user type
The dashboard reports are, by default, the first page that a user see when logging in. They give an overall idea of the status of all the SLAs a user has access to or to all the customers (depending if you are a executive user) for whom the user is responsible. See Figure 4-37 on page 174 for an example.
The user can modify the time range or the SLA types listed, using the Filter Criteria section in the report. In this view, the user can easily see where problems or potential problems are and explore details to find the causes. The user does this by clicking in the cell that shows the violations or trends (red or yellow cell). Then they see the SLA Details view. For more information about the contents of this type of report, see IBM Tivoli Service Level Advisor SLM Reports, SC32-1248.
Ranking reports (Figure 4-33) consider the number of violations, trends, and SLAs, and display them in order. This is used to quickly find the most impacted objects (SLA, SLA type, resource, customer, realm, or offering component) in order. It uses an algorithm to define the rank. For details about the algorithm, see IBM Tivoli Service Level Advisor SLM Reports, SC32-1248.
Operator Executive Customer
Dashboard
Customers by Realms Yes Default No
SLA by Customers Default Yes Default
Ranking
SLA Yes Yes Yes
SLA Type Yes Yes No
Customer Yes Yes No
Realm Yes Yes No
Offering Component Yes No No
Resource Yes No No
Details
Overall details Yes Yes Yes
SLA Results Yes No No
Trends Yes No No
Violations Yes No No
Chapter 4. Planning to implement service level management using Tivoli products 167
Figure 4-33 Ranking report
Details reports show more details about a set of SLAs, such as SLO results, trends, and violations.
Summary graphsIn some of the reports, summary graphs are displayed. Two sets of graphs can be displayed depending on the type of report that is shown.
For SLA details or Overall details reports, a pair of graphs is displayed at the top of the page. You can customize the type of graph and choose from the following variables:
� Metrics or resources� Trends or violations� Bar or pie chart
The graph can be displayed for the metrics or the resources with most trends or violations.
168 Service Level Management
For the ranking reports, eight different graphs can be displayed per object type (SLA, SLA Type, customer, realm, offering component and resource):
� Violations per object� Trends per object� Violations per time period� Trends per time period� Violations and trends per object� Rank per object� Top objects with the most violations� Top objects with the most trends
Figure 4-34 shows two examples of summary graphs. One example of using a ranking report is for the executive who wants to know about the resources that most contributed to violations in the last month.
Figure 4-34 Summary graph
Changes to service level agreementsAccording to ITIL, SLM is a dynamic process with constant reviews and improvements. In addition, the infrastructure is something dynamic that can change and evolve with time. The following sections show two change situations: changing SLOs and replacing resources. They also show how IBM Tivoli Service Level Advisor can handle them.
Chapter 4. Planning to implement service level management using Tivoli products 169
Changing service level objectivesThe first situation is when the SLOs are changed. This can happen in a regular SLA review. To set up the new service levels, create a new offering based on the original one (using the IBM Tivoli Service Level Advisor Create Like feature) and replace the offering in the SLA. Refer to Chapter 6, “Case study scenario: Greebas Bank” on page 315.
Replacing resourcesThe second situation is when a resource is replaced. For example, Server1 breaks and is replaced by Server2. In this case, it would be nice if the monitoring application that is monitoring Server1 starts monitoring Server2 as well. Then you should run the ETLs for both the monitoring application and for IBM Tivoli Service Level Advisor. With this, you can see a reference to Server2 during the Replace Resource in IBM Tivoli Service Level Advisor.
For example, consider that you want to replace S2STI-TBSMWebCons_67 with the Step_1... resource as shown in Figure 4-45 on page 185. Follow these steps:
1. Log in to the IBM Tivoli Service Level Advisor administrator’s console.
2. Click Administer SLA →Replace Resource.
3. In the Find Resource window, click Browse.
4. In the Select Resource Type window, select Transaction Node and click Next.
5. In the Create Filter window, complete these tasks:
a. Click Create Filter.b. In the Attribute field, select Transaction Management Policy.c. In the Value field, type S2STI-TBSMWebCons.d. Click Next.
6. In the Select Resources window, select S2STI-TBSMWebCons_67 and click Next.
7. In the Find Resource window, click Next.
8. In the Replace Resource window, repeat steps 3 to 7, but now choose the Step_1... resource. Select Online Accounts Trend SLA and click Finish.
9. In the Track Updated SLAs window, verify that the SLA is there and click Close.
This way the resources are replaced in the Online Accounts Trend SLA.
AdjudicationIBM Tivoli Service Level Advisor provides a way to adjudicate violations. In the SLA, you can specify situations where a violation can be adjudicated. For
170 Service Level Management
example, one situation can be that the service level is guaranteed only up to a certain number of users connected to an application running in WebSphere. You can use IBM Tivoli Monitoring for WEB Infrastructure live servlet sessions metric to monitor the number of sessions in a given server. When the number of sessions exceed a certain breach value, you receive a violation. This metric can be created in IBM Tivoli Service Level Advisor as an internal one, so that the customer does not receive the violation event. But with this, you can have a well documented way to justify the adjudication.
To adjudicate any violation, follow these steps:
1. Log in to the IBM Tivoli Service Level Advisor administrator console.
2. Click Administer SLAs →Manage Violations.
3. In the Manage Violations window, select the violation that is to be excluded and click Exclude.
4. In the Exclude Violation window, write the reason for excluding the violation and click OK.
Tiered SLAsIBM Tivoli Service Level Advisor has the capability to combine one or more SLAs into another one. Here you use this to create an SLA that includes all three banking SLAs. If any of these SLAs has a violation, the Banking SLA shows a violation. You also link this to the Banking business service, so that the Banking business system icon in the IBM Tivoli Business Systems Manager executive console shows any violations in any of the Banking services.
1. In the IBM Tivoli Service Level Advisor administrator console, click Administer Offerings →Create Offering.
2. In the Name Offering window, complete these tasks:
a. For Name, type Banking Offering.
b. For Description, type This offering includes all the SLAs in the Banking business unit.
c. Click Next.
3. In the Select SLA Type window, click Next.
4. In the Include SLAs window, click Add.
5. In the Select SLAs window, select all three SLAs:
Chapter 4. Planning to implement service level management using Tivoli products 171
6. In the Include SLAs window (Figure 4-35), click Next.
Figure 4-35 Include SLAs window
7. In the Select Business Schedule window, select 24 x 7 schedule and click Next.
8. In the next panels, click Next until you see the Summary window.
9. In the Summary window, select Publish the offering and click Finish.
Don’t include any offering components.
To create the SLA, follow these steps:
1. Click Administer SLA →Create SLA.2. In the Name SLA window, in the SLA Name field, add Banking SLA and click
Next.
172 Service Level Management
3. In the Select Customer window, select Banking and click Next.4. In the Select Service window, select Banking and click Next.5. In the Select Offering window, select Banking Offering and click Next.6. In the Select SLA Start Date window, click Next.7. In the Summary window, click Finish.
Now look at the reports for this SLA. Log in to the IBM Tivoli Service Level Advisor Reports interface as the SLA Administrator. Then click in one of the cells of the Banking SLA. Now you see the Banking SLA with the three other SLAs that it contains as shown in Figure 4-36.
Figure 4-36 SLA details
Chapter 4. Planning to implement service level management using Tivoli products 173
If you go back to the high level report, you will see that each violation on two of the SLAs are reflected on the Banking SLA (that is the parent). You also see that two of the component SLAs have one violation and that the Banking SLAs have two. Each of the component SLA’s violations is reflected in the parent or tiered SLA as shown in Figure 4-37.
Figure 4-37 Reports dashboard
Details of what is seen for SLA violations are given in the case study scenarios presented in Part 2, “Case study scenarios” on page 195.
If a violation or trend is propagated to this SLA from one of the associated ones, this event is sent to IBM Tivoli Business Systems Manager to be shown in the executive dashboard and is associated with the Banking business system.
174 Service Level Management
Maintenance scheduleIt is important to schedule preventive maintenance from time to time. Be sure to include a maintenance window in the signed SLA.
The maintenance, in this case, should happen every three months on a Sunday. The maintenance should be done from 0:00 a.m. to 2:00 a.m. on Sunday. To define this to IBM Tivoli Service Level Advisor, the only prerequisite is that the maintenance window is in the future.
The process to assign a maintenance window is to create a new schedule with a No Service period defined to cover the maintenance window and replace the existing schedule with it. Assume that today is 12 October 2004 and you want the maintenance to happen on 12 December 2004 from 0:00 a.m. to 2:00 a.m. Also assume that you want to do this maintenance in the resources that support the Online Banking service.
Changing the scheduleThe 24 x 7 schedule cannot be changed because it is used in some offerings. Therefore, create another schedule based on the one first. Follow these steps:
1. In the Administrator Console, click Administer Offerings →Manage Schedules.
2. In the Manage Schedules window, select 24 x 7 schedule and click Create Like.
3. In the Name Schedule window, complete these tasks:
a. For Name, select the 24 x 7 20041219M schedule.
b. For Schedule Description, the schedule is the same as the 24 x 7 schedule, except that it has a maintenance (no service) window on 19 December 2004 from 0:00 a.m. to 2:00 p.m.
c. Click Next.
4. In the Select Schedule Type window, click Next.
5. In the Include Auxiliary Schedules window, click Next.
6. In the Define Periods window, the original Critical period is already there. Add a No Service period. Click Create.
Chapter 4. Planning to implement service level management using Tivoli products 175
7. In the Create Period window (Figure 4-38), complete these tasks:
a. In the Frequency field, select Single Date.
b. The window changes for the options relative to Single Date.
i. In the State field, select No Service.
ii. Keep the Time Zone and Start Time as the default.
iii. In the End Time field, select 01:59.
iv. In the Date field, type 12/19/2004 or use the calendar icon on the right side of the field.
v. Click OK.
Figure 4-38 Maintenance period
176 Service Level Management
8. You return to the Define Periods window (Figure 4-39). The difference is that you added the No Service period. Click Next.
Figure 4-39 Modified schedule
9. In the Summary window, click Finish.
Chapter 4. Planning to implement service level management using Tivoli products 177
In the Manage Schedules window (Figure 4-40), you see the added schedule.
Figure 4-40 Schedules
Replacing the scheduleNow replace this schedule in the Online Banking Offering.
1. Click Administer Offerings →Manage Offerings.
2. In the Manage Offerings window, select Online Accounts Trend Offering and click Change.
Tip: As a general rule, create only one SLA for each offering. There are situations, for example, where the same type of service is provided to many different customers, using different resources. They have the same metrics, breach values, and schedules. In this case, using the same offering as a base for many SLAs can be lead to confusion and unnecessary complexity.
178 Service Level Management
3. In the Associate SLAs window (Figure 4-41), in the task list, click Select Compatible Business Schedule.
Figure 4-41 Offering tasks
Chapter 4. Planning to implement service level management using Tivoli products 179
4. In the Compatible Business Schedule window (Figure 4-42), select 24 x 7 20041219M schedule and click Next.
Figure 4-42 Select compatible business schedule
5. Continue clicking Next until you reach the Summary window.
6. In the Summary window (Figure 4-43), at the bottom, there is a table with all the SLAs that are affected by this change. Click Finish.
Figure 4-43 Affected SLAs
180 Service Level Management
7. In the Track Updated SLAs window, you see a table similar to the one in Figure 4-43 for tracking the SLAs that are affected by the change on this offering. Click Close.
Now the maintenance window is included. At the end of the month (monthly SLA period), the SLA will be calculated taking into account this maintenance period.
Adding a maintenance schedule period using CLIYou can perform the same operation using a CLI. You must follow this set of rules when running this operation from the CLI:
� The schedule period should be present in the Business/Auxiliary schedule to which this period going to be added and a breach value should be defined.
� A No Service period can be added even if it is not present in the existing Business/Auxiliary schedule.
� The schedule period can be added only for a single date in future.
� The schedule period can be on the same day if the time is in future.
� The schedule period cannot be added for a past time or date.
� The schedule period cannot span two dates even though the period is less than 24 hours. If the span must be two days, then two schedule periods should be added.
scmd mem addSingleSchedulePeriod -schedule “IRB Trade Business Schedule” -date 2004 11 21 -startHour 05 -endHour 12 -state 7
This adds a No Service state on 12 November 2004 between 05:00 hours and 12:00 hours. This CLI is helpful if you must suddenly set up a maintenance period by adding a No Service period.
TrendsAnother SLM tool in IBM Tivoli Service Level Advisor is the use of trends. Trends are automatically calculated in all the metrics selected for an SLA. To improve this capability, you can add another metric. This section explains how to add another metric, for example, and how to set the metric for trending analysis. The metric is to collect the performance on the same resource in IBM Tivoli Monitoring for Transaction Performance that is feeding a IBM Tivoli Business Systems Manager business system.
Chapter 4. Planning to implement service level management using Tivoli products 181
We already created the original SLA, Online Banking SLA. Now we modify this SLA to include this new metric and enhance the trend. For this, we include the same resource that is feeding events to the resources under Real-time Online Account Transactions.
The first stage is to modify the offering. Because IBM Tivoli Service Level Advisor does not allow you to add new service offering components, create another offering using the original one as a base.
The reason IBM Tivoli Service Level Advisor behaves this way is because the published offering can be assigned to some other SLAs other than the one you want to modify. This can cause changes on those SLAs when this was not the intention.
Creating the online accounts trend offeringTo modify the offering, follow these steps:
1. On the IBM Tivoli Service Level Advisor Administrator Console, click Administer Offerings →Manage Offerings.
2. In the Manage Offerings window, select Online Accounts Offering 20041001 and click Create Like. This creates a copy of the Online Banking Offering.
3. In the Name Offering window, complete the following tasks:
a. In Offering Name field, add Online Accounts Trend Offering.
b. In Offering Description field, add This offering will add the performance metric to improve trend capability.
c. Click Next.
4. In the Select SLA Type window, select External and then click Next.
5. In the Include SLAs window, click Next.
6. In the Select Business Schedule window, click Next.
7. In the Include Offering Components window, click Add.
8. In the Select Resource Type window (Figure 4-44), you see the resource that is under Real-time Online Account Transaction Business System. If you examine the details of this resource, you see that events are being sent from IBM Tivoli Monitoring for Transaction Performance to this resource. You also see that the name of the management policy is S2STI-TBSMWebCons.
Because Transaction Node is the resource type used by IBM Tivoli Monitoring for Transaction Performance, select Transaction Node and click Next.
10.In the Select Metrics window, select Response Time and click Next.
11.In the Define Breach Values window, complete these tasks:
a. As defined in OLA, in the Average files field, type 10.
b. For Keep Violation Condition with, select Actual average greater than supplied average.
c. Click Next.
12.In the Evaluation Frequency window, complete these tasks:
a. In Access to Results, select Internal Use Only. We don’t want business executives outside of the business unit to see this.
a. In Evaluation Frequency, select Monthly.
b. In Advanced Metric Settings, select Configure advanced metric settings.
c. Click Next.
13.In the Advanced Metric Settings window, complete these tasks:
a. In Intermediate Evaluations, select Perform intermediate evaluations.b. Still in Intermediate Evaluations, keep the Daily selection.
Chapter 4. Planning to implement service level management using Tivoli products 183
c. In Trend Analysis, select Current evaluation Period Only.d. Click Finish.
14.In the Include Metrics window, click Next.
15.In the Name Offering Component window, in Offering Component field, add Online account response time. Click Next.
16.In the Include Offering Components window, click Next.
17.In the Summary window, select Publish the offering and click Finish.
Creating the online accounts trend SLAFollow these steps to create the online accounts trend SLA:
1. In the Administrator’s Console, click Administer SLAs →Create SLA.
2. In the Name SLA window, complete these tasks:
a. For SLA Name, type Online Accounts Trend SLA.
b. For SLA Description, type This SLA contains the extra performance metric.
c. Click Next.
3. In the Select Customer window, select Banking and click Next.
4. In the Select Service window, select Real Time Online Account Transactions. Then click Next.
5. In the Select Offering window, select Online Accounts Trend Offering. Then click Next.
6. In the Add Resources to Business System Availability window, follow the same procedure as explained in “Selecting the resource” on page 163 and in Chapter 6, “Case study scenario: Greebas Bank” on page 315.
7. In the Add Resources to Online Account Response Time window, click Add.
8. In the Select Resource List Type window, select Static Resource List. Then click Next.
9. In the Filter Resources window, the name of the management policy is S2STI-TBSMWebCons. To select the resource that corresponds to this policy, follow these steps:
a. Click Create Filter.
b. A new row is displayed in the Resource Filters table. In this first row, under the Attribute column, click the arrow on the right side of the field and select Transaction Management Policy from the list.
184 Service Level Management
c. In the Value field, add any part of the name of the transaction management policy, for example, S2STI-TBSM.
d. Click Next.
10.In the Select Resources window (Figure 4-45), you see Step_1_..., which is a subtransaction of the other transaction. Select S2STI-TBSMWebCons_67 and click Next.
Figure 4-45 Filter Results
11.In the Add Resources to Online Account Response Time window, click Next.
12.In the Select SLA Start Date window, complete these tasks:
a. Make this SLA valid for the next month. In the SLA Start Date, specify the first day of the next month.
b. Click Recalculate First Evaluation Dates.
c. Click Next.
13.In the Summary window, click Finish.
Chapter 4. Planning to implement service level management using Tivoli products 185
Escalating the SLA eventsIBM Tivoli Service Level Advisor provides the ability for event escalation. The types of events are violation of SLA, trending toward a violation for SLA, trend cancel for SLA, and application event. IBM Tivoli Service Level Advisor also provides the ability to configure additional messages to be escalated using the following CLI command:
scmd log handler eventWatcher
The escalation message can be any of the following forms:
To enable TEC event escalation with service details when violation or trending toward violation occurs, load the sample ruleset provided with the SLM Event class definitions into the TEC Rule base. See Command Reference for IBM Tivoli Service Level Advisor, SC32-0833-03, for details to customize and enable the event escalation.
You can toggle on or off the event escalation for parent SLAs in the tiered SLA using the CLI:
scmd escalate parentSLAEscalation {true|false}
This disables any violation or trending toward violation event escalation to TEC. Load the sample TEC rule, slmDropParentEvents.rls, that is provided into TEC. After the rule is loaded and event escalation is switched on using the CLI, the parent SLA events can be controlled for escalation.
4.4.3 Realistic expectations for real-time SLAsTo be as close to real time as possible, you can reduce the evaluation period as much as possible up to one hour. The limit on how low you can go depends on how fast the source, IBM Tivoli Service Level Advisor ETLs, and SLA evaluation can be run. Refer to “Frequency of ETL runs” on page 152 for details.
4.4.4 Integrating IBM Tivoli Service Level Advisor with IBM Tivoli Business Systems Manager
Section 4.4, “IBM Tivoli Service Level Advisor V2.1” on page 156, introduces the concept of loading IBM Tivoli Business Systems Manager data into Tivoli Data Warehouse and extracting it to IBM Tivoli Service Level Advisor. This enables IBM Tivoli Service Level Advisor to use IBM Tivoli Business Systems Manager data to calculate SLA metrics. In “Escalating the SLA events” on page 186, you can learn how to send IBM Tivoli Service Level Advisor events to TEC. In
186 Service Level Management
“Executive dashboard” on page 130, you learn how the IBM Tivoli Business Systems Manager executive dashboard can receive IBM Tivoli Service Level Advisor events.
This section describes the process to pass IBM Tivoli Service Level Advisor events from TEC into IBM Tivoli Business Systems Manager.
Getting IBM Tivoli Service Level Advisor events into IBM Tivoli Business Systems Manager executive dashboardFor IBM Tivoli Service Level Advisor events to show in the correct icon on the IBM Tivoli Business Systems Manager executive dashboard, you must perform the following actions:
1. Place IBM Tivoli Business Systems Manager data into IBM Tivoli Service Level Advisor (TSLA). This is detailed in 4.4, “IBM Tivoli Service Level Advisor V2.1” on page 156.
2. Mark the IBM Tivoli Business Systems Manager business system as a service.
3. Build an SLA or SLAs around services defined in IBM Tivoli Business Systems Manager. This is detailed in “Building SLAs” on page 162.
4. Enable TSLA → TEC → TBSM event traffic and display it in the TEC console.
The following sections explain how to mark IBM Tivoli Business Systems Manager business services as a service. They also explain how to enable IBM Tivoli Service Level Advisor to send event data, using TEC, to IBM Tivoli Business Systems Manager for display in executive dashboard views.
Marking an IBM Tivoli Business Systems Manager business system as a serviceThe concept of services is shared between IBM Tivoli Business Systems Manager, Tivoli Data Warehouse, and IBM Tivoli Service Level Advisor. Basically, an entity defined as a service in IBM Tivoli Business Systems Manager will be a service within Tivoli Data Warehouse. It is also available as a service for selection during the SLA definition process in IBM Tivoli Service Level Advisor.
Marking a resource a service within IBM Tivoli Business Systems Manager can be done for both business systems and individual objects within a business system. Note that objects that are not in business systems cannot be marked as services.
Chapter 4. Planning to implement service level management using Tivoli products 187
To mark a resource as a service, click the resources’ Properties tab and select the Executive View tab. This opens the Executive Dashboard panel (Figure 4-46) for defining a resource as a service.
Figure 4-46 Executive dashboard window
The Executive Dashboard panel contains two check boxes and five text fields to complete (starting from the top of the right pane in Figure 4-46):
� Executive Dashboard Service check box
Selecting this box marks the resource as a service and eligible to appear as a service in the executive dashboard. Selecting this box also defines the resource as a service within Tivoli Data Warehouse and IBM Tivoli Service Level Advisor.
� Name of Service text field
This is pre-filled with the name of the resource.
� Service Identified text field
This is also pre-filled with the name of the resource. This is a unique identifier field. Once you set it, you cannot change it. This is so that the data going to Tivoli Data Warehouse is consistent even if the name of the BSV is changed.
188 Service Level Management
� Business Role of Service text field
This field is a free-form text field that is used to describe the service. Values that have already been placed in this field for other resources are available from the drop-down list to the right of the text field.
� Business Impact for Red Alerts field
This field is for defining the impact upon this Service when a red event is received.
� Business Impact for Yellow Alerts field
This field is for defining the impact upon this service when a yellow event is received.
� SLA Supported check box.
This check box enables the secondary indicator in the executive dashboard icon for the service. When you select this option, and the ETLs have run, the IBM Tivoli Business Systems Manager resource is a service resource within IBM Tivoli Service Level Advisor.
Enable TSLA →TEC →TBSM event traffic The IBM Tivoli Business Systems Manager executive dashboard is notified by TEC. TEC receives IBM Tivoli Service Level Advisor events as part of IBM Tivoli Service Level Advisor setup. To have TEC forwards events to IBM Tivoli Business Systems Manager, you must update the TEC rulebase. You do this by running a script that is provided with the IBM Tivoli Business Systems Manager code that is installed on TEC. The script is:
Running this script sets up everything. After this is done, IBM Tivoli Service Level Advisor events are sent to IBM Tivoli Business Systems Manager. If the events are for a service that is represented in the executive dashboard, the IBM Tivoli Service Level Advisor icons show that there are outstanding violations or trends.
You only need to perform this process once for each TEC feeding into IBM Tivoli Business Systems Manager. Figure 4-47 shows an executive dashboard that has non-viewed SLA violations (red square) and viewed SLA trends (blue arrow).
Figure 4-47 IBM TSLA notifications on a business system icon
Chapter 4. Planning to implement service level management using Tivoli products 189
4.5 Additional products supporting SLMThis section provides a brief description and information about additional products, mainly IBM Tivoli monitoring applications, that contribute to the SLM solution.
4.5.1 IBM Tivoli Monitoring for Transaction PerformanceChapter 3, “IBM Tivoli products that assist in service level management” on page 53, introduces IBM Tivoli Monitoring for Transaction Performance. It is used for monitoring user transactions on Web and desktop-based applications. It is useful for SLM because the user-experience events from IBM Tivoli Monitoring for Transaction Performance supplement the resource-specific events from IBM Tivoli Business Systems Manager for true end-to-end monitoring of a service.
For details about IBM Tivoli Monitoring for Transaction Performance implementation and exploitation, see End-to-End e-business Transaction Management Made Easy, SG24-6080.
Integrating IBM Tivoli Monitoring for Transaction Performance events into IBM Tivoli Business Systems ManagerIBM Tivoli Monitoring for Transaction Performance sends events to TEC through simple configuration of parameters on the IBM Tivoli Monitoring for Transaction Performance Management Server. You can pass IBM Tivoli Monitoring for Transaction Performance events on to IBM Tivoli Business Systems Manager by configuring TEC to forward the events.
1. Add the IBM Tivoli Monitoring for Transaction Performance baroc file and rule to TEC.
2. Extend the perl script to forward IBM Tivoli Monitoring for Transaction Performance events to IBM Tivoli Business Systems Manager.
3. Create generic objects in IBM Tivoli Business Systems Manager for IBM Tivoli Monitoring for Transaction Performance resources.
This is close to the same process used for sending any form of event from TEC to IBM Tivoli Business Systems Manager. This is described in IBM Tivoli Business Systems Manager Installation and Configuration Guide, SC32-9089, and in IBM Tivoli Business Systems Manager Administrator’s Guide, SC32-9085.
TMTP objects are standard generic TBSM objects, so they look like whichever icon is chosen for them by the IBM Tivoli Business Systems Manager Administrator when creating the generic objects. The actual IBM Tivoli Monitoring for Transaction Performance events contain a lot of details about the transaction and the thresholds as shown in Figure 4-48.
190 Service Level Management
Figure 4-48 A TMTP event as seen in IBM Tivoli Business Systems Manager
Using IBM Tivoli Monitoring for Transaction Performance for SLMThe four components of IBM Tivoli Monitoring for Transaction Performance can all be used for SLM with varying degrees of ease and granularity.
Synthetic Transaction Investigator (STI) is the easiest and most detailed component of IBM Tivoli Monitoring for Transaction Performance. STI records and replays Web-based transactions. For details about exploiting STI for SLM, see Chapter 6, “Case study scenario: Greebas Bank” on page 315.
Quality of Service (QoS) helps to give metrics of user response and overall user-experience of a transaction by using a reverse proxy to measure round-trip
Chapter 4. Planning to implement service level management using Tivoli products 191
time. QoS is potentially a performance overhead and is not covered further in this redbook.
IBM Tivoli Monitoring for Transaction Performance has rich J2EE Monitoring. This can be useful for monitoring a WebSphere-based J2EE application. Plus, the data from IBM Tivoli Monitoring for Transaction Performance can add a lot to SLM.
The final IBM Tivoli Monitoring for Transaction Performance component is the Rational Robot. You can use it to great effect by recording and replaying user transactions on desktop applications. The Robot is not restricted to Web browser transactions, so it has many uses. The Robot needs manually-added Application Response Monitoring calls placed into the Robot script so that metrics can be returned to IBM Tivoli Monitoring for Transaction Performance. To learn about exploitation of the Robot, see Chapter 5, “Case study scenario: IRBTrade Company” on page 197.
4.5.2 IBM Tivoli Monitoring for Operating SystemsIBM Tivoli Monitoring for Operating Systems provides automated monitoring of system resources. It provides the ability to detect the bottlenecks and other potential problems and automatic recovery from critical situations. The main features are:
� Data collection and problem analysis of the Windows, UNIX, Linux, OS/400 operating systems
� Available resource models that can report on the system status such as CPU usage, memory usage, etc.
� The ability to change the thresholds of the resource models to meet specific system requirements
� Seamless integration to TEC and IBM Tivoli Business Systems Manager
� Heartbeat function to check the availability of any system in the enterprise
4.5.3 IBM Tivoli Monitoring for DatabasesIBM Tivoli Monitoring for Databases provide the database administrator with:
� Performance metrics of the monitored database� Performance metrics of the database environment
This helps the database administrator to provide an optimally performing database environment by tuning the database applications, increase the throughput of the database, improve the processing efficiency of the database server, among other functions. The various metrics provided by this application
192 Service Level Management
allow you to define and create SLOs for the database that is provided by individual resource models of IBM Tivoli Monitoring for Databases.
4.5.4 IBM Tivoli Monitoring for Web InfrastructureIBM Tivoli Monitoring for Web Infrastructure is provided by two resource models of IBM Tivoli Monitoring:
� IBM Tivoli Monitoring for Apache Server provides the ability to:
– Register the resources in a Tivoli Management Framework and the managements functions such as start, stop and retrieve the status of the Apache HTTP servers, and retrieve the status of virtual hosts
– Monitor the performance and availability of virtual hosts run by each Apache HTTP Server
� IBM Tivoli Monitoring for WebSphere Application Server provides the ability to:
– Monitor the operations, performance, and availability of IBM WebSphere Application Sever resources across distributed environments
– Manage and store the data in CDW database for further data mining purposes
– Manage event correlation, when used in combination with TEC and IBM Tivoli Business Systems Manager Adapter facilities
– Give details about the performance of Enterprise JavaBeans (EJBs), servlets, usage of run-time memory, etc.
Chapter 4. Planning to implement service level management using Tivoli products 193
194 Service Level Management
Part 2 Case study scenarios
This part includes the following chapters:
� Chapter 5, “Case study scenario: IRBTrade Company” on page 197� Chapter 6, “Case study scenario: Greebas Bank” on page 315
This chapter describes a scenario that is based on the fictitious business, IBM Redbook Trade Company (IRBTrade Company), with a distributed only systems infrastructure. This business is experiencing difficulties in both the business and the Information Technology (IT) departments.
Although fictitious, the scenario is based on the collective experiences of the authors from working at major IBM client sites around the world.
5.1 Background of the business and its current issuesIRBTrade Company, a fictitious online trading company, is based in the Blue Ridge mountains of Asheville, North Carolina in the United States. Its client base is primarily individual investors who are comfortable with making buy, hold, and sell decisions on their own.
This section provides perspectives from both the business and IT services, laying out a case study scenario for which a service level management (SLM) solution is provided. This helps to identify the key players in the scenario and their respective viewpoints about the current issues with the IRBTrade Company.
5.1.1 The business perspectiveIRBTrade Company has three business units with managers who are responsible for:
� Marketing
This business unit is in charge of determining customer satisfaction and expanding the customer base by promoting superiority of the company’s services.
� Financial consultancy
This business unit is responsible for providing IRBTrade Company customers with up-to-date stock information in the form of links to other companies’ Web sites. It also provides market rating of the stocks in which customers are interested. The information provided by this business unit is readily available from other sources. This puts it all together into one package.
� Information Technology
This business unit is responsible for supporting the IT infrastructure, supporting and enhancing the online trading application, and assisting customers with the provided services.
Figure 5-1 shows the organizational hierarchy for IRBTrade Company that is relevant to the case study scenario. This case study focuses on the perspectives and needs of both the marketing and IT business units.
198 Service Level Management
Figure 5-1 Organization chart for the IRBTrade Company business units
IRBTrade Company began as a small online trading company with a loyal customer base. Since going public one year ago, the company has seen their customer base increase steadily. In addition, the recent economic upturn of the past few months has led to an exceptional growth of 50%, which is due also in part to such promotions as one free trade with every five and no commission day.
Recent research from marketing indicates that:
� Customers are satisfied with the low commission rates and the promptness and reliability of the service during off-peak hours.
� High-peak performance and availability are often unacceptable according to many customers. Specifically it can take two to three attempts to successfully login. This complaint is twice as common on promotional days.
� During peak times, transactions sometimes take so long to complete that the stock price has changed.
� Occasionally during peak times, the entire transaction times out and must be repeated.
� Overall performance on heavy trading days is poor. Heavy trading is usually caused by acts of terrorism, the exposure of corporate fraud, etc.
In this competitive market, customer loyalty is typically due to promptness, reliability, and per-trade commission rates. If customer satisfaction does not improve soon, customers will find another online trading company to use. The marketing business unit is concerned that poor performance factors on such days will decrease customer loyalty when less value for money is perceived.
Further research by marketing has shown that they can increase revenue if they can quantitatively prove the company’s superior service compared to its competitors. As a result of this research, marketing is willing to fund a project to implement SLM to facilitate its marketing strategy.
CEO
Marketing FinancialConsultancy
InformationTechnology
Chapter 5. Case study scenario: IRBTrade Company 199
5.1.2 The Information Technology perspectiveThe IT business unit provides all IT services for IRBTrade Company. This includes first-level technical support for customers, business application development and production environments, and systems management. It is divided into four groups with line managers for:
� Service desk
This group is responsible for assisting customers with the provided services.
� Application development
This group is responsible for application development. It designs, develops, and tests new features in a development environment before new features, versions, and releases can be deployed in the production environment. It is also responsible for defect correction.
� Application production and support
This group supports the online trading application. It works with the Service Desk group to assist customers with application specific questions. It also works with the application development group to coordinate the introduction of new code.
� IT infrastructure
The IT infrastructure group supports the infrastructure required to meet the organization’s business needs. It is divided into four teams:
– Web infrastructure: This team maintains the Web applications in use at IRBTrade Company.
– Databases: This team maintains all the databases used at IRBTrade Company and includes Oracle, Microsoft SQL, and IBM DB2.
– Network: This team maintains the network environment and infrastructure.
– Operating systems: This team maintains the system health of the UNIX and Windows servers in use throughout the company.
Summary of issues:
� Low customer satisfaction� Loss of customers in spite of promotional activities� Decreased customer loyalty� No tools to quantitatively prove IRBTrade Company’s superior service � Inability to understand the impact of peak loads on customer satisfaction� Reports provided by the IT business unit are written in technical terms and
do not contain information relevant to the business.
200 Service Level Management
Figure 5-2 shows the organizational hierarchy for the IT business unit.
Figure 5-2 Organization chart for the IRBTrade Company IT business unit
The IT business unit is constantly enhancing the online trading application by adding new features, making it easier to use, and by improving performance and system availability. However, since the results of these improvements are not visible to the marketing business unit, the IT business unit has been under pressure to demonstrate quality service.
The IT business unit is responsible for planning and implementing the SLM project funded by the marketing business unit.
Summary of issues:
� IT services provided by the IT business unit are not aligned with the current and future needs of the business.
� Perception of quality of delivered IT services is low.
� There is a lack of visibility of the work being done to improve the online trading application and underlying infrastructure support.
� There is a lack of understanding on the impact of IT services to the overall business of IRBTrade Company.
� Existing systems management tools are being under used.
� Reports are manually produced and do not provide information required by the marketing business unit as described in 5.2.3, “Reporting” on page 203.
InformationTechnology
ServiceDesk
ApplicationDevelopment
ITInfrastructure
ApplicationProduction
And Support
WebInfrastructure Databases Network Operating
Systems
Chapter 5. Case study scenario: IRBTrade Company 201
5.2 Existing IT infrastructureThis section describes the IT infrastructure that is currently in use by IRBTrade Company. The IT infrastructure includes a service desk application, load balancers, firewalls, Web servers, Web application servers, databases, networking, systems management and monitoring tools, and reporting applications that are developed in house.
5.2.1 Systems environmentIRBTrade Company has established a resilient distributed systems environment for the online trading application that includes a recovery site in standby mode, allowing quick recovery in case of failure of the main site. Figure 5-3 shows the production environment that is used for the online trading application and how customers obtain first line technical support. It shows only the components that are important for the case study scenario described in this chapter. It does not show the entire IT infrastructure of IRBTrade Company.
Figure 5-3 IRBTrade Company infrastructure schematic
202 Service Level Management
5.2.2 Systems managementSystems management and monitoring was implemented in the earlier stages of the production environment deployment. The systems management environment used at IRBTrade Company includes:
� IBM Tivoli products:
– IBM Tivoli Monitoring, IBM Tivoli Monitoring for Databases, and IBM Tivoli Monitoring for Web Infrastructure for monitoring operating systems, databases, Web servers, and Web application servers in production
– IBM Tivoli NetView for monitoring network infrastructure and servers availability
– IBM Tivoli Enterprise Console as a console consolidator for events and alerts coming from other monitoring applications
– IBM Tivoli Monitoring for Transaction Performance was deployed by the IT infrastructure group as a first step toward measuring user experience and transaction response time. Due to time constraints, the IT infrastructure group could not exploit the full capacity of the product. However, they obtained a confirmation that the performance of the online trading application was degrading. This confirmed is what the marketing business unit discovered on the customer surveys.
� A monitoring tool developed in house by the online trading application development team which provides availability data
This in-house tool verifies whether the online trading application processes are up and running and sends an event to the IBM Tivoli Enterprise Console in case of a change of status. It also stores application availability information in flat files, which are used later for generating online trading application availability reports.
� Peregrine ServiceCenter as their service desk solution (see Figure 5-3)
The IT business unit is aware of the fact that it makes limited usage of these systems management tools. When the SLM project is implemented, additional capabilities of these products will be configured along with deploying additional systems management products.
5.2.3 ReportingIndividually, each team of the IT business unit provides reports indicating overall availability of the system or software being maintained. These reports are produced manually and are often prone to errors.
More detailed reports from the operating systems group indicate periodic episodes of high CPU utilization, but nothing on a regular basis. Similarly, the
Chapter 5. Case study scenario: IRBTrade Company 203
Web infrastructure team reports some periods of high usage, but is unable to identify any trends.
All of the reports inform the IT infrastructure manager of periodic performance problems. However, there is no way to correlate all the information to what the surveys’ of the marketing business unit are showing and complaints in terms of performance and customer satisfaction.
When reports are provided to the marketing manager, the information provided mainly shows good to average availability and performance of the systems. However, they are written in technical terms, are not consolidated, and therefore, do not provide information that is relevant to the business.
5.3 A service level management solutionThe IT manager decided to promptly respond to the marketing business unit requests and agreed to initiate the SLM project proposed by the marketing business unit. He set up a task force to work on the issue and contacted IBM consultants to obtain practical advice and guidance on systems management.
An important aspect of implementing an SLM process in any company is to have buy-in and commitment throughout the entire process from all the parties involved. For IRBTrade Company, the project was requested and funded by the marketing business unit. But it was carried out by the IT business unit. During the task force initiative, the IT director was later nominated as the service level manager in charge of the entire project.
This section explains how the issues described in the previous section are resolved with SLM using the IT Information Library (ITIL) recommendations for process improvement as much as possible. You can find a summary of the ITIL approach for service management in Appendix A, “Service management and the ITIL” on page 447.
To summarize the ITIL process improvement model IRBTrade Company asks the these four questions:
� Where do we want to be?� Where are we now?� How do we get there?� How do we know we have arrived?
The following sections discuss the methodology that IRBTrade Company used to answer these questions.
204 Service Level Management
5.3.1 Where we want to beThis section defines the vision and business objectives of IRBTrade Company related to the SLM project. The following items represent the data gathered by the service level manager:
� The desired outcome of the SLM project� Services targeted for improvement� Service level objectives (SLOs) to be met
Table 5-1 lists the IRBTrade Company desired outcomes.
Table 5-1 Desired outcomes
5.3.2 Where we are nowAn assessment of the IT infrastructure’s ability to deliver services has been performed and current issues are already identified and documented. The goal of this assessment is to identify various services and service levels that are being currently achieved. We identify the cause and effect of one service over the other in providing the overall service to the IRBTrade Company customer. Then we use this information to make plans to fix and improve systems that provide maximum return on investment. The optimal result of this phase is to identify the root cause of the issues in technical terms as far as it is known.
Desired outcome Benefactor or comments
Organize IT resource groups to provide services according to the business model
Align IT services with business objectives
Identify potential services and desired SLOs
Formalize, automate, and quantify levels of service
Achieve the ability to monitor and forecast potential service impacts
Implement a proactive warning mechanism for potential service breaches
Define an SLM process that reflects ITIL recommendations
Timely, accurate, meaningful and automated SLA reporting as per agreement between business units
Prioritize a support effort to minimize business impact in case of IT failure
Align IT business unit with the needs of the business to improve the quality of service
Automate the escalation method Shift the culture of the IT infrastructure group from a reactive to proactive mind set
Implement a continuous improvement process
Ensure implemented processes are aligned with business objectives
Chapter 5. Case study scenario: IRBTrade Company 205
The main issue seems to lack correlation between the two organizations when evaluating the effective level of service that is being provided. Table 5-2 identifies this and other issues.
Table 5-2 Key issues
5.3.3 How we will get thereThe task force produces a plan for the SLM project. It makes some early decisions about how the currently deployed systems management and monitoring tools would be used to deliver the desired outcomes.
This section explains, at a high level, the steps that we take to achieve the objectives of the SLM project used by IRBTrade Company. This includes the tools to be used and the features of the tools that will address the problems previously identified.
As described in Chapter 2, “General approach for implementing service level management” on page 23, there are several tasks to perform when implementing SLM processes. The task force defined for IRBTrade Company decided to follow the ITIL model as close as possible and pursue the following high level steps:
Issue Impact
Low customer satisfaction Loss of customers; diminished growth of customer base; reduced marketing potential
Absence of quantitative data to support the level of service being provided by each organization, and then in turn to the customer
Inability of IT to address customer perception. Inability to prioritize resolution of incidents
Under utilization of the existing IT infrastructure and tools.
The inability to identify the areas of the IT infrastructure that are performing or not performing to the desired levels to meet the overall business goals of the company
No formal SLM processes in place; manual process for availability and performance reporting and analysis
Report creation takes too long; accuracy is questionable; reports are after the fact; there is no trend to failure; no proactive analysis
No clear understanding of the impact of IT failures on the business
No root cause analysis of business failures
No formal operational level agreements (OLA) or service level agreements (SLA) defined
Since there are no objectives to meet, there are no drivers to improve service levels
206 Service Level Management
1. Identify the services and business processes that will be part of the SLM project.
2. Identify the consumers, customers and providers of various services.
In this case study scenario, from a point of view that is external to the IRBTrade Company, the consumers and customers are the users of the online trading application. The provider is the IRBTrade Company.
From a point of view that is internal to the IRBTrade Company, the responsibilities of the provider go to the IT business unit, since they provide IT services that make up the online trading application.
3. Identify and reconcile customer requirements and provider’s capabilities.
4. Define SLOs and SLAs.
5. Identify and implement additional systems management and monitoring tools.
6. Identify the resources and components that make up the defined services.
7. Identify proper metrics for each defined service. Determine the desired metrics and the current monitoring sources. Perform analysis to determine if additional ones are needed.
8. Identify, implement, and customize monitoring tools and procedures for collecting metric data.
9. Identify the reporting frequency.
10.Identify and define executive views and assign proper services to the views.
11.Implement a proactive warning mechanism for potential service breaches.
12.Review and adjust processes whenever necessary.
Using tools and features to meet objectivesThe task force has identified improvements to the existing infrastructure. This includes the tools to be implemented or enhanced in the IRBTrade Company’s environment to complement the existing systems management infrastructure. The following list includes new products and additional instrumentation to already implemented products:
� Tivoli Data Warehouse V1.2 � IBM Tivoli Service Level Advisor V2.1� IBM Tivoli Business Systems Manager V3.1� IBM Tivoli Monitoring for Transaction Performance V5.3
Chapter 5. Case study scenario: IRBTrade Company 207
� Warehouse enablement packs (WEPs) for the following products:
– IBM Tivoli Monitoring– IBM Tivoli Monitoring for Databases– IBM Tivoli Monitoring for Web Infrastructure– IBM Tivoli Enterprise Console– IBM Tivoli Monitoring for Transaction Performance– IBM Tivoli Business Systems Manager
Chapter 3, “IBM Tivoli products that assist in service level management” on page 53, provides a high-level description of the IBM software tools that are used in this solution. This section explains how the specific features of IBM Tivoli Service Level Advisor V2.1 and IBM Tivoli Business Systems Manager V3.1 are used to meet the objectives of the SLM project for IRBTrade Company. Refer to 5.4.1, “Additional instrumentation required” on page 212, for specific information about how these features are implemented in our case study scenario.
Table 5-3 summarizes the IBM Tivoli Business Systems Manager features that are used.
Table 5-3 IBM Tivoli Business Systems Manager features and usage
Feature Reason for use
Business systems To create representations of business services to monitor from a business perspective
Executive dashboard services To enable critical business system status to be displayed in an executive view
Executive dashboard display To provide executive views showing service status with SLA indicators
To provide visibility of SLAs violations and trends for critical services
IBM Tivoli Business Systems Manager WEP
To enable IBM Tivoli Business Systems Manager business system availability data to be used in SLAs built with IBM Tivoli Service Level Advisor
Console consolidator To consolidate views and representation of IT resources, based on the administrator’s roles and responsibilities
208 Service Level Management
Table 5-4 summarizes the IBM Tivoli Service Level Advisor features that are used.
Table 5-4 IBM Tivoli Service Level Advisor features and usage
The service level manager assigned a team formed by technical and business representatives to decide on how to implement the features and customize IBM Tivoli Business Systems Manager and IBM Tivoli Service Level Advisor to achieve the desired results for SLM in IRBTrade Company. As described in Chapter 4, “Planning to implement service level management using Tivoli products” on page 109, the team performed the following activities:
Feature Reason for use
Realm and customer definition To segregate services for external and internal clients
Service offerings To provide options to define different options for SLOs and targets
IBM Tivoli Business Systems Manager/IBM Tivoli Enterprise Console (TEC) integration
To enable breaches and trends for services to be displayed on IBM Tivoli Business Systems Manager executive dashboards
Service Level notification To escalate via SNMP, TEC and e-mail when the SLO is breached or trending toward violation
Tiered SLAs To group various SLAs via tiered SLAs
Ability to add a maintenance window
Add an unexpected maintenance period to an active SLA
Adjudicate Violations To have the ability to adjudicate violations with an agreement between the customer and the service provider
Ability to plug-in any monitoring application
To have the ability to create SLAs using data from any monitoring application if the WEP is available
Create SLAs using Service Desk data
To have the ability to create SLAs using Peregrine ServiceCenter data using Peregrine’s TDW connector
Executive dashboard To display the SLA status using SLM reports
Provision of various evaluation intervals
To evaluate monitoring data using multiple interval frequencies such as hourly, two hourly, etc.
Wizard based Administration Console
To create an offering, schedule, customer, realm, etc.
Ability to deal with data from multiple warehouse databases
To use the provided WEP to extract data from multiple central data warehouse databases
Chapter 5. Case study scenario: IRBTrade Company 209
1. Identifies all the services that will be considered in the project2. Performs a service decomposition task to identify all the resources that make
up the service3. Decides on the relationships among the various resources4. Identifies the business system units5. Outlines the business systems views for each of the executives6. Defines the SLOs per business units 7. Establishes agreements on SLOs between business units representatives8. Determines the service level reporting content and frequency
The team created a high level representation of the various business systems, resources, executive views, SLAs and components, and reporting to use as a basis for IBM Tivoli Business Systems Manager (TBSM) and IBM Tivoli Service Level Advisor (TSLA) configurations for IRBTrade Company. See Figure 5-4.
Figure 5-4 High level view of TBSM and TSLA configurations
Refer to 5.4, “Implementation” on page 211, for details about how the configuration is performed in the systems management and monitoring environment of IRBTrade Company.
Legends:
Marketing
User Experience
- Customer Satisfaction
FinancialConsultancy
IT Infrastructure
SLA Definition
D
S SLA Report
Dashboard
Service
- OS Servers Support
- Database Servers Support
- Web Application Servers Support
- Web Servers Support
Trade Application
- OS Servers
- Database Servers
- Web Application Servers
- Web Servers
Development Service Desk
- External
- Internal
- Availability
- Response Time
User Load
Research
Information Technology
OLA
ServiceProvider
ServiceReceiver
OLA OLA
D S
CEO
D S
D S
SLA SLA
D
OLA
210 Service Level Management
5.3.4 How we will know we have arrivedThis section defines the factors that determine the success of the SLM project for IRBTrade Company. The service level manager obtained, from both business units involved in the SLM project, expectations and agreement about the accomplishment of the project, as follows:
� Improve perceived levels of satisfaction of the existing customer base.
� Acquire the ability to measure levels of satisfaction of existing customer base.
� Deliver business driven rather than technology driven IT services.
� Understand the impact of IT failures to the overall business.
� Demonstrate improved service delivery with proactive service management using predictive analysis and operational status alerts.
� Provide business executives with views of the overall IT services according to their business perspectives.
� Provide business executives with service level reports that are meaningful and relates to their business needs.
5.4 ImplementationThis section shows how the SLM processes is implemented in the IRBTrade Company. It also provides references to how the solution maps to ITIL recommendations in here supplement what we’ve said in earlier sessions.
The high level steps are:
1. Determine and implement additional instrumentation on the existing systems management environment of IRBTrade Company.
2. Determine and define business services and their infrastructure components at a high level.
3. Determine user roles for IBM Tivoli Business Systems Manager and IBM Tivoli Service Level Advisor.
4. Define the required IBM Tivoli Business Systems Manager resource types.
5. Create business systems based on business functions.
6. Agree and define content of executive dashboard views.
7. Agree and define SLOs.
8. Define the required metrics to measure SLOs.
9. Enable data sources in IBM Tivoli Service Level Advisor.
10.Set up IBM Tivoli Service Level Advisor schedules, realms, and customers.
Chapter 5. Case study scenario: IRBTrade Company 211
11.Set up offerings in the SLAs in IBM Tivoli Service Level Advisor.
12.Define the required SLAs in IBM Tivoli Service Level Advisor.
5.4.1 Additional instrumentation requiredTo enhance the SLM capabilities of IRBTrade Company, the company decided to implement the following additional instrumentation:
� Enhance the usage of existing monitoring capabilities using IBM Tivoli Monitoring.
� Improve the usage IBM Tivoli Monitoring for Transaction Performance and create user-experience based IBM Tivoli Monitoring for Transaction Performance transactions using Synthetic Transaction Investigator (STI) and Rational Robot components. The IBM Tivoli Monitoring for Transaction Performance transactions defined are based on the user transactions that monitor end-to-end activities in real-time on production system. They also collect data to measure the availability and performance characteristics of the service being provided to the customer.
� Deploy IBM Tivoli Business Systems Manager and create IBM Tivoli Business Systems Manager business systems to proactively monitor key IT resources and services.
� Deploy IBM Tivoli Service Level Advisor along with Tivoli Data Warehouse to create and document SLAs of various corresponding services identified by IBM Tivoli Business Systems Manager.
IBM Tivoli Monitoring instrumentationThe monitoring applications in Table 5-5 are in place to collect availability and performance information.
Table 5-5 IBM Tivoli Monitoring instrumentation
Resource Monitoring application
Web server IBM Tivoli Monitoring for Web Infrastructure V5.1.2
Web application server IBM Tivoli Monitoring for Web Infrastructure V5.1.2
DB2 server IBM Tivoli Monitoring for Databases V5.1.0
Trade/quote synthetic transaction
IBM Tivoli Monitoring for Transaction Performance V5.3
Event escalation IBM Tivoli Enterprise Console V3.9
IBM Tivoli Monitoring for Transaction Performance instrumentationTo enhance the SLM capabilities of IRBTrade Company, the company decided to monitor the user experience. This is based IBM Tivoli Monitoring for Transaction Performance transactions using STI and Rational Robot components, which can simulate and measure the IRBTrade Company customer and user transaction experience. The transactions defined are based on user transactions that monitor end-to-end transaction in real-time, on production systems. This type of transaction simulation and monitoring provide data to measure the availability and performance characteristics of the service being provided to the customer.
IBM Tivoli Monitoring for Transaction Performance STI or GenWin (Rational Robot) playback policies are created to run the following IRBTrade Company user experience related transactions. They are scheduled to run frequently to monitor and gather user experience data.
� IRBTrade Company Application Availability
This transaction verifies the availability of the IRBTrade Company home page. It generates an event if it fails to succeed in accessing the home page.
� IRBTrade Company General Web Site Response
This transaction accesses the IRBTrade Company Web site and measures the response time. If the response time is exceeds the threshold, then it generates an event.
� IRBTrade Company Online Quote Response
This transaction accesses the Web site, logs on to an account designated for this purpose, and performs a stock quote request (such as for IBM). If the response time exceeds the agreed and specified threshold, then IBM Tivoli Monitoring for Transaction Performance generates an event to IBM Tivoli Enterprise Console.
� IRBTrade Company Online Sell Transaction Response
This transaction accesses the Web site, logs on to an account designated for this purpose, and performs a stock sell order (such as shares of IBM). If the response time exceeds the threshold, then IBM Tivoli Monitoring for Transaction Performance generates an event to IBM Tivoli Enterprise Console.
� IRBTrade Company Online Buy Transaction Response
This transaction is defined to access the Web site, log on to an account designated for this purpose, and perform a stock buy order (such as shares of IBM). If the response time exceeds the threshold, then IBM Tivoli Monitoring for Transaction Performance generates an event to IBM Tivoli Enterprise Console.
Chapter 5. Case study scenario: IRBTrade Company 213
Figure 5-5 illustrates the IRBTrade Company user experience transactions as defined in the IBM Tivoli Monitoring for Transaction Performance console.
Figure 5-5 IRBTrade Company user experience-related TMTP transactions
Installing IBM Tivoli Monitoring for Transaction Performance management server, management agents, creating playback recordings, and policies to monitor the IRBTrade Company user experience are outside the scope of this redbook. Refer to IBM Tivoli Monitoring for Transaction Performance Administrator’s Guide, GC32-9189, for implementation details.
IBM Tivoli Business Systems Manager instrumentationIBM Tivoli Business Systems Manager V3.1 provides the capability to monitor business systems in real time in terms of availability and performance. Its business systems are defined based on what matters the most from a customer and IRBTrade Company business point of view, IRBTrade Company organizational structure, responsibilities, and dependencies between various groups.
214 Service Level Management
The business systems are defined to facilitate monitoring of service levels at each organization level (line management, senior management, and executive management) and to identify and define OLAs between the organizations. The existing monitoring capabilities using IBM Tivoli Monitoring are also integrated into the business systems to provide operational status of each IT resource that is critical to the business and to the service.
All IBM Tivoli Business Systems Manager business systems are defined using IBM Tivoli Business Systems Manager Java Console and drag-and-drop approach. For information about how business systems are defined, refer to the IBM Tivoli Business Systems Manager Administrator’s Guide, SC32-9085. The business systems defined for the IRBTrade Company SLM solution are presented in 5.4.2, “Identifying the business service” on page 216.
IBM Tivoli Business Systems Manager distributed resource types are defined to represent various IT resources and the IRBTrade Company user experience-related transactions. The resource types defined (as listed in 5.4.4, “Required resource types” on page 225) are based on the existing monitoring capabilities, potential internal and external services, and SLAs that facilitate implementation of SLM. Existing IT resource monitoring, IBM Tivoli Enterprise Console event sources, plus additional event sources as a result of deploying IBM Tivoli Monitoring for Transaction Performance user experience-related transactions are analyzed. These events are mapped to the appropriate IBM Tivoli Business Systems Manager distributed resources types defined.
TEC events are integrated into the IBM Tivoli Business Systems Manager distributed solution by:
� Mapping TEC events to the appropriate IBM Tivoli Business Systems Manager resource type and then to a specific instances of that resource type
� Using the TEC rules and a single perl script to forward the event to TBSM
Both IBM Tivoli Enterprise Console rule and script are listed in Appendix B, “Important concepts and terminology” on page 515.
� Forwarding the event data to IBM Tivoli Business Systems Manager using the IBM Tivoli Business Systems Manager Event Enablement component installed at TEC (via the ihstttec application programming interface (API) call)
The approach used in this case study scenario, using IBM Tivoli Enterprise Console rule and a script, is one of the many ways to integrate TEC events into TBSM distributed solution. Using the TEC rule and script to evaluate the event and then forward TEC events to TBSM via the ihstttec API call allows the most flexibility in mapping TEC events to TBSM resource types. This approach also allows any automation (IBM Tivoli Enterprise Console rules, etc.) that is in place to take effect before forwarding events to IBM Tivoli Business Systems Manager.
Chapter 5. Case study scenario: IRBTrade Company 215
IBM Tivoli Service Level Advisor instrumentationIBM Tivoli Service Level Advisor V2.1 is used to create SLAs. It is based on the identified business systems that provide additional information of the service levels of various performance metrics provided by various monitoring products. It also provides user-based reports for service levels of these metrics.
Tivoli Data Warehouse V1.2 instrumentationIBM Tivoli Data Warehouse is used to extract, transform, and load the measurement data of the metrics from various monitoring applications using warehouse enabled packs (WEPs). The following WEPs are needed for the IRBTrade Company case study scenario:
� IBM Tivoli Monitoring for Operating Systems WEP� IBM Tivoli Monitoring for Databases WEP� IBM Tivoli Monitoring for Web Infrastructure WEP� IBM Tivoli Enterprise Console WEP � IBM Tivoli Monitoring for Transaction Performance WEP� IBM Tivoli Business Systems Manager WEP� IBM Tivoli Service Level Advisor WEP
5.4.2 Identifying the business serviceThis is the first stage of decomposition of the services and IT resources that support the overall business of IRBTrade Company. At this point, we must gather, analyze, and categorize the information about the infrastructure that supports the business to facilitate the definition and monitoring of service levels.
We identify the IRBTrade Company business services and then define them to facilitate monitoring of service levels. We do this at each level of the organization (line management, senior management, and executive management), keeping in mind monitoring capabilities, IBM Tivoli Enterprise Console event data (existing events from IBM Tivoli Monitoring), and expected events from IBM Tivoli Monitoring for Transaction Performance deployment.
Not all services that we identify will result in a corresponding SLA. Some of these services may be used to define OLAs between the organizations. For example, the application production and support team may have an OLA with the IT infrastructure group to provide necessary technical support in case of operating system (system administrative support or Database Administrative Support (DBA)) services.
At the highest level, the service provided by the IRBTrade Company or the primary business of the IRBTrade Company needs to be defined as a service. We name this primary business service IRB Trade. Then we create a naming
216 Service Level Management
convention for service definitions. It is IRB Trade <ServiceName>, where IRB Trade represents the core business of IRBTrade Company as defined earlier.
To facilitate SLM of the IRB Trade service, we identify additional services based on the IRBTrade Company mission, organizational structure, responsibilities of each organization, and inter-dependencies between the organizations to provide the best possible service to its customers. With this in mind, and based on the information provided in Figure 5-4 on page 210, we identify the following business services that map to executive level management given the IRBTrade Company’s organizational structure:
� Marketing services
This is related to the services provided by the IRBTrade Company to its external customers. It is mainly concerned with customer traffic or volume, customer perception about the quality of the service, and end-user transaction promptness as perceived by its customers. This service is based on end user load, and end user experience as monitored by the IRBTrade Company. We name this service IRB Trade Marketing.
� Financial consultancy services
This service deals with providing stock analysis information provided to the IRBTrade Company customers. It is not addressed in any further detail, but is included here for the sake of making this case study scenario complete at this level. We name this service IRB Trade Research.
� IT services
This service is based on the services provided by the IT business unit and its organizations: trade application production and support, trade application development, service desk, and IT infrastructure. It is made of the IRBTrade Company Web site supporting software and all other IT infrastructure that is used to run the IRBTrade Company’s day-to-day business. These services support the services listed earlier. We name this service IRB Trade IT Division.
Chapter 5. Case study scenario: IRBTrade Company 217
Figure 5-6 shows an overview of these services and their relationships in terms of SLAs and OLAs. The hierarchy of identified business services for IRBTrade Company begins with IRB Trade. Underneath this level are:
� IRB Trade IT Division� IRB Trade Marketing� IRB Trade Research
We must perform further decomposition of the services provided by IRBTrade Company, as explained in the following sections.
Figure 5-6 IRBTrade Company services
Customers
IRBTrade Company
SLA
SLA
InformationTechnology
ServiceDesk
ITInfrastructure
ApplicationProduction
And Support
OLAs
Application Development
Marketing
Financial Consultancy
218 Service Level Management
Figure 5-7 shows the final breakdown of IRBTrade Company’s business services.
Figure 5-7 Decomposition of IRBTrade Company’s business services
IRB Trade
IRB Trade IT Division
IRB Trade Research
IRB Trade Marketing
IRB Trade Application
IRB Trade Development
IRB Trade Infrastructure
IRB Trade Service Desk
IRB Trade AvailabilityIRB Trade Web ServersIRB Trade Web Application ServersIRB Trade Database ServersIRB Trade Unix ServersIRB Trade Wintel Servers
IRB Trade Infra Web Server SupportIRB Trade Infra Web Application Server SupportIRB Trade Infra Database Server SupportIRB Trade Infra Unix System SupportIRB Trade Infra Wintel System Support
IRB Trade Application AvailabilityIRB Trade External Customer Incident ManagementIRB Trade General Web Site Response or ExperienceIRB Trade On-line Quote Response timeIRB Trade On-line Sell Transaction Response timeIRB Trade On-line Buy Transaction Response time
Chapter 5. Case study scenario: IRBTrade Company 219
IRB Trade IT Division service decompositionThe executive level service IRBTrade Company IT consists of trade application production and support, trade application development, service desk, and IT infrastructure. Each of these services is managed by a senior manager or manager responsible for providing the services and meeting the SLAs or OLAs.
The IRB Trade.IT Division services include:
� IRB Trade Application
This is a senior level manager service. It deals with the IRBTrade Company online application, which is critical to the business. This service deals with the production online application system, and the components on which the application depends. These components in turn depend on services provided by the IT infrastructure group.
The components are candidates based on the following services (OLA candidates) managed by the line managers. These services deal with operational aspects of the online trade application and can be divided into:
The IRB Trade Availability component measures the availability of the components that make up the online trading application.
� IRB Trade Development
This is a senior level manager service. It deals with developing, maintaining, and providing level 3 support to the online application which is critical to the business. This service is not be defined and addressed any further in this scenario. However, it can be implemented like other services addressed in this document.
� IRB Trade Infrastructure
This is a senior level manager service. It deals with the IT that is critical to the IRBTrade Company business. The IRB Trade Infrastructure service consists of providing system, database, and middleware support for the online application and all other services required to run the day-to-day IRBTrade Company business. This service is based on the following services or technology pillars managed by the line managers. These services deal with operational aspects of the online trade application and IT support.
220 Service Level Management
– IRB Trade Infra Web Server Support– IRB Trade Infra Web Application Server Support– IRB Trade Infra Database Server Support– IRB Trade Infra UNIX System Support– IRB Trade Infra Wintel System Support
Senior level management that reports to the executives is responsible for providing these services and meeting the SLAs.
� IRB Trade Service Desk
This service is related technical support provided by the IRBTrade Company help desk to external customers and internal customers. The service level measurement is based on the trouble ticket resolution time. This service is related to incidents created using the service desk management system implemented in the IRBTrade Company, which is Peregrine ServiceCenter 6.
The service IRB Trade Service Desk consists of the following services:
The IRB Trade Service Desk service provides the ability to track customer (internal and external) technical support effectiveness in terms of incident management, such as open incidents, closed incidents, and incident resolution time.
IRB Trade Marketing service decompositionThe IRB Trade Marketing service provides the marketing organization to evaluate and monitor the user experience and user load. It also monitors whether the company is meeting, or exceeding the customer expectations, or falling short of customer expectation.
The executive level service IRB Trade Marketing consists of these services:
� IRB Trade User Load
This service is related to the number of users logged onto the IRBTrade Company Web site. It performs user actions without creating any performance degradation or impacting the user experience adversely. This service is provided by the IT organization to the marketing business unit. The user load is measured using the IBM Tivoli Monitoring for Web Infrastructure WebSphere product.
This service is not defined or addressed in this scenario. However, it can be implemented similar to the services addressed in this document.
Chapter 5. Case study scenario: IRBTrade Company 221
� IRB Trade User Experience
This service is related to the availability and response times associated with the customer transactions and activities performed using the IRBTrade Company Web site. The service level is calculated using the data collected on availability and response times for various common IRBTrade Company customer transactions such as the availability of the Web site, response time for quotes, and buy or sell orders. This service is managed by a senior level manager and is used by the marketing organization.
This is a senior level manager service. It deals with the IRBTrade Company’s user satisfaction with the online application that is critical to the business. This service is based on the following services managed by the manager in-charge. These services deal with user transaction performance and availability of the online trade application. The service IRB Trade User Experience service deals with the following aspects of IRBTrade Company:
– IRB Trade Application Availability– IRB Trade Customer Help desk Experience– IRB Trade General Web Site Response or Experience– IRB Trade On-line Quote Response time– IRB Trade On-line Sell Transaction Response time– IRB Trade On-line Buy Transaction Response time
IRB Trade Research service decompositionIRB Trade Research service is a senior level manager service. It deals with the developing, maintaining, and providing stock data to the online application, which is critical to the business. This service is not defined or addressed in this scenario. However, it can be implemented similar to the services addressed in this document.
5.4.3 Identifying necessary users rolesTo implement SLM for IRBTrade Company as explained in this section, we must define various user IDs and groups in both IBM Tivoli Business Systems Manager and IBM Tivoli Service Level Advisor. These user IDs are used by various executives and administrators of IRBTrade Company depending on their respective roles in the project.
The following sections present the user IDs and group definitions and their roles used in this case study scenario.
222 Service Level Management
IBM Tivoli Business Systems Manager users and groupsTable 5-6 presents the user IDs, groups, and their respective roles defined in IBM Tivoli Business Systems Manager. These definitions are performed in the IBM Tivoli Business Systems Manager Console Server.
Table 5-6 IBM Tivoli Business Systems Manager users and groups
TBSM local OS user group
TBSM local OS user IDs
TBSM user role
TBSM Administrators
irbAdmin IRBTrade Company TBSM Administrator who is in-charge of administering the two-server TBSM system, defining business views, and executive dashboards
TBSM Administrators Super
irbSuperAdmin IRBTrade Company TBSM super administrator
IRBTrade Company executives or senior managers who own the business that a service represents
They do not want to see details about the each IT resource but want to see a high level summary of the services (business systems) in their scope of responsibility.
IRBTrade Company senior managers and line managers who either manage the IT business unit or an IT group who are more interested in the details supporting the executive dashboard than the TBSM_Executives role
TBSM_Operators irbOper1irbOper2
TBSM operators who monitor operational views
Note: Each IBM Tivoli Business Systems Manager dashboard user needs a user ID to view his or her dashboard.
Chapter 5. Case study scenario: IRBTrade Company 223
IBM Tivoli Service Level Advisor users and groupsTable 5-7 presents the user IDs, groups, and their respective roles defined in IBM Tivoli Service Level Advisor. These definitions act as post installation steps after the users and their roles are identified.
These roles are classified into two groups. The first group deals with the SLM administrator and the supportive roles where defining the schedules, offerings, customers, realms and slas were involved. These users are created in the local operating system and mapped to the roles specified. Refer to Administrator’s Guide for IBM Tivoli Service Level Advisor, SC32-0835-03, for ways to map the roles in IBM WebSphere.
Table 5-7 TSLA administrator console users
The second group deals with the reports and its usage. Table 5-8 shows the list of various users. These users are created using the command line interface provided by IBM Tivoli Service Level Advisor V2.1. Refer to Command Reference for IBM Tivoli Service Level Advisor, SC32-0833-03, for usage details.
Table 5-8 TSLA report users
Local OS user role
TSLA user role
TSLA role description
SLMAdmin SLMAdmin SLM Administrator for administration GUI; responsible for administrative roles such as maintenance, deletion, cancellation, adjudication, etc. This user role is mapped to SLM administrator for Administrative Console.
SLMSupp SLMSupp This role is mapped to the SLM specialist who is responsible for creating SLAs and changing SLAs by adding or deleting resources.
OffrgSpl OffrgSpl This role is mapped to the offering specialist who is responsible for defining the SLOs, and the frequency of the SLOs must be met.
Local OS user role
TSLA user role
TSLA role description
SLMAdmin SLMAdmin SLM Administrator for the TSLA reports. This is equivalent to the operator role specified for TSLA reports.
itexec itexec This user role gets the executive summary report for the realm IT Division.
mktgexec mktgexec This user role receives the executive summary report for the customer marketing executive.
inframgr inframgr This user role receives the executive summary report for the customer IRB Trade Infrastructure Sr Mgr.
dbamgr dbamgr This user role receives the executive summary report of all database servers.
224 Service Level Management
5.4.4 Required resource typesTo support the solution and the scenario defined in this section, the IBM Tivoli Business Systems Manager Distributed generic object types listed in Table 5-9 are defined to represent the IT resources and the potential customer transactions.
Table 5-9 TBSM resources types defined for IRBTrade Company scenario
syssupmgr syssupmgr This user receives the executive summary report of all the servers for their hardware and operating system performance.
webmgr webmgr This user gets the executive summary report of all the Web infrastructure performance.
prodmgr prodmgr This user receives the executive summary report of the application production environment regarding its availability and performance.
Local OS user role
TSLA user role
TSLA role description
TBSM/D resource type
Resource description
DB2Server DB2 server software running on a server
ExtUserIncident Service desk ticket or incident that is created as result of an external customer call to the help desk with a problem
IntUserIncident Service desk ticket trouble ticket or incident that is created as result of an internal “customer” call to the help desk with a problem or request
LinuxServer Linux servers
MSSQLServer Microsoft SQL Server software running on a Wintel server
MailServer E-mail server
UNIXServer UNIX servers (such as AIX®, HP UX, etc.)
UserTransaction User transaction simulated via IBM Tivoli Monitoring for Transaction Performance STI or GenWin (Rational Robot) Playback policy. Each instance of this resource type represents a user transaction initiated from a IBM Tivoli Monitoring for Transaction Performance agent.
WebApplServer IBM WebSphere Application Server software running on a server
WebServer HTTP server software running on a server
WintelServer Windows 2000 or NT server
Chapter 5. Case study scenario: IRBTrade Company 225
IBM Tivoli Business Systems Manager Distributed generic object types are defined using the gemgenprod command. An icon is assigned to each object type using the LoadGEMIcons command. Refer to IBM Tivoli Business Systems Manager Command Reference Guide, SC32-1243, for additional details about these commands.
Example 5-1 lists the commands that were executed to define the IBM Tivoli Business Systems Manager resource types for this case study scenario.
For example, the last two commands in Example 5-1 define a IBM Tivoli Business Systems Manager distributed resource type called WintelServer. Then they assign an icon specified by file cid_system_32.gif. If an icon is not specified, IBM Tivoli Business Systems Manager assigns a default icon.
226 Service Level Management
Initial resource discoveryAfter the resource types are defined, in order for IBM Tivoli Business Systems Manager to discover and instances of these resource types, it must receive one or more status events that pertain to these resources.
To create instances of IRBTrade Company IT resources, perform the following sequence of activities:
1. Configure the IBM Tivoli Business Systems Manager Agent listener.2. Generate alerts for the resource types defined.
Example 5-2 show the commands used to configure the IBM Tivoli Business Systems Manager Agent listener running in the IBM Tivoli Business Systems Manager Database Server.
Example 5-2 GemEEConfig commands issued from the TBSM database server
# Enable Events from the TBSM Database ServerD:\tbsm\bin>GemEEConfig.bat -a bc1srv7.itso.ral.ibm.comAdded Event Enabler bc1srv7.itso.ral.ibm.com
# Enable Events from the TEC ServerD:\tbsm\bin>GemEEConfig.bat -a bc1srv5.itso.ral.ibm.comAdded Event Enabler bc1srv5.itso.ral.ibm.com
# Show Agent Listener configurationD:\tbsm\bin>gemEEconfig
Listing configured Event Enablers:
Event Enabler: bc1srv7.itso.ral.ibm.comConnection Status: ConnectedEnabled for connection at startup.Port: 4030RetryTime: 12 secondsRetryCount: 10ContinuousLoop: TrueBackupHostPortList: 0
Event Enabler: bc1srv5.itso.ral.ibm.comConnection Status: ConnectedEnabled for connection at startup.Port: 4030RetryTime: 12 secondsRetryCount: 10
Chapter 5. Case study scenario: IRBTrade Company 227
ContinuousLoop: TrueBackupHostPortList: 0
Done.
Note that bc1srv7.itso.ral.ibm.com is the IBM Tivoli Business Systems Manager Database Server, and bc1srv5 is the IBM Tivoli Enterprise Console Server for the IRBTrade Company.
To generate an initial set of instances of various resource types that are part of IRBTrade Company, we must issue a sequence of ihstttec commands. Each ihstttec command generates an event to IBM Tivoli Business Systems Manager that associates the resource with its resource type. Example 5-3 shows a sample of the commands used for IRBTrade Company.
Example 5-3 IRBTrade Company sample TBSM initial discovery commands
# Event for DB2 Servers - Repeat command for every DB2 serverd:/tbsm/TDS/EventService/ihstttec.exe -b 'DB2Server;1.0' -i 'bc1srv12.itso.ral.ibm.com' -d 'DB2Server' -h 'bc1srv12.itso.ral.ibm.com' -p 'CreateDB2ServerInstance' -s 'HARMLESS' -m 'Event to create the instance'
# Event for WebSphere Servers - Repeat command for every WebSphere serverd:/tbsm/TDS/EventService/ihstttec.exe -b 'WebApplServer;1.0' -i 'bc1srv11.itso.ral.ibm.com' -d 'WebApplServer' -h 'bc1srv11.itso.ral.ibm.com' -p 'CreateWebApplServerInstance' -s 'HARMLESS' -m 'Event to create the instance'
# Event for HTTP Servers - Repeat command for every HTTP serverd:/tbsm/TDS/EventService/ihstttec.exe -b 'WebServer;1.0' -i 'bc1srv35.itso.austin.ibm.com' -d 'WebServer' -h 'bc1srv35.itso.austin.ibm.com' -p 'CreateWebServerInstance' -s 'HARMLESS' -m 'Event to create the instance'
# Event for WinTel Servers - Repeat command for every WinTel serverd:/tbsm/TDS/EventService/ihstttec.exe -b 'WintelServer;1.0' -i 'bc1srv11.itso.ral.ibm.com' -d 'WintelServer' -h 'bc1srv11.itso.ral.ibm.com' -p 'CreateWintelServerInstance' -s 'HARMLESS' -m 'Event to create the instance'
228 Service Level Management
After IBM Tivoli Business Systems Manager receives and processes the events, resources are placed in the IBM Tivoli Business Systems Manager Console associated with its respective resource type. Figure 5-8 shows a sample of the resources and resource types defined for IRBTrade Company.
Figure 5-8 Sample Resources view after the initial discovery: Topology view
Chapter 5. Case study scenario: IRBTrade Company 229
Figure 5-9 shows the various IRBTrade Company IBM Tivoli Business Systems Manager resources that are created as result of initial discovery. These resources are used in creating the IRBTrade Company business systems.
Figure 5-9 Sample Resources view after the initial discovery: Table view
Note: In order for these commands to result in creating an initial set of IRBTrade Company resource instances in the IBM Tivoli Business Systems Manager database, you must define the IBM Tivoli Business Systems Manager database server as one of the event enablers as shown in Example 5-2 using the gemEEConfig command.
230 Service Level Management
5.4.5 Creating business systems based on business functionsBased on the IRBTrade Company organizational structure and the initial decomposition of services presented in 5.4.2, “Identifying the business service” on page 216, we must define the business systems views for IRBTrade Company. Later, these business systems views will be associated to executive dashboards, depending on users roles and responsibilities.
When creating the IBM Tivoli Business Systems Manager business systems, we use a bottom up approach:
1. The discovered resources are grouped by resource type, or by the organization that is responsible for monitoring and managing these resources. These are called lower-level business systems. For example, the business systems that fall under this category include:
– IRBTrade Company Infrastructure DB2 Server Support– IRBTrade Company Infrastructure MSSQL Server Support– IRBTrade Company Infrastructure UNIX System Support– IRBTrade Company On-line Quote Response time– IRBTrade Company On-line Sell Transaction Response time– IRBTrade Company On-line Buy Transaction Response time– IRBTrade Company External Customer Incident Management
2. After the lower level business systems are defined, then the higher level business systems are defined and the lower-level business systems are associated to them to build the hierarchy of business systems. For example, the higher-level business systems defined include:
– IRBTrade Company User Experience– IRBTrade Company Infrastructure Database Server Support– IRBTrade Company Marketing– IRBTrade Company Research– IRBTrade Company Infrastructure
The strategy is to create the lower-level business systems first and then use these business systems to create or build higher-level business systems by association.
In the IRBTrade Company scenario, all business systems are created using IBM Tivoli Business Systems Manager Java Console. They are not created using the Automatic Business Systems (ABS) configuration file and ABS commands. This method can be used and is appropriate when resource mapping can be determined by resource type or some other supported resource attribute consistently based on well defined (naming) convention. The business system IRBTrade Company infrastructure, and its lower-level business systems, could have been defined using this approach in our scenario instead of the manual console method.
Chapter 5. Case study scenario: IRBTrade Company 231
Figure 5-10 shows all IBM Tivoli Business Systems Manager business systems defined for IRBTrade Company in the left pane, and the high-level business systems in the right pane.
Figure 5-10 Business systems definitions for IRBTrade Company
232 Service Level Management
The following sections go into more detail about the main business systems created for IRBTrade Company. Later in this chapter, SLAs are defined based on these business systems.
IRB Trade IT Division business systemThe executive level service IRB Trade IT Division (Figure 5-11) consists of the following senior level management services and identified in 5.4.2, “Identifying the business service” on page 216.
Chapter 5. Case study scenario: IRBTrade Company 233
IRB Trade Application business systemIRB Trade Application business system (Figure 5-12) deals with the online trading application, which is critical to the IRBTrade Company business. This business system is identified as a service and will be available to the executive line of IRBTrade Company. This business system will consist of other lower level business systems managed by the line managers. These lower level business systems all deal with operational aspects of the online trading application.
IRB Trade Infrastructure business systemIRB Trade Infrastructure business system (Figure 5-13) is a senior level manager service. It deals with the IT Technology that is critical to the business including providing system, database, and middleware support for the online trading application. This business system is identified as a service based on the following lower level business systems managed by the line managers. These business systems deal with operational aspects of the online trade application.
� IRB Infrastructure Web Server Support� IRB Infrastructure Web Application Server Support� IRB Infrastructure Database Server Support� IRB Infrastructure UNIX System Support� IRB Trade Wintel System Support
The senior level management that reports to the executives is responsible for providing these services and meeting the SLAs.
Figure 5-13 IRB Trade Infrastructure business system
Chapter 5. Case study scenario: IRBTrade Company 235
IRB Trade Service Desk business systemThe executive level business system IRB Trade Service Desk (Figure 5-14) is identified as a service. It consists of the following senior level management business systems:
� IRBTrade Company External Customer Incident Management � IRBTrade Company Internal Customer Incident Management
Figure 5-14 IRB Trade Service Desk business system
236 Service Level Management
IRB Trade Marketing business systemThe executive level business system IRB Trade Marketing (Figure 5-15) is identified as a service. It consists of the following senior level management services as identified in 5.4.2, “Identifying the business service” on page 216:
� IRB Trade User Load � IRB Trade User Experience
Figure 5-15 IRB Trade Marketing business system
Chapter 5. Case study scenario: IRBTrade Company 237
IRB Trade User Experience business systemIRB Trade User Experience is a senior level manager business system (Figure 5-16). It deals with user satisfaction with the online trading application that is critical to the business. This business system is based on the following lower level business systems managed by the senior manager in charge. These business systems deal with user transaction performance of the online trade application. The executive level business system IRB Trade User Experience consists of the following senior level management business systems:
� IRB Trade Application Availability� IRB Trade Customer Helpdesk Experience� IRB Trade General Web Site Response or Experience� IRB Trade On-line Quote Response time� IRB Trade On-line Sell Transaction Response time� IRB Trade On-line Buy Transaction Response time
Figure 5-16 IRB Trade User Experience business system
238 Service Level Management
5.4.6 Defining executive dashboard viewsBased on the organization structure, services identified in 5.4.2, “Identifying the business service” on page 216, and the required user IDs defined in 5.4.3, “Identifying necessary users roles” on page 222, for IBM Tivoli Business Systems Manager executive board users, the IBM Tivoli Business Systems Manager executive dashboards are defined.
Using the IBM Tivoli Business Systems Manager Console, each business system view that represents a service is designated as an executive dashboard service. Each is also identified as an SLA supported service as shown in Figure 5-17 by selecting the business system and updating the properties page.
Figure 5-17 Designating a business view as a service using TBSM Console
Chapter 5. Case study scenario: IRBTrade Company 239
Figure 5-18 shows the main executive dashboard definitions for IRBTrade Company.
Figure 5-18 Identified executive dashboards and services for IRBTrade Company
Executive level
Management Level
Operational Level
IRB Trade IT Infrastructure Manager
IRB Trade Infra Web Server SupportIRB Trade Infra Web Application Server SupportIRB Trade Infra Database Server SupportIRB Trade Infra Unix System SupportIRB Trade Infra Wintel System Support
IRB Trade Application Manager
IRB Trade AvailabilityIRB Trade Web ServersIRB Trade Web Application ServersIRB Trade Database ServersIRB Trade Unix ServersIRB Trade Wintel Servers
IRB Trade Application AvailabilityIRB Trade Customer Help desk ExperienceIRB Trade General Web Site Response or ExperienceIRB Trade On-line Quote Response timeIRB Trade On-line Sell Transaction Response timeIRB Trade On-line Buy Transaction Response time
IRB Trade Marketing Executive
IRB Trade User LoadIRB Trade User Experience
IRB Trade IT Executive
IRB Trade ApplicationIRB Trade InfrastructureIRB Trade Service Desk
IRB Trade CEO Executive
IRB Trade IT DivisionIRB Trade MarketingIRB Trade Research
IRB Trade OS Support Manager
IRB Trade Unix ServersIRB Trade Wintel Servers
IRB Trade Web Infrastructure Support Manager
IRB Trade Infra Web Server SupportIRB Trade Infra Web Application Server Support
IRB Trade DBA Support Manager
IRB Trade DB2 Servers SupportIRB Trade MSSQL Servers Support
240 Service Level Management
Each of the IBM Tivoli Business Systems Manager business systems has a service, an a executive dashboard service, and an SLA supported service. Then depending on the role, appropriate IBM Tivoli Business Systems Manager business views or services are included into each dashboard. The left pane of Figure 5-19 lists all business systems related to IRBTrade Company. The right pane lists the executive dashboards with appropriate business systems or services assigned to each dashboard user.
Figure 5-19 IRBTrade Company executive dashboard lists
The figures in the following sections show the IRBTrade Company’s executive dashboards of some of the key players in this case study scenario.
Chapter 5. Case study scenario: IRBTrade Company 241
IRB Trade CEO executive dashboard Figure 5-20 shows the IRBTrade Company top level executive dashboard that oversees the three major services or business units of IRBTrade Company: marketing, research, and IT.
Figure 5-20 IRB Trade CEO executive dashboard
242 Service Level Management
RB Trade IT executive dashboardFigure 5-21 shows the IRBTrade Company IT business unit executive dashboard. It includes the major services provided by the business unit: trade application production and support, IT infrastructure, and service desk.
Figure 5-21 IRB Trade IT executive dashboard
Chapter 5. Case study scenario: IRBTrade Company 243
RB Trade Marketing executive dashboardFigure 5-22 shows the IRBTrade Company marketing business unit executive dashboard with two major services that concern the marketing business unit: user experience and user load.
IRB Trade User Experience Manager executive dashboardFigure 5-23 shows the executive dashboard for the manager in charge of IRBTrade Company’s user experience group that is part of the marketing business unit. This dashboard monitors the issues relating to the end user transactions and satisfaction (Web site availability; quote, buy, or sell transaction response times; etc.) that concern the marketing business unit.
Figure 5-23 IRB Trade User Experience Manager executive dashboard
Chapter 5. Case study scenario: IRBTrade Company 245
IRB Trade IT Infrastructure Manager executive dashboardFigure 5-24 shows the dashboard for the manager in charge of IT infrastructure support for the IRBTrade Company IT infrastructure support group part of the IT business unit. This dashboard monitors issues that relate to the IT resources and services support such as database servers support, operating systems and servers support, Web servers, and Web application servers support services.
Figure 5-24 IRB Trade IT infrastructure manager executive dashboard
246 Service Level Management
RB Trade Application Manager executive dashboard Figure 5-25 shows the dashboard of the manager in charge of the online trade application group part of the IT business unit. This dashboard monitors issues that relate to all production environment resources of the trade application, such as servers, Web servers, Web application servers, trade database servers, etc. that are supported by the IT business unit. This view also gives the manager an overall look at the trade application’s availability.
Chapter 5. Case study scenario: IRBTrade Company 247
IRBTrade Company Service Desk Manager executive dashboardFigure 5-26 shows the dashboard of the manager in charge of the IRBTrade Company’s service desk group part of IT business unit. This dashboard monitors issues that relate to the service desk and external and internal incident management services provided by the IT business unit.
Figure 5-26 IRBTrade Company Service Desk Manager executive dashboard
248 Service Level Management
IRB Trade OS Support Manager executive dashboardFigure 5-27 shows the dashboard of the manager in charge of the operating system support and administration part of the IT infrastructure group within the IT business unit. This dashboard monitors issues that relate to operating system level monitoring and support services provided by the group.
Figure 5-27 IRB Trade OS Support Manager executive dashboard
Chapter 5. Case study scenario: IRBTrade Company 249
IRB Trade Web Infrastructure Support Manager executive dashboardFigure 5-28 shows the dashboard of the manager in charge of the Web infrastructure support and administration part of the IT infrastructure group within the IT business unit. This dashboard monitors issues that relate to Web infrastructure software monitoring and support, such as Web servers and Web application servers.
Figure 5-28 IRB Trade Web Infrastructure Support Manager executive dashboard
250 Service Level Management
IRBTrade Company DBA Support Management executive dashboardFigure 5-29 shows the dashboard of the manager in charge of the database infrastructure support and administration part of the IT infrastructure group within the IT business unit. This dashboard monitors issues that relate to the database administration services provided by the group.
Figure 5-29 IRBTrade Company DBA Support Management executive dashboard
5.4.7 Agreeing to and defining service level objectives The SLOs should follow the same structure of the business systems. Doing so emphasizes the service levels of the business systems defined for IRBTrade Company. The objectives and terms should always depend on the business needs.
The IT infrastructure team brain stormed and came up with the required SLOs. Also during the brain storming session, they decided that every day, Monday through Friday, from 9 a.m. to 4 p.m., is critical to the business. They decided that the SLOs should be at a better level during this period.
They map the SLOs to SLAs, OLAs, or underpinning contracts. Table 5-10 lists the provider, client, and type of agreement defined for the IRBTrade Company case study scenario. These SLAs and OLAs are defined based on the breakdown of the business systems identified in Figure 5-6 on page 218.
Chapter 5. Case study scenario: IRBTrade Company 251
Reports are provided to the customers presented in Table 5-10 where SLAs and OLAs are involved. Some of the SLAs and OLAs mentioned are intended to provide a measurement of the quality of the delivery of key infrastructure subsystems being delivered by the infrastructure support teams.
Table 5-10 IRBTrade Company customers and providers of SLAs
The SLOs were divided into the following subgroups to match the business systems defined earlier:
� SLOs for database servers
� SLOs for Web infrastructure servers, for example, HTTP servers and Web application servers
� SLOs for operating system level performance
This is defined for the server part of the Wintel business systems.
� SLOs for service desk� SLOs for availability of defined business systems
Description Customer Provider Type Business systems
Trading user experience availability and performance
Marketing executive IT executive SLA IRB Trade User Experience
OLA IRB Trade Infra Web Server Support and IRB Trade Infra Web Application Server Support
Hardware and operating systems availability and performance
Infra senior manager Infra system support manager
OLA IRB Trade Wintel System Support
Service desk Infra senior manager, marketing executive, development manager, etc.
IT executive OLA IRB Trade Service Desk
252 Service Level Management
� SLOs for the IRB trade Application business system� SLOs for the user experience business system
Service level objectives for database serversTable 5-11 defines the SLOs for the database servers. These objectives may decide the outcome of the other business systems’ SLOs. For example, if a transaction is taking time to respond, it may be due to the unavailability of the database connection for that transaction. It may also provide the basis for further improvement of the business systems. The IT infrastructure group decided that the SLOs in Table 5-11 will maintain the response of the database servers for optimum performance. The objectives should manage the percent of connections used, better buffer pool hit rate, better index hit rate, and DB2 server uptime.
Table 5-11 SLOs for the database servers
Service level objectives for Web infrastructureThe SLOs of the Web infrastructure depend on the SLOs of the Web server and Web application server as described in Table 5-12. These SLOs must be in line with the definitions of the Web infrastructure business systems. The business systems are made of Web servers and Web application servers that support the IRBTrade Company’s online trading application.
Table 5-12 shows for SLOs for the Web servers, which are running IBM HTTP Server (powered by Apache) in this scenario. These objectives are to verify the running of the Apache HTTP Server, availability of the Web site, and the amount of failed pages.
Service level objectives Breach condition Schedule period
DB2 instance up Average < 99.9% Critical: 9 a.m. to 4 p.m.Monday through Friday
Average < 99.50% All other times
DB2 database percent connections used
Average > 95% Critical: 9 a.m. to 4 p.m.Monday through Friday
Average > 85% All other times
DB2 database percent index hits
Average > 95% Critical: 9 a.m. to 4 p.m.Monday through Friday
Average > 85% All other times
DB2 database percent buffer pool hits
Average > 95% Critical: 9 a.m. to 4 p.m.Monday through Friday
Average > 85% All other times
Chapter 5. Case study scenario: IRBTrade Company 253
Table 5-12 SLOs for Web servers
The Web application servers used by IRBTrade Company run IBM WebSphere. The SLOs for the Web application servers are considered as total used Java Virtual Machine (JVM) memory, state of the IBM WebSphere administration server and IBM WebSphere application server, average Enterprise JavaBean (EJB) response time, and number of live servlet sessions. Table 5-13 lists the SLOs for the IRBTrade Company’s Web application servers.
Table 5-13 Web application server SLOs
Service level objectives Breach condition Schedule period
Apache server running Average < 99.99% Critical: 9 a.m. to 4 p.m.Monday through Friday
Average < 99.50% All other times
Apache Web site running Average < 99.99% Critical: 9 a.m. to 4 p.m.Monday through Friday
Average < 99.50% All other times
Apache failed pages Average > 4 Critical: 9 a.m. to 4 p.m.Monday through Friday
Average > 7 All other times
Service level objectives Breach condition Schedule period
WebSphere used JVM memory
Average > 512 MB Critical: 9 a.m. to 4 p.m.Monday through Friday
Average >512 MB All other times
WebSphere server state up Average <99.99% Critical: 9 a.m. to 4 p.m.Monday through Friday
Average <99.50% All other times
Average EJB response time Average > 350 msec Critical: 9 a.m. to 4 p.m.Monday through Friday
Average > 450 msec All other times
Number of live servlet sessions
Average > 20000 Critical: 9 a.m. to 4 p.m.Monday through Friday
Average > 15000 All other times
254 Service Level Management
Service level objectives for Wintel ServersThese SLOs align to the business system defined and cover all the servers at the operating system level. The SLOs considered important are total available memory, processor time used by process, and free disk space on the logical disk. Table 5-14 displays the SLOs for the Wintel business system.
Table 5-14 Wintel server SLOs
Service level objectives for service deskThe important SLOs for the service desk business system are average time to close an incident, which shows quick response time to an incident, and number of closed and open incidents, which denotes the quality of service. The number of closed events indicates how quickly the events are closed, taking the average rate of arrival of the incidents. Table 5-15 shows the service desk SLOs.
Table 5-15 Service desk SLOs
Service level objectives Breach condition Schedule period
Percent of the User CPU time by the process
Average > 70% Critical: 9 a.m. to 4 p.m.Monday through Friday
Average > 60% All other times
Percent free space on the logical disk
Average < 10% Critical: 9 a.m. to 4 p.m.Monday through Friday
Average < 10% All other times
Total available memory Average < 64 MB Critical: 9 a.m. to 4 p.m.Monday through Friday
Average < 64 MB All other times
Service level objectives Breach condition Schedule period
Average time to close an incident
Average > 3 hrs Critical: 9 a.m. to 4 p.m.Monday through Friday
Average > 6 hrs All other times
Number of closed Incidents
Total < 10 Critical: 9 a.m. to 4 p.m.Monday through Friday
Total < 15 All other times
Number of open incidents Total > 10 Critical: 9 a.m. to 4 p.m.Monday through Friday
Total > 15 All other times
Chapter 5. Case study scenario: IRBTrade Company 255
Service level objectives for availability of business systemsThe SLOs defined in this section display the availability of a business system. The SLOs for the availability of the business systems are derived from metrics and measurements available from IBM Tivoli Business Systems Manager V3.1.
Table 5-16 defines availability for a partial list of the business systems that have availability data measurements.
Table 5-16 Business systems availability definition
Table 5-17 presents the SLOs for availability as defined per business system.
Table 5-17 Business systems SLOs
Service level objectives of IRB Trade Application business systemSLOs of the IRB Trade application business system are made up of the SLOs of the various business systems that IRB Trade Application is made of. They define the availability and the performance of the various resources and components that make up the IRB Trade application. They are the SLOs of the database servers, Web servers, Web application servers, Wintel business system, and the availability of these business systems as defined in the previous section.
Business system Availability
IRB Trade Application business system
Combination of availability measurements of the components that make up the online trading application, such as database servers, Web servers, and Web application servers
IRB User Experience URL availability and threshold limit for response time collected by IBM Tivoli Monitoring for Transaction Performance
IRB Infra Database Servers
Database server and database instance availability
IRB Infra Web Infrastructure
Web servers and Web application servers availability
IRB Infra Wintel Servers
Operating system availability
Service level objectives Breach condition Schedule period
Availability Average < 99.99% Critical: 9 a.m. to 4 p.m.Monday through Friday
Average < 99.50% All other times
256 Service Level Management
Service level objectives of IRB User Experience business systemThe user experience is derived from the response time of user login, trade, and quote URLs of the IRB trade application. Also, the time to close any incident from an external customer is included into the user experience. The user load (number of active users logged in at a particular time) is an important factor to consider when the response time is involved, because response time is proportional to the user load. The successful number of transactions are considered to achieve the transaction complete rate. Table 5-18 displays the SLOs for a user experience.
Table 5-18 User experience SLOs
5.4.8 Identifying metricsThe metrics chosen to define the SLOs are obtained from various monitoring applications implemented for IRBTrade Company. Refer to “Using tools and features to meet objectives” on page 207 for a list of the products and their respective WEPs.
This section assumes that all those applications are installed and operational, including data collection of the various monitoring tools into their respective source databases and data collection of various WEPs into the Tivoli Data Warehouse. As described in Chapter 4, “Planning to implement service level management using Tivoli products” on page 109, this is a prerequisite for identifying the metrics and their measurements. All the metrics must be identified in conformance with the SLOs defined previously. This section identifies the
Service level objectives Breach condition Schedule period
Response time Average > 350 msec Critical: 9 a.m. to 4 p.m.Monday through Friday
Average > 450 msec All other times
Percent of successful transactions
Average < 99.99% Critical: 9 a.m. to 4 p.m.Monday through Friday
Average < 99.5% All other times
Time to close an incident Average > 3 hrs Critical: 9 a.m. to 4 p.m.Monday through Friday
Average > 6 hrs All other times
User load Average > 20000 Critical: 9 a.m. to 4 p.m.Monday through Friday
Average > 15000 All other times
Chapter 5. Case study scenario: IRBTrade Company 257
metrics of each monitoring application chosen to derive the SLOs defined in this case study scenario.
Metrics for database serversThe metrics that constitute the SLOs for the database servers that support IRBTrade Company’s online trading application are provided by IBM Tivoli Monitoring for Databases, particularly, the resource models for IBM DB2. You can find a complete list of the available metrics in IBM Tivoli Monitoring for Databases Guide for Warehouse Pack, SC09-7781.
Table 5-19 lists the metrics chosen from the database servers in our case study scenario.
Table 5-19 DB2 metrics
Metrics for Web infrastructureThe metrics that constitute the SLOs for the Web servers and Web application servers that support IRBTrade Company’s online trading application are provided by IBM Tivoli Monitoring for Web infrastructure, particularly, the resource models for IBM HTTP Server (powered by Apache) and IBM WebSphere. For a complete list of the available metrics, see IBM Tivoli Monitoring for Web Infrastructure: WebSphere Application Server Warehouse Enable, SC09-7783.
Table 5-20 lists the metrics chosen from the Web infrastructure servers in our case study scenario.
Table 5-20 Web infrastructure metrics
Metric name Metric description
DB2Up The percentage of time that the DB2 server is up
Percent Connections Used The percentage of connection used by an application
PctIndexHits The percentage of hits for the index
PctBufferPoolHits The percentage of available bufferpool hits
Metric name Metric description
Web server running The percentage of time the Web server, IBM HTTP Server (powered by Apache), is running
Web site running The percentage of time the Web site specified is running
Web site failed pages The number of failed pages for the Web site specified
Used JVM memory Amount of used JVM memory by the Web application server
258 Service Level Management
Metrics for Wintel serversThe metrics that constitute the SLOs for the Wintel servers business system that supports IRBTrade Company’s online trading application are provided by IBM Tivoli Monitoring. Table 5-21 lists the metrics chosen from the Windows servers in our case study scenario.
Table 5-21 Operating system metrics
Metrics for service deskThe metrics that constitute the SLOs for the service desk business system are provided by the Peregrine TDW connector. Table 5-22 lists the metrics chosen from the service desk in our case study scenario.
Table 5-22 Service desk metrics
Average EJB response time
Average total method response time for the remote methods of the bean for the cycle
Live servlet session Number of concurrently live servlets sessions
Web application server state up
Percentage of time the Web application server is up and running
Metric name Metric description
PercentUserTime Percentage of the CPU that is used by the process
TotalAvail Total available memory at any point of time
PercentFreeSpace Percentage of the free space on the logical disk
Metric name Metric description
Time to close TIme to close an incident
Number of open incidents Number of opened incidents
Number of closed incidents Number of closed incidents
Metric name Metric description
Chapter 5. Case study scenario: IRBTrade Company 259
Metrics for user experienceThe metrics that constitute the SLOs for the user experience business system are provided by IBM Tivoli Monitoring for Transaction Performance. For a complete list of the available metrics, see IBM Tivoli Monitoring for Transaction Performance Warehouse Enablement Pack Implementation Guide, SC32-9109.
Table 5-23 lists the metrics that are chosen from the user experience in our case study scenario.
Table 5-23 Transaction performance metrics
Metrics for availability of business systemsThe metrics that constitute the SLOs for availability of defined business system for this case study scenario are provided by IBM Tivoli Business Systems Manager. For a complete list of the available metrics, see IBM Tivoli Business Systems Manager Guide for Warehouse Pack, Version 3.1.0.0, SC32-9114.
Table 5-24 lists the metric chosen from the availability of business systems in our case study scenario.
Table 5-24 Business systems availability metrics
5.4.9 Enabling data sources in IBM Tivoli Service Level AdvisorAfter all WEPs for the monitoring applications run at scheduled times, data flows from the respective monitoring application data source databases to the Tivoli Data Warehouse. The data for all of the metrics defined in the previous section is available in the Tivoli Data Warehouse central database (TWH_CDW database). The next step is to enable IBM Tivoli Service Level Advisor to collect metrics data from the TWH_CDW database.
Refer to Getting Started with IBM Tivoli Service Level Advisor, SC32-0834-03, for complete instructions on how to enable data source collection in IBM Tivoli Service Level Advisor. In our case study scenario, for IRBTrade Company, the process is as follows:
Metric name Metric description
Response time Response time of the transaction in the IRB trade application
Number of successful transactions
Percent of successful transactions of the application
Metric name Metric description
Availability Amount of time that the business system is available
260 Service Level Management
1. Launch a command window.
2. Change the directory to the location of IBM Tivoli Service Level Advisor installation and source the IBM Tivoli Service Level Advisor environment by issuing the following command:
slmenv.bat
3. Run the following command to find the source applications that were added:
scmd etl getApps
4. Enable the data sources using the sequence of scmd commands and the AVA codes (Table 5-25) as shown in the following example. The syntax of the scmd commands is:
scmd etl addapplicationdata <avacode> <avacode description/Monitoring Application> (to add any new source applications if not present in step 2)
scmd etl enable <avacode>
Consider this example:
scmd etl addapplicationdata AMY “IBM Tivoli Monitoring for OS”
scmd etl enable AMY
Table 5-25 AVA codes used in this case study scenario
Schedule the WEPs for the monitoring applications to run appropriately so that they start one after another. For example, consider the sequence presented in the following paragraph.
If the daily roll up of data by IBM Tivoli Monitoring into its database finishes at 01:00 o’clock, schedule the AMX ETL for 01:30 hours everyday. This ensures that data collection for all IBM Tivoli Monitoring applications is complete. Then
Monitoring application AVA codes to be enabled
IBM Tivoli Monitoring for OS AMY
IBM Tivoli Monitoring for Databases: DB2 CTD
IBM Tivoli Monitoring for Web Infrastructure: Apache Server
GWA
IBM Tivoli Monitoring for Web Infrastructure IZY
IBM Tivoli Monitoring for Transaction Performance BWM, MODEL1*
IBM Tivoli Business Systems Manager V3.1 GTM, MODEL1*
* The MODEL1 AVA code is part of the new Tivoli Common Data Model V1 and must also be enabled in IBM Tivoli Service Level Advisor.
Chapter 5. Case study scenario: IRBTrade Company 261
schedule the IBM Tivoli Service Level Advisor WEPs (DYK) for 30 minutes after the AMX ETL completes. Always schedule the WEPs so that only one WEP runs at a time.
After the successful run of the IBM Tivoli Service Level Advisor WEP, the metrics described in this section are available in the IBM Tivoli Service Level Advisor databases (DYK_CAT and DYK_DM).
5.4.10 Setting up schedules, realms, and customersThe task force decides that the service level manager will appoint a technical leader to be in charge of the SLM administrator role to create the various objects in IBM Tivoli Service Level Advisor. The SLM administrator is responsible for performing the following initial tasks:
� Creating schedules� Identifying and creating realms� Identifying and creating customer
Creating schedulesSchedules are made up of one or more periods that have a start and end time. Schedules are categorized into business and auxiliary schedules in IBM Tivoli Service Level Advisor. A business schedule can contain one or more auxiliary schedules. An auxiliary schedule is used to specify maintenance periods and holidays. Each schedule period is used to represent an SLO in that period.
Since the business model for IRBTrade Company considers 9 a.m. to 4 p.m., Monday through Friday, as critical period, create a business schedule with this period as critical. This business schedule also contains a maintenance schedule and holiday schedule that are created as auxiliary schedules.
To create the auxiliary schedules for IRBTrade Company, follow these steps:
1. Launch the IBM Tivoli Service Level Advisor Administration console.
2. Select Manage Schedules →Create in the portfolio.
3. Name the schedule and (for example, Maintenance schedule) and specify it as type auxiliary schedule.
4. Click the Create button to create a schedule period.
a. Specify the No Service option. b. Select the interval from 00:00 hrs to 14:59 hrs.c. Set the frequency to every first Saturday of the month.
5. Similarly, create the holiday schedule, specifying the holidays of the site.
262 Service Level Management
After you create the auxiliary schedules, use the following steps to create the business schedule for IRBTrade Company.
1. On the IBM Tivoli Service Level Advisor Administration console, select Manage Schedules →Create.
2. Name the schedule IRB Trade Business Schedule and specify it as type business schedule.
3. Add the previously created auxiliary schedules to the business schedule. We define two auxiliary schedules. One has a period of no service on the first Saturday of every month. The other has no service period on predefined public holidays.
Select Manage Schedules →Add and select the auxiliary schedules.
4. Define the business schedule periods.
a. Under the Define the schedule state to be active during unspecified periods option, select Standard.
b. Select Create a new schedule period.
c. Mark this period as Critical.
d. Select the start time as 9:00 and end time as 15:59.
e. Select the frequency as Weekly.
f. Deselect Saturday and Sunday.
g. Proceed to the next page and select Finish to complete the schedule creation.
Chapter 5. Case study scenario: IRBTrade Company 263
Figure 5-30 shows the summary of the business schedule creation.
Figure 5-30 IRB Trade business schedule summary
For our case study scenario, we must create the following business schedules. The periods and auxiliary schedules are similar to the IRB Trade business schedule. Separate schedules are created for maintainability. If the business schedule for IRB Trade DB Servers business unit must be changed, then changing one schedule affects only that SLA. The business schedules are:
1. Select Manage Schedules.2. Select IRB Trade Business Schedule. 3. Select the Create Like option.
Identifying and creating a realmBecause realms are used to group customers or consumers, we decided that realms represent the divisions of the IRBTrade Company (as shown in Figure 5-1 on page 199 and Figure 5-2 on page 201). The customers are the various users of the business system units.
We established a naming convention for the realm. They are identified by IRB.<DivisionName>. The following realm definitions are performed for the IRBTrade Company:
The realms for the IRBTrade Company business units are:
To create realms in IBM Tivoli Service Level Advisor, follow these steps:
1. Launch the IBM Tivoli Service Level Advisor Administration Console.2. From the portfolio, select the Create Realm option. 3. Enter an appropriate name and optionally provide a description.
Chapter 5. Case study scenario: IRBTrade Company 265
Figure 5-31 shows an example of a realm created for our case study scenario.
Figure 5-31 IRB.IT infrastructure realm
Identifying and creating a customerIn this case study scenario, customers are the various users responsible for the the business systems as defined in 5.4.3, “Identifying necessary users roles” on page 222. After we identify the customers, we must group them together using realms according to the hierarchy defined by the organization chart presented in Figure 5-1 on page 199 and Figure 5-2 on page 201.
For example, consider the realm IRB.IT infrastructure. It contains the customers IRB.Network Manager, IRB. WebInfra Manager, IRB.DB2 Server Administrator, and hardware and OS support.
266 Service Level Management
Table 5-26 lists the customers to be defined for IRBTrade Company and their respective realm relationships.
Table 5-26 Customer and realms relationships
Customers are created in IBM Tivoli Service Level Advisor using this process:
1. Launch the IBM Tivoli Service Level Advisor Administration console.
2. Select Create Customer.
3. Provide the customer name and a description. For example, we type the customer name IRB Infra DBA Administrator and a description of Manages all the DB2 Servers in the Organization. Then click Next.
4. Because we must relate this customer to a realm, click Add.
5. Choose the appropriate realm. In this example, the IRB Infra DBA Administrator customer belongs to the IT infrastructure, we selected the realm IRB.IT Infrastructure.
Click Next.
6. Click Next again to reach the Summary page.
7. On the Summary page, Click Finish to finalize the customer creation.
Customer name Realm
IRB Network Manager IRB.IT Infrastructure
IRB Infra DBA Manager
IRB Infra Sys Support Manager
IRB Web Infrastructure Manager
IRB WebServer Administrator IRB.IT InfrastructureIRB Web Infrastructure Manager
IRB WebAppServer Administrator IRB.IT InfrastructureIRB Web Infrastructure Manager
IRB Trade Application Manager IRB.IT Division
IRB Trade Development Manager
IRB.IT infrastructure
Marketing executive IRB.Marketing Division
Service desk IRB.IT DivisionIRB.Marketing Division
Chapter 5. Case study scenario: IRBTrade Company 267
Figure 5-32 displays the summary of the customer creation.
Figure 5-32 Summary of the customer creation
5.4.11 Setting up offeringsYou must create the offerings to define the SLOs and frequency in which these SLOs must be met. The SLOs are identified in 5.4.7, “Agreeing to and defining service level objectives” on page 251. These SLOs constitute the basis for offering definitions.
Table 5-27 displays the mapping of the business system defined in IBM Tivoli Business Systems Manager to the offerings to be defined in IBM Tivoli Service Level Advisor for IRBTrade Company.
268 Service Level Management
Table 5-27 Business systems and offerings relationship
The offerings are created using the IBM Tivoli Service Level Advisor Administration console using the process shown in Figure 5-33.
Figure 5-33 Process to create an offering
Business system Offerings
IRB Trade Database Server IRB DB Offering
IRB Trade WebServer IRB Web Server Offering
IRB Trade Web Application Servers IRB WebApp Offering
IRB Trade Wintel Servers IRB SysSupport Offering
IRB Trade Availability The offerings are included in a tiered SLA for the resources that the trade application is running and name it the IRB TradeApplication business system offering.
User Experience IRB User Experience business system offering includes the user experience metrics of TMTP.
Name Offering
Include Offering Components
Select Business Schedule
Include SLAs (Optional)
Select SLA Type
Publish Offering
Define Evaluation Frequency
Define Breach Values
Select Metrics
Chapter 5. Case study scenario: IRBTrade Company 269
The following process creates an offering using the DBServer Offering:
1. Launch the IBM Tivoli Service Level Advisor Administration console.
2. In the portfolio, select Manage Offerings → Create.
3. Type a name for the offering, for example IRB DB Offering. Click Next.
4. For SLA type, select Internal and click Next.
5. Select the Use an existing business schedule option. Select an existing business schedule for the offering. In our case, we selected the business schedule IRB Trade DB Schedule. Click Next.
6. The next page displays a resource type tree and the resource types that are available. Expand the resource type tree and select the appropriate resource type for the offering. Figure 5-34 shows the selection of the resource type for our example.
Click Next.
Figure 5-34 Selecting the resource type for the offering
270 Service Level Management
7. Add the metrics for the offering. Depending on the chosen resource type, available metrics are presented. Select the appropriate metric and define the breach values for the metric. Figure 5-35 shows the breach selection for our example.
Click Next.
Figure 5-35 Defining breach values
Chapter 5. Case study scenario: IRBTrade Company 271
8. Define trend analysis and the evaluation frequency for the offering. Select the appropriate evaluation frequency and select the Advance Metric Settings check box. See Figure 5-36.
Click Next.
Figure 5-36 Defining SLO evaluation frequency
272 Service Level Management
9. In the Advanced Metrics Setting panel (Figure 5-37), under the Intermediate Evaluations section, select the check box. Then define the Trend Analysis and Current Evaluation period.
Provide a name for this metric, for example, DB2 Distributed Instance-DB2Up.
Figure 5-37 Advance Metric Settings
10.Similarly define other SLOs. For Resource Type Tree object, choose DB2 Distributed Database. Define the other details listed in Table 5-28.
11.Publish the offering after all of the metrics are configured.
Chapter 5. Case study scenario: IRBTrade Company 273
The following tables provide details about the various offerings that are created for IRBTrade Company in our case study scenario.
� IRB DB Offering: Define this using the resource type tree object, resource type, metrics, breach values, and condition listed in Table 5-28.
Table 5-28 DBServer offering settings
� IRB Web Server Offering: Choose the resource type tree object as [Root] and the resource type, metrics, breach values, and conditions listed in Table 5-29.
Table 5-29 Web server resource types, metrics, breach conditions
Resource type Metric Average value Breach condition
DB2 Distributed Database
Index Hits 90 - Critical85 - Standard(%)
Average greater than supplied average
DB2 Distributed Database
Bufferpool Hits
90 - Critical 85 - Standard(%)
Average greater than supplied average
DB2 Distributed Database
Connections Used
90 - Critical80 - Standard
Average greater than supplied average
DB2 Distributed Instance
DB2 Up 99.9 - Critical99.50 - Standard
Average less than supplied average
Resource type Metric Average value Breach condition
IBM HTTP Server (powered by Apache)
Server Running
99.99 - Critical99.50 - Standard(%)
Average value less than supplied average
Apache HTTP Web site
Web Site Running
99.99 - Critical99.50 - Standard(%)
Average value less than supplied average
Apache HTTP Web site
Failed Pages
1 - Critical3 - Standard(Quantity)
Average value greater than supplied average
274 Service Level Management
� IRB WebApp Offering: Select the resource type tree object as IBM WebSphere Administration Server and the resource type, metrics, breach values, and condition listed in Table 5-30.
Table 5-30 Web Administration Server resource types, metrics, breach conditions
Select the IBM WebSphere Application Server as a resource type tree object and the resource type, metrics, breach values, and condition listed in Table 5-31.
Table 5-31 Web Application Server resource types, metrics, breach conditions
� IRB SysSupport Offering: Select the resource type tree object as Host Monitored by ITM and resource type, metrics, breach values, and conditions listed in Table 5-32.
Table 5-32 Wintel server resource types, metrics, breach conditions
Resource type Metric Average value Breach condition
IBM WebSphere Administration Server
WebSphere Server state up
99.99 - Critical99.50 - Standard(%)
Average value less than supplied average
IBM WebSphere application server
Average EJB Response Time
350 - Critical450 - Standard(msec)
Average value greater than supplied average
Resource type Metric Average value Breach condition
IBM WebSphere Java Virtual Machine
Used Memory 536870912 - Critical536870912 - Standard(Bytes)
Average value greater than supplied average
IBM WebSphere Servlet Session
Live Servlet Session
20000 - Critical15000 - Critical(Quantity)
Average value greater than supplied average
Resource type Metric Average value Breach condition
Logical Disk Free space on Logical Disk
10 - Critical10 - Standard(%)
Average value less than supplied value
Memory Total Available Memory
64 - Critical64 - Standard(MB)
Average value less than supplied value
System Processor
Processor Time Used By the process
70 - Critical60 - Critical
Average value greater than supplied average
Chapter 5. Case study scenario: IRBTrade Company 275
� IRB User Experience: Select the resource type tree as [Root] and resource type, metrics, breach values, and conditions listed in Table 5-33.
Table 5-33 User experience resource types, metrics, breach conditions
After we create all of the offerings, we see the Manage Offerings page in the IBM Tivoli Service Level Advisor Administration Console (Figure 5-38).
Figure 5-38 Offerings for IRBTrade Company case study scenario
5.4.12 Setting up SLA in IBM Tivoli Service Level AdvisorWith the schedules, realms, customers, and offerings defined in IBM Tivoli Service Level Advisor, you can create the SLAs. In IBM Tivoli Service Level Advisor, SLAs are associations of a customer to the offering that represents the agreed SLOs for a specific set of resources for predefined periods.
Resource type Metric Average value Breach condition
Transaction Node(Measurement source is Tivoli Common Data Model V1)
Response Time
300 - Critical400 - Standard(msec)
Average value greater than supplied average
Transaction Node Successful Transactions
99.9 - Critical99.2 - Standard(%)
Average value less than supplied value
276 Service Level Management
SLAs are created using the IBM Tivoli Service Level Advisor Administration Console and following the process illustrated in Figure 5-39.
Figure 5-39 Process for creating SLAs
For our case study scenario, the SLAs that we define can be mapped to the business systems defined in IBM Tivoli Business Systems Manager because we used the offerings that reflect these business units to create SLAs.
These SLAs can be further divided into two groups.
� SLAs that map to the lower level business systems (Table 5-34): These form the infrastructure of the organization
Table 5-34 SLAs that are mapped to the low level business systems
Name SLA
Add Resources
Select OfferingSelect Service
Select Customer
Select Start Date
SLA name Description
IRBInfraDBServer SLA The SLA for all the database servers in the organization
IRBInfraWintelSeverSLA SLA for all Windows servers in the organization
IRBInfraWebServer SLA SLA for the Web servers in the organization
IRBWebAppServer SLA SLA for all Web application servers in the organization
IRBTradeUserExperience SLA SLA for the success and response time of the transactions
IRBTradeDBServer SLA SLA of the database servers hosting the trade application
IRBTradeWintelServer SLA SLA for the Windows servers hosting the trade application
IRBTradeWebServer SLA SLA for the Web servers hosting the trade application
IRBTradeWebAppServer SLA SLA for the Web application servers hosting the trade application
Chapter 5. Case study scenario: IRBTrade Company 277
� SLAs that are mapped to the higher level business systems (Table 5-35): Here we use the tiered SLA function explained in Chapter 4, “Planning to implement service level management using Tivoli products” on page 109.
Table 5-35 SLAs that were mapped to the higher level business systems
For example, using the IRBUserExperience business system SLA, we see that it is made up of two items:
� One SLA that measures the transaction response time and number of successful transactions. Such metrics are obtained from monitoring data collected by IBM Tivoli Monitoring for Transaction Performance, which is IRBTradeUserExperience SLA.
� Availability of the various business systems that make up the user experience business system. Such metrics are obtained using IBM Tivoli Business Systems Manager.
We use tiered SLAs to achieve this SLA. Tiered SLAs are used to include one or more SLAs in an offering. This enables the tracking of OLAs against underpinning contracts or business systems that depend on these OLAs.
To create such a tiered SLA, we use a three-step approach:
1. Create SLAs using transaction response time and successful transaction measurements for each IT infrastructure business system.
2. Create an offering that contains the SLAs defined in step 1.
3. Create an overall SLA for user experience using the offerings in step 2.
Creating an SLA for the user experience business systemThis section outlines the steps that required to create a tiered SLA for the user experience business system.
SLA name Description
IRBUserExperience business system SLA
Maps resource of the user experience business system to the offering that includes IRBTradeUserExperience SLA, the availability metric of the business system
IRBTradeApplication business system SLA
Maps the resource of the trade application business system to the offering that includes IRBTradeDBServer SLA, IRBTradeWintelServerSLA, IRBTradeWebServer SLA, and IRBTradeWebAppServer SLA
IRBInfrastructure SLA Maps the resource of the IRB Trade IT infrastructure business system to the offering that includes IRBInfraDBServer SLA, IRBInfraWintel Server SLA, IRBInfraWebServer SLA, and IRBInfraWebAppServer SLA
278 Service Level Management
Step 1: Creating the IRBTradeUserExperience SLAThe following steps explain how to create an SLA mapping to the business system. Here we create one of the SLAs that is used to create an offering for the overall user experience SLA.
1. Launch the IBM Tivoli Service Level Advisor Administration console.
2. In the portfolio, select Create SLAs.
3. In the Name SLA panel (Figure 5-40), name the SLA, such as IRBTradeUserExperience SLA. Optionally provide a description. Click Next.
Figure 5-40 Name SLA panel
Chapter 5. Case study scenario: IRBTrade Company 279
4. In the next panel (Figure 5-41), select an existing customer to be associated with the SLA, such as IRB Trade Application Manager. Click Next.
Figure 5-41 Choosing a customer for the SLA
280 Service Level Management
5. In the Select Offering panel (Figure 5-42), select the offerings to be part of the SLAs definitions, such as IRB User Experience. Click Next.
Figure 5-42 Choosing the offering during SLA creation
6. In the Include Resources panel, click Add to add the resources.
Chapter 5. Case study scenario: IRBTrade Company 281
7. In the Select Resource List Type panel (Figure 5-43), define the type of resources to add to the SLA. The Dynamic Resource List is used to group resources and create filter. Static resources are used for particular resources that are to be added. Click Next.
Figure 5-43 Selecting the resource list type
282 Service Level Management
8. In the Filter Resource panel (Figure 5-44), create a filter so that only relevant resources are listed. Select the attribute, condition, and value for the filter. For example, for Attribute, select Name; for Condition, select Contains; and for Value, select Trade. Click Next.
Figure 5-44 Creating a filter for the resources
Chapter 5. Case study scenario: IRBTrade Company 283
9. The resources are displayed and you can select them to be included in the SLA definition. You can add or change resources in this panel. The resources must be defined to every metric used in the SLA. For example, our UserExperience offering has two metrics defined. In this case, resources must be assigned to both metrics. Figure 5-45 shows the resources included for the first metric in the offering. Click Next.
Figure 5-45 Resources selected for the SLA
284 Service Level Management
10.The Select SLA Start Data panel (Figure 5-46) is displayed. The start date of the SLA is used to evaluate the previous monitoring data to verify the SLOs instantaneously. If there is no data, choose the default date (the current date). Optionally select the time zone for the SLA to be evaluated. Click the Recalculate the First Evaluation button to refresh the first evaluation date depending on the SLA start date. Figure 5-46 shows the details used in the UserExperienceSLA definition.
Figure 5-46 Selecting the SLA start date
11.The summary of the SLA creation is displayed. Click Finish to complete the SLA creation. If the SLA start date is an earlier date, the SLA evaluates it immediately.
Step 2: Creating an offering including the SLA created in step 1As described in 5.4.11, “Setting up offerings” on page 268, offerings can include SLAs definitions. This section explains how to create a business system offering named IRBUserExperience that includes the previously defined SLA IRBTradeUserExperience SLA. This offering is used later to create an SLA for the user experience business system.
Chapter 5. Case study scenario: IRBTrade Company 285
The following process creates the IRBUserExperience business system offering:
1. Launch the IBM Tivoli Service Level Advisor Administration Console.
2. In the portfolio, select Manage Offerings → Create.
3. Provide a name for the offering, for example, IRBUserExperience business system offering, and a description, such as Offering for the business system that describes the user experience. Click Next.
4. For SLA type, select External, and click Next.
5. In the Include SLAs panel (Figure 5-47), complete these tasks:
a. Click the Add button. b. Select the SLA IRBTradeUserExperience SLA. c. Click OK to display the included SLA. d. Click Next.
Figure 5-47 Including IRBTradeUserExperience SLA
6. In the next panel, select Use an existing business schedule. For the schedule, select IRB Trade UserExperience Schedule. Click Next.
7. Click Add to include the offering components.
286 Service Level Management
8. The Select Resource Type panel (Figure 5-48) is displayed. For Resource Type, select Business System. Click Next.
Figure 5-48 Selecting the business system resource type for the offering
9. Click Add and for the metric, select Availability.
10.Define the breach values for the user experience business system.
a. For the breach value, specify 99.99. b. For the critical period, select Average value less than supplied average. c. Define another breach value of 99.20 d. For Standard period, select Average value less than supplied average. e. Click Next.
11.In the next panel, complete these tasks:
a. For Evaluation frequency, select Weekly.b. Select Advanced Metric Settings.c. Click Next.
12.Complete these tasks:
a. Select the Perform Intermediate evaluations check box.b. For Intermediate evaluation frequency, select Daily. c. Finish the SLO creation.
We enable the intermediate evaluations because this enables the SLO of the metric up to the current day from the start of the evaluation start. This is reflected in the SLA reports.
Chapter 5. Case study scenario: IRBTrade Company 287
13.Provide a name to the offering component and a description. Optionally, use the default name if it is unique in this offering. Click Next.
14.Select Publish the offering to complete the offering creation.
Step 3: Creating the IRBUserExperience business system SLAUse the following steps to create the IRBUserExperience business system SLA.
1. Launch the IBM Tivoli Service Level Advisor Administration Console.
2. In the portfolio, select Create SLAs.
3. Give the SLA a name, for example IRBUserExperience business system Offering, and optionally provide a description. Click Next.
4. Select the customer for the SLA. In this case, the customer is the marketing executive of IRBTrade Company. Click Next.
5. In the Select Service panel (Figure 5-49), you see the services defined in IBM Tivoli Business Systems Manager. In our case study scenario, the business system IRB.Trade User Experience has the service IRB.Trade User Experience defined. Click Next.
6. Select the offering to be part of the SLA definition. In this case, we select IRBUserExperience business system Offering, which includes the IRBTradeUserExperience SLA. Click Next.
7. Click the Add button to include the resources. For Filter type, select Static resource filter. Click Next.
8. Create a filter. For attribute, select Name; for Condition, select Contains; and for Filter value, select IRB.Trade. Click Next.
9. For Resource, select /IRB.Trade.Marketing/IRB.Trade.User.Experience. Click Next.
10.For the SLA Start Date, specify 10/01/04. To do this, either use the calendar widget or type the value. Choose the default time zone. Click Next.
11.Click the Finish button.
This completes the SLA creation IRBUserExperience business system SLA.
288 Service Level Management
Figure 5-49 Selecting the service for the SLA being created
We can further enhance the IRBUserExperience business system SLA by adding an SLA for the Number of Live Servlet Sessions metric provided by IBM Tivoli Monitoring for WebSphere. To do this, we use these steps:
1. Create a new offering IRBUserLoadOffering and include this metric.
2. Define the breach values and evaluation frequency similar to the IRB User Experience Offering.
3. Create an SLA using the customer name IRB Trade Application Manager.
4. Assign the resources of the trade application.
5. Include this SLA in the IRBUserExperience business system offering.
Doing so gives service details for the user load. This provides the information required to plan for the future in terms of the load, as it may require extra resources to meet higher load.
Chapter 5. Case study scenario: IRBTrade Company 289
Using the IRB TradeApplication business system SLA as an example, we follow a procedure similar to what was explained in the previous example. This requires multiple SLAs defined as described in the previous section. Figure 5-50 shows the list of SLAs. You must define these SLAs with the resources used in the trade application.
Figure 5-50 List of SLAs for the trade application infrastructure
After we define the SLAs, we build an SLA that encompasses all of the resources and applications used by the trade application.
1. From the portfolio, click Manage Offerings.
2. Click Create to create an offering.
3. Provide a name, for example, TradeApplicationBSO, and optionally provide a description. Click Next.
4. For SLA Type, select External. Click Next.
5. Click the Add button to add the SLAs. Add the SLAs as listed in Figure 5-50. Click Next.
6. Each SLA that is added appears in the list. Click Next.
7. For the business schedule, select IRB Trade Business Schedule. Click Next.
290 Service Level Management
8. Click Add to include the offering components. For Resource type, select Business System. Click Next.
9. Click Add to include the metrics. Select Availability. Click Next.
10.Define the breach values for the IRB Trade Application business system.
a. Define a breach value of 99.99.b. For Critical period, select Average value less than supplied average. c. Define another breach value of 99.20.d. For Standard period, select Average value less than supplied average.e. Click Next.
11.In the next panel, complete these tasks:
a. For Evaluation frequency, select Weekly. b. Select the Advanced Metric Settings check box. c. Click Next.
12.In the next panel, follow these steps:
a. Select the Perform Intermediate evaluations check box. b. Set the intermediate evaluation frequency as Daily. c. Finish the SLO creation.
13.Proceed to the next page. Provide a name to the offering component and a description. Optionally, use the default name if it is unique in this offering. Click Next.
14.Click Publish the offering to complete the offering creation.
15.From the portfolio, select Manage SLAs.
16.In the Manage SLAs panel, click the Create button.
17.In the Create SLA panel, type the name IRB TradeApplication BS SLA and optionally type a description. Click Next.
18.For the service, select IRB.Trade.Application. Click Next.
19.For the offering, select IRBTradeApplication BS Offering. Click Next.
20.Click the Add button to include the resources. For Filter type, select static resource filter. Click Next.
21.Create the filter. For attribute, select Name; For Condition, select Contains; and for Filter value, select IRB.Trade. Click Next.
22.For the resource, select /IRB.Trade.IT.Dividion/IRB.Trade.Application. Click Next.
23.Select SLA start date as 10/01/04, by using the calendar widget that is provided or by typing the value. Choose the default time zone. Click Next.
24.Click the Finish button.
Chapter 5. Case study scenario: IRBTrade Company 291
This completes the SLA creation IRB TradeApplication BS SLA. Figure 5-51 shows all the SLAs defined for IRBTrade Company in our case study scenario.
Figure 5-51 List of SLAs
5.5 How the new solution works in practiceThe objective of the solution is to provide a proactive monitoring capability to the operational staff and line management via IBM Tivoli Business Systems Manager business system views. It is also intended to provide SLA trend and violation information to executive and senior management via IBM Tivoli Business Systems Manager executive dashboards.
IRBTrade Company line managers will have access to the IBM Tivoli Business Systems Manager dashboards and business views for the services and resources for which they are responsible. Refer to 5.4.5, “Creating business systems based on business functions” on page 231, and 5.4.6, “Defining executive dashboard views” on page 239, for a complete list of services defined for IRBTrade Company.
292 Service Level Management
Usage example: Monitoring business system views using IBM Tivoli Business Systems Manager Administrative ConsoleThe line manager or the senior DBA responsible for database administrative services may monitor the IBM Tivoli Business Systems Manager business system view (BSV) shown in Figure 5-52. This person may notice that the DB2 server running on bc1srv12.itso.ral.ibm.com is in an exception state and is soon turning red. Upon this event, this person takes the appropriate action to correct the problem. This keeps its impact on applications that use the DB2 server (bc1srv12) to a minimum.
Figure 5-52 IRBTrade Company database servers view
Chapter 5. Case study scenario: IRBTrade Company 293
The line manager responsible for the IRBTrade Company user experience may monitor the IBM Tivoli Business Systems Manager view shown in Figure 5-53. He or she may notice that the IRBTrade Company customers are experiencing slow response time (yellow/warning condition) when requesting stock quotes and stock trading (sell) online (red/critical condition). By looking at the TBSM event view from this view, the line manager can see that the simulated stock quote and stock sell transactions are exceeding the specified thresholds. These transactions are monitored using IBM Tivoli Monitoring for Transaction Performance playback policy running from the IBM Tivoli Monitoring for Transaction Performance management agent bc1srv6.itso.ral.ibm.com.
Figure 5-53 IRBTrade Company user experience view
294 Service Level Management
Usage example: Business impact monitoringThe line manager responsible for IRBTrade Company Web servers may monitor the IBM Tivoli Business Systems Manager view shown in Figure 5-54. He or she may notice that the Web application server running on bc1srv21.itso.austin.ibm.com is in an exception state as soon as it turns red. By looking at the business impact view for the bcssrv21, he or she can determine the relative importance or severity of the problem and take appropriate action correct the problem. This keeps the impact on applications that use the Web application server to a minimum.
Figure 5-54 IRBTrade Company infrastructure Web application servers view
Chapter 5. Case study scenario: IRBTrade Company 295
Usage example: Monitoring executive dashboardThe IRBTrade Company marketing executive who is concerned with the user experience may monitor the IBM Tivoli Business Systems Manager executive dashboard shown in Figure 5-55. He or she may notice that IRBTrade Company customers may be experiencing slow response times, which may lead to an SLA violation. This real-time status may assist the senior management in escalating the issue for immediate attention to avoid potential SLA violation.
By drilling-down, the dashboard user can review the actual problem that caused the status change.
Figure 5-55 IRBTrade Company marketing executive/senior manager dashboard
Note: Figure 5-55 does not indicate an SLA violation or trend toward a violation. It indicates that one or more resources monitored as part the service (IRBTrade Company User Experience) are in exception state. Indicating the service status at the highest level can be controlled by specifying the appropriate propagation rules. Resource level exceptions can be monitored using the IBM Tivoli Business Systems Manager business views by operational staff or line management.
296 Service Level Management
The IRBTrade Company IT Executive who is concerned with trade application, IT infrastructure, and service desk may monitor the IBM Tivoli Business Systems Manager executive dashboard shown in Figure 5-56. He or she may notice that the IRB Trade IT Infrastructure service level is trending toward a violation. This trend indicator may provide an opportunity to investigate (by looking at the IBM Tivoli Service Level Advisor reports, for example) the underlying issues and resolve them in time to stop the negative trend to avoid the SLA violation.
Figure 5-56 IRBTrade Company IT executive dashboard with SLA trend indicator
Chapter 5. Case study scenario: IRBTrade Company 297
The IRBTrade Company IT Executive who is concerned with trade application, IT infrastructure, and service desk may look at the IBM Tivoli Business Systems Manager executive dashboard shown in Figure 5-57. He or she may realize that the IRB Trade IT Infrastructure and Trade Application service levels violated the SLA agreements for the previous period.
Figure 5-57 IT executive dashboard with SLA violation indicator
298 Service Level Management
Figure 5-58 and Figure 5-59 show that the IT infrastructure service is trending toward a violation for the upcoming period as well. This trend indicator may provide an opportunity to further investigate (by looking at the IBM Tivoli Service Level Advisor reports, for example) the underlying issues and resolve them in time to stop the negative trend. This helps to avoid the SLA violation for the upcoming period.
Figure 5-58 IT executive dashboard with an SLA violation and trend indicator
Figure 5-59 IT infrastructure service SLA violation and trend details
Chapter 5. Case study scenario: IRBTrade Company 299
Usage example: Dealing with an SLA trend The IRBTrade Company IT Executive who is concerned with the trade application, IT infrastructure, and service desk may monitor the IBM Tivoli Business Systems Manager executive dashboard shown in Figure 5-60. He or she may notice that the IRB Trade IT Infrastructure service level is trending toward violation. This trend indicator may provide an opportunity to investigate (by looking at the IBM Tivoli Service Level Advisor reports, for example) the underlying issues and resolve them in time to stop the negative trend to avoid the SLA violation.
Figure 5-60 IT executive dashboard with an SLA trend indicator
The IRBTrade Company Infrastructure senior manager checks the SLA high level report and finds that there trending toward a violation event was escalated during
Note: Escalation is enabled in IBM Tivoli Service Level Advisor to send events to the TEC server. You can do this during installation or post installation. Refer to Getting Started with IBM Tivoli Service Level Advisor, SC32-0834-03, to help you enable the escalation for post installation. The various types of events that are escalated (or posted to TEC) are violation of SLA, trending toward a violation for an SLA, trend cancel for the previously sent trending toward violation for an SLA, and application type events. You can configure the TEC server to forward IBM Tivoli Service Level Advisor events to IBM Tivoli Business Systems Manager. The trending evaluation period is set to daily for all SLOs.
300 Service Level Management
the intermediate evaluation period of 10/11/2004 to 10/14/2004. Refer to Figure 5-61 for the sample report.
Figure 5-61 IRB Infrastructure senior manager’s TSLA high level report
The IRBTrade Company Infrastructure senior manager clicks the high level report and sees that the details are of the trend shown in Figure 5-62.
Figure 5-62 Trend details as seen by the IRB Trade Infrastructure senior manager
Chapter 5. Case study scenario: IRBTrade Company 301
Further investigation indicates that the trending was due to the available memory that was decreasing in a way toward a violation as shown in Figure 5-63.
Figure 5-63 Report of system trending toward a violation
302 Service Level Management
Also the manager was informed that the problem may be due to a memory leak in the application on WebSphere application server. And the manager was informed that the development team is looking into it.
The trending toward a violation condition is investigated and escalated for immediate attention from the system support group. The system support group finds that WebApplication server process is the root cause of the problem. The process had higher CPU usage and the JVM runtime indicated that the memory used was increasing. Figure 5-64 shows the CPU usage of the Java process.
Figure 5-64 CPU usage by the process
The IRBTrade Company system support manager looks into the details of the intermediate evaluations of the system that is trending toward violation. The manager finds that the total available memory is decreasing day by day and may violate on 10/16/2004 at 8 p.m.
The IRBTrade Company system support manager’s report provides further details. Refer to Figure 5-63 for the sample report. The problem was transferred to the Web Infrastructure group for further evaluation.
Chapter 5. Case study scenario: IRBTrade Company 303
Web infrastructure support is informed about the findings. The team looks into the issue and finds that the application hosted on the server in question may be having a memory leak. This was reported to the development team of the application. While the development team investigates the issue (for resolution), the Web infrastructure support group suggests increasing the memory on the system in question so that the SLO is satisfied.
This trend event is propagated to the SLO of the trade application because the SLA that is measuring the SLO is the parent of the SLA that is measuring the SLOs of the Wintel servers.
Usage example: Dealing with an SLA violation At the beginning of the week, the marketing executive notices the executive dashboard and finds the violation shown in Figure 5-65.
Figure 5-65 IRBTrade Company marketing executive dashboard with a violation
Note: The trade application is the business service. The trend is propagated to the executive dashboard of the IT executive, which can result in taking timely action.
304 Service Level Management
The marketing executive logs into the TSLA reports and sees the high level report shown in Figure 5-66.
Figure 5-66 Marketing executive IBM Tivoli Service Level Advisor Reports
Chapter 5. Case study scenario: IRBTrade Company 305
The marketing executive drills down into the report and sees the violations of the availability of the business system IRB Trade User Experience and the response time of the trade sell response (Figure 5-67).
Figure 5-67 Violations of the application in user experience
306 Service Level Management
At the same time, the IT executive dashboard shows the SLA violations for IRBTrade Company IT Infrastructure (see Figure 5-68). It starts the investigation into an underlying course. The marketing executive contacts the IT executive and calls for a meeting to discuss the SLA violation.
Figure 5-68 IT executive dashboard with SLA violation and trend indicator
Chapter 5. Case study scenario: IRBTrade Company 307
IT executive management logs into the SLA reports sees the high level report as shown in Figure 5-69.
Figure 5-69 TSLA report as seen by the IT executive
308 Service Level Management
After drilling through the details, the IT executive management gathers the following information:
� The violations in the IRBTrade Company Infrastructure are due to the DB2 and WebSphere servers that were hosted on bc1srv12 and bc1srv21. See Figure 5-70. Because the trade application is hosted on these servers, the availability and the user experience SLOs are also effected due to this outage.
Figure 5-70 Violation report
� The outage impacted the availability of the trade application from the end-user experience. The trade application production environment has violations because the DB2 server (bc1srv12) and WebSphere server (bc1srv21) were down. This is indicated in Figure 5-52 on page 293 and Figure 5-54 on page 295. The availability of the trade application suffers and the successful number of transactions was lower than the specified SLO.
� The IT executive sees the violation report (Figure 5-70).
Chapter 5. Case study scenario: IRBTrade Company 309
� The Trade Application Manager sees the report for the period shown in Figure 5-71.
Figure 5-71 Violation and trending toward violation report
310 Service Level Management
� The Trade application manager report displays the violations due to the user experience. The unavailability of the servers that caused the outage is shown in the violations report (Figure 5-72).
Figure 5-72 TSLA Report detailing unavailability of the trade application
� Similarly the IRB Trade IT Infrastructure manager sees the violations for the two systems in question.
� After the analysis, the team suggested the following options to the IT executive to address the problem and reduce the potential for future SLA violations of this nature:
– Make a backup of the production system available at all times.
– Replicate the data on the production system. Then when any system in the production environment goes down, the backup system immediately takes over.
Employing one of these options will satisfy the SLO of the availability of the production environment.
Chapter 5. Case study scenario: IRBTrade Company 311
5.6 Continuous improvementThis section describes the views and reports that are made available to the various roles (business managers, IT managers etc.). It also explains what you need to do to carry forward the achievements to provide continuous improvement.
For IBM Tivoli Monitoring for Transaction Performance instrumentation for continuous improvement, IRBTrade Company must consider this proposal: Extend the IBM Tivoli Monitoring for Transaction Performance implementation to facilitate further decomposition of end-user experience or transactions. In doing so, deploying J2EE and QoS components helps to provide further insight into user transaction structure and topology.
For continuous improvement of IBM Tivoli Business Systems Manager, IRBTrade Company must consider the following proposals:
� Evaluate BSVs that are candidates for creating and keeping current by redefining these BSVs using the ABS configuration file and ABS commands. This facilitates reduction in manual efforts to maintain the BSVs. For example, IRBTrade Company Infrastructure BSV is ideal for this approach.
� Depending on the executive dashboard user feedback, consider implementing percentage-based thresholding (PBT) for BSVs and services that are used by dashboard users. PBT is a propagation concept. It enables a business system folder or business system shortcut to have its state derived from the collective state of the resources it contains.
� Consider using resource level propagation (RLP) to refine status propagation of both operational and executive service-related BSVs. RLP allows different thresholds for resources in the physical tree and for each copy of the resource in a business system.
Refer to Chapter 6, “Case study scenario: Greebas Bank” on page 315, for details about how to specify PBTs and RLPs.
For continuous improvement in IBM Tivoli Service Level Advisor, IRBTrade Company must consider the following proposals:
� Replace the current SLAs with the SLAs that were evaluating every month, instead of every week.
� Create the SLA for the marketing executive to see the details of the availability of the user experience business system SLA because the executive is not interested in the working details of the SLA.
� Implement the SLAs for the backup production environment.
312 Service Level Management
� Closely monitor the usage of the hard drive space and memory to plan for future requirements.
� Specify the start date of the SLA in the past so that it gives an idea of the current performance of the enterprise infrastructure for each SLO. This may lead to a better SLO.
� Determine the bottle necks and improve the performance of the application by using better tuning parameters and assigning better resources, depending on the mission criticality of the application. When this is done, try to improve the SLO.
� Use the adjudication function of IBM Tivoli Service Level Advisor when the violations can be adjudicated and agreement is reached between the service provider (IT infrastructure team or Trade Application team) and the user (marketing executive).
� Send e-mail escalation to the service desk, so that each violation is treated as an incident. This helps to measure the violations.
Chapter 5. Case study scenario: IRBTrade Company 313
314 Service Level Management
Chapter 6. Case study scenario: Greebas Bank
This chapter introduces a scenario that is based on fictitious the business, Greebas Bank. Greebas Bank has a complex infrastructure with services delivered on a combination of legacy mainframe and distributed systems platforms. Both the business units and the IT department face difficulties that are addressed by implementing service level management (SLM).
The scenario is based on the collective experiences of the authors from working at major IBM client sites around the world.
6.1 Background to the business and its current issuesGreebas Bank is a major European banking institution established for over 100 years that has grown in size as a result of a series of mergers and acquisitions. Its main focus is the United Kingdom (UK). However it operates in all parts of the European Union (EU) and has plans for further expansion into the recently admitted EU Member States where it already has a token presence.
6.1.1 The business unit perspectiveThe bank has an executive board that consists of a CEO and four business units with directors who are responsible for:
� Banking
This business unit provides traditional banking, checking, and savings accounts to companies and individuals.
� Trading
This business unit provides equity trading services for bank and independent brokers.
� Personal finance
This business unit provides credit cards and personal loans.
� IT
This business unit provides IT services to all parts of the company.
Over many years, Greebas Bank has built itself an image of a company providing value and high customer satisfaction. Historically Greebas Bank had a base of very loyal clients. However, use of the Internet to access bank services meant that client loyalty could no longer be assumed, especially if clients were unhappy with the service they are getting. Competition was easily a few mouse clicks away.
The banking and personal finance directors noted a trend of account closures and lost repeat business. Personal Internet checking accounts were particularly affected. The bank hired an independent company to conduct a survey of “lost” clients. Analysis of the results showed that one of the top three reasons for lost business was the unreliability of the bank’s online services in the evening when most clients wanted to access it. It also confirmed the suspicion that many lost clients switched to other banks as a result of their poor online experiences.
There are no current issues with the trading business. But, the trading director is concerned that he may start to suffer a loss of business if there is an underlying cause which has not been addressed.
316 Service Level Management
Figure 6-1 shows the CEO’s organization chart. This case study focuses on the banking business and the IT department.
Figure 6-1 CEO organization chart
The other business unit directors think they have insufficient information about services delivered by the IT department. Service level agreements (SLAs) are in place, but they are based on the availability of technology components rather than business services. And they almost always show that SLA targets are met. At best, the monthly SLA reports appear two weeks after the end of the reporting period, but often are delivered much later. The mismatch between the SLA reports and customer perception has sparked heated discussions between the business unit directors.
The concern is that, if the bank acquires a reputation for poor service, the loss of clients will grow exponentially. Because of the threat to the company, the board of directors has agreed to fund a program of service improvement proposed by the IT director. The board has expects to see results within six months.
6.1.2 IT management perspectiveThis section elaborates on the IT director’s organization, the IT department’s view of the situation, and a description of some of the work they have already done to try to improve services.
Summary of the issues:
� There is an increase in account closures and a loss of repeat business.� Online checking for accounts is unreliable at peak periods.� SLAs are delivered late and are not meaningful to the business.� SLA results do not tally with reported user experiences.� Improvements must be made within six months.
CEO
TradingDirector
PersonalFinanceDirector
ITDirector
BankingDirector
Chapter 6. Case study scenario: Greebas Bank 317
IT department organizationThe IT director is responsible for all IT services across the company. He has two managers reporting to him who are responsible for software development and service delivery respectively.
The development departmentThe development manager has three development teams, one for each business unit. They design, develop, test, and maintain application software to meet the changing needs of the business units. Some legacy applications used within the bank are based entirely on mainframes and accessed by terminals. However, all new applications are browser or Java based.
This department is under constant pressure to provide new business applications and enhancements. It is highly dependent on the availability of development and testing services provided by the service delivery department. There are no formal SLAs or OLAs for these services.
The service delivery departmentThe service delivery manager is responsible for operating all live services. Reporting to him are:
� An operations manager who manages:
– Four shift teams who provide a 24 x 7 service
– An incident and problem manager with a team of call loggers and first line support people who handle calls from all users of company systems
– A service level manager who is responsible for agreement of the SLAs with business units and production of SLA reports
� A technical support manager who manages teams focused on:
– Operating systems– IBM WebSphere– Networks– Databases– CICS and MQ
Figure 6-2 shows the high-level organization chart for the IT department. The IT department is highly centralized with most staff working at the bank’s headquarters building in central London. The bank’s lights-out data center has been designed with multiple instances of most components to provide high availability and disaster recovery. There are small teams of technical staff at the other main locations who report to the operations manager and provide local support for desktop computers, e-mail, file/print servers, and networks.
318 Service Level Management
Figure 6-2 Organization chart for Greebas Bank IT department
Summary of the issues:
� The cause of the problem with the online checking systems is not known.
� The IT staff are working in a reactive rather than proactive mode.
� Current tools do not provide data on the user experience.
� Separate tools provide disjointed “technology based” views of the infrastructure.
� Judging the impact of component failure depends on knowledge held in the heads of key technicians who are not always available.
� SLM processes are known to be ineffective and are based on unsuitable software tools.
ITDirector
DevelopmentManager
Operations Manager
Service Delivery Manager
Technical Support Manager
Operations Shift Leader
(x4)
Operating System Support
Team Leader
Incident Problem &
Change Manager
NetworksTeam Leader
CICS/MQ Team Leader
DatabaseTeam Leader
Service LevelManager
DevelopmentTL Banking
DevelopmentTL Trading
DevelopmentTL Personal
Finance
Chapter 6. Case study scenario: Greebas Bank 319
The IT director knew that he had to respond urgently to the concerns of the business or risk losing his job. He has already set up a task force to work on the service improvement program and placed a contract with IBM to provide consultants to give best practice advice and guidance on systems management.
6.2 Existing IT infrastructureThe bank has a complex mainframe and distributed systems IT infrastructure that is continually changing to meet business needs.
6.2.1 Systems environmentThis section provides a high level description of the systems environment at the bank.
Mainframe infrastructureThe company mainframe infrastructure consists of 22 logical partitions (LPARs) on five z/OS machines. DB2 and IMS are used for data storage and CICS is widely used for transaction processing by legacy applications. All major production services have multiple instances of software components running on different LPARs to provide high availability.
Distributed systems infrastructureWeb services are hosted on computers located in the data center. Traffic from the Internet is distributed by network load balancers between sets of WebSphere edge servers running on Windows 2000. The edge servers communicate with application servers running WebSphere Application Server located in a demilitarized zone (DMZ). These communicate with the legacy mainframe systems to exchange data as required.
There are also various Windows 2000 e-mail and file/print servers located throughout the enterprise.
Figure 6-3 shows a diagram of the type of infrastructure in place at Greebas Bank.
320 Service Level Management
Figure 6-3 Infrastructure schematic
6.2.2 Systems managementThis section provides an overview of the systems management infrastructure at the bank.
Mainframe systems managementThere is a mature systems management infrastructure based on IBM SA/390, IBM Tivoli NetView, IBM Tivoli Workload Scheduler, and IBM Tivoli Omegamon products. Event data is forwarded to IBM Tivoli Business Systems Manager.
Distributed systems managementTwo years ago the bank implemented IBM Tivoli Monitoring and IBM Tivoli Enterprise Console (TEC) to manage all Windows and UNIX servers. IBM Tivoli Monitoring resource models monitor key services, CPU utilization, and disk space. Heartbeating raises alerts when servers can’t be reached in the network.
IBM Tivoli Monitoring sends events to TEC where some event filtering is applied. Logfile adapters are used to collect information about a number of application and system events, which are also forwarded to TEC. So far minimal automation has been configured on TEC, but only to forward events to IBM Tivoli Business Systems Manager.
Table 6-1 summarizes the main systems management tools in place at the bank and the extent to which they have been exploited to date. Despite the use of these tools, the IT organization is working in reactive mode. There are no tools
Chapter 6. Case study scenario: Greebas Bank 321
available to measure end-to-end performance of applications, and therefore the user experience.
Table 6-1 Maturity of systems management tools
6.2.3 Existing service level managementThe existing SLAs are based on the percentage availability of servers as measured by analysis of incident records from the incident and problem management system. Software, developed by an employee who left the company two years ago, extracts and processes data, but takes 48 hours to run and fails every couple of months. The software is inadequately documented, and no current employee has the skills to fix it permanently. The SLA team imports the data into a spreadsheet, validates the results, then send the spreadsheet by e-mail to the business unit directors and within the IT department.
SLA reporting is a frustrating experience for the IT organization. Everyone wants to improve the entire process. The data created by IBM Tivoli Monitoring and TEC is not yet used for SLA reporting. The service level manager arranged the installation of Tivoli Data Warehouse three months ago, and extract transform loads (ETLs) were installed to collect data from IBM Tivoli Monitoring. There has been no progress with reporting from Tivoli Data Warehouse because of pressures to produce SLA reports.
Product Platform Maturity of exploitation
System Automation for z/OS Mainframe Very mature
IBM Tivoli NetView for z/OS Mainframe and distributed Very mature
Tivoli Workload Scheduler Mainframe Very mature
Omegamon XE for z/OS and OS/390 Mainframe Very mature
Omegamon II for CICS Mainframe Very mature
Omegamon II for IMS Mainframe Very mature
Omegamon XE for DB2 Mainframe Very mature
IBM Tivoli Monitoring Distributed Mature
IBM Tivoli Enterprise Console Distributed Mature
IBM Tivoli Business Systems Manager Mainframe and distributed Immature
Tivoli Data Warehouse Distributed Immature
322 Service Level Management
The IT director shares the view of the business unit directors that it is better to have SLAs that reflect the business. He knows he has to resolve the issues around production of SLA reports, but is not sure how to make this happen.
6.2.4 Business service managementIBM Tivoli Business Systems Manager was implemented by the bank six months ago during a console consolidation exercise.
Following IBM recommendations, the bank decided to acquire early values from IBM Tivoli Business Systems Manager. The bank did this by creating business systems based on the organizational structure of the IT department. It also eliminated a number of existing point solution monitoring tools.
The implementation team constructed business systems representing DB2, IMS, CICS, Windows, UNIX and the network for use by the operations and technical support teams. Each technical team has an IBM Tivoli Business Systems Manager view displaying the infrastructure components they look after. There have been significant savings on software licenses for superseded products.
The bank considers this phase of the project to have been a success. Despite this success, Greebas Bank has not implemented business service management as described in earlier chapters of this IBM Redbook.
Using IBM Tivoli Business Systems Manager for console consolidationBefore implementing IBM Tivoli Business Systems Manager, the operations bridge had separate consoles to show the status of various mainframe and distributed subsystems and monitors. As the enterprise grew in size and complexity over the years, the number of consoles continued to grow and the operations bridge became larger and crowded. Apart from cost and space considerations, there were too many places the operators had to look for alerts and status changes.
By implementing IBM Tivoli Business Systems Manager and sending events from the various monitors to it, IBM Tivoli Business Systems Manager became a focal point for the operators.
The IBM Tivoli Business Systems Manager administrator provided the operators with the IBM Tivoli Business Systems Manager Event Viewer as shown in Figure 6-4. The Event Viewer is being used to consolidate event feeds from z/OS and Windows 2000 machines in a single view with a common look and feel. This type of view can display events from any combination of monitors installed on both z/OS and distributed systems machines, depending on how the work space is configured.
Chapter 6. Case study scenario: Greebas Bank 323
Figure 6-4 Console consolidation using IBM Tivoli Business Systems Manager
The success of console consolidation enabled the IT department to reduce the number of consoles on the operations bridge, making it much less cluttered. Operators now have one screen to watch for all the events received by all the monitoring tools.
The operators and technical support teams still log in and use other tools when necessary, but the need to do this has been greatly reduced through the use of the TBSM Task Server. This enables an operator to launch a software tool in the context of an object selected (by right-clicking) on the IBM Tivoli Business Systems Manager console.
The IBM Tivoli Business Systems Manager implementation team should now gather information to build business systems based on business services. This work has been put on hold by the IT Manager because the technical staff with the
Tip: To learn about setting up the IBM Tivoli Business Systems Manager Task Server, see IBM Tivoli Business Systems Manager Administrator’s Guide, SC32-9085.
324 Service Level Management
key information about the infrastructure was told to focus on resolving the immediate difficulties with the Internet Banking service.
6.3 A service level management solutionThe task force set up by the IT manager decided to use the IT Infrastructure Library (ITIL) model for process improvement as a framework for making improvements. You can learn more about ITIL in Appendix A, “Service management and the ITIL” on page 447.
The approach taken can be summarized as follows:
� Decide the objectives and business goals: “Where do we want to be?”� Assess the current situation: “Where are we now?”� Formulate a plan to get to the desired situation: “How do we get there?”� Decide the success criteria and metrics: “How do we know we have arrived?”
6.3.1 Where we want to beThe task force drew up a list of desired outcomes based on business objectives produced by the board of directors. This is used to drive the service improvement project and evaluate its success. Table 6-2 identifies the desired outcomes, who is expected to benefit from them, and how to evaluate the outcomes.
Table 6-2 Desired outcomes
Desired outcome Who benefits? How to evaluate the outcome
1 Clear status information about business services
Business unit and IT directors
Get user feedback after implementation
2 The impact of infrastructure component failure on business services to be clearly visible and as close to real time as possible
Operations and service level managers
Get user feedback after implementation
3 Technical teams prioritize efforts to fix faults according to business impact
All stakeholders Measurable improvement in availability or performance of business services shown in SLA reports
4 SLAs based on the availability or performance of business services, agreed between IT and business unit directors, and implemented
Business unit and IT directors
Feedback from business unit and IT directors
Chapter 6. Case study scenario: Greebas Bank 325
6.3.2 Where we are nowThis section describes the initial investigation of the performance degradation issue and the key issues for the IT organization as seen by the task force.
Potential causes of performance degradationThe task force included representatives from each technical group. It examined the diagnostic information readily available and concluded that there was no obvious single cause.
The task force delivered a preliminary report which identified three areas of the infrastructure potentially responsible for the poor service reported by clients.
� Defective network components in the data centers� Peaks in user demand exceeding the capacity of Web servers� Overloading of infrastructure components shared by multiple services
5 Early warnings of potential SLA breaches IT director, operations manager and service level manager
Get user feedback after implementation
6 SLA reports available within one day of the end of the reporting period; intermediate SLA evaluation reports produced on demand throughout the reporting period
Business unit and IT directors, service level manager, and operations manager
Check date SLA reports are received; include a statement of due dates and actual dates of reports in an SLA reporting pack
7 Demonstrated improvement in business services as measured by the SLA reports and a reduction of instances of lost clients
All stakeholders Demonstrate measurable improvement in availability or performance of business services in SLA reports
8 OLAs agreed and implemented between technical team leaders and the IT director
IT director and technical team leaders
Count how many OLAs are in productive use within six months of implementation
9 New IT systems and processes in line with ITIL recommendations
All stakeholders Audit systems management processes as part of a continuous improvement program
Desired outcome Who benefits? How to evaluate the outcome
326 Service Level Management
Key issuesThe task force also documented their understanding of the key issues that the IT department needed to tackle, and the impact this was having, as summarized in Table 6-3.
Table 6-3 Key issues
6.3.3 How we will get thereThe task force produced a plan for the service improvement program. It made some early decisions about how to use software tools to deliver the desired outcomes.
The service improvement planThe task force decided to work in parallel on:
� A tactical solution to the performance problem� A strategic approach to address the other desired outcomes
Table 6-4 lists the key tasks and how they map to the desired outcomes listed in Table 6-2 on page 325.
Issue Impact
Business services are not performing as expected
Client dissatisfaction
No effective way of measuring services
Ineffective service management and inability to construct meaningful SLAs
No clear understanding of how the infrastructure maps onto business services
The business impact of component failure is either not known or relies on expertise of individuals; systems management cannot account for business impact
Technical staff does not always target incidents causing the greatest business impact
Potential for serious impacts to business services because of inappropriate prioritization in the absence of reliable business impact data
SLAs do not reflect delivery of business services
Poor SLM and dissatisfied internal customers
Production of SLA reports is expensive, slow, and erratic
Poor SLM, dissatisfied internal customers, and wasted IT resources
Chapter 6. Case study scenario: Greebas Bank 327
Table 6-4 Key tasks in the service improvement programs
Other items agreed at an early stage were:
� Production of the current SLA reporting will stop immediately to enable the SLA team to assist in implementing meaningful SLAs
� Business representatives will be appointed to the task force
Using tools and features to meet objectivesThis section summarizes how specific features of IBM software products are used to meet the objectives of the service improvement program. Further information about many of the topics covered here are provided in Chapter 3, “IBM Tivoli products that assist in service level management” on page 53, and in Chapter 4, “Planning to implement service level management using Tivoli products” on page 109.
Task description Desired outcomes addressed
Detailed analysis of potential causes of the poor performance of the Internet Banking service
7
Build business systems based on those starting with banking applications 1, 2, 3, 7
Review operations and technical team processes for incident prioritization 3, 7, 8
Update the systems management architecture to deliver the desired outcomes All outcomes
Agree the success criteria All outcomes
Plan implementation of the solution All outcomes
Implement the solution All outcomes
Review the implementation against the success criteria and refine if necessary All outcomes
Put a continuous improvement plan in place 7, 8
328 Service Level Management
IBM Tivoli Business Systems Manager features and usageTable 6-5 summarizes the IBM Tivoli Business Systems Manager features that are used in the solution.
Table 6-5 IBM Tivoli Business Systems Manager features and usage
IBM Tivoli Service Level Advisor features and usageTable 6-6 summarizes the IBM Tivoli Service Level Advisor (TSLA) features that are used in the solution.
Table 6-6 TSLA features and usage
Feature Reason for use
Business systems To create representations of business services to enable monitoring from a business perspective
Executive dashboard To provide executive views showing service status
Executive dashboard secondary impact indicators
To provide visibility of SLA violations and trends for critical services
Percentage based thresholds
� To control event propagation to executive views� To control event propagation for redundant components to correctly
represent business impact of component failure
Resource level propagation To avoid “hair trigger” situations to avoid alerting directors and managers to transient situations and faults with no real business impact
IBM Tivoli Business Systems Manager warehouse enablement pack (WEP)
To enable IBM Tivoli Business Systems Manager business system availability data to be exported to Tivoli Data Warehouse and used by IBM Tivoli Service Level Advisor
Feature Reason for use
IBM Tivoli Business Systems Manager/TEC integration
To enable breaches and trends for services to be displayed on IBM Tivoli Business Systems Manager executive dashboards
Intermediate evaluation of SLAs
To provide updates on how well the service is delivered before the end of the evaluation period
Notification of trends toward SLA violations during the reporting period
To provide early warnings of trends to appropriate executive dashboard users to focus on corrective action to prevent trends from becoming violations
SLA violation adjudication To provide a mechanism to record the facts when there is a justifiable reason for an SLA violation and enable this to be included in SLA reports
Scheduling planned service outages
To provide a mechanism to discount periods of planned service from SLA evaluations
Tiered SLAs To enable viewing of violations on multiple SLAs from a single tiered SLA
Chapter 6. Case study scenario: Greebas Bank 329
6.3.4 How we will know we have arrivedThe team agreed to the desired outcomes for the service improvement program in 6.3.1, “Where we want to be” on page 325. Table 6-3 on page 327 also suggests how success will be evaluated.
Some of the criteria is subjective. Other criteria is based on measurable improvements in service quality. In the process of implementing the solution, the IT department will negotiate with the business representatives to agree on service metrics that will ultimately be used to judge success. See “Stage 7: Agreeing to service level agreement objectives” on page 363.
Ultimately the service improvement project will conduct a post-implementation review and agree to further action that may be necessary after the project is closed.
6.4 ImplementationChapter 4, “Planning to implement service level management using Tivoli products” on page 109, covers the implementation of Tivoli products for SLM. This scenario uses the stages that are summarized in Table 6-7.
Table 6-7 Stages of implementation for the scenario
Stage Description Reference
1 Define services Identify and define business services and their infrastructure components at a high level
“Stage 1: Defining services” on page 332
2 Enhance instrumentation
Identify and implement additional instrumentation to enable the service to be measured
“Stage 2: Enhancing instrumentation” on page 333
3 Determine users and roles
Decide who will use IBM Tivoli Business Systems Manager and IBM Tivoli Service Level Advisor and what type of access they need
“Stage 3: Determining users and roles” on page 337
4 Determine IBM Tivoli Business Systems Manager resource types
Create any special IBM Tivoli Business Systems Manager objects if required
“Stage 4: Determining IBM Tivoli Business Systems Manager resource types” on page 339
5 Create IBM Tivoli Business Systems Manager business systems
Create a hierarchy of business systems to reflect the services being delivered
“Stage 5: Creating IBM Tivoli Business Systems Manager business systems” on page 340
330 Service Level Management
You can find the details of these stages in Chapter 2, “General approach for implementing service level management” on page 23. Or in the context of Tivoli products, refer to Chapter 4, “Planning to implement service level management using Tivoli products” on page 109.
6 Create IBM Tivoli Business Systems Manager views
Configure IBM Tivoli Business Systems Manager to meet the requirements of the various users and user roles
“Stage 6: Creating IBM Tivoli Business Systems manager views” on page 351
7 Agree SL objectives
Decide what service parameters will be measured in SLAs
“Stage 7: Agreeing to service level agreement objectives” on page 363
8 Define metrics Decide which specific metrics will be used in SLAs
“Stage 8: Defining metrics” on page 366
9 Prepare for ETLs Check IBM Tivoli Service Level Advisor implementation; test and schedule running of ETLs
“Stage 9: Preparing for ETLs” on page 369
10 Prepare IBM Tivoli Service Level Advisor
Set up IBM Tivoli Service Level Advisor realms, customers and schedules
“Stage 10: Preparing IBM Tivoli Service Level Advisor” on page 371
11 Create offerings Create service offerings for use in SLAs “Stage 11: Creating offerings” on page 375
12 Create SLAs and OLAs
Create the SLAs and OLAs to support the defined services
“Stage 12: Creating SLAs and OLAs” on page 395
12 SLA reporting Produce the SLA and OLA reports “Stage 13: SLA reporting” on page 409
Stage Description Reference
Chapter 6. Case study scenario: Greebas Bank 331
Figure 6-5 shows the high level implementation tasks. The numbers in the boxes correspond to the stages listed in Table 6-7.
Figure 6-5 High level implementation flowchart
6.4.1 Stage 1: Defining servicesIt is essential to clearly understand the business services delivered before proceeding further. For guidance about the general background information required, see Chapter 2, “General approach for implementing service level management” on page 23, and Chapter 4, “Planning to implement service level management using Tivoli products” on page 109.
To summarize, we must obtain the following information:
� What are the services: From the business representatives
� How are the services architected: From the application development representatives
� Where are the services implemented: From the IT service delivery representatives
Our aim is to work out the relationships between the main service components so that we can use this at a later stage to produce a business system hierarchy. We start from the highest level in the company, including banking, personal finance, and trading. Then we break this down into the next level of components. We need an early view of the relative importance of the different services and which have existing problems so we can work on the most critical services first.
#1 Identify anddefine services
#2 EnhanceInstrumentation
#3 DetermineTBSM & TSLA
User Roles
#4 DetermineTBSM Resource
Types
#6 Create TBSMViews
#7 Agree SLAObjectives
#8 DefineMetrics
#9 Prepare forETLs
#10 PrepareTSLA
#11 CreateOfferings
#12 Create SLAsand OLAs
#5 Create TBSMBusinessSystems
#12 SLAReporting
332 Service Level Management
Figure 6-6 shows our first stage analysis of the banking services.
Figure 6-6 Banking services: First level decomposition
6.4.2 Stage 2: Enhancing instrumentationIn this scenario, although appropriate systems monitoring are in place for the majority of the infrastructure components and events are fed into IBM Tivoli Business Systems Manager, there is no means of monitoring or measuring user experience.
Monitoring and measuring user experienceWe implement IBM Tivoli Monitoring for Transaction Performance to provide information about the user experience. For an overview of the IBM Tivoli Monitoring for Transaction Performance architecture, see Chapter 3, “IBM Tivoli
Banking
Asset Management
ATM System
BatchCICS
ATM NetworksATM ServersATM Transactions
Batch
Inter-bank TransfersBACS Clearing ProcessesCommercial InterbankingDTS data TransmissionsPersonal Interbanking
products that assist in service level management” on page 53, and Chapter 4, “Planning to implement service level management using Tivoli products” on page 109.
IBM Tivoli Monitoring for Transaction Performance simulates standard user transactions and measures how long they take to complete. The time to complete each transaction is measured and the result is sent as an event to TEC and, from there, to IBM Tivoli Business Systems Manager. Response time data is transferred from IBM Tivoli Monitoring for Transaction Performance and IBM Tivoli Business Systems Manager to the Tivoli Data Warehouse. We explain how data from IBM Tivoli Monitoring for Transaction Performance is used to measure user experience in “Online accounts performance data” on page 367.
You can find detailed technical instructions for installing IBM Tivoli Monitoring for Transaction Performance, configuring it to forward events to TEC, and installing the Tivoli Data Warehouse WEP in IBM Tivoli Monitoring for Transaction Performance Administrator’s Guide, GC32-9189, and IBM Tivoli Monitoring for Transaction Performance Warehouse Enablement Pack Implementation Guide, SC32-9109. For additional information, see Business Service Management Best Practices, SG24-7053.
We assume that the implementation of the product and integration with TEC has already been completed and tested. We concentrate on explaining how to use IBM Tivoli Monitoring for Transaction Performance to provide information about availability and response time.
Setting up IBM Tivoli Monitoring for Transaction Performance for bankingIn this example, we simulate browser-based transactions (though it should be noted that IBM Tivoli Monitoring for Transaction Performance can handle other types of transactions as well). We use the Synthetic Transaction Investigation (STI) playback component of IBM Tivoli Monitoring for Transaction Performance. This enables the recording and replaying of browser-based transactions and provides detailed reporting and thresholding mechanisms.
The key steps to set up IBM Tivoli Monitoring for Transaction Performance to monitor user perception for the online banking service are:
1. Identify the critical transactions.2. Set up user accounts and permissions for the simulated transactions to use.3. Decide locations for running synthetic transactions and prepare computers.4. Capture the transaction using the STI recorder feature.5. Configure playback policies, metrics, and thresholds.6. Distribute playback polices to IBM Tivoli Monitoring for Transaction
Performance Management Agent machines.
334 Service Level Management
Identifying the critical transactionsDuring this task, we ask business representatives to identify the most commonly used client activities so we can capture them in IBM Tivoli Monitoring for Transaction Performance. For example, for the online banking checking service, they may suggest that a typical user logs on, views their account balance, looks at a statement of the last month’s transactions, makes a payment, and logs off.
Setting up user accounts and permissionsThere are two separate tasks here:
� Create a checking account for the simulated transaction to use� Create a user account and setting up permissions for the simulated user to
access the checking service
Both tasks have security and process implications that vary from organization to organization and are not discussed further here.
Preparing locations to run the synthetic transactionsFirst we decide where to locate the IBM Tivoli Monitoring for Transaction Performance Management Agents (MAs) that will run the synthetic transactions. We give the MA locations careful thought to be as close as possible to the experience of real users.
Important: The transactions that are monitored are a sample of the transactions that are carried out by the business every day. An event received that describes a problem with these transaction does not indicate that all user transactions are affected. The event is only applicable to the sample transaction that generated it. “Configuring RLP to allow for single IBM Tivoli Monitoring for Transaction Performance failures” on page 343 shows how the sample size can be broadened without sending unnecessary events to IBM Tivoli Business Systems Manager users.
We recommend that you do not monitor every type of user transaction. Concentrate effort on critical transactions.
Tip: IBM Tivoli Monitoring for Transaction Performance V5.3 can measure and report upon network latency. Therefore, we recommend that you run the STI in different parts of the network. This enables you to quickly distinguish between issues caused by the network from those caused by application programs.
Also consider how your users access the service. Do they use the internal company network, an extranet, or the Internet? Place your machines accordingly.
Chapter 6. Case study scenario: Greebas Bank 335
The MA code must be installed on machines that are capable of running the synthetic transactions as described in IBM Tivoli Monitoring for Transaction Performance Administrator’s Guide, GC32-9189.
Recording the transactions using the STI recorderThe STI recorder feature of IBM Tivoli Monitoring for Transaction Performance is used to record one successful iteration of each transaction that is replayed to simulate the behavior of real users. To complete this task, we must have details of the account prepared earlier and knowledge of the application.
Configuring the IBM Tivoli Monitoring for Transaction Performance playback policies
We decide on which management agent machines the synthetic transactions will run and the schedule used to run the transactions. We also decide on the thresholds that will be used to determine whether events should be sent to TEC and IBM Tivoli Business Systems Manager.
We consider these points first for playback:
� The schedule must be set up to ensure that transactions are given time to complete.
� STI transactions must be run from locations that represent user locations, for example different countries or regions.
� The more frequently transactions are run, the better they represent the user experience.
Configuring IBM Tivoli Business Systems Manager for IBM Tivoli Monitoring for Transaction Performance eventsFor an overview of how IBM Tivoli Monitoring for Transaction Performance events are forwarded and displayed in IBM Tivoli Business Systems Manager, see Chapter 4, “Planning to implement service level management using Tivoli products” on page 109. For this scenario, we keep IBM Tivoli Monitoring for Transaction Performance objects and events in a separate child business system: Real-time User Experience – Banking. We did this because:
� Events indicating degradation to user experience usually propagate to the top-level business system so they can come to the attention of the business process owner.
Important: You must deploy the STI playback component to at least the IBM Tivoli Monitoring for Transaction Performance MA in your environment before you begin this step.
336 Service Level Management
� IBM Tivoli Monitoring for Transaction Performance events can put other events received for the technology objects in the business system into context. For example, a technology event received by a server shows the servers’ criticality to the business system.
� Corresponding IBM Tivoli Monitoring for Transaction Performance events indicating an increase in user response times show the impact upon users of the server hit. Incorrect event management at the source can result in giving insufficient priority to an event. If this were the case for the server hit, we would want the IBM Tivoli Monitoring for Transaction Performance event to always be visible in the business system. This is most easily achieved by keeping it in a separate business system that is subject to different propagation rules to the technology business systems.
� If components of the infrastructure are not instrumented, IBM Tivoli Business Systems Manager may not receive events that show that they are defective. We can overcome this deficiency by using complementary events from IBM Tivoli Monitoring for Transaction Performance, which may notice that the user experience has deteriorated without any information about the cause. If this occurs, it may be necessary to either implement additional instrumentation or to modify the business system. To enable this, we recommend that you create separate business systems for the user experience with their own propagation rules.
� We adapt the business systems to suit the requirements of the IBM Tivoli Business Systems Manager executive dashboard users. This requires us to have the IBM Tivoli Monitoring for Transaction Performance objects subject to different propagation rules to the other objects.
The business system structure that we use is shown in Figure 6-8 on page 342. The application of propagation rules to suit IBM Tivoli Monitoring for Transaction Performance events is described in detail in “Setting PBT rules to allow propagation to top-level business system” on page 348.
6.4.3 Stage 3: Determining users and rolesThe task force interviewed the key players in the organization and identified a number of discrete roles. The following sections explain the requirements for each role and how each one maps to IBM Tivoli Business Systems Manager and IBM Tivoli Service Level Advisor roles.
IBM Tivoli Business Systems Manager administratorThe IBM Tivoli Business Systems Manager administrator is responsible for the configuration and maintenance of the IBM Tivoli Business Systems Manager system. This person is also responsible for the construction of work spaces and
Chapter 6. Case study scenario: Greebas Bank 337
business systems for other users. There is no requirement to use IBM Tivoli Service Level Advisor.
In IBM Tivoli Business Systems Manager, this maps to the super administrator and administrator roles with Java console access.
OperatorsOperators need an IBM Tivoli Business Systems Manager work space which allows them to manage the entire production enterprise using all available IBM Tivoli Business Systems Manager views. They have no requirement to use IBM Tivoli Service Level Advisor. Although in some organizations, operators focus on specific services or customers, in this scenario, the shift operators share responsibility for all computer systems and there is no need to restrict the resources they can manage.
In IBM Tivoli Business Systems Manager, this maps to the operator and restricted operator role with Java console or Web console access.
Technical support team membersIn this organization, “technology tower” teams manage and plan specific parts of the infrastructure. Operators refer incidents to these teams if they are unable to resolve them. Each team requires an IBM Tivoli Business Systems Manager work space that provides views of the components for which they are responsible.
In IBM Tivoli Business Systems Manager, this maps to the operator and restricted operator role with either Web console or Java console access depending on the IBM Tivoli Business Systems Manager views that are used.
Service delivery, operations and technical support managersThis group of managers wants an executive dashboard with the ability to drill down and see additional details of current incidents. These users also want to access IBM Tivoli Service Level Advisor to examine the intermediate SLA evaluation reports.
In IBM Tivoli Business Systems Manager, this maps to the TBSM_Executives_IT role with executive dashboard access. In IBM Tivoli Service Level Advisor, this maps to an SLM Reports Console user role.
Business unit directors The directors, including the IT director, want a window available on their desktop computers that shows the status of the critical company services. Specifically they want the display to show when a key application is down and when users of
338 Service Level Management
a key application are experiencing poor response time. They also want to be aware of potential and actual SLA breaches that relate to key business services.
They want a simple display without the technical details. They want a nominated deputy to view the display, access current SLA reports online, and receive SLA reports sent via e-mail from the SLM team.
In IBM Tivoli Business Systems Manager, this maps to the TBSM_Executives user role with executive dashboard access. In IBM Tivoli Service Level Advisor, this maps to an SLM Reports Console user role.
Service level managerIn our scenario, the service level manager does most of the non-routine work related to SLAs. Although using IBM Tivoli Service Level Advisor as his principle tool, the service level manager wants access to the same IBM Tivoli Business Systems Manager executive dashboard seen by the business unit directors to have a current picture of the state of the services.
In IBM Tivoli Service Level Advisor, this maps to the SLM administrator and SLM Reports user roles. In IBM Tivoli Business Systems Manager, this maps to the TBSM_Executives_IT role with executive dashboard access.
Service level assistantIn this scenario, the service level manager has an assistant who works with SLAs, does adjudication, and produces the SLA reports for circulation. There is no requirement for IBM Tivoli Business Systems Manager access.
In IBM Tivoli Service Level Advisor, this maps to the SLA Specialist and SLA Adjudicator roles.
6.4.4 Stage 4: Determining IBM Tivoli Business Systems Manager resource types
No additional IBM Tivoli Business Systems Manager resource types were required for the solution in this scenario, so no action was necessary. The section is included to remind you that this may be necessary depending on the event sources you are using.
To learn how to define IBM Tivoli Business Systems Manager resource types as generic objects, see Chapter 5, “Case study scenario: IRBTrade Company” on page 197.
Chapter 6. Case study scenario: Greebas Bank 339
6.4.5 Stage 5: Creating IBM Tivoli Business Systems Manager business systems
The Banking business system was built using the structure shown in Figure 6-7. There are six child business systems, each of which contain their own child business system. The business system was built using drag and drop, but could have been built using Automatic Business Systems (ABS) or Extensible Markup Language (XML) as discussed in IBM Tivoli Business Systems Manager Administrator’s Guide, SC32-9085.
The Online Accounts business system is critical, the ATM System business system is important, and the other business systems are of equal low criticality. The banking director must be informed, without delay, of impacts to ATM System and Online Accounts. The banking director is less concerned about the other business systems but should be notified if they are affected by severe problems.
Figure 6-7 Banking business system
340 Service Level Management
Although the director is the primary customer of this business system, we need to ensure that the customizations do not impair the ability of the other IBM Tivoli Business Systems Manager users to fulfil their responsibilities.
We configure the business system to the director’s requirements using these steps:
1. Set resource level propagation (RLP) to stop child events from propagating to the top level business system.
2. Configure RLP for the Real-time Account Application Transaction child business system to allow for single IBM Tivoli Monitoring for Transaction Performance transaction failures.
3. Set child business system weighting to prioritize business system alerting.
4. Set the priority of Real-time User Experience – Banking business system to permit propagation to override percentage-based thresholding (PBT) rules.
5. Set PBT threshold rules to permit child business systems to propagate to a top level business system.
6. Define the business system as a service, and configure the executive dashboard for the business system.
7. Verify that the business system is valid for other user roles.
Chapter 6. Case study scenario: Greebas Bank 341
Setting RLP to stop child events propagatingThe child event RLP is set on the Banking business system to stop all child events from propagating all business systems to Banking as shown in Figure 6-8.
Figure 6-8 PBT settings for the Banking business system
342 Service Level Management
Configuring RLP to allow for single IBM Tivoli Monitoring for Transaction Performance failuresThe Real-time Account Application Transaction business system is a child of the Banking business system as shown in Figure 6-9. It contains five child objects. Each object represents an instance of the same IBM Tivoli Monitoring for Transaction Performance STI running on a different Management Agent. A short-duration network problem could cause an individual STI transaction to fail.
Figure 6-9 Real-time Account Application Transaction business system
RLP is used to ensure that propagation only happens based on the settings in Table 6-8 to prevent such transient faults from alarming the Executive Console users.
Table 6-8 RLP settings for Real-time Account Application Transaction business system
Propagation conditions Red Yellow
High > 1 > 2
Medium > 2 > 3
Low > 3 > 5
Chapter 6. Case study scenario: Greebas Bank 343
This configuration of RLP allows the business system to receive at least two events before an event is propagated up to the next level. This is done by determining the desired thresholds and defining them in the Child Event window of the Real-time Account Application Transaction business system properties (Figure 6-10).
Figure 6-10 RLP settings for Real-time Account Application Transaction business system
344 Service Level Management
Setting weighting to allow prioritization of business system alertingThe child business systems are not of equal criticality. Online Accounts is the most critical, followed by ATM System. The other business systems are all less critical and equal in importance. The weights of the business systems have been adjusted to allow the PBT rules to reflect the ranking of the business systems. Figure 6-11 shows the Propagation window of the Banking business system and the weightings of the child business systems.
Figure 6-11 Different weights for child business systems based on priority
Chapter 6. Case study scenario: Greebas Bank 345
Table 6-9 summarizes the importance of each business system based on weight.
Table 6-9 Importance of child business systems based on weight
Setting the priority of the business system to override RLP and PBT rulesThe Real-time User Experience – Banking business system has a weight of 0. This means that it will not participate in the PBT calculations and will not send any events to the Banking business system. This may seem odd considering that we already stated that we want this business system to send its events to the Banking business system. However, giving this business system a weight would complicate the PBT rules. We resolve this apparent contradiction by using an override mechanism.
Real-time User Experience – Banking only sends up user experience events that have already passed the thresholds set by its own child business systems. Any event sent to the Real-time User Experience – Banking business system indicates a problem with user experience.
Business system Importance Weight
ATM System High 200
Asset Management Low 50
Batch Low 50
Interbank Transfers Low 50
Online Accounts Very high 250
Real-time User Experience Not included in calculations 0
Important: The weight values for the business systems are based on what makes the PBT mathematics work to satisfy the requirements. Some trial and error are involved to ensure that more complex scenarios work as required. See Chapter 4, “Planning to implement service level management using Tivoli products” on page 109, for more details.
346 Service Level Management
We want to propagate this to the relevant executive dashboard users. To do this, we set the priority of the Real-time User Experience – Banking business system to Critical as shown in Figure 6-12. This overrides all propagation rules and allows the event to be propagated directly to the Banking business system.
Figure 6-12 Business system set to priority of Critical to allow propagation
Chapter 6. Case study scenario: Greebas Bank 347
Setting PBT rules to allow propagation to top-level business systemWe used the following criteria when setting the PBT for the Banking business system:
� For one or two red low-criticality child business systems, send a low yellow event to Banking.
This rule is for non-critical business systems only. Any red status that affects them should notify the IBM Tivoli Business Systems Manager executive dashboard users. However, the notification should reflect the low criticality of these business systems.
Figure 6-13 Sending a low yellow event for one or two red non-critical business systems
348 Service Level Management
� For three red child low-criticality business systems or a red event on the ATM System business system, send a high yellow event to Banking.
This rule is for three non-critical business systems that have red events or for the ATM System business system that have a red alert. The weighting is set up so that this rule fires when the ATM System is the only business system to have a red event or when all three of the non-critical business systems have a red event. A high yellow event is sent to the Banking business system.
Figure 6-14 Sending a high yellow event for three red non-critical or ATM System
Chapter 6. Case study scenario: Greebas Bank 349
� For a red event on the Online Accounts business system, send a high red event to Banking.
This rule fires when the Online Accounts business system is the only business system to have a red event. It also fires when the ATM System business system and one or more non-critical business systems have red events. It does not fire if all the non-critical business systems have red events.
Figure 6-15 Sending a high red when Online Accounts has a red event
350 Service Level Management
� For green child business systems, clear PBT events from Banking.
This rule is set to clear out all PBT-generated events when all child business systems are in green status. It is similar to the green threshold rule for the Personal Finance business system except that the event ID is set to be the same as the other Banking business system PBT threshold rule event IDs. This allows the PBT-generated events to be cleared.
Defining services and configuring the executive dashboardThe IBM Tivoli Business Systems Manager administrator defines the Banking business system as an executive dashboard service using its properties pages. Then the administrator drags the Banking business system icon to the Banking Director icon in the executive dashboard list as described in Chapter 4, “Planning to implement service level management using Tivoli products” on page 109. He also adds the business system to the executive view lists for the operations manager and the service delivery manager.
Verifying that the business system suits other user rolesThe Banking business system is customized to suit the banking director. We now must ensure that other IBM Tivoli Business Systems Manager users with a responsibility for the Banking business system can manage it correctly from their IBM Tivoli Business Systems Manager view. This is covered in the next section.
6.4.6 Stage 6: Creating IBM Tivoli Business Systems manager viewsWith the Banking business system customized, we must create views for each role and ensure that they are suitable and usable. We now explain the special configuration and constructions to the meet the specific requirements of the users and roles from “Stage 3: Determining users and roles” on page 337.
Role: IBM Tivoli Business Systems Manager administratorsNo specific customization is required for the IBM Tivoli Business Systems Manager administrator. This person uses out-of-the-box functionality and sees everything in IBM Tivoli Business Systems Manager.
Tip: It is possible, and sometimes desirable, to set green rules to match every red and yellow PBT rule to clear each PBT-generated event when it is no longer applicable. We chose not to do this here because the business system is already complex, and the extra refinement presents administrative overhead with little benefit. The rules are set to notify the Executive Console users when there is a problem impacting their business and, when the problem is resolved, the rules clear the notification from the executive dashboard. Further refinement is possible but not necessary.
Chapter 6. Case study scenario: Greebas Bank 351
Role: OperatorsThe IBM Tivoli Business Systems Manager administrator creates a work space for the operations team that contains the whole enterprise represented as business systems. No special customization is required other than to create the business systems.
IBM Tivoli Business Systems Manager operators have an extensive range of IBM Tivoli Business Systems Manager views available to them as explained in Chapter 4, “Planning to implement service level management using Tivoli products” on page 109. They normally access IBM Tivoli Business Systems Manager using a Java console to allow them to use hyperviews, topology views and the Event Viewer.
In this scenario, the operations team sees an initial view as shown in Figure 6-16 when they first log on to IBM Tivoli Business Systems Manager. The work space includes two windows containing:
� A hierarchical topology view� An Event Viewer
Figure 6-16 Java Console for operations
352 Service Level Management
Hierarchical topology viewThe hierarchical topology view shows several business systems. By including both technology business systems and business systems, operators see a single view of the whole production enterprise. This enables the operations team to monitor and manage the critical business applications, the underlying technology, and the associated production technologies that are not direct components of a business application.
In our scenario the scope of the operator’s responsibility is limited to production systems. This approach is good practice because test and development services tend to create large numbers of events that clog the console and reduce the effectiveness of operations to react to business-impacting events.
Event ViewerUnderneath the topology view is an Event Viewer. It enables operators to view the events that affect the business systems shown in the top view and take action on individual events as required. This conforms to the operators’ accustomed working practices and smooths the transition to IBM Tivoli Business Systems Manager. The column adjustments done for the consolidation consoles (Figure 6-4 on page 324) are retained for this use of the IBM Tivoli Business Systems Manager Event Viewer.
Verifying the Banking business system for the operator roleThe IBM Tivoli Business Systems Manager operator needs to see all events for all objects in the Banking business system. The propagation rules prevent events from propagating to the top of the Banking business system. Therefore, operators need a view that shows them the technology event, the PBT-issued events, and the overall status of the Banking business system. The combination of a hierarchical topology and the Event Viewer in the operator work space delivers these requirements. It does so using the rules that we applied to the Banking business system.
Disaster recovery and call outThe operations team is also required to become familiar with the IBM Tivoli Business Systems Manager Web Console. This enables them to work at a remote site in the event of disaster recovery.
IBM can make the IBM Tivoli Business Systems Manager Web Console available to on-call support technicians to reduce the need for resolution-delaying travel.
Note: Associated technologies may be started tasks on z/OS systems, for example, that are not components of a business application but are critical to the overall status of the z/OS system that hosts the business application.
Chapter 6. Case study scenario: Greebas Bank 353
They can view the IBM Tivoli Business Systems Manager Web Console over a secure link to assess the business impact of a failed component and direct fault resolution. A Critical Watch List (CWL) (Figure 6-17) was created for operations using the same business systems as used in the Java Console work space.
Figure 6-17 TBSM Web Console showing the CWL
Role: Technical support team membersAs shown in the IT department organization chart (Figure 6-2 on page 319), there are separate technical support teams for operating systems, WebSphere, networks, databases and CICS/MQ. In our scenario, these teams were already using IBM Tivoli Business Systems Manager to consolidate events from their various specialized product monitoring tools. However, they were not taking full advantage of IBM Tivoli Business Systems Manager features.
This section describes the improvements for the DB2 team that exploit new IBM Tivoli Business Systems Manager V3.1 features.
354 Service Level Management
Technology-based business system foldersIBM Tivoli Business Systems Manager provides sophisticated topology views for DB2, CICS and IMS. Figure 6-18 shows the workspace setup for the database team and the IBM Tivoli Business Systems Manager Topology view for DB2. The team uses the topology view for a high-level overview of their DB2 systems.
Like the operations work space, the team can enhance this view by using the IBM Tivoli Business Systems Manager Event Viewer. For this view, the IBM Tivoli Business Systems Manager users use the Event Viewer by toggling it on and off as needed.
Figure 6-18 Example of a technology-based TBSM business system view
Chapter 6. Case study scenario: Greebas Bank 355
Role: Technical support team leadersEach team leader wants a view that shows the status of the technology for which they are responsible, so we built a separate Executive Console view for each of them. We could have added the icons to show the status of services, but did not in this case. Figure 6-19 shows the view for the database team leader.
The business systems used by the technical team members are also used for the technical team leaders’ executive dashboards. The difference is that the team members have full IBM Tivoli Business Systems Manager functionality using the IBM Tivoli Business Systems Manager Java Console. And the team manager has a status overview from the executive dashboard.
Figure 6-19 Executive view for database team leader
356 Service Level Management
Role: Operations and technical support managersThese managers have complementary responsibilities. Between them, they must deliver the services expected by the customers, but also be aware of the overall status of the infrastructure even though services may not be currently affected. The executive dashboard view (Figure 6-20) that meets this requirement includes icons that represent three aspects of the status of the enterprise:
� The status of services as presented to directors
� The status of the business systems that support the services, such as the ability to view the technology events that affect the status of the services
� The status of the production technology systems
Figure 6-20 Executive dashboard: Operations and technical support managers
Services as presented to directorsThere is one icon that represents the overall status of the services provided to each director: one each for the banking, personal finance and trading businesses. These icons show exactly what the directors see. You can learn more about them “Business unit directors” on page 338.
Status of business systems supporting key servicesIt is not enough for this group of managers to see the same view as the directors. They need to be assured that the technical teams are dealing properly with faults that have not yet impacted services. The propagation rules that we set up for the business systems described so far prevent them from seeing the details that they need. Because of this, we build service-supporting business systems.
Chapter 6. Case study scenario: Greebas Bank 357
This second set of icons on the dashboard indicates component failures that have not impacted services but must still be fixed. It reflects the status of the business systems that represent the services.
These business systems are shortcuts of the child business systems of the Banking, Trading and Personal Finance business systems. The child business systems have new high-level business systems created without any thresholding rules. All events propagate up to these business systems. This satisfies the requirements of the people in these roles to be aware of all technology events.
The structure of the three business systems that support the services are shown as children of the Operations Manager business system (see Figure 6-21). The business system icons may show a different status than the previous set of icons because there may be some issues with components that are not so serious as to cause a failure of services.
Figure 6-21 Business system that support services and their executive dashboard icons
358 Service Level Management
Status of production technology systemsThe final icon reflects the status of the Production Technology Systems business system. This business system contains child business systems that contain objects that represent all of the production resources in the Bank. There are many resources that are not directly part of the business processes, but that are part of the technology that underpins the business processes. These resources need to be monitored and managed. The operations manager wants to see this view, which is also available to the operators.
This icon is likely to show a different status than the other sets of icons because it is has a broader scope.
Role: Service delivery managerThe service delivery manager is primarily interested in the status of services and does not want to see details about problems with the technology. He sees a view that is the same as the one for operations and technical support managers, except that it does not have the icon for the production technology systems.
Figure 6-22 shows the service delivery manager’s executive dashboard.
Figure 6-22 Executive dashboard for the service delivery manager
Chapter 6. Case study scenario: Greebas Bank 359
Role: Business unit directorsThere are special considerations when setting up IBM Tivoli Business Systems Manager to meet the requirements of the directors. They want to know when services are down, when customer response time is degraded, when SLAs are breached, and if there is a likelihood of them being breached. They do not want to know about failures in infrastructure components that do not affect key services. We can meet these requirements using the executive dashboard views.
Customization of the Banking business system performed in “Stage 5: Creating IBM Tivoli Business Systems Manager business systems” on page 340 is done with this in mind. We demonstrate the effectiveness of the solution using tests.
Figure 6-23 shows the banking executive basic view.
Figure 6-23 Banking director executive dashboard
Note: We must balance this carefully. We want to inform the directors about serious services issues, but we don’t want to alarm them unnecessarily. The solution can fall into disrepute if we either fail to show real issues or raise false alarms.
360 Service Level Management
To test event behavior, we sent red alerts to objects in the Asset Management business system. As expected, when Asset Management turned red, the top of the business system tree, the Banking object itself, received a yellow alert as shown in Figure 6-24.
Figure 6-24 Yellow alert from one red business system
We cleared the previous alert and sent another red event to an object in the Online Accounts business system. This one red event caused the Banking object to turn red as the rules state that it should (see Figure 6-25).
Figure 6-25 Red propagating to the top of the Banking business system
Chapter 6. Case study scenario: Greebas Bank 361
This red event turns the executive dashboard red for the banking executive view as shown in Figure 6-26.
Figure 6-26 Executive dashboard for banking executive
The drill down of this event shows that it is the PBT-configured event that is sent to the Executive and not the technical alert that caused the incident as shown in Figure 6-27.
Figure 6-27 Drill down of alert sent to banking executive
362 Service Level Management
We issued and cleared events across the Banking business system until we exhaustively tested the rules that were configured for this business system and verified that it performs as expected for all roles. It is fit for use in production.
6.4.7 Stage 7: Agreeing to service level agreement objectivesIn this stage, we decide on the required SLAs and OLAs and their targets.
Required SLAs and OLAsChapter 4, “Planning to implement service level management using Tivoli products” on page 109, discusses the difference between SLAs and OLAs. This section provides an overview of the SLAs and OLAs that need to be put in place to support the production Banking services as an example of what is required ultimately for all production services.
Some organizations may also want OLAs for testing and development services. We do not cover this here. The approach is essentially the same, but usually with significantly lower targets than for production services.
Table 6-10 summarizes the SLAs and OLAs required. The first three entries in the table are SLAs. They provide measurement of the quality of the services being delivered to customers. Both availability and response times for services are covered in the SLAs, and reports are provided to customers.
The remaining entries are OLAs for internal use within the IT department and reports are not provided to customers. They are intended to provide a measurement of the quality of infrastructure subsystems being delivered by the technical support teams.
Tip: You can develop business systems in a test IBM Tivoli Business Systems Manager environment. You can also subject them to behavior verification without impacting the production IBM Tivoli Business Systems Manager environment. After the business system is verified, you can extract it from the test environment and implant it into the production environment using the XML facilities provided with IBM Tivoli Business Systems Manager V3.1. For details about using XML to export and import business systems, see IBM Tivoli Business Systems Manager Administrator’s Guide, SC32-9085.
Chapter 6. Case study scenario: Greebas Bank 363
Table 6-10 SLA and OLAs for production Online Accounts services
SLA targetsHaving determined the SLAs and OLAs required, we must define the targets for each of them. We discuss examples of an SLA and an OLA here. Later in this chapter, we show how they are implemented.
SLA example: Performance and availability of online accounts The banking business representative has stated the parameters for the minimum acceptable requirements for the Online Accounts service. It has been made clear that this is simply the starting point to be used initially in the SLA, and that the banking director expects to see this improved over time.
Description Client Provider Type
Online accounts performance and availability Banking director
IT director SLA
Account application performance and availability Banking director
IT director SLA
Interbank transfers performance and availability Banking director
IT director SLA
OS availability for z/OS servers (production banking) Operations manager
Technical support manager
OLA
OS availability for Windows servers (production banking) Operations manager
Technical support manager
OLA
OS availability for UNIX servers (production banking) Operations manager
Technical support manager
OLA
WebSphere service availability (production banking) Operations manager
Technical support manager
OLA
Network service availability (production banking) Operations manager
� The service hours are 24 hours per day, 7 days per week.
� The service should be available for at least 99.5% of the time during service hours.
� The response time of the service should no greater than 10 seconds for 99.5% of transactions during the service hours.
� The reporting period for measurement is one month.
� Interim weekly SLA reports should be provided for at least the first three months after which the requirement will be reviewed.
� Reports should be available for review within one day of the end of the reporting period.
OLA example: OS availability for Windows serversIn this case, there are multiple instances of all the servers supporting the production banking services to provide high availability. The resilience of the architecture enables the service to withstand the failure of at least 50% of the components without serious degradation in the performance perceptions of clients under normal load conditions. The teams that are supporting the servers do not have statistics to show the average availability that is currently being delivered.
It has been agreed that rather than measuring the availability of servers, a better measurement of the effectiveness of the support teams is to base measurements on how long it takes to get critical servers back online after a failure.
� The service hours are 24 hours per day, 7 days per week.
� The average time to return a server to a fully operational state after a failure should be one hour or less, except when a server is taken out of service for planned maintenance.
� The longest time to return a server to a fully operational state after a failure should be four hours or less, except when a server is taken out of service for planned maintenance.
� The reporting period for measurement is one month.
� Interim SLA reports should be provided each day, at least for the first three months.
� Reports should be available for review within one day of the end of the reporting period.
Chapter 6. Case study scenario: Greebas Bank 365
6.4.8 Stage 8: Defining metricsMetrics must be determined to carry out evaluation of the SLAs and OLAs.
Metrics for example SLA online accounts: Performance and availabilityThere are two components of this SLA: availability and response time. Both require metrics.
Figure 6-28 Sources of metrics for example SLA
Online accounts availability dataFor availability, SLA metrics are taken from the Online Accounts business system in the Banking business system. Events that affect the Online Accounts business system come from the systems management products monitoring the technology components of the business process.
Bad events that propagate to the Online Accounts business system icon are regarded as availability impacts. The business system is regarded as available when green, degraded when yellow, and unavailable when red. This emphasizes the importance of event management as discussed in Chapter 4, “Planning to implement service level management using Tivoli products” on page 109.
Data that contains the duration of each red, yellow or green state are moved from IBM Tivoli Business Systems Manager to the Tivoli Data Warehouse by running an ETL. The data is transferred to IBM Tivoli Service Level Advisor by another ETL. IBM Tivoli Service Level Advisor uses the data to calculate availability.
Availability metrics
Performancemetrics fromhere
from here
366 Service Level Management
Online accounts performance dataFor performance, SLA metrics are taken from the Real-time Online Account Transactions business system. IBM Tivoli Monitoring for Transaction Performance can help to provide data to calculate the average time taken to complete a transaction. However, in this case, the requirement is to identify the percentage of transactions that take longer than a threshold value. This information cannot be obtained directly from IBM Tivoli Monitoring for Transaction Performance.
Instead we configure IBM Tivoli Monitoring for Transaction Performance to send different events to IBM Tivoli Business Systems Manager objects that represent IBM Tivoli Monitoring for Transaction Performance Management Agents depending on whether the threshold is breached. Threshold setting and alerting is standard IBM Tivoli Monitoring for Transaction Performance functionality as described in IBM Tivoli Monitoring for Transaction Performance Administrator’s Guide, GC32-9189. The objects are in the Real-time Online Account Transactions business system.
An STI recording is played back on the IBM Tivoli Monitoring for Transaction Performance Management Agents. The time taken to complete it is measured. If it exceeds the threshold, the resulting event sets the object state to yellow or red depending on how far the threshold is exceeded.
Like before, the data is transferred to IBM Tivoli Service Level Advisor through ETLs. IBM Tivoli Service Level Advisor used the data to calculate the percentage of transactions that were within the 10 second threshold.
Chapter 6. Case study scenario: Greebas Bank 367
Metrics for example OLAThere is one metric for this OLA, Mean time to repair. This measures the time period between a server entering a degraded or unavailable state and its return to an available state.
The data is taken from the IBM Tivoli Business Systems Manager business system OS Availability for Window Servers. This business system contains 10 critical servers (Figure 6-29). Events received for each of the servers are used to calculate the Mean time to repair for each server and the whole business system.
Figure 6-29 OS Availability for Window Servers business system
368 Service Level Management
6.4.9 Stage 9: Preparing for ETLsThis redbook does not cover the basic implementation of IBM Tivoli Service Level Advisor. You can find details about this implementation in Getting Started with IBM Tivoli Service Level Advisor, SC32-0834-03.
The tasks to set up ETLs on IBM Tivoli Service Level Advisor are:
1. Check the IBM Tivoli Service Level Advisor installation.2. Run the initial ETL.3. Schedule the running of ETLs.
Checking the IBM Tivoli Service Level Advisor installationThe person who is installing the software must complete these tasks:
1. Install the basic IBM Tivoli Service Level Advisor.
2. Install the IBM Tivoli Business Systems Manager, IBM Tivoli Monitoring for Transaction Performance, IBM Tivoli Monitoring, and any other WEPs including the pre- and post-installation steps.
3. Install the IBM Tivoli Service Level Advisor WEP including the pre- and post-installation steps.
Important: If you do not issue the commands to access state transition data, you do not see the required data from the Tivoli Data Warehouse for IBM Tivoli Monitoring for Transaction Performance and IBM Tivoli Business Systems Manager. You can find general guidance in Getting Started with IBM Tivoli Service Level Advisor, SC32-0834-03, under “Enabling Existing Source Applications for Data Collection.”
If you have not already issued the commands, follow these steps:
1. Go to the directory where you installed IBM Tivoli Service Level Advisor (C:\TSLA) for example.
2. Run the following command:
– For Windows:
slmenv
– For UNIX or Linux:
. ./slmenv
3. Run the following commands:
scmd etl enable MODEL1 (enables the Tivoli common data model)smcd etl enable GTM (enables data from TBSM)smcd etl enable BWM (enables data from TMTP)
Chapter 6. Case study scenario: Greebas Bank 369
Running the initial ETLWe must run the ETLs in the correct sequence to enable the transfer of meaningful data to IBM Tivoli Service Level Advisor.
1. Move data from the source applications to Tivoli Data Warehouse.2. Move data from Tivoli Data Warehouse to IBM Tivoli Service Level Advisor.
Figure 6-30 shows the recommended processing sequence for ETLs on the first occasion, assuming that the data is sourced from IBM Tivoli Business Systems Manager, IBM Tivoli Monitoring, and IBM Tivoli Monitoring for Transaction Performance. We recommend that you run the ETLs manually on the first occasion and note the time taken to complete each one to assist scheduling at a later date.
Figure 6-30 Initial Run ETL sequencing
Thereafter, database reorganization must be done periodically to maintain the performance of IBM Tivoli Service Level Advisor.
To run the database reorganization, use these steps:
1. Stop the IBM Tivoli Service Level Advisor service from Windows Services.
2. Open a DB2 command window. Type the following command to check that there are no connections to the IBM Tivoli Service Level Advisor database:
db2 list active databases
Tip: When the IBM Tivoli Service Level Advisor Registration ETL is run for the first time, IBM Tivoli Service Level Advisor must process a large amount of component type information. After it is completed, we recommend that you reorganize the database to improve performance.
Note: If there are connections to the IBM Tivoli Service Level Advisor database, you must terminate them before you run this command.
Run TBSM Source ETL
Run TSLA Process ETL
Run TSLA Registration
ETL
Run ITM Source ETL
Run TMTP Source ETL
Run Database Reorganization
370 Service Level Management
The response should show no connections listed for the DYK_CAT database.
3. Connect to the IBM Tivoli Service Level Advisor database:
db2 connect to DYK_CAT
4. Reorganize the database:
db2 reorgchk update statistics
5. Restart the IBM Tivoli Service Level Advisor service from Windows Services.
Scheduling ETL runningYour business may decide to continue running the ETLs manually until the service delivery manager is familiar with the IBM Tivoli Service Level Advisor product and to enable additional timings for ETLs to be taken.
After this time, we recommend that you run ETLs automatically using a schedule. Figure 6-31 shows the recommended processing sequence for ETLs under normal operating conditions. We recommend that you run only one ETL at a time for performance reasons.
Figure 6-31 Normal ETL sequencing
6.4.10 Stage 10: Preparing IBM Tivoli Service Level Advisor IBM Tivoli Service Level Advisor is capable of supporting a complex set of customers and SLAs. However, when required, it can restrict who can see what for confidentiality. This is done by defining realms and customers.
Tip: To see the time that each ETL took to run, you can go to the Work in Progress window of the DB2 Data Warehouse Center tool.
Run TBSM Source ETL
Run TSLA Process ETL
Run TSLA Registration
ETL
Run ITM Source ETL
Run TMTP Source ETL
Restriction: This separation applies only to IBM Tivoli Service Level Advisor SLM report users. Other IBM Tivoli Service Level Advisor users have full access to data for all realms and customers.
Chapter 6. Case study scenario: Greebas Bank 371
RealmsIn this scenario, it is possible to use only a single realm because everyone works for the same company. However we set up two realms: one for the business units and one for the IT department. See Figure 6-32.
Figure 6-32 Manage Realms panel
372 Service Level Management
CustomersWe also set up the first customers as required for the SLAs and OLAs that we identified. The initial IBM Tivoli Service Level Advisor customers are:
� Banking� Trading� Personal Finance� Operations
These customers are identified in Figure 6-33.
Figure 6-33 Manage Customers panel
Chapter 6. Case study scenario: Greebas Bank 373
Creating schedulesSchedules specify the time period over which IBM Tivoli Service Level Advisor offerings (and ultimately SLAs) are evaluated. For detailed instructions about setting up schedules, see Creating SLAs with IBM Tivoli Service Level Advisor 2.1, SC32-1247.
The service level manager logs on to IBM Tivoli Service Level Advisor using the SLM administrator role. He navigates to Manage Schedules, and then selects Create to create a new schedule.
The services we are working with in this scenario all have a requirement for service hours of 24 hours per day, 7 days per week. Figure 6-34 shows the schedule after it is created.
Figure 6-34 24 x 7 schedule
374 Service Level Management
6.4.11 Stage 11: Creating offerings
Offerings define a set of parameters that are used to evaluate the behavior of a group of resources. It is generic and does not specify which set of resources are evaluated, only how they are evaluated. You can reuse the offering by applying it to different groups of resources to set up multiple SLAs. The same evaluations are performed in each case.
This scenario requires several SLAs and OLAs and explains how to set up offerings for each one. The SLA for Online Accounts uses a set of measurements that is not applicable for other purposes. We create an offering named Online Accounts offering for clarity in the example. The OLA for OS Availability for Windows Servers uses a set of measurements that may apply to many groups of servers. The corresponding offering is generic and is called OS Availability for Windows Server offering. Figure 6-35 illustrates how to create an offering. The numbers in the boxes match the steps in the following examples.
Figure 6-35 Process flow: Creating an offering
Important: You must have run the ETLs to move data from the source applications to the Tivoli Data Warehouse and from Tivoli Data Warehouse to IBM Tivoli Service Level Advisor before you continue with this stage. Otherwise, IBM Tivoli Service Level Advisor has no knowledge of the resources you need to work with.
#1 Name Offering
#5 Include Offering
Components
#4 Select Business Schedule
#3 Include SLAs (Optional)
#2 Select SLA Type
#9 Publish Offering
#8 Define Evaluation Frequency
#7 Define Breach Values
#6 Select Metrics
Chapter 6. Case study scenario: Greebas Bank 375
Creating the Online Accounts offeringThis section explains how you, as the service level manager, create the Online Accounts offering.
Step 1: Naming the offeringLog on to IBM Tivoli Service Level Advisor using the SLM administrator role and follow these steps.
1. Navigate to Manage Offerings and select Create Offering. 2. Enter the name and a description for the offering.3. Click Next. Figure 6-36 shows the first stage of the process.
Figure 6-36 Naming the Online Accounts offering
376 Service Level Management
For complete instructions to set up offerings, see “Creating Offerings” in Creating SLAs with IBM Tivoli Service Level Advisor 2.1, SC32-1247.
Step 2: Selecting the SLA type Now you see the Select SLA Type panel on which you must select the type of SLA to which this offering applies. Figure 6-37 shows the available alternatives.
1. Select the External SLA type since the SLA to implement is between the IT department and a business unit.
2. Click Next.
Figure 6-37 Select SLA Type panel
Chapter 6. Case study scenario: Greebas Bank 377
Step 3: Including SLAs The Include SLAs panel (Figure 6-38) is displayed. This panel enables you to include another SLA that has already been deployed. In this scenario, we do not want to do this so we leave the panel unchanged. Simply click Next.
Figure 6-38 Include SLAs panel
378 Service Level Management
Step 4: Selecting the business schedule The Select Business Schedule panel (Figure 6-39) is displayed. You use this panel to select an existing schedule or jump to panels to create a new one.
1. Select an existing schedule as shown. 2. Click Next.
Figure 6-39 Select Business Schedule panel
Chapter 6. Case study scenario: Greebas Bank 379
3. You now see the Include Offering Components panel (Figure 6-40). At this stage, you have not entered any components and the bottom section of the panel is empty. Click Add.
Figure 6-40 Initial Include Offering Components panel
380 Service Level Management
Step 5: Including the offering components You see the Select Resource Type panel (Figure 6-41). When you set up the SLA in a later step, you select an IBM Tivoli Business Systems Manager business system called Online Accounts as described in “Online accounts availability data” on page 366.
In this step you must provide for a business system without naming it specifically.
1. Select Business System. 2. Click Next.
Figure 6-41 Select Resource Type panel
Chapter 6. Case study scenario: Greebas Bank 381
3. The Include Metrics panel (Figure 6-42) is displayed. Click Add.
Figure 6-42 Include Metrics panel
382 Service Level Management
Step 6: Selecting metrics The Select Metrics panel (Figure 6-43) shows four metrics that are available from the IBM Tivoli Business Systems Manager business system resource in SLA:
� Number of Outages: Number of red and yellow statuses received� Availability: Duration of red and yellow statuses� Time to Repair: Measure time from red or yellow status to green status� Time to Acknowledge: Measure time from red or yellow status to ownership
status
In this scenario, complete these steps:
1. Select Availability.2. Click Next.
Figure 6-43 Select Metrics panel
Chapter 6. Case study scenario: Greebas Bank 383
Step 7: Defining breach valuesThe value that you set in the Define Breach Values panel (Figure 6-44) was determined in “SLA targets” on page 364 to be 99.5%.
1. Set the Average field to 99.5%. 2. For Violation Condition, select Actual average less than supplied average. 3. Click Next.
Figure 6-44 Define Breach Values panel
384 Service Level Management
Step 8: Defining evaluation frequency In the Evaluation Frequency panel (Figure 6-45), complete these steps:
1. Leave the Internal Use Only check box blank because this offering is intended for an external customer.
2. The customer wants a monthly evaluation period. For Evaluation Frequency, select Monthly.
3. Since you need to set some advanced metric settings, select the Configure Advance Metric Settings check box.
4. Click Next.
Figure 6-45 Evaluation Frequency panel
Chapter 6. Case study scenario: Greebas Bank 385
5. The customer has asked for daily evaluations of the SLA. In the Advanced Metrics Settings panel (Figure 6-46), complete these tasks:
a. Select the Perform Intermediate Evaluations check box.
b. For Define the frequency for intermediate evaluations, select Daily.
c. Set Range of Data to Current evaluation period only because we only want to examine data from the current reporting period.
d. Click Finish.
Figure 6-46 Advanced Metrics Settings panel
386 Service Level Management
6. You return to the Include Metrics panel (Figure 6-47), which now shows the metric that you added. In this case, you only use a single metric for the business system. If necessary, you can enter another metric on this panel. Click Next on this panel to continue.
Figure 6-47 Include Metrics panel after adding the first metric
Chapter 6. Case study scenario: Greebas Bank 387
7. In the Name Offering Component panel (Figure 6-48), complete these steps:
a. Change the Offering Component Name from the default entry of Business System to Business System Availability.
b. Leave the description field blank.
c. Click Next.
Figure 6-48 Name Offering Component panel
8. You return to the Include Offering Components panel (Figure 6-49), which shows the offering component that represents availability of the business system that we added. Add a second component to deal with the performance of the Online Accounts service. This requires data from a
388 Service Level Management
business system as explained in “Online accounts performance data” on page 367.
To set this up, repeat “Step 5: Including the offering components” on page 381 through “Step 9: Publishing the offering” on page 392 with exactly the same selections and entries in the panels. However, in Step 9, change the Offering Component Name from the default entry to Business System Performance.
Figure 6-49 Include Offering Components panel after adding the first component
Attention: You create two offering that use exactly the same resources, metrics, and breach values. However, the offerings are set up for different purposes and are exploited in different ways to suit your requirements.
Chapter 6. Case study scenario: Greebas Bank 389
9. You return to the Include Offering Components panel (Figure 6-50). Click Next.
Figure 6-50 Include Offering Components panel after completion
390 Service Level Management
You now see the Summary panel as shown in Figure 6-51.
Figure 6-51 Summary panel
Chapter 6. Case study scenario: Greebas Bank 391
Step 9: Publishing the offeringAt this point you can either save the offering as a draft or publish it. In this section, you publish it to complete this stage of the process. Then it appears in the Manage Offerings panel with a status of Published as shown in Figure 6-52.
1. Select Publish the offering.2. Click Finish.
At this point, you can use the offering in an SLA.
Figure 6-52 Manage Offerings panel with the Online Accounts Offering
392 Service Level Management
Creating the OS Availability for Windows Server offeringThe steps for creating this offering are exactly the same as for the SLA. For reasons of brevity, you, again as the service level manager, see only the information used and selected panels to assist in your understanding.
Step 1: Naming the offeringFor Name, use the name OS Avail for Windows Server offering. You must abbreviate the name because IBM Tivoli Service Level Advisor has restrictions on the name size. For Offering Description, type This is the base for an OLA with the Windows servers group.
Step 2: Selecting the SLA typeIn the Select SLA Type panel (Figure 6-53), select Internal because this is an OLA rather than an SLA. Also the results aren’t published to external customers.
Figure 6-53 Select SLA Type panel for OLA
Step 3: Including SLAsIn this panel, you do not include any SLAs, so do not change this panel.
Chapter 6. Case study scenario: Greebas Bank 393
Step 4: Selecting the business scheduleSelect the same schedule 24 per 7 schedule as for the SLA because you will evaluate over a 24 x 7 period.
Step 5: Include offering componentsFor Resource type, add the resource type Business System.
Step 6: Selecting metricsFor Metrics, add the metric Time to Repair.
Step 7: Defining breach valuesIn the Define Breach Values panel (Figure 6-54), enter the values 240 (=4 hours), for maximum, and 60 (= 1 hour), for average. Use the default violation condition Actual average greater than supplied average.
Figure 6-54 Defining breach values for OLA
394 Service Level Management
Step 8: Defining evaluation frequencyFor Evaluation Frequency, select Monthly and select the Configure Advanced Metrics check box.
In the Advanced Metrics panel, complete these tasks:
1. Under Intermediate Evaluations, select the option Perform intermediate evaluations and accept the default frequency of Daily.
2. Under Trend Analysis, accept the default frequency of Daily and select Current Evaluation Period Only.
3. For Name Offering Component, change the name to Windows servers.
Step 9: Publishing the offeringSelect Publish the offering and click Finish.
6.4.12 Stage 12: Creating SLAs and OLAsNow we set up the SLAs in IBM Tivoli Service Level Advisor. You can find detailed instructions in “Creating and Managing SLAs,” Creating SLAs with IBM Tivoli Service Level Advisor 2.1, SC32-1247. The service level manager typically performs all the steps in this section.
To create an SLA, the service level manager links together a set of evaluation rules defined in a service offering and the set of resources that he will evaluate under the agreement. Figure 6-55 shows the process flow for setting up an SLA.
Figure 6-55 Process flow: Setting up an SLA
Note: You do not need to select the Internal Use Only check box, because in this example, the entire SLA is for internal use. This option is used to prevent customers from seeing components of SLAs that are for internal use only in SLA reports.
#1 Name SLA
#5 Add Resources
#4 Select Offering
#3 Select Service
#2 Select Customer
#6 Select Start Date
Chapter 6. Case study scenario: Greebas Bank 395
Creating the SLA for Online AccountsTo begin, follow these steps:
1. Log on to IBM Tivoli Service Level Advisor using the SLM administrator role.2. Navigate to Administer SLAs. 3. Select Create SLA to create a new SLA.
Complete the steps in the following section to create the SLA for Online Accounts.
Step 1: Naming the SLAIn the Name SLA panel (Figure 6-56), enter the SLA name as Online Accounts SLA and click Next.
Figure 6-56 Name SLA panel
396 Service Level Management
Step 2: Selecting the customerThere is provision to jump to the panels to create customers from here, but in this scenario, we use a customer that already created. In the Select Customer panel (Figure 6-57), select the Banking customer and click Next.
Figure 6-57 The Select Customer panel
Chapter 6. Case study scenario: Greebas Bank 397
Step 3: Selecting the serviceIn the Select Service panel (Figure 6-58), we use filtering to assist in selecting the service. Select the Real Time Online Account Transactions service and click Next.
Figure 6-58 Select Service panel
Note: The purpose of selecting a service is to tell IBM Tivoli Service Level Advisor the destination for events it sends to IBM Tivoli Business Systems Manager via TEC in the case of SLA breaches and trends. The destination is an object in IBM Tivoli Business Systems Manager that has been defined as a service for an executive dashboard view using the IBM Tivoli Business Systems Manager Console.
398 Service Level Management
Step 4: Selecting the offeringIn the Select Offering panel (Figure 6-59), select Online Accounts Offering and click Next.
Figure 6-59 Select Offering panel
Chapter 6. Case study scenario: Greebas Bank 399
Step 5: Adding resourcesIn this example, you add two resources:
� Online Accounts business system� Real-time Online Account Transactions business system
We explain the details for adding the first resource and then summarize the steps for adding the second resource.
In the Add Resources to Business System panel (Figure 6-60), click Add.
Figure 6-60 Add Resources to Business System panel
400 Service Level Management
Adding the Online Accounts business systemPerform the following steps:
1. In the Select Resource List Type panel (Figure 6-61), select the Static Resource List option because the resources are not going to change over time. Click Next.
Figure 6-61 Select Resource List Type panel
Chapter 6. Case study scenario: Greebas Bank 401
2. In the Filter Resources panel (Figure 6-61), set a filter to restrict the number of business system resources shown. If you do not set a filter, you would see an error message indicating that there are too many resources to display.
To create the filter, click Create Filter.
Figure 6-62 Filter Resources initial panel
402 Service Level Management
3. In the next Filter Resources panel (Figure 6-63), in the Value field, type Online Accounts. Click Next.
Figure 6-63 Filter Resources panel with a filter defined
Chapter 6. Case study scenario: Greebas Bank 403
4. In the Select Resources panel (Figure 6-64), select /Banking/Online Accounts and click Next.
Figure 6-64 Select Resources panel
5. You return to the Add Resources to Business System Availability panel. Click Next.
You now see the Add Resources to Business System Performance panel (Figure 6-65).
Tip: You can help find the resource by looking in the IBM Tivoli Business Systems Manager console. The business system we are looking for is called Online Accounts and is located in the Banking business system in IBM Tivoli Business Systems Manager. In IBM Tivoli Service Level Advisor, you see it in the Select Resources panel as /Banking/Online Accounts.
404 Service Level Management
Adding the Real-time Online Account Transactions business systemYou now repeat the actions in “Step 5: Include offering components” on page 394, for the second resource. This time you select the Real Time Online Account Transactions business system. You also use the words Real Time Online Account for the filter and select /Banking/Real Time User Experience - Banking/Real Time Online Account Transactions.
Then you see the Add Resources to Business System Performance panel (Figure 6-65). Click Next.
Figure 6-65 Add Resources to Business System Performance panel
Chapter 6. Case study scenario: Greebas Bank 405
Step 6: Selecting a start dateIn the Select SLA Start Date panel (Figure 6-66), you can select a current date, a future date, or a past date. By selecting a past date, you can do an evaluation of past data if it is available in Tivoli Data Warehouse.
1. Enter a date. Then, you can see when the next evaluation will occur, depending on the period and Start Date.
2. Enter a start date.
3. Click Recalculate First Evaluation Dates.
4. Click Next.
Figure 6-66 Select SLA Start Date panel
406 Service Level Management
5. In the Summary panel (Figure 6-67), click Finish. The SLA is now complete.
Figure 6-67 SLA Summary panel
Creating the OLA for OS Availability of Windows ServersCreating the OLA for this business system is similar to creating an SLA. The wizard and the dialogs are the same, but this time you use the Dynamic Resource List. This list is used to select resources to be managed by the OLA using filter criteria. Any resources in the IBM Tivoli Service Level Advisor database that conforms to the filter criteria is evaluated as part of the OLA. This means that data relating to resources added after the creation of the OLA is included in the calculations if they match the filter criteria.
Chapter 6. Case study scenario: Greebas Bank 407
The Dynamic Resource List enables filtering based on the names or attributes of resources. This makes it suitable for OLA resources where naming standards are used for common resources such as servers. Create the OLA in the same way as an SLA until you reach the Select Resource List Type panel.
1. In the Select Resource List Type panel, select Dynamic Resource List and click Next.
2. In the Filter Resources panel, complete these steps:
a. Click Create Filter.b. A row appears in the Resource Filter table. In the Value field, add Critical
Server, which selects and isolates all resources in the business system.c. Select Preview current evaluation of filters.d. Click Next.
3. You see the View Dynamic Resource List panel (Figure 6-68) next because you selected the Preview current evaluation of filters option in the previous panel. You use this window to verify that the filter or filters selected the correct resources. Click Next.
Figure 6-68 View Dynamic Resource List panel
408 Service Level Management
4. In the Name Dynamic Resource List panel, name the Dynamic Resource List.
a. In Dynamic Resource List Name field, type Critical Server List.
b. In Dynamic Resource List Description field, type List of all the critical servers under OS availability of Windows servers.
c. Click Next.
5. Complete the build of the OLA exactly the same as for an SLA.
The example OLA is now defined and active.
6.4.13 Stage 13: SLA reportingWhen an SLA is active, IBM Tivoli Service Level Advisor Reporting Console can help to verify and display the SLA reports. The URL for the IBM Tivoli Service Level Advisor Reporting Console is:
http://TSLA_server/SLMreport/login.jsp
IBM Tivoli Service Level Advisor Reporting Console offers two types of reporting:
� Intermediate evaluation reports� End of SLA evaluation period reports
Intermediate evaluation reportsIntermediate evaluations are assessments of the SLA made using data from the beginning of the current evaluation period to the time the report is run. They are not normally provided to customers. They are used primarily by IT departments to identify issues and take proactive actions to avoid breaching SLAs.
Figure 6-69 shows an intermediate evaluation of the Online Banking SLA taken after the first day of the evaluation period.
For the /Banking/Online Accounts resource, the breach value is 98.5% measured over a month. By using simple arithmetic, you can calculate that this equates to a permitted average unavailability of approximately:
(24 x 60 x 1.5)/100 = 21.6 minutes per day (365 x 24 x 60 x 1.5)/(12 x 100) = 657 minutes per month
The average availability for the first day was 97.01%. This equates to an outage of 43 minutes. Although this exceeds the daily permitted average outage, it is not close to the monthly permitted outage and there could be up to 614 minutes of additional outages before the SLA is violated.
Chapter 6. Case study scenario: Greebas Bank 409
Figure 6-69 Intermediate evaluation report
Being aware of the position as the reporting period progresses, the IT department has an opportunity to focus effort on the relevant part of the infrastructure to seek improvement for the remainder of the month.
However, if the intermediate evaluation was not run until day 15 in the month and the result was availability of 97.01% as before, this would represent a total outage of:
(2.99 x 60 x 24 x 15)/100 = 646 minutes
This would leave a downtime margin of 11 minutes for the remainder of the month. In this case, there would be little room in which to manoeuvre. This illustrates that intermediate SLA evaluation can give the IT department early warnings. However, it should be done regularly and must be followed up with urgent remedial action. Otherwise the exercise is pointless.
IBM Tivoli Service Level Advisor can calculate trends toward violations automatically. By linking SLAs to services defined to the IBM Tivoli Business Systems Manager executive dashboard, trending events are shown on the
410 Service Level Management
dashboard icon. This is explained in Chapter 4, “Planning to implement service level management using Tivoli products” on page 109.
End of SLA reporting period reportsFor the sample SLA, we logged onto the IBM Tivoli Service Level Advisor reporting console and selected a date that corresponds to the end of the reporting period. Figure 6-70 shows the selected SLA and results of the service level objective (SLO). In this case, you see a report about a monthly SLA, where the start date is set in the past to include historical data collected in the Tivoli Data Warehouse before the SLA was created.
Looking closely at Figure 6-70, you see the level of service that has been delivered during the reporting period. The delivery of 99% availability and 98.84 user experience is below what the business wanted.
This benchmarking information proves extremely useful in negotiations between the business and IT department to agree on SLA targets. ITIL notes that a number of SLM projects have failed due to setting unrealizable SLA targets. We recommend that you set achievable targets initially with a commitment to work on improving them over time.
This is the purpose of a service improvement program. It may be necessary to make changes to working practices and to invest in the hardware and software infrastructure to reach desired service levels. The SLM solution we have described here provides a means of measuring progress.
Important: Make sure that the monitoring application, in this case IBM Tivoli Business Systems Manager, is running during the period of the calculation of the SLA and that the application WEP and the IBM Tivoli Service Level Advisor WEPs are scheduled and complete successfully. If you do not do this, the data will be incomplete and the calculations will be inaccurate.
Chapter 6. Case study scenario: Greebas Bank 411
Figure 6-70 Report results for Online Banking
Important: According to ITIL, there are cases where implementing SLM processes has failed because unrealistic SLA targets were set. Before you put formal agreements in place between customers and suppliers, we recommend that you set up interim SLAs and use them to measure what is currently being achieved with the infrastructure. Tune the SLAs to make sure that targets can be met. If the targets are lower than what is considered desirable by the business, address this using a service improvement project with goals to improve performance over time. SLA targets can then be progressively increased and used to demonstrate how services have been improved as a result of changes made. You can also set shorter evaluation periods, and set retrospective SLA start dates initially to get faster feedback of results.
See “Adjusting SLAs after reviews” on page 441 for details about adjusting SLAs to suit targets
412 Service Level Management
Sample SLATable 6-11 shows a sample of the kind of information you can expect to find in the written SLA contract based on previous SLA.
Table 6-11 Sample SLA
Name of the service Online Banking service
Approvals Names, positions, and signatures, for example, Banking director
Description The Online Banking Service is the Greebas Bank application that enables clients to manage checking and savings accounts through a browser interface.
Hours The service should be available 24 hours per day, 7 days per week and 365 days per year.
Measurement Period The measurement period is one calendar month starting on the first of each month.
Availability Availability of the service is determined from agreed measurements obtained from IBM Tivoli Business Systems Manager. The service should be available 99.5% of the time during the measurement period, excluding any planned and agreed maintenance windows.
Performance Performance of the service is determined from agreed measurements obtained from IBM Tivoli Business Systems Manager and derived from synthetic transactions driven by IBM Tivoli Monitoring for Transaction Performance. A value of 99.5% of measured browser transactions should take less than 10 seconds.
Reporting Reports should be available for review within one day of the end of the reporting period. The reports must contain the following minimum information:
� An overview report showing the status of all the SLAs of the business unit for the last reporting period
� Lists of SLA violations with details
� Weekly reports on service levels for three months from the date this agreement was accepted
Reviews SLA review meetings are held each month and to discuss performance levels and violations. SLA planning meetings are held every three months to discuss long-term trends, new services, and proposals to modify SLA targets.
Other details This includes additional information such as customer support, change management, scheduled maintenance, and escalation.
Chapter 6. Case study scenario: Greebas Bank 413
6.5 How the SLM solution works in practiceThis section reviews the extent to which the SLM solution meets the desired outcomes recorded in Table 6-2 on page 325. It begins with two examples of how the SLM solution works in specific situations. Then it summarizes the extent to which the desired outcomes have been achieved.
6.5.1 Example 1: Component failure without loss of serviceThis example shows how the SLM solution behaves when an infrastructure component fails but does not degrade or kill a service because there are sufficient redundant components in place to prevent this. A UNIX server that is a component of the ATM UNIX servers business system has failed. Because it is one of four redundant components, the ATM System service continues to operate with no impact on the service from a customer perspective.
Due to the way we designed the IBM Tivoli Business Systems Manager business system hierarchy, we expect to find that views showing the status of the ATM System service on executive dashboards to be normal. However, views available to the IT department technical staff show that there is a fault. The following sections show windows that the users in various roles see in this situation and explain why they see this information.
414 Service Level Management
What the operator seesFigure 6-71 shows the Java console view of the operator. The topology window in the operator’s view shows that the ATM System business system appears as normal because the service is still fully operational. The event related to the server fault appears in the Event Viewer window in the bottom half of the window. When a member of the relevant technical team takes ownership, this is apparent to the operator. No action is required by the operator at this stage. Although if nobody takes ownership within a short period of time, this can be followed up.
Figure 6-71 Example 1: Operator’s view
Chapter 6. Case study scenario: Greebas Bank 415
The operator can view where the impacted object fits into the business system structure by selecting the event in the Event Viewer, right-clicking, and selecting Business Impact.
In this case, as shown in Figure 6-72, the Business Impact view shows the operator that the failing component is part of the ATM System business system that is a child of the Banking business system. Although the failed component does not impact the business system, the operator can proactively resolves the problem before the business process is compromised. The operator also sees a lot of red business systems. These are the technology business systems for the operating system support teams. They have no propagation-limiting rules and therefore propagate events to the top of the tree.
See the following section for details about what the operating system support team sees.
Figure 6-72 Business impact showing the business system containing an affected component
416 Service Level Management
What the operating system support team seeFigure 6-73 shows the Java Console view of the operating system support team. The team is responsible for all z/OS, Windows, and UNIX hosts and therefore, must see events from them. The IBM Tivoli Business Systems Manager view is divided into four windows: one Event Viewer for each platform and one topology view showing the overall status of the three Operating System business systems.
The UNIX alert causes the OS Availability for UNIX Servers business system to light up because there are no propagation controls on this business system. The UNIX event also appears in the Event Viewer for OS Availability for UNIX Servers where it can be seen by the operating system support team. The Event Viewer also shows that the user, S2Oper1, owns the event, so the operating system support team can see that the problem is being managed.
Figure 6-73 Example 1: Operating system support team view
Event owned by user S2Oper1
Chapter 6. Case study scenario: Greebas Bank 417
What the operating system support team leader seesIn addition to the view available to his team members, the operating system support team leader has access to an executive dashboard view (Figure 6-74) with an icon to represent UNIX servers. The team leader can keep this minimized on the workstation, and set preferences so the minimized window flashes when something turns red. To see details about what has happened, he simply restores the window and clicks the Details hotspot.
Figure 6-74 Operating system support team leader executive dashboard view
418 Service Level Management
What the operations and technical support managers seeThe operations and technical support managers see a dashboard view (Figure 6-75). This view indicates that the services are OK, although the icon for the production technology systems is in the color red. The managers can drill down to see more details.
Figure 6-75 Example 1: Operations and technical support manager view
Chapter 6. Case study scenario: Greebas Bank 419
What the service delivery manager seesThe service delivery manager’s dashboard (Figure 6-76) has icons that all appear in the color green because it does not include an icon for the production technologies systems.
Figure 6-76 Example 1: Service delivery manager view
420 Service Level Management
What the banking director seesThe banking director’s dashboard view (Figure 6-77) reflects the status of the Banking business system. This business system is designed to remain green unless there is a major problem with the infrastructure or an impact on user experience. The hardware failure relating to the ATM system has not led to the service being down or degraded, so this system is behaving exactly as expected.
Figure 6-77 Example 1: Banking director’s view
6.5.2 Example 2: Component failure terminates a serviceThis example shows how the SLM solution behaves when a series of STI transactions driving the Online Accounts system fail. At around the same time, an IBM Tivoli Monitoring resource model detects the failure of a critical service on a WebSphere server. The following sections show the windows that the users in various roles see in this situation and explain why this is so.
What the operator seesObserving the IBM Tivoli Business Systems Manager console, the operator sees the view shown in Figure 6-78. The WebSphere failure, which is in red, is the fourth event in the Event View. Because of the PBT rules for the Online Accounts business system (“Setting PBT rules to allow propagation to top-level business system” on page 348), a PBT High Red alert is sent from Online Accounts to Banking. This alert is generic. In this case, its purpose is to light up the Banking business system so that operations is aware that a notification has gone to the Banking director, so resolution should be timely.
Chapter 6. Case study scenario: Greebas Bank 421
The STI alerts are from two STI objects in the Real-time Account Application business system. This business system is set to propagate only when two or more red events are received from IBM Tivoli Monitoring for Transaction Performance. In this case, the red event is propagated to the top of the tree although a red event is already generated by PBT for the WebSphere event.
Figure 6-78 Operator view for critical events affecting the Banking business system
What the operating system support team seesThis team has access to both IBM Tivoli Business Systems Manager and IBM Tivoli Service Level Advisor.
Information from the IBM Tivoli Business Systems Manager viewThe operating system support team receives an event for the WebSphere but not for the IBM Tivoli Monitoring for Transaction Performance STI failures. This means that this team does not immediately see the impact of this event. It can
422 Service Level Management
assess business impact using the IBM Tivoli Business Systems Manager Business Impact facility. However, it would be worth considering adding the critical business systems to the OS Support team view.
Information from the IBM Tivoli Service Level Advisor viewIn this example, the OLAs for the operating system support teams are not compromised. Further information is available to them using IBM Tivoli Service Level Advisor views and reports. The operating system support team should have access to the following information:
� Unrestricted view: Access to all OLAs and SLAs and all details including Internal Use Only metrics
� Operations user type: Access to detailed reports
For the operating system support teams, we create one IBM Tivoli Service Level Advisor user ID, IT, of userType 1 using the following command:
scmd report addUser -name IT -view 1 -userType 1
When the IT users logs in, he or she sees the dashboard shown in Figure 6-79.
Figure 6-79 IT user dashboard
Tip: Refining views to suit user roles is a process of continuous improvement. It does not stop once views are used in production environments.
Chapter 6. Case study scenario: Greebas Bank 423
The IT user is an internal user and can view more information than an external user such as a banking executive. The IT user sees all the internal metrics, where the banking executive sees only a summary. For example, in Figure 6-80, the IT user uses an Intermediate Evaluation for Response Time, which is an internal metric. Internal metrics added for IT department users can help in diagnosis without affecting the SLA.
Figure 6-80 OS Support Team intermediate evaluation
What the operations and technical support managers seeThe operations and technical support managers also have access to both IBM Tivoli Business Systems Manager and IBM Tivoli Service Level Advisor.
424 Service Level Management
Information from the IBM Tivoli Business Systems Manager viewFigure 6-81 shows the executive dashboard for the operations and technical support managers. The Banking and Banking business systems icons are red. This is in line with the events received and the event behavior that we customized into the business systems.
Notice also that the SLA icon for the Banking business system is red to indicate a violation.
Figure 6-81 Operations and technical support managers’ executive dashboard view
Information form the IBM Tivoli Service Level Advisor view“Information from the IBM Tivoli Service Level Advisor view” on page 426 describes the reports that are available to these users to further investigate this SLA violation.
What the service delivery manager seesThe service delivery manager is a user of both IBM Tivoli Business Systems Manager and IBM Tivoli Service Level Advisor.
Chapter 6. Case study scenario: Greebas Bank 425
Information from the IBM Tivoli Business Systems Manager viewFigure 6-82 shows the executive dashboard for the service delivery manager. The initial view is the same for the operations and technical support managers. Again this is in line with the events received and the event behavior that we customized into the business systems.
Realistically, the service delivery manager may well have been investigating the situation before the SLA was violated since Intermediate Evaluation or Trending would have provided early notification of an impending violation.
Figure 6-82 Executive dashboard for service delivery manager
Information from the IBM Tivoli Service Level Advisor viewThis section applies to the service delivery, operations, and technical support managers, which refer to in general as “the manager”.
The manager has access to the following information:
� Unrestricted view of all SLAs and all details including Internal Use Only metrics
� Executive user type access to high level reports
To enable the manager to access IBM Tivoli Service Level Advisor, we create a user, SDManager, using the command:
When the manager logs in to the Report interface, he or she sees the page shown in Figure 6-83. On this page, the manager has a view of all the services that are provided as organized by realms.
Figure 6-83 Service delivery manager IBM Tivoli Service Level Advisor view
Chapter 6. Case study scenario: Greebas Bank 427
The manager can see that last month there were four violations in the Banking business unit. Clicking in the relevant cell shows the resources with the most violations. In this case, the /Banking/Interbank Transfers components has the most violations as shown in Figure 6-84.
Figure 6-84 Resources with most violations
What the banking director seesThe banking director (and his nominated representative) has customized access to both IBM Tivoli Business Systems Manager and IBM Tivoli Service Level Advisor.
Information from the IBM Tivoli Business Systems Manager viewPresenting meaningful information to the banking director has been a main design consideration in customizing the IBM Tivoli Business Systems Manager business systems. The banking director is informed when there are problems in the system that affect the banking business. The executive dashboard shows problems, but also that they are being owned and dealt with, without going into all the technical details.
428 Service Level Management
Figure 6-85 shows the banking director’s view in IBM Tivoli Business Systems Manager.
Figure 6-85 Banking executive dashboard view
The Banking icon is red as is the IBM Tivoli Service Level Advisor indicator. When the director drills down, the icon shows generic details of what has occurred as shown in Figure 6-86.
Figure 6-86 Banking executive dashboard drill down
Chapter 6. Case study scenario: Greebas Bank 429
Information from the IBM Tivoli Service Level Advisor ViewsThe banking director is an external IBM Tivoli Service Level Advisor user and does not have access to as many detail as the other IBM Tivoli Service Level Advisor users. Enough information is available to present a picture of how the IT department is meeting the SLOs.
The banking director should have access to the following information:
� External view: Access only to SLAs of their own business unit and no access to internal metrics (marked as Internal Use Only when creating an offering)
� Customer user type: Access to moderately detailed reports
We create a user, BankingExecutive, using the following command:
When the BankingExecutive user logs in, this person sees the dashboard in Figure 6-87. This dashboard shows the banking director all the SLAs. Notice that only banking SLAs are available in this view. By clicking in the cell as indicated in the figure, the user can view some of the details of the last month’s violation. Notice that the cell is exactly under the column of the last day of the month.
Figure 6-87 Banking executive view in IBM Tivoli Service Level Advisor
Click for SLA details
Chapter 6. Case study scenario: Greebas Bank 431
Figure 6-88 shows the resulting window. Notice that in the section Violations, the violation occurred in the /Banking/Online Accounts component. In the SLO Results section, you can see that the other component is fine. Notice that you can only see two metrics. The SLA contains more metrics, but the others are internal and are not visible to this user.
Figure 6-88 Violations report
432 Service Level Management
The banking director may also want to know how well the IT department is meeting the SLAs in the reporting period that is underway. The director checks this by clicking in the appropriate cell related to the current period on the initial panel. See Figure 6-89.
This shows that Real-time User experience is a little under the target. If this is a matter of concern, the director can discuss this immediately with the IT department.
Figure 6-89 Director intermediate evaluations
Chapter 6. Case study scenario: Greebas Bank 433
When the director clicks in one of the values of the table shown in Figure 6-89, he or she sees a graphical view of the values for a specific date. The director can also see measurements based on longer intervals by setting the Start Date in the Filter Criteria section and clicking Update. Figure 6-90 provides an example of the type of display.
Figure 6-90 intermediate SLA chart
6.5.3 Root cause analysisWhen there is a service outage, or one is impending, it is important to determine the root cause to take action to prevent re-occurrence. In the situation outlined in 6.5.2, “Example 2: Component failure terminates a service” on page 421, the correlation between service outage and component failure is easy to make. We enhanced the alerting by using RLP and PBT rules to ensure that users are notified of failures to critical components and problems with user experience.
434 Service Level Management
The root cause is not always so obvious. This section explains how the IBM Tivoli Business Systems Manager console, IBM Tivoli Business Systems Manager historical reporting, and IBM Tivoli Service Level Advisor can assist in finding it.
Using the IBM Tivoli Business Systems Manager Console for root cause analysisYou can configure IBM Tivoli Business Systems Manager so that it monitors both the infrastructure and user experience. In a properly instrumented enterprise, an indication of bad user experience should match indications of failure of infrastructure components. By using well-designed business systems, the link between the user experience and infrastructure failure should be apparent from examination of the IBM Tivoli Business Systems Manager console and by navigating through the business system hierarchy using the various views that are available.
Using TBSM Historical Reporting for root cause analysisWhen there is no obvious correlation, you can use the TBSM Historical Reporting system to identify the times and dates of previous user experience outages. From this information, you can run further reports to determine the components that were affected at the same time as the service outages.
Chapter 6. Case study scenario: Greebas Bank 435
TBSM Historical Reporting has a selection of reports available for use. We recommend that you use this approach.
1. Run the Business System Availability report against the business system in which you are interested. Report around the approximate time of the outage. For example, Figure 6-91 shows a report run against the PBT Demo business system between the 14 and 16 October 2004 and the report selection options.
Figure 6-91 Business System Availability Report selection
436 Service Level Management
2. Analyze the results and extract the start and end times for red and yellow status. Figure 6-92 shows an example of the output of the report request. The business system indicates that it entered red status at 4:40:57 p.m. on 21 October and returned to green status at 4:47:57 p.m. on the same day. The business system was red for seven minutes. What caused this?
Figure 6-92 Results from Business System Availability Report
Chapter 6. Case study scenario: Greebas Bank 437
3. Run the Business System Events report to establish which events were received to cause red status. Figure 6-93 shows the report selection options for the Business System Events report. We selected to search between the times of the outage and added a couple of minutes at either end of the time parameters.
Figure 6-93 Business System Events Report selection
438 Service Level Management
4. Analyze the report to identify the components likely to cause an outage. The report for this business system, as shown in Figure 6-94, indicates that the red status was caused by four objects receiving red events at 4:40:47 on 21 October.
The objects and the business system were set to green status at 4:47:47 when the events were owned by user ID S2Admin1. The option to clear the alerts from the objects was taken, so the red status was removed from the objects.
Figure 6-94 Results of the Business Systems Events Report
Chapter 6. Case study scenario: Greebas Bank 439
Using IBM Tivoli Service Level Advisor and Tivoli Data Warehouse Reporting for root cause analysisFurther information to aid correlation can be extracted from IBM Tivoli Service Level Advisor. For instance, the Components with the Most Violations Report can show which component of the business system has the most failures. For non-specific components, such as business systems, this is of limited value.
However, for an SLA or OLA built using granular components, such as every component in the business system specified as individual resources of the Service, the Components with the Most Violations Report shows the actual component that is the root cause of the outage.
6.5.4 Assessing the SLM solutionTable 6-12 compares the desired outcomes with what the SLM solution has achieved.
Table 6-12 Assessment of the SLM solution
Desired outcome Extent of achievement
1 Clear status information about business services
IBM Tivoli Business Systems Manager consoles and executive dashboards show all stakeholders the status of key business services.
2 The impact of infrastructure component failure on business services to be clearly visible and as close to real time as possible
IBM Tivoli Business Systems Manager consoles now show the business impact of infrastructure failures shortly after receiving alerts from monitors.
3 Technical teams prioritize efforts to fix faults according to business impact
Technical teams can easily see the business impact of faults. Process changes within the organizations will ensure that faults with the greatest business impact are fixed first.
4 SLAs based on the availability, performance, or both of business services agreed between IT and business unit directors and implemented
SLAs negotiated with the business should now be understandable.
5 Early warnings of potential SLA breaches SLA breaches and trends toward breaches are displayed on executive dashboards.
6 SLA reports available within one day of the end of the reporting period, and intermediate SLA evaluation reports produced on demand throughout the reporting period
SLA reports are can be produced as soon as the reporting period ends. Interim reports can be produced on demand using intermediate evaluation.
440 Service Level Management
The solution has met most of the desired outcomes. But as in the real world, there is still much work to be done. Chapter 3, “IBM Tivoli products that assist in service level management” on page 53, discusses the need for continuous improvement. The next section describes some specific actions that you can take to make further improvements to the scenario described in this chapter.
6.6 Continuous improvementImplementing SLM enables an organization to see and communicate exactly how it is delivering services. It is unlikely that everyone will be completely satisfied with the results.
We set a baseline that everyone understands. In this scenario, Greebas Bank can move on to raise the standards and demonstrate improvements using the SLM processes that we set in place. Many of the improvements are likely to involve modifying the infrastructure in some way. The bank can consider any cost implications in light of how well SLAs are being met. It can evaluate the investment by showing the improvements in SLA achievement after the modifications are made.
Chapter 2, “General approach for implementing service level management” on page 23, provides information about continuous improvement. A task that must be completed regularly as changes are made is to update SLAs to reflect new targets. The following section presents an example.
Adjusting SLAs after reviewsAfter a review period, we found that the 99.5% target for both metrics of the Banking SLA was higher than average achievement and there were regular violations. While this is not good news for Greebas Bank, we can use this to illustrate how to adjust existing SLAs to suit changed circumstances.
7 Demonstrated improvement in business services as measured by the SLA reports and a reduction in the instances of lost clients
The SLM solution provides the means of measuring the quality of delivery of business services, but cannot in itself deliver service improvement. This must come via analysis, process changes, and corrective actions.
8 OLAs agreed and implemented between technical team leaders and the IT director
Initial OLAs are in place. These must be extended and refined over time.
9 New IT systems and processes in line with ITIL recommendations
The approach taken is based on ITIL recommendations.
Desired outcome Extent of achievement
Chapter 6. Case study scenario: Greebas Bank 441
Let’s say that the banking director agreed to a slightly lower level of service as an interim measure as follows:
We can apply these changes to the current SLA without creating a new SLA. This is done by creating a new offering to reflect the changed measurement requirements.
To ensure that measurements are consistent, we recommend that you make SLA changes from the first day of the next measurement period. This enables you to compare the effect of the change with the previous measurement period. The best time to make the change is after the final evaluation is finished. When DYK_M10_Populate_Measurement_Datamart_Process finishes in the data warehouse, the evaluation is complete. Now we can make SLA changes.
To change an SLA, we use these steps:
1. Create a new offering that includes the new breach values, ideally based on the old offering.
2. Replace the old offering in the SLA with the new one.
We can create a new offering, based on the Online Banking offering, using these steps.
1. In the IBM Tivoli Service Level Advisor Administrator Console, select Administer Offerings →Manage Offerings.
2. In the Manage Offerings window, select Online Accounts Offering and click Create Like. This creates a copy of the Online Banking offering.
3. In the Name Offering window, complete these tasks:
a. In the Offering Name field, add Online Accounts Offering date.b. In the Offering Description field, add This offering was reviewed in date.c. Click Next.
4. Continue through the offering definition as before until you reach the Define Breach Values window.
5. In Define Breach Values window, in the Average field, replace the value with 98.5. Click Next.
6. Continue through offering definition as before until you reach the Include Offering Components window.
7. In Include Offering Components window, repeat the same process again for Business System Performance. Enter a breach value of 98. Click Next.
8. Finish and then publish the offering.
442 Service Level Management
To replace this offering in the SLA, follow these steps:
1. Click Administer SLAs →Replace Offering.
2. In the Old Offering window, select Online Accounts Offering and click Next.
3. In the New Offering window, select Online Accounts Offering date and click Next.
4. In the Move Resources window, follow these steps:
a. In the first To field, select Business System Availability.b. In the second To field, select Business System Performance.c. Click Next.
5. In the Select SLAs window, select Online Accounts SLA and click Next.
6. In the Summary window, click Finish.
7. In the Track Updated SLAs window, monitor the modified SLAs in this window. Click Close.
The SLA is now updated with the new offering. From now on, the bank can use the new offering to calculate compliance with the SLA. It can use the Track Updated SLAs window to monitor and verify the SLAs that have been modified.
Chapter 6. Case study scenario: Greebas Bank 443
444 Service Level Management
Part 3 Appendixes
This part includes the following appendixes:
� Appendix A, “Service management and the ITIL” on page 447� Appendix B, “Important concepts and terminology” on page 515� Appendix C, “Scripts and rules used in this book” on page 527
There are various components and definitions behind service management in Information Technology Infrastructure Library (ITIL) terms. Anyone who is involved in the service level management (SLM) process will find this appendix to be a helpful reference.
The ITILThe ITIL is a series of documents that are used to aid the implementation of a framework for IT service management. This customizable framework defines how service management is applied within an organization.
The ITIL was originally created by the Central Computing and Telecommunications Agency (CCTA), a United Kingdom (UK) Government agency (now known as the Office of Government Commerce (OGC)). It is now is becoming more popular and has been adopted and used across the world as the standard for best practice in the provision of IT service. Although the ITIL covers many areas, its main focus is on IT service management.
The ITIL’s IT service management is organized into a series of sets, which are divided into two main areas: service support and service delivery. Each area contains several disciplines, which stipulate the ITIL practices or requirements.
� Service support is the practice of those disciplines that enable IT services to be provided effectively.
� Service delivery covers the management of the IT services themselves. It involves many management practices to ensure that IT services are provided as agreed upon between the service provider and the customer.
Refer to the following Web sites for details about what ITIL is and what it can provide:
� IT systems management forum Web site
http://www.itsmf.com
� Official ITIL Web site
http://www.itil.co.uk
� Official OGC Web site
http://www.ogc.gov.uk
Service managementToday, the service management revolution is well on its way. Almost every IT organization is moving toward business-oriented service delivery. IT is being called upon to participate as a partner in the corporate mission, which requires their functioning as a proactive group that is responsive to their customers.
Adopting this mind set is difficult for internal service providers, who face an increasingly less captive audience. The corporate IT organization is now challenged to operate as a stand-alone business, without corrective forces that profit orientation and that the threat of losing customers presents for companies operating in a free market. In the absence of these forces, IT organizations are embracing a new competitive mindset: service level management.
Through the process of establishing an SLM orientation, IT organizations can engage customers, as though they were driven by market forces. SLM is a means for the lines of business (LOB) and IT organization to explicitly set their mutual expectations for the content and extent of IT services. It also allows them to determine in advance what steps to take if these conditions are not met. The concept and application of SLM allows IT organizations to provide a business-oriented, enterprise-wide service by varying the type, cost, and level of service for the individual LOB.
For the IT organization to make and use the service level agreements (SLAs) with the LOBs as a tool for decision making, the IT organization must organize itself accordingly and establish internal procedures that support SLA management. SLM is not an isolated activity. It interacts with, and draws upon, all the other disciplines that are part of the IT infrastructure management.
There is no point in agreeing to deliver a service if the basic tools and processes needed to deploy, manage, monitor, correct, and report the service level achieved are not established. All of these activities are grouped into two major disciplines (Figure A-1): service delivery and service support.
Figure A-1 The service management disciplines
Release Management
IT Service Continuity
Management
Service Desk
Change Management
Incident Management
Financial Management
for IT Services
Availability Management
Capacity Planning
Service Level Management
Configuration Management
Service Support
Service Delivery
Problem Management
Appendix A. Service management and the ITIL 449
Service deliveryThe primary objective of the service delivery discipline is proactive. It consists of planning and ensuring that the service is delivered according to plan and, in turn, to the SLA. The tasks that you must accomplish to make this happen are:
� Service level management
This involves managing customer expectations and negotiating service delivery agreements. It involves determining the customers’ requirements and how you can meet them the best way possible within the agreed-upon budget.
Working together allows IT disciplines and departments to plan and ensure the delivery of services. This involves setting measurable performing targets, monitoring performance, and taking action where targets are not met.
Refer to Chapter 1, “Introduction to service level management” on page 3, and Chapter 2, “General approach for implementing service level management” on page 23, for a description of the approach to SLM used in this redbook.
� Financial management for IT services
You must register and maintain cost accounts related to the usage of IT services. You must also deliver cost statistics and reports to SLM to assist in obtaining the right balance between service cost and delivery. And you must assist in pricing the services in the service catalog and SLAs.
� Capacity management
This involves planning and ensuring that adequate capacity with the expected performance characteristics is available to support the service delivery. It also entails delivering capacity usage, performance, and workload management statistics, and trend analysis to SLM.
� IT services continuity management
This requires you to plan and ensure the continuing delivery, or minimum outage, of the service by reducing the impact of disasters, emergencies, and major incidents. You do this work in close collaboration with the company’s business continuity management, which is responsible for protection of all aspects of the company’s business, including IT.
� Availability management
This entails planning and ensuring the overall availability of the services. It also requires you to provide management information in the form of availability statistics, including security violations, to SLM. This discipline may include negotiating underpinning contracts with external suppliers, and defining maintenance windows and recovery times.
450 Service Level Management
Service supportThe disciplines in the service support group are reactive and concerned with implementing the plans and providing management information regarding the levels of service achieved.
� Service desk
This is an essential function to effective service management that acts as the main point-of-contact for the users of the service. You register incidents, allocate severity, and coordinate the efforts of the support teams to ensure timely and correct resolution of problems.
Escalation times are noted in the SLA and are, as such, agreed upon between the customer and the IT department.
This discipline also requires you to provide statistics to SLM to demonstrate the service levels achieved.
� Incident management
This goal of this discipline is to restore services to their normal operational levels as soon as possible, ensuring service levels are maintained. You must maintain meaningful records of all reported incidents that causes, or may cause, interruption or degradation of quality of IT services. You must also provides investigation and diagnosis of incidents, as well as incident ownership, monitoring, and tracking.
� Problem management
For this discipline, you must ensure that resources are prioritized to resolve problems in the most appropriate order based on business needs. A problem is the unknown cause of one or more incidents. When the root cause is known and a temporary work-around or a permanent fix is determined, the problem becomes a known error.
You must also agree on escalation times internally with SLM during the SLA negotiation. And you must provide problem resolution statistics to support SLM.
� Change management
In the change management discipline, you must ensure that the impact of a change to any component of a service is well known, and the implications regarding service level achievements are minimized. This includes changes to the SLA documents and the service catalog, as well as organizational changes and changes to hardware and software components.
Appendix A. Service management and the ITIL 451
� Release management
For release management, manage the master software repository, named the Definitive Software Library (DSL), and deploy software components of services. You must also deploy changes upon the request of change management. And you must provide management reports regarding deployment.
� Configuration management
With configuration management, your must register all components in the IT service, including customers, contracts, SLAs, hardware and software components, and more. Plus, you must maintain a repository of configurable attributes and relationships among the components.
Figure A-2 shows the key relationships among the disciplines.
Figure A-2 Key relationships among service management disciplines
To fully understand the responsibilities of each of the disciplines and the relationships among them, the following sections discuss both the service support and the service delivery disciplines.
Service support disciplinesThe purpose of the disciplines grouped in the service support group is to provide a means of implementing and monitoring the plans defined by the service delivery disciplines. Even though an IT organization may not have embraced the idea of SLM, it certainly has parts of most of the disciplines, in the service support group, in place. It is simply a prerequisite for managing client/server systems and the vast amount of desktop computers found in any business today.
Depending on many factors, size being one of the major ones, the disciplines may or may not be fully implemented. Also the same persons within the IT organization may have roles and responsibilities from more than one discipline. Take these factors into account when designing the procedures governing the incident, change, and problem management processes and, especially, the interfaces between each of the disciplines.
Having more caps makes it easy to skip the defined procedures. And implementing workflow tools to ensure compliance with the defined processes may be too rigid to make the daily work flow smoothly.
Because of the dramatic impacts that outages of IT services may have on a business, it is important that you define, document, and follow the processes well. These processes must be in line with the priorities of the business. Strict compliance with the rules may not always be required. However, if something goes wrong, it is better if you closely follow the rules and regulations.
During the life cycle of an IT service, it passes through the following phases:
� Planning� Deployment� Usage
– Monitoring– Correction– Verification
� Disintegration
You can regard each of these phases as a change to the existing environment. Although the term change may apply mostly to the activities that occur inside the usage phase, it still applies to all of the phases. In each of them, there is a need for information regarding the environment, components, status, operational
Appendix A. Service management and the ITIL 453
attributes, users, and so on. Likewise, there is a need to know where the roles and responsibilities of different activities involved with service support are placed within the support organization.
During all the phases of the life cycle, the IT organization as a whole should be able to answer the question: Who does what to which component: where, when, why, how, and authorized by whom?
Providing the answer requires contributions from all the disciplines in the service support group:
� Configuration management: Answers the where and which� Service desk: Should be in a position to answer why� incident and problem management: Are responsible for the what and how� Change management: Takes care of the when and whom� Release management: Depends upon the nature of the change; who is often
placed here
Change requests may originate from sources other than incident management, problem management, and service desk. For example, if a request to increase the size of a file system is issued from capacity management, the change request is passed directly to change management without the knowledge of service desk. However, each change request should be registered with and governed by configuration management. This enables the service desk to find the answer to why, even though the change did not address a specific incident received by the service desk.
Configuration managementFor day-to-day incident, problem, and change handling, as well as deployment of new services, information about all the components that are related to delivery of a service is vital. Configuration management is responsible for providing and maintaining this information because it is, perhaps, one of the toughest tasks related to service management.
Configuration management, as a discipline of service support, is not restricted to the configuration management aspects of development. If it applies to the specific environment, development aspects are included. But configuration management includes all of the components within the IT infrastructure that are related to delivery of a service. Configuration management should be applied throughout the organization and should not be restricted to IT-related items.
454 Service Level Management
The four main activities of configuration management are:
� Identification: This involves identifying all the configuration items (CIs) in the IT infrastructure, as well as defining the information to hold each of the CIs and the relationships between them. Additionally, it entails defining baselines and identifying variants.
To summarize, this task is responsible for defining the policies regarding the type and level of information that is maintained in the organization. Not only may identifying, gathering, and storing the information initially require a huge effort, but maintaining the information may be even worse.
The basic principles for identifying the CIs are as follows:
– CIs must be uniquely identified.– The indoctrination must be prominent and clearly visible.– Identities must be as meaningful as possible.– Versioning must be supported.– Growth must be catered to.
� Control: This activity handles maintenance, updates, and access to the configuration repository, called the configuration management database (CMDB). Many of the other service management disciplines support this effort, but it requires adequate control procedures to be in place:
– Specifications of CIs are agreed upon and frozen.
– Only changes authorized through predefined change management procedures are allowed.
� Status accounting: Since the CMDB is used by all system management disciplines, it is vital that the information is correct and timely. The CMDB holds active and historical configuration data. Therefore, attributes must be defined and maintained to track the configuration of CIs over time. These attributes must support the state of acquisition, development, testing, or implementation of the CIs and must be recorded as soon as they happen.
Another way of expressing the responsibilities of this activity is to record and report all current and historical data for all CIs. Some useful reports are:
– The number of incidents from a particular CI in a particular period– The change history for a CI in a particular period– The total amount spent with a particular supplier over a particular period
� Verification: It is important to audit the contents of the CMDB, that is, verify them to make sure that the repository reflects the actual configuration of the IT infrastructure. The configuration management staff themselves can accomplish this, or some of the operational procedures (for example, related to incident reception in the service desk) may assist. Review the consistency of the CMDB regularly.
Appendix A. Service management and the ITIL 455
The accuracy of the CMDB may be easier if:
– The CMDB is active rather than passive.
– The CMDB is updated automatically whenever possible.
– Configuration management activities are integrated into other relevant operational procedures.
– Automatic audits are built into the system.
Configuration and configuration itemsThe ITIL documentation describes a configuration as a configuration is anything within the IT infrastructure that needs to be controlled. According to this definition, such configurations are:
� Hardware� Software� Networks� People� Relationships� Documentation and contracts� Incidents, problems, solutions, and changes� Policies and procedures� Anything else that needs to be controlled
However, a configuration, much like a service, is usually a self-contained cohesive collection of components that are called configuration items (CI).
Configuration item attributesAll CIs are identified uniquely within the CMDB, and, for each CI, several attributes are recorded. An attribute is an item of information that can be recorded about a CI. Only attributes that are relevant to a specific organization should be recorded.
For all of the different types of configurations, configuration management must identify and manage all the attributes needed to manage the configuration. Obviously, this is a cumbersome task. Within the IT infrastructure, there is a large number of configurations, each with different attributes, that are needed to support different management processes. The service desk may, for example, be interested in information regarding capacity and free space of a personal computer (PC) used by the person who calls. However, change management needs to know the physical characteristics (size, energy consumption, and so on) of the hard disk, as well as the manufacturer and serial number, to replace it in case of a failure. But it does not need the free space information in the case of hard disk failure.
456 Service Level Management
You should record at least four basic attributes for every CI:
� ID: A unique identification. To ensure uniqueness and easily differentiate different types of CI from one another, you must develop a naming standard for CI IDs that supports type. This naming standard for the CIs should not include elements of information that may change over time. Therefore, avoid location and owner information because it may change, requiring the CI to assume a new ID.
� Location: Record the location where the CI may be found to assist all other service management disciplines. In particular, the impact analysis of the change management process relies on this piece of information.
When discussing mobile computers, it may not make sense (or it may be difficult) to determine the physical location of the CI. Each individual organization must be determined within itself, if the efforts to maintain the physical location are too high to take on this task.
� Owner: To charge services, monitor SLA achievements for different LOBs, determine maintenance policies, and so on, it is necessary to connect the CI to an owner or user. Linking this information to the organizational structure, which is also recorded in the CMDB, the CI can be associated to a specific group or department, providing the key to the desired information.
� State: The state of the CI is vital to track the CI through its life cycle to ensure that each CI is made to cost, on time, complete, to specification, authorized, and more. During each state, you may track responsibilities, progress, and problems.
The information needed to manage a configuration varies as a function of the type of configuration and the management task performed. In the previous example, free space is an attribute of the configuration of type PC, and the serial number is an attribute of a configuration of type hard disk.
When you break down the IT infrastructure into configurations and configuration items, you must follow these three principles:
� Break down CIs only to the level at which they can be changed or amended independently.
� The level of CI breakdown and the attributes stored for each CI vary depending upon the individual organization and the purposes for which control is exercised.
� The cost of gathering and storing information must never exceed the value of the information.
Besides attributes, you may also use relationships to associate CIs with one another. This may be the most obvious way to break down CIs for tangible components, such as hardware. However, defining the CI structure for software
Appendix A. Service management and the ITIL 457
and organizational configurations becomes more complicated. The CMDB must be able to handle relationships between:
� Hardware and hardware� Hardware and software� Software and subsystems� Applications, hardware, and software� Hardware, software, and operating systems� Networks� All of the previous items and their users� Incidents, problems, solutions, and change requests
The configuration management databaseConfiguration management is not a discipline that arose with the use of IT. In particular, the building and manufacturing industries have used configuration management for as long as these industries have been around. Configuration management has been used to manage bill-of-materials of the components produced and to track which components were used in which assemblies and when. For manufacturers of airplanes, automobiles, and trains, and so on, this information is vital, especially when a failing component is identified and must be replaced on all products where it was used.
All of the information needed to support the service management disciplines is properly available within the organization. However, chances are that it is scattered all over the installation, is not based on a common data model, and is stored in a variety of formats on different media.
The CMDB does not necessarily have to be implemented according to an all-encompassing data model. Nor are there any requirements to store the data in a specific database management system (DBMS), but it helps. If neither a common data model nor a common DBMS systems is used, the CMDB is likely to be full of duplication and with a build-in potential for inconsistency. Furthermore, exchanging information between applications and extracting meaningful management information from all these sources of information is extremely difficult.
You must diminish these inconveniences by using a common data model and the same DBMS. It may be impractical to change all the applications that provide data to the CMDB, but extracting the required information and transforming it to fit the CMDB data model may prove beneficial to any organization in these ways:
� Avoids duplication� Avoids inconsistencies� Identifies relationships� Allows corporate access to data� Generates management information
458 Service Level Management
This list is by no means complete. More benefits will be obvious for each specific discipline.
Configuration management and other disciplinesSince configuration management is the owner of the CMDB, this discipline interacts with all the other service management disciplines. Whenever data is requested, the request must be authorized by configuration management. And of course, configuration management must also be in control when it comes to updates and additions to the CMDB.
For the most part, the other disciplines primarily request data from the CMDB. However, especially within the service support group of the disciplines, service desk, problem management, change management, and release management, the repository is used as a means of communication when handling incidents and problems as described in the following sections.
For the service delivery disciplines, the CMDB is primarily a databank where information, related to such specific areas as cost, capacity, and performance, can be found. These disciplines contribute to the repository by adding SLA-specific information, updates, and additions to the service catalog.
Service deskThe service desk provides a main point of contact for users of the services. Whenever users experience problems, have questions, or need information regarding the use of services, they should contact the service desk. The service desk is also responsible for notifying users about disruptions in service, planned outages, and availability of new functions. It serves as a two-way conveyer of information between the service users and the staff supporting the service. This section focuses on the one-way information flows from user to staff (Figure A-3).
Providing quality service requires processes and procedures to detect and rectify problems as quickly as possible. Detection is either done by programs that monitor specific resources of the hardware and software components of the IT infrastructure or by the users of the service. When an issue is reported, it is recorded centrally with the service desk as an incident. This central incident control is required, partly to ensure that the issue is handled and partly to ensure that the same issue is handled only once, even though more incidents may have been opened against the issue.
When the issue is reported, the service desk must provide a solution to it. The service desk may (but is not required to), through incident management processes, identify, test, and apply the solution. It must also keep track of the incident to ensure that the issue is solved within the time agreed in the SLA and to escalate the issue if necessary.
Appendix A. Service management and the ITIL 459
If a service desk cannot identify a solution to the issue on its own, the incident is recorded as a problem, which is stored in the CMDB. Now, problem management assumes responsibility to provide a solution for the problem by accepting the problem. When the root cause of the problem is known and a temporary work-around or permanent fix is identified, it is recorded as a known error.
When a solution is available, it may require changes to the CI for which the incident was opened or another CI within the infrastructure on which the failing CI relies. The service desk is now required to open a request for change in order for change management to access the impact and authorize the change. Once authorized, release management may take over to perform the actual implementation of the change.
During this process, each service support discipline is responsible for recording status information in the CMDB. The service desk must also keep the user informed through all the stages in the life cycle of the incident. It must also confirm that the issue has been resolved, record the solution to the known error, and close the incident.
Figure A-3 Service desk activities
Incidentoccurs
Call answered
Incident number allocation
Initial data capture
Categorization
Initial investigation
Assign problem
Resolve
Escalate
CanService Desk
resolve
Resolve intime ?
Close incident
Record solution
Confirm
Y
N
N
N Y
Y
Known errors
Diagnostic scripts
Personal skills
ConfigurationManagement
Database
ProblemManagement
ChangeManagement
ReleaseManagement
460 Service Level Management
Service desk and other disciplinesSince the service desk is the “front office” of incident and problem management, there is a close collaboration between the three. However, since the service desk is responsible for tracking and following an incident through its entire life cycle, it must also interact with change management through incident management, once a solution is identified and must be implemented. Again, the service desk uses the CMDB to keep track of the status of an incident, the related problems, and changes.
Interfacing to configuration management (through the CMDB) is also vital to service desk. Ask the user a few simple questions, such as: What is your name or personnel number? Are you using your own workstation? Are you in your own office? Then using the answers as keys for searching the CMDB, the following information is available:
� Equipment held� Software accessible� Diagnostic aids available� Problem history� Change history� Service level agreement� Training and experience records� Personal information
Since the service desk is the function, which has the most interaction with users, procedures may be established to assist configuration management to keep track of CIs and verify their attributes. It is common that the service desk asks the user questions related to the equipment and applications available to the user and records deviations from the expected values shown in the CMDB.
Finally, service desk provides statistics to SLM in order for it to verify that each LOB gets the required level of support from the service desk.
Incident managementAs described earlier in this appendix, incident management has as a goal to restore services to their normal operational levels as soon as possible, to ensure that service levels are maintained. The service desk plays a key role in incident management. When an issue is reported, the service desk captures the data needed to open a new incident. This data must include an ID of the person (or proxy) who submitted the issue report, and the ID of the CI suffering the impact. With this information, service desk can query the CMDB to investigate whether the CI exists in the CMDB, and whether any outstanding problems, changes, or other incidents are active for that particular CI. It should also be determined if the particular issue was reported earlier.
Appendix A. Service management and the ITIL 461
If there are no indicators showing that the issue is being handled, the incident must be categorized. A type and an impact code are assigned to the incident. Do not confuse this with priority, urgency or severity, as defined here:
� Impact: Impact of the incident on the achievement of business objectives
� Severity: Impact of an incident on service provision
� Urgency: Determines the speed with which an incident must be resolved
� Priority: Order of handling incidents, based on a combination of impact, severity, urgency, and availability of resources to address the incident
Using these definitions, it is clear that an incident can have a high impact on the achievement of business objectives and yet have an insignificant impact on the provision of the service (and vice versa). The priority primarily depends on the impact on the business and secondly on the impact on the service. However, since the business relies on the service, incidents with a high service impact quickly affect the business as well.
The priority of the incident is determined from both a business and a service perspective as shown in Figure A-4.
Figure A-4 Incident priority
Having categorized the incident, an initial investigation may be carried out using incident management processes. This involves searching the CMDB for similar or related issues to identify the cause of the incident as a known error. If this is the case, the service desk can inform the user of the status of the problem, when to expect the issues to be fixed, or any actions the user can take to circumvent the issue.
medium
low
high
medium
Business impact
Ser
vice
impa
ct
impact
severity
medium
low
high
medium
Business impact
Ser
vice
impa
ct
impact
severity
462 Service Level Management
If no immediate solution can be found, the incident becomes a problem, and a solution must be provided by the problem management discipline. When the service desk passes the problem to problem management, the responsibility of managing the problem still lies with the service desk. The service desk is now responsible to keep the user informed about the progress and escalate the problem if the times for problem resolution set out in the SLA cannot be met.
Problem managementThe activities performed by problem management are similar to those of the service desk. Problems are received, accepted, diagnosed, and assessed for severity. This is known as problem control. Then, solutions are developed or identified, tested, verified, and recorded, which is all part of the error control process.
The problem control process is concerned with identifying the real causes of incidents to prevent future recurrences. This process is made up of five phases:
1. Initially investigating the nature of the problem2. Accepting the problem3. Assigning priority (impact on service delivery and business objectives)4. Allocating support effort5. Performing further investigation and diagnosis
After the problem is accepted and a work-around or permanent fix is identified, it is recorded in the CMDB as a known error. There are two types of known errors:
� Accepted problems that are not yet rectified (Root cause analysis has been done, solution has been identified, but not implemented.)
� Accepted problems for which a resolution or circumvention is available
Allocating the support effort to find a solution to a problem is important. Depending on the nature of the problem, the impact, urgency, and the severity, it may prove more productive to the business as a whole to live with the problem rather than using all available support staff and all the budget for external support to diagnose and rectify it. Making a decision such as this requires detailed impact analysis and acceptance from the service level manager as well as the sponsor. It may lead to renegotiation of the SLA.
When the cause of the problem is identified and a decision to provide a solution is approved, error control takes over. The primary objective of this function is to eliminate all known errors by providing solutions to the problems and ensuring that they are implemented on all CIs where the problem has occurred or may occur. To meet this objective, error control and change management go hand-in-hand since change control is responsible for approving any changes made to any CI. See Figure A-5.
Appendix A. Service management and the ITIL 463
Figure A-5 Interrelationships of incidents, problems, and known errors
The verification of solutions is especially important. First, you must verify that the proposed solution targets the source of the problem rather than removing the symptoms. Secondly, you must ensure that implementation of the solution does not result in any undesired side effects. If this is the case, the solution implementation may lead to other (even worse) problems that will harm the overall service delivery.
All of the disciplines in service support should work together to avoid the vicious circle of change. Much too often, solutions, changes, and implementations are rushed through without proper testing, leading to even more severe incidents of higher impact. This requires even quicker resolution, so the solution is not tested properly and new incidents are the result. This is depicted on the left side in Figure A-6.
On the right side of Figure A-6, error control has had enough time to assess the impact of the solution. Change management also has had adequate time to assess the impact of the change, and the implementation had exactly the foreseen implications. The source of the problem was eliminated, and the technical support staff can start working on the next problem.
incident
known error
problem
change
Problem control
Error control
Change controlChange
Management
ProblemManagement
Service Desk
Incident Management
incident
known error
problem
change
incident
known error
problem
change
Problem control
Error control
Change controlChange
Management
ProblemManagement
Service Desk
Incident Management
464 Service Level Management
Figure A-6 The vicious cycle of change
Problem management and other disciplinesHaving a front office to filter out irrelevant requests, such as a service desk, and a back office processes in place, such as incident management and change management, the problem management staff can focus only on problems. They interact primarily with the service desk function, incident management, and change management processes. They use the CMDB to gather information necessary to perform the following tasks:
� Automatic escalation� Logging problems � Highlighting trends: Incident and problem history� Matching problems� Listing known errors� Identifying outstanding problems� Identifying relationships� Creating a Request for Change (RFC) to be performed� List recent changes� Identify responsibilities� Assess impact� Comparison of cost of fix with cost if no fix
You may wonder what the differences are between incident management and problem management processes. The objective of incident management is to
incident
problem
change
implementation
incident
change
problem implementation
incident
problem
change
implementation
incident
problem
change
implementation
incident
change
problem implementation
incident
change
problem implementation
Appendix A. Service management and the ITIL 465
restore services that support the business as quickly as possible, performing tasks such as researching the CMDB for known errors, while problem management focuses on determining the root causes of incidents, their resolutions, and prevention.
Change managementAfter configuration management, change management is the most important to continue delivering quality service. The responsibility of change management is to manage changes to the configuration items such as:
� Hardware� Software� Communication equipment and software� Production application software� All documentation, plans, and procedures relevant to running, supporting, and
maintaining the production systems� Environmental equipment� People
By using the term production, it is indicated that changes to equipment and applications used for development and test purposes are normally not the responsibility of change management.
The processes that are used to manage changes involve:
To support the processes, several players must be involved. In the typical IT organization, a dedicated change manager is appointed. The change manager must receive, access, approve, and manage the changes.
To assist the change manager, a change advisory board (CAB) is appointed. This board consists of members from all the support groups within the organization, such as service desk, networking, space management, platform support, and representatives of the business. The board is responsible for assessing proposed changes for impact and estimating the resource requirements needed to design, build, test, implement, and review a change. The
466 Service Level Management
CAB also advises the change manager in change acceptance matters and assist in scheduling changes.
The CAB may be divided into subcommittees that handle changes in specific areas as shown in Figure A-7. The LOB representative from finance does not have to attend the meeting when changes to the production control software are discussed. Also, the presence of the representative for networking is not always required when changes to the central disk configuration are handled.
A super-committee, the CAB/emergency committee (CAB/EC), is also appointed. The purpose of this committee is to meet to authorize urgent changes on short notice. Because of the size of the change advisory board, it is impractical to convene a full meeting to handle urgent changes. The change manager may be authorized to accept some urgent changes, but we do not recommend doing so without considering other key personnel. The CAB/EC, for example, may be made up of the change manager and key staff members from the CAB. It acts as the safety net, or sparring partner, of the change manager. The selection of members of the CAB/EC is a matter of preference and the nature of the change, but the change manager should always be a born member.
Operations Networking Systems Support Service Desk Development
Subsystems Solutions
Security
IT ManagerLOB representative
LOB representative
LOB representative
Appendix A. Service management and the ITIL 467
Managing normal changesIn day-to-day work, the change manager authorizes and manages all changes that apply to the IT infrastructure. In large and medium size installations, this is an enormous task. Therefore, the change manager can pre-approve standard changes and delegate the responsibility to others, such as the service desk.
For nonstandard and major changes, which are the concern of the change manager, follow the procedure shown Figure A-8. This includes the steps outlined in “Change management” on page 466.
Figure A-8 Change management: Change procedure for normal changes
Successful?
Build ChangeDevice back-out and test plans
Test Change
Co-ordinate change implementation
ReviewDocument change after elapse of review period
Estimate impact and resources.Confirm agreement to change and prioritySchedule Change
Authorized?
May be interactive
On budget?
Implement back-out plansSuccessfulNo
No
No
No
Yes
Yes
Yes
Yes
Close Change
Change Builder
Change Tester
Change Manager
Change Advisory Board
Authorise and schedule change.Reports action to CAB Circulates RFC to CAB members
Refers RFC upwards.IT Manager decides.Passes to CAB for action
Change Initiators
Receive and filter RFCs
Allocate priority
Decides priority
Urgent? To urgent procedure
No
Yes
Service Desk, Tech. Staff, or users
Change Manager
Change Manager
Successful?
Build ChangeDevice back-out and test plans
Test Change
Co-ordinate change implementation
ReviewDocument change after elapse of review period
Estimate impact and resources.Confirm agreement to change and prioritySchedule Change
Authorized?
May be interactive
On budget?
Implement back-out plansSuccessfulNo
No
No
No
Yes
Yes
Yes
Yes
Close Change
Change Builder
Change Tester
Change Manager
Change Advisory Board
Authorise and schedule change.Reports action to CAB Circulates RFC to CAB members
Refers RFC upwards.IT Manager decides.Passes to CAB for action
Change Initiators
Receive and filter RFCs
Allocate priority
Decides priority
Urgent? To urgent procedure
No
Yes
Service Desk, Tech. Staff, or users
Change Manager
Authorise and schedule change.Reports action to CAB Circulates RFC to CAB members
Refers RFC upwards.IT Manager decides.Passes to CAB for action
Authorise and schedule change.Reports action to CAB Circulates RFC to CAB members
Refers RFC upwards.IT Manager decides.Passes to CAB for action
Change Initiators
Receive and filter RFCs
Allocate priority
Decides priority
Urgent? To urgent procedure
No
Yes
Service Desk, Tech. Staff, or users
Change Manager
Change Initiators
Receive and filter RFCs
Allocate priority
Decides priority
Urgent? To urgent procedure
No
Yes
Service Desk, Tech. Staff, or users
Change Manager
Change Manager
468 Service Level Management
Change initiationUsually, changes can be requested by any technical staff member in the organization. Users should also be allowed to submit RFC, but to provide initial filtering and coordination, user RFCs require approval of a LOB manager.
Change reception: Logging and filteringLog all change requests as RFCs. Give each RFC a unique number and store it in the CMDB. If the change is suggested to resolve a problem, create a relationship between the incident and the change.
Having logged the request, the change manager should reject requests that are impractical, undesirable, repetitive, and so on. An appeal process should be in place for change initiators to dispute the verdict of the change manager.
Initial change prioritizationThe first action that the change manager takes after receiving an RFC is to allocate an initial priority to the change. This initial priority indicates the urgency of the change. The change manager is solely responsible for allocating the correct priority, even though the change initiator may be consulted during this process. Urgent changes should be handled via special procedures as explained in “Managing urgent changes” on page 470.
For normal (non-urgent) changes, the change manager places the RFC into one of the following categories:
� A: Minor impact and few additional resources needed
The change manager is delegated the authority to approve and schedule changes, although they should be reported to the CAB. If there are any doubts about authorizing these changes, the CAB should be consulted.
� B: More than a minor impact or significant resources needed
The RFC must be discussed at the next regular CAB meeting. Prior to this, the change manager must circulate the RFC to the CAB members or to a wider audience if necessary (for impact and resource assessment).
� C: Major impact or major resource requirements
The IT manager must refer these requests upward. Approved changes must be passed back to the CAB for scheduling and implementation.
Change assessment and schedulingEach RFC is assessed in terms of impact on the business and availability of resources. At this point, you must consider several business and technical factors. It is more than likely that the change manager has to consult the business and technical support staff to fully assess the impact and requirements.
Appendix A. Service management and the ITIL 469
� Change building: If the change is authorized, the appropriate technical group is given the task of building the change and devising a test plan. Create backout plans to enable the implementation team to revert to a known trusted state in case problems arise during the implementation of the change.
� Change testing: An independent testing authority should test both the change and backout procedures prior to implementation. The change cannot be allowed to be implemented before satisfactory tests have been completed.
� Change implementation: Upon completion of testing, the change manager coordinates the implementation of the change. Advise all relevant staff in advance of the planned implementation, perhaps through the service desk. If anything fails, execute the backout plans and remove the change.
� Change review: To ensure that the desired effects are achieved and to assess whether the resource estimates are accurate, review all changes after a predefined period of time. This also helps to improve future estimates.
Managing urgent changesRequests for urgent changes are bound to appear at the desk of the change manager. Typically, these are the result of component failures or unforeseen incidents, but urgent RFCs have been observed as the result of poor or missing planning. To avoid the panic of urgent changes, perform the disciplines of service delivery, primarily capacity management and availability management, with an equal focus on long-term and short-term issues.
Reception and prioritizing of urgent RFCs follow the same processes as for normal RFCs. After the change manager decides that the change is urgent, for business or IT service delivery reasons, the CAB emergency committee is called for an urgent meeting or conference call.
The urgency, the impact of the change, and the resources needed to create and implement the change are all assessed. Also the need for testing is determined. Figure A-9 shows the urgent change procedure. Just as for a normal RFC, but hopefully a little faster, the change is built, and backout plans are created. If time allows, the change and backout plans are tested, and, with no further delay, the implementation takes place.
Of course, urgency is a matter for this type of RFC. Therefore, deviation from the normal requirements for thorough documentation throughout change processing may apply. The change manager has to make up for this when the implementation of the change proves to be satisfactory. The CMDB needs to be updated with all relevant information regarding the change.
Finally, the change is reviewed and properly documented as is the case if a normal RFC was handled.
Change management and other disciplinesChange management is a key discipline for delivering high availability services. Naturally, there is a tight relationship between change management, problem management, incident management, and the service desk. Refer to “Problem management and other disciplines” on page 465. Change management often relies on release management for implementation, and, as usual, the main transfer of information between the cooperating disciplines is the CMDB.
However, the discipline that most depends on the services of change management is configuration management. The two disciplines mutually depend on each other. There can be no control over CIs in an organization if they are not subject to change control. At the same time, there can be no meaningful change control if there is no idea of what CIs are in the organization and what their functions are.
Successful?
Test Change urgently
Co-ordinate change implementation
Ensure records are brought up to date
From normal procedure
Call CAB/EC meeting
Urgently assess impact, resource requirements and urgency.
Urgent? To normal procedure
Implement back-out plans.Change is referred back to CAB/ECSatisfactory?
No
No
No
No
Yes
Yes
Yes
Yes
Change Manager
Change Advisory Board / EC
Change Builder
Change Tester
Change Manager
Urgently Build Change.Create back-out plans
Time to test?
ReviewDocument change after elapse of review period
Close Change
Appendix A. Service management and the ITIL 471
This interdependence leads to:
� Configuration management tasks to update the configuration repository should be prompted in several ways, a large number of which fall within the scope of change management. Some of these are:
– When new CIs are added to the IT infrastructure
– When the status of CIs changes
– When the owners of CIs change
– When the location of CIs changes
– When relationships between CIs change
– When old CIs are removed
– When a unregistered CI is found or information regarding a CI is inaccurate
– When a change is requested
Change management should assess that change’s impact on the business and identify other CIs that could possibly be affected. If the CMDB is not up to date, this affects the way in which the change is treated.
� Any change request is made using a RFC, which is reflected in the CMDB. Unless this is done, it is difficult to track progress and trace problems in the IT infrastructure back to previous changes.
� Unless change management is functioning effectively, the CMDB cannot reflect the current status of specific CIs in the organization.
� If changes fail, the CMDB can be used to indicate what state the CI should be reverted to. If that is out of date, time is wasted trying to remember what the CI looked like before the work started.
Release managementSince configuration management is responsible for managing the logical aspects of CIs (including software and hardware CIs), release management is responsible for the physical aspects. Release management is involved whenever a significant hardware or software rollout takes place. In relation to software, the main types that are to be controlled are:
� Application programs developed in-house� Bought-in application software and utilities� System software provided by suppliers
All of this software must be stored in a common secure software library, called the Definitive Software Library. This library contains all the definitive
472 Service Level Management
quality-controlled versions of all the software CIs defined in the configuration repository.
The DSL is one single library, separate from other parts of the environment. At least, the DSL, logically, is single, but it may be practical to use more physical locations, formats, and backup storage as part of the contingency plan.
For hardware control, set aside an area for the secure storage of approved hardware components, named Definitive Hardware Store (DHS). Similarly to all the approved software, record all details that relate to the hardware components in the CMDB.
The tasks performed by release management are:
� Planning and overseeing the successful rollout of new and changed software and hardware and associated documentation
� Physical storage, protection, distribution, and implementation of all approved software and hardware
� Control of access to authorized versions and support of change control in releasing software for distribution for further work
� Ensuring that only correctly-released and authorized versions of software are in use
� Distributing software to remote locations
� Implementing (or bringing into service) approved software and hardware
� Managing the organization’s rights and obligations regarding software and hardware
The release management processes include elements that are concerned with development and other elements that are concerned with the production environment. Both are managed to ensure that the required standards are met when the service is delivered and to control the way the software is being used in the production environment. This is why release management is considered a service management discipline.
Figure A-10 shows the details of the release management process. The left part of the figure shows the tasks that are related to verifying and ensuring the functionality and quality of the new software CIs, which are developed in-house or bought-in. This is the control part of release management. After the required specifications are met, the software, along with its attributes, are registered in the CMDB and stored in the DSL.
The right part of the figure shows the functions that are related to distribution. The software is copied from the DSL and built. The build process may be a simple copy or a complete (or partial) compilation and linkage. The main issue is
Appendix A. Service management and the ITIL 473
to test and verify that the output from the build process can be distributed and implemented successfully. This must be tested before initiating any distributions and implementations.
Figure A-10 Release management: DSL
Release management and other disciplinesDespite that fact that, for service management purposes, release management is the extended arm of change control, it also interacts with configuration management by maintaining the CMDB throughout the life cycle of the software and hardware CIs. Configuration can help release management achieve the following tasks:
� Recording location of software and hardware� Code control� Building releases� Identifying who needs new releases� Implementation� Software and hardware auditing� Determining license fees� Identifying unused software and hardware � Recovering software� Recovering from data loss or corruption
In addition, release management must also provide reports to SLM regarding implementations.
Build
PerformanceTesting
System Testing
FunctionTesting
Rework
QualityAssurance
DSL
Test
Distribution
Implementation
474 Service Level Management
Service delivery disciplinesIf service support is the hands of the service management body, service delivery is the mind of service management. Service delivery is a discipline that needs to be mastered in most enterprises. One way or another, every enterprise provides services to its customers, either as the main business idea or as a supplement to the goods provided by the company. Even though services from various industries differ, all providers of services must answer two questions before they initiate service delivery:
� What is the service that will be delivered?� How will the service be delivered?
To support the answering process, you must address a lot of related questions, such as:
� Why are we delivering the service?
� Why will customers buy the service?
� Where and when will the service be delivered, in what quantities, and at what level of quality?
� What resources are needed to deliver sufficient quantities of service of the desired quality, at the place or places and time or times of usage?
� What is the cost of delivering sufficient quantities of the service of the desired quality at the place or places and time or times of usage?
� How is service delivery assured?
� How is unauthorized use of the service assured?
� Who will support the delivery?
� What is the price customers have to pay to make use of the service?
Many services are standard off-the-shelf services that are well-defined and apply to a large number of different customers. Other services share the same attributes but may be tailored to the specific geographies, industries, businesses, or types of customers. Yet other services are highly customized to meet the needs of specific customers.
In general, IT services are grouped into three categories of service. Each reflects the need for particular adjustments to fulfill the requirements of the users:
� Off-the-shelf: Standard; no adjustment
� Volume customization: Standard versions; adjusted to fit similar groups of customers
� One-of-a-kind: Made to order to fit the unique needs of one particular customer
Appendix A. Service management and the ITIL 475
The cost of delivering a one-of-a-kind service properly is much higher than the cost of delivering a standard service. The price that the customer pays reflects the cost. To determine the cost, and thereby predefine the price that the customer must pay, you must answer all of the questions concerning who, why, what, where, when, and how. That is you must define the service in such detail that there can be no misinterpretations about:
� The deliverable� Quantities and quality of the deliverable� Prerequisites and requirements for the delivery� Division of roles and responsibilities between customer and provider� How, where, and when the delivery takes place� The penalties for not delivering� Benefits/penalties for increased delivery
And finally, when all these items are defined, you must determine the price.
Discussing SLM in the context of IT services typically applies to volume-customization and one-of-a-kind services. Within the enterprise, the IT organization provides the same basic services to all LOBs (mail, office applications, Internet access, etc.). It fulfills particular needs for each LOB by providing specialized services designed solely for this purpose (for example, accounts payable/receivable, payroll, procurement, and so on). Likewise, an external network service provider wants to sell similar networking services to many customers and perhaps design special services for customers with special needs.
In the service management organization, SLM is responsible for defining services. It is also responsible for managing customer demand and negotiating the SLAs. After the services are established and delivery has begun, service providers need to assure that the service is delivered as expected. They must also ensure continued delivery, which is also the responsibility of SLM.
To do this, SLM needs assistance from other disciplines that focus on various aspects of the service delivery processes and the overall mission of the IT department:
� Capacity management: Deals with the daily monitoring and reporting of workloads, resource usage, and component performance. It is also responsible for capacity planning by identifying trends and predicting future needs.
� Availability management: Ensures that the services are available to the users that are authorized to use those services, when they are needed. This is primarily achieved by ensuring the availability of each of the components that is part of the service.
476 Service Level Management
� Financial management of IT services: Manages the IT budgets and negotiates contracts with suppliers. It also plays a key role in determining the cost of a service (often based on resource usage), therefore assisting SLM with pricing the service.
� IT service continuity management: Ensures that the IT services delivery may continue, or be re-established quickly, after a disaster. IT services are often required to perform business transactions, so the IT organization must have completed and tested plans and procedures for disaster recovery and related subjects.
The following sections explore these four disciplines and their association with SLM.
Capacity managementInsufficient capacity often leads to bottlenecks, performance problems, and loss of availability, all of which contribute to degrading service delivery. Looking at a typical client/server service, it is evident that, since more components make up the service as it is perceived by the end user, the capacity of each individual component must balance with the capacity of the other components.
In the IT community, more capacity is often synonymous with new technology. Capacity is an attribute of the hardware components that make up the service or the amount of hardware resources available to software components. Therefore, capacity management is often seen as managing procurement of new advanced technology. Too often, new technology is procured when performance or capacity problems are experienced, and then the capacity management function becomes reactive rather than proactive. This tends to happen in a very complex environment where many components are a part of more services and are tied together in a giant web.
Considering capacity as the maximum performance or output of a component, we can say that, to manage capacity of a service, it is important to manage the workloads of the service to forecast the need for capacity. It is also important to know what workloads run where and when, and under what circumstances.
In general, this means that the objective of capacity management is to ensure that the appropriate technology is used in the best way possible. The word appropriate is determined by the level of service that is to be provided to the business at all times. Also, the phrase best way is determined by how well any given technology supports the business requirements of the users.
Ensuring that the right technology is used to provide the best support for the business is like trying to hit a moving target that varies in size. Not only does the business environment change constantly, but technology changes happen so fast
Appendix A. Service management and the ITIL 477
these days, that ordered devices may be obsolete before they are received. The rapid development of new technologies may even pose new possibilities and opportunities for the business leading to business changes driven by the availability of new technology. The e-revolution is one of the best examples of technology-driven business changes. Some of the questions that change management helps to answer are:
� How will the new technology affect the way business is conducted?� How can we make the best use of these technologies?� Will they really save us money?� Are they going to make us more productive?
To answer these questions, capacity management draws upon data of the past environment where the variables are known. It compares this date to current projected future variables. Data about the past and present environment also helps to optimize current performance, estimate future needs and demands, and take steps to be ready to meet them when required.
To overcome all this, capacity management is divided into the following subdisciplines, each covering different aspects of capacity management.
� Capacity management database: Maintains the data related to capacity management
� Performance management: Monitors and optimizes the performance of the existing components
� Workload management: Identifies, understands, and forecasts workloads
� Application sizing: Predicts service levels, as well as cost and resource implications of future applications or major modifications to existing applications
� Modeling: Predicts systems performance under given volumes and varieties of work
� Resource management: Understands the IT infrastructure to ensure that the organization uses the available technology that best suits the business
� Demand management: Prioritizes customer demand for use of component resources without adding more capacity
� Capacity planning: Predicts when components reach their saturation point and identifies the action to be taken to prevent this
Capacity management databaseThe central tool used by capacity management is a repository of information relevant to capacity management. This repository is unlikely to reside in a single database, but may exist in several physical locations and contain several types of data.
478 Service Level Management
The type of information that is stored in the capacity management database is technical, business, and cost data required by capacity management to produce technical and management reports showing usage and trends.
Performance managementThe objective of performance management is to ensure that the agreed-upon service level is maintained. In addition, performance management is responsible for ensuring that each hardware, software, and networking component delivers the expected capacity.
This is a day-to-day task that involves monitoring the capacity delivered to quickly identify problems or bottlenecks. The information gathered for monitoring purposes is stored in the capacity management database to keep historical information and help determine trends.
SLM delivers the required service levels to be achieved for performance management. These are in the form of thresholds for each component that must be met to provide the agreed-upon level of service. If these thresholds are not met or if indicators show that they will not be met in the near future, performance management investigates the reason, identifies actions to tune the systems to meet the thresholds, and implements the tuning activities shown in Figure A-11.
Figure A-11 Performance management activities
Capacity Management Database
Service LevelException Reports
tuning
monitoring
implementation analysis
Service Level thresholds
Appendix A. Service management and the ITIL 479
All the activities of performance management are conducted in close contact with configuration, problem, and change management.
Workload managementWorkload management has three objectives:
� Understand and document all workloads
� Establish interfaces with relevant parties in the IT department for interchange of information
� Implement an effective workload forecasting system
Breaking down a service into individual workloads that execute on one or more components in the IT infrastructure is crucial to understanding and defining the capacity needs for any one component. Furthermore, workloads often depend on one another to form a hierarchy in which one workload must be completed before the next one occurs.
All the workloads, and the relationships between them, must be defined and categorized in the workload catalog, which is part of the overall capacity management database, as shown in Figure A-12.
Figure A-12 Workload management activities
In addition to the existing workloads, capacity management must understand new workloads to estimate future capacity needs. The metrics used for this estimation are obtained from the application sizing and modeling tasks of capacity management.
Capacity Management Database
Workload catalogue
Workloadclassification
ExistingWorkload
NewWorkload
Business NeedsPeek Load
analysis
480 Service Level Management
Application sizingThe objectives of this task are to establish a means of predicting the service level, resource, and cost implications of new applications and major changes to existing applications. Application sizing is of particular interest in the early stages of the life of a service. Part of determining the cost of providing the service is a clear picture of the required capacity. Capacity management, therefore, supports SLM through the application sizing activities in the preliminary cost and business implications analysis.
ModelingThe modeling activities involve estimating or predicting the performance of a system under a given volume and variety of work. Modeling is the application sizing of hardware and networking components.
You can perform modeling with more or less accuracy. The most accurate method is benchmarking, where a load is run on a given system and the performance is measured. This is the most expensive way of modeling (Figure A-13).
Figure A-13 Capacity management modeling
At the other end of the scale is estimation. Based on historical performance data and known variables, the performance of a workload is estimated. This is the most inaccurate way of modeling, but also the cheapest.
Between estimation and benchmarking are:
� Trend analysis: More historical data representing different workloads on different systems is compared with the expected workload on a new system.
� Analytical modeling: Statistical methods are brought into play to provide a more detailed workload and system models.
Benchmarking
Simulation Modelling
Analytical modelling
Trend analysis
Estimation
accu
racy
cost
Appendix A. Service management and the ITIL 481
� Simulation modeling: A subset of a workload is run on the new system to obtain data that can be extrapolated to provide the expected performance figures.
Analytical models and even the equipment needed to run simulation and benchmarking tests may be provided by the hardware supplier. However, internally in the IT department, the most commonly found types of modeling are estimation, trend analysis, and common sense.
Modeling must be regarded as a tool that is available to all the tasks of capacity management since it is equally important and applicable to each of them.
Resource managementResource management works together with the availability and configuration management disciplines. It helps to provide an understanding of the organization’s hardware, software, infrastructure, and other resources and to ensure that the organization is aware of changes in technology. This information is vital when evaluating the business implications of acquiring new technology. It is also important when suggesting the application of new technologies to solve business challenges.
Demand managementCapacity management must also manage customer demand for IT resources of limited capacity. (Limited, in this sense, means that the available capacity cannot be increased for technical, financial, or business reasons.) Such a situation may occur when a component fails completely or when decreased capacity of exceptionally high demand is experienced. The capacity constraints may even be the result of a deliberate business decision not to invest in the full capacity needed to provide full service to all LOBs during peek hours. In a situation with limited capacity available, customers compete for service, and there is an evident need for prioritizing the tasks.
Demand management is related to capacity management and prioritizes competing demands based on business reasons rather than technical or other reasons. In this capacity, change management has to make some unpopular decisions, such as stopping or decreasing the service delivered to some users while others receive the usual high service level. However, since the decisions are based on business reasons, chances are that they are supported by senior management. And capacity management certainly needs that support when prioritizing.
Capacity planningUsing all the other capacity management disciplines, the foundation to create a capacity plan has been established. The ITIL defines the capacity plan as a plan
482 Service Level Management
that predicts when components will reach their saturation point and identify actions to prevent saturation.
Often, the capacity management discipline is perceived as creating and maintaining the capacity plan. In this definition, it is implied that all the other tasks (performance, workload, resource, and demand management as well as application sizing and modeling) are accomplished to provide all the information necessary to create the capacity plan. Figure A-14 illustrates capacity planning.
Figure A-14 Capacity planning
The capacity plan is by no means a static plan. Since both the business and technological environments change over time, demand, available capacity, service levels to deliver, and business priorities change accordingly, affecting the capacity plan.
Capacity management and other disciplinesCapacity management is a key discipline in service delivery. Since capacity management has the overview of the infrastructure, resources and capacities needed to support the services, knowledge about available technology and even business priorities, it interacts with all the other disciplines of service delivery.
capacity plan
technology
business
capacity
wor
klo
ads
demand
app
licat
ions
time
Appendix A. Service management and the ITIL 483
The primary collaboration is between capacity management and SLM. When negotiating new SLAs (or renegotiating existing ones), SLM consults capacity management to assess the capacity needs to accommodate the customer requirements. After the SLA is negotiated, SLM sets the targets for capacity management to deliver, and capacity management reports performance and throughput achievements back to SLM.
Availability managementSometimes, availability management can be regarded as part of capacity management. However, the responsibilities of availability management include planning, implementation, management, and optimization of IT services so that they can be used where and when the business requires.
Availability management, as defined by the ITIL, is involved with much more than system availability. Availability management focuses on entire services and ensures that the services are available where and when they are needed. Doing this, availability management is heavily influenced by the following factors:
� The complexity of the services
� The reliability of the IT components and environmental services
� The level of maintenance provided by suppliers or elements of self-maintenance
� The infrastructure on which the services are built
� The configuration of the infrastructure used to provide the service
When conducting availability management, you must observe the key elements (combined for all the components that are part of the service) in the following sections.
AvailabilityAvailability is one of the main attributes of the quality of service delivery perceived by users. The availability of components to meet user requirements as stipulated in the SLA (expressed as a percentage) depends on these factors:
� The reliability of components� The resilience to failure� The quality of maintenance and support� The quality of operating procedures
To optimize the availability of the service, you must take into account all of these factors for all components of the service. In this context, it is important to remember that the user’s perception of the service is depends on the availability
484 Service Level Management
of the hardware, software, and networking components as well as the availability of the data that is used.
A service that meets the required availability may be characterized as a service that has minimal interrupts yet, when an incident occurs, is recovered quickly and efficiently.
ReliabilityFrom a quality service point of view, reliability can be defined as freedom from operational failure. It is often measured as the mean time between failure (MTBF), the mean time between system incidents (MTBSI), or the number of breaks in a period. All of these values help determine the reliability of a component to perform a required function under the stated conditions for a stated period of time.
The reliability of a service is partly determined by the amount of resilience built into the service and partly by the pervasive management applied with the aim of preventing failures from occurring. The resilience of a service is the ability of the service to continue providing an operation service when components of the infrastructure are non-operational.
MaintainabilityMaintainability defines the ability of an IT service to be maintained in or restored to a satisfactory operational state. Maintaining or restoring a service involves five separate stages:
ServiceabilityAs used by the ITIL, serviceability defines the reliability, maintainability, and maintenance support of components for which external suppliers are responsible. When an external party assumes complete responsibility for an entire IT service and its support (as when a service is outsourced), availability is equivalent to serviceability.
SecurityAvailability management has the responsibility of the last letter in the basic security CIA principle:
� Confidentiality� Integrity� Availability
Appendix A. Service management and the ITIL 485
From the perspective of availability management, among the security considerations that you must address are:
� Services must only be available to authorized personnel.
� After failure, services must be recoverable without compromising confidentiality and integrity.
� Services must be recoverable without contravening IT security policies.
� Access for contractors to hardware and software should be clearly identifiable.
� Data must only be available to authorized personnel and only at agreed-upon times as specified in the SLA.
Figure A-15 shows the availability management perspective of the relationships between users, the IT organization, and external suppliers of services and the agreements/contracts that govern these relationships.
Figure A-15 Key elements of availability management
IT Services
IT Systems IT Systems
IT Services
Internal suppliers and maintainers
Softwaremaintenance
Softwaredevelopers
Othermaintenance
External suppliers and maintainers
hardwareEnvironmental
equipmentsoftware networking
Users
User User User User
Reliability&
Maintainability
Availability&
Security
Serviceability
Service LevelAgreement
Underpinningcontracts
OperationalLevel Agreement
486 Service Level Management
Availability management and other disciplinesNot surprisingly, availability management works most closely with configuration management, capacity management, SLM, incident and problem management, and service desk.
Configuration management provides information about the components to manage. Capacity management provides information about the availability of the hardware and software components (based on performance monitoring). Service desk and problem management alert availability management in case of user-discovered availability problems. Finally, service desk needs the help of availability management when user access to services needs to be modified and in case of authentication problems or violations.
Like all the other disciplines, availability management also provides reports and statistics to SLM that show the availability of the services delivered.
Financial management for IT servicesWhile IT services are seen as essential in many organizations, the cost of providing these services is realized only by a small number of people. This may lead to accusations that IT is not providing value for the money spent. This may occur while the users demand a higher level of service, which requires more capacity, which, in turn, leads to a higher cost of providing the service.
The objective of financial management for IT services is to break this vicious circle by:
� Identifying all costs necessary to provide the service� Establishing a fair means of recovering these costs from the business
This places IT in line with the rest of the business making users aware that they pay their fair price for the services they receive.
The tasks performed by financial management for IT services are:
� Costing: Identifies and accounts for the costs of running the IT department and providing IT services
� Charging: Recovers the costs of IT service provision in a fair and equitable way related to how the services are used
The objective of costing is to provide detailed information about where and why money is spent to provide IT services. The objectives of charging are:
� To recover the costs of providing IT services from the users of those services� To create, maintain awareness of costs of IT service provision among users� To provide an incentive for IT staff to deliver the agreed-upon level of service� To shape customer behavior in conjunction with capacity management
Appendix A. Service management and the ITIL 487
Charging should be implemented only after careful consideration has been made. It may work as a double-edged sword. While providing money to the IT department, it may scare off users so seriously that they refuse to deal with their internal IT service provider and seek services from external providers. This may lead to higher costs for the remaining users, giving them more incentives to go to external providers, and, before long, the entire IT department may be outsourced. Figure A-16 illustrates the vicious charging cycle.
Figure A-16 The vicious charging cycle
For these reasons, you may consider using notional charging instead of hard charging. This creates user awareness of the costs involved in the service provision without affecting their budgets. However, notional charging is effective only if the normal financial management for IT services processes are functional and effective so the users have a realistic idea of the cost of a service.
Implement charging only when it will give a clear value to the organization. An environment that is ready for charging has these characteristics:
� Budgetary control by users� Charging exists for other resources� Freedom of choice� Commercial flexibility� Adequate monitoring capabilities
The reasons for charging may include:
� Improved cost consciousness� Better utilization of resources� Allows comparisons� Demand management� To recover IT costs in an equitable manner� Inform users how changes are derived, so they can influence usage/charges� Raise revenue
Fewer Users Higher Cost
488 Service Level Management
The costing and charging mechanisms used to align the IT infrastructure more closely to the business objectives is referred to as the cost management system. This must be an integral part of the overall financial management system of the organization. The objectives for the cost management system are to:
� Provide assistance in developing a sound investment strategy that evaluates the options available from technology in the light of business strategy and objectives
� Set targets for financial performance and measure that performance in terms of budgeted versus actual costs
� Provide a basis for prioritizing resource usage
� Ensure sound stewardship of all assets employed in the organization
� Provide information for management’s decision making and planning requirements
� Provide a flexible and fast response to changing business circumstances
The way financial management for IT services meets these objectives varies slightly depending on the nature of the IT department whether it is a profit center or a cost center. Following the ITIL, the two may be defined as a profit center or cost center.
� Profit center: A computer services business center that operates as a separate business entity, but with its business objectives set by the organization. It provides clearly-identified products that are sold to a market. Each of the provided services carries a price tag.
� Cost center: A utility cost center that provides services to other cost centers. Performance is not measured in terms of projected or anticipated return but on how effectively and efficiently it provides services to its users.
The major difference between the two models is the extent to which they charge the users. The profit center must charge in order to generate a profit, where the cost center may charge primarily to raise cost awareness among the users. Both need to estimate and measure the costs of service provision.
In its simplest form, cost estimation begins by identifying the IT services to be provided and then estimating the total resources needed to provide them. The cost of the resources is then broken down into costs per unit of output.
The aim of cost estimation is to understand (on a user-by-user level) the proportion of the IT resources being used. To do this, it is necessary to break costs down into cost units that can be measured according to workloads used by individual users. The cost estimation is based on the following areas:
Appendix A. Service management and the ITIL 489
� Cost units: A way to accumulate and classify costs for the purpose of calculating a rate. Typical cost units include:
� Cost classification: Breaking down costs into units is not enough. There is still no way to determine how much a cost or resource is related to a particular user or group. Cost accounting can assist by further cost classification as:
� Workload estimation and forecasting: A way to calculate how each service is going to be used. Input is typically provided by capacity management.
� Standard cost calculation: A standard cost is a carefully predetermined unit cost that can be used as a basis for total cost calculations or the measure of financial performance.
� Standard cost units: Are used to determine the overall budget estimates. During the year, standard costs are monitored, and updated forecasts are made. A comparison of standard costs to actual costs enables financial management for IT services to assess the need for cost reduction or price increases.
� Cost monitoring: The identified costs are monitored on a regular basis to enable more effective financial planning and capacity planning. Monitoring is also a prerequisite to implement charging. Monitoring should be automatic.
PricingAny pricing policy must take the into account the objectives of charging, the direct and indirect costs, the demand for the commodity, the size of the market and the nature of the competitors. Based on the type of IT department (cost or profit center), charging can now be performed according to one or more of the following methods:
� Direct charging: Customers are charged directly upon receiving a service, such as charging for the delivery of a PC.
� Resource usage: Charges are based on the use of specific IT components or resources, such as disk space or CPU seconds.
490 Service Level Management
� Output related: Customers are charged for specific printouts or reports.
� Appointment: The costs of shared facilities are split up between the users of that facility or resource.
� Market related: Customers are charged based on what other organizations are charging.
Financial management for IT services and other disciplinesIt is evident that financial management for IT services is an important player in planning and conducting service management. Capacity and availability management provide input related to current and future needs for capacity that needs to be produced. Configuration management is an invaluable partner when categorizing and charging costs.
Financial management for IT services delivers information about financial performance to SLM. It also helps to shape customer behavior through the applied charging policies.
IT service continuity managementIt is essential that IT services can quickly recovered and delivered to the agreed quality, even if disaster strikes the IT infrastructure. IT service continuity management undertakes this by reducing the impact of major incidents, emergencies, and disasters. When a disruption affects critical business processes, the consequences can be severe and include substantial financial loss, embarrassment, and loss of credibility or goodwill for the organization concerned. The consequential damage can extend much further and impact staff welfare, customers, suppliers, taxpayers, shareholders, and the general public.
IT service continuity management is considered a part of overall Business Continuity Management (BCM), which is the responsibility of senior management in any organization. Both IT service continuity management and BCM are concerned with managing risks to ensure that an organization can, at all times, continue to operate to at least a predetermined minimum level. The risks that are addressed by BCM and IT service continuity management are those that could result in a sudden and serious disruption to the business, for example:
� Damage or denial of access to premises, possibly as a result of terrorism, fire, flood, or other disasters
� Loss of critical underpinning services, such as telecommunications and power
� Failure or non-performance of critical suppliers, distributors, or other third parties, particularly where key business functions have been outsourced
� Human error and technical or environmental breakdown
Appendix A. Service management and the ITIL 491
� Fraud, sabotage, extortion, or commercial espionage
� Infiltration of IT systems by viruses and other forms of malicious users
� Industrial action or other unavailability of key staff
The three objectives of IT service continuity management and BCM are:
� To reduce or avoid identified risks� To plan for the recovery of business processes if the business is disrupted� To transfer all or part of the risk to a third party
All business units or LOB within an enterprise should develop and maintain plans to continue business in case of a disaster. Figure A-17 shows the typical process model for business continuity.
Figure A-17 BCM process model
Initiate BCM
Business impact analysis
Risk assessment
Business continuity strategy
Business impact analysis
Risk assessment
Business continuity strategy
Organisation and implementation
planning
Develop business recovery plans
Implement risk reduction measures
Implement stand-by arrangements
Develop procedures
Initial testing
Organisation and implementation
planning
Develop business recovery plans
Implement risk reduction measures
Implement stand-by arrangements
Develop procedures
Initial testing
Stage 1: Initiation
Stage 2: Requirements and strategy
Stage 3: Implementation
Stage 4: Operational management
Education and awareness
Review Testing Change control Training
Assurance
Education and awareness
Review Testing Change control Training
Assurance
492 Service Level Management
Since the LOBs rely on IT services to perform their business, the IT department is heavily involved in this process. As is the case with any other business unit, the IT department should develop and maintain a set of plans to use in case of an emergency.
While the CEO is responsible for business continuity planning for the whole enterprise, the IT manager is responsible for the overall plan for the IT department. The IT manager is responsible for defining the strategy and organization to use for business recovery (stages 1 to 2). The responsibility to develop, test, verify, and maintain plans and procedures for recovery of the individual services is often delegated to the team leaders.
Meanwhile tactical stages 1 and 2 of the BCM process focus on proactive measures, to prevent the emergency from occurring, and the reactive measures. Operational stages 3 and 4 focus mainly on the reactive aspects. In stage 3, the product support teams are brought in to develop, document, and test emergency procedures. In stage 4, the procedures are tested with the users and maintained. Stage 4 must be repeated periodically to keep an awareness of what to do should anything happen.
The plans must be maintained and updated whenever major changes to the infrastructure or services are implemented. Figure A-18 shows the typical content of business continuity plans.
Each plan describes specific roles and responsibilities as well as activities to perform. It also contains supporting data, such as addresses and telephone numbers, for different phases of an emergency. These phases are best illustrated using an example of a fire in an office building of a small company as follows:
1. Emergency response and salvage: Call the fire brigade, and, if possible, prevent the fire from spreading and secure vital assets; evacuate the building.
2. Crisis management: While the fire is being handled, inform senior management, employees, families, customers, and suppliers, and maybe the media. Put stand-by accommodations and equipment on alert.
3. Stand-by invocation: After the fire is extinguished, Assess the damage and decide what action to take. Invoke standby arrangements if necessary.
4. Recover business processes: Re-establish the basic IT services and business processes in intermediate offices. Provide accommodations and transportation for employees if necessary.
5. Plan return to normal: Arrange for the normal office to be cleaned and redecorated, re-establish IT infrastructure. Make plans for move back to the normal office and normal business procedures.
6. Return to normal: Place move-back plans into effect.
Appendix A. Service management and the ITIL 493
Figure A-18 Structure and content of recovery plans
Before you establish the individual recovery plans for each business unit, you must develop and agree on a framework for the business recovery plans. This framework should include:
� A master plan to coordinate the overall recovery effort
� A series of other plans for activities that may need to be coordinated across the organization
� Plans for each key support function
� Plans for each critical business process
Figure A-19 shows a template framework.
Pla
n c
on
ten
ts
Roles and responsibilities
Roles and responsibilities
Reference data (including contract details and inventories)
Roles and responsibilities
Roles and responsibilities
Action lists
Roles and responsibilities
Roles and responsibilities
Roles and responsibilities Alert phase
Invocation& recovery
phase
Return tonormal phase
Emergency response and salvage
Crisis management
Invoke stand-by arrangements.Decision to invoke stand-by.
Damage assessment.
Recover Business processes
Plan return to normal
Return to normal
Recove
ry A
ctiv
ities
Alert•emergency response•salvage•crisis Management•damage Assessment•decide whether to invoke stand-by arrangements
Invoke stand-byarrangements•accommodation•IT systems and networks•telecommunications•power•services•suppliers•staff
Recover business processes•customer service•sales•production•distribution•…•other business processes
Business Recovery plans
494 Service Level Management
Figure A-19 Typical set of integrated business recovery plans
IT service continuity management and other disciplinesIT service continuity management involves all the other disciplines in service management, especially since each discipline must provide plans and procedures for handling an emergency. The capacity, availability, and configuration management areas are vital to the ability to develop and maintain valid plans. These disciplines provide input to the negotiations related to establishing and using the standby facilities.
Address IT service continuity management in every SLA, both internal and external. Even though nobody expects the disaster, a company that outsources its IT operation is depends almost 100 percent on the service provider’s ability to deliver. If the supply of service is cut off, chances are that the company pays a very high price, perhaps even going out of business.
Service level managementConducting SLM does not in itself guarantee high quality in the service delivery. It should be clear that several disciplines must be in place and working satisfactory to support SLM. They must provide information necessary to define and plan the
Master Plan
Overall co-ordination
Emergency Response Plan
Damage Assessment Plan
Salvage Plan Vital Records PlanCrisis Management & Public Relations
Plan
Key Support Functions
Accommodation and Services Plan
Computer Systems and Networks Plan
Telecommunications Plan
Security Plan
Personnel Plan
Finance & Administration
Plan
Critical Business Processes
Customer Services Plan
Sales Plan
Production Plan
Distribution Plan
Plans for other Business
Processes…
Overall co-ordination
Emergency Response Plan
Damage Assessment Plan
Salvage Plan Vital Records PlanCrisis Management & Public Relations
Plan
Overall co-ordination
Emergency Response Plan
Damage Assessment Plan
Salvage Plan Vital Records PlanCrisis Management & Public Relations
Plan
Emergency Response Plan
Damage Assessment Plan
Salvage Plan Vital Records PlanCrisis Management & Public Relations
Plan
Key Support Functions
Accommodation and Services Plan
Computer Systems and Networks Plan
Telecommunications Plan
Security Plan
Personnel Plan
Finance & Administration
Plan
Key Support Functions
Accommodation and Services Plan
Computer Systems and Networks Plan
Telecommunications Plan
Security Plan
Personnel Plan
Finance & Administration
Plan
Accommodation and Services Plan
Computer Systems and Networks Plan
Telecommunications Plan
Security Plan
Personnel Plan
Finance & Administration
Plan
Critical Business Processes
Customer Services Plan
Sales Plan
Production Plan
Distribution Plan
Plans for other Business
Processes…
Critical Business Processes
Customer Services Plan
Sales Plan
Production Plan
Distribution Plan
Plans for other Business
Processes…Customer Services Plan
Sales Plan
Production Plan
Distribution Plan
Customer Services Plan
Sales Plan
Production Plan
Distribution Plan
Plans for other Business
Processes…
Appendix A. Service management and the ITIL 495
service and the levels of service that must be delivered and provide feedback to indicate what levels of service have been achieved.
But what is high quality? Some users of a service may feel that they are receiving the best service ever while other users are dissatisfied with the same quality of service, even thought the IT department providing the service feels that the quality delivered is satisfactory. In most companies, the quality of service is an arbitrary issue. Therefore the judgement of the quality of service becomes a subjective matter based on personal (often short-term) criteria. This is why customers can be satisfied one week and demand the resignation of the entire IT department the next.
Before going into SLM, let’s look at service quality and customer satisfaction.
Measuring service qualityObviously, quality is an issue that closely related to expectations. Figure A-20 illustrates the relationship between the actual performance (in terms of quality) of an IT department as opposed to the way their performance is perceived by its customers. It clearly shows that sustained improvements in the quality of service delivered increase the quality perceived by the users even more than the improvements made. This goes on until the users feel that they receive a higher quality of service than what is actually delivered.
From Figure A-20, you can deduce that, even if the quality of service delivered remains the same and no improvements are made, users perceive the quality as being degraded.
Providing quality service is not enough. The service must consistently be of the same high quality both in actual delivery and in the eyes of the users. To fulfill this quality goal, quality must be defined. In the ITIL context, quality is a long-term strategic issue that defines exactly what standards to use to measure IT’s contribution to the business.
On a day-to-day, week-to-week and year-to-year basis, quality is measured in terms of operational levels of service provided by the IT department. Therefore, in the short term, quality is expressed as the achievement of specified levels of service.
Following this definition of quality, a quality service is one that meets the specified levels of service, not high levels or low levels, but the levels specified by the customers during the SLA negotiations. The IT department simply has to provide the quality of service demanded by customers. However, customer demands and customer expectations are two different (often incompatible) issues.
496 Service Level Management
Figure A-20 Actual versus user-perceived service delivery performance
Service levels and customer satisfactionConsistent delivery of the quality of service defined may lead to unhappy customers, since they perceive the service as degrading. One way to keep customers happy is to keep them satisfied. Constant high customer satisfaction means that the service is good, but it does not reveal anything about the quality of service.
Figure A-21 shows how customer satisfaction of a delivered service may be grouped:
� Generic: The most basic service. All services of this type can be easily recognized because they are all based on the same generic type.
� Expected: This is the level of service that the customer has come to expect from a specific supplier or chain.
� Generous: This level of service offers more than the customer expects, often for the same price or less than is normally the case.
� Total: This level of service is of such a standard that it is impossible to improve it further.
0
20
40
60
80
100
Time
Leve
l of Q
ualit
y
User perception of IT Performance IT Performance
Appendix A. Service management and the ITIL 497
Figure A-21 Levels of service and customer satisfaction
Determining the right level to deliver is part of SLM. Working with intangibles, such as expectations, makes it a difficult task.
From a service provider point of view, the challenge is to keep customer satisfaction as high as possible while keeping costs down. Usually, higher quality means higher costs. Since the service provider is paid only to deliver to expectations, the optimum level of service to be delivered is in the expected range. This gives the service provider a small level of flexibility to deliver a service of a slightly higher or lower quality than what is expected. This depends on such factors as customer loyalty, delivery cost, and available capacity. The service provider can choose to divert from this (typically, by providing higher quality than expected) to promote services or to cater for specific LOBs.
Determining the right level to deliver is part of SLM. Again working with intangibles, such as expectations, makes it a difficult and tricky task.
Who is the customerChances are that the service provider is paid to meet the expected level of service. However, it is not always a level of service that is perceived as satisfactory by customers. In ITIL terms, the customer is the recipient of an IT service, who is responsible for the cost of IT either directly through a charge-out system or indirectly in terms of demonstrated business necessity.
498 Service Level Management
According to this definition, the customer may use and pay for the service. In business organizations, it is not practical to negotiate service delivery on a person-by-person basis. Services are typically delivered to departments or LOB and paid for by the organization, and the one paying does not necessarily have to use the service. In this case, the one responsible for the cost is the customer, and those who are not financially responsible are called users
Usually, during negotiations between the customer and the provider, service quality is adjusted to meet the needs of both parties. This adjustment often leads to degradations in both service quality and service price without a readjustment of users’ expectations. When the provider delivers the agreed-upon level of service, the users are disappointed because they receive a lower level of service than expected. However, customer satisfaction is as expected because the sponsor receives the expected level of service.
The role of service level managementFrom the previous sections, you can see that SLM is concerned with managing the customers’ expectations to the IT department. In this external role, SLM tries to determine the customer’s requirements and meet these within the budgetary constraints of the business.
SLM also has an internal role to work together with all IT disciplines and departments to ensure that these levels of service can be delivered. This involves setting measurable performance targets, monitoring performance, and taking action when targets are not met.
In the internal role, SLM works to make every person involved with service provision aware of what is expected of them and to ensure business success. This means that every member of the IT team is aware of what they need to do to perform well and how their individual performance may affect the overall business.
Consequently, SLM works to build recognition by all parties supplying and receiving services. This is achieved through preparation, agreement, and maintenance of formal SLAs that document all the relevant details of the service. In this way, SLM bridges customers and suppliers by:
� Identifying and integrating the elements that make up service provision� Packaging these into an easy-to-understand service� Expressing that service in terms that the customer can understand, for
example, in business terms
The responsibilities of SLM can, in many ways, be compared to those of a cruise director on a cruise liner as shown in Figure A-22. The customers see all of the ship above the waterline, while the technical mechanisms that are used to achieve all the services are out of sight below the waterline. SLM’s task is to
Appendix A. Service management and the ITIL 499
manage the technical assets and support business needs while keeping the technical aspects out of the customer’s sight. The customers are more concerned with what is being delivered rather than how it is delivered.
Figure A-22 SLM: Cruise director comparison
Service level management objectivesSLM is the process of negotiating, defining, and managing the levels of IT service that are required and cost-justified. As such, it is an integral part of the overall goal of IT service management, which is the delivery of cost-effective IT services that are of known quality, are quantity-based, and meet or exceed customer expectations.
The service management goal is important because it emphasizes the quantification of services. Therefore, when defining the objectives for the SLM processes, specify the deliverables in quantifiable terms. Examples of such objectives are:
� IT services are catalogued.
� IT services are quantified in terms that both customers and IT providers understand.
� Internal and external targets of IT services are defined and agreed upon.
� Service targets are agreed upon.
The quantification of objectives applies to all three parts of the scope of the SLM process, which involves the management of IT services between:
� The customer organization and the IT services organization� The IT services organization and its external suppliers� The IT services organization and its internal departments
Of course, all of these objectives must be aligned with the overall business objectives as shown in Figure A-23.
Service Level Agreement
Internal Processes
Services toprovide
How its done
500 Service Level Management
Figure A-23 Alignment of objectives
Quantifying IT servicesA key to the success of SLM is correctly quantifying the services that are being provided. Unless there is an agreed-upon method of how services are to be measured, there is no way of knowing whether targets have been met. SLM is responsible for understanding and documenting customer requirements and translating them into a set of understandable measures.
Figure A-24 illustrates the service design process, which consists of four steps:
1. Understanding and documenting customer requirements
The basis for any service is to understand the customer’s demands and requirements. Through this process, SLM acquires detailed knowledge about the customer environment and requirements. This understanding is a prerequisite for defining the service, estimating the capacity needs, and defining the measurements needed to support service delivery.
2. Specifying external standards
With a basic understanding of the customer’s requirements and demands, SLM can define the external standards. These specify the planned deliverables (both in terms of functionality and capacity) and the measurements that are used to quantify these to the customer, using customer terminology.
Before completing the external standards, SLM must negotiate them with the customer. The external standards specify the functions and capacities that are delivered and the way in which they are measured. All of these must be accepted by the customer. The external standards, however, cannot be finalized without consent from all the teams in the IT department that are
BusinessObjectives
IT Services OrganizationObjectives
User DepartmentObjectives
ExternalSuppliers
Internal IT Departments
BusinessObjectives
IT Services OrganizationObjectives
User DepartmentObjectives
ExternalSuppliers
Internal IT Departments
ExternalSuppliers
Internal IT Departments
Appendix A. Service management and the ITIL 501
going to deliver on the promise. This consent is obtained by SLM using the internal standards.
Figure A-24 Service design process
3. Translate to internal standards
After the external standards are defined, or, rather, during the specification and negotiation processes, you must translate them into a set of standards to be used internally by the IT department.
The internal standards specify, in IT terms, the functional and capacity-related requirements that the IT department must fulfill to support the delivery and the ways the delivery are measured and optionally charged. These specifications are negotiated between SLM and the other disciplines of service management. Each of the other disciplines is committed to providing the specified levels of service.
The internal standards are produced by SLM and must be revised and renegotiated when the external standards change.
4. Produce contracts and agreement
Finally, when both the internal and the external negotiations are finalized, the external and internal standards are used to create the final documents: contracts and agreements. SLM produces a set of contracts and agreements aimed at the customer. This set includes (for internal use):
Customer requirements
knowing your customer
Specify external standards
defining service requirements (to be measurable by customer)
Customer requirements
defining service requirements (to e measurable by IT)
Produce contracts and agreements
produce documents
502 Service Level Management
– Service level requirements– External specifications– Service level agreement– Service catalog
There is another set of contracts and agreements produced to be used with external suppliers. In this set, the following items are found:
Specifying service levelsWhen the customer’s expectations are identified (through the service level requirements), the next logical step is to specify the detailed requirements to met those expectations. The goals for this specification are:
� An unambiguous and detailed description of an IT service and its components� Specification of how the service is to be delivered to meet the agreed targets� Specification of the quality control measures to consistently meet the
Figure A-25 illustrates the service specification process. During this process, you must keep the internal and external documents. External documents refer to targets that agreed upon with the customer. They provide the input for the internal documents. Internal documents refer to targets within the IT organization that must be met to comply with agreed upon customer requirements.
Another benefit of separating external and internal documents is that SLM does not have to bother the customer with unnecessary technical details. Yet it still maintains comprehensive documentation for both business and IT staff.
Appendix A. Service management and the ITIL 503
Figure A-25 The service specifications process
The use of specsheets is helpful to the SLA design process. The purpose of a specsheet is to specify, in detail, what the customer wants (external) and what consequences this has for the service provider (internal). Specsheets do not require signatures, but they are subject to document control.
The SLA and the service catalog are built from specsheets. When a service level requirements document is changed, the specsheets must be updated. This in turn leads to rebuilding the SLA. Therefore, you can use the specsheets to keep internal quality targets in line with the external demands. Figure A-26 illustrates the use of external and internal specsheets.
Seven types of documents are generated and maintained by the service specification process:
� External specsheet: The external specsheet contains information about customer demands, which are quantified as measurable targets. It also defines responsibilities for delivery and the assurance of the quality of service.
� Internal specsheet: The internal specsheet contains all the information related to the building, control, and monitoring of the components that make up the service. After completion of the specheets, the business demands should be successfully transformed into IT deliverables. It is now possible to draft the formal SLM documents:
� Service catalog: This document provides an overview of the services that are available to the customers of the IT organization. As a marketing tool, the service catalog presents a profile of the IT organization as a service provider and shows customers exactly what the IT organization can do. This also helps the IT organization manage the expectations of business more effectively.
The design of the document should be consistent with its marketing purpose. This means that it should use information that is interesting to the customer,
External Specsheets
Service LevelRequirements
InternalSpecsheets
Corporate Level
Customer Level
Service Level
Agreements
Appendix A. Service management and the ITIL 505
and expressed in non-technical language. Also the layout should be professional and interesting.
� Service level agreement: The format of each SLA depends on several factors, including the physical, cultural, and business aspects of the organization. Where the organization consists of several fairly independent business units, these should be seen as independent customers.
Often, SLAs are divided into parts: a part specific to the customer that specifies responsibilities, terms, and conditions; a general part that describes the service; and several optional appendixes specific to the actual agreement.
� Operational level agreement (OLA): The OLA is an internal document that is used only by the IT department. It serves as the internal SLA, specifying the service, responsibilities, terms, and conditions in IT terms rather than business terms.
� Underpinning contracts: Review all underpinning contracts regularly, both to accommodate changing service level requirements and as a routine measure. Underpinning contracts must be easily accessible for all participants in the SLM processes.
Underpinning services supplied in-house are also vital to the service. It is important for you to review these and introduce OLAs (if they are not already in place) to safeguard the supporting services.
� Service Quality Plan: After the SLA is negotiated and signed, the difficult task of delivering on the promise begins. Even more difficult is the ongoing monitoring and review of the services delivered to the customer. This can only be accomplished with a full understanding of the total IT service delivery situation in terms of:
– The capabilities of the IT service– Agreed-upon service levels– The demands for internal and external suppliers
This information is contained in a comprehensive Service Quality Plan, which aims to balance the customer requirements with the IT organization. The Service Quality Plan achieves this in the following ways:
– Specification of process parameters– Specification of required management information– Specification of key performance indicators
The Service Quality Plan document is the written definition of the internal targets, responsibilities, and delivery times that are necessary to live up to the agreed upon service levels.
506 Service Level Management
Bringing it all togetherTo enable service management and all the disciplines within service support and service delivery, you must consider three important factors:
� Organization� Processes� Tools
To make service management work successfully, these three ingredients have to be mixed in adequate proportions. They must all constantly undergo modifications to adapt to the needs and requirements of the company and to support the current and future IT infrastructure.
The key ingredients are interrelated so that both the organizational changes and the tools used may affect the processes. The processes may require a certain organizational structure and specialized tools. Also the tools may call for changes in the organization and impose limitations on the processes. Figure A-27 illustrates this relationship.
Figure A-27 Key ingredients of service management
OrganizationWhile the organization, roles, and responsibilities are covered in previous sections, it is important to emphasize that the ITIL model is only a suggestion. When organizing the service management organization, you may adjust the model to fit the specific needs and policies of a particular company. Chances are that, when transforming the current IT organization into a service management organization, many of the disciplines are already, at least partially, implemented. Use this as the starting point for the service management organization.
toolsprocesses
organisation
Appendix A. Service management and the ITIL 507
It is equally important not to implement all of the disciplines at one time. This can create too great a disturbance for the entire organization and, most probably, can lead to a chaotic situation that threatens the welfare of the entire company.
Implementing service management is a gradual process of taking small steps and implementing the disciplines that provide the most benefit to the company first. In most situations, the two most obvious candidates are SLM and configuration management.
Configuration management is one of the most difficult disciplines to implement. It requires a lot of hard work and discipline to combine many data repositories (often, with a lot of built-in redundancy) into one all-encompassing repository and to build the processes around it that ensure data consistency and integrity. Furthermore, the benefits are more long term.
More immediate results are realized by implementing SLM. Doing this helps to shift the focus of the entire IT department to be much more business-oriented than if no SLM was in place. This shift in focus also helps to create an atmosphere in which the need for discipline and processes supporting the other service management disciplines is nurtured.
ProcessesProcesses are the bread and butter of service management. Where the organization defines roles and responsibilities (who does what), the processes define the achievements and procedures (inputs, outputs, and how to). Without processes, there can be no service management.
In a highly-dynamic environment, such as the IT world, the organization, tools, and processes may change. The technology undergoes constant changes, and organizations are constantly aligned to the businesses. People move from one job to another and from company to company. Also companies are acquired and sold (almost at the speed of light) to the benefit of the overall business.
In the middle of the chaotic structure that forms business today, the processes are the most stable of the three, despite having to be adjusted to support both the organizations and the underlying technology. In most cases, changes in technology or organization do not affect the nature (inputs and outputs) of the processes. Of course, processes need to be aligned to business requirements and company policies. They must also be constantly monitored for relevance and optimum efficiency.
The success of service management relies more on processes than any other discipline. The execution of the processes ensures delivery of services according to the SLA. The processes ensure that incidents and problems are raised and
508 Service Level Management
that solutions are identified and implemented when the service delivery is in jeopardy. Also processes ensure consistency of the data in the configuration repository. Processes are everything. Tools are merely there to assist.
ToolsApplying tools and technology alone will solve any of the challenges of service management. The basis of a successful service management operation is well-defined processes that ensure that everyone knows what their responsibilities are, what deliverables they are supposed to provide and in what quality, and why they are doing it.
You must realize that tools are necessary to help the processes work, to automate processes where possible, and to handle the volumes. In some cases, monitoring system resources being the most obvious example, tools are a necessity to make the process work.
The two most important parameters in deciding what tools are needed to support service management are integration and openness. How well the tools integrate and enable interdisciplinary processes and data usage is the key to a successful implementation. Using tools that are open (enabling integration into the current IT infrastructure and customization to support the specific organization and its processes) is a must. Failing to do so results in islands of management that are difficult, and even impossible, to bridge. This in turn, leads to a loss of business focus, autonomous sub-optimization for specific needs, and loss of control.
Constant improvement is a mustContinuous improvement is a key element of providing high quality services and is used to empower staff to drive improvements that benefit the business and the user of services. As discussed in “Measuring service quality” on page 496, sustained improvements in the quality of service delivered increase the quality perceived by the users, improving customer satisfaction and loyalty.
Even high quality service management processes need to go through an improvement process overtime. The service manager must ensure that corrective actions progress to address any shortfalls in the process in meeting the levels of services required and expected by the business.
Appendix A. Service management and the ITIL 509
This ongoing improvement process can, for example, be achieved by periodically performing the following tasks:
� Monitoring and reporting on service achievements
Incorporate details of performance against all SLA targets, together with details of any trends or specific actions being undertaken to improve service quality, into the periodic report.
� Holding service review meetings with customers
Hold periodic review meetings on a regular basis with customers (or their representatives) to review the service achievement.
� Implement a formal Service Improvement Program
The Service Improvement Program (SIP) is a project that the organization establishes to continuously identify improvements in customer satisfaction and service quality as delivered by IT. When the analysis of service levels and achievement reports identifies issues that impact, or may impact, service quality, SLM in conjunction with problem management and availability management can initiate a SIP to identify and implement actions to overcome the issues and restore service quality.
� Maintenance of SLAs
Keep current all SLAs that are in place to ensure that the services covered and the targets for each are still relevant and represent the need of the customers.
As shown in Figure A-28, all of the disciplines within service management encompass four distinct activities:
� Planning� Delivery or deploying � Measurement and act based on measurements� Calibration and changes for improvement
At the outset, the IT organization and its customers plan the nature of the service to be provided. Next, the IT organization delivers according to the plan. It takes calls, resolves problems, manages change, monitors inventory, opens the service desk to end users, and connects to the network and systems management platforms. The IT organization then measures its performance to determine whether it is delivering superior service based on the explicit needs of the LOB. Finally, the IT organization and the LOB continually reassess their agreements to ensure that those agreements meet changing business needs.
510 Service Level Management
Figure A-28 Constant improvement of IT services
PlanningDuring the planning phase, IT and the LOB determine what services will be provided, at what levels, and for what ends. This effort leads to the establishment of SLAs, or contracts, that specify the who, what, when, and how of IT service.
The most effective SLAs focus on key issues, such as:
� The needs of the LOB� Business system availability� Device and service quality� Device usage and maintenance
SLAs succeed when they are simple, clearly stated, and measurable. Clear and concise SLAs form an IT organization’s SLM foundation, matching the LOB’s need with IT service as well as cost. For example, consider an organization that has highly-skilled, relatively self-sufficient engineers who can deal with a four-hour response time during normal business hours. That organization should not have to pay the same for their IT service as a customer-billing organization with less experienced staff running real-time, important applications that require a one-hour response time 24 hours a day.
SLAs, while conceptually simple, can quickly become complex. When specifying the term of the agreement, we recommend that you offer several basic levels of service rather than tailoring one for each organization. In this way, the total number of service options stays at a manageable level, and IT’s ability to monitor them effectively is greatly enhanced.
Appendix A. Service management and the ITIL 511
DeliveryComprehensively delivering service at a competitive cost as outlined and mutually agreed upon in the plan is a difficult task. As shown in the previous sections, delivery involves many separate disciplines that span the IT functional groups, such as network operations, application development, hardware procurement and deployment, software distribution and training, and that support all these elements. It also involves incident and problem resolution, configuration management, service request and change management, end-user empowerment, and the complete spectrum of network and systems management. Successful service delivery requires these functions to be integrated seamless.
MeasurementHow can an IT organization determine whether it is meeting the service levels established with its customer? Much of the measurement step is built around monitoring those terms outlined in the SLAs.
Therefore, an IT organization relies on technologies to actively monitor these service levels through the various delivery stages. These stages include the service delivery, monitoring of LOB assets, ensuring the health of LOB networks and systems, and managing changes to the LOB infrastructure. Two types of technologies support this measurement: real-time reporting tools and static historical reporting tools.
For example, two calls may come to the service desk simultaneously. One call is covered under an agreement that entitles the caller to a one-hour resolution, while the second is entitled to a four-hour resolution.
The service desk technology presents this information to the technician, who prioritizes the calls to ensure that both callers receive timely support. These technologies also include intelligent escalation utilities, operating in real time, to alert service desk management when agreements are in danger of being breached. Real-time reporting technologies enable management to initiate corrective action before service deteriorates.
In addition to these real-time metrics, it is important for the service desk to monitor other key performance indicators including first-call resolution rates, SLA thresholds, high-priority open problems, problem time open, and call queue by analyst. Historical reporting is also vital to management for planning purposes. The data generated by these reporting tools substantiates the discussion that IT and LOBs have when they determine the appropriate level of service required. It also assesses the effectiveness of the service delivered.
512 Service Level Management
CalibrationThe process of planning, delivering, and measuring the delivery of customized IT support to its LOB is continuous because competitive pressures, technologies, capabilities, and needs change over time. Planning is the foundation of SLM. Calibrating the plan keeps IT responsive to the continually-changing conditions throughout the entire organization.
To calibrate the service delivered, successful IT organizations employ a combination of historical reporting tools and a decision support framework. While the real-time monitoring tools described earlier assist IT in running the day-to-day operations, decision support tools provide a framework for exploring data more completely to make better-informed decisions. These tools, often built around multidimensional analysis techniques, enable IT management to see relationships in the volumes of data generated by one or more operational systems-relationships that are rarely apparent in real time or static reporting methodologies.
For example, as an IT manager, you are tasked with managing your organization efficiently and effectively. This means that you need to use the best means to support the LOB in your company, and the best means are not always the same for each LOB. For instance, let’s return to the earlier example of highly technical users, such as engineers, and less technical users, such as customer billing representatives. The engineers are relatively self-sufficient while the billing representatives relatively depend on your support. Given this, IT will likely support these two groups differently. By analyzing problem and usage data, service desk management determines how best to support each group or user, whether by telephone, e-mail, Web, voice mail, or a combination of these.
The true power of decision support frameworks and static reporting technologies is to ensure that IT remains in sync with the LOB it supports. The calibration step of SLM is an explicit reminder for IT and LOBs to constantly evaluate the effectiveness and appropriateness of the service delivered.
The power of integrationThe real power in managing your IT infrastructure as a business-oriented service is only realized when the core processes and tools used by service management are seamlessly integrated. Incidents, problems, events, changes, capacity, cost, and configuration items are all interrelated.
If an end user reports a problem with a faulty asset, service desk technicians know if a service call has been ordered for that asset. Because the problem was reported, the service desk can initiate that service request immediately. If a
Appendix A. Service management and the ITIL 513
repair technician is dispatched and determines that the asset needs to be replaced, the technologies generate the appropriate change order and initiate that process. When the change is approved and executed, the asset discovery tools confirm the work, close the change request, and report the new status in the asset management system. Finally, if the same end user initiates a second call, the service desk technician sees the updated inventory and a history of the change.
In addition to the disciplines mentioned in the previous example, network and systems management integration encompass other enterprise IT technologies. These include technologies for software distribution, event management, systems management, applications management, remote control, and security. The seamless integration of these technologies can reduce the burden for many labor-intensive IT operations.
514 Service Level Management
Appendix B. Important concepts and terminology
This appendix provides an important list of terms and definitions, in the context used in this redbook.
IBM Tivoli Service Level Advisor concepts This section defines the terms related to IBM Tivoli Service Level Advisor.
� Availability: Measurement of how often a service is accessible to a defined customer set, measured as a percentage of up-time versus total time. Scheduled outages (no-service periods) are not counted against the availability measurement.
� Breach value: The value at which a service level objective (SLO) is considered as not being met. A service level agreement (SLA) is violated if a breach value for one or more of its service level objectives is exceeded.
� Business schedule or schedule: A timeline of the operations of a business, with the timeline segmented into different operational states. Valid states include peak, off hours, and no service (scheduled downtime for maintenance).
� Change: An action to modify the properties of a customer order.
� Component: The basic unit of service used to create a service offering. It is an entity about which measurements are collected for reporting purposes. For example, a component can be a specific Web site or a particular application running on a Web application server.
� Component type: A grouping mechanism to group similar types of system resources (firewalls, servers, routers, etc.) that have common metrics. Each component type in the data model has a set of metrics and attributes that apply to all components of that type. The Tivoli Enterprise Data Warehouse includes many types of monitoring data. In IBM Tivoli Service Level Advisor, you can selectively filter for those component types of interest. The component type specifies the kind of enterprise resource that is evaluated by the SLO.
� Configure service level objective: The process of customizing a customer order by selecting the resources to include in the SLA according to the type of measurements specified in the SLO definition.
� Customer: A party that enters into an SLA with the provider of a particular service. Customers are associated with available SLA orders. Customers can be given access to the results of SLA evaluation and trend analyses to validate their SLAs. Customers can be internal (members of a department within the enterprise) or external (a member, department, or company) associated with a service provider.
Note: A service may be unavailable even though the components used to provide the service are all available, and vice-versa.
516 Service Level Management
� Customer order: The action of setting up an SLA by associating customers with service offerings.
� Data collection: The process of obtaining performance and availability metric data from source applications for storage and later evaluation.
� Dependency: The relationship between SLAs in which the validation of one SLA depends upon the validation of another SLA. Typically used when one or more SLAs, which are internal to a service provider organization, are monitored for the purpose of guaranteeing an external customer’s SLA.
� End time: The end time of a defined period in the schedule that is associated with a particular state of peak, standard, or no-service hours.
� Evaluation: The examination of performance and availability data from one or more monitoring applications to determine if a violation or a trend toward a violation of an SLA has occurred.
� Frequency: Can have one of the following meanings:
– In business schedules: How often the associated period is active– In metric evaluation: How often the evaluation is to be performed
� Measurement and metric: A standard of measurement or a measurable quantity, associated with guaranteed service levels to create SLOs. Metrics evaluate performance, availability, or utilization of resources, such as response time, CPU, and disk utilization.
� Measurement source: The source application from where a measurement originates. Performance and availability measurements are collected by the source application and written to a central data warehouse for processing later. A measurement source can provide measurement for one or more components. Examples of measurement sources are:
– IBM Tivoli Monitoring for Transaction Performance – IBM Tivoli Business Systems Manager– IBM Tivoli Enterprise Console– IBM Tivoli Monitoring
� No-service: The state of a period in a business schedule in which SLAs are not evaluated. This time is typically used for down time or maintenance hours that do not count against the SLOs established in SLAs.
� Offering: A service with guaranteed service levels. They are associated with business schedules and form the building blocks for customer orders and SLAs. They can be differentiated to provide service level choices to customers (such as Gold, Silver, and Bronze levels of service). An offering must be in the published state to be included in an SLA order.
� Offering component: Supplies the metrics for offerings and customer orders. At the time of an offering creation, one or more offering components are
Appendix B. Important concepts and terminology 517
selected. IBM Tivoli Service Level Advisor checks to determine the number of measurement sources for a component.
� Offering state: The state of a service offering. Valid values include:
– Draft: The offering is being created. It is not yet published but is available to be included in a customer order.
– Published: The offering has been defined and is made available for inclusion in customer orders.
– Withdrawn: A previously published offering has been removed from the list of available offerings and can no longer be included in customer orders.
� Order: The process by which an SLA is entered into the Tivoli Service Level Management solution. It includes customer information, a service offering, and the specific elements that make up the SLA.
� Order ID: The assigned identification number that distinguishes one customer order from another.
� Peak: The state of a period in a business schedule that defines hours in which levels of service are the most critical to the customer during peak business hours. Typically it defines a more severe level of service than that specified for standard hours.
� Period: A component of a business schedule that divides the timeline into named intervals, such as critical, peak, prime, standard, low impact, off hours, and no service. The general meaning of those intervals is defined by the customer during SLA negotiations. For example, you may define different SLOs (thresholds) for each period, depending on how critical that particular period is for the business.
� Published offering: An offering that is complete and made available to customers to be included in an SLA.
� Realm: A grouping of customers that is used to organize customer information and, in some cases, to control access to that information. Customers may be grouped by region, by company, by a division within a company, or by some other logical grouping. Customers can be assigned to one or more realms.
� Reports: Summarize the evaluated measurement data for an SLA. IBM Tivoli Service Level Advisor provides the following types of reports:
– Results reports show monitoring information for the peak or standard states of a specified metric in an order.
– Violations reports display the SLA violations during a specified period of time.
– Trends reports display trends toward the violation of breach values, that is, tendencies to violate SLAs.
518 Service Level Management
� Resource: A hardware, software, or data entity that is managed by Tivoli management software. In IBM Tivoli Service Level Advisor, the entity is monitored by performance and availability monitoring applications.
� Rollback: The capability of IBM Tivoli Service Level Advisor to return to the last valid state if there is a failure during customer order deployment or cancellation, enabling failed orders to be restarted or deleted.
� Service: Any task performed by one person or group for another person or group. Refer to the definition provided in Chapter 2, “General approach for implementing service level management” on page 23.
� Service element: A component that provides a piece of an overall service. Service elements are the building blocks used to construct service offerings and customer orders.
� Service level agreement (SLA): An agreement or contract between a service provider and a customer of that service, which sets expectations for the level of service with respect to availability, performance, and other measurable objectives.
� Service level objective (SLO): A specification of a metric that is associated with a guaranteed level of service that is defined in an SLA. The SLO is part of an offering and is associated with a business schedule so that different breach values can be set for each schedule period. Choices include peak, critical, standard, prime, off hours, and no service.
� Service level management (SLM): The disciplined, proactive methodology and procedures used to ensure that adequate levels of service are delivered to all IT users in accordance with business priorities and at acceptable cost. Effective SLM requires the IT organization to thoroughly understand each service it provides, including the relative priority and business importance of each. SLM is the continuous process of measuring, reporting, and improving the quality of service provided by the IT organization to the business.
� Service offering: A defined level of service that associates a business schedule, including specified peak, standard, and no-service periods, with particular metrics to be evaluated.
� Service provider: A person or organization that provides a service to a customer based on an SLA.
� SLA state: The state of an active SLA. It can assume one of the following values:
– Violation: One or more breach values have been exceeded, indicating that the agreed-upon level of service is not being met.
– Steady: All levels of service are currently being met, and there is no detected trend toward a violation of the SLA.
Appendix B. Important concepts and terminology 519
– Trend: A trend toward a future violation of an SLA has been detected.
– None: The SLA is not fully processed yet. This is an initial state.
� Standard: The state of a period in a business schedule that defines hours in which levels of service are not as critical as during peak business hours.
� Start time: May have one of the following meanings:
– In defining business schedules, this is the start time of a defined period in the schedule that is associated with a particular state of peak, standard, or no-service hours.
– In defining the schedule for metric evaluation, this is the time that the evaluation will be initiated.
� Trend: A series of related measurements that indicates a defined direction or a predictable future result.
� Trend analysis: The examination of related measurements to determine whether a breach level for a level of service is being approached, so that corrective action can be taken to prevent a violation of an SLA.
� View: The display of the details of a business schedule, period, offering, customer, or realm.
� Violation: The state of an SLA when one or more SLOs are not met. SLA violations can be used to trigger a remediation policy for affected customers.
� Web report: SLA results made available through a series of Java servlets. Each report servlet can be integrated independently into the service provider’s existing Web content. Using Web server authentication, report data can be restricted by customer or realm. Displayed on a user’s Web browser showing the results of evaluation and trend analysis of SLA data to validate an SLA or to assist in identifying problem areas and taking corrective action.
� Withdrawn order: An order that is removed from the list of active orders that is being managed to guarantee levels of service.
� Withdrawn offering: An offering that was published, but which has since been withdrawn and is not available to customers for inclusion in an SLA.
Note: Withdrawn orders are not deleted, but are no longer active.
520 Service Level Management
IBM Tivoli Business Systems Manager conceptsIn IBM Tivoli Business Systems Manager, there are several concepts that you should be familiar with to work with the product. Learning about the following concepts helps you to have a better understanding about the product:
� Business systems� Object discovery processing� Event propagation
Business systemsA business system is a representation of a group of diverse but interdependent enterprise resources that are used to deliver specific business functionality. These resources can include applications or other resources that are distributed over different networks and installed on different platforms. For example, a Web banking application that is distributed over mainframe database systems, application servers, firewall, intranet and Internet can be considered a business system.
A business system is a hierarchical view that displays IT resources that relate to a business process. IBM Tivoli Business Systems Manager provides a flexible user interface that enables the viewing resources that are of interest to a user (such as a Manager of the Web Services group) or a group of users (such as the Web banking support team). It does this in ways that reflect the business process that is monitored, the so-called business system.
A business system consists of:
� The system resources that provide the business function
� The appropriate prioritization of resources used to determine the health of the business system
� The relationship between system resources that may be shown
A business system can be created from the console or automatically upon receiving events. Effective business systems consider only resources that are important to the target business systems. An important factor in defining business systems is who will actually use the business system. A help desk may need a business system based more on the physical organization of systems and applications. However, a CIO may want a business system that shows all the business processes in the enterprise, but not at the level of detail needed by the help desk.
Business systems can be built according to the following aspects:
� An application or a set of applications (Web banking)� A department (accounting department)
Appendix B. Important concepts and terminology 521
� A vertical area of responsibility (International Technical Support Organization) � A geographic region (Europe, Middle East, Africa (EMEA) region for IBM)
Resources are represented as icons within the business system. To easily determine the root causes of a business system outage, IBM Tivoli Business Systems Manager provides several viewing perspectives.
� Tree view: Lists the hierarchy of all resources
� Hyperview: The best viewing option for displaying a large number of resources in one glance
� Table view: Shows resources in a table format and is equipped with column filtering and sorting capabilities
� Topology view: Shows the topology of the business system to the desired level of detail
� Web Console: Shows browser versions of the tree view and hyperview
� Executive dashboard: Shows a high level overview of the business system status
In addition, you can invoke the following views from any resources in the business system:
� Business impact view: Shows resources that are affected and their relationship to the impact causing resource
� Event view: Displays the events that triggered the resource state change
Object discovery processingBefore IBM Tivoli Business Systems Manager can monitor resources and their performance characteristics, its database must be populated with discovered resources. The process of discovery is different for Distributed Discovery and for z/OS Discovery.
Distributed DiscoveryFor distributed environments, an object type must be registered to IBM Tivoli Business Systems Manager. Then the object must then be discovered by the discovery process. This enables the Tivoli Business Systems Manager to identify and classify resources. Distributed resources can be discovered and monitored through the following interface:
� Agent listener
IBM Tivoli Enterprise Console events can be forwarded through this interface. IBM Tivoli Enterprise Console rules can be developed to forward events to the IBM Tivoli Business Systems Manager database. The first event from a resource triggers the creation of the object as the discovery process.
522 Service Level Management
� Common listener
The common listener transport provides bulk and delta transactions. The bulk transaction populates the IBM Tivoli Business Systems Manager database with snapshots of the instrumented environments. The delta transaction keeps the IBM Tivoli Business Systems Manager database updated as new resources are introduced or removed from the instrumented environments.
z/OS DiscoveryIBM Tivoli Business Systems Manager installation requires you to install three started tasks and run them on each z/OS system that feed into IBM Tivoli Business Systems Manager. These started tasks perform a limited discovery of the objects running on the z/OS system. They feed the data to IBM Tivoli Business Systems Manager, where the objects are automatically discovered and placed.
For more detailed discovery, IBM Tivoli Business Systems Manager uses NetView for the z/OS family of products. It uses REXX routines within NetView to discover IMS, DB2, and CICS resources. These resources are sent automatically to IBM Tivoli Business Systems Manager and correctly placed in the object hierarchy.
Event propagationEvent processing is the process of capturing business-critical events from IBM Tivoli Enterprise Console or common listener and routing them to IBM Tivoli Business Systems Manager. The events are then processed and stored in the IBM Tivoli Business Systems Manager database.
Events affect the status of a resource. State changes are propagated upward to affect the resource’s parents, to facilitate the determination of the status of business systems. Propagation is the process that allows events to escalate or propagate up the All Resources view or business systems. Propagation is implemented by generating a child event to the parent resources.
In a distributed implementation, all events are of the type exception. Depending on their priority, exceptions can be processed to affect the object alert state. If the exception threshold for the object in a specific priority bucket is exceeded, the object alert state is changed and child events are generated.
In enterprise implementations, events can be either exceptions or messages. Messages are an object status event, and only one message can ever be posted against an object at a time. Examples of typical message event statuses are Up, Down, and Abended.
Appendix B. Important concepts and terminology 523
Object typesIn IBM Tivoli Business Systems Manager, an object type represents an IT component class, such as a machine, database or application. The object type can have multiple event sources mapped to that object type. Examples of object types can include Node, WindowsServer, OracleDatabase, CustomApp, Hub, and NetworkDevice.
Each object type can have:
� An icon associated with it� Events that can appear under it� A set of tasks associated with it� One or more Uniform Resource Locators (URLs) associated with it� One or more local applications associated with it
An object type can have multiple instances. Each actual IT component is an instance of that object type. For example, if you have an object type of NTServer and you have three NT servers called ServerA, ServerB, and ServerC, then you would have three instances of NTServer, which are NTServer on ServerA, NTServer on ServerB, and NTServer on ServerC. The Properties Page for each object instance lists the events that are received for that object instance.
Object types can be as granular as desired. Consider these points:
� All instances of a given object type will have the same icon, tasks, and URLs.
� Each instance will display only the events that have come in for that instance, even though the object type must have all possible events types for that object type defined to it.
� An instance of any given object type can appear in any or all business systems.
In an IBM Tivoli Business Systems Manager V3.1 distributed implementation, the only available object type is the generic object type.
Generic object typesGeneric object types are usually defined for events that come from sources other than Tivoli Distributed Monitoring or IBM Tivoli Monitoring, or more precisely, when the event is forwarded to event enablement with the binary ihstttec. Only generic events can appear under generic object types. The only way to post a DM event to a generic object instance is to treat the event as a generic event.
In order for an instance of a generic object type to appear on an IBM Tivoli Business Systems Manager console, a generic event must be forwarded to IBM Tivoli Business Systems Manager for the given instance. You can use scripts to
524 Service Level Management
send artificial events to IBM Tivoli Business Systems Manager if you want to populate it ahead of time with object instances.
Other useful IBM Tivoli Business Systems Manager terminologyThis section provides other useful IBM Tivoli Business Systems Manager terminology:
� Resource: Any real object in Tivoli Business Systems Manager.
� Physical resource: Any resource in the All Resources view (sometimes referred to as the physical tree).
� Business system: Any resource in the business system tree.
� Business system folder: An object created using Insert Business System representing a folder (container).
� Business system resource: An object that represents a physical resource in the business system tree. The business system resource is linked to the physical resource.
� Business system folder shortcut: An object that represents a business system folder in the business system tree. The business system folder shortcut is linked to the business system folder.
� Business system shortcut: Alternative for business system folder shortcut.
� Source: The business system folder or physical resource from which the business system shortcut or business system resource was created.
� Folder: Business system folders and business system folder shortcuts.
� Shortcut: Business system folder shortcut or business system resource.
� Executive dashboard: The high level view of executive view services.
� Executive view service: Can be defined for a business system folder or business system shortcut. Business system folders and shortcuts that are defined as services can then be configured to be displayed for the EXEC or IT_EXEC executive dashboard roles.
� Executive view service resource: Is defined for a business system resource. It cannot be configured to be displayed for the EXEC or IT_EXEC executive dashboard roles. It only provides an impact or problem statement.
Appendix B. Important concepts and terminology 525
526 Service Level Management
Appendix C. Scripts and rules used in this book
This appendix contains the scripts and IBM Tivoli Enterprise Console rules used in the case study scenarios presented in this redbook.
Example C-1 is used in Chapter 5, “Case study scenario: IRBTrade Company” on page 197, to forward events from IBM Tivoli Enterprise Console (TEC) to IBM Tivoli Business Systems Manager.
The perl script invoked by the IBM Tivoli Enterprise Console rule in Example C-1 (D:/tbsmd/bin/tec2tbsm.pl) is the customized version of the sample script send_to_TBSM.pl. This sample script is shipped with the IBM Tivoli Business Systems Manager product. You can find the original perl script in the %BINDIR% TDS\ EventService\ samples\ scripts\ directory on the IBM Tivoli Enterprise Console server after you install the IBM Tivoli Business Systems Manager Event Enablement component. Refer to the send_to_TBSM.pl sample script for additional details.
After you install or configure the TEC rule and script on the IBM Tivoli Enterprise Console server, examine the sample TEC events listed in Example C-2.
Example: C-2 Sample TEC events processed by the tec2tbsm_forward rule
1~5888~1~1097776526(Oct 14 13:55:26 2004)### EVENT ###TMTP-PERF-VIOLATION-BELOW;fqhostname='bc1srv6.itso.ral.ibm.com';parentTransactionId='null';rootTransactionId='5B976E80DBC0736F3B7F1C474C1AFACF0000006600000000';msg='Management Policy "TradeOnlineQuoteResponse", Transaction "TradeOnlineQuoteResponse.*" exceeded a lower performance threshold of 20 seconds. The transaction time is 13.088 seconds.';transactionName='TradeOnlineQuoteResponse.*';managementPolicyName='TradeOnlineQuoteResponse';userName='.*';hostname='bc1srv6.itso.ral.ibm.com';applicationName='GenWin';startTime='1096922434000';violatedThresholdValue=20.0;severity=MINOR;hostName='bc1srv6.itso.ral.ibm.com';returnCode=0;transactionDuration=13.088;transactionId='5B976E80DBC0736F3B7F1C474C1AFACF0000006600000000';date='Oct 4, 2004 4:40:47 PM EDT';thresholdId=113;END
### END EVENT ###PROCESSED...
Appendix C. Scripts and rules used in this book 529
The tec2tbsm_forward rule invokes the tec2tbsm.pl script. It results in tec2tbsm.pl script issuing the ihstttec application programming interface (API) calls (as shown in Example C-3) to map the events to IBM Tivoli Business Systems Manager resource type. Then it sends the events to IBM Tivoli Business Systems Manager for discovery, status change, or both.
The approach in Example C-3 (using an IBM Tivoli Enterprise Console rule and script) is one of the many ways to integrate IBM Tivoli Enterprise Console events into the IBM Tivoli Business Systems Manager distributed solution. Using this method to evaluate the event and then forward IBM Tivoli Enterprise Console events to IBM Tivoli Business Systems Manager via the ihstttec API call allows the most flexibility in mapping IBM Tivoli Enterprise Console events to IBM Tivoli Business Systems Manager resource types. It also allows any automation (IBM Tivoli Enterprise Console rules, etc.) that is in place to take effect before forwarding events to IBM Tivoli Business Systems Manager.
Example: C-3 Sample ihstttec API calls invoked by tec2tbsm.pl script
TCP/IP Transmission Control Protocol Internet Protocol
TDS Topology Display Services
TDW Tivoli Data Warehouse
TEC IBM Tivoli Enterprise Console
TEDW Tivoli Enterprise Data Warehouse
TMR Tivoli Management Region
TMTP IBM Tivoli Monitoring for Transaction Performance
TSLA IBM Tivoli Service Level Advisor
UDB Universal Database
URI Universal Resource Identifier
URL Universal Resource Locator
531
532 Service Level Management
Related publications
The publications listed in this section are considered particularly suitable for a more detailed discussion of the topics covered in this redbook.
IBM RedbooksFor information about ordering these publications, see “How to get IBM Redbooks” on page 536. Note that some of the documents referenced here may be available in softcopy only.
� IBM Tivoli Monitoring Version 5.1: Advanced Resource Monitoring, SG24-5519
� Early Experiences with Tivoli Enterprise Console 3.7, SG24-6015
� Tivoli NetView 6.01 and Friends, SG24-6019
� End-to-End e-business Transaction Management Made Easy, SG24-6080
� Introduction to Tivoli Data Warehouse, SG24-6607
� Tivoli Business Systems Manager V2.1 End-to-end Business Impact Management, SG24-6610
� Introducing IBM Tivoli Service Level Advisor, SG24-6611
� IBM Tivoli Monitoring for Databases: Database Management Made Simple, SG24-6613
� Introducing IBM Tivoli Monitoring for Web Infrastructure, SG24-6618
� IBM Tivoli Monitoring for Business Integration, SG24-6625
� Unveil Your e-business Transaction Performance with IBM TMTP 5.1, SG24-6912
� Business Service Management Best Practices, SG24-7053
� Implementing Tivoli Data Warehouse V 1.2, SG24-7100
How to get IBM RedbooksYou can search for, view, or download Redbooks, Redpapers, Hints and Tips, draft publications and Additional materials, as well as order hardcopy Redbooks or CD-ROMs, at this Web site:
building SLAs 162bulk discovery 61bulk transaction 523Business Continuity Management (BCM) 491business decomposition 134business goals 55–56, 65, 72, 79, 87, 94, 206business information 30business knowledge base 19business management 40business owners 26business process 18, 134business process-based business system 122business recovery 493business representatives 28business schedule 516business service
basing SLAs 58functions 32monitoring from this perspective 57
business service management (BSM) 17business system 18, 59, 113, 115, 117, 525
best practices for building 120business process based 122concept 59constructs 103creation 119Drag and Drop 119folder 525folder shortcut 525hyperview 126propagation rules 59relationships 59resource 525resources 59shortcut 525technology-based IBM Tivoli Business Systems Manager 121topology view 127types 121views 60Web Console 129
Business System Shortcut (BSS) 120business system tree 118business system view 60, 521
control 455identification 455status accounting 455verification 455
configuration management database (CMDB) 455, 458Configuration Repository 455console consolidation 56console server 64constructing services and business systems 20constructs 35consumers 499contingency planning 450continuous improvement 48, 50, 205, 312control center server 70cost
cost center 489cost control 9cost management 43, 450
system 489cost of support 48costing 487creating offerings 158crisis management 493critical path management 57Critical Watch List (CWL) 129Crystal Enterprise Professional for Tivoli 104Crystal Enterprise Server 71customer 498, 516
order 517requirements 501satisfaction 497segregation 76transactions 79
CWL (Critical Watch List) 129cycle 96
538 Service Level Management
cycle time 96
Ddashboard roles 525data collection 517data mart 66, 68, 70
ETL 67–68database server 63defining services in TBSM 187Definitive Hardware Store (DHS) 473Definitive Software Library (DSL) 452, 472delta transaction 523demand management 478, 482dependency 517deployment review session 48design specifications 16desired quality 32DHS (Definitive Hardware Store) 473discovering resources 61discovery by event 61discovery processing 522Distributed Discovery 522documentation 10Drag and Drop business system 119DSL (Definitive Software Library) 452, 472dynamic resource 164Dynamic Resource List 407
Eeffectiveness of SLM 50efficiency of SLM 49emergency response 493end time 517error control 463escalating SLA events 186escalation 459ETL
frequency 152processes for Tivoli Service Level Advisor 152runs 152
IBM Tivoli Business Systems Manager 214IBM Tivoli Monitoring 212IBM Tivoli Monitoring for Transaction Perfor-mance 213IBM Tivoli Service Level Advisor 216Tivoli Data Warehouse V1.2 216
integration with TBSM 186integration, the power of 513internal metric 112internal specsheet 505internal standards 502IT domains 39IT Infrastructure Library (ITIL) 5, 448
IT knowledge base 19IT management 41IT representatives 29IT service 18IT service continuity management 477, 491IT_EXEC 525ITIL 22ITIL (IT Infrastructure Library) 5–6, 22, 448
knowledge of the business function 10known error 451, 462–463
Llibarm library 81life cycle
of incident 460of service 453
lines of business (LOB) 4, 449live servlet sessions metric 171LoadGEMIcons command 226LOB (lines of business) 4, 449location of CI 457lower-level business system 231
Mmaintainability 485maintenance period 116, 175maintenance schedule 175managing expectations 9mean time between failure (MTBF) 485mean time between system incidents (MTBSI) 485measurement 517measurement layer 54measurement metrics 34measurement source 517message 118, 523
MsmtRul table 159MsmtTyp table 159MsmtTyp_ID column 159msrc_cd value 152MTBF (mean time between failure) 485MTBSI (mean time between system incidents) 485
Nnegotiating OLAs 28negotiating on SLAs 37negotiating SLAs 28no service 517No Service period 175notional charging 488
Oobject discovery 61, 522objects 117occurrence 97offering 75, 102, 517offering component 517offering evaluation 158offering resource types 158offering state 518offerings 158, 375Office of Government Commerce (OGC) 448off-the-shelf 475OGC 448OLA (operational level agreement) 13, 506OLA negotiation 28one-of-a-kind 475ongoing management 15ongoing SLM process 44operational level agreement (OLA) 13, 506order 518order ID 518OS/390 adapter 102owner of CI 457
activities 480period 518periodic reviews 49physical domains 38physical resource 525physical tree 525policy-based correlators 82Populate Measurement ETL step 162Populate Registration ETL step 162predictive management 55pricing 490priority of incident 462proactive improvement of SLM process 50proactive integration tools and processes 51proactive management of service levels 51proactive response to business changes 50problem 451problem control 463problem management 107, 451, 454, 463
tasks 465problem request processor 107problem tickets 107process improvement model 25processes 10product mapping 54production 466profit center 489project manager 27propagation 118, 523propagation of alerts 118propagation rules 103propagation server 64
Index 541
published offering 518
QQoS (Quality of Service) 87, 191
components 312quality 496Quality of Service (QoS) 87, 191, 312quality of service level improvement 48quality perception 26, 31quality service 459, 496quantifying IT services 501
RRational Robot 82, 192, 213RDBMS Interface Module 92realm 75, 518real-time faults 47real-time management 55real-time monitoring 102Redbooks Web site 536
Contact us xvirediscovery 61Registration ETL 153release management 454, 472, 474
approach 24benefits 7challenges 7components 10convergence with business service manage-ment 18definition 5effectiveness 50efficiency 49external role 499functions 12goals 7implementation 25, 35integration 20internal role 499life cycle 74life cycle with IBM Tivoli Service Level Advisor 73management tools 38measurement data mart 72, 78monitoring 38objectives 500ownership 28planning 26pros and cons 6responsibilities 499Tivoli Service Level Advisor 72
service level manager 28service level objective (SLO) 14, 519
sponsor 499standard 520stand-by invocation 493start time 520state of CI 457status accounting 455steady 519STI (Synthetic Transaction Investigator) 191STI Recorder 82Synthetic Transaction Investigator (STI) 82, 191
Index 543
Ttable view 60tapmagent 81target ETL 66technical information 30technology-based IBM Tivoli Business Systems Manager business system 121threshold 97ticket request processor 108tiered SLA 171, 278Tivoli Business Systems Manager
architecture 62console 129overview 117roles 132roles in SLM 132services 187system types 121user roles 132views in SLM 125
Tivoli Data Warehouse 64architecture 68overview 64reporting 103V1.2 instrumentation 216
TMTP object 190tools 10topology view 60, 127total service 497tree view 60, 125trend 520trend analysis 520trends calculation 181types of business system 121
UUC (underpinning contract) 13, 165underpinning contract (UC) 13, 165, 506understanding services 29urgency 462urgent change procedure 470urgent changes 470usage information 32user perception 26user roles in TBSM 132utility cost center 489
Vview 520violation 519–520violations adjudications 170visibility of SLA breaches 58visibility of SLA trends 58volume customization 475
Wwarehouse agent 71warehousing data 20Web Console 129
application server 64Web Health Console 95Web report 520withdrawn offering 520withdrawn order 520work space 61, 128
544 Service Level Management
workload catalog 480workload management 478, 480
objectives 480workloads 480
XXML BSV definition 121XML Business System 116
Yyellow event 144yellow objects 140yellow status of resources 131
Zz/OS data 117
Index 545
546 Service Level Management
(1.0” spine)0.875”<->
1.498”460 <->
788 pages
Service Level Managem
ent Using IBM Tivoli Service
Level Advisor and Tivoli Business Systems M
anager
®
SG24-6464-00 ISBN 073849173X
INTERNATIONAL TECHNICALSUPPORTORGANIZATION
BUILDING TECHNICALINFORMATION BASED ONPRACTICAL EXPERIENCE
IBM Redbooks are developed by the IBM International Technical Support Organization. Experts from IBM, Customers and Partners from around the world create timely technical information based on realistic scenarios. Specific recommendations are provided to help you implement IT solutions more effectively in your environment.
For more information:ibm.com/redbooks
Service Level Management Using IBM Tivoli Service Level Advisor and Tivoli Business Systems Manager
Integrate Tivoli Business Systems Manager and Tivoli Service Level Advisor
Map business service management to service level management
Achieve proactive service level management
Managing IT costs requires repeatable and measurable processes such as the best practices for service level management (SLM) documented in the IT Infrastructure Library (ITIL). Central to the ITIL best practices are the service management processes. These are subdivided into the core areas of service support and service delivery.
This IBM Redbook takes a top-down approach that starts from the business requirement to improve service management. This includes the need to align IT services with the needs of the business, to improve the quality of the IT services delivered, and to reduce the long-term cost of service provision. It focuses on how clients accomplish this by implementing SLM processes supported by IBM Tivoli Service Level Advisor and IBM Tivoli Business Systems Manager.
For IT managers and technical staff who are responsible for providing services to their customers, use this IBM Redbook as a practical guide to SLM with IBM Tivoli products. It takes you from a general outline of SLM to specific implementation examples of banking and trading that incorporate the Tivoli monitoring products.