Date post: | 06-Apr-2018 |
Category: |
Documents |
Upload: | angel-broking |
View: | 220 times |
Download: | 0 times |
8/3/2019 Shree Cement Result Updated
http://slidepdf.com/reader/full/shree-cement-result-updated 1/11
Please refer to important disclosures at the end of this report 1
Y/E Mar. (` cr) 3QFY2012 2QFY2012 % Chg qoq 3QFY2011 % Chg yoy
Net sales 1,259 855 47.3 780 61.4
Operating profit 332 199 66.8 152 119.2
OPM (%) 26.4 23.3 310bp 19.5 697bp
Net profit 59 38 53.8 27 115.3
Source: Company, Angel Research
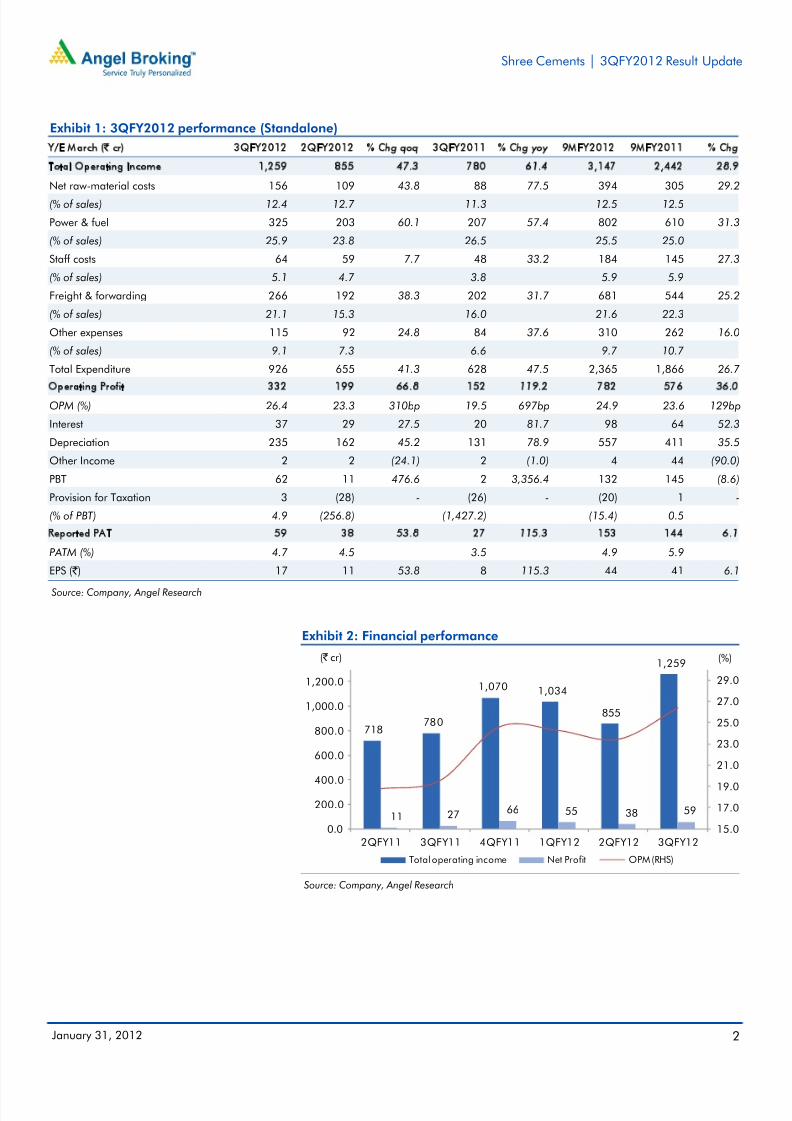
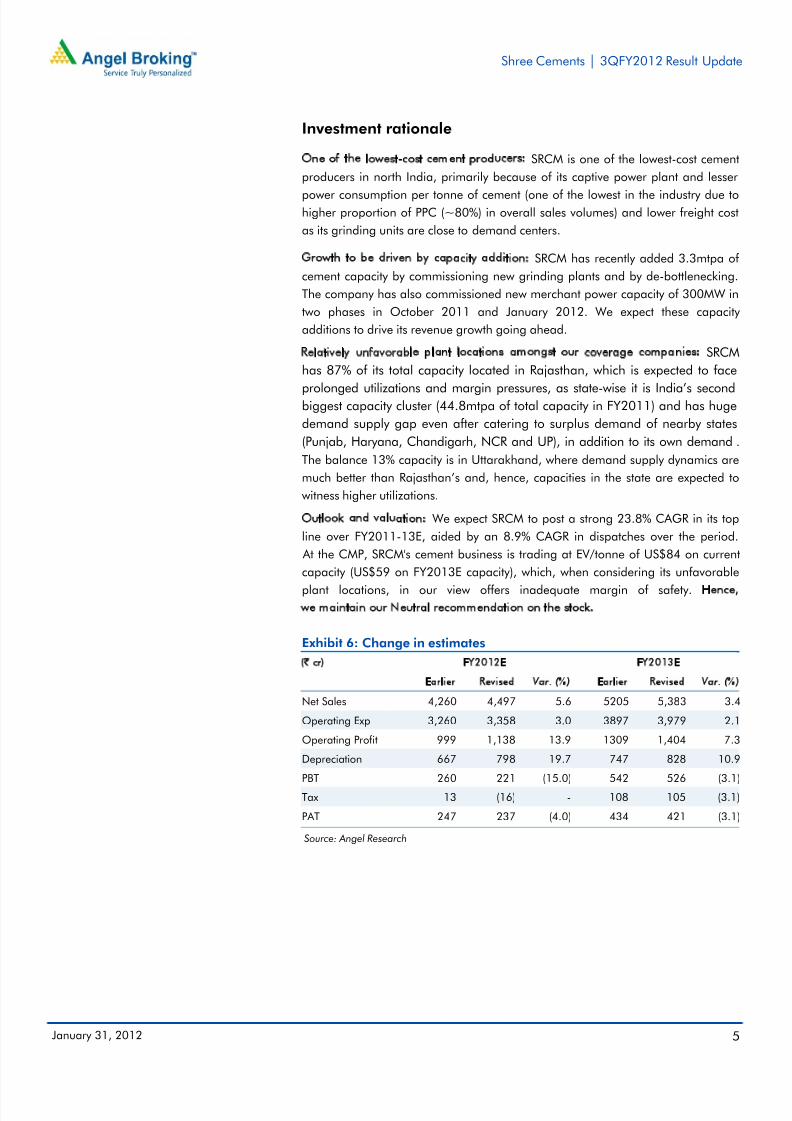
During 3QFY2012, Shree Cement (SRCM) posted 115.3% yoy growth in its
bottom line to ` 59cr. Bottom-line growth was mainly driven by the cement
business, which posted substantially higher realizations and reasonable 8.8%growth in volumes. PAT growth could have been higher, but it was restricted to a
large extent by the sharp increase in depreciation cost (78.9% yoy) on account of
capitalization of 150MW of new power capacity. We remain Neutral on the stock.
OPM up by 697bp yoy, 310bp qoq: SRCM’s total operating income grew by
61.4% yoy to ` 1,259cr, primarily on account of higher cement realization. The
company’s cement realization improved by 33.2% yoy to ` 3,794/tonne (up
11.4% qoq) on account of higher cement prices and higher cement sales as a
proportion of total cement and clinker sales (98% in 3QFY2012 vs. 88% in
3QFY2011, as it had 1.5mtpa of incremental grinding capacity operational).
Revenue of the power business also grew by 429% yoy to ` 177cr due to a 244%
increase in sale volumes to 256.4MUs. This revenue included ` 66cr from powertrading operations. The company’s overall EBITDA margin expanded by 697bp
yoy, as higher cement realization negated the cost pressures witnessed in freight
cost and other expenses.
Outlook and valuation: We expect SRCM to post a strong 23.8% CAGR in its top
line over FY2011-13E, aided by an 8.9% CAGR in dispatches over the period.
At the CMP, SRCM's cement business is trading at EV/tonne of US$84 on current
capacity (US$59 on FY2013E capacity), which, when considering its unfavorable
plant locations, in our view offers inadequate margin of safety. Hence,
we maintain our Neutral recommendation on the stock.
Key financialsY/E March (` cr) FY2010 FY2011 FY2012E FY2013E
Net Sales 3,642 3,512 4,497 5,383
% chg 34.2 (3.6) 28.0 19.7
Net Profit 676 210 237 421
% chg 17.0 (69.0) 12.9 77.6
FDEPS(Rs) 194.0 74.1 68.0 120.7
OPM (%) 39.5 25.2 25.3 26.1
P/E(x) 11.6 30.4 33.2 18.7
P/BV(x) 4.3 4.0 3.6 3.1
RoE(%) 45.2 13.5 11.3 17.7
RoCE(%) 26.2 5.4 8.9 15.8
EV/Sales (x) 1.9 2.0 1.6 1.1
EV/EBITDA 4.8 8.0 6.2 4.4
Source: Company, Angel Research
NEUTRALCMP ` 2,255
Target Price -
Investment Period -
Stock Info
Sector
Bloomberg Code
Shareholding Pattern (%)
Promoters 64.8
MF / Banks / Indian Fls 5.0
FII / NRIs / OCBs 8.7
Indian Public / Others 21.5
Abs. (%) 3m 1yr 3yr
Sensex (2.9) (6.2) 82.4SRCM 18.9 35.9 353.1
SRCM@IN
BSE Sensex 17,194Nifty 5,199
Reuters Code SHCM.BO
52 Week High / Low 2305/1505
Avg. Daily Volume 5,824
Face Value ( ` ) 10
Cement
Market Cap ( ` cr) 7,857
Beta 0.7
V.Srinivasan
+91 22 39357800 Ext. 6833
Sourabh Taparia+91 22 39357800 Ext. 6872
Shree Cement
Performance highlights
3QFY2012 Result Update| Cement
January 31, 2012
8/3/2019 Shree Cement Result Updated
http://slidepdf.com/reader/full/shree-cement-result-updated 2/11
Shree Cements | 3QFY2012 Result Update
January 31, 2012 2
Exhibit 1: 3QFY2012 performance (Standalone)
Y/E March (` cr) 3QFY2012 2QFY2012 % Chg qoq 3QFY2011 % Chg yoy 9MFY2012 9MFY2011 % Chg
Total Operating Income 1,259 855 47.3 780 61.4 3,147 2,442 28.9
Net raw-material costs 156 109 43.8 88 77.5 394 305 29.2(% of sales) 12.4 12.7 11.3 12.5 12.5
Power & fuel 325 203 60.1 207 57.4 802 610 31.3
(% of sales) 25.9 23.8 26.5 25.5 25.0
Staff costs 64 59 7.7 48 33.2 184 145 27.3
(% of sales) 5.1 4.7 3.8 5.9 5.9
Freight & forwarding 266 192 38.3 202 31.7 681 544 25.2
(% of sales) 21.1 15.3 16.0 21.6 22.3
Other expenses 115 92 24.8 84 37.6 310 262 16.0
(% of sales) 9.1 7.3 6.6 9.7 10.7
Total Expenditure 926 655 41.3 628 47.5 2,365 1,866 26.7
Operating Profit 332 199 66.8 152 119.2 782 576 36.0
OPM (%) 26.4 23.3 310bp 19.5 697bp 24.9 23.6 129bp
Interest 37 29 27.5 20 81.7 98 64 52.3
Depreciation 235 162 45.2 131 78.9 557 411 35.5
Other Income 2 2 (24.1) 2 (1.0) 4 44 (90.0)
PBT 62 11 476.6 2 3,356.4 132 145 (8.6)
Provision for Taxation 3 (28) - (26) - (20) 1 -
(% of PBT) 4.9 (256.8) (1,427.2) (15.4) 0.5
Reported PAT 59 38 53.8 27 115.3 153 144 6.1
PATM (%) 4.7 4.5 3.5 4.9 5.9
EPS ( ` ) 17 11 53.8 8 115.3 44 41 6.1
Source: Company, Angel Research
Exhibit 2: Financial performance
Source: Company, Angel Research
718780
1,070 1,034
855
1,259
11 27 66 55 38 59
15.0
17.0
19.0
21.0
23.0
25.0
27.0
29.0
0.0
200.0
400.0
600.0
800.0
1,000.0
1,200.0
2QFY11 3QFY11 4QFY11 1QFY12 2QFY12 3QFY12
(%)( ` cr)
Total operating income Net Profit OPM (RHS)
8/3/2019 Shree Cement Result Updated
http://slidepdf.com/reader/full/shree-cement-result-updated 3/11
Shree Cements | 3QFY2012 Result Update
January 31, 2012 3
Exhibit 3: 3QFY2012 – Actual vs. Angel estimates
(` cr) Actual Estimates Variation (%)
Net sales 1,259 1,082 16.3
Operating profit 332 279 19.0Net profit 59 76 (21.7)
Source: Company, Angel Research
Performance highlights
Total operating income up 61.4% yoy, led by strong growth in cement
business
During 3QFY2012, SRCM’s total operating income grew by 61.4% yoy to
` 1,259cr, primarily on account of higher cement realization. The company’s
cement realization improved by 33.2% yoy to ` 3,794/tonne (up 11.4% qoq), on
account of higher prices as well as higher cement sales as a proportion of total
cement and clinker sales (98% in 3QFY2012 vs. 88% in FY2011 as 1.5mtpa of
incremental grinding capacity was operational). Cement dispatches also grew by
8.8% yoy to 2.85mn tonnes.
Revenue of the power business also grew by 429% yoy to ` 177cr due to a 244%
increase in sale volumes to 256.4MUs. This revenue included ` 66cr from power
trading operations. Power volumes growth was aided by 150MW of new capacity
commissioned during the quarter.
Freight costs spiked, but much higher cement realization aided improvementin overall OPMs
Although SRCM faced margin pressures during the quarter due to higher freight
cost and other expenses, substantial growth in cement realization and higher
revenue from the power division resulted in OPM expanding by 697bp yoy to
26.4%. Even on a sequential basis, the company’s margin improved by 310bp due
to higher realization, which negated the surge in costs faced by the company.
Per tonne analysis
On the operating front, raw-material cost per tonne of cement was flat yoy, while it
fell by 23.4% qoq. Power and fuel cost per tonne increased by 10.8% yoy;however, it reduced by 2.3% qoq on account of moderation in pet coke prices.
Freight cost/per tonne rose by 21.1% yoy on account of inter-unit clinker transfer to
incremental grinding unit at Jaipur in Rajasthan (1.5mtpa) and higher diesel cost.
Operating profit per tonne of the cement increased to ` 1,113 (100.2% yoy).
8/3/2019 Shree Cement Result Updated
http://slidepdf.com/reader/full/shree-cement-result-updated 4/11
Shree Cements | 3QFY2012 Result Update
January 31, 2012 4
Exhibit 4: Cement operational performance
Particulars (`) 3QFY2012 2QFY2012 3QFY2011 chg (%) yoy chg (%) qoq
Realization/tonne 3,794 3,405 2,848 33.2 11.4
Raw material cost/tonne 328 428 329 (0.3) (23.4)Power & fuel cost/tonne 798 817 721 10.8 (2.3)
Freight cost/tonne 932 771 769 21.1 20.9
Other costs 403 370 319 26.5 9.1
Operating profit/tonne 1,113 800 556 100.2 39.1
Source: Company, Angel Research
Exhibit 5: Segment-wise revenue break-up
Particulars (` cr) 3QFY2012 2QFY2012 3QFY2011 chg (%) yoy chg (%) qoq
Cement 1,081 848 746 44.9 27
Power 177 7 34 429.2 2,469.2
Source: Company, Angel Research
8/3/2019 Shree Cement Result Updated
http://slidepdf.com/reader/full/shree-cement-result-updated 5/11
Shree Cements | 3QFY2012 Result Update
January 31, 2012 5
Investment rationale
One of the lowest-cost cement producers: SRCM is one of the lowest-cost cement
producers in north India, primarily because of its captive power plant and lesser
power consumption per tonne of cement (one of the lowest in the industry due to
higher proportion of PPC (~80%) in overall sales volumes) and lower freight cost
as its grinding units are close to demand centers.
Growth to be driven by capacity addition: SRCM has recently added 3.3mtpa of
cement capacity by commissioning new grinding plants and by de-bottlenecking.
The company has also commissioned new merchant power capacity of 300MW in
two phases in October 2011 and January 2012. We expect these capacity
additions to drive its revenue growth going ahead.
Relatively unfavorable plant locations amongst our coverage companies: SRCM
has 87% of its total capacity located in Rajasthan, which is expected to face
prolonged utilizations and margin pressures, as state-wise it is India’s second
biggest capacity cluster (44.8mtpa of total capacity in FY2011) and has huge
demand supply gap even after catering to surplus demand of nearby states
(Punjab, Haryana, Chandigarh, NCR and UP), in addition to its own demand.
The balance 13% capacity is in Uttarakhand, where demand supply dynamics are
much better than Rajasthan’s and, hence, capacities in the state are expected to
witness higher utilizations.
Outlook and valuation: We expect SRCM to post a strong 23.8% CAGR in its top
line over FY2011-13E, aided by an 8.9% CAGR in dispatches over the period.
At the CMP, SRCM's cement business is trading at EV/tonne of US$84 on current
capacity (US$59 on FY2013E capacity), which, when considering its unfavorable
plant locations, in our view offers inadequate margin of safety. Hence,
we maintain our Neutral recommendation on the stock.
Exhibit 6: Change in estimates
(` cr) FY2012E FY2013E
Earlier Revised Var. (%) Earlier Revised Var. (%)
Net Sales 4,260 4,497 5.6 5205 5,383 3.4
Operating Exp 3,260 3,358 3.0 3897 3,979 2.1
Operating Profit 999 1,138 13.9 1309 1,404 7.3
Depreciation 667 798 19.7 747 828 10.9
PBT 260 221 (15.0) 542 526 (3.1)
Tax 13 (16) - 108 105 (3.1)
PAT 247 237 (4.0) 434 421 (3.1)
Source: Angel Research
8/3/2019 Shree Cement Result Updated
http://slidepdf.com/reader/full/shree-cement-result-updated 6/11
Shree Cements | 3QFY2012 Result Update
January 31, 2012 6
Exhibit 7: One-year forward EV/tonne
Source: Company, Angel Research
Exhibit 8: Recommendation summary
Company Reco CMP Tgt. Price Upside FY2013E FY2013E FY2011-13E FY2013E FY2013E
(`) (`) (%) P/BV (x) P/E (x) EPS CAGR RoCE (%) RoE (%)
ACC* Neutral 1,190 - - 2.8 17.6 6.4 20.9 1
Ambuja Cements* Neutral 161 - - 2.7 17.5 6.9 20.4 16.5
India Cements Neutral 81 - - 0.7 8.8 165.3 7.2 8.0
JK Lakshmi Cement Accumulate 47 51 7.9 0.5 6.1 53.9 7.5 8.3
Madras Cements Neutral 117 - - 1.2 7.7 31.1 12.8 16.5
Shree Cement Neutral 2,255 - - 3.1 18.7 27.6 15.8 17.7
UltraTech Neutral 1,211 - - 2.3 14.6 27.1 17.5 17.1
Source: Company, Angel Research; Note: December year ending
0
10,000
20,000
30,000
40,000
50,000
60,000
70,000
80,000
90,000
A p r - 0 1
O c t - 0 1
A p r - 0 2
O c t - 0 2
A p r - 0 3
O c t - 0 3
A p r - 0 4
O c t - 0 4
A p r - 0 5
O c t - 0 5
A p r - 0 6
O c t - 0 6
A p r - 0 7
O c t - 0 7
A p r - 0 8
O c t - 0 8
A p r - 0 9
O c t - 0 9
A p r - 1 0
O c t - 1 0
A p r - 1 1
O c t - 1 1
E V
(`
m n )
EV/tonne US $70 US $90 US $110 US $130
8/3/2019 Shree Cement Result Updated
http://slidepdf.com/reader/full/shree-cement-result-updated 7/11
Shree Cements | 3QFY2012 Result Update
January 31, 2012 7
Profit and loss statement
Y/E March (` cr) FY2008 FY2009 FY2010 FY2011 FY2012E FY2013E
Total operating income 2,108 2,715 3,642 3,512 4,497 5,383
% chg 50.3 28.8 34.2 (3.6) 28.0 19.7Total Expenditure 1,284 1,793 2,204 2,626 3,358 3,979
Net Raw Materials 225 262 313 401 542 596
Other Mfg costs 367 606 610 912 1,156 1,493
Personnel 74 104 159 199 245 270
Other 618 821 1,121 1,114 1,415 1,619
EBITDA 824 922 1,439 886 1,138 1,404
% chg 37.8 11.9 56.0 (38.4) 28.5 23.3
(% of net Sales) 39.1 34.0 39.5 25.2 25.3 26.1
Depreciation& Amortization 479 205 570 676 798 828
EBIT 346 717 868 210 341 576
% chg 109.1 107.5 21.1 (75.8) 62.2 69.0
(% of net Sales) 16.4 26.4 23.8 6.0 7.6 10.7
Interest & other Charges 56 77 129 175 199 143
Other Income 78 83 129 124 79 93
(% of PBT) 21.3 11.5 14.8 78.2 36.0 17.7
Recurring PBT 368 723 868 159 221 526
% chg 88.2 96.3 20.1 (81.7) 38.9 138.2
Extraordinary expense/(Inc.) - - - 48 - -
PBT (reported) 368 723 868 110 221 526
Tax 108 145 192 (99) (16) 105
(% of PBT) 29.3 20.1 22.1 (90.0) (7.3) 20.0
PAT (reported) 260 578 676 210 237 421
% chg 41.6 122.0 17.0 (61.8) (8.3) 77.6
(% of Net Sales) 12.3 21.3 18.6 7.4 5.3 7.8
Basic EPS (`) 75 166 194 74 68 121
Fully Diluted EPS (̀ ) 75 166 194 74 68 121
% chg 41.6 122.0 17.0 (61.8) (8.3) 77.6
8/3/2019 Shree Cement Result Updated
http://slidepdf.com/reader/full/shree-cement-result-updated 8/11
Shree Cements | 3QFY2012 Result Update
January 31, 2012 8
Balance sheet
Y/E March (` cr) FY2008 FY2009 FY2010 FY2011 FY2012E FY2013E
SOURCES OF FUNDS
Equity share capital 35 35 35 35 35 35Reserves & surplus 638 1,175 1,798 1,951 2,155 2,517
Shareholders’ funds 673 1,210 1,833 1,986 2,190 2,552
Total loans 1,331 1,496 2,106 2,008 1,608 1,108
Deferred tax liability (18) (10) (12) (72) (90) (90)
Total Liabilities 1,985 2,696 3,927 3,922 3,708 3,570
APPLICATION OF FUNDS
Gross block 2,187 2,256 2,951 4,042 5,242 5,442
Less: acc. depreciation 1,427 1,629 2,199 2,875 3,673 4,501
Net Block 760 627 752 1,167 1,569 941
Capital work-in-progress 18 479 967 1,028 78 78
Goodwill - - - - - -
Investments 591 845 1,592 1,196 1,546 1,846
Current Assets 1,112 1,466 1,582 1,439 1,484 1,725
Cash 484 509 416 461 740 791
Loans & advances 403 744 725 466 199 245
Other 226 213 441 512 545 689
Current liabilities 496 721 967 908 970 1,021
Net Current Assets 616 745 615 531 514 704
Misc. exp. not written off - - - - - -
Total Assets 1,985 2,696 3,927 3,922 3,708 3,570
8/3/2019 Shree Cement Result Updated
http://slidepdf.com/reader/full/shree-cement-result-updated 9/11
Shree Cements | 3QFY2012 Result Update
January 31, 2012 9
Cash flow statement
Y/E March (` cr) FY2008 FY2009 FY2010 FY2011 FY2012E FY2013E
Profit before tax 368 723 868 110 221 526
Depreciation 479 205 570 676 798 828Change in Working Capital (476) (80) 33 98 295 (139)
Less: Other income 78 83 129 124 79 93
Direct taxes paid 124 164 190 (71) (16) 105
Cash Flow from Operations 169 601 1,152 831 1,250 1,017
(Inc)/ Decin Fixed Assets (204) (530) (1,183) (1,152) (250) (200)
(Inc)/ Dec in Investments (541) (254) (747) 396 (350) (300)
Other income 78 83 129 124 79 93
Cash Flow from Investing (667) (700) (1,802) (631) (521) (407)
Issue of Equity - - - - - -
Inc./(Dec.) in loans 399 165 610 (98) (400) (500)Dividend Paid (Incl. Tax) 33 41 53 57 33 59
Cash Flow from Financing 367 125 557 (155) (433) (559)
Others - - - - 18 -
Inc./(Dec.) in Cash (131) 25 (92) 44 279 51
Opening Cash balances 615 484 509 416 461 740
Closing Cash balances 484 509 416 461 740 791
8/3/2019 Shree Cement Result Updated
http://slidepdf.com/reader/full/shree-cement-result-updated 10/11
Shree Cements | 3QFY2012 Result Update
January 31, 2012 10
Key ratios
Y/E March FY2008 FY2009 FY2010 FY2011 FY2012E FY2013E
Valuation Ratio (x)
P/E (on FDEPS) 30.2 13.6 11.6 30.4 33.2 18.7P/CEPS 10.6 10.0 6.3 8.9 7.6 6.3
P/BV 12.7 6.8 4.3 4.0 3.6 3.1
Dividend yield (%) 0.4 0.5 0.7 0.7 0.4 0.7
EV/Sales 3.8 2.8 1.9 2.0 1.6 1.1
EV/EBITDA 9.8 8.1 4.8 8.0 6.2 4.4
EV / Total Assets 4.1 2.8 1.8 1.8 1.9 1.7
Per Share Data (`)
EPS (Basic) 74.7 165.9 194.0 74.1 68.0 120.7
EPS (fully diluted) 74.7 165.9 194.0 74.1 68.0 120.7
Cash EPS 212.1 224.8 357.8 254.2 297.0 358.5
DPS 9.4 11.7 15.2 16.3 9.5 16.8
Book Value 177.4 333.2 526.2 570.1 628.6 732.5
Dupont Analysis
EBIT margin 16.4 26.4 23.8 6.0 7.6 10.7
Tax retention ratio 70.7 79.9 77.9 190.0 107.3 80.0
Asset turnover (x) 1.8 1.5 1.3 1.0 1.4 1.9
ROIC (Post-tax) 21.0 31.1 23.7 11.4 11.4 16.0
Cost of Debt (Post Tax) 3.5 4.4 5.6 16.2 11.8 8.4
Leverage (x) 1.2 0.9 0.9 1.0 0.8 0.5
Operating ROE 42.1 55.9 40.9 6.8 11.0 19.8
Returns (%)
ROCE (Pre-tax) 20.2 30.6 26.2 5.4 8.9 15.8
Angel ROIC (Pre-tax) 52.3 81.7 95.7 19.2 26.4 52.4
ROE 49.2 65.0 45.2 13.5 11.3 17.7
Turnover ratios (x)
Asset Turnover (Gross Block) 1.1 1.2 1.4 1.0 1.0 1.0
Inventory / Sales (days) 29 22 26 40 34 33
Receivables (days) 7 7 7 10 9 9
Payables (days) 147 124 140 130 102 91
WC cycle (ex-cash) (days) 1 25 22 14 (6) (11)
Solvency ratios (x)Net debt to equity 0.4 0.1 0.1 0.2 (0.3) (0.6)
Net debt to EBITDA 0.3 0.2 0.1 0.4 (0.6) (1.1)
Interest Coverage (EBIT / Int.) 6.2 9.3 6.7 1.2 1.7 4.0
8/3/2019 Shree Cement Result Updated
http://slidepdf.com/reader/full/shree-cement-result-updated 11/11
Shree Cements | 3QFY2012 Result Update
January 31, 2012 11
Research Team Tel: 022 - 39357800 E-mail: [email protected] Website: www.angelbroking.com
DISCLAIMER
This document is solely for the personal information of the recipient, and must not be singularly used as the basis of any investmentdecision. Nothing in this document should be construed as investment or financial advice. Each recipient of this document should make
such investigations as they deem necessary to arrive at an independent evaluation of an investment in the securities of the companies
referred to in this document (including the merits and risks involved), and should consult their own advisors to determine the merits and
risks of such an investment.
Angel Broking Limited, its affiliates, directors, its proprietary trading and investment businesses may, from time to time, make
investment decisions that are inconsistent with or contradictory to the recommendations expressed herein. The views contained in this
document are those of the analyst, and the company may or may not subscribe to all the views expressed within.
Reports based on technical and derivative analysis center on studying charts of a stock's price movement, outstanding positions and
trading volume, as opposed to focusing on a company's fundamentals and, as such, may not match with a report on a company's
fundamentals.
The information in this document has been printed on the basis of publicly available information, internal data and other reliablesources believed to be true, but we do not represent that it is accurate or complete and it should not be relied on as such, as thisdocument is for general guidance only. Angel Broking Limited or any of its affiliates/ group companies shall not be in any way responsible for any loss or damage that may arise to any person from any inadvertent error in the information contained in this report .
Angel Broking Limited has not independently verified all the information contained within this document. Accordingly, we cannot testify,nor make any representation or warranty, express or implied, to the accuracy, contents or data contained within this document. While Angel Broking Limited endeavours to update on a reasonable basis the information discussed in this material, there may be regulatory,compliance, or other reasons that prevent us from doing so.
This document is being supplied to you solely for your information, and its contents, information or data may not be reproduced,
redistributed or passed on, directly or indirectly.
Angel Broking Limited and its affiliates may seek to provide or have engaged in providing corporate finance, investment banking or
other advisory services in a merger or specific transaction to the companies referred to in this report, as on the date of this report or in
the past.
Neither Angel Broking Limited, nor its directors, employees or affiliates shall be liable for any loss or damage that may arise from or in
connection with the use of this information.
Note: Please refer to the important `Stock Holding Disclosure' report on the Angel website (Research Section). Also, please refer to thelatest update on respective stocks for the disclosure status in respect of those stocks. Angel Broking Limited and its affiliates may haveinvestment positions in the stocks recommended in this report.
Disclosure of Interest Statement Shree Cement
1. Analyst ownership of the stock No
2. Angel and its Group companies ownership of the stock No
3. Angel and its Group companies' Directors ownership of the stock No
4. Broking relationship with company covered No
Ratings (Returns): Buy (> 15%) Accumulate (5% to 15%) Neutral (-5 to 5%)Reduce (-5% to 15%) Sell (< -15%)
Note: We have not considered any Exposure below`
1 lakh for Angel, its Group companies and Directors