26 Sep. 2012@Tsukuba Simulating soil carbon in Simulating soil carbon in Japanese agricultural land by the Rothamsted carbon model Yasuhito SHIRATO Yasuhito SHIRATO Yasumi YAGASAKI (National Institute for Agro- (National Institute for Agro- Environmental Sciences, Japan)
Transcript
26 Sep. 2012@Tsukuba
Simulating soil carbon inSimulating soil carbon in Japanese agricultural land by the Rothamsted carbon model
Yasuhito SHIRATOYasuhito SHIRATOYasumi YAGASAKI
(National Institute for Agro-(National Institute for Agro-Environmental Sciences, Japan)
Two steps
1. Validation and “Utilization of soil information”
modification of the model
Long‐term soil experimentsthe model
2. Country‐ scale application of
Soil map & databaseapplication of the model Agricultural activity data
Objective:Objective:Estimate potential of soil C sequestration
M difi d d lModified model Original RothC is OK Modified model
Next: Country scale simulation using 3 versions
Country-scale simulationCountry-scale simulation
Simulation unit: 100m × 100m grid
3rd grid: 30″ x 45″ (≒ 1 1 k )
1st id
2nd grid:5′ x 7.5 ′(≒ 10 x 10 km)
3rd grid: 30″ x 45″ (≒ 1 x 1 km)
4th grid: 3″ x 4.5″ (≒ 0.1 x 0.1 km)total: ca. 38,000,000 grids
1st grid:40′ x 1°(≒80 x 80 km)
Soil mapLand use map
1 paddy2 cropland3 orchard4 managed grassland5 unmanaged grassland6 f l d6 forest lands7 wetlands8 settlements9 other lands
Land use historySimulation unit: 100m grid
3
水稲作付け
田
Agricultural land use change during 51 years
ha)
PaddyNot fixed!
1
2 田
畑
樹園地
(m
illio
n
Upland
OrchardDiff i
0
0 3 6 9 2 5 8 1 4 7 0 3 6 9 2 5 8
樹園地
牧草地
Are
a Orchard
Grassland
•Different version of model•different activity
1970
1973
1976
1979
1982
1985
1988
1991
1994
1997
2000
2003
2006
2009
2012
2015
2018
T bl f l d h hi t
different activity data
1970 1971 1972 ・ ・ ・ ・ 2018 2019 2020
P P U U U U U P P P100m grid
P: paddyU: uplandO: orchard
Table of land use change history
O O O S S S S S S S
F F F G G G G G G G
gG: grassland
F: ForestS S ttl t
・ ・ ・ ・ ・ ・ ・ ・ ・ ・S: Settlement
All grids which have agricultural land use at least once were included in simulation
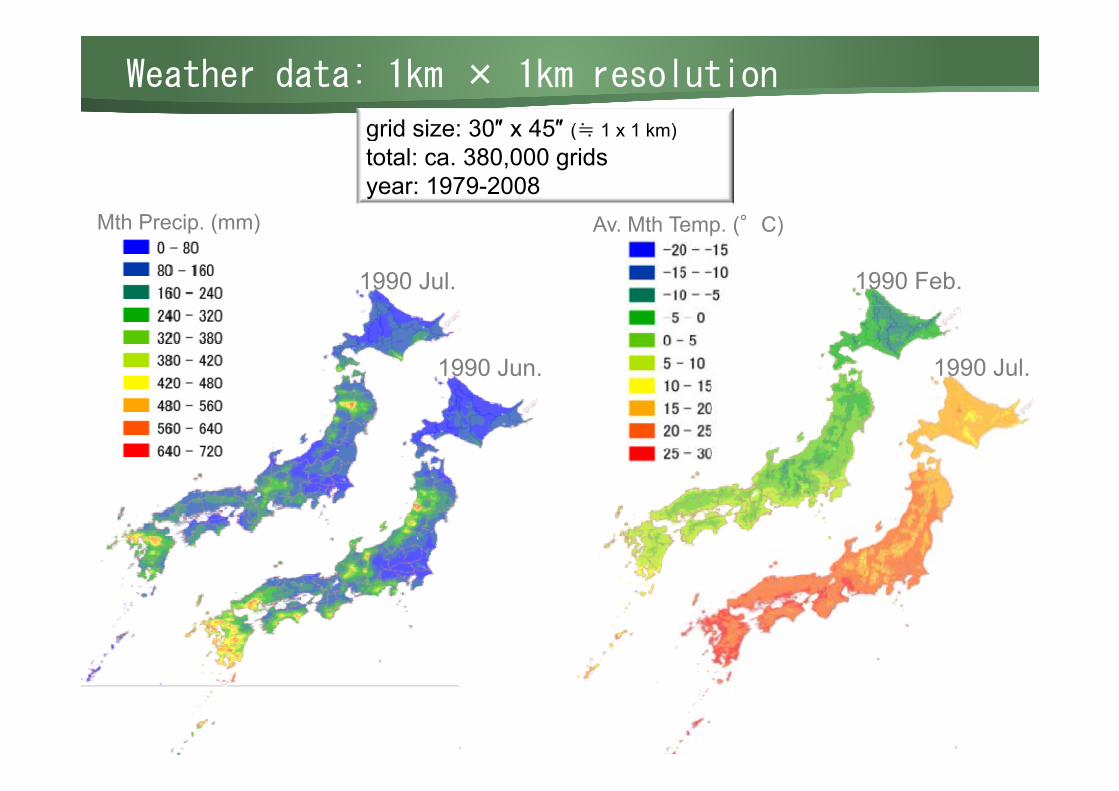
Weather data: 1km × 1km resolution
grid size: 30″ x 45″ (≒ 1 1 k )
°
grid size: 30 x 45 (≒ 1 x 1 km)total: ca. 380,000 gridsyear: 1979-2008
Mth P i ( )
1990 Feb.
Av. Mth Temp. (°C)
1990 Jul.
Mth Precip. (mm)
1990 Jul.1990 Jun.
•Estimated C input to soils: 1) crop residue 2)Farmyard manure (FYM)
Activity data (management): resolution=prefecture•Estimated C input to soils: 1) crop residue, 2)Farmyard manure (FYM) •47 prefecture•51 year
C inputs from crop residue•4 agricultural land uses (paddy, upland, orchard, grassland)
p pYield residue amount entered soils
QuestionnaireStatistics Literature
C inputs from FYMQuestionnaire Statistics Literature
Head of livestock excreta FYM amount entered soilsQuestionnaire Statistics Literature
Assumption: OM produced in a prefecture enters soils inAssumption: OM produced in a prefecture enters soils in that prefecture, but different rate with land uses
Activity data (management): resolution=prefecture
Many steps and assumptions: high uncertaintyuncertainty 3 levels of estimates (small,
medium, large) of C inputs were created Simulation was performed for each
of 3of 3
Simulation period: 1970-202070 実測Initial SOC
60
70
)
実測
モデル(緩和シナ
リオ)
毎年の土壌へのC投入量(県別。作
物残渣・堆肥)を入力して計算
C inputs (t /ha) each year, 47 prefectures, 4 land uses Simulation
Summary RothC was validated against long‐term experiments in Japan.
Modified versions for Andosols and for paddy soils were p ydeveloped.
Country‐scale simulation with three versions of the RothC at y100m‐resolution was conducted from 1970‐2020.
Inter‐annual variability in CO2 emission (SOC decrease) was y 2 ( )large .
Range of 2 to 5 Mt of net‐net CO2 removal were estimated by g 2 yKyoto protocol accounting method.
Effect of weather condition during commitment period wereEffect of weather condition during commitment period were larger than the effect of improved management.
The suitability of net‐net accounting method by using singleThe suitability of net net accounting method by using single base year should be considered.
Future work
Uncertainty analysis (e.g. activity data)
Comparison with monitoring‐based estimation
GWP calculation together with CH4 and N2OGWP calculation together with CH4 and N2O
LCA including fossil fuel use
Proposalsp
Create and share Asian soil map
Land use map Land use map
Networking long‐term experiments
For extending our methodology to AsiaFor better utilization of soil information inFor better utilization of soil information in Asia
Thank you for your attention!Thank you for your attention!