32
Singtel Investor Day 2019 Scaling our Digital Engines for Growth Samba Natarajan CEO, Group Digital Life Jun 11, 2019
Singtel Investor Day 2019
Scaling our Digital Engines
for GrowthSamba NatarajanCEO, Group Digital LifeJun 11, 2019
2
Key Questions
on your mind
What is Singtel’s appetite for future investments
in the digital businesses?
What will it take for Group Digital Life to achieve
profitability, and when will this happen?
What is the plan to crystallize the value of the
Group’s digital businesses?
What is the plan for Amobee and HOOQ? Is
Singtel investing more, and how does that
impact profitability?
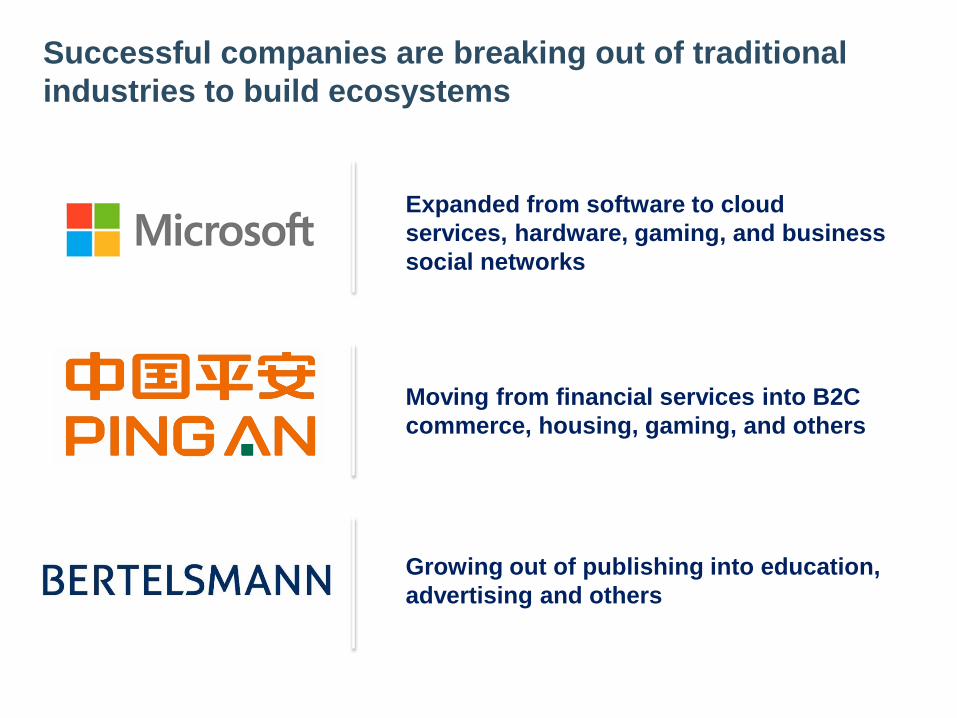
Successful companies are breaking out of traditional
industries to build ecosystems
Growing out of publishing into education,
advertising and others
Moving from financial services into B2C
commerce, housing, gaming, and others
Expanded from software to cloud
services, hardware, gaming, and business
social networks
4
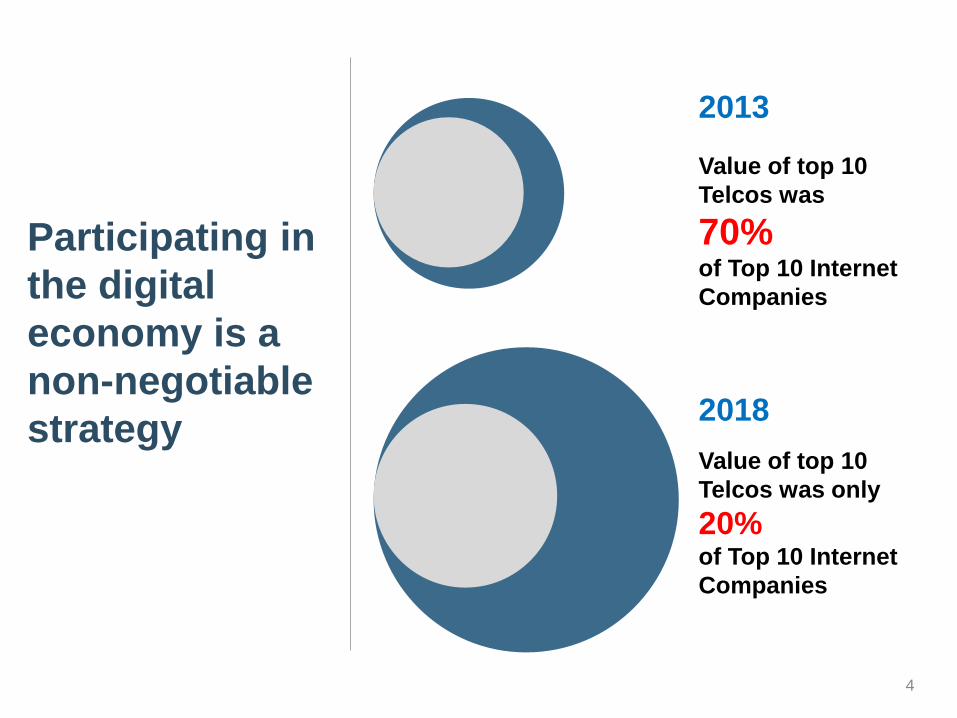
Participating in
the digital
economy is a
non-negotiable
strategy
2013
2018
Value of top 10
Telcos was
70% of Top 10 Internet
Companies
Value of top 10
Telcos was only
20% of Top 10 Internet
Companies

5
Advertising
Financial Services
Communication
Gaming
Digital Health
Singtel Group
Data Assets
CRM
Demographics
Web
Intent
Network
Location
Entertainment
Particularly
when we have a
differentiating
data
proposition

6
Digitizing
the core
operating
model
Partnerships
to build the
digital
ecosystem
and enhance
the core
Building new
standalone
digital
businesses
where we
have a right to
play
Singtel’s Digital Transformation Strategy
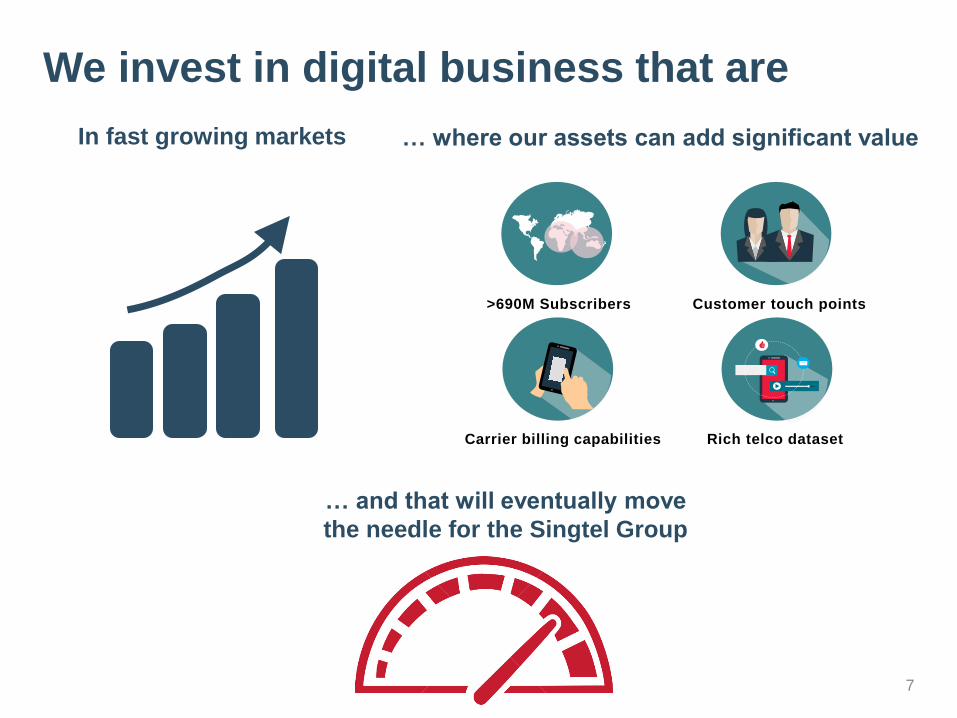
We invest in digital business that are
7
… and that will eventually move
the needle for the Singtel Group
In fast growing markets … where our assets can add significant value
>690M Subscribers Customer touch points
Carrier billing capabilities Rich telco dataset

GDL Financials
8
Revenue (S$ millions) EBITDA (S$ millions)
-104
-170-180
-137
-122
-51
-92
FY15FY13 FY18FY17FY14 FY16 FY19
111
184
369
511
626
1,162
1,289
FY15FY14 FY17FY13 FY16 FY19FY18
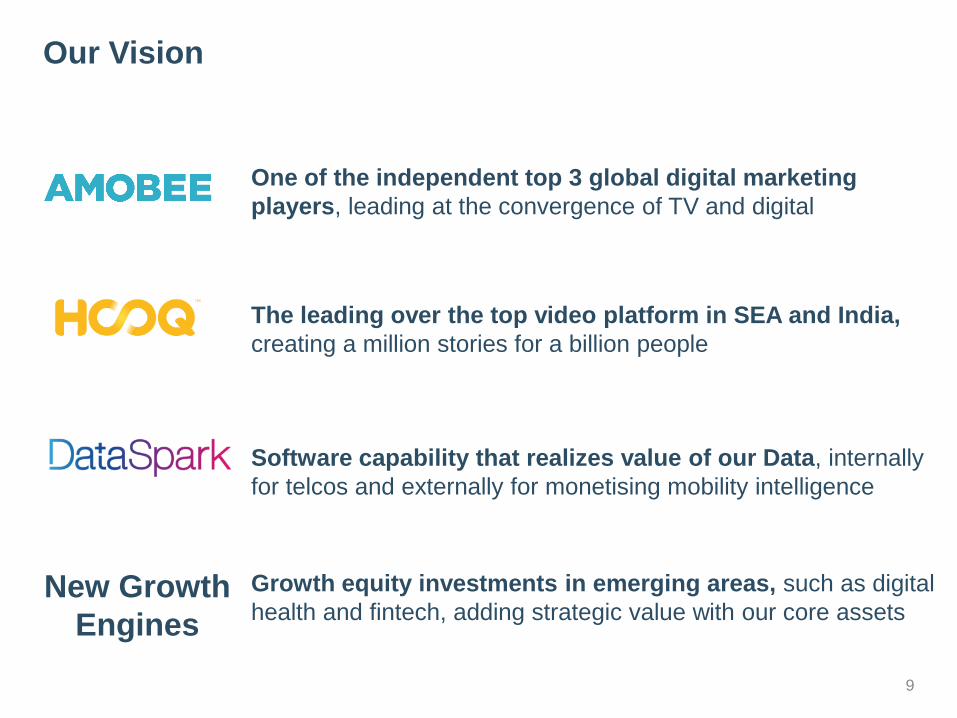
Our Vision
9
Software capability that realizes value of our Data, internally
for telcos and externally for monetising mobility intelligence
The leading over the top video platform in SEA and India,
creating a million stories for a billion people
One of the independent top 3 global digital marketing
players, leading at the convergence of TV and digital
New Growth
Engines
Growth equity investments in emerging areas, such as digital
health and fintech, adding strategic value with our core assets
10
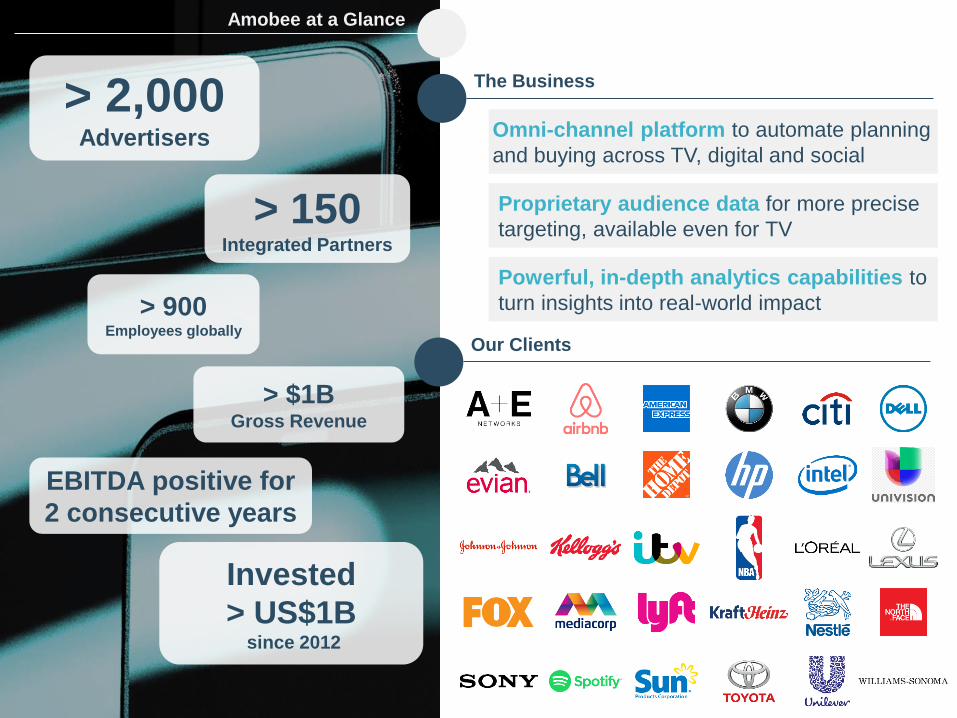
> 2,000Advertisers
> $1BGross Revenue
Invested
> US$1B since 2012
> 900Employees globally
Our Clients
Amobee at a Glance
The Business
Omni-channel platform to automate planning
and buying across TV, digital and social
Proprietary audience data for more precise
targeting, available even for TV
Powerful, in-depth analytics capabilities to
turn insights into real-world impact
> 150Integrated Partners
EBITDA positive for
2 consecutive years

-16
-34
-78
-45
-32
31
1
FY18FY17FY15FY13 FY14 FY16 FY19
57128
348
501
602
1,139
1,250
FY16FY13 FY14 FY15 FY18FY17 FY19
Guidance on FY20:
Amobee is expecting to grow its operating revenue by high single digit and improve its EBITDA
Amobee Financials
Revenue (S$ millions) EBITDA (S$ millions)
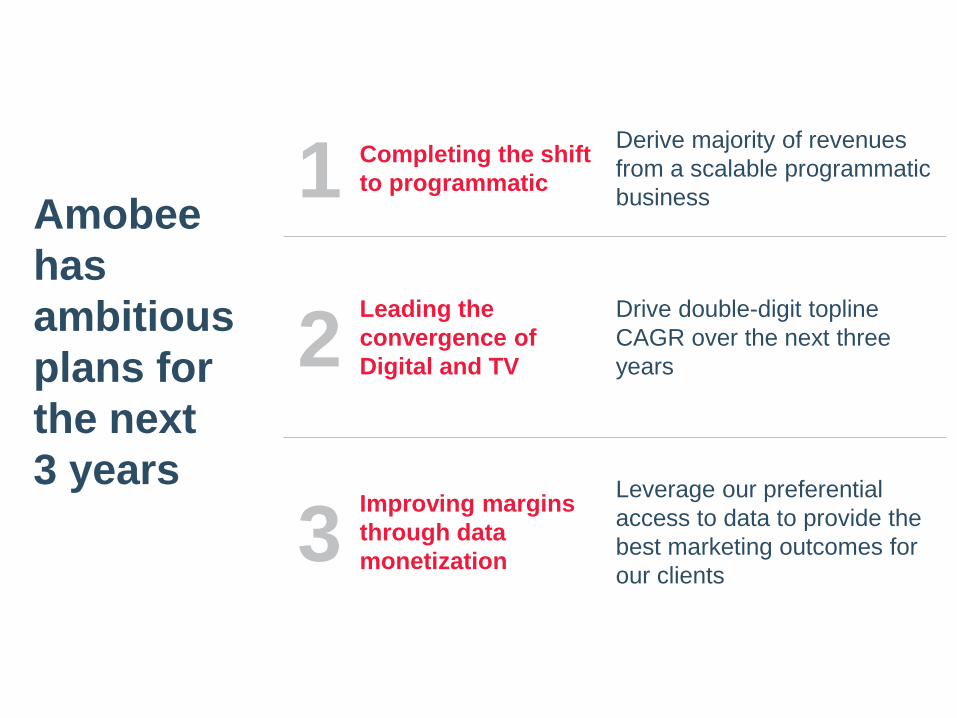
Amobee
has
ambitious
plans for
the next
3 years
1 Completing the shift
to programmatic
Derive majority of revenues
from a scalable programmatic
business
2Leading the
convergence of
Digital and TV
Drive double-digit topline
CAGR over the next three
years
3Improving margins
through data
monetization
Leverage our preferential
access to data to provide the
best marketing outcomes for
our clients

14
CAGR
US Digital Ad Spend (US$ billions)
Rebalancing towards programmatic1
46 53 59 70 81 9125
3649
5970
81
20212018
129
2016 2017
72
2019 2020
88
109
151
172
26%
Programmatic Digital Display Ad Spend
Non-Programmatic Digital Display Ad Spend
14%
Source: eMarketer
19%
15
3,000
2,000
6,000
4,000
0
1,000
5,000
7,000
8,000
9,000
10,000
11,000
0x
5x
10x
15x
20x
25x
30x
35x
40x
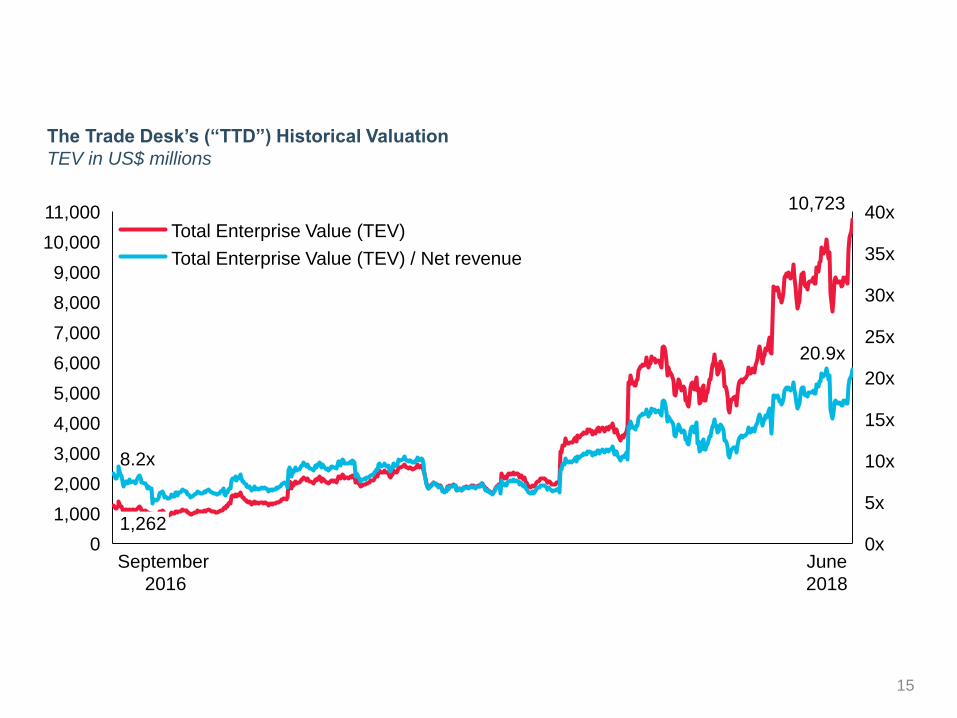
8.2x
1,262
10,723
20.9x
Total Enterprise Value (TEV) / Net revenue
Total Enterprise Value (TEV)
The Trade Desk’s (“TTD”) Historical Valuation
TEV in US$ millions
September
2016
June
2018
16
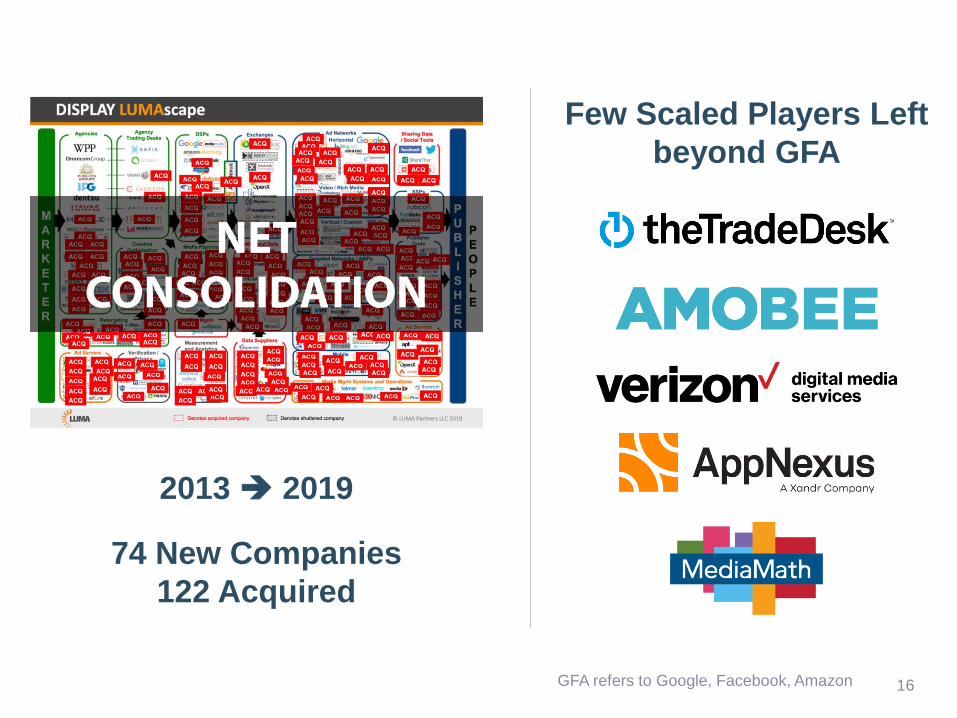
2013 2019
74 New Companies
122 Acquired
Few Scaled Players Left
beyond GFA
GFA refers to Google, Facebook, Amazon
17
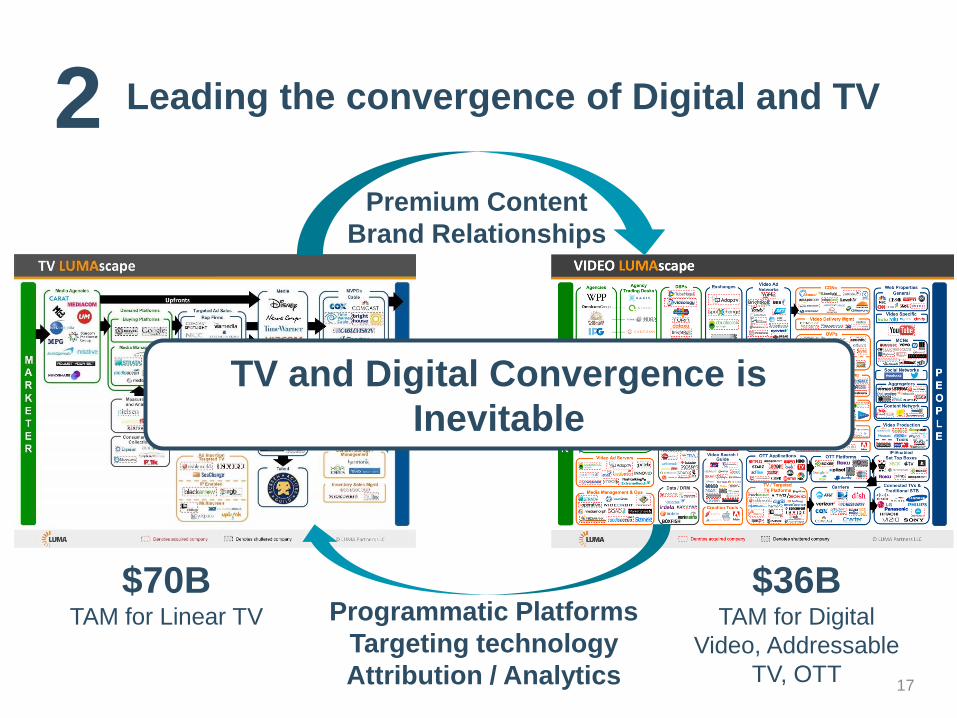
Leading the convergence of Digital and TV2
Integrated
workflow
Premium Content
Brand Relationships
Programmatic Platforms
Targeting technology
Attribution / Analytics
TV and Digital Convergence is
Inevitable
$36BTAM for Digital
Video, Addressable
TV, OTT
$70BTAM for Linear TV
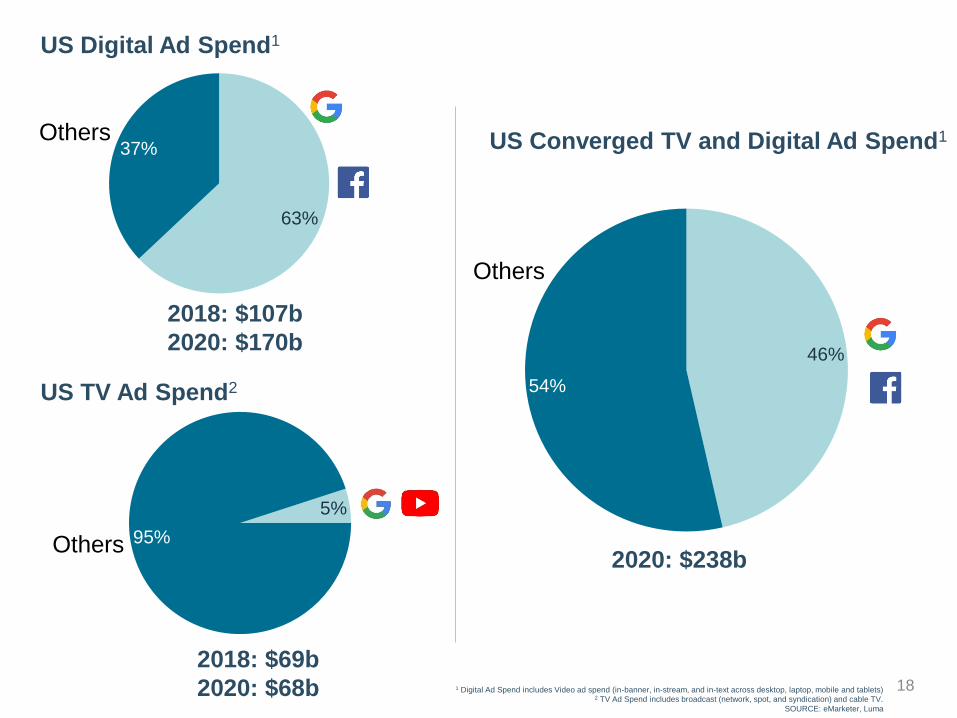
18
5%
95%Others
US TV Ad Spend2
2018: $69b
2020: $68b
US Digital Ad Spend1
63%
37%Others
2018: $107b
2020: $170b46%
54%
Others
2020: $238b
US Converged TV and Digital Ad Spend1
1 Digital Ad Spend includes Video ad spend (in-banner, in-stream, and in-text across desktop, laptop, mobile and tablets)2 TV Ad Spend includes broadcast (network, spot, and syndication) and cable TV.
SOURCE: eMarketer, Luma
19
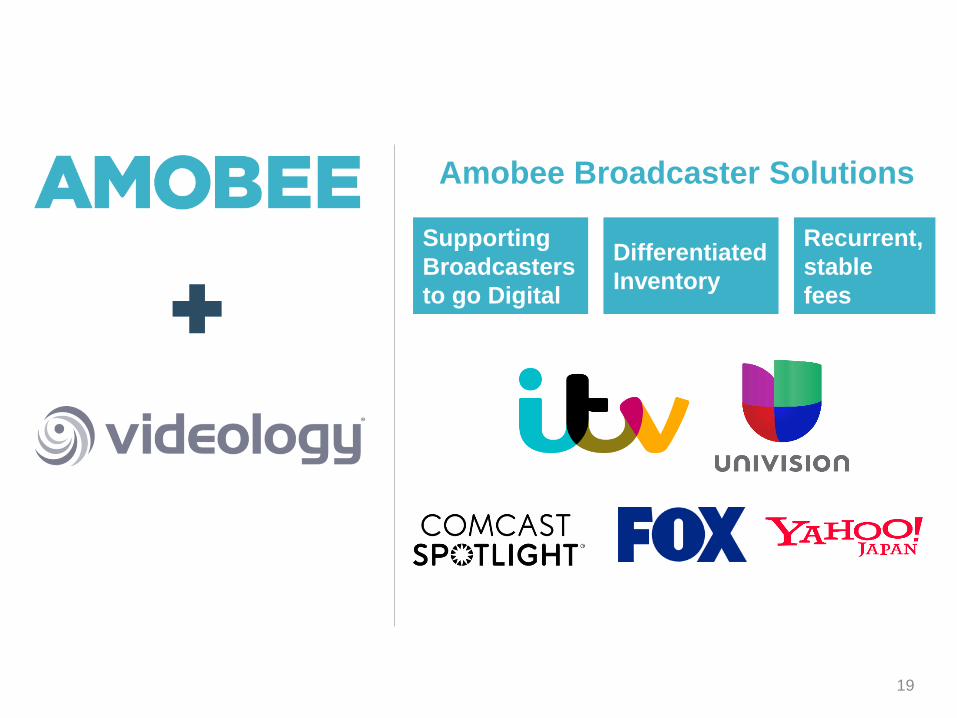
Amobee Broadcaster Solutions
Differentiated
Inventory
Recurrent,
stable
fees
Supporting
Broadcasters
to go Digital

20
Leveraging differentiated data and analytics3First Party
Data
Unique
Capabilities
Making Data
Easy to Use
Preferential
Partnerships
Telco
Enterprise
Customer
Data
DataMine
Analytics
Brand
Intelligence
Recommendation
Engine
Simplified UI/UX
New Data
Products

21
4.6x
3.3x
7.9x
Private Market Net Rev Multiple
Public Market
20.9x
5.4x
And we are
committed
to realizing
value
22
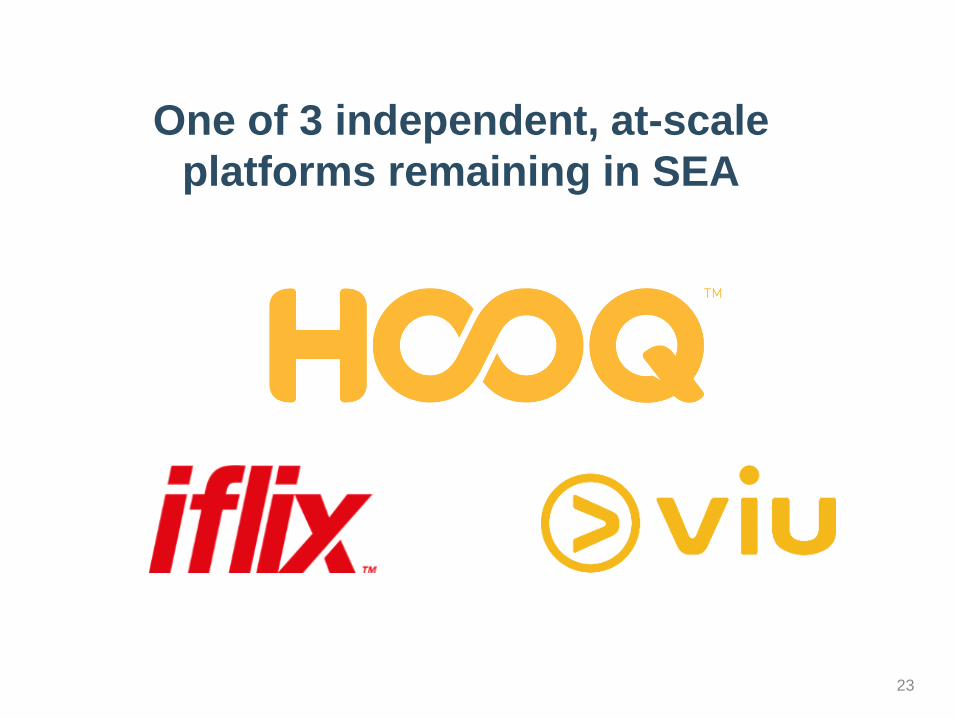
23
One of 3 independent, at-scale
platforms remaining in SEA
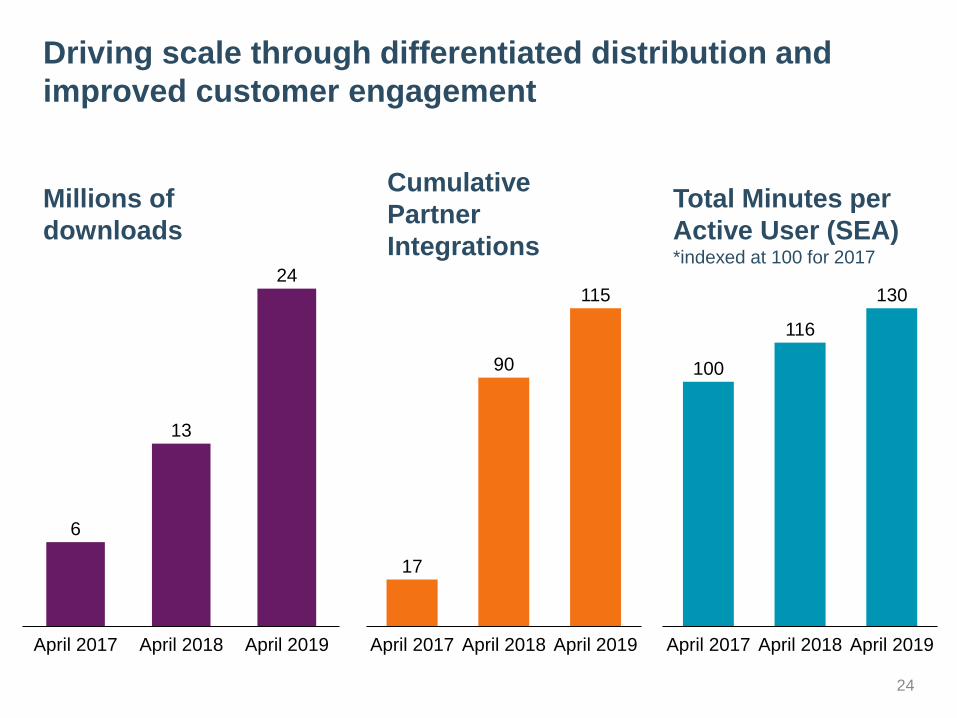
Driving scale through differentiated distribution and
improved customer engagement
24
6
13
24
April 2017 April 2018 April 2019
17
90
115
April 2018April 2017 April 2019
Millions of
downloads
Cumulative
Partner
Integrations
Total Minutes per
Active User (SEA)*indexed at 100 for 2017
100
116
130
April 2017 April 2018 April 2019

25
Completed new
partnership deals and
scaled existing channels
AVOD/SVOD
Rolled out
freemium layer
across SEA
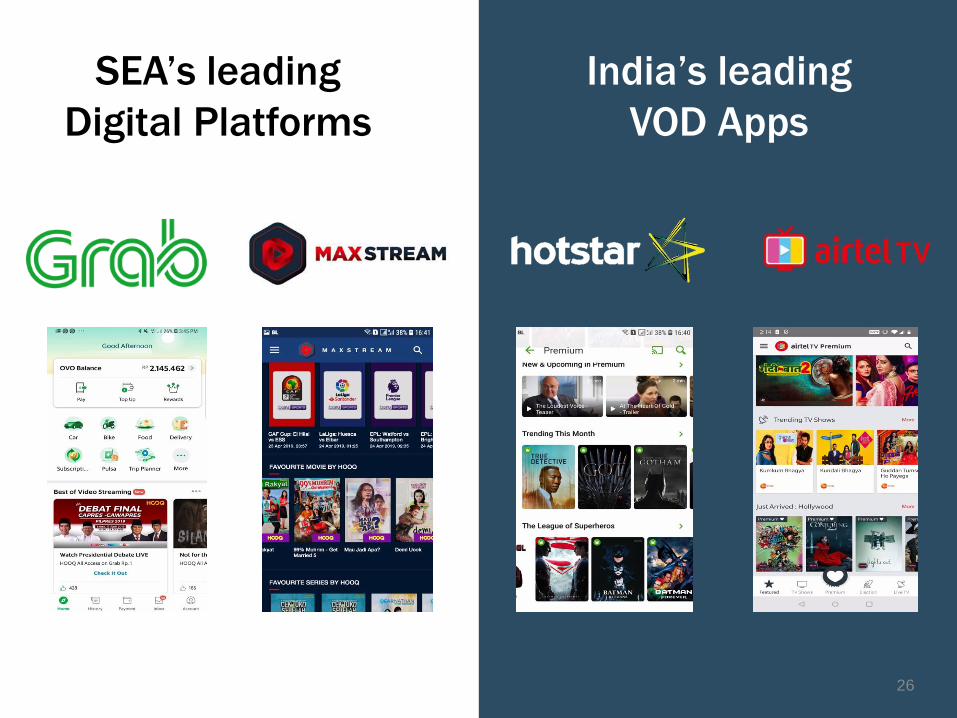
26
India’s leading
VOD Apps
SEA’s leading
Digital Platforms
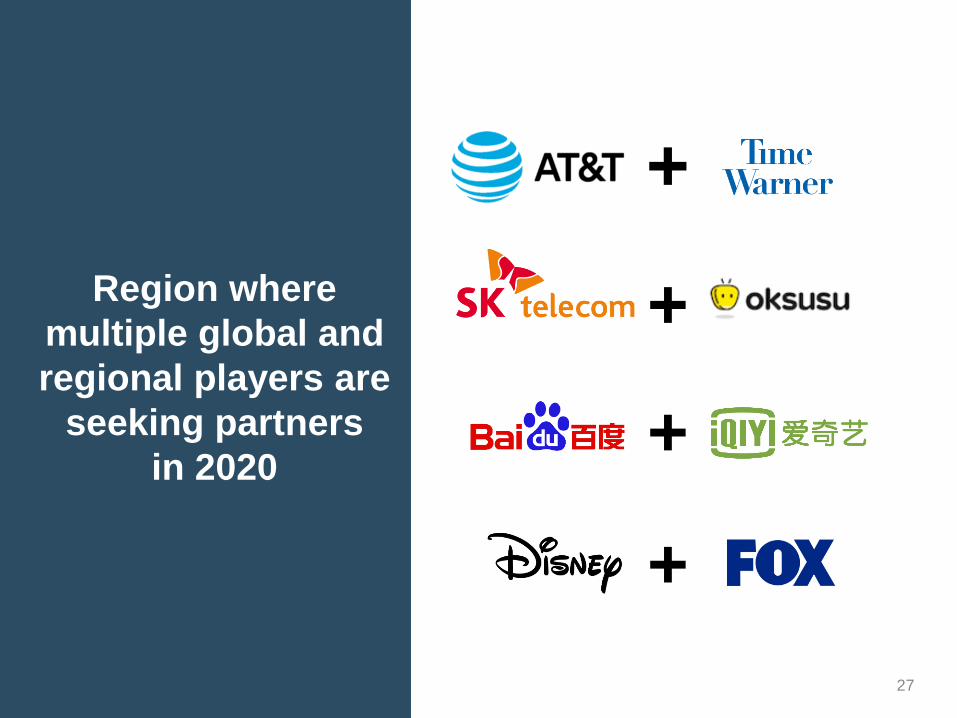
27
Region where
multiple global and
regional players are
seeking partners
in 2020

has built out products addressing 3 key use cases
28
Telco Network
Capex Optimisation
Transport Planning &
Operations Management
Out-of-Home
Planning

29
8 new investments, 11 follow-on investments, 2 exits
1,098 Startups seen
# of startups seen by category
802
112
184
Growth
Engines
Enablers
New and
Emerging
Services
(target: 50 – 70%)
(target: 20 – 30%)
(target: 10 – 20%)
73%
9%
18%
Digital Marketing (1)
Endpoint threat platform
Enterprise Security (6) Big Data and AI (4)
Ecommerce (1)
Network Security
Enterprise authentication
Digital data rights management
Advanced app security
Video analytics platform
Data analytics platform
Computer vision
and deep learning
Data exchange platformEdtech (1)
Smart/Safe Cities (1)
End-to-end car marketplace
Autonomous mobile robots
Social learning network
Enterprise Solution (1)
Video analytics platform
Telco data
monetization platform
Next-Gen Network (1)
Network acceleration
Security rating platform
End-to-end healthcare platform
Fintech (2)
Healthtech (2)
Purchase intelligence platform
Digital assets banking solution
Employee benefits
and insurance platform
FY19 in reviewNew investments Follow-on investments Exits
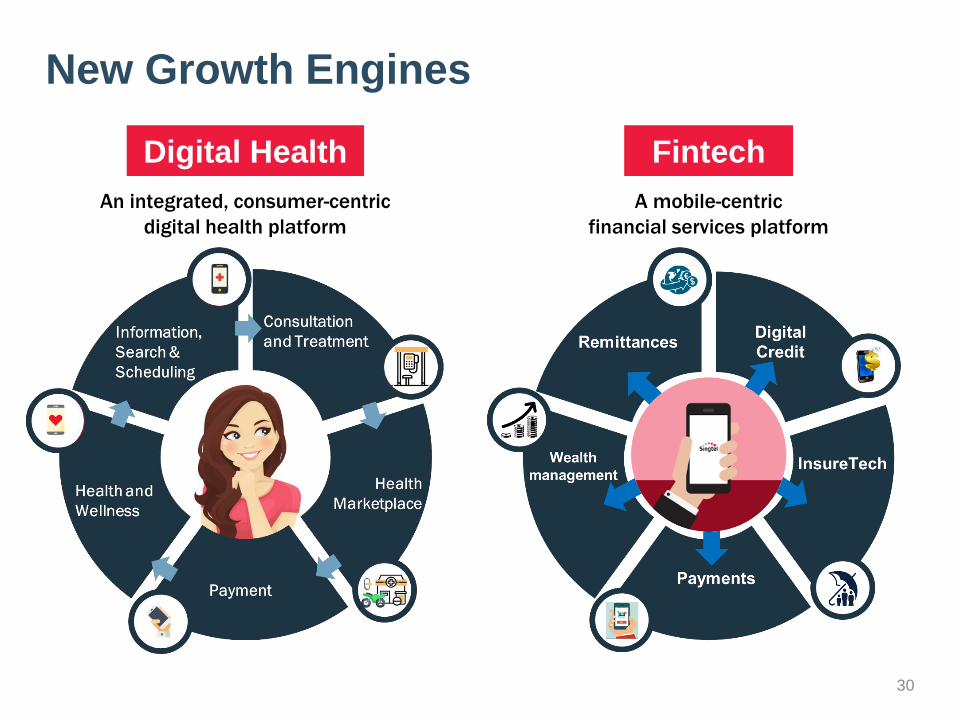
30
FintechDigital Health
A mobile-centric
financial services platform
An integrated, consumer-centric
digital health platform
New Growth Engines

Digital
Health
31
Digital Health ecosystem that
simplifies healthcare access
Employee benefits platform
powered by analytics
32
Revisiting the
Key Questions
What is Singtel’s appetite for future investments
in the digital businesses?
What will it take for Group Digital Life to achieve
profitability, and when will this happen?
What is the plan to crystallize the value of the
Group’s digital businesses?
What is the plan for Amobee and HOOQ? Is
Singtel investing more, and how does that
impact profitability?


