59
r SOCIETAL COSTS AND BENEFITS

r-'ç
SOCIETAL COSTS AND BENEFITS
The designations employed and the presentation of material in this information product do not imply the expression of any opinion whatsoeveron the part of the Food and Agriculture Organization of the United Nations (FAO) concerning the legal or development status of any country,territory, city or area or of its authorities, or concerning the delimitation of its frontiers or boundaries. The mention of specific companies orproducts of manufacturers, whether or not these have been patented, does not imply that these have been endorsed or recommended by FAOin preference to others of a similar nature that are not mentioned.The views expressed in this information product are those of the author(s) and do not necessarily reflect the views or policies of FAO.
ISBN 978-92-5-108510-3 (print)E-ISBN 978-92-5-108511-0 (PDF)
© FAO 2014
FAO encourages the use, reproduction and dissemination of material in this information product. Except where otherwise indicated, materialmay be copied, downloaded and printed for private study, research and teaching purposes, or for use in non-commercial products or services,provided that appropriate acknowledgement of FAO as the source and copyright holder is given and that FAO’s endorsement of users’ views,products or services is not implied in any way.All requests for translation and adaptation rights, and for resale and other commercial use rights should be made via www.fao.org/contactus/li-cence-request or addressed to [email protected] information products are available on the FAO website (www.fao.org/publications) and can be purchased through [email protected].
About this documentFood Wastage Footprint (FWF) is a project led by Nadia El-Hage Scialabba, Climate, Energy and Tenure Division. Phase I of the FWF project mod-eled the impacts of food loss and waste on climate, land, water and biodiversity. Phase II of the project, commissioned to the Research Institutefor Organic Farming (FiBL), Switzerland, expanded the project to include modules on full-cost accounting of societal externalities of food wastage.This report is linked to three other publications: (i) Food Wastage Footprint: Impacts on Natural Resources (FAO 2013); (ii) Toolkit: Reducing theFood Wastage Footprint (FAO 2013); and Food Wastage Footprint: Full-Cost Accoounting (FAO 2014). This publication is aimed both towardconsumers and their purchasing and consumption habits and to policy-makers who have the potential to set regulations and make investmentsthat will lesson the burden of food wastage on society and our planet’s natural resources.
AcknowledgementsFAO wishes to thank FIBL staff Adrian Muller, Christian Schader, Uta Schmidt and Patricia Schwegler, FiBL. Thanks also go to Anthony Bennett,Alessia Cecchini, Zhijun Chen, Martin Gummert, Mathilde Iweins, Laura Marchelli, Soren Moller, Ludovica Principato and Andrea Segrè for theircontributions to the case studies. Francesca Lucci is thanked for the design of all products of the FWF project, including videos andpublications.The FWF project was undertaken with the generous financial support of the Federal Republic of Germany.
The FWF project products are available at: www.fao.org/nr/sustainability/food-loss-and-waste


Executive Summary 5
Introduction 6
1. Methods 8
2. Case studies of mitigation measures 9
2.1 Overview of mitigation strategies 9
Case study 1: Milk cooler (Kenya) 11
Case study 2: Household food waste prevention (UK) 16
Case study 3: Rice Super Bags (Philippines) 21
Case study 4: Improved carrot sorting (Switzerland) 26
Case study 5: Food banks (Germany) 30
Case study 6: Canteen surplus to food banks (Italy) 36
Case study 7: Food wastage as pig feed (Australia) 40
2.2 Synthesis of case studies 45
3. Lessons learned from the case studies 46
4. Conclusions and recommendations 50
References 52
ANNEX: INDICATORS OF THE ENVIRONMENTAL AND FINANCIAL PERFORMANCE OF FOOD WASTAGE MITIGATION MEASURES (inserted into the back cover)
Table of Contents
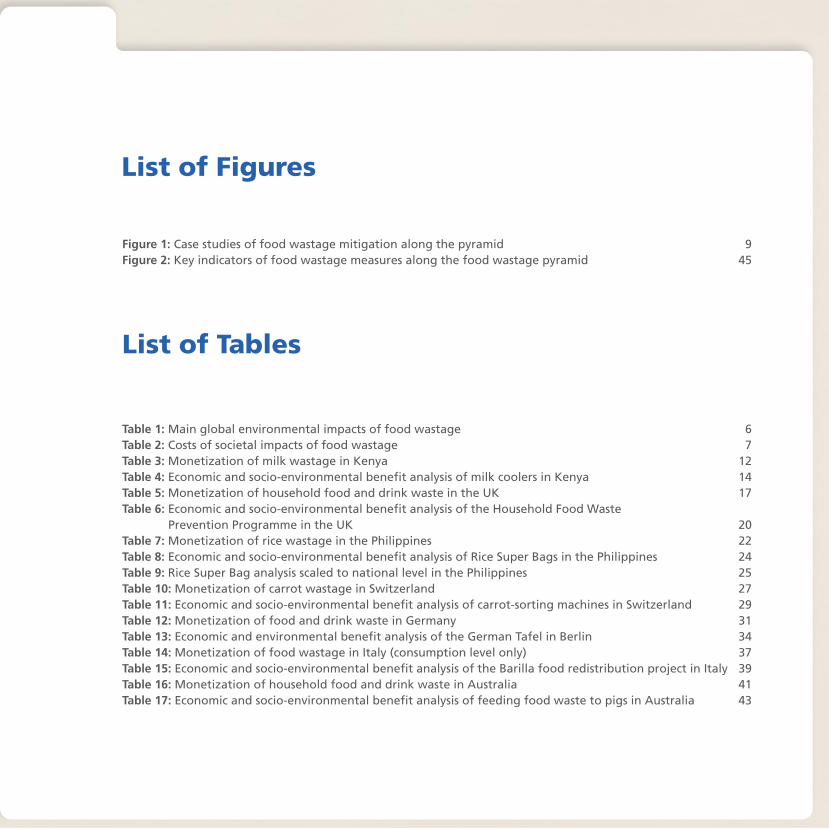
Figure 1: Case studies of food wastage mitigation along the pyramid 9Figure 2: Key indicators of food wastage measures along the food wastage pyramid 45
List of Tables
Table 1: Main global environmental impacts of food wastage 6Table 2: Costs of societal impacts of food wastage 7Table 3: Monetization of milk wastage in Kenya 12Table 4: Economic and socio-environmental benefit analysis of milk coolers in Kenya 14Table 5: Monetization of household food and drink waste in the UK 17Table 6: Economic and socio-environmental benefit analysis of the Household Food Waste
Prevention Programme in the UK 20Table 7: Monetization of rice wastage in the Philippines 22Table 8: Economic and socio-environmental benefit analysis of Rice Super Bags in the Philippines 24Table 9: Rice Super Bag analysis scaled to national level in the Philippines 25Table 10: Monetization of carrot wastage in Switzerland 27Table 11: Economic and socio-environmental benefit analysis of carrot-sorting machines in Switzerland 29Table 12: Monetization of food and drink waste in Germany 31Table 13: Economic and environmental benefit analysis of the German Tafel in Berlin 34Table 14: Monetization of food wastage in Italy (consumption level only) 37Table 15: Economic and socio-environmental benefit analysis of the Barilla food redistribution project in Italy 39Table 16: Monetization of household food and drink waste in Australia 41Table 17: Economic and socio-environmental benefit analysis of feeding food waste to pigs in Australia 43
List of Figures
5
Executive Summary
In recent years, progress has been made globally in establishing sustainable food production systemsaimed at improving food and nutrition security and the judicial use of natural resources. Yet, all of thoseefforts are in vain when the food produced in those systems is lost or wasted and never consumed. As food wastage increases in parallel with production increases, it becomes even more important torecognize that reducing food wastage must be part of any effort aimed at sustainable productionand food security. In addition to this, there also are environmental repercussions, including all of thenatural resources used and greenhouse gases emitted during the production or disposal of food thatis not consumed. Analysis of food wastage causalities suggests that it is economically rational to loose food as part ofthe costs are externalized, and incentives to producers and consumers along the supply chain furtherencourages not taking into account negative externalities such as environmental costs. However,food wastage has huge environmental impacts and corresponding societal costs that need to bedealt with. Mitigation of this wastage must become a priority for each actor along the food chain. This paper presents a portfolio of potential food wastage mitigation measures, illustrating the grossand net economic, environmental and societal benefits of each. Adopting appropriate food wastagemitigation measures can offer corresponding huge environmental benefits, leading to associatednet gains for societies in terms of reduced economic losses and external costs. The performance ofmeasures aiming at avoiding food wastage tends to be higher than for reusing, recycling of foodproducts and certainly higher than landfilling. Assessments reveal different pictures, depending on the indicators used, such as GHG reduction pertonne of avoided food waste, GHG reduction per tonne of GHG emitted by the mitigation measure,or financial benefits per dollar invested. While for most measures, environmental benefits are un-ambiguously high, economic profitability can hinge on voluntary work, such as is often the case forfood distribution to charities. With paid work, such measures can be less cost effective, even whenaccounting for avoided external costs. This highlights the importance of community commitmentand engagement in food wastage reduction. Full-cost accounting informs about the direct and in-direct cost-benefit potential of different options.The highest aggregate impact reductions are clearly achieved with high volumes of wastage andhigh impact, so mitigation policies should first address commodities that have the highest environ-mental impact.Getting more food to family meals requires innovative thinking and partnerships along the entire sup-ply chain. However, the efforts also should extend beyond the food and agriculture sector, as severalother sectors (such as energy) have a key role to play. With increasing natural resource scarcity andchanging food and energy market prices, the need for food wastage mitigation programmes will be-come more obvious in terms of their potential beneficial in both societal and economic terms. As thishappens, improvements – whether self-driven or government-calatyzed – will most likely increase.
6
Introduction
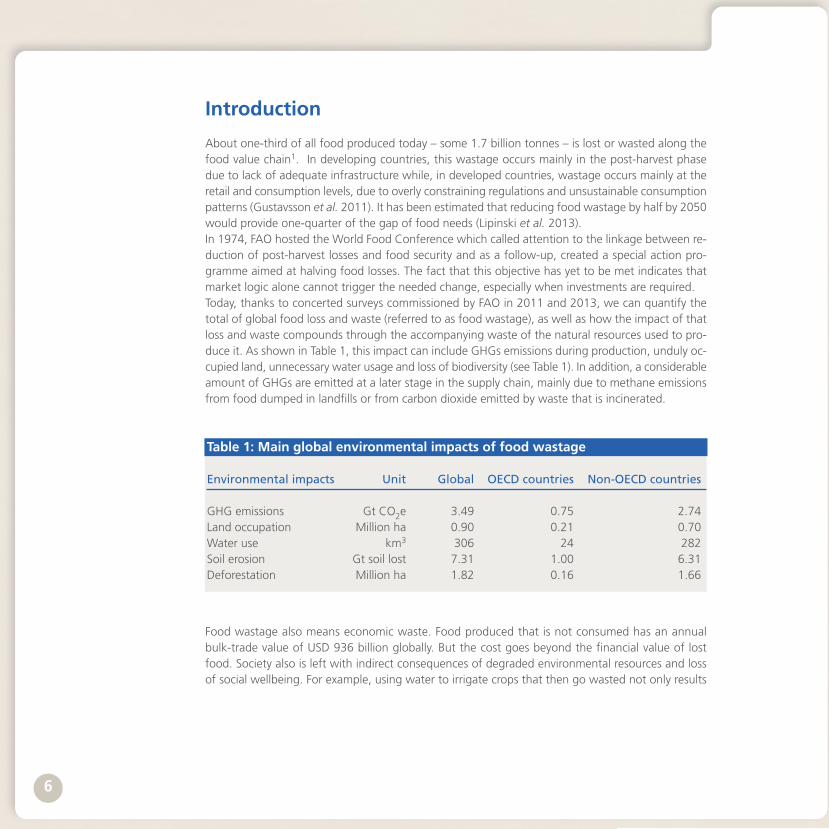
About one-third of all food produced today – some 1.7 billion tonnes – is lost or wasted along thefood value chain1. In developing countries, this wastage occurs mainly in the post-harvest phasedue to lack of adequate infrastructure while, in developed countries, wastage occurs mainly at theretail and consumption levels, due to overly constraining regulations and unsustainable consumptionpatterns (Gustavsson et al. 2011). It has been estimated that reducing food wastage by half by 2050would provide one-quarter of the gap of food needs (Lipinski et al. 2013).In 1974, FAO hosted the World Food Conference which called attention to the linkage between re-duction of post-harvest losses and food security and as a follow-up, created a special action pro-gramme aimed at halving food losses. The fact that this objective has yet to be met indicates thatmarket logic alone cannot trigger the needed change, especially when investments are required. Today, thanks to concerted surveys commissioned by FAO in 2011 and 2013, we can quantify thetotal of global food loss and waste (referred to as food wastage), as well as how the impact of thatloss and waste compounds through the accompanying waste of the natural resources used to pro-duce it. As shown in Table 1, this impact can include GHGs emissions during production, unduly oc-cupied land, unnecessary water usage and loss of biodiversity (see Table 1). In addition, a considerableamount of GHGs are emitted at a later stage in the supply chain, mainly due to methane emissionsfrom food dumped in landfills or from carbon dioxide emitted by waste that is incinerated.
Food wastage also means economic waste. Food produced that is not consumed has an annualbulk-trade value of USD 936 billion globally. But the cost goes beyond the financial value of lostfood. Society also is left with indirect consequences of degraded environmental resources and lossof social wellbeing. For example, using water to irrigate crops that then go wasted not only results
Table 1: Main global environmental impacts of food wastage
Environmental impacts Unit Global OECD countries Non-OECD countries
GHG emissions Gt CO2e 3.49 0.75 2.74Land occupation Million ha 0.90 0.21 0.70Water use km3 306 24 282Soil erosion Gt soil lost 7.31 1.00 6.31Deforestation Million ha 1.82 0.16 1.66

7
in the direct loss of the economic value of the water used, it can also compound water scarcity inthe production region, leading to additional costs. Similarly, any food production may increase soildegradation, but if that food is wasted, it means that there was no benefit from the use of the soiland its nutrients and there will be corresponding social costs which may even contribute to sparkingconflicts, due to increased scarcity of fertile land (see Table 2).
1This includes edible and non-edible parts, i.e. it is measured in “primary product equivalents”, thus, for example, not counting“wheat flour” but “wheat grains” (which is about 30% more in weight due to byproducts (brans and germ) and processinglosses. In total, the difference is about 20%, as “edible parts” would only account for about 1.3–1.4 billion tonnes.
Table 2: Costs of societal impacts of food wastage (USD billion per year - 2012 value)
Costs Global OECD countries Non-OECD countries
GHG emissions 394 85 309Deforestation (as a proxy for land occupation)a 2.9 0.3 2.6Water use 7.7 2.2 5.5Water scarcity 164 14 150Water pollution 24 13 11Soil erosion 34.6 16.4 18.2Biodiversity 9.5 4.4 5.2Health (acute pesticide incidence costs)b 8 0.8 7.2Livelihood (adults)c 228.6 7.8 230.8Individual health (adults)c 102 2.8 99.2Conflict (adults) 248.9 n.a. n.a.Total 1 224.2 146.7d 838.7d
Notes: a As no land values are available, the costs of land use and land occupation due to food wastage cannot be determined di-rectly. Thus, the costs of deforestation are used as a proxy for the costs of land occupation, as this strongly relates to theareas used for agricultural production.
b These represent public health expenditures only, including costs for medical treatment and the like. Individual costs, costsdue to loss of labour force and other individual costs are not included.
c The conflict estimate is provided for global values only, due to small sample size for regional estimates; The difference bet-ween OECD and non-OECD numbers for livelihood and individual health are due to calculations based on per capita andyear costs of one unit of environmental impact (soil erosion/toxicity) and the fact that these incidence levels are about sixtimes higher in non-OECD than OECD, and that population in non-OECD is also about six times that of OECD. The OECDand non-OECD estimates do not sum to the global numbers, as they are based on three separate regressions leading toregionally different parameter estimates.
d Excluding conflicts, as these costs are provided on global level only.

8
Businesses and consumers are more likely to participate in preventing and reducing food wastagewhen mitigation measures are economically attractive or when they are required to comply withlegally binding requirements. Hence, there is need for instruments that reflect the real cost of foodwastage.The urgency of food wastage mitigation becomes even more pressing when full societal costs areunderstood. But to give the full picture, any investment in mitigating food wastage needs to bebroadly evaluated, in terms of potential environmental, social and economic costs and benefits. Todate, there are gross estimates of the size of food wastage volumes and their environmental impacts,but almost no information on the related costs to society. Similarly, much is known about technicalaspects of food wastage measures (Gustavsson et al. 2011), but the environmental and societal costsand aggregate reduction potential of food wastage measures are largely unknown. To fill this gap,FAO has engaged in work on cost accounting of food wastage to provide a basis for informed de-cision-making. Cost accounting makes the true societal costs of food wastage and its mitigation ex-plicit and, in turn, allows a more encompassing and realistic assessment and understanding of thebenefits of food wastage mitigation.
1. Methods
The FAO framework for full-cost accounting of food wastage describes the effects of food wastageand its mitigation in the context of the global economy, and suggests viable and easily managedmethods for estimating specific parts of these costs. This includes global estimates on quantifiableenvironmental and social costs, and assessments of the costs and benefits of a range of concretefood wastage mitigation measures which, added together, illustrate the potential effects of foodwastage mitigation. It is important to note that food wastage and its mitigation have different outcomes, depending onwhere along the supply chain wastage occurs, or where the mitigation measure is implemented. Forexample, pre- and post-harvest losses result in costs for producers, due to lost income and wastedinput costs. Ironically, losses at the processing, distribution or consumption stage can also be bene-ficial for producers, as they lead to scarcity and thus higher demand. Similarly, wastage at the retaillevel is costly to the retailer, but wastage at the consumer level can mean higher sales and revenuesfor retailers. Furthermore, the effectiveness of any food wastage measures will vary greatly dependingon the type of intervention, with avoidance of wastage from the outset faring better than reuse orrecovery of food wastage. When discussing food wastage, its mitigation and the related costs andbenefits, it is thus crucial to address the distribution of costs and benefits, especially when there isneed to make decisions on concrete mitigation measures. It also should be noted that, no matter how efficient or beneficial, there are still costs involved inmitigation measures. Thus, from a societal perspective, “zero waste” cannot be a goal, as achievingit would require much higher mitigation costs. From an economic perspective, there is an optimallevel of wastage in a society – a level considerably lower than the wastage level of today.
1. Methods
REDUCEAvoided lossof natural resources
Savednatural resources
RECYC LE/REC,C)VbliWastednatural resources
LANDFILL
TYPE OF REDUCTION MEASURE
Milk coolerInformation campaign
IRRI bag
Food banks
Feeding pigs
Anaerobic digestion
141, Incineration
from the most to the leastenvironmentally-friendly
9
This document focuses on case studies of different food wastage mitigation measures in order to il-lustrate the full-cost accounting of food wastage in concrete cases and to inform decision-makerson the cost and benefits of different investment options2. The choice of the case studies was basedon the desire to cover different commodities and food wastage hotspots, as well as types of inter-ventions, namely those that reduce, reuse, recycle, recover and dispose of waste.
2. Case studies of mitigation measures
2.1. Overview of mitigation strategies
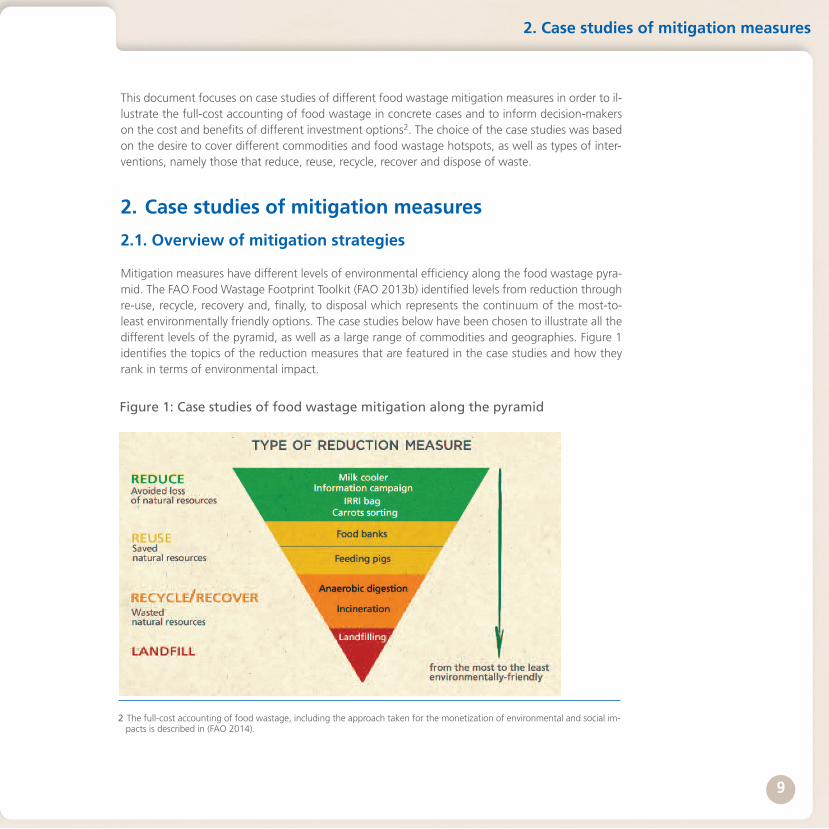
Mitigation measures have different levels of environmental efficiency along the food wastage pyra-mid. The FAO Food Wastage Footprint Toolkit (FAO 2013b) identified levels from reduction throughre-use, recycle, recovery and, finally, to disposal which represents the continuum of the most-to-least environmentally friendly options. The case studies below have been chosen to illustrate all thedifferent levels of the pyramid, as well as a large range of commodities and geographies. Figure 1identifies the topics of the reduction measures that are featured in the case studies and how theyrank in terms of environmental impact.
2. Case studies of mitigation measures
Figure 1: Case studies of food wastage mitigation along the pyramid
2 The full-cost accounting of food wastage, including the approach taken for the monetization of environmental and social im-pacts is described in (FAO 2014).
10
Some case studies have a more individual or business focus, such as the one featuring a carrot-sorting machine, while others, such as the one that looks at the contribution of food banks, have asociety focus. The difference arises in how certain effects are judged as benefits or costs. Reducinglabour, for example, is a benefit from a business perspective, as it reduces wage payments but, froma societal point of view, it can be problematic. Voluntary and unpaid work, on the other hand, canbe of big value for society, while it would not have a place in a business operation.
2. Case studies of mitigation measures
11
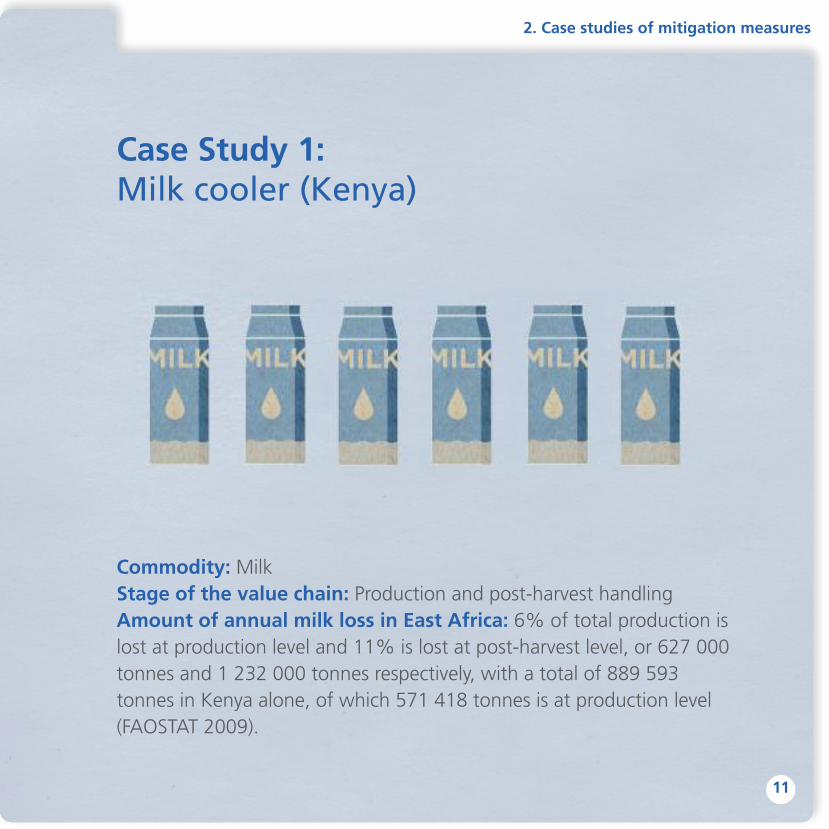
Case Study 1: Milk cooler (Kenya)
2. Case studies of mitigation measures
Commodity: MilkStage of the value chain: Production and post-harvest handling Amount of annual milk loss in East Africa: 6% of total production islost at production level and 11% is lost at post-harvest level, or 627 000tonnes and 1 232 000 tonnes respectively, with a total of 889 593tonnes in Kenya alone, of which 571 418 tonnes is at production level(FAOSTAT 2009).
12
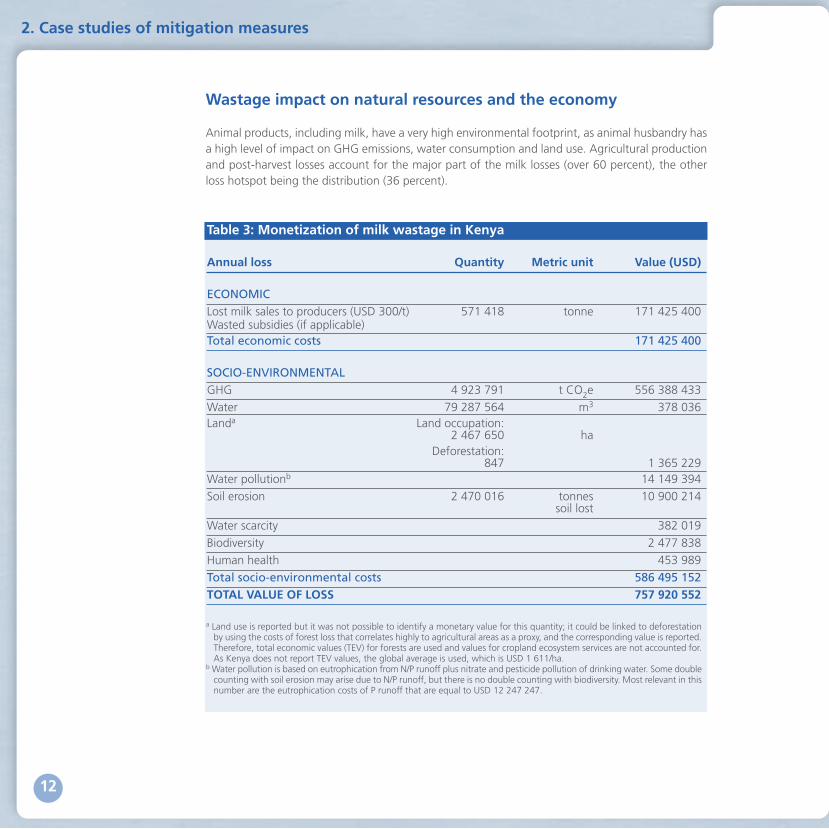
Wastage impact on natural resources and the economy
Animal products, including milk, have a very high environmental footprint, as animal husbandry hasa high level of impact on GHG emissions, water consumption and land use. Agricultural productionand post-harvest losses account for the major part of the milk losses (over 60 percent), the otherloss hotspot being the distribution (36 percent).
Table 3: Monetization of milk wastage in Kenya
Annual loss Quantity Metric unit Value (USD)
ECONOMIC Lost milk sales to producers (USD 300/t) 571 418 tonne 171 425 400Wasted subsidies (if applicable)Total economic costs 171 425 400
SOCIO-ENVIRONMENTAL GHG 4 923 791 t CO2e 556 388 433
Water 79 287 564 m3 378 036Landa Land occupation:
2 467 650 haDeforestation:
847 1 365 229Water pollutionb 14 149 394
Soil erosion 2 470 016 tonnes 10 900 214soil lost
Water scarcity 382 019
Biodiversity 2 477 838
Human health 453 989
Total socio-environmental costs 586 495 152 TOTAL VALUE OF LOSS 757 920 552
a Land use is reported but it was not possible to identify a monetary value for this quantity; it could be linked to deforestationby using the costs of forest loss that correlates highly to agricultural areas as a proxy, and the corresponding value is reported.Therefore, total economic values (TEV) for forests are used and values for cropland ecosystem services are not accounted for.As Kenya does not report TEV values, the global average is used, which is USD 1 611/ha.
b Water pollution is based on eutrophication from N/P runoff plus nitrate and pesticide pollution of drinking water. Some doublecounting with soil erosion may arise due to N/P runoff, but there is no double counting with biodiversity. Most relevant in thisnumber are the eutrophication costs of P runoff that are equal to USD 12 247 247.
2. Case studies of mitigation measures
13
Full-cost of wastage reduction measure
Description:Milk deteriorates fast at ambient temperature in Africa, which is a major cause of pro-duction and post-harvest milk losses. Installing milk cooling devices at the farmer cooperative levelenables farmers to fight these losses. Reference scenario: Farmers rarely have milk coolers, meaning the milk not sold immediately de-teriorates quickly.Scope of the measure: The cooling device considered by this case study is able to cool and store 1000 litres of milk. Through the milk coolers, almost all of the 15 percent of production lost could besaved.Life span: The average useful life of most dairy equipment is about 8 years.System boundaries: Only the milk cooler itself has been studied, not the rest of the cold chain, northe building in which the milk cooler should operate. The maintenance work for the milk cooler, aswell as the socio-environmental costs of manufacturing the cooler have been also excluded fromthe calculation, as the running costs are usually much higher. Economically, only the sales of the“saved” milk have been included, though milk coolers are also often linked to improved milk pro-duction through higher yields and higher revenues for the famer.Data sources: The year 2009 is the reference year. Data are based on FAOSTAT for milk prices, expertopinions for milk loss reduction potential, energy need and investment return and for energy costs(Bohm et al. 2013). For calculating the environmental impacts of the saved milk, FAOSTAT data wasmodelled.
Economic and socio-environmental cost-benefit analysis of the foodwastage reduction measure
Economic cost of the measure: A 1 000-litre milk cooler costs around USD 7 000, with an associ-ated 10 percent two-years micro-credit interest rate, and electricity running costs of USD0.01/litre/day).Economic benefit of the measure: Possibility to sell more milk at USD 0.3/litre (FAOSTAT).Environmental cost of the measure: Production and powering of the milk cooler.Environmental benefit of the measure: Milk loss reduction, saving 150 litres of milk per day foreach 1 000-litre milk cooler (i.e. 54 750 litre/year).Investment burden: The initial cost of the milk cooler is USD 7 000, also taking into account the10 percent credit interest rate.Investment breakeven point: Reached after two years.
2. Case studies of mitigation measures
14
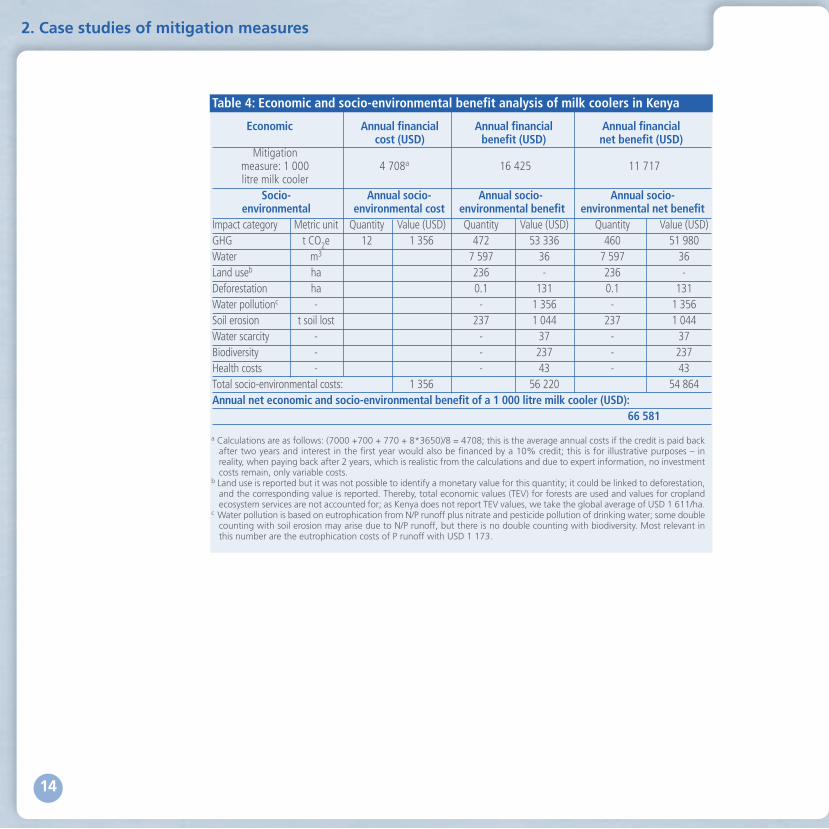
Economic Annual financial Annual financial Annual financial cost (USD) benefit (USD) net benefit (USD)
Mitigation measure: 1 000 4 708a 16 425 11 717litre milk cooler
Socio- Annual socio- Annual socio- Annual socio- environmental environmental cost environmental benefit environmental net benefit
Impact category Metric unit Quantity Value (USD) Quantity Value (USD) Quantity Value (USD)GHG t CO2e 12 1 356 472 53 336 460 51 980Water m3 7 597 36 7 597 36Land useb ha 236 - 236 -Deforestation ha 0.1 131 0.1 131Water pollutionc - - 1 356 - 1 356Soil erosion t soil lost 237 1 044 237 1 044Water scarcity - - 37 - 37Biodiversity - - 237 - 237Health costs - - 43 - 43Total socio-environmental costs: 1 356 56 220 54 864Annual net economic and socio-environmental benefit of a 1 000 litre milk cooler (USD):
66 581
a Calculations are as follows: (7000 +700 + 770 + 8*3650)/8 = 4708; this is the average annual costs if the credit is paid backafter two years and interest in the first year would also be financed by a 10% credit; this is for illustrative purposes – inreality, when paying back after 2 years, which is realistic from the calculations and due to expert information, no investmentcosts remain, only variable costs.
b Land use is reported but it was not possible to identify a monetary value for this quantity; it could be linked to deforestation,and the corresponding value is reported. Thereby, total economic values (TEV) for forests are used and values for croplandecosystem services are not accounted for; as Kenya does not report TEV values, we take the global average of USD 1 611/ha.
c Water pollution is based on eutrophication from N/P runoff plus nitrate and pesticide pollution of drinking water; some doublecounting with soil erosion may arise due to N/P runoff, but there is no double counting with biodiversity. Most relevant inthis number are the eutrophication costs of P runoff with USD 1 173.
2. Case studies of mitigation measures
Table 4: Economic and socio-environmental benefit analysis of milk coolers in Kenya
15
Potential of food wastage reduction measure
Opportunities:Milk cooler dissemination within farmer cooperatives that produce enough milk torun one or several 1000-litre milk coolers efficiently makes sense economically. Its environmentalbenefits make it a great way to reduce food losses. While the initial financial investment is costly,there is an apparent return on investment by the second year. Constraints: The initial investment in the milk cooler is a major issue for farmer associations, as accessto credit is difficult. Also, energy supply in Kenya is not reliable, and these calculations have beenmade on the basis of a functioning national grid. This means that the purchase of a generator andthe costs of its fuel should be added to the costs. Calculations have been made on the GHG impactsof using a generator instead of the national grid and the emission are multiplied by a factor 2.5.
Further methodological annotations
• The energy needed to cool 12 litres of milk is 1 kWh/day. • The GHG emissions are 0.395 kg CO2/kWh using the average national grid emission factor inKenya from the national grid. If the energy is coming from a diesel generator, the fuel consumptionis estimated at 0.3 litres/kWh and the total GHG emission (direct + indirect) factor is 3.2413kgCO2/litre which is 0.973 kg CO2/kWh.
• This assumes there is a market for the cooled milk and the rest of the cold chain is in place.
2. Case studies of mitigation measures
Wrap
Waste preventionKeY Are
ruouut. muu rue. eau ToIm 'MO% MS
r?-,t ,Wu. p.o.e./Wm mhon 1.1,0autaury, sue Was. 1,,,,nmotm Lo." Courtauld COmulturt.
Mot tousle M1grarrs F
Lure...wade,. Pe. 4-4,ovos.,
%ISIS&
00
16
Case Study 2: Communication campaign: the Household Food Waste Prevention Programme of UK Wasteand Resources Action Programme(WRAP)
2. Case studies of mitigation measures
Commodity: Food and drinkStage of the value chain: ConsumptionAmount of annual household food and drink waste (UK):5 421 873 tonnes in 2012, avoidable and possibly avoidable(WRAP 2013b).
17
Wastage impact on natural resources and the economy
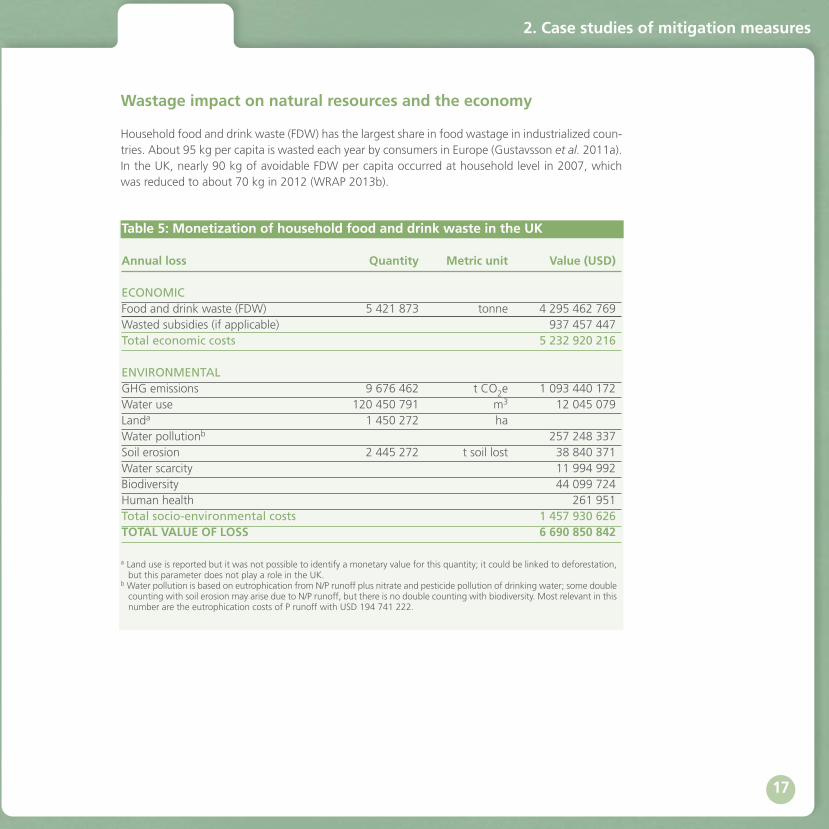
Household food and drink waste (FDW) has the largest share in food wastage in industrialized coun-tries. About 95 kg per capita is wasted each year by consumers in Europe (Gustavsson et al. 2011a).In the UK, nearly 90 kg of avoidable FDW per capita occurred at household level in 2007, whichwas reduced to about 70 kg in 2012 (WRAP 2013b).
a Land use is reported but it was not possible to identify a monetary value for this quantity; it could be linked to deforestation,but this parameter does not play a role in the UK.
b Water pollution is based on eutrophication from N/P runoff plus nitrate and pesticide pollution of drinking water; some doublecounting with soil erosion may arise due to N/P runoff, but there is no double counting with biodiversity. Most relevant in thisnumber are the eutrophication costs of P runoff with USD 194 741 222.
Table 5: Monetization of household food and drink waste in the UK
Annual loss Quantity Metric unit Value (USD)
ECONOMIC Food and drink waste (FDW) 5 421 873 tonne 4 295 462 769Wasted subsidies (if applicable) 937 457 447 Total economic costs 5 232 920 216
ENVIRONMENTAL GHG emissions 9 676 462 t CO2e 1 093 440 172Water use 120 450 791 m3 12 045 079Landa 1 450 272 haWater pollutionb 257 248 337Soil erosion 2 445 272 t soil lost 38 840 371Water scarcity 11 994 992Biodiversity 44 099 724Human health 261 951Total socio-environmental costs 1 457 930 626 TOTAL VALUE OF LOSS 6 690 850 842
2. Case studies of mitigation measures
18
Full-cost of wastage reduction measure
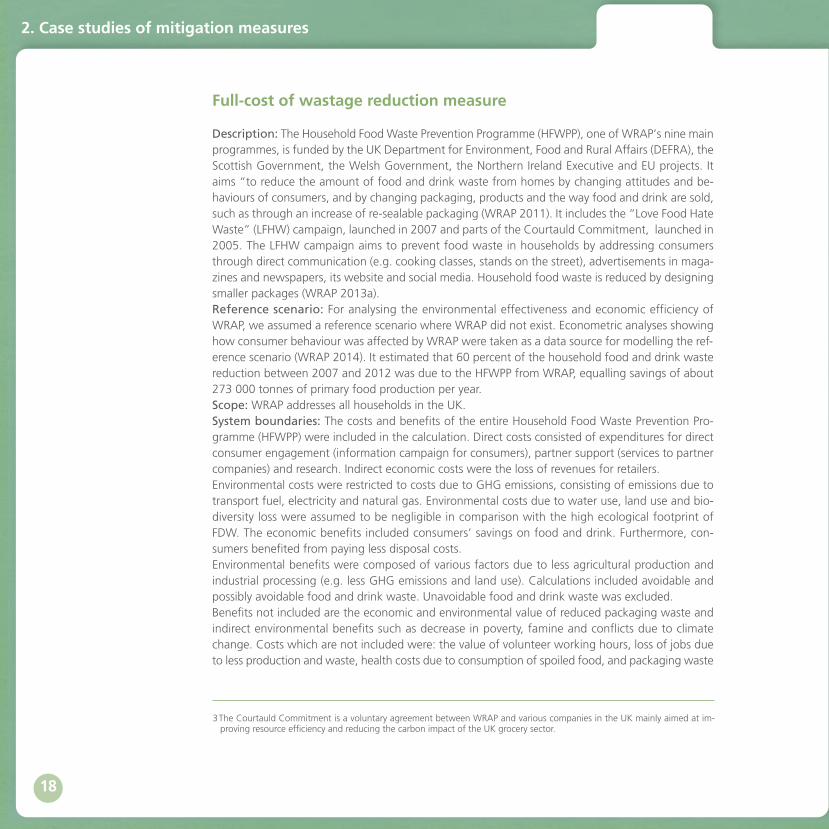
Description: The Household Food Waste Prevention Programme (HFWPP), one of WRAP’s nine mainprogrammes, is funded by the UK Department for Environment, Food and Rural Affairs (DEFRA), theScottish Government, the Welsh Government, the Northern Ireland Executive and EU projects. Itaims “to reduce the amount of food and drink waste from homes by changing attitudes and be-haviours of consumers, and by changing packaging, products and the way food and drink are sold,such as through an increase of re-sealable packaging (WRAP 2011). It includes the “Love Food HateWaste” (LFHW) campaign, launched in 2007 and parts of the Courtauld Commitment, launched in2005. The LFHW campaign aims to prevent food waste in households by addressing consumersthrough direct communication (e.g. cooking classes, stands on the street), advertisements in maga-zines and newspapers, its website and social media. Household food waste is reduced by designingsmaller packages (WRAP 2013a). Reference scenario: For analysing the environmental effectiveness and economic efficiency ofWRAP, we assumed a reference scenario where WRAP did not exist. Econometric analyses showinghow consumer behaviour was affected by WRAP were taken as a data source for modelling the ref-erence scenario (WRAP 2014). It estimated that 60 percent of the household food and drink wastereduction between 2007 and 2012 was due to the HFWPP from WRAP, equalling savings of about273 000 tonnes of primary food production per year. Scope: WRAP addresses all households in the UK.System boundaries: The costs and benefits of the entire Household Food Waste Prevention Pro-gramme (HFWPP) were included in the calculation. Direct costs consisted of expenditures for directconsumer engagement (information campaign for consumers), partner support (services to partnercompanies) and research. Indirect economic costs were the loss of revenues for retailers. Environmental costs were restricted to costs due to GHG emissions, consisting of emissions due totransport fuel, electricity and natural gas. Environmental costs due to water use, land use and bio-diversity loss were assumed to be negligible in comparison with the high ecological footprint ofFDW. The economic benefits included consumers’ savings on food and drink. Furthermore, con-sumers benefited from paying less disposal costs. Environmental benefits were composed of various factors due to less agricultural production andindustrial processing (e.g. less GHG emissions and land use). Calculations included avoidable andpossibly avoidable food and drink waste. Unavoidable food and drink waste was excluded. Benefits not included are the economic and environmental value of reduced packaging waste andindirect environmental benefits such as decrease in poverty, famine and conflicts due to climatechange. Costs which are not included were: the value of volunteer working hours, loss of jobs dueto less production and waste, health costs due to consumption of spoiled food, and packaging waste
3The Courtauld Commitment is a voluntary agreement between WRAP and various companies in the UK mainly aimed at im-proving resource efficiency and reducing the carbon impact of the UK grocery sector.
2. Case studies of mitigation measures
19
due to smaller packaging. The programme was assumed to have major impact on food markets, asthe demand for food was reduced. Price reactions have not been considered.Data sources: WRAP provided documentation and reports, shared internal data on the economicvalue of wasted food and drink, and made rounded figures available (WRAP 2013c). Environmentalbenefits due to saved food were calculated with a model based on FAOSTAT data and a study con-ducted by Gustavsson et al. (2011). Environmental costs of the HFWPP were calculated back fromelectricity and gas costs by taking year-specific average prices offered by the UK Department of En-ergy and Climate (DECC 2013) and conversion factors offered by DEFRA (2012). Environmental (costsdue to fuel use were based on miles driven by car, train and flight and also converted on basis ofdata from DEFRA (2012).
Economic and environmental cost-benefit analysis of food waste reduction measure
Economic cost of the measure: Expenditure for direct consumer engagement, partner supportand research, as well as decrease in revenues of retailers.Economic benefits of the measure: Consumer savings.Environmental cost of the measure: Energy costs (fuel, gas, electricity) and resulting social costsof carbon (SCC).Environmental benefits of the measure: Saved food.Investment burden: N/A.Investment breakeven point: N/A.
2. Case studies of mitigation measures

20
Potential of food wastage reduction measure
Opportunities: Conducting a programme such as the HFWPP makes sense economically and envi-ronmentally. The cost-benefit analysis revealed a huge benefit, in particular due to saving of GHGemissions.Constraints: Reaching all/enough people through such campaigns might be difficult. The mitigationopportunity of food and drink wastage in the UK is declining (WRAP 2013a), thus the potential ofsuch campaigns might become exhausted in a few years. Nevertheless, information campaigns canplay an important part in a portfolio of different food waste mitigation measures.
2. Case studies of mitigation measures
Economic Annual financial Annual financial Annual financial cost (USD) benefit (USD) net benefit (USD)
Mitigation measure: information campaignSocio- Annual socio- Annual socio- Annual socio-
environmental environmental cost environmental benefit environmental net benefit Impact category Metric unit Quantity Value (USD) Quantity Value (USD) Quantity Value (USD)GHG t CO2e 16.77 1 895 614 770 69 468 967 614 753 69 467 072Water m3 9 783 277 978 328 9 783 277 978 328Land usea ha 75 995 - 75 995 -Water pollutionb - - 13 287 125 - 13 287 125Soil erosion t soil lost 170 813 2 713 167 170 813 2 713 167Water scarcity - - 974 260 - 974 260Biodiversity - - 2 290 747 - 2 290 747Health costs - - 12 119 - 12 119Total socio-environmental costs: 1 895 89 724 713 89 722 818Annual net economic and socio-environmental benefit of the HFWPP information campaign (USD):
66 581
a Land use is reported but it was not possible to identify a monetary value for this quantity; it could be linked to deforestation,but this factor does not play a role in the UK.
b Water pollution is based on eutrophication from N/P runoff plus nitrate and pesticide pollution of drinking water; some doublecounting with soil erosion may arise due to N/P runoff, but there is no double counting with biodiversity. Most relevant inthis number are the eutrophication costs of P runoff with USD 10 204 483.
Table 6: Economic and socio-environmental benefit analysis of the Household Food Waste Prevention Programme in the UK
854 950 576 934 372 657 79 422 080
21
Case Study 3: IRRI Rice Super Bags (Philippines)
Commodity: RiceStage of the value chain: Post-harvest storage Amount of annual rice loss in the Philippines: 10% of total domestic production (FAOSTAT 2009) or 1 803 242 tonnes.
2. Case studies of mitigation measures
22
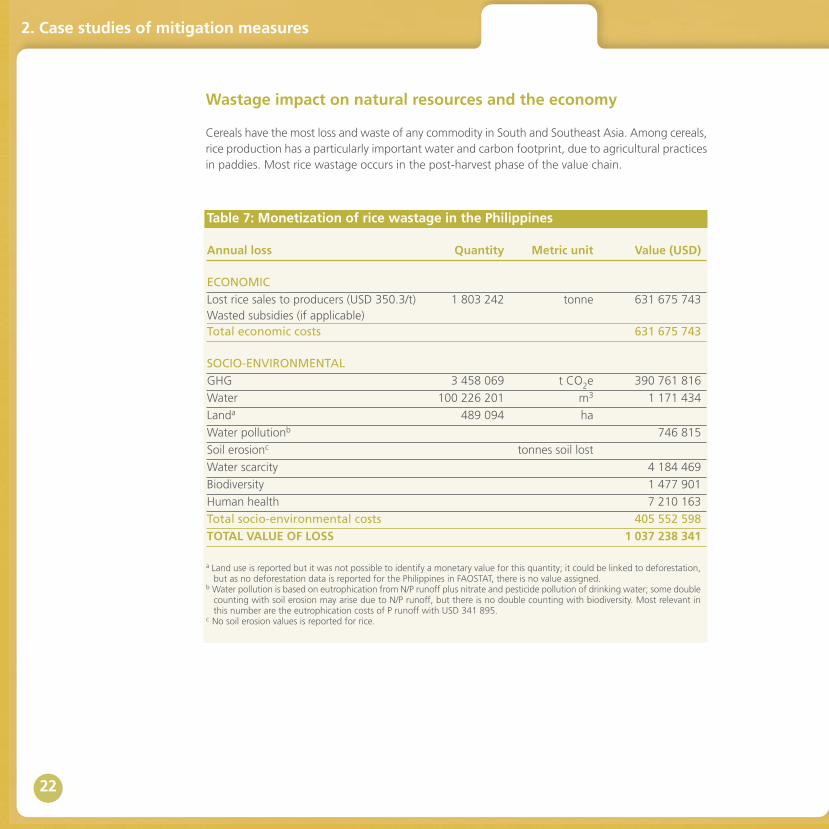
Wastage impact on natural resources and the economy
Cereals have the most loss and waste of any commodity in South and Southeast Asia. Among cereals,rice production has a particularly important water and carbon footprint, due to agricultural practicesin paddies. Most rice wastage occurs in the post-harvest phase of the value chain.
Table 7: Monetization of rice wastage in the Philippines
Annual loss Quantity Metric unit Value (USD)
ECONOMIC Lost rice sales to producers (USD 350.3/t) 1 803 242 tonne 631 675 743Wasted subsidies (if applicable)Total economic costs 631 675 743
SOCIO-ENVIRONMENTAL GHG 3 458 069 t CO2e 390 761 816
Water 100 226 201 m3 1 171 434
Landa 489 094 ha
Water pollutionb 746 815
Soil erosionc tonnes soil lost
Water scarcity 4 184 469
Biodiversity 1 477 901
Human health 7 210 163
Total socio-environmental costs 405 552 598 TOTAL VALUE OF LOSS 1 037 238 341
a Land use is reported but it was not possible to identify a monetary value for this quantity; it could be linked to deforestation,but as no deforestation data is reported for the Philippines in FAOSTAT, there is no value assigned.
b Water pollution is based on eutrophication from N/P runoff plus nitrate and pesticide pollution of drinking water; some doublecounting with soil erosion may arise due to N/P runoff, but there is no double counting with biodiversity. Most relevant inthis number are the eutrophication costs of P runoff with USD 341 895.
c No soil erosion values is reported for rice.
2. Case studies of mitigation measures
23
Full-cost of wastage reduction measure
Description: The Super Bag (SB), an ultra-hermetic bag that provides a water-resistant and gastightstorage solution, is used as an inner liner for jute bags and ordinary sacks. It is made of multilayerpolyethylene and protects rice from moisture, pest infestation and fungal growth. It was developedby the International Rice Research Institute (IRRI).Reference scenario: Under regular storage conditions (without the SB), 10 percent of stored ricecan be lost due to rodents or fungus.Scope of the measure: The 50 kg SB contributes to avoiding the 10 percent of rice lost due to fun-gus and rodents.Life span: The SB can be reused effectively for an average of 5 years.System boundaries: This case study looks specifically at the impact of the bag itself. It does not in-clude processes that happen before or after bagging, such as drying. It also does not incude trans-portation of the basic material for bag production to the production unit or the impact of thetransportation of the bag from the production to the retailing site.Data sources: The year 2009 is the reference year. Data on SB production are based on personalcommunication with IRRI. Ecoinvent 2.2 database has been used for calculating the environmentalimpacts, and FAOSTAT has been modeled to calculate the environmental impacts of the saved rice.Rice prices have been estimated using FAOSTAT 2009 producer prices, but it is important to notethat the price of the rice is highly dependent on quality grade and local economic situations.
Economic and socio-environmental cost-benefit analysis of the foodwastage reduction measure
Economic costs of the measure: Super Bag price (no recurrent cost), estimated at USD 2.5 perbag, but the price can vary depending on the marketing channel.Economic benefits of the measure: Sales of the rice saved from loss, as well as premium pricesreceived if rice conserved in the bags is sold out of season. Rice prices can be up to 20 percent higherwhen sold out of the main season.Socio-environmental cost of the measure: SB production (no recurrent cost). To calculate the en-vironmental impact of the SB, it was assumed that the bag is made of multilayer plastic film, usuallyconsisting of two polyethylene (PE) layers of 78 µm thickness with an oxygen barrier in betweenand weighing around 250 g.Socio-environmental benefits of the measure: Rice saved from being lost.Investment burden: The investment is USD 2.5 per SB. Each bag can be used for an average of 5years, so an annual cost of USD 0.5 is used in the calculations below. Investment breakeven point: The return on investment is apparent by the second year.National investment requirements: Saving 1 803 242 tonnes of rice that is currently lost in thePhilippines would require 36 065 SBs, or an investment of USD 90 162 – amounting to USD 18 032per year for the 5-year life of the bag.
2. Case studies of mitigation measures
IN
24
2. Case studies of mitigation measures
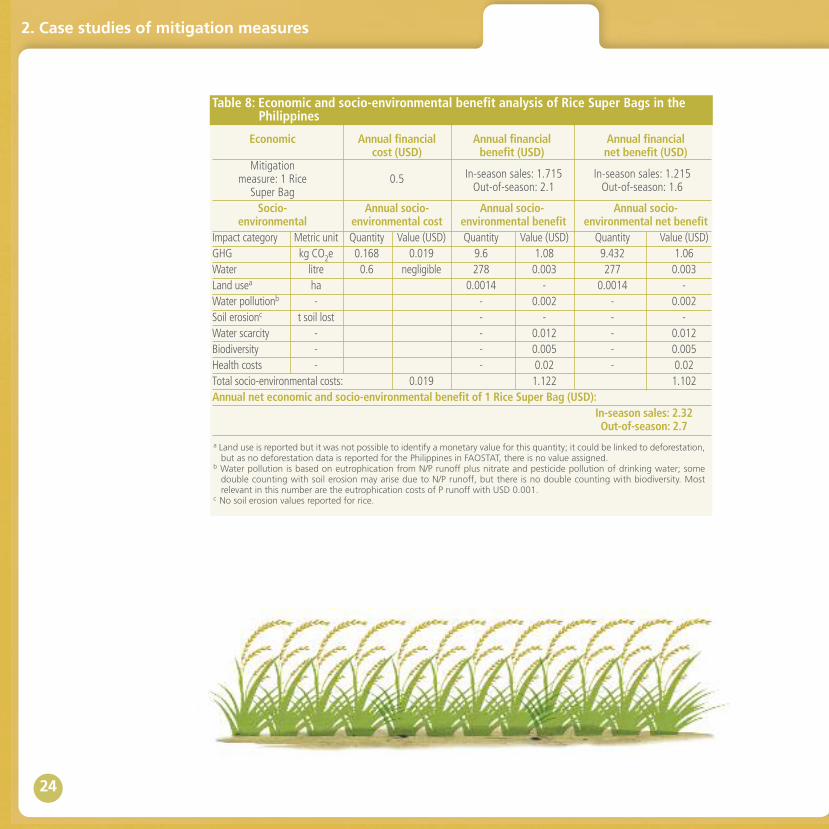
Economic Annual financial Annual financial Annual financial cost (USD) benefit (USD) net benefit (USD)
Mitigation measure: 1 Rice 0.5Super Bag Socio- Annual socio- Annual socio- Annual socio-
environmental environmental cost environmental benefit environmental net benefit Impact category Metric unit Quantity Value (USD) Quantity Value (USD) Quantity Value (USD)GHG kg CO2e 0.168 0.019 9.6 1.08 9.432 1.06Water litre 0.6 negligible 278 0.003 277 0.003Land usea ha 0.0014 - 0.0014 -Water pollutionb - - 0.002 - 0.002Soil erosionc t soil lost - - - -Water scarcity - - 0.012 - 0.012Biodiversity - - 0.005 - 0.005Health costs - - 0.02 - 0.02Total socio-environmental costs: 0.019 1.122 1.102Annual net economic and socio-environmental benefit of 1 Rice Super Bag (USD):
In-season sales: 2.32Out-of-season: 2.7
a Land use is reported but it was not possible to identify a monetary value for this quantity; it could be linked to deforestation,but as no deforestation data is reported for the Philippines in FAOSTAT, there is no value assigned.
b Water pollution is based on eutrophication from N/P runoff plus nitrate and pesticide pollution of drinking water; somedouble counting with soil erosion may arise due to N/P runoff, but there is no double counting with biodiversity. Mostrelevant in this number are the eutrophication costs of P runoff with USD 0.001.
c No soil erosion values reported for rice.
Table 8: Economic and socio-environmental benefit analysis of Rice Super Bags in the Philippines
In-season sales: 1.715Out-of-season: 2.1
In-season sales: 1.215Out-of-season: 1.6
11.Z,
"t,
'RIC
Z
.61ti:.;
25
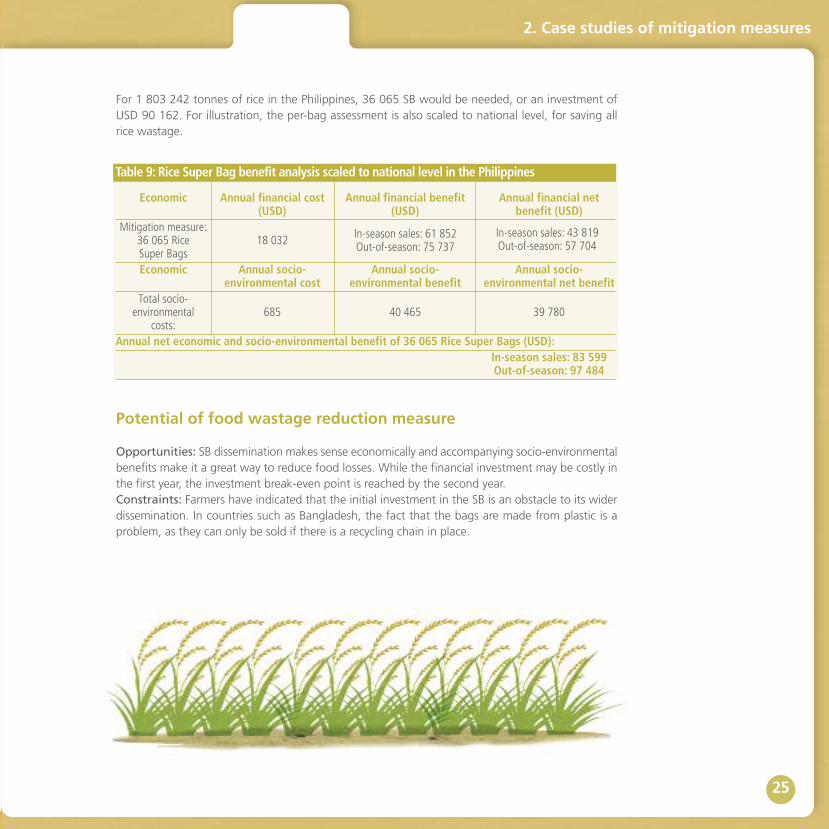
Table 9: Rice Super Bag benefit analysis scaled to national level in the Philippines
Economic Annual financial cost Annual financial benefit Annual financial net (USD) (USD) benefit (USD)
Mitigation measure: 36 065 Rice 18 032Super BagsEconomic Annual socio- Annual socio- Annual socio-
environmental cost environmental benefit environmental net benefitTotal socio-environmental 685 40 465 39 780
costs:Annual net economic and socio-environmental benefit of 36 065 Rice Super Bags (USD):
In-season sales: 83 599Out-of-season: 97 484
Potential of food wastage reduction measure
Opportunities: SB dissemination makes sense economically and accompanying socio-environmentalbenefits make it a great way to reduce food losses. While the financial investment may be costly inthe first year, the investment break-even point is reached by the second year. Constraints: Farmers have indicated that the initial investment in the SB is an obstacle to its widerdissemination. In countries such as Bangladesh, the fact that the bags are made from plastic is aproblem, as they can only be sold if there is a recycling chain in place.
2. Case studies of mitigation measures
For 1 803 242 tonnes of rice in the Philippines, 36 065 SB would be needed, or an investment ofUSD 90 162. For illustration, the per-bag assessment is also scaled to national level, for saving allrice wastage.
In-season sales: 61 852Out-of-season: 75 737
In-season sales: 43 819Out-of-season: 57 704
26
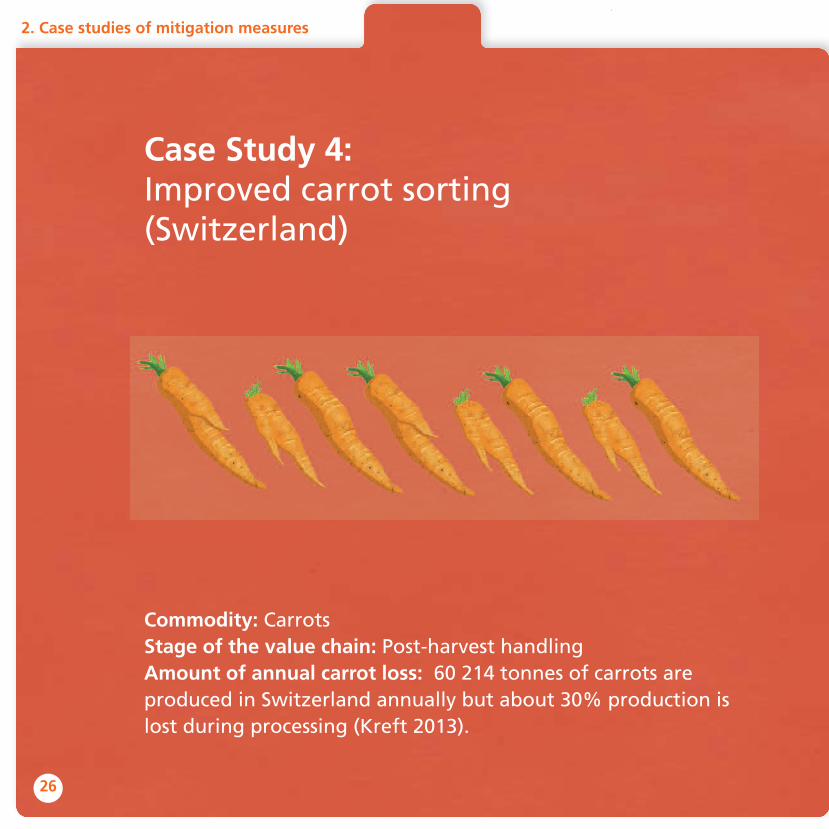
Case Study 4: Improved carrot sorting (Switzerland)
Commodity: CarrotsStage of the value chain: Post-harvest handlingAmount of annual carrot loss: 60 214 tonnes of carrots areproduced in Switzerland annually but about 30% production islost during processing (Kreft 2013).
2. Case studies of mitigation measures
27
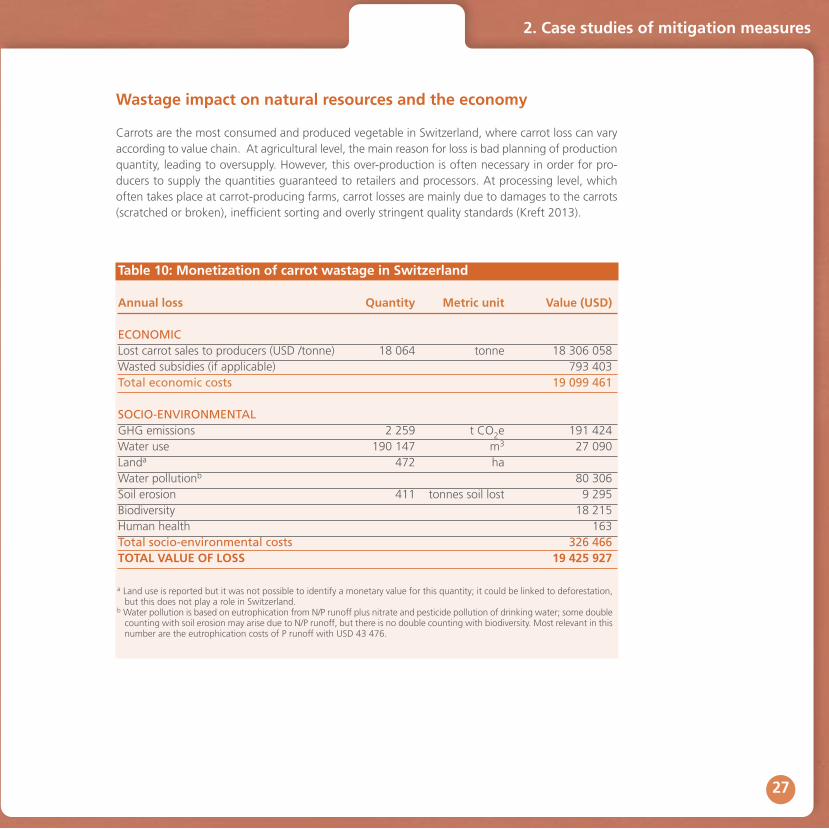
Wastage impact on natural resources and the economy
Carrots are the most consumed and produced vegetable in Switzerland, where carrot loss can varyaccording to value chain. At agricultural level, the main reason for loss is bad planning of productionquantity, leading to oversupply. However, this over-production is often necessary in order for pro-ducers to supply the quantities guaranteed to retailers and processors. At processing level, whichoften takes place at carrot-producing farms, carrot losses are mainly due to damages to the carrots(scratched or broken), inefficient sorting and overly stringent quality standards (Kreft 2013).
Table 10: Monetization of carrot wastage in Switzerland
Annual loss Quantity Metric unit Value (USD)
ECONOMIC Lost carrot sales to producers (USD /tonne) 18 064 tonne 18 306 058Wasted subsidies (if applicable) 793 403Total economic costs 19 099 461
SOCIO-ENVIRONMENTALGHG emissions 2 259 t CO2e 191 424 Water use 190 147 m3 27 090Landa 472 haWater pollutionb 80 306Soil erosion 411 tonnes soil lost 9 295Biodiversity 18 215 Human health 163 Total socio-environmental costs 326 466 TOTAL VALUE OF LOSS 19 425 927
a Land use is reported but it was not possible to identify a monetary value for this quantity; it could be linked to deforestation,but this does not play a role in Switzerland.
b Water pollution is based on eutrophication from N/P runoff plus nitrate and pesticide pollution of drinking water; some doublecounting with soil erosion may arise due to N/P runoff, but there is no double counting with biodiversity. Most relevant in thisnumber are the eutrophication costs of P runoff with USD 43 476.
2. Case studies of mitigation measures
28
Full-cost of wastage reduction measure
Description: Carrot losses at sorting stage can be reduced from 27 to 30 percent with a modernand appropriate carrot-sorting machine. A typical sorting machine can handle 2 to 6 tonnes of carrotsper hour. This case study included 2 carrot-sorting machines, as this represents a typical sorting ca-pacity for Switzerland.Reference scenario:When carrots are sorted by hand, 30 percent of the produce is discarded.Life span: The average lifespan of the carrot-sorting machine is 5 years.System boundaries: To calculate the environmental costs, both the production and the use phasesof the two machines were considered. The other environmental costs listed in the tables were foundto be negligible for the carrot-sorting machines. Furthermore, the impacts of producing the carrotsthat can be substituted through the machines were accounted for. Transport of carrots was not con-sidered in the model. The calculations refer to“Class A” quality carrots.Data sources: The main data sources for this case study are the reports from Kreft (2013) andAgridea (2010). FAOSTAT data have been modelled for calculating the environmental impacts of thesaved carrots. Technical features of the carrot-sorting machine and hand-sorting were based on in-formation from Visar Sorting (2014) and Kreft (2013). Total costs of carrot losses in Switzerland werebased on information by BLW/SBV (2008), Agridea (2010) and Kreft (2013).
Economic and socio-environmental cost-benefit analysis of foodwaste reduction measure
Economic cost of the measure: Purchase and use of the machines, including maintenance, clean-ing, labour, energy and interest for financial capital. The average costs represent the annual cost ifthe machine is depreciated linearly, i.e. by the same amount each year over its entire lifetime.Economic benefits of the measure: Extra benefit from the sale of the carrots saved and saving onmanpower.Socio-environmental cost of the measure: Environmental impacts of the production and use ofthe two carrot-sorting machines.Socio-environmental benefits of the measure: 375 tonnes of carrots saved from loss annually,meaning fewer carrots have to be produced. The environmental impacts of this saving can be at-tributed to the carrot-sorting machines.Investment burden: The cost of the two carrot-sorting machines is USD 191 314. The machinescan be used for about 5 years and the savings in annual labour costs are higher than this investment,bringing the average annual net benefit to USD 427 283.Investment breakeven point: The return on investment is apparent by the second year.
2. Case studies of mitigation measures

29
Potential of food wastage reduction measure
Opportunities: The carrot-sorting machine is economically and environmentally beneficial. If theenvironmental costs are considered, the relation between costs and benefits is even better as thesavings in environmental costs from saving carrots are by far higher than the environmental costsfor building and using a carrot-sorting machine.Constraints: Farmers indicate the initial investment in the carrot-sorting machine is an obstacle tothe wider dissemination of its use. Furthermore, replacing human labour with machines can lead tounemployment if there are not enough alternative jobs – which can lead to social problems.
2. Case studies of mitigation measures
Economic Annual financial Annual financial Annual financial cost (USD) benefit (USD) net benefit (USD)
Mitigation measure: 2 carrot- - 47 258a 380 025 427 283sorting machines
Socio- Annual socio- Annual socio- Annual socio- environmental environmental cost environmental benefit environmental net benefit
Impact category Metric unit Quantity Value (USD) Quantity Value (USD) Quantity Value (USD)GHG kg CO2e 1 180 133 46 889 5 298 45 709 5 165Water m3 3 947 562 3 947 562Land usex ha 10 - 10 -Water pollutionc - - 1 667 - 1 667Soil erosion t soil lost 9 193 9 193Biodiversity - - 505 - 505Health costs - - 5 - 5Total socio-environmental costs: 133 8 230 8 097Annual net economic and socio-environmental benefit of 2 carrot-sorting machines (USD):
435 380
a Savings in labour costs are that high that they overcompensate initial investments into carrot-sorting machines, thus leadingto profits (i.e. negative costs) from this measure, making it profitable from the beginning.
b Land use is reported but it was not possible to identify a monetary value for this quantity; it could be linked to deforestation,but this does not play a role in Switzerland.
c Water pollution is based on eutrophication from N/P runoff plus nitrate and pesticide pollution of drinking water; somedouble counting with soil erosion may arise due to N/P runoff, but there is no double counting with biodiversity. Mostrelevant in this number are the eutrophication costs of P runoff with USD 903.
Table 11: Economic and socio-environmental benefit analysis of carrot-sorting machines in Switzerland

30
Case Study 5: Food banks: the German Tafel (Germany)
Commodity: Mixed food and drinkStage of the value chain: DistributionAmount of annual food waste (Germany): 10 970 000 tonnes/yearfor the total value chain; at the processing and distribution levels,it totals 2 400 000 tonnes/year (Kranert et al. 2012).
2. Case studies of mitigation measures
31
Wastage impact on natural resources and the economy
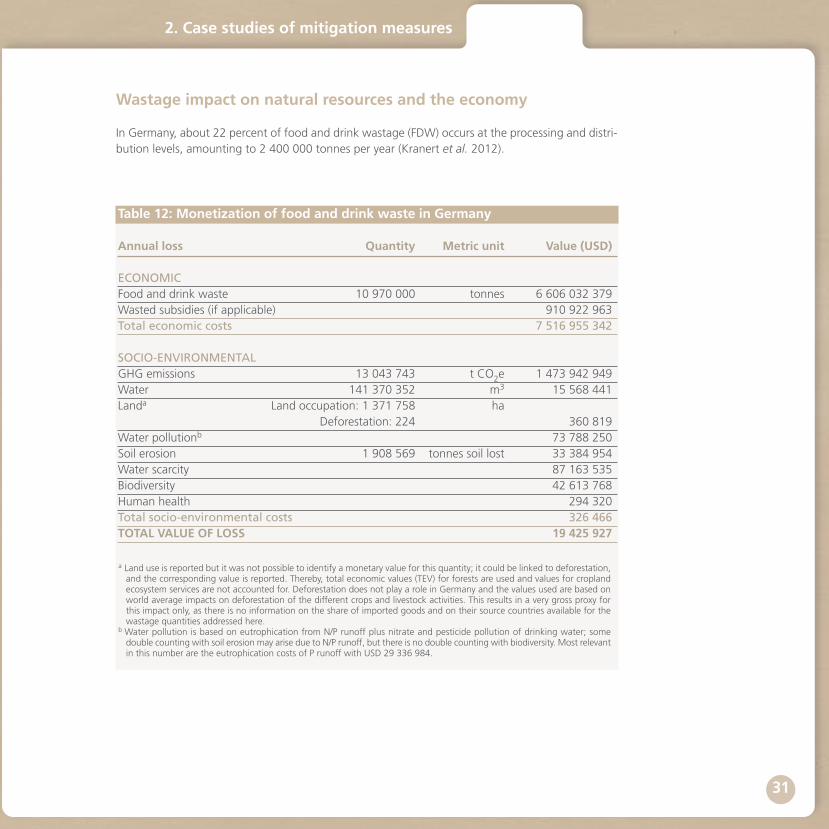
In Germany, about 22 percent of food and drink wastage (FDW) occurs at the processing and distri-bution levels, amounting to 2 400 000 tonnes per year (Kranert et al. 2012).
Table 12: Monetization of food and drink waste in Germany
Annual loss Quantity Metric unit Value (USD)
ECONOMIC Food and drink waste 10 970 000 tonnes 6 606 032 379Wasted subsidies (if applicable) 910 922 963Total economic costs 7 516 955 342
SOCIO-ENVIRONMENTAL GHG emissions 13 043 743 t CO2e 1 473 942 949Water 141 370 352 m3 15 568 441Landa Land occupation: 1 371 758 ha
Deforestation: 224 360 819Water pollutionb 73 788 250Soil erosion 1 908 569 tonnes soil lost 33 384 954Water scarcity 87 163 535Biodiversity 42 613 768Human health 294 320 Total socio-environmental costs 326 466 TOTAL VALUE OF LOSS 19 425 927
a Land use is reported but it was not possible to identify a monetary value for this quantity; it could be linked to deforestation,and the corresponding value is reported. Thereby, total economic values (TEV) for forests are used and values for croplandecosystem services are not accounted for. Deforestation does not play a role in Germany and the values used are based onworld average impacts on deforestation of the different crops and livestock activities. This results in a very gross proxy forthis impact only, as there is no information on the share of imported goods and on their source countries available for thewastage quantities addressed here.
b Water pollution is based on eutrophication from N/P runoff plus nitrate and pesticide pollution of drinking water; somedouble counting with soil erosion may arise due to N/P runoff, but there is no double counting with biodiversity. Most relevantin this number are the eutrophication costs of P runoff with USD 29 336 984.
2. Case studies of mitigation measures

32
Full-cost of wastage reduction measure
Description: Food banks, such as those operated by the German NGO “Deutsche Tafel” (referredto hereafter as “German Tafel” or “GT”) enable people in need to access surplus high-quality foodat little or no cost. In addition, by participating in food banks, food processors and retailers can savemoney by reducing what they pay for waste disposal (FAGT 2014). GT established its first food bankin Berlin and, subseqently, initiated and runs food banks all over Germany.Reference scenario: If the food bank were not active, the food it distributes would have beenwasted, and the needy consumers who accessed that food would have had to buy it at regular su-permarket prices. Scope of the measure: The GT in Berlin distributes food for the symbolic price of Euro 1–2 per per-son. The food is collected by the GT in Berlin from 74 supermarkets, companies, hotels and bakeries,and redistributed at 45 distribution points to over 300 social institutions where about 125 000 per-sons benefit from it each month.Life span: The GT in Berlin has worked continously since its founding in 1993.System boundaries: Societal boundaries included all economic costs and benefits from the GT, in-cluding fixed and variable costs of the food bank, costs borne by supermarkets due to fewer sales,and the symbolic price that the customers of the food bank have to pay. Economic benefits consid-ered consumer savings on cost of food, and company savings on cost of diposal. What was not con-sidered was the value of volunteer workers, potential loss of jobs due to less production, sale andwaste, and reduced packaging waste due to a reduction in sales. Indirect benefits not consideredincluded decrease of poverty, because poor people have access to cheap food, and health benefitsdue to enhanced possibilities for a healthy diet for the customers of the GT. On the environmentalcost side, water use, land use and biodiversity loss due to activities of the GT were not considered,as they were assumed to be negligible in comparison to the high ecological footprint of food anddrink wastage.Data sources: A survey of several German food banks was conducted, for which datasets from theGT in Berlin were the most complete. Data about food and drink redistribution were available for2011 and 2013. Figures in the table above are the mean values of these years. Additional data wastaken by Kranert et al. (2012). Environmental benefits due to saved food were calculated by mod-elling FAOSTAT data and Gustavsson et al. (2011).
2. Case studies of mitigation measures
33
Economic and environmental cost-benefit analysis of food waste reduction measure
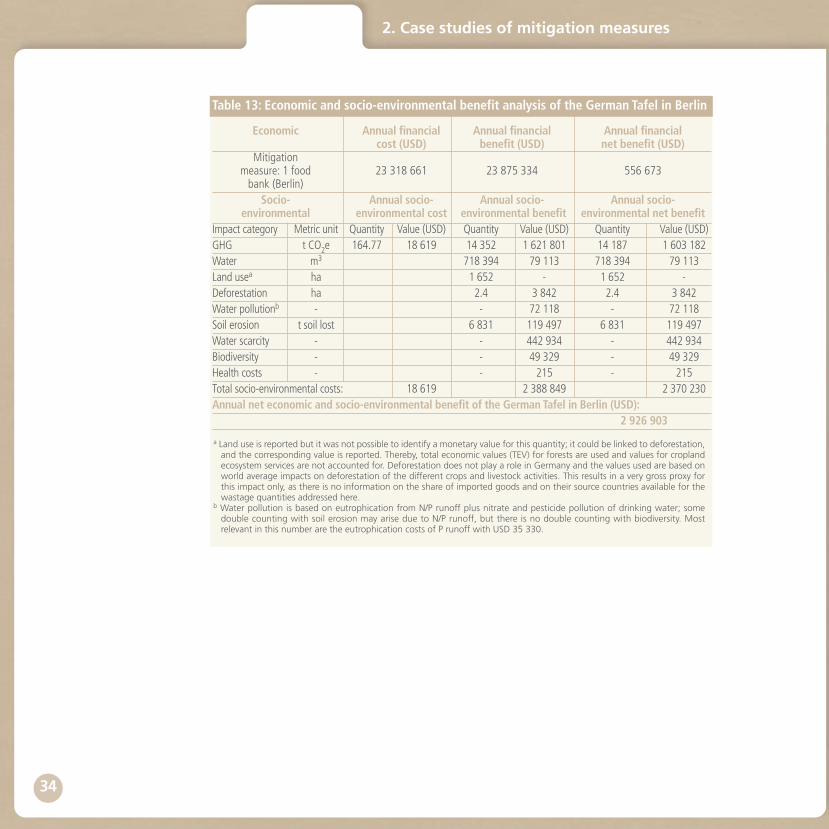
Economic costs of the measure: The analysis included factors such as potential for reduced salesby supermarkets (main cost), personnel costs and rent for the GT building. Direct economic costs in-cluded fixed costs, such as costs for buildings, variable costs such as personnel and energy, and in-direct economic costs, including the decrease in revenues for retailers and the symbolic price paidby beneficiaries to the GT.Economic benefits of the measure: Economic benefits consisted of savings to companies due tofewer disposal costs, savings to beneficiaries, and the revenue from the symbolic payments con-sumers make when purchasing food from GT. Socio-environmental costs of the measure: Transportation.Socio-environmental benefits of the measure: 8 060 tonnes of food and drink saved fromwastage annually (in primary product equivalents).Investment burden:Most of the equipment and infrastructure was rented, meaning the initial pri-vate investment was small.National investment requirements: It cost USD 381 to save 1 tonne of food and drink fromwastage. Break even point: N/A.
2. Case studies of mitigation measures
34
2. Case studies of mitigation measures
Economic Annual financial Annual financial Annual financial cost (USD) benefit (USD) net benefit (USD)
Mitigation measure: 1 food 23 318 661 23 875 334 556 673bank (Berlin)Socio- Annual socio- Annual socio- Annual socio-
environmental environmental cost environmental benefit environmental net benefit Impact category Metric unit Quantity Value (USD) Quantity Value (USD) Quantity Value (USD)GHG t CO2e 164.77 18 619 14 352 1 621 801 14 187 1 603 182Water m3 718 394 79 113 718 394 79 113Land usea ha 1 652 - 1 652 -Deforestation ha 2.4 3 842 2.4 3 842Water pollutionb - - 72 118 - 72 118Soil erosion t soil lost 6 831 119 497 6 831 119 497Water scarcity - - 442 934 - 442 934Biodiversity - - 49 329 - 49 329Health costs - - 215 - 215Total socio-environmental costs: 18 619 2 388 849 2 370 230Annual net economic and socio-environmental benefit of the German Tafel in Berlin (USD):
2 926 903
a Land use is reported but it was not possible to identify a monetary value for this quantity; it could be linked to deforestation,and the corresponding value is reported. Thereby, total economic values (TEV) for forests are used and values for croplandecosystem services are not accounted for. Deforestation does not play a role in Germany and the values used are based onworld average impacts on deforestation of the different crops and livestock activities. This results in a very gross proxy forthis impact only, as there is no information on the share of imported goods and on their source countries available for thewastage quantities addressed here.
b Water pollution is based on eutrophication from N/P runoff plus nitrate and pesticide pollution of drinking water; somedouble counting with soil erosion may arise due to N/P runoff, but there is no double counting with biodiversity. Mostrelevant in this number are the eutrophication costs of P runoff with USD 35 330.
Table 13: Economic and socio-environmental benefit analysis of the German Tafel in Berlin
35
Potential of food wastage reduction measure
Opportunities: The GT distributes food to poor people that would be wasted otherwise. Thus, lessfood has to be bought, and both environmental and social benefits are generated for society. Thetotal benefits exceed the costs as shown above. Constraints: The activities of the GT lead to reduced sales by supermarkets. The GT food distributionsystem does not make sense from a business perspective in the current economic framework. TheGT is dependent on monetary donations and volunteer workers. In addition, about one-third of thefruits and vegetables donated by companies is still wasted due to low quality (estimation of the GT).Food and drink that pass the best-before date are not allowed to be redistributed and have to bediscarded, even though they would have been edible.
Further methodological annotations
• The GT may impact the market prices of foodstuffs. These were not considered.• Environmental costs of the GT were calculated back from fuel costs by taking USD 1.93 per litrediesel (ADAC 2014). The Berliner Tafel uses electricity from renewable sources, and thus CO2eemissions were not part of the equation.
• The economic value of wasted food and drink was calculated on basis of data from Kranert et al.(2012).
• Saved disposal costs to companies donating food and drink were calculated by using the USD163.39 per tonne gate-fee charges of landfills in Berlin (BSR 2013). Environmental impacts of thedisposal of the food in the reference scenario were not considered.
• On the basis of the estimation of the GT in Berlin, it was assumed that one-third of vegetablesand fruits donated to the Berliner Tafel could not be redistributed, due to poor quality.
• A small part of the redistributed food and drink might be wasted at household level, but this isnot included in the calculations, as the GT has no influence on it.
2. Case studies of mitigation measures

-.W
36
Case Study 6: Canteen surplus goes to food banks(Italy)
Commodity: Mixed food (no drinks)Stage of the value chain: Consumption (food services)Amount of annual food waste at consumption level (Italy): 9 300 000 tonnes.
2. Case studies of mitigation measures

37
Wastage impact on natural resources and the economy
In industrialized countries, food wastage happens mostly at the end of the value chain. Food servicesrepresent a particular food wastage hotspot due to the difficulty in adapting the food offer to achanging demand.
Table 14: Monetization of food wastage in Italy (consumption level only)
Annual loss Quantity Metric unit Value (USD)
ECONOMIC Food waste 9 277 725 tonnes 9 183 709 229Wasted subsidies (if applicable) 952 816 419Total economic costs 10 136 525 648
SOCIO-ENVIRONMENTAL GHG 15 448 184 t CO2e 1 745 644 820
Waterc 63 070 510 m3 2 783 638Landa 1 474 032 ha -Water pollutionb 213 267 773
Soil erosionc 1 752 515 tonnes soil lost 25 370 430Water scarcityc - -Biodiversity 40 918 966Human health 453 491 Total socio-environmental costs 2 028 439 118 TOTAL VALUE OF LOSS 12 164 964 766
a Land use is reported but it was not possible to identify a monetary value for this quantity; it could be linked to deforestation,but this does not play a role in Italy.
b Water pollution is based on eutrophication from N/P runoff plus nitrate and pesticide pollution of drinking water; some doublecounting with soil erosion may arise due to N/P runoff, but there is no double counting with biodiversity. Most relevant in thisnumber are the eutrophication costs of P runoff with USD 131 802 197.
c No data on water scarcity and water use data and costs are very low if compared to other countries (e.g. UK), and we judgethem to be particularly uncertain.
2. Case studies of mitigation measures
38
Full-cost of wastage reduction measure
Description: In 2013, the Italian food company, Barilla, joined with Siticibo, a food redistributionproject focusing on food from hotels, canteens, etc. promoted by the Italian food bank organizationBanco Alimentare. With this partnership, Barilla committed to gather surplus food from the manycanteens within its headquarters and main plants (located in Pedrignano), and then provide it to theCatholic charity, Caritas, for distribution to people in need. An analysis of the food waste reduction – conducted monthly at headquarters and main plant can-teens from January until December 2013 – included the number of meals recovered for the firstcourses (mainly pastas and soups) and main courses, and the average meals per day. Reference scenario: All the food not eaten in the canteen is wasted.Scope of the measure: 2 percent of all the meals served to employees can be redistributed throughthis initiative, equalling 1.5 tonnes of food per year.Life span: N/A.System boundaries: Evaluation included the impact of adding the Barilla canteen component tothe Siticibo programme, not the entire system.Data sources: The year 2013 was the reference year. Data were provided by Barilla. Calculations ofthe environmental impacts of the saved food used the Ecoinvent (0.000257 kg CO2e/kg/km fortransportation; 0.18 kg CO2e/kg for refrigeration and reheating data.
Economic and environmental cost-benefit analysis of food waste reduction measure
Economic costs of the measure: The yearly wage costs necessary for the labour involved in this ini-tiative are about Euro 2 500 (USD 3 460), which include 2 hours of work per day, 1 hour paid job/day,1 hour volunteer work, 1 hour in Barilla canteen, and 1 hour Caritas driver’s time (Salary Explorer2014). The volunteers‘ time for distribution was not included. The reduced sales from the canteen(USD 1 000 per year) were not accounted for, as the food would have been wasted anyway in thereference scenario, nor was the possible loss in retail sales elsewhere, due to distribution of the savedfood. The cost of the vehicle transporting the food was not considered, as it was part of Siticibo. Economic benefits of the measure: For the beneficiaries to buy the food and prepare it themselveswould have cost about Euro 5 000 (USD 6 920) per year. Loss in retail sales was not accounted for,nor were the negative effects in reduction in employment due to this, as lower sales likely result inlower labour demand. Socio-environmental cost of the measure: Transportation cost amounted to 10 km/day in a re-frigerated van, 6 hours of refrigeration between lunch and dinner, and reheating for dinner. Socio-environmental benefits of the measure: Food saved from being wasted.Investment burden: This measure added Barilla to the existing Siticibo system, so no particular in-vestment was needed, as all the material was already available. Investment breakeven point: N/A.
2. Case studies of mitigation measures

39
Potential of food wastage reduction measure
Opportunities: Barilla‘s participation in Siticibo makes sense socially and environmentally, as it feedsneedy people, less food has to be produced to feed all parties in the system, and total benefitsexceed the costs. However, environmentally, the measure does not make sense, as the measure itselfis very GHG intensive for saving a small amount of food with correspondingly low total emissions.Constraints: Employees need dedicated time to prepare the food donated and to manage the lo-gistics. Some governments are now improving logistics to encourage food donations and go overthese hurdles. Positive results depend on efforts of volunteer workers because, if it were necessaryto pay two people, both the GHG balance and the economic balance would be negative.
2. Case studies of mitigation measures
Economic Annual financial Annual financial Annual financial cost (USD) benefit (USD) net benefit (USD)
Mitigation measure: 1.5 t of food redistributedSocio- Annual socio- Annual socio- Annual socio-
environmental environmental cost environmental benefit environmental net benefit Impact category Metric unit Quantity Value (USD) Quantity Value (USD) Quantity Value (USD)GHG kg CO2e 22 488 2 541 2 498 282 -19 990 -2259Water litre 10 197 0.5 10 197 0.5Land useb ha 0.24 - 0.24 -Water pollutionc - - 34.5 - 34.5Soil erosion t soil lost 0.28 4.1 0.28 4.1Biodiversity - - 6.6 - 6.6Health costs - - 0.1 - 0.1Total socio-environmental costs: 2 541 328 -2 213Annual net economic and socio-environmental benefit of 1.5 t of food redistribution (USD):
1 247
a Benefits may even be higher, USD 6 920 are based on estimates of what the food would cost to individuals buying it them-selves. Barilla itself judges them to be more than USD 10 000, based on the estimated costs of alternative meals providedby a canteen supplier.
b Land use is reported but it was not possible to identify a monetary value for this quantity; it could be linked to deforestation,but this does not play a role in Italy.
c Water pollution is based on eutrophication from N/P runoff plus nitrate and pesticide pollution of drinking water; somedouble counting with soil erosion may arise due to N/P runoff, but there is no double counting with biodiversity. Mostrelevant in this number are the eutrophication costs of P runoff with USD 21.3.
Table 15: Economic and socio-environmental benefit analysis of the Barilla food redistribution project in Italy
3 460 3 4606 920a
40
Case Study 7: Feeding food wastage to pigs vs anaerobic digestion (Australia)
Location: AustraliaCommodity: Food and drinksStage of the value chain: Food waste from all supply chain stagesAmount of annual household food and drink waste in Australia:3 176 046 tonnes.
2. Case studies of mitigation measures

41
Wastage impact on natural resources and the economy
In industrialized countries, food wastage happens mostly at the end of the value chain. In Australia,consumers waste about 3.2 million tonnes of food and drink each year.
Table 16: Monetization of household food and drink waste, Australia
Annual loss Quantity Metric unit Value (USD)
ECONOMIC Food and drink waste 3 176 046 tonnes 2 271 253 113Wasted subsidies (if applicable) 70 757 399 Total economic costs 2 342 010 512
SOCIO-ENVIRONMENTAL GHG emissions 26 545 745 t CO2e 2 999 699 181
Water 200 391 771 m3 16 887 875Landa Land occupation: 20 072 969 Costs of deforestation:
Related deforestation: 36 760 ha 68 153 216Water pollutionb 7 472 196 939
Soil erosion 15 393 144 tonnes soil lost 287 983 108Water scarcity 9 578 726Biodiversity 945 094 603 Human health 391 539Total socio-environmental costs 11 799 985 187 TOTAL VALUE OF LOSS 14 141 995 699
a Land use is reported but it was not possible to identify a monetary value for this quantity; it could be linked to deforestation,and the corresponding value is reported. Thereby, total economic values (TEV) for forests are used and values for croplandecosystem services are not accounted for; the Australian average is USD 1 854/ha.
b Water pollution is based on eutrophication from N/P runoff plus nitrate and pesticide pollution of drinking water; some doublecounting with soil erosion may arise due to N/P runoff, but there is no double counting with biodiversity. Most relevant inthis number are the eutrophication costs of P runoff with USD 7 249 372 489.
2. Case studies of mitigation measures

42
Full-cost of wastage reduction measure
Description: Feeding food waste to pigs offers an alternative to using anaerobic digestion to processfood waste. This means collecting food waste from households or from larger waste producers (foodindustry, farms, retailers) and bringing it to farmers, who feed it to their pigs, instead of using in-dustrial pig feed that is produced from primary products. However, under current veterinary laws,no meat can be fed to pigs, which means measures are needed to ensure compliance. This studyconsidered the average food waste amount produced by a household in Australia (182 kg per year)as a functional unit. Reference scenario: If this measure is not implemented, food waste is collected and brought to ananaerobic digestion plant (life span about 12 years), which produces biogas from the food waste.This procedure is considered more environmentally friendly than centralized composting, incinerationor landfilling. Only home composting performs better than anaerobic digestion, but home compost-ing calls for the compost to be aerated regularly (Lundie and Peters 2005). Although rare, it stillshould be noted that, depending on the type of management chosen, compost has the potential togenerate considerable methane and nitrous oxide emissions. As for their outputs, both compost andslurry from anaerobic digestion can be used to replace mineral fertilizers, although it is not clearwhat fares better. If the slurry were assumed to be dumped and compost were to be used to replacemineral fertilizers, then composting would definitely be more advantageous. Scope: All household food waste of plant origin, including milk and eggs, but not meat, will be fedto pigs.System boundaries: This study only considered the environmental impact of the two options. Itdid not consider transporting, as it was assumed to be similar in both options. Greenhouse gasesand water use were considered in evaluating the environmental costs, and biodiversity impacts wereconsidered for the option of growing feed. It was assumed that demand for pig meat does notchange due to this food waste reuse measure and, therefore, other emissions from pigs (e.g.methane emissions from manure storage and application) were not taken into consideration.Data sources: Data for the pig feeding measure (e.g. Australian food waste mix and substitution ofconcentrate feed) were calculated with the SOL-model. The case was based on an example of pigfeeding use of wastage from UK, taken from (Stuart 2009). The reference scenario with anaerobicdigestion was based on life-cycle calculations of anaerobic digestion and other wastage mitigationmeasures presented by Evangelisti et al. (2014), and Lundie and Peters (2005). Potential impactsfrom food waste sorting or heating were not considered.
Economic and socio-environmental cost-benefit analysis of foodwaste reduction measure
Economic cost of the measure: Not considered due to lack of data.Economic benefits of the measure: Not considered due to lack of data.
2. Case studies of mitigation measures
43
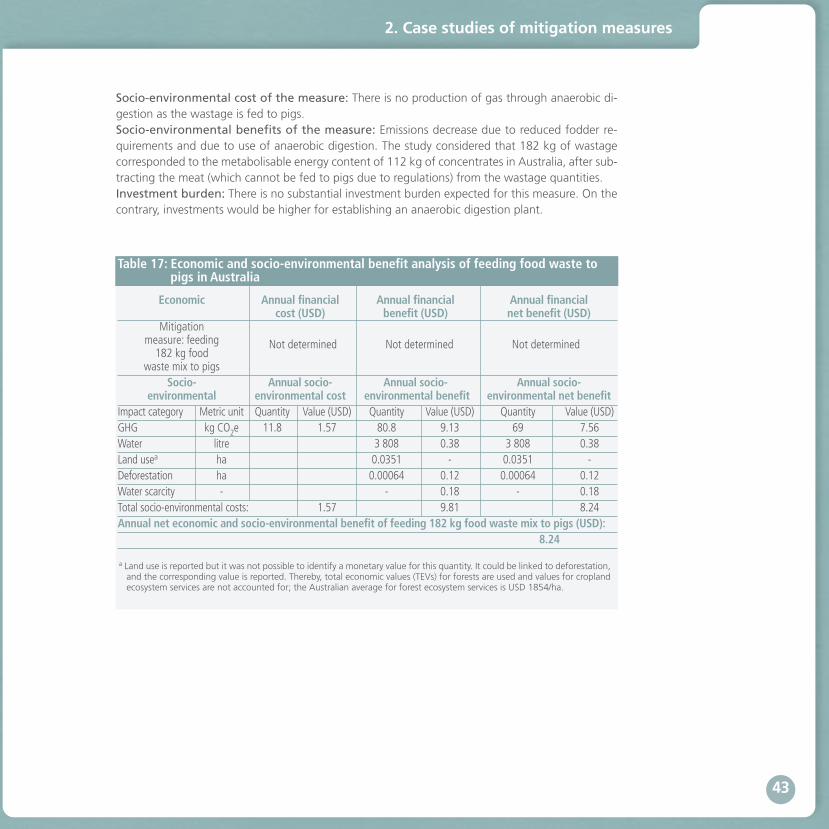
Socio-environmental cost of the measure: There is no production of gas through anaerobic di-gestion as the wastage is fed to pigs.Socio-environmental benefits of the measure: Emissions decrease due to reduced fodder re-quirements and due to use of anaerobic digestion. The study considered that 182 kg of wastagecorresponded to the metabolisable energy content of 112 kg of concentrates in Australia, after sub-tracting the meat (which cannot be fed to pigs due to regulations) from the wastage quantities. Investment burden: There is no substantial investment burden expected for this measure. On thecontrary, investments would be higher for establishing an anaerobic digestion plant.
2. Case studies of mitigation measures
Economic Annual financial Annual financial Annual financial cost (USD) benefit (USD) net benefit (USD)
Mitigation measure: feeding182 kg food
waste mix to pigsSocio- Annual socio- Annual socio- Annual socio-
environmental environmental cost environmental benefit environmental net benefitImpact category Metric unit Quantity Value (USD) Quantity Value (USD) Quantity Value (USD)GHG kg CO2e 11.8 1.57 80.8 9.13 69 7.56Water litre 3 808 0.38 3 808 0.38Land usea ha 0.0351 - 0.0351 -Deforestation ha 0.00064 0.12 0.00064 0.12Water scarcity - - 0.18 - 0.18Total socio-environmental costs: 1.57 9.81 8.24Annual net economic and socio-environmental benefit of feeding 182 kg food waste mix to pigs (USD):
8.24
a Land use is reported but it was not possible to identify a monetary value for this quantity. It could be linked to deforestation,and the corresponding value is reported. Thereby, total economic values (TEVs) for forests are used and values for croplandecosystem services are not accounted for; the Australian average for forest ecosystem services is USD 1854/ha.
Table 17: Economic and socio-environmental benefit analysis of feeding food waste to pigs in Australia
Not determined Not determined Not determined
44
Potential of food wastage reduction measure
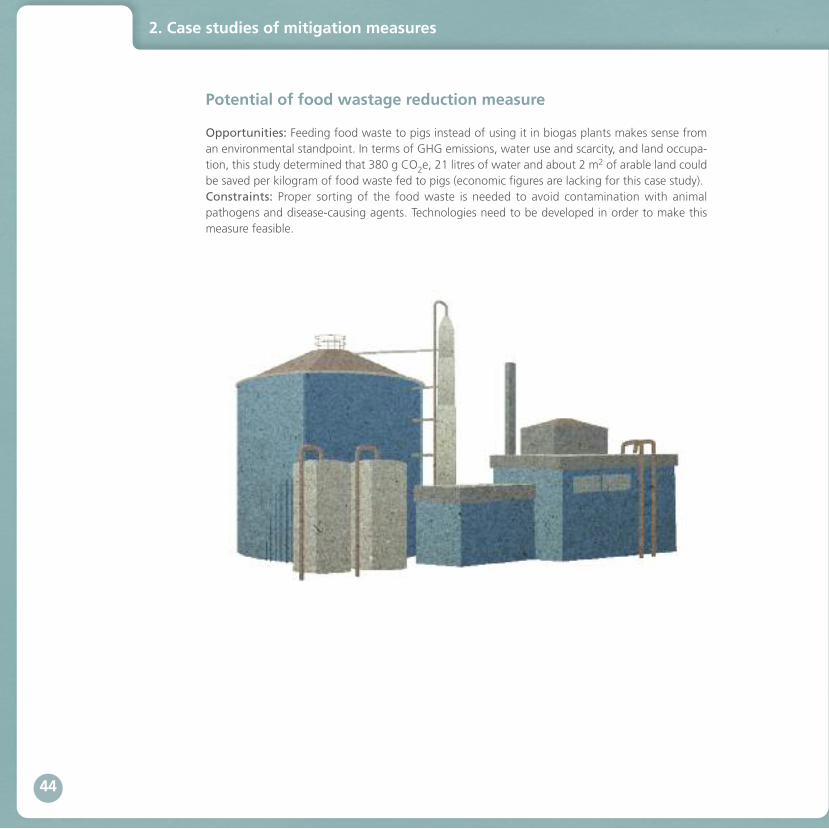
Opportunities: Feeding food waste to pigs instead of using it in biogas plants makes sense froman environmental standpoint. In terms of GHG emissions, water use and scarcity, and land occupa-tion, this study determined that 380 g CO2e, 21 litres of water and about 2 m
2 of arable land couldbe saved per kilogram of food waste fed to pigs (economic figures are lacking for this case study).Constraints: Proper sorting of the food waste is needed to avoid contamination with animalpathogens and disease-causing agents. Technologies need to be developed in order to make thismeasure feasible.
2. Case studies of mitigation measures

TYPE OF REDUCTION MEASURE
Milk coolerInformation campaign
IRRI bagsCarrots sorting
Feeding pigs
Anaerobic digestion 7Incineration
Centr41Composting
Kg CO,e saved Net benefits USO) CO,e emissions savedKg avoided waste Kg avoided waste CO,e from mitigation
3.4 1.22 39-332.25 0.62 36162.491.89 0.5 57.140.12 1.17 39.74
1.76 0.36 87.10
0.38 0.05 6.85
0.06 n.a n.a
0.04 n.a n.a
n.a n.a-111
-0.84 n.a na
45
2.2 Synthesis of case studies
In summarizing the case studies, it is important to note that climate change mitigation is also a keytopic in the food wastage debate. Figure 2 illustrates the key indicator “kg CO2e saved/kg avoidedwaste” in relation to the different mitigation measures presented in this report. However, the casestudies and the comparison of the respective indicators (e.g. CO2e reductions per kilogram wastagesaved) have purely illustrative character only. The environmental impact of wastage depends on itstype – there are enormous differences for some indicators, such as between carrots and milk, or fordifferent compositions of aggregate food waste at retail level in different nations. Those differenceshave to be considered when discussing the results. Therefore, it is important to analyse the effectsof food wastage mitigation measures with other criteria as well (as displayed in the third and fourthcolumns of Figure 2). For example, in terms of net benefits per kilogram of waste reduced and emis-sions reduced per emissions from the mitigation measure, carrots and milk fare similarly regardingthe CO2e emissions saved per CO2e needed for the mitigation, while in emissions per kilogramwastage saved, the difference is huge. Determining the overall effect, however, calls for analyzinghow the size and efficiency of the measure combine. Measures that avoid a large amount of foodwastage with relatively low CO2e emissions per tonne wastage can save as much as measures thatavoid a smaller amount of wastage with high CO2e emissions per tonne wastage. These and otherkey indicators for the different case studies are collected in the Annex.
2. Case studies of mitigation measures
Figure 2. Key indicators of food wastage measures along the food wastage pyramid
46
For example, the indicator “kg CO2e saved per kg food waste” indicates that anaerobic digestion is15 times a better mitigation option than landfilling; however avoiding food wastage is 140 times bet-ter than anaerobic digestion from a GHG emission perspective. The carrot-sorting mitigation measureperforms poorly according to this indicator, as carrot production has a low emission potential per kilo-gram. However, if the indicators “net benefits per kg food wastage avoided” or “ratio of emissionsreduced per unit emission from the wastage measure” are considered, the carrot-sorting mitigationmeasure appears as performing as the milk cooler mitigation measure. This is due to the fact thatcarrot-sorting results in high savings on production value and labor, while being a low emission mit-igation measure. Incineration and centralized composting are added in the pyramid for illustrationpurposes only (Lundie and Peters 2005), as there are no detailed calculations provided for those.
3. Lessons learned from the case studies
The following identifies lessons drawn from the case studies on the full cost of food wastage andtheir respective mitigation measures.
Avoidance of food wastage is the primary goalPreventing food wastage in the first place is much more beneficial than food wastage management.For example, reusing food wastage as pig feed fares quite well and also cuts back on industrial pro-duction, namely of feed. However, it still is more beneficial to avoid food wastage, even if it meanshaving to produce the feed.
Focus should be on high impact wastage or hotspotsGiven limited resources, there is need to address those supply chains and mitigation measures thatoffer the highest net benefits. This calls for informing decision-makers on how to measure benefits.For example, results will differ on whether measurements refer to total GHG emissions saved, GHGsaved per GHG emitted for mitigation, or GHG saved per dollar invested. For instance, as shown inCase Study 4, which looked at carrot production in Switzerland, wastage in carrots can be avoidedat little cost but the effort will only result in relatively low environmental improvements becausecarrot production has low environmental impact. On the other hand, Case Study 1, which looked atmilk cooling machines for Kenyan farmers, found mitigation costs high but the environmental ben-efits high as well. A situation that has both high total reduction of impacts and high reductions inimpact per dollar invested clearly has the best potential, while a situation that avoids low impactwastage with high impact measures should be seen critically (e.g. cold storage of fruits producesmuch lower GHG emissions per tonne than milk).
Obstacles to food wastage mitigation need to be better understoodAlthough the case studies showed that some wastage mitigation measures provide financial benefitsfor some operators – carrot sorting, bags for rice storage or avoided household food waste in general
3. Lessons learned from the case studies

47
– their implementation has not been widespread. This indicates there must be non-economic reasonswhen operators do not implement the measures, such as lack of knowledge about causes forwastage or about mitigation options. It becomes crucial for regulators, governmental agencies, pol-icy-makers and also NGOs to design and suggest optimal food wastage mitigation policies and ac-tivities that set incentives for effective reductions.
Harvesting the potential of certain mitigation measures requires technical and social innovations, as well as changes in policies and regulations Existing regulations and lack of technologies or wastage management options can hinder imple-mentation of mitigation measures. Case Study 7, looking at feeding food wastage to pigs, showedthe enormous environmental benefits of this, but current legal conditions and household waste col-lection practices do not allow the widespread reuse of large amounts of food wastage in this waybecause meat needs to be separated from food wastage. This can increase reuse costs considerably,but the measure can be highly beneficial if the basic food wastage does not contain any meat fromthe beginning. Technical innovations and changes in the legal framework are thus necessary to makethe feed reuse measure feasible and effective at large scale. Similarly, Case Study 5, which lookedat the example of food banks in Germany, illustrated that restrictive regulations on best-before datesin combination with bans to reuse food that has exceeded these dates reduce the potential of suchmeasures.
Good socio-environmental choices do not necessarily require sacrificing economic benefits As most case studies show, net economic benefits parallel net environmental benefits. However, notall economically viable measures make sense according to all environmental indicators. Case Study6, which looked at an Italian food manufacturer establishing a system for donating food from itsheadquarters and factory employee canteens to charity, had high GHG emissions compared withemissions saved. Furthermore, the presence of volunteer work can be decisive for the economic per-formance and needs to be taken into account when comparing measures.
Labour costs can be a decisive aspect of the profitability of food wastage measuresIn high-income countries, reducing labour costs is important as shown in Case Study 4, which lookedat carrot sorting options in Switzerland. Also, in Case Study 5, which looked at German food bankassociations, the absence of labour costs due to charity work was a major determinant of its success.More generally, a simplified assessment may be achieved by focusing on key inputs and any corre-sponding key impact reductions. For example, if large fossil energy use is involved in the mitigationmeasure, as for cooling within a coal-based electric system, the GHG emission balance will play akey role. If labour costs are high, measures with low labour input or those that reduce high labourinputs (e.g. carrot sorting) have a big advantage in relation to labour-intensive measures that cannotbuild on voluntary work.
3. Lessons learned from the case studies
48
The lower the product prices, the less profitable the food waste mitigationAlong the supply chain, operators have stronger incentives for reducing the waste of high-pricedfoodstuffs such as milk and meat, as compared with lower priced products. Mitigation measuresbecome economically feasible sooner for those products. Such higher value commodities also showsome correlation with higher environmental footprints, if the value added derives from higher inputuse, as with animal products. This is not (or much less) the case if the higher value derives from highlabour inputs in contexts with high wages, or if it derives from situations of demand surpassing sup-ply, thus resulting in higher prices. Clearly, for commodities with fluctuating prices, the economicfeasibility of mitigation measures is subject to corresponding changes. In such cases, a longer-termview is needed for an economic assessment, which can identify benefits in relation to some longer-term average price development.
Some reduction options can be less environmentally friendly than some re-use optionsThe inverted food wastage pyramid indicates the general order of decreasing environmental benefitsfrom food wastage measures as a gradient of reduce-reuse-recycle-landfill. However, in some cases,the order may be different. In particular, this can arise when different types of food wastage or re-sources are involved. For example, reusing food wastage as pig feed in Australia as described in CaseStudy 7, saves more CO2e per tonne of wastage than reducing carrot waste in Switzerland, as de-scribed in Case Study 4. The benefits from the pig feeding case arise due to the avoidance of pro-ducing pig feed which has a higher environmental footprint than carrots. The footprint of theAustralian food wastage itself does not enter the comparison here, as the food is still wasted but itis used as feed instead of dumped. However, reducing the food wastage in the first place and givingthe pigs actual pig feed would still be better, as the environmental footprint of the food wastage ishigher than the footprint of the pig feed.
The relative performance of mitigation measures can change with different types of foodwastageAlthough similar to Lesson 8, this lesson is a more general formulation based on the relative per-formance of the mitigation measures, as driven by the different food wastage types they apply to.Country-specific contexts and regional differences can also drive differences in the relative perform-ance of mitigation measures. With one single type of wastage in a specific geographic context, theorder of the pyramid is kept – reducing food wastage by avoiding its production is always betterthan reusing it. This is also the case if reusing leads to replacing other inputs that can then be saved.In such situations, it is usually more beneficial and efficient to replace those inputs with a specificallytargeted replacement, rather than with food wastage. For example, producing food wastage andthen recycling it in an anaerobic biogas digester to produce natural gas usually is less efficient thanproducing specific substrates to load the digester.
3. Lessons learned from the case studies

49
Reducing food wastage can have negative effects which needs to be recognizedCase Study 5, which looked at German food banks, showed that they provided food to the needybut also led to reduced retail food sales, with corresponding negative effects on retailers’ revenuesand, potentially, on related jobs. This may only have a small effect within a local economy, but therecan be hot-spot situations, where these effects have a broader impact. For example, chicken meatconsumed in Europe is mainly from breasts, while the rest of the meat (legs, wings, necks and feet)is exported on a large scale to western Africa. This undermines local production and has detrimentalimpacts on the local economies in the target countries (ACDIC et al. 2007, APRODEV et al. 2006).Albeit a food wastage reduction measure, expectedly with environmental benefits, it may be judgednegatively due to these side-effects indicating that promoting consumption of all parts of the chickenin Europe would be a better approach.
Ultimately, effective mitigation of food wastage depends not only on effective single measures but fundamental changes in the food system and culinary habitsFood wastage, particularly at retail and consumer levels, is often due to consumer expectations forimmediate and uninterrupted availability, and to supporting regulations that control freshness andappearance of the products. Furthermore, consumers in developed countries have become increas-ingly selective, consuming only certain parts of animals (e.g. chicken breasts) or crops (e.g. whiteflour) and leaving the rest (e.g. offals) to be dumped or sold elsewhere. Raising awareness of theseissues with consumers and policy-makers and promoting more “sufficient” lifestyles with more mod-erate expectations and consumption patterns regarding those aspects would help reduce this waste.
3. Lessons learned from the case studies
50
4. Conclusions and recommendations
With globalization and modernization of the food sector, families are now much less likely to stocktheir own fresh and preserved foods within their households. As a result, they have lost their under-standing of the source and value of food and have become “consumers” at the end of the ever-lengthening food supply chain. Food is not a “commodity” but an offering from Earth, human labourand (as reflected in many sacred texts since ancient times) the divine. Above all, mitigating foodwastage is a moral imperative for all. While there is a global consensus that mitigating food wastage is imperative, it remains important toraise awareness of the situation and how individuals and the industry can participate in mitigationmeasures. The “zero loss or waste of food” element of the Zero Hunger Challenge put forward bythe UN Secretary General, and various studies and policy targets (e.g. EU 2025) suggest that approx-imately half of food wastage could actually be prevented. More specifically, global agricultural lossescould be reduced by 47 percent and global consumption waste by 86 percent (Kummu et al. 2012). Yet, despite on-going efforts, investments remain insufficient to create the necessary conditions orchange behaviour towards this end. Furthermore, global population dynamics and changing lifestylesand consumption patterns are expected to exacerbate food wastage, especially in developing coun-tries that do not have the necessary infrastructure (e.g. conservation equipment). Economic growthhas come with increasing waste that is expected to increase further in coming decades. However,this increase in waste will be accompanied by expansion of energy recovery, central composting andrecycling. It is interesting to note that UNEP (2011) estimated that sorting and processing recyclablescan sustain ten times more jobs than landfilling or incineration on a per tonne basis and, at the sametime, reduce financial pressure on governments.This document has assessed, to the extent possible, the cost-benefit potential of different mitigationoptions by monetizing indirect social and environmental costs. The inefficient use of environmentalresources, coupled with the wasted use of human resources undermines the basis for food securityand wellbeing. It has been shown that societal externalities can change the ratio of food loss andwaste if operators and private actors reassess their processes that generate wastage, and recognizethat they need to take steps to curb the wastage both for their own benefit and for society’s, andto invest in mitigation measures. Return on investments become more acceptable to public or privateactors when societal benefits are understood, unveiling the huge costs of inaction. It is important to acknowledge that pursuing the absolute goal of zero food wastage is unrealisticand economically inefficient, due to high marginal costs. However, much could be achieved by publicpolicies to correct market failures that cause food wastage (e.g. matching production and consump-tion demand or setting up “pay-as-you-throw” systems) or by creating a sustainable consumptionculture. Food waste at retail and consumer level can often be traced to demand for choice, which
4 European Parliament, 2012.5 Less than 5 percent of funding to agricultural research is allocated to post-harvest systems.
4. Conclusions and recommendations

51
includes food aesthetics and overstocking of household pantries. Whatever mitigation measure istaken will have economic costs but, in turn, will also offer more global efficiency and equity. Reducing the level of food wastage is often beyond the capability of individual farmers, distributorsor consumers. Providing food supply is more than meeting cultural or traditional demand. It dependson systems outside the food and agriculture sector, including markets, trade, energy security andtransportation, in addition to cultural and culinary food choices. As shown in this report, public bodies, private enterprises and civil society institutions that have theauthority to make or influence policy decisions need to develop actions. For example, policy instru-ments such as subsidies on harvested areas rather than planted areas, taxing waste according to itscost to society, or collaborative action should be applied in order to reduce, prevent and managefood wastage throughout all steps of the food supply chain.
Therefore, there is need for a holistic approach to food wastage mitigation:
Multi-stakeholders linkagesThis calls for improving dialogue and cooperation of different authorities, including various ministries,such as health, rural development, environment, bioenergy and agriculture and municipalities, as wellas food supply chain actors, from producers to consumers. Improving communication can resolve dis-crepancies between demand and supply, such as what happens when farmers do not find a marketfor their production and leave crops to rot in the field, when a parent cooks dinner for five but onlythree family members actually make it to the table, when supermarkets downsize product orders atthe last minute, leaving producers with unsellable products, or when restaurants overestimate demandand overstock food supplies which then are wasted. Establishing coordinated joint action by buildingrelationships along the supply chain is crucial, as it allows for sharing the burden of risk (e.g. over-planting due to contracts calling for specific quantity and shape of products). Innovative deal structureshold promise for reducing food wastage, while strengthening the sense of community.
Multi-disciplinary food web linkagesAddressing food web linkages – from agro-ecosystem health to food quality and safety to consumerpreferences and nutrition – is a starting point for establishing food wastage mitigation measuresthat address negative externalities (e.g. GHG emissions) across the food system. In particular, publicgood investments and policies seeking to reduce food wastage involve improving farm productivity,supporting research, avoiding price volatility and promoting sustainable consumption.
Food wastage impact assessmentApplying some type of food wastage impact assessments is needed when introducing instrumentsin other areas that may indirectly increase food waste. Integrating food wastage impact assessmentinto standard practices will pave the way for effective operations.
4. Conclusions and recommendations

52
References
ACDIC, ICCO, APRODEV & EED. 2007. No more chicken, please. Church Development Service(EED), Citizens Association for the Defense of Collective Interests (ACDIC), Interchurch organisationfor development co-operation ICCO, Association of World Council of Churches related DevelopmentOrganisations in Europe APRODEV. http://aprodev.eu/files/Trade/071203_chicken_e_final.pdf
ADAC. 2014. Monatliche Durchschnittspreise Kraftstoffe seit 2000. http://www.adac.de/infotes-trat/tanken-kraftstoffe-und-antrieb/kraftstoffpreise/kraftstoff-durchschnittspreise/default.aspx?ComponentId=51587&SourcePageId=185107.)
Agridea. 2010. 'Deckungsbeiträge', Agridea, Lindau, Switzerland. http://www.agridea.ch/en/
APRODEV, EED, ICCO & SAILD/ACDIC. 2006. Poultry Meat Exports from the European Union toWest- and Central Africa: Comments on EU Answers to APRODEV Questions. Association of WorldCouncil of Churches related Development Organisations in Europe APRODEV, Church DevelopmentService (EED), Interchurch organisation for development co-operation ICCO, Citizens Association forthe Defense of Collective Interests (ACDIC). http://123doc.vn/document/1267938-poultry-meat-exports-from-the-european-union-to-west-and-central-africa-comments-on-eu-answers-to-aprodev-questions-pptx.htm
BSR. 2013. Selbstanlieferung Gewerbeabfälle. http://www.bsr.de/9825.html.
Bohm, F., Ellegren, L. & Hansson, L. 2013. Reducing costs and emissions at a cut flower plantationin Kenya. Uppsala Universitet. http://uu.diva-portal.org/smash/get/diva2:628202/FULLTEXT01.pdf
DECC. 2013. Statistical data set. Annual domestic energy bills. https://www.gov.uk/government/sta-tistical-data-sets/annual-domestic-energy-price-statistics
DEFRA. 2012. 2012 Guidelines to Defra / DECC's GHG conversion factors for company reporting.https://www.gov.uk/government/publications/2012-guidelines-to-defra-decc-s-ghg-conversion-factors-for-company-reporting-methodology-paper-for-emission-factors
European Parliament. 2012. Press release: Parliament calls for urgent measures to halve foodwastage in the EU.
Evangelisti, S., Lettieri, P., Borello, D. & Clift, R. 2014. Life cycle assessment of energy from waste viaanaerobic digestion: A UK case study. Waste Management, 34, 226-237.http://www.cabdirect.org/ab-stracts/20143037888.html?start=3150
53
FAGT. Die Tafeln. (http://www.tafel.de/die-tafeln.html.)
FAO. 2013a. Food Wastage Footprint: Impacts on Natural Resources. Natural Resources Manage-ment and Environment Department, Rome. http://www.fao.org/docrep/018/i3347e/i3347e.pdf
FAO. 2013b. Reducing Food Wastage Footprint: a Toolkit. Natural Resources Management and En-vironment Department, Rome. http://www.fao.org/docrep/018/i3342e/i3342e.pdf
FAO. 2014. Food Wastage Footprint: Full-Cost Accounting. Climate, Energy and Tenure Division,Rome.
Gustavsson, J., Cederberg, C., Sonesson, U., van Otterdijk, R. & Meybeck, A. 2011. Globalfood losses and food waste. Extent, causes and prevention. Agriculture and Consumer ProtectionDepartment, FAO, Rome. http://www.fao.org/fileadmin/user_upload/suistainability/pdf/Global_Food_Losses_and_Food_Waste.pdf
Kranert, M., Hafner, G., Barabosz, J., Schneider, F., Lebersorger, S., Scherhaufer, S., Schuller,H., Leverenz D. & Kölbig, A. 2012. Ermittlung der weggeworfenen Lebensmittelmengen undVorschläge zur Verminderung der Wegwerfrate bei Lebensmitteln in Deutschland. Stuttgart.http://www.bmelv.de/SharedDocs/Downloads/Ernaehrung/WvL/Studie_Lebensmittelabfaelle_Lang-fassung.pdf?__blob=publicationFile
Kreft, C. 2013. Lebensmittelverluste in konventionellen und biologischen Gemüsewertschöpfungs-ketten in der Schweiz. Ursachen und Handlungsoptionen. Master Thesis, Zürich, ETH Zürich.
Kummu, M., de Moel, H., Porkka, M., Siebert, S.,Varis, O. & Ward, P.J. 2012. Lost food, wastedresources: Global food supply chain losses and their impacts on freshwater, cropland, and fertiliseruse. Science of The Total Environment 438(0): 477-489. http://www.ncbi.nlm.nih.gov/pubmed/23032564
Lipinski B., Hanson C., Lomax J., Kitinoja L., Waite R. & Searchinger T. 2013. Reducing FoodLoss and Waste. Installment 2 of Creating a Sustainable Food Future. World Resources Institute.http://www.unep.org/pdf/WRI-UNEP_Reducing_Food_Loss_and_Waste.pdf
Lundie, S. and Peters, G.M. 2005. Life cycle assessment of food waste management options. Jour-nal of Cleaner Production, 13, 275-286. http://www.fcrn.org.uk/research-library/waste/food/life-cycle-assessment-food-waste-management-options
Salary Explorer. 2014. Salary Survey in Italy. (http://www.salaryexplorer.com/salary-survey.php?&loc-type=1&loc=105).

Segrè A. & Gaiani S. 2011. Transforming Food Waste into a Resource. Royal Society of Chemistry,Cambridge, UK.
Stuart, T. 2009. Waste - Uncovering the global food scandal. Penguin Books, London.
UNEP. 2011. Towards a Green Economy: Pathways to Sustainable Development and Poverty Eradi-cation, p287-329. (www.unep.org/greeneconomy,)
Visar Sorting. 2014. Visar Sorting Company Home Page. ( www.visar-sorting.com).
WRAP. 2011. Towards resource efficiency. WRAP business plan 2008-11. A report on impact. Ban-bury. http://www.wrap.org.uk/sites/files/wrap/WRAP%20Business%20Plan%20Review_0.pdf
WRAP. 2013a. The Courtauld Commitment. Phase 2. Final Results. Banbury.http://www.wrap.org.uk/sites/files/wrap/Courtauld%20Commitment%202%20Final%20Results.pdf
WRAP. 2013b. Household food and drink waste in the United Kingdom 2012. Banbury.http://www.wrap.org.uk/content/household-food-and-drink-waste-uk-2012
WRAP. 2013c. Methods used for household food and drink waste in the UK 2012. Annex report.Banbury. http://www.wrap.org.uk/sites/files/wrap/Methods%20Annex%20Report%20v2.pdf
WRAP. 2014. Econometric modeling and household food waste. Using an econometric modelingapproach to understand the influences on food waste and food purchases. WRAP.
54
i' DIFFERENT INDICATORS OF THE ENVIRONMENTAL AND FINANCIAL PERFORMANCE OFFOOD WASTAGE MITIGATION MEASURES
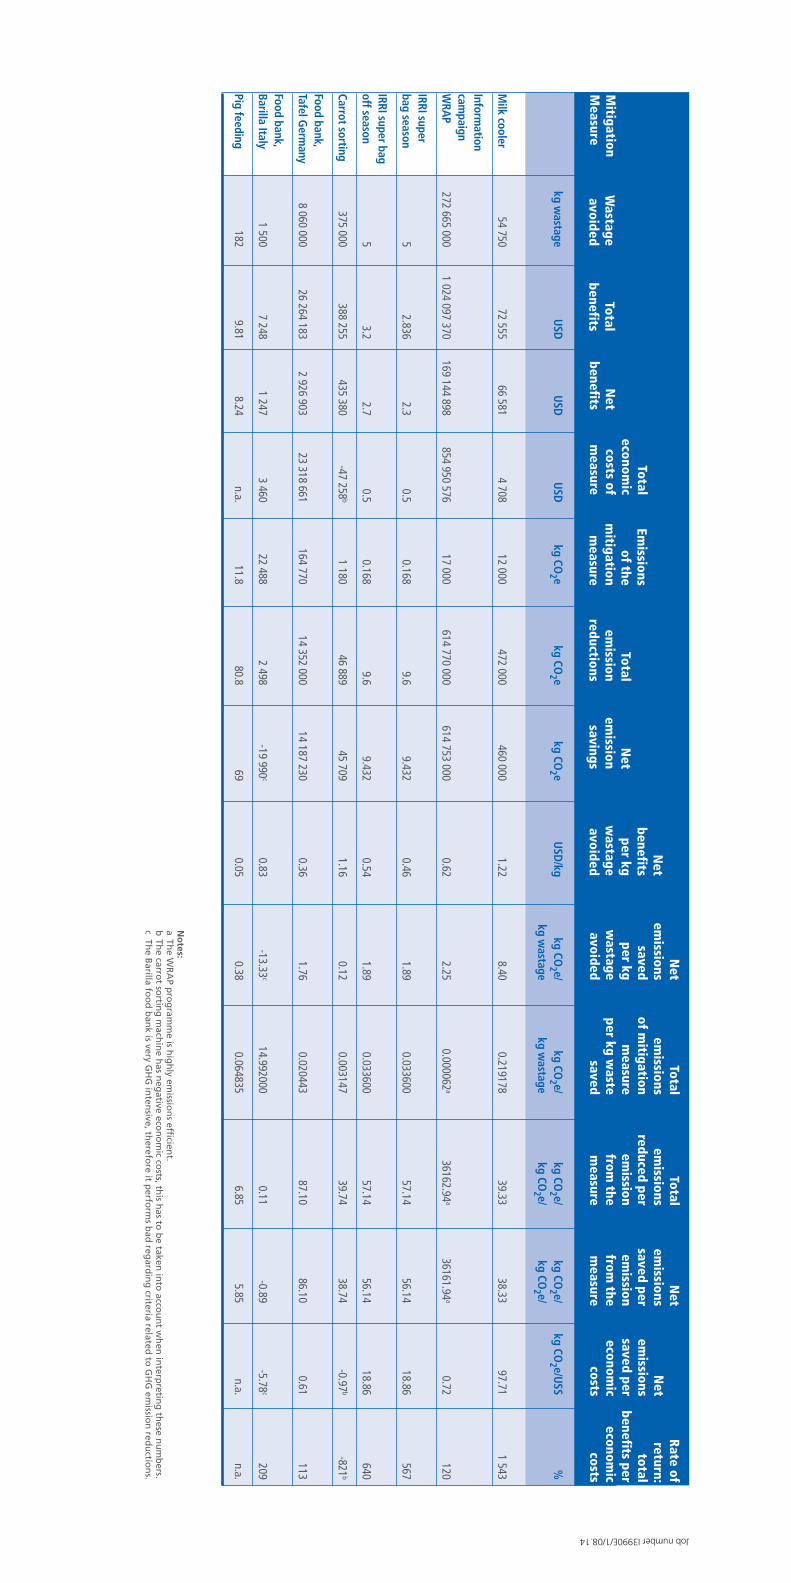
kg wastage
USDUSD
USD
kg CO2 e
kg CO2 e
kg CO2 e
USD/kg
kg CO2 e/
kg CO2 e/
kg CO2 e/
kg CO2 e/
kg CO2 e/USS
%kg w
astagekg w
astagekg CO
2 e/kg CO
2 e/
Milk cooler
54 75072 555
66 5814 708
12 000472 000
460 0001.22
8.400.219178
39.3338.33
97.711 543
Information
campaign
WRAP
272 665 0001 024 097 370
169 144 898854 950 576
17 000614 770 000
614 753 0000.62
2.250.000062
a36162.94
a36161.94
a0.72
120
IRRI super bag season
52.836
2.30.5
0.1689.6
9.4320.46
1.890.033600
57.1456.14
18.86567
IRRI super bag off season
53.2
2.70.5
0.1689.6
9.4320.54
1.890.033600
57.1456.14
18.86640
Carrot sorting375 000
388 255435 380
-47 258b
1 18046 889
45 7091.16
0.120.003147
39.7438.74
-0.97b
-821b
Food bank, Tafel G
ermany
8 060 00026 264 183
2 926 90323 318 661
164 77014 352 000
14 187 2300.36
1.760.020443
87.1086.10
0.61113
Food bank, Barilla Italy
1 5007 248
1 2473 460
22 4882 498
-19 990c
0.83-13.33
c14.992000
0.11-0.89
-5.78c
209
Pig feeding182
9.818.24
n.a.11.8
80.869
0.050.38
0.0648356.85
5.85n.a.
n.a.
Mitigation
Measure
Wastage
avoidedTotal
benefitsN
et benefits
Total econom
iccosts of
measure
Emissionsof the
mitigationm
easure
Total em
issionreductions
Net
emission
savings
Net
benefitsper kg
wastage
avoided
Net
emissionssaved
per kgw
astageavoided
Total em
issionsof m
itigationm
easure per kg w
astesaved
Total em
issions reduced per
emission
from the
measure
Net
emissions
saved perem
issionfrom
them
easure
Net
emissions
saved pereconom
iccosts
Rate of return:
total benefits per
economic
costs
No
tes: aTh
e WRAP p
rogram
me is h
ighly em
issions efficien
t. bTh
e carrot so
rting m
achine h
as neg
ative economic co
sts, this h
as to be taken
into acco
unt w
hen
interp
reting th
ese numbers.
cTh
e Barilla fo
od ban
k is very GHG in
tensive, th
erefore it p
erform
s bad
regard
ing criteria related
to GHG em
ission red
uctio
ns.
Job number I3990E/1/08.14

www.fao.org/nr/sustainability
I3989E/1/08.14
ISBN 978-92-5-108510-3
9 7 8 9 2 5 1 0 8 5 1 0 3


