+ All Categories
Home > Documents > Society of Biblical Literature and American Academy of ... · Society of Biblical Literature and...

Society of Biblical Literature and American Academy of ... · Society of Biblical Literature and...

Date post: 26-Jun-2018
Category:
Upload: phamdung
View: 218 times
Download: 0 times
Share this document with a friend
18
Job Advertisement Data 2016-2017 Society of Biblical Literature and American Academy of Religion Executive Summary After a historic low in positions advertised through AAR-SBL Employment Services in academic year 2016, the number of positions advertised through AAR-SBL Employment Services saw a slight increase of four percent. While the market for jobs in religion still shows signs of decreasing faculty positions, specifically tenured or tenure-track positions, other position types exhibited notable increases in 2017. The key findings from this year are below, followed by more complete data analysis. When reviewing this report, note that the data in it represent only the jobs posted with AAR and SBL. While it is a representative sample of the job market, the data does not necessarily reflect all positions in the field, in particular positions outside of North America as well as some adjunct positions, which may be locally advertised. For previous reports, please see the following links: July 1, 2015 through June 30, 2016 July 1, 2014 through June 30, 2015 January 1, 2013 through June 30, 2014 January 1, 2011 through December 31, 2012 January 1, 2001 through December 31, 2010 Key Findings Positions advertised in AY17 increased 4.0% compared to AY16. This increase in postings was primarily the result of increased listings for non-faculty positions. The total number of faculty positions decreased by 8.6% year over year from AY16 to AY17. Within this percentage, several mixed findings can be highlighted: o Postings from research institutions are at an all-time low since SBL and AAR began collecting employment data in 2003. o The number of entry-level faculty positions increased by 11.4% year over year from AY16 to AY17. o The number of tenure-track faculty positions reached a six-year low. o The number of postings from baccalaureate institutions is at seven-year high. For faculty positions, the most selected category for the annual course load shifted from three to four in 2016 to five to six in 2017.
Transcript

Job Advertisement Data 2016-2017 Society of Biblical Literature and American Academy of Religion Executive Summary After a historic low in positions advertised through AAR-SBL Employment Services in academic year 2016, the number of positions advertised through AAR-SBL Employment Services saw a slight increase of four percent. While the market for jobs in religion still shows signs of decreasing faculty positions, specifically tenured or tenure-track positions, other position types exhibited notable increases in 2017. The key findings from this year are below, followed by more complete data analysis. When reviewing this report, note that the data in it represent only the jobs posted with AAR and SBL. While it is a representative sample of the job market, the data does not necessarily reflect all positions in the field, in particular positions outside of North America as well as some adjunct positions, which may be locally advertised. For previous reports, please see the following links: • July 1, 2015 through June 30, 2016 • July 1, 2014 through June 30, 2015 • January 1, 2013 through June 30, 2014 • January 1, 2011 through December 31, 2012 • January 1, 2001 through December 31, 2010

Key Findings

• Positions advertised in AY17 increased 4.0% compared to AY16. This increase in postings was primarily the result of increased listings for non-faculty positions.

• The total number of faculty positions decreased by 8.6% year over year from AY16 to AY17. Within this percentage, several mixed findings can be highlighted:

o Postings from research institutions are at an all-time low since SBL and AAR began collecting employment data in 2003.

o The number of entry-level faculty positions increased by 11.4% year over year from AY16 to AY17.

o The number of tenure-track faculty positions reached a six-year low. o The number of postings from baccalaureate institutions is at seven-year

high. • For faculty positions, the most selected category for the annual course load

shifted from three to four in 2016 to five to six in 2017.

2

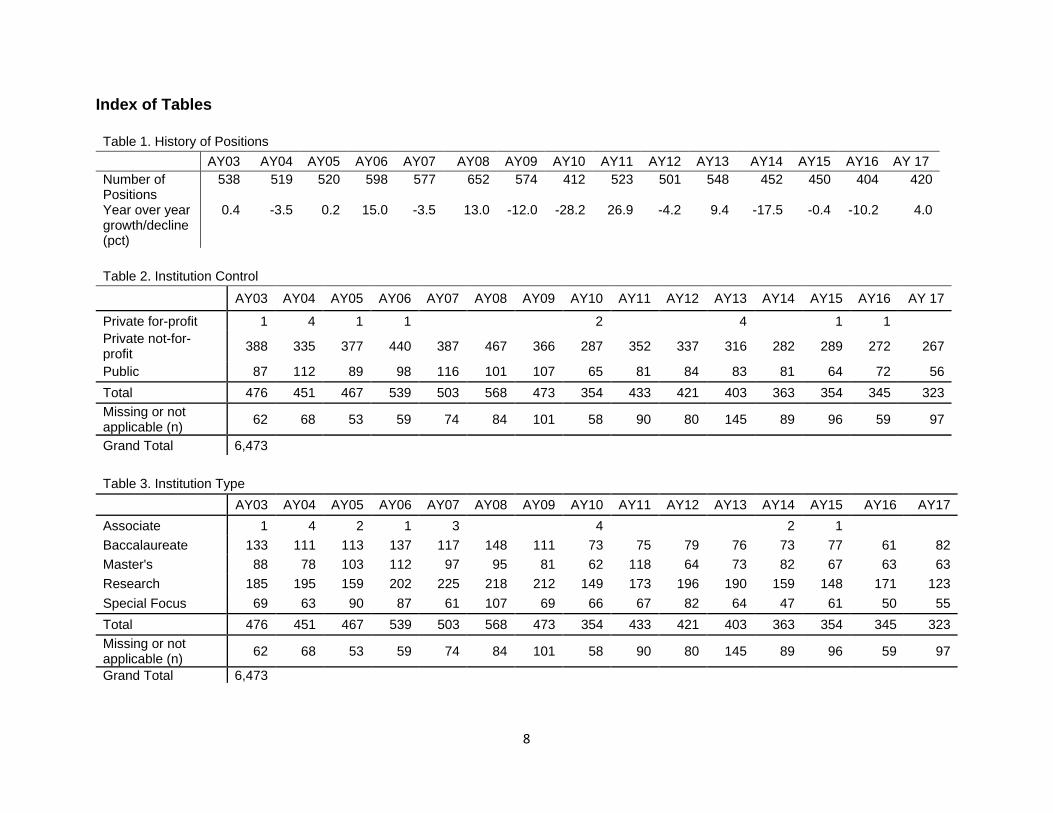
Data Analysis The data generated from the postings on the AAR and SBL Employment Services site offer an indication that, while still at a low, the job market saw a slight improvement in academic year 2017 (AY17). The number of discrete institutions is at a three-year high of 272 (Table 2), and the number of positions increased by 4.0% year over year (Table 1). While the number of positions is still low compared to ten years ago, 2017 is the first year to see an increase in positions since 2013.

After a year of historic lows in some categories, significant shifts occurred in 2017 in the number of positions by institution type (Table 3).1 After reaching a record low in AY16,

1 For more information on these classifications, see the Carnegie Classification of Institutions of Higher Education at http://carnegieclassifications.iu.edu/classification_descriptions/basic.php. Doctoral Universities Includes institutions that awarded at least 20 research/scholarship doctoral degrees during the update year (this does not include professional practice doctoral-level degrees, such as the JD, MD, PharmD, DPT, etc.). Excludes Special Focus Institutions and Tribal Colleges. Master's Colleges and Universities Generally includes institutions that awarded at least 50 master's degrees and fewer than 20 doctoral degrees during the update year (with occasional exceptions – see Methodology). Excludes Special Focus Institutions and Tribal Colleges. Baccalaureate Colleges Includes institutions where baccalaureate or higher degrees represent at least 50 percent of all degrees but where fewer than 50 master's degrees or 20 doctoral degrees were awarded during the update year.

Figure 1. Number of Positions and Number of Discrete Institutions

3

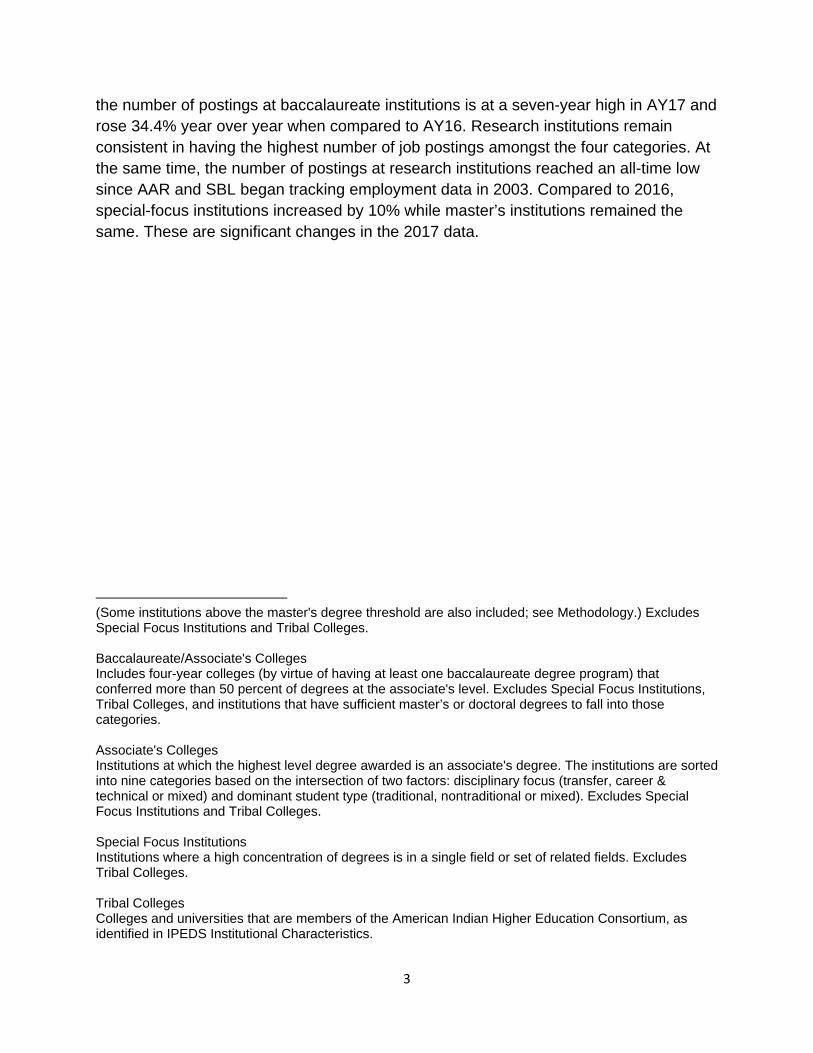
the number of postings at baccalaureate institutions is at a seven-year high in AY17 and rose 34.4% year over year when compared to AY16. Research institutions remain consistent in having the highest number of job postings amongst the four categories. At the same time, the number of postings at research institutions reached an all-time low since AAR and SBL began tracking employment data in 2003. Compared to 2016, special-focus institutions increased by 10% while master’s institutions remained the same. These are significant changes in the 2017 data.

(Some institutions above the master's degree threshold are also included; see Methodology.) Excludes Special Focus Institutions and Tribal Colleges. Baccalaureate/Associate's Colleges Includes four-year colleges (by virtue of having at least one baccalaureate degree program) that conferred more than 50 percent of degrees at the associate's level. Excludes Special Focus Institutions, Tribal Colleges, and institutions that have sufficient master’s or doctoral degrees to fall into those categories. Associate's Colleges Institutions at which the highest level degree awarded is an associate's degree. The institutions are sorted into nine categories based on the intersection of two factors: disciplinary focus (transfer, career & technical or mixed) and dominant student type (traditional, nontraditional or mixed). Excludes Special Focus Institutions and Tribal Colleges. Special Focus Institutions Institutions where a high concentration of degrees is in a single field or set of related fields. Excludes Tribal Colleges. Tribal Colleges Colleges and universities that are members of the American Indian Higher Education Consortium, as identified in IPEDS Institutional Characteristics.

4

As Figure 2 shows, 2017 also displayed a shift in position types (Table 4). Though the number of faculty positions continued to decline in AY17, the non-faculty positions listed through AAR and SBL increased. Compared with 2016, positions in administration saw an increase of 27%, fellowship or postdoc positions increased by 30%, and positions outside of higher education (e.g., K-12, nonprofit, publishing) increased by 300% and are at a record high. Even though the non-faculty positions represent less than half of the total postings in Employment Services, this increase is part of a clear, three-year trend. After a steady three-year decline, entry-level faculty positions increased by 11.4% over 2016 (Table 5). Mid-level positions increased 45% year over year and hit a five-year high in AY17. Upper-level positions hit the lowest number (eleven postings) on record since 2003. Along with the overall number of faculty positions, the number of tenured or tenure-track positions continued to decline in 2017. While this number is at a five-year low, the percentage of tenured or tenure track faculty jobs in 2017 is 63.4%, the highest percentage since 2013.2

2 However, as noted above, this report only includes jobs posted to the AAR-SBL Employment Service, and it is unknown how many adjunct or contingent positions are posted outside of that service.

Figure 2. Position Types, AY03-17

Faculty

Administration

Other Industry (e.g., K-12, Nonprofit, Publishing)

Other Higher Education (e.g., Librarian, Non-faculty Researcher)

Fellowship or Postdoc

5

As shown above in Figure 3, annual course load shifted from 2016 to 2017. The highest concentration in 2017 is five-to-six annual courses, which represents over half of faculty positions that listed the annual course load in 2017. In 2016, the course load of three to four was the most common followed closely by five to six. Note, however, that only half of the faculty listing reported annual course load (Tables 7, 8).

Remaining consistent with previous years’ data, a completed PhD and teaching experience remain the qualifications most desired/required by employers for faculty positions (Table 9).3 Published journal articles and published book(s) and/or monograph(s) increased in AY17 and remain the third and fourth most desired/required qualifications for a candidate, respectively. While a PhD and teaching experience are desired/required consistently across the different position levels, published book(s) and/or monograph(s) and published journals are less desired/required in entry-level positions compared with mid-level and upper-level positions (Table 10). Online course experience is preferred more in entry-level (13.8%) and mid-level (20.9%) positions compared with upper-level positions (6.5%). Along with differing preferences across position levels, the position’s institution type significantly affects certain qualifications desired. Special focus institutions, for example, desire ordination and online course experience and require religious affiliation more 3 Employers were able to select more than one desired qualification for candidates in Tables 9, 10, 11

Figure 3. Annual Course Load (Faculty)

6

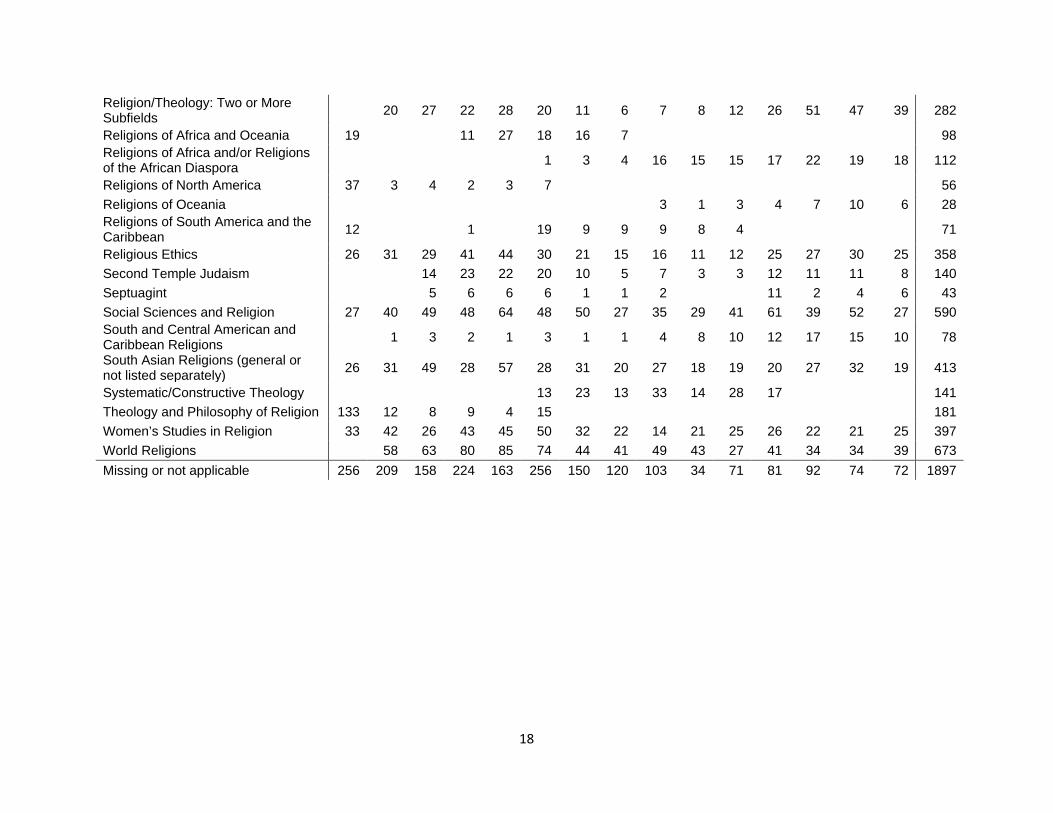
than the other three institution types. In addition, candidates who have published book(s) and monograph(s) are more desired at research and special focus institutions. The fields of expertise available for employers to select, shown in Table 12, have changed throughout the history of the AAR-SBL Employment Services. While some fields have remained as options for employers since 2003, it is important to note that other fields have been added, removed, or combined. Employers are able to select more than one field of expertise per position. While administrative support remained low overall in qualifications desired by employers for faculty positions, the administration and support services increased 36% year over year as a field of expertise in overall positions. Other fields increasing by 20% or more from 2016 include Early Christianity/Church History, Introduction to Religion, New Religious Movements, Christian Studies, Editorial/Journalism/Media, Septuagint, Pastoral Care, and Library. Among the fields that decreased in AY17, Ancient Near Eastern Languages, Archaeology - Greco-Roman, Social Sciences and Religion, Archaeology - Ancient Near East, East Asian Religions (general or not listed separately), Missiology, South Asian Religions (general or not listed separately), and Religions of Oceania decreased by 40% or more compared to 2016.

Figure 4. Positions by Country

7

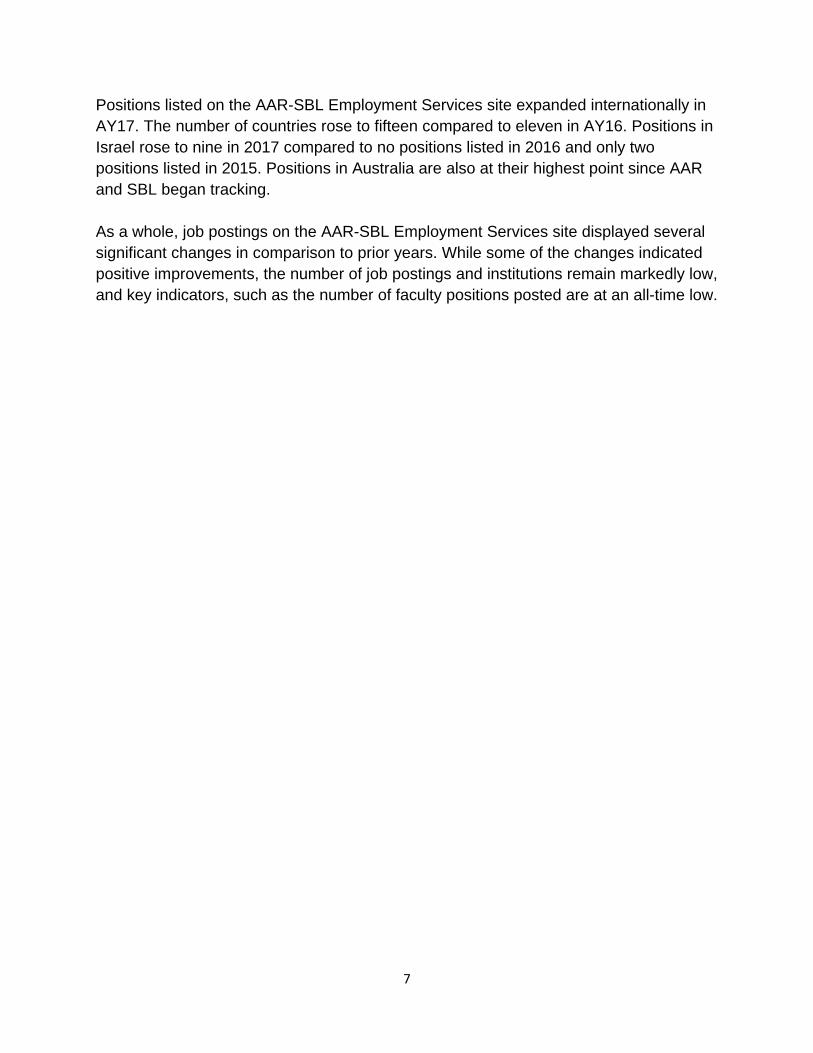
Positions listed on the AAR-SBL Employment Services site expanded internationally in AY17. The number of countries rose to fifteen compared to eleven in AY16. Positions in Israel rose to nine in 2017 compared to no positions listed in 2016 and only two positions listed in 2015. Positions in Australia are also at their highest point since AAR and SBL began tracking. As a whole, job postings on the AAR-SBL Employment Services site displayed several significant changes in comparison to prior years. While some of the changes indicated positive improvements, the number of job postings and institutions remain markedly low, and key indicators, such as the number of faculty positions posted are at an all-time low.

8

Index of Tables Table 1. History of Positions AY03 AY04 AY05 AY06 AY07 AY08 AY09 AY10 AY11 AY12 AY13 AY14 AY15 AY16 AY 17 Number of Positions

538 519 520 598 577 652 574 412 523 501 548 452 450 404 420

Year over year growth/decline (pct)

0.4 -3.5 0.2 15.0 -3.5 13.0 -12.0 -28.2 26.9 -4.2 9.4 -17.5 -0.4 -10.2 4.0

Table 2. Institution Control

AY03 AY04 AY05 AY06 AY07 AY08 AY09 AY10 AY11 AY12 AY13 AY14 AY15 AY16 AY 17

Private for-profit 1 4 1 1

2

4

1 1 Private not-for-profit 388 335 377 440 387 467 366 287 352 337 316 282 289 272 267

Public 87 112 89 98 116 101 107 65 81 84 83 81 64 72 56 Total 476 451 467 539 503 568 473 354 433 421 403 363 354 345 323 Missing or not applicable (n) 62 68 53 59 74 84 101 58 90 80 145 89 96 59 97

Grand Total 6,473 Table 3. Institution Type

AY03 AY04 AY05 AY06 AY07 AY08 AY09 AY10 AY11 AY12 AY13 AY14 AY15 AY16 AY17 Associate 1 4 2 1 3

4

2 1

Baccalaureate 133 111 113 137 117 148 111 73 75 79 76 73 77 61 82 Master's 88 78 103 112 97 95 81 62 118 64 73 82 67 63 63 Research 185 195 159 202 225 218 212 149 173 196 190 159 148 171 123 Special Focus 69 63 90 87 61 107 69 66 67 82 64 47 61 50 55 Total 476 451 467 539 503 568 473 354 433 421 403 363 354 345 323 Missing or not applicable (n) 62 68 53 59 74 84 101 58 90 80 145 89 96 59 97

Grand Total 6,473

9

Table 4. Position Type (n) AY03 AY04 AY05 AY06 AY07 AY08 AY09 AY10 AY11 AY12 AY13 AY14 AY15 AY16 AY17 Administration 34 24 14 22 17 28 27 14 32 32 37 31 13 37 47 Faculty 484 465 480 518 541 588 502 360 435 429 429 345 384 302 276 Fellowship or Postdoc 19 22 19 22 14 28 29 28 49 28 70 60 38 60 78 Other Higher Education (e.g., Librarian, Non-faculty Researcher)

2 1 2

2 9 7 3 2 6 12 9 11 7

Other Industry (e.g., K-12, Nonprofit, Publishing)

1 5 3 3 4 6 7 3 4 10 6 4 6 3 12

Total 538 519 520 598 577 652 574 412 523 501 548 452 450 404 420 Missing or not applicable 5 1 3 31 1

Grand Total 7,820 Table 5. Position Level of Seniority (n, Faculty) AY03 AY04 AY05 AY06 AY07 AY08 AY09 AY10 AY11 AY12 AY13 AY14 AY15 AY16 AY17 Entry-level 281 270 282 295 293 277 289 180 194 210 240 232 228 184 205 Mid-level 22 17 23 25 25 29 15 9 19 35 17 14 21 20 29 Upper-level 40 42 38 38 54 61 46 29 35 43 36 26 62 28 11 Open or unspecified 141 136 137 160 169 221 152 142 187 141 136 73 73 88 31 Total 484 465 480 518 541 588 502 360 435 429 429 345 384 302 276 Missing or not applicable

Grand Total 6,538

10

Table 6. Position Tenure Status (n, Faculty) AY03 AY04 AY05 AY06 AY07 AY08 AY09 AY10 AY11 AY12 AY13 AY14 AY15 AY16 AY17

Non-tenure track or term-limited 93 76 79 87 72 112 50 80 92 80 83 83 61 44 70

Tenure-track or tenured 238 244 245 291 290 306 292 54 99 312 279 184 227 187 175

Total 331 320 324 378 362 418 342 134 191 392 362 267 288 231 245 Missing or not applicable 153 145 156 140 179 170 160 226 244 37 67 78 98 71 31

Grand Total 6,538 Table 7. Total Annual Number of Courses (n, Faculty) AY03 AY04 AY05 AY06 AY07 AY08 AY09 AY10 AY11 AY12 AY13 AY14 AY15 AY16 AY17 One to two 7 11 3 7 10 7 2 4 5 14 19 17 17 20 2 Three to four 100 123 132 128 123 145 109 67 69 83 75 84 73 86 43 Five to six 152 145 160 201 182 171 130 82 85 74 73 83 98 74 85 Seven to eight 64 64 61 69 70 69 35 20 54 33 36 41 35 26 23 Nine or more 11 8 16 4 8 8 3 2 5 3 11

1

Total 334 351 372 409 393 400 279 175 218 207 205 225 223 206 154 Missing or not applicable

150 114 108 109 148 188 223 185 217 222 224 120 161 96 122

Grand Total 7,672 Table 8. Total Annual Number of Courses (pct, Faculty)

AY03 AY04 AY05 AY06 AY07 AY08 AY09 AY10 AY11 AY12 AY13 AY14 AY15 AY16 AY17 One to two 2.1 3.1 0.8 1.7 2.5 1.8 0.7 2.3 2.3 6.8 9.3 7.6 7.6 9.7 1.3 Three to four 29.9 35.0 35.5 31.3 31.3 36.3 39.1 38.3 31.7 40.1 36.6 37.3 32.7 41.7 27.9 Five to six 45.5 41.3 43.0 49.1 46.3 42.8 46.6 46.9 39.0 35.7 35.6 36.9 43.9 35.9 55.2 Seven to eight 19.2 18.2 16.4 16.9 17.8 17.3 12.5 11.4 24.8 15.9 17.6 18.2 15.7 12.6 14.9 Nine or more 1.5 1.4 2.4 0.5 0.3 0.8 0.7 0.6 0.9 1.5 1.4 1.0

0.6

Total 100 100 100 100 100 100 100 100 100 100 100 100 100 100 100 Missing or not applicable (n)

204 168 148 189 184 252 295 237 305 294 343 227 227 198 122

Grand Total 7,672

11

Table 9. Qualifications Desired/Required by Employers (pct, Faculty, AY13-AY17) Type AY13 AY14 AY15 AY16 AY17

Administrative Experience Desired 9.5 4.3 10.6 6.7 4.5 Required 5.9 5.1 7.1 7.4 3.6 Total 15.4 9.0 17.4 12.6 8.2

Affirmative Action Eligibility Desired 15.1 6.9 9.0 4.4 6.8 Required 2.6 1.4 1.0 1.1 0.9 Total 17.7 7.9 9.7 4.8 7.7

Interdisciplinary Teaching or Research Desired 28.2 17.7 24.8 15.6 14.5 Required 13.4 13.7 15.5 9.6 11.8 Total 41.6 30.0 37.4 23.3 26.4

Online Course Instruction Experience Desired 0.3 11.6 10.6 10.0 14.1 Required 0.3 1.1 2.9 3.0 1.8 Total 0.7 12.6 12.3 13.0 15.9

Ordination Desired 8.5 2.9 5.5 4.1 5.5 Required 1.0 3.2 2.2 1.4 Total 9.5 2.9 8.7 5.9 6.8

Other Desired 2.0 9.7 4.5 4.1 2.3 Required 2.3 7.6 4.5 4.8 5.9 Total 3.6 10.1 7.7 7.7 8.2

PhD Desired 18.7 21.3 20.0 22.6 16.4 Required 75.4 76.2 77.1 76.3 80.9 Total 94.1 92.4 92.3 93.3 97.3

Published Book(s) and/or Monograph(s) Desired 0.3 13.7 19.4 20.0 17.7 Required 0.3 4.3 8.4 4.4 7.3 Total 0.7 17.3 26.8 23.7 25.0

Published Journal Article(s) Desired 0.3 20.9 25.2 23.0 23.6 Required 0.3 6.9 13.5 8.5 9.1

12

Total 0.7 26.4 36.1 30.4 32.7

Religious Affiliation/Commitment (bona fide occupational qualification) Desired 5.9 5.4 7.4 3.0 5.0 Required 14.1 10.8 16.1 12.6 13.2 Total 20.0 15.5 21.9 14.4 18.2

Student Services Experience Desired 5.2 1.8 3.2 1.5 1.8 Required 3.3 1.4 1.3 0.4 0.5 Total 8.5 2.9 4.2 1.9 2.3

Teaching Experience Desired 31.1 30.0 29.7 31.5 27.3 Required 47.5 45.8 51.0 41.5 44.5 Total 78.7 71.8 72.9 67.8 71.8

U.S. Citizenship Desired 3.9 0.7 1.9 0.7 0.4 Required 4.6 2.2 2.3 2.2 Total 8.5 2.9 3.5 3.0 0.4

Grand Total 100.0 100.0 100.0 100.0 100.0

13

Table 10. Qualifications (selected) Desired/Required by Employers by Level (pct, Faculty, AY15-AY17) Qualification Type Entry-level Mid-level Upper-level

Interdisciplinary Teaching or Research Desired 17.9 16.3 14.5 Required 10.5 20.9 22.6 Total 28.4 37.2 37.1

Online Course Instruction Experience Desired 11.6 16.3 3.2 Required 2.2 4.7 3.2 Total 13.8 20.9 6.5

PhD Desired 18.1 7.0 1.6 Required 77.9 88.4 85.5 Total 96.1 95.3 87.1

Published Book(s) and/or Monograph(s) Desired 16.4 25.6 27.4 Required 1.6 34.9 30.6 Total 17.9 60.5 58.1

Published Journal Article(s) Desired 22.5 20.9 21.0 Required 5.5 39.5 41.9 Total 28.0 60.5 62.9

Teaching Experience Desired 30.8 14.0 8.1 Required 41.4 69.8 71.0 Total 72.2 83.7 79.0

Grand Total 100.0 100.0 100.0

14

Table 11. Qualifications Desired/Required by Institution Type (pct, Faculty, AY15-AY17) Type Baccalaureate Master's Research Special Focus

Administrative Experience Desired 3.6 4.1 6.2 8.5

Required 1.8 2.8 2.2 6.8 Total 5.4 6.9 8.3 15.3

Affirmative Action Eligibility Desired 6.0 10.3 4.7 8.5

Required 1.4 0.4 2.5 Total 6.0 11.7 5.1 11.0

Interdisciplinary Teaching or Research Desired 19.6 11.7 17.0 13.6

Required 6.5 15.2 7.6 12.7 Total 26.2 26.9 24.6 26.3

Online Course Instruction Experience Desired 3.6 9.7 4.7 31.4

Required 0.6 1.4 2.2 6.8 Total 4.2 11.0 6.9 38.1

Ordination Desired 2.4 18.6

Required 0.6 7.6 Total 3.0 26.3

Other Desired 0.6 3.4 2.5 5.9

Required 1.8 7.6 3.6 5.1 Total 2.4 11.0 6.2 11.0

PhD Desired 26.2 23.4 9.8 11.0

Required 69.0 66.9 72.8 74.6 Total 95.2 90.3 82.6 85.6

Published Book(s) and/or Monograph(s) Desired 11.9 9.0 17.8 29.7

Required 1.8 2.8 8.3 9.3 Total 13.7 11.7 26.1 39.0

Published Journal Article(s) Desired 17.9 14.5 19.9 33.9

Required 3.6 6.9 11.2 11.9 Total 21.4 21.4 31.2 45.8

Religious Affiliation/Commitment (bona fide occupational qualification) Desired 1.2 5.5 1.1 10.2

Required 6.0 11.0 2.9 42.4

15

Total 7.1 16.6 4.0 55.6

Student Services Experience Desired 1.8 1.4 0.7 1.7

Required 1.2 1.7 Total 3.0 1.4 0.7 3.4

Teaching Experience Desired 24.4 30.3 20.3 27.1

Required 42.9 44.8 40.9 44.1 Total 67.3 75.2 61.2 71.2

U.S. Citizenship Desired 0.7 0.7 1.7

Required 0.6 3.4 2.5 Total 0.6 4.1 0.7 4.2

Grand Total 100.0 100.0 100.0 100.0

16

Table 12. Position Fields of Expertise AY

03 AY 04

AY 05

AY 06

AY 07

AY 08

AY 09

AY 10

AY 11

AY 12

AY 13

AY 14

AY 15

AY 16

AY 17 Total

Administration and Support Services 46 32 32 37 48 43 33 39 43 53 34 40 39 53 507 Ancient Near Eastern Languages 9 12 19 14 3 2 6 3 1 13 14 17 8 112 Archaeology 1 1 1 1 2 2 2 1 1 12 Archaeology - Ancient Near East 11 9 12 9 2 12 3 10 22 9 11 6 109 Archaeology - Greco-Roman 6 5 10 3 3 3 13 2 8 11 11 8 4 82 Arts, Literature, and Religion 33 32 31 36 43 30 34 17 22 15 16 32 26 29 27 395 Asian Religions (general or not listed separately) 41 41 42 38 51 55 40 23 33 36 30 30 37 40 34 537

Biblical Languages 2 27 32 40 25 9 4 11 6 21 39 33 25 17 272 Buddhism 22 32 22 36 37 30 22 37 23 13 17 33 35 23 359 Catholic Studies 20 18 18 24 17 17 10 8 4 5 11 9 21 13 182 Catholic Theology (all areas) 30 34 32 27 37 18 8 17 12 16 24 23 30 24 307 Central and South American and Caribbean Religions

10 15 9 13 14 10 7 6 4 4 92

Christian Ethics 36 38 32 31 25 22 14 15 13 18 18 33 26 25 320 Christian Studies 50 29 35 37 43 32 23 26 36 25 33 36 25 23 34 451 Christian Theology (general or not listed separately) 1 31 34 33 37 26 22 15 16 18 25 16 54 36 42 360

Christian Theology: Practical/Praxis 31 21 26 21 34 16 16 6 10 10 12 22 39 26 23 287 Christian Theology: Systematic/Constructive 50 34 32 28 41 24 19 4 9 13 18 25 32 23 25 352

Classics 14 9 15 16 13 5 12 3 11 19 17 15 12 148 Comparative Religions 47 58 49 44 64 70 35 24 54 29 33 37 36 37 42 616 Comparative Religions/Theology 12 1 1 3 13 7 8 12 16 7 80 Critical Studies/Theory/Methods in Religion

14 17 22 28 19 33 13 20 19 32 30 29 27 23 302

Early Christian Literature/New Testament 66 58 33 23 22 14 216

Early Christianity/Church History 4 30 28 48 36 19 10 13 8 9 15 28 26 33 271 Early Judaism 20 16 21 18 13 8 15 4 7 5 17 14 12 157 East Asian Religions (general or not listed separately) 22 27 43 30 44 32 32 18 39 19 15 22 24 30 17 397

17

Editorial/Journalism/Media 5 4 1 4 2 1 1 3 5 4 2 3 31 Epigraphy 2 3 2 2 2 2 1 1 5 4 19 Ethics 50 24 32 20 22 23 24 9 20 21 18 7 270 Gay/Lesbian Studies in Religion 7 5 8 10 14 9 3 3 3 4 11 8 13 13 98 Hebrew Bible and Religions of the Ancient Near East 34 49 46 58 63 51 42 28 44 28 21 31 495

Hebrew Bible/Old Testament 79 66 74 65 80 85 21 26 19 13 11 33 48 44 35 662 Hinduism 26 29 17 34 29 16 14 31 11 12 18 24 25 23 286 History of Christianity/Church History 70 58 64 75 74 84 44 35 49 32 29 36 39 36 31 723 History of Religion (general) 44 49 46 65 66 60 31 20 43 28 26 30 26 28 26 561 Indigenous/Native/Traditional Religions

18 23 10 16 16 14 4 13 10 12 11 12 19 16 178

Introduction to Religion 1 51 43 49 51 65 49 44 48 35 33 47 16 14 18 546 Islam/Islamic Studies 103 66 92 83 94 77 70 52 62 64 61 49 37 51 42 876 Judaism/Jewish Studies 88 52 54 57 55 56 50 36 43 30 57 42 39 34 34 629 Languages (inc. Hebrew, Greek, Urdu, Arabic, etc.)

5 6 8 4 6 11 3 43

Library 3 4 5 2 2 16 13 16 5 5 4 1 3 8 79 Missiology 14 10 5 8 12 8 10 7 9 5 8 14 7 4 117 Moral Theology 4 22 7 19 16 15 14 97 New Religious Movements 12 9 8 15 8 13 8 7 2 4 9 14 10 13 119 New Testament 3 50 49 61 53 28 16 17 11 27 35 53 46 41 445 New Testament, Christian Origins, Ancient Christianity 19 29 60 72 74 76 38 32 44 59 46 36 585

North American Religions 37 33 30 28 37 37 20 19 16 17 20 23 20 27 22 364 Pastoral Care 22 20 18 19 25 11 9 14 14 6 13 25 11 19 207 Philosophy of Religion 134 45 45 54 48 56 26 16 20 22 27 22 24 29 22 568 Practical/Praxis Theology 31 22 36 40 38 48 8 3 4 8 5 4 156 Preaching/Ministry/Liturgical Studies 27 28 25 29 26 15 12 19 14 11 14 27 22 15 264 Rabbinic Judaism 12 17 16 16 11 8 5 3 4 13 11 11 10 126 Racial/Ethnic Minority Studies in Religion 30 37 34 34 39 42 29 12 10 8 7 21 26 29 27 338

Religion and Science 5 20 15 20 17 60

18

Religion/Theology: Two or More Subfields

20 27 22 28 20 11 6 7 8 12 26 51 47 39 282

Religions of Africa and Oceania 19 11 27 18 16 7 98 Religions of Africa and/or Religions of the African Diaspora

1 3 4 16 15 15 17 22 19 18 112

Religions of North America 37 3 4 2 3 7 56 Religions of Oceania 3 1 3 4 7 10 6 28 Religions of South America and the Caribbean 12 1 19 9 9 9 8 4 71

Religious Ethics 26 31 29 41 44 30 21 15 16 11 12 25 27 30 25 358 Second Temple Judaism 14 23 22 20 10 5 7 3 3 12 11 11 8 140 Septuagint 5 6 6 6 1 1 2 11 2 4 6 43 Social Sciences and Religion 27 40 49 48 64 48 50 27 35 29 41 61 39 52 27 590 South and Central American and Caribbean Religions

1 3 2 1 3 1 1 4 8 10 12 17 15 10 78

South Asian Religions (general or not listed separately) 26 31 49 28 57 28 31 20 27 18 19 20 27 32 19 413

Systematic/Constructive Theology 13 23 13 33 14 28 17 141 Theology and Philosophy of Religion 133 12 8 9 4 15 181 Women’s Studies in Religion 33 42 26 43 45 50 32 22 14 21 25 26 22 21 25 397 World Religions 58 63 80 85 74 44 41 49 43 27 41 34 34 39 673 Missing or not applicable 256 209 158 224 163 256 150 120 103 34 71 81 92 74 72 1897


Recommended