50


SODIUM CHLORATE LISTING BACKGROUNDDOCUMENT
FOR THE INORGANIC CHEMICAL LISTING DETERMINATION
This Document Does Not Contain Confidential Business Information
August, 2000
U.S. ENVIRONMENTAL PROTECTION AGENCYARIEL RIOS BUILDING1200 PENNSYLVANIA AVENUE, N.W.WASHINGTON, D.C. 20460
Inorganic Listing Determination Sodium ChlorateListing Background Document August, 2000
TABLE OF CONTENTS
1. SECTOR OVERVIEW . . . . . . . . . . . . . . . . . . . . . . . . . . . . . . . . . . . . . . . . . . . . . . . . . . . . 11.1 SECTOR DEFINITION, FACILITY NAMES/LOCATIONS . . . . . . . . . . . . . . . . 11.2 PRODUCTS, PRODUCT USAGE AND MARKETS . . . . . . . . . . . . . . . . . . . . . . 31.3 PRODUCTION CAPACITY . . . . . . . . . . . . . . . . . . . . . . . . . . . . . . . . . . . . . . . . . 3
2. DESCRIPTION OF MANUFACTURING PROCESS . . . . . . . . . . . . . . . . . . . . . . . . . . . 52.1 PRODUCTION AND PROCESS DESCRIPTION . . . . . . . . . . . . . . . . . . . . . . . . 52.2 PRODUCTION TRENDS, CHANGES AND IMPROVEMENTS . . . . . . . . . . . . 7
3. WASTE GENERATION AND MANAGEMENT . . . . . . . . . . . . . . . . . . . . . . . . . . . . . . . 93.1 CONTAMINATED WATER AND DEBRIS . . . . . . . . . . . . . . . . . . . . . . . . . . . . . 93.2 MATERIALS . . . . . . . . . . . . . . . . . . . . . . . . . . . . . . . . . . . . . . . . . . . . . . . . . . . . . 9
3.2.1 In-process Recycling . . . . . . . . . . . . . . . . . . . . . . . . . . . . . . . . . . . . . . . . . . 93.2.2 Materials Used or Reused for Other Purposes . . . . . . . . . . . . . . . . . . . . . . . 9
3.3 WASTES PRODUCED BY THE SODIUM CHLORATE PRODUCTIONPROCESS . . . . . . . . . . . . . . . . . . . . . . . . . . . . . . . . . . . . . . . . . . . . . . . . . . . . . . 113.3.1 Record Sampling and Analysis . . . . . . . . . . . . . . . . . . . . . . . . . . . . . . . . . . 133.3.2 Process Sludge with Chromium or Lead . . . . . . . . . . . . . . . . . . . . . . . . . . 153.3.3 Process Sludge without Chromium and Lead . . . . . . . . . . . . . . . . . . . . . . . 193.3.4 Spent Filters with Chromium or Lead . . . . . . . . . . . . . . . . . . . . . . . . . . . . . 283.3.5 Spent Filters without Chromium and Lead . . . . . . . . . . . . . . . . . . . . . . . . . 303.3.6 Wastewaters with Chromium that are not Recycled Back to the Process
. . . . . . . . . . . . . . . . . . . . . . . . . . . . . . . . . . . . . . . . . . . . . . . . . . . . . . . . . 333.3.7 Other Wastewaters That Do Not Contain Chromium or Lead And Are Not
Recycled . . . . . . . . . . . . . . . . . . . . . . . . . . . . . . . . . . . . . . . . . . . . . . . . . . 34
Appendix A: Summary of Waste Generation and Management and Summary Appendix B: Record Sampling Analytical Data Reports
Inorganic Listing Determination Sodium ChlorateListing Background Document August, 2000
LIST OF TABLES
Table 1.1 Sodium Chlorate Producers . . . . . . . . . . . . . . . . . . . . . . . . . . . . . . . . . . . . . . . . . . . . . . . 1Table 1.2 Sodium Chlorate Production Capacity . . . . . . . . . . . . . . . . . . . . . . . . . . . . . . . . . . . . . . . 4Table 3.1 Materials Generated from the Production of Sodium Chlorate . . . . . . . . . . . . . . . . . . . . . 10Table 3.2 Wastes Generated from the Production of Sodium Chlorate . . . . . . . . . . . . . . . . . . . . . . 12Table 3.3 Summary of Sodium Chlorate Production Wastes and Record Sample Collection . . . . . . 14Table 3.4 Waste Management Summary for Process Sludge with Chromium . . . . . . . . . . . . . . . . . 15Table 3.5 Record Samples, Process Sludge with Chromium . . . . . . . . . . . . . . . . . . . . . . . . . . . . . . 16Table 3.6 Waste Characterization for Process Sludge with Chromium or Lead . . . . . . . . . . . . . . . . 17Table 3.7 Waste Management Summary for Process Sludge without Chromium . . . . . . . . . . . . . . . 19Table 3.8 Record Samples, Process Sludge without Chromium or Lead . . . . . . . . . . . . . . . . . . . . . 20Table 3.9 Analytical Results for Process Sludge Without Chromium and Lead . . . . . . . . . . . . . . . . 21Table 3.10 Modeling Results for Process Sludge without Chromium and Lead That is Managed Under
the Land Treatment Scenario . . . . . . . . . . . . . . . . . . . . . . . . . . . . . . . . . . . . . . . . . . . . . . . 23Table 3.11 Georgia Gulf’s On-Site Land Treatment Unit Characterization . . . . . . . . . . . . . . . . . . . 24Table 3.12 Summary of Process Sludge without Chromium and Lead That Are Managed in Landfill
Scenarios . . . . . . . . . . . . . . . . . . . . . . . . . . . . . . . . . . . . . . . . . . . . . . . . . . . . . . . . . . . . . . 25Table 3.13 Calculated Resultant Concentrations of Constituents of Concern in the Cement Product 27Table 3.14 Waste Management Summary for Spent Filters with Chromium . . . . . . . . . . . . . . . . . . 28Table 3.15 Record Sample, Filter Wastes with Chromium . . . . . . . . . . . . . . . . . . . . . . . . . . . . . . . 29Table 3.16 Analytical Results of Sampling Spent Filters with Chromium or Lead Wastestream
. . . . . . . . . . . . . . . . . . . . . . . . . . . . . . . . . . . . . . . . . . . . . . . . . . . . . . . . . . . . . . . . . . . . . 29Table 3.17 Waste Management Summary for Spent Filters without Chromium . . . . . . . . . . . . . . . . 31Table 3.18 Record Samples, Filter Wastes without Chromium or Lead . . . . . . . . . . . . . . . . . . . . . 31Table 3.19 Analytical Results of Sampling Spent Filters with Chromium or Lead Wastestream
. . . . . . . . . . . . . . . . . . . . . . . . . . . . . . . . . . . . . . . . . . . . . . . . . . . . . . . . . . . . . . . . . . . . . 32Table 3.20 Summary of Spent Filters without Chromium and Lead That Are Managed in Landfills . 33Table 3.21 Waste Management Summary for Wastewaters with Chromium that are not Recycled
Back to Process . . . . . . . . . . . . . . . . . . . . . . . . . . . . . . . . . . . . . . . . . . . . . . . . . . . . . . . . . 34Table 3.22 Waste Management Summary for Other Wastewaters That Do not Contain Chromium or
Lead and are not Recycled . . . . . . . . . . . . . . . . . . . . . . . . . . . . . . . . . . . . . . . . . . . . . . . . 35
LIST OF FIGURES
Figure 1.1 Geographical Distribution of Sodium Chlorate Producers . . . . . . . . . . . . . . . . . . . . . . . . . 2Figure 2.1 Generic Process Flow Diagram for the Production of Sodium Chlorate . . . . . . . . . . . . . . 8

1 EPA, RCRA 3007 Survey of Inorganic Chemicals Industry
2 ChemExpo Home Page, http://www.chemexpo.com/news/profile990927.cfm
Inorganic Listing Determination Sodium ChlorateListing Background Document August, 20001
1. SECTOR OVERVIEW
1.1 SECTOR DEFINITION, FACILITY NAMES/LOCATIONS
There were ten sodium chlorate manufacturers in the United States in 1999. Table 1.1 represents thenames and locations of the ten sodium chlorate producers1 and Figure 1.1 shows their geographicaldistribution of the facilities presented in Table 1.1. The numbers on the map correspond to the facilitynumbers in Table 1.1.
Table 1.1 Sodium Chlorate Producers
Facility Name Facility Location
1. CXY Chemicals, USA Hahnville, LA
2. Eka Chemicals (Eka-Columbus) Columbus, MS
3. Eka Chemicals (Eka-Washington) Moses Lake, WA
4. Elf Atochem North America, Inc. Portland, OR
5. Georgia Gulf Corp. Plaquemine, LA
6. Huron Tech-442 Corp. (Huron Tech 442) Perdue Hill, AL
7. Huron Tech (Huron Tech-Augusta) Augusta, GA
8. Kerr-McGee Chemical LLC Hamilton, MS
9. Sterling Pulp Chemicals Valdosta, GA
10.Western Electrochemical Cedar City, UT
Elf Atochem closed its 25,000-ton Tacoma, WA plant in September 1997. Georgia-Pacific closed its27,000-ton Brunswick, GA plant in April 1997. Huron Tech Corporation's new 90,000-ton plant inEastover, SC came on line in March, 1999. Huron Tech 442 Corporation is scheduled for closure inmid-2000. Sterling Pulp Chemicals added 110,000 tons of capacity to its U.S. total by bringing on lineValdosta, GA plant in 1997.2

Inorganic Listing Determination Sodium ChlorateListing Background Document August, 20002
Figure 1.1 Geographical Distribution of Sodium Chlorate Producers 1
î
ï
õ
ò ó í
ñ ô ðì
1 See Table 1.1 for facility name and location.

3 ECDIN Home page, http://ecdin.etomep.net
4 ChemExpo Home Page, http://www.chemexpo.com/news/profile990222.cfm
5Ibid
6 Ibid
7 Ibid
8Ibid
Inorganic Listing Determination Sodium ChlorateListing Background Document August, 20003
1.2 PRODUCTS, PRODUCT USAGE AND MARKETS
Sodium chlorate, NaClO 3, is a cubic, colorless, odorless crystal at room temperature and has amolecular weight of 106.44 grams(g) /mol. Sodium chlorate has a melting point of 248 degrees Celsiusat atmospheric pressure. It is very soluble in ethyl alcohol and degrades before its boiling point isreached.3
Approximately 98 percent of the sodium chlorate produced is used as the raw material for theproduction of chlorine dioxide. Chlorine dioxide is used as an oxidizing bleaching agent in the pulp andpaper industry, replacing chlorine and sodium hypochlorite. Approximately 2 percent of the sodiumchlorate produced is used as an intermediate in the production of sodium chlorite, herbicides, anduranium mining.4
The fast-growing demand for elemental chlorine-free (ECF) chemical pulp bleaching drives the sodiumchlorate market. From 1988-1997, sodium chlorate sales have grown 8 percent per year. Near-termNorth American sodium chlorate demand is expected to peak at more than 2 million tons in 2001,when EPA's cluster rules, which call for ECF pulp bleaching, are fully implemented.5 The chloratemarket is expected to level off and track a modest increase in pulp demand of 2 to 3 percent per year. Current chlorate capacity is adequate. Companies have consolidated within the industry and more suchmoves are predicted in the future.6
The sodium chlorate industry's capacity continues to increase at a faster rate than demand, loweringutilization rates and putting pressure on prices and margins. Rising electrical power cost is a majorconcern in some regions, as electricity can constitute well over half the cost of manufacturing sodiumchlorate. Currently sodium chlorate sells for $450 per ton.7
1.3 PRODUCTION CAPACITY
As of 1999, the current maximum production capacity of sodium chlorate in the United States isapproximately 946,000 short tons per year.8 Table 1.2 shows the distribution of production capacityamong the ten current manufacturers.

9 Ibid
10ChemExpo Home Page, http://www.chemexpo.com/news/profile990222.cfm
Inorganic Listing Determination Sodium ChlorateListing Background Document August, 20004
Table 1.2 Sodium Chlorate Production Capacity
Facility Location Capacity (x 103 shorttons/yr)9
CXY Chemicals Hahnville, LA 134
Eka Chemicals Columbus, MS 219
Eka Chemicals Moses Lake, WA 63
Elf Atochem Portland, OR 58
Georgia Gulf Plaquemine, LA 27
Huron Tech-442 Perdue Hill, AL 40
Huron Tech Augusta, GA 145
Kerr-McGee Hamilton, MS 143
Sterling Pulp Valdosta, GA 110
Western Electrochemical Cedar City, UT 7
Canada with 2,139,000 short tons per year has the largest production capacity in the world.10

Inorganic Listing Determination Sodium ChlorateListing Background Document August, 20005
2. DESCRIPTION OF MANUFACTURING PROCESS
This industry manufactures sodium chlorate crystals and solutions from the electrolysis of a sodiumchloride brine solution. All ten facilities use a similar process in producing sodium chlorate. Thesefacilities purchase either evaporated salt or rock salt or chemical grade salt as their main feedstock intheir production of sodium chlorate. Internet information searches confirm that evaporated salt, rocksalt, and chemical grade salt are saleable mineral products.
2.1 PRODUCTION AND PROCESS DESCRIPTION
A generic process flow diagram for the sodium chlorate production can be found in Figure 2.1. Theprocess can be divided into 6 major steps.
Brine Purification
In the first step, sodium chloride is dissolved in water. Hardness impurities such as sulfates, calciumand magnesium are removed. The sulfates are removed through the addition of calcium chloride whichprecipitates calcium sulfate. Sodium carbonate precipitates excess calcium from the solution as calciumcarbonate and sodium hydroxide precipitates the magnesium as magnesium hydroxide. Facilitiesremove these impurities from the brine solution by filtration, the addition of filter aid, passing the brinesolution through a filter press or allowing the impurities to settle to the bottom of a tank where liquidsslowly seep from the waste. One facility removes the impurities with a water sluice sending the materialto a waste treatment system.
Electrolysis In the second step, the purified brine solution is fed into electrolytic cells and sodium dichromate isadded to the process stream. The sodium dichromate is added to inhibit corrosion and to promote themain reaction in the electrolytic cell. The types of electrodes used in the electrolytic cell can vary. Fourfacilities use dimensionally stable electrodes (DSA) in the electrolytic cells. These cells have anodescomposed of a titanium base coated with ruthenium dioxide or platinum metal and cathodes made ofcarbon steel. Other facilities use steel electrodes or copper cathodes with lead plated graphite anodes.
Hydrogen and sodium hydroxide are formed at the cathode while chlorine gas is discharged at theanode. The chlorine undergoes hydrolysis to form hypochlorous acid, HClO, which then undergoesautoxidation to produce the chlorate ion, ClO 3 -.
The reaction steps are:
a) Cl 2 + H2O ÷ HClO + H + + Cl -
b) 2 HClO + ClO - ÷ ClO3 - + 2Cl- + 2 H +
Solids accumulate in the bottom of the electrolytic cells as sludge. The solids are the result of thedeterioration of the steel cathodes as well as other insoluble impurities. The sludge is removed from thecells periodically during scheduled maintenance. This is the predominant source of process sludges

Inorganic Listing Determination Sodium ChlorateListing Background Document August, 20006
generated from the production of sodium chlorate where chromium or lead is present. There are otherprocesses that generate this wastestream that are peculiar to a particular facility. At Georgia Gulf,Plaquemine, LA, a side stream is removed from the sodium chlorate solution after it has passed throughthe electrolysis process. This side stream is filtered producing a sludge that contains sulfate andcarbonate solids contaminated with chromium. This is a portion of the process sludges generated fromthe production of sodium chlorate where chromium or lead is present. Some facilities periodicallyremove the electrolytic cells from service, replace the anode/cathode arrangement, and wash them withwater generating a filter cake that is contaminated with chromium.
Dehypo Treatment
The third step of the process removes residual hypochlorite from the mother liquor. This isaccomplished by heating the electrolytic solution, adding urea, formate or hydrogen peroxide. This stepis done to protect downstream equipment which is made of stainless steel and is susceptible tohypochlorite corrosion. The sludges and filters produced from this step are part of two wastestreams,process sludges generated from the production of sodium chlorate where chromium or lead is presentand spent filters generated from the production of sodium chlorate where chromium or lead is present. At one facility the sodium hypochlorite, NaClO, is removed from the sodium chlorate solution as itleaves the electrolytic cell and the solution is split between two processes, sodium chloratecrystallization and Dechrome production. The sodium chlorate solution that goes to the Dechromeprocess is filtered a second time serving as an additional source of process sludges generated from theproduction of sodium chlorate where chromium or lead is present and spent filters generated from theproduction of sodium chlorate where chromium or lead is present.
Crystallization, Salt Recovery, and Drying
The fourth step in the process, crystallization, salt recovery, and drying, concentrates the liquor byevaporation, recycles residual brine back to the process, dries the crystals and produces the sodiumchlorate product. Steam is used to form a vacuum during this step and enough water is removed fromthe solution to cause the precipitation of crystalline sodium chlorate. The chlorate is separated from themother liquor and sent to the drying process. Wastestreams generated from this step include spentfilters without chromium or lead, and wastewaters recycled back to the process.
Chromium Removal
In the fifth step hexavalent chromium is reduced to trivalent chromium and precipitated using sodiumsulfide or sodium thiosulfate. Most facilities recycle the process wastewaters that contain chromiumback into the process. Some facilities recycle the wastewater that contains chromium back to theelectrolytic cells and some facilities recycle the wastewaters with chromium back to the brine solution.One facility reduces hexavalent chromium to chromium (III) oxide using ferrous iron and sends thewastewater to a treatment unit where it is mixed with wastewater from the onsite titanium dioxideprocesses and moved to surface impoundments.

Inorganic Listing Determination Sodium ChlorateListing Background Document August, 20007
Hydrogen Purification
The sixth step in the process, hydrogen purification and recovery usually occurs concurrently with theelectrolysis step in the process. Hydrogen gas is produced at the cathodes of the electrolytic cells. Thehydrogen gas is purified by removing excess chlorine gas from the gaseous stream using sodiumthiosulfate and caustic scrubbers or passing the gaseous stream through carbon filter beds. The purifiedhydrogen gas is burned in boilers for steam, or vented to the atmosphere.
At one facility the purified hydrogen gas stream is compressed and delivered to a neighboring facility foruse as an energy source in boilers.
2.2 PRODUCTION TRENDS, CHANGES AND IMPROVEMENTS
One facility, Huron Tech - 442 Corp, Perdue Hill, AL, will close in the midyear of 2000. There is noother indication of upcoming production changes from current practices.
Inorganic Listing Determination Sodium ChlorateBackground Listing Document August 7, 20008
Figure 2.1 Generic Process Flow Diagram for the Production of Sodium Chlorate

Inorganic Listing Determination Sodium ChlorateListing Background Document August 7, 20009
3. WASTE GENERATION AND MANAGEMENT
This section discusses all the wastes and materials generated from the production of sodium chlorate. Section 3.1 discusses the contaminated water and debris reported in one facility’s RCRA §3007questionnaire that are outside the scope of the Consent Decree. Section 3.2 describes the materialsthat are either piped directly back to the sodium chlorate production process or used for otherpurposes. Section 3.3 details six categories of wastes generated from the sodium chlorate productionprocess, including waste characterization, waste management practices, facilities/wastes selected forrecord sampling, and results of initial risk screening analyses. Appendix A tabulates the wastestreams,volumes of the wastestreams (in MT/yr), and the reported management practices for each of the sixwaste categories.
3.1 CONTAMINATED WATER AND DEBRIS
One facility reported one-time generation of contaminated water and debris from demolition of an old,abandoned contaminated water tank. The contaminated water was deep welled and the debris wasdisposed off-site in a Subtitle C landfill. EPA considers these materials not wastes from the“production” of sodium chlorate and, therefore, outside the scope of the Consent Decree.
3.2 MATERIALS
During the production of sodium chlorate, all ten facilities produce materials that are either pipeddirectly back to the production process or used for other purposes. These materials are described inSections 3.2.1 and 3.2.2. Table 3.1 summarizes the materials generated by the facilities from theproduction of sodium chlorate.
3.2.1 In-process Recycling
Scrubber waters and filtrates are piped to onsite sodium chlorate production units for use. Becausethese materials are managed prior to reuse in ways that present low potential for releases to theenvironment, and because we evaluated process wastes generated after they are reused, we do notbelieve that these secondary materials present significant threats.
3.2.2 Materials Used or Reused for Other Purposes
At all ten facilities, hydrogen gas is produced by the electrolysis units and is either piped to on-siteboilers, vented, or in one case, piped to a compression plant where it is compressed and sold. Becausethe material is a gas produced from a production unit rather than a waste management unit and isconveyed to its destination via piping, the gas is not a solid waste. RCRA Section 1004(27) excludesnon-contained gases from the definition of solid waste and thus they cannot be considered a hazardouswaste. (See 54 FR 40973). Because these materials are not solid wastes when produced, we did notevaluate them further.

Inorganic Listing Determination Sodium ChlorateListing Background Document August 7, 200010
Eka Chemicals-Columbus reports generating a sulfate solution from brine treatment. The wastewater istransported to an off-site facility and used in their black liquor pulping process. The sulfate solution isadded to black liquor for use in a wood digester. Any re-use of black liquor is excluded from RCRAregulation (40 CFR 261.4(a)(6)). The black liquor is burned to recover sulfur values for reuse inpulping. EPA considers any wastes associated with the black liquor process to be beyond the scope ofthe consent decree and did not evaluate them further. The black liquor is burned to recover sulfurvalues for reuse in pulping. The sulfate solution is stored in tanks prior to use in the pulping process andburning of the black liquor is subject to MACT standards, therefore, there are no exposure pathways ofconcern.
Table 3.1 Materials Generated from the Production of Sodium Chlorate
Facility In-Process Recycling Materials Used or Reused
Scrubber Waters andFiltrates RecycledBack to the Process
Hydrogen Gas Wastewaters
CXY Chemicals x x
Eka-Columbus, MS x x x
Eka-Moses Lake, WA x x
Elf Atochem x x
Georgia Gulf x x
Huron Tech-Augusta, GA x x
Huron Tech-442 x x
Kerr-McGee x x
Sterling Pulp x x
Western Electrochemical x x

Inorganic Listing Determination Sodium ChlorateBackground Listing Document August, 200011
3.3 WASTES PRODUCED BY THE SODIUM CHLORATE PRODUCTION PROCESS
Wastes generated from the production of sodium chlorate consists of process sludges, spent filters, andwastewaters. Since all ten facilities are using saleable mineral products as their only feedstock, their processes may not be classified as mineral processing, rather they are conducting chemicalmanufacturing. Therefore, all wastes from the production of sodium chlorate are non-Bevill exemptsolid waste.
Based on an evaluation of survey responses from the ten sodium chlorate producers, we divided thewastes further into six general waste categories based on the presence or absence of chromium or lead. The sodium chlorate industry in general characterizes wastes that have been in contact with chromiumor lead as hazardous (D007 or D008). Chromium is introduced into the process by the addition ofsodium dichromate into electrolytic cells to protect electrodes from corrosion and to improve productyields. The presence of lead in the wastes results from the deterioration of anodes that can be used inthe electrolytic cells. The six waste categories are:
• Process sludges with chromium or lead. These include electrolytic cell sludge, product filterpress sludge, and those brine treatment sludges generated from purification where brine isformed by mixing salts with chromium-laden wastewaters recycled from various steps in theprocess.
• Process sludges without chromium and lead. These wastes include filter press sludge or drumsludge from treatment of brine, when recycled chromium-laden wastewater is not used in thebrine dissolution step.
• Spent filters with chromium or lead. The filters are generated at several points in the productionprocess, but most are generated after the electrolysis of the brine solution when the motherliquor is filtered to remove impurities.
• Spent filters without chromium and lead. Examples include disposable cartridge and sock filtersfrom treatment of brine, when recycled chromium-laden wastewater is not used in the brinedissolution step.
• Wastewaters with chromium that are not recycled back to the process.
• Other wastewaters that do not contain chromium or lead and are not recycled (condensate,cooling water, and ion-exchange wastewater).
Table 3.2 presents a summary of wastes generated by each of the ten facilities from production ofsodium chlorate.

Inorganic Listing Determination Sodium ChlorateListing Background Document August, 200012
Table 3.2 Wastes Generated from the Production of Sodium Chlorate
Facility Process Sludgewith Chromium
or Lead
Process Sludge without
Chromium and Lead
Spent Filterswith
Chromium orLead
Spent Filters without
Chromiumand Lead
Wastewater with Chromium
Not RecycledBack to Process
OtherWastewaters
WithoutChromium orLead That AreNot Recycled
CXY x x x
Eka-Columbus,MS
x x x x
Eka-Moses Lake,WA
x x x x
Elf Atochem x x x
Georgia Gulf x x x x
Huron TechAugusta
x x x x
Huron Tech 442 x x x
Kerr-McGee x x x
Sterling Pulp x x
WesternElectrochemical
x x
x-facility generates this waste

Inorganic Listing Determination Listing Background Document 13
3.3.1 Record Sampling and Analysis
Based on an evaluation of survey responses from the ten sodium chlorate production facilities, similartypes of wastes from multiple facilities were grouped into six general categories for further listingdetermination.
Three facilities were selected for record sampling: Kerr-McGee-Hamilton, MS; Eka Chemicals-Columbus, MS; and Huron Tech-Augusta, GA. These facilities and wastes were selected because,based on the survey information collected, we believe that the wastes generated by these three facilitiesare fully representative of the wastes generated by this industry and their management practices. Table3.3 presents the record samples and the information used for record sampling decision, including wastecodes, waste volumes, and current waste management practices. Record samples collected for each ofthe six waste categories are discussed further in later sections of this background document.
As described in the facility-specific SAPs and the QAPjP, the record samples collected were analyzedfor the following:
• Total, TCLP, and SPLP concentrations of metals• Total, TCLP, and SPLP concentrations of hexavalent chromium• pH• Oxidation-reduction potential• Specific gravity• Percent solids
Appendix B contains a summary of the record sample results. The complete analytical data reportsare available in the docket, including QA/QC and data validation information.

Inorganic Listing Determination Sodium ChlorateListing Background Document August, 200014
Table 3.3 Summary of Sodium Chlorate Production Wastes and Record Sample Collection
Waste Categories (# offacilities)
# ofStreams
WasteCodes
Volume(MT/yr)
Management Practices RecordSample ID
Process sludges withchromium or lead (10)
19 D001D002D007D008
28,547 Nine facilities store the waste on site in containers and then send it toSubtitle C landfills or incinerators; one facility decharacterizes thewaste in tanks before managing it in on-site surface impoundments.
EC-SC-01HT-SC-01HT-SC-02KM-SC-01KM-SI-01KM-SI-04
Process sludges withoutchromium and lead (5)
7 nonereported
1,886 Three facilities store the waste on site in containers and then send it offsite to municipal Subtitle D landfills; one facility stores the waste on aconcrete pad with secondary containment before applying it to anonsite land farm; one facility stores the waste on site in containers andthen sends it off site to an industrial Subtitle D landfill; one facilitystores the waste on site in containers before sending it off site forrecycling.
EC-SN-01EC-SN-02EC-SN-03HT-SN-01
Spent filters with chromiumor lead (7)
12 D001D007 D008
82.9 All seven facilities classify the waste as hazardous; six send the waste toSubtitle C landfills or incinerators; one facility decharacterizes thewaste on site in tanks, stores it in a closed compactor, then ships thewaste off site to an industrial Subtitle D landfill.
KM-FB-01
Spent filters withoutchromium and lead (4)
6 nonereported
3.52 Three facilities store the waste on site in containers and send it off siteto Subtitle D landfills. One facility stores the waste with process sludgein onsite containers and then sends it off site to a Subtitle C facility forstabilization prior to disposal in a Subtitle C landfill.
HT-FB-01HT-FB-02
Wastewaters with chromiumthat are not recycled back tothe process (2)
5 D002D007
26,736 One facility sends the wastewater to an offsite Subtitle C facility fortreatment and disposal. One facility combines and treats the wastewaterwith other process wastewaters in tanks prior to discharge to onsitesurface impoundments.
KM-SC-01KM-SI-01KM-SI-04

Waste Categories (# offacilities)
# ofStreams
WasteCodes
Volume(MT/yr)
Management Practices RecordSample ID
Inorganic Listing Determination Sodium ChlorateListing Background Document August, 200015
Other wastewaters that donot contain chromium orlead and are not recycled (4)
4 nonereported
10,744 Discharged via NPDES permit or to a POTW NotSampled

Inorganic Listing Determination Sodium ChlorateListing Background Document August, 200016
3.3.2 Process Sludge with Chromium or Lead
Waste Generation All ten facilities generate this residual category. The predominant source of process sludge withchromium or lead is from the periodic cleanout of electrolytic cells used to convert the brine solution tosodium chlorate. Other sources are sludges generated from the purification of brine where brinesolution is mixed with chromium-laden wastewaters recycled from various steps in the process andfrom sludges formed when the product is filtered.
The “process sludge with chromium” is generated at various rates from less than 1 metric ton (MT)/yrto 11,000 MT/yr. Appendix A, Table 1 lists wastestreams of this waste category, including the wastegenerators, RINs, RCRA waste codes, waste volumes, final waste management step, and recordsample numbers.
Waste Management
Process sludge with chromium or lead is managed in off-site Subtitle C landfills or incinerators, ordecharacterized in tanks before managing in on-site surface impoundments. Table 3.4 presents thevolume and final management step used by the facilities for this waste. Some facilities contribute morethan one residual to this waste.
Table 3.4 Waste Management Summary for Process Sludge with Chromium or Lead
Final Management Total Volume (MT/yr)
Off-site Subtitle C landfill 1,682
Off-site incineration 65
Discharge to on-site wastewatertreatment facility
26,800
Waste Characterization
Two sources of residual characterization were developed during the industry study:
• RCRA § 3007 questionnaire
Eight generators report this wastestream to be characteristically hazardous for D007(chromium), and or other characteristic (D001 (ignitability), D002 (corrosivity), or D008(lead)). Two facilities do not classify their wastes as characteristic but nevertheless send theirwastes to Subtitle C landfills.

Inorganic Listing Determination Sodium ChlorateListing Background Document August, 200017
Facilities report that this waste has a pH in the range of 6 - 12, and the primary chemicalconstituent in the waste is chromium or lead.
• Six record samples collected from three facilities and analyzed by EPA.
Six samples were collected for our assessment of this waste. Table 3.5 shows the process sludge withchromium or lead samples collected and their corresponding sample numbers.
Table 3.5 Record Samples, Process Sludge with Chromium or Lead
Facility Sample No.
Eka Chemicals Incorporated, Columbus, MS EC-SC-01
Huron Tech, Augusta, GA HT-SC-01HT-SC-02
Kerr-McGee, Hamilton, MS KM-SC-01KM-SI-01KM-SI-04
Results of Initial Risk Screening Analysis
Three samples (EC-SC-01, HT-SC-01, HT-SC-02) were collected at two facilities (Eka Chemical-Columbus, MS; Huron Tech- Augusta, GA) to characterize wastes destined for Subtitle C treatmentand disposal. EC-SC-01 is the filter press waste produced when a part of the sodium chlorate solutionleaving the electrolytic cell is filtered to remove impurities. HT-SC-01 is sludge that accumulates at thebottom of the electrolytic cell, and HT-SC-02 is sludge that accumulates on a process filter after thesodium chlorate solution leaves the electrolytic cell and has been treated with urea and filtered. Complete analytical results of these samples, cited in Appendix B, are part of the record characterizingthis waste category, but were not used for risk assessment because the Subtitle C disposal scenario wasnot identified for modeling.
Another three samples were collected from the Kerr McGee-Hamilton, MS facility that classifies thiswaste as characteristically hazardous and treats it in tanks to reduce hexavalent chromium to therelatively stable trivalent state. The facility commingles this sludge with wastes from the production oftitanium dioxide (TiO2) in these tanks. The treated mixture is subsequently managed in on-site surfaceimpoundments. One sample (KM-SC-01) reflects the untreated sodium chlorate sludge collected froma dedicated sump prior to commingling with the titanium dioxide wastewaters. The second sample(KM-SI-01) is the treated combined wastes collected at the inlet to the surface impoundments. Thethird sample (KM-SI-04) is the treated commingled sludge collected from one of the on-site surfaceimpoundments.

11 TCLP analyses were not run for Cr+6 using TCLP leachant because of typically low or no recovery ofhexavalent chromium due to conversion of hexavalent chromium to trivalent chromium.
Inorganic Listing Determination Sodium ChlorateListing Background Document August, 200018
Table 3.6 presents the analytical results for the three Kerr McGee samples. The HBL for eachconstituent is provided for comparison. For the untreated waste, only totals were conducted becausethe sample was collected from the dedicated sump (prior to treatment, commingling with titanium dioxidewastes and land placement). The only constituent of concern in the untreated sodium chlorate wastewas hexavalent chromium. As shown in Table 3.6, all other constituents in the untreated wastes werepresent at levels below their respective HBLs. For the treated waste, totals plus leaching with TCLPand SPLP tests are reported. Analytical data shows that total hexavalent chromium level in the treatedsample (KM-SI-01) is quite low (below the HBL for hexavalent chromium). Note that while hexavalentchromium doe not exceed the HBL, other constituents of concern are present in this sample at elevatedlevels; these constituents of concern are associated with the commingled titanium dioxide wastes andwere assessed as part of that sector’s listing determination elsewhere in today’s record.
We also assessed the leachable levels of chromium from sludge in the impoundment, even though thissludge is largely composed of solids from titanium dioxide production. The leachable chromium in thissample (KM-SI-04), both total and hexavalent chromium, is below the HBLs, again demonstrating theeffectiveness of the treatment methodology. No other toxicants in the untreated wastewater sample(KM-SC-01) exceed the health-based levels used for the screening analysis.
Table 3.6 Waste Characterization for Process Sludge with Chromium or Lead
Analytical Data
KM-SC-01(Untreated)
KM-SI-01(Treated)
KM-SI-04(Sludge)
HBL (mg/l)
Parameter Total Total TCLP SPLP TCLP SPLP
Arsenic <0.005 0.04 <0.5 <0.05 <0.5 <0.05 0.0007
Barium 0.11 1.8 <2 0.26 B <2 0.09 1.1
Cadmium <0.005 0.024 <0.05 <0.05 <0.05 <0.05 0.0078
Chromium 0.99 31.1 <0.5 <0.05 1.3 <0.05 23
Chromium+6 0.85 L <0.02 N/A11 <0.02 0.03 <0.02 0.05
Iron 12.5 1,120 <1 <0.5 <1 <0.5 5
Lead 0.007 0.38 <0.5 <0.03 <0.5 <0.03 0.015
Manganese 0.30 25.9 0.7 0.7 59.9 <0.05 0.73

Analytical Data
KM-SC-01(Untreated)
KM-SI-01(Treated)
KM-SI-04(Sludge)
HBL (mg/l)
Parameter Total Total TCLP SPLP TCLP SPLP
Inorganic Listing Determination Sodium ChlorateListing Background Document August, 200019
Molybdenum <0.005 0.53 <0.2 0.3 <0.2 0.27 0.078
Nickel <0.005 1.97 <0.2 <0.05 3.7 <0.05 0.31
Thallium <0.005 0.086 <2 <0.05 <2 <0.05 0.0013
Vanadium <0.005 59.6 <0.05 <0.05 <0.05 0.08 0.14
pH 10.1 E 8.4 E NR 4.96 10.0
Percent solids <2% 3.4 NA
Oxidation red.pot.mV
434 329,000
NA: Not AnalyzedNR: Not ReportedB: Analyte also detected in the associated method blank analysis.L: Concentration reported from analysis performed outside required holding time. Value should be considered biasedlow.Chromium total concentration in the treated waste is higher than the untreated waste due to commingling with otherwastes from the titanium dioxide production process.
Based on the record sampling data, it appears that the only constituent of concern associated with thesodium chlorate process, hexavalent chromium, has been treated so that leachable hexavalent chromiumlevels are below health-based levels. The treated, co-mingled waste sample collected at the influent tothe surface impoundment, had undetected level of hexavalent chromium (<0.02 mg/L in the total andSPLP analyses).
The treated effluent is managed in a series of four surface impoundments, three of which are lined withleachate collection systems. The wastewaters from the sodium chlorate process only comprise about 2percent of the wastewaters going to Kerr McGee’s treated tanks. Therefore, our assessment of theimpoundment sludge (KM-SI-04) and constituents other than chromium present in the commingledwastewater (KM-SI-01) at elevated levels are covered in the titanium dioxide assessment. For a morecomplete description of this sludge analysis, see the Titanium Dioxide Listing Background Document andRisk Assessment Listing Background Document in the docket for this proposed rulemaking.

Inorganic Listing Determination Sodium ChlorateListing Background Document August, 200020
3.3.3 Process Sludge without Chromium and Lead
Waste Generation
Five facilities generate this residual. This sludge is produced as part of the initial purification of the brinesolution. These wastes include filter press sludge or drum sludge from the treatment of brine, whenrecycled chromium-laden wastewater is not used in the brine dissolution step. Process sludge withoutchromium is generated at various rates from 37 MT/yr to 790 MT/yr. Appendix A, Table 2 listswastestreams of this waste category, including the waste generators, RINs, RCRA waste codes, wastevolumes, final waste management step, and record sample numbers.
Waste Management
Four facilities manage the waste as non-hazardous in an on-site land farm, offsite municipal and industrialSubtitle D landfills. Eka Chemicals, Columbus, MS, ships their waste offsite for recycling. Table 3.7presents the volume and final management step used by the facilities for this waste.
Table 3.7 Waste Management Summary for Process Sludge without Chromium and Lead
Final Management Total Volume (MT/yr)
Permitted solid waste landfarm 37
Off-site municipal Subtitle D landfill 224
Off-site industrial Subtitle D landfill 835.2
Recycling 790
Waste Characterization
Two sources of residual characterization were developed during the industry study:
• RCRA § 3007 questionnaire• Four record samples collected from two facilities and analyzed by EPA.
Five facilities classified this wastestream as non-hazardous. Facilities reported the following physical andchemical characteristics for this wastestream in the RCRA § 3007 questionnaire:
S This waste has a pH in the range of 10 to 11 and a moisture content below 50 percent.
S Chemical constituents reported were: barium, cadmium, lead, calcium carbonate andmagnesium hydroxide.
Four samples of this waste category were collected from two facilities. EC-SN-02 and HT-SN-01

Inorganic Listing Determination Sodium ChlorateListing Background Document August, 200021
were generated in the sodium chlorate process from the initial treatment of the rock salt with sodiumcarbonate and sodium hydroxide to precipitate and remove calcium carbonate and magnesiumhydroxide. The filter cakes were collected from a roll-off bin and a hopper. EC-SN-01 was generatedby filtering a brine solution to remove the sulfate impurities. The sample was collected from a roll-offbin. EC-SN-03 is generated at the bottom of a brine tank where the sulfate impurities precipitate fromthe initial brine solution. This sample was collected from a basin in which it is stored. Table 3.8 showsthe “process sludge without chromium and lead” samples collected and their corresponding samplenumbers.
Table 3.8 Record Samples, Process Sludge without Chromium or Lead
Facility Sample No.
Eka Chemicals Incorporated, Columbus, MS EC-SN-01EC-SN-02EC-SN-03
Huron Tech, Augusta, GA HT-SN-01
Two of the four samples (HT-SN-01 and EC-SN-03) are representative of wastes that are landdisposed. The other two samples (EC-SN-01 and EC-SN-02) are representative of wastes that aregenerally recycled and occasionally also landfilled.
Results of Initial Risk Screening Analysis
Table 3.9 identifies the constituents of concern that we found to be present in the waste at levelsexceeding their respective HBLs and/or soil screening levels.

Inorganic Listing Determination Sodium ChlorateListing Background Document August, 200022
Table 3.9 Analytical Results for Process Sludge Without Chromium and Lead
Parameter HT-SN-01 EC-SN-03 EC-SN-01 EC-SN-02 HBL(mg/L)
SSL1
(mg/kg)Total (mg/kg)
TCLP (mg/L)
SPLP(mg/L)
Total (mg/kg)
TCLP (mg/L)
SPLP(mg/L)
Total (mg/kg)
TCLP (mg/L)
SPLP(mg/L)
Total (mg/kg)
TCLP (mg/L)
SPLP(mg/L)
Arsenic 14.3 0.03 <0.05 <5 <0.005 <0.05 <5 <0.005 <0.05 <5 <0.005 <0.05 0.0007
5.2
Cadmium 27.4 <0.05 <0.05 <5 <0.05 <0.05 <5 <0.05 <0.05 <5 <0.05 <0.05 0.0078
4.3
Chromium 57.3 <0.05 <0.05 15.3 <0.05 <0.05 <5 <0.05 <0.05 10.1 <0.05 <0.05 23 37
Copper 17.2 <0.25 <0.05 15.3 <0.05 <0.05 <5 <0.25 <0.05 5.3 <0.25 <0.05 1.3 17
Lead 14.8 0.024 <0.03 139 <0.03 <0.03 19.3 0.12 E 0.001 34.9 0.05 E 0.002E
0.015 400*
Manganese
69.2 0.08 <0.05 238 4.5 <0.05 125 0.5 <0.05 51.9 0.7 <0.05 0.73 330
Mercury 0.5 L <0.002 <0.0002 <0.1 <0.002 <0.0002 <0.1 <0.002 <0.0002 <0.1 <0.002 <0.0002
0.0047
24*
Nickel 7.4 <0.2 <0.05 12.1 0.4 <0.05 <5 <0.2 <0.05 <5 <0.2 <0.05 0.31 13
Silver 1.1 <0.1 <0.01 <1 <0.1 <0.01 <1 <0.1 <0.01 <1 <0.1 <0.01 0.078 400*
Zinc 111 <2 <0.5 279 10.6 <0.5 <50 <2 <0.5 <50 <2 <0.5 4.7 481 SSL: Soil Screening Level based on geometric mean background concentration (mg/kg) in soils in conterminous U.S. Or soil ingestion HBL (marked *).E: Analysis performed outside recommended holding time. Reported value should be considered as estimated.

Inorganic Listing Determination Sodium ChlorateListing Background Document August, 200023
The Agency evaluated wastes managed under the four reported management scenarios: on-site landfarm, municipal Subtitle D landfill, industrial Subtitle D landfill, and recycling. All scenarios screen out(as described further below), with the exception of the municipal D landfill scenario.
Land Treatment Scenario
Georgia Gulf reports managing 37 MT/yr in their land treatment unit. While EPA did not sample atGeorgia Gulf, we determined that the available samples (HT-SN-01, EC-SN-03, EC-SN-01, and EC-SN-02) are representative of Georgia Gulf’s wastes because Georgia Gulf’s process is similar to HuronTech’s. (Georgia Gulf uses mined salt from a salt dome in LA, not rock salts as three other facilities do. We did not however find any information that links raw materials to variations in waste composition forthis sector.)
EPA previously assessed the same on-site land farm as part of the chlorinated aliphatics listingdeterminations (see proposed rule at 64 FR 46475, August 25, 1999). Our assessment of sodiumchlorate waste placed in the same unit was based on our earlier modeling of this unit for a waste from theproduction of chlorinated aliphatics (EDC/VCM sludges).
In assessing this management scenario, we first compared the total constituent concentrations of all fourrecord samples to background soil concentrations. All of the metals screen out against background soilconcentrations except for arsenic, cadmium, chromium, copper, lead, mercury, silver, and zinc asindicated in Table 3.9. We then used the metal modeling results generated from the chlorinatedaliphatics listing determination to calculate the proportional sodium chlorate risks. The proportionalsodium chlorate risks were calculated, as shown below:
NaClO3 risk = (CA risk) x NaClO3 conc. x NaClO3 volume CA conc. CA volume
As shown in Table 3.10, the calculated modeling results of arsenic, cadmium, hexavalent chromium, andzinc for the same land farm are all below a hazard quotient (HQ) of 1 and 10-6 risk thresholds for theland treatment scenario. Table 3.11 presents a characterization of the land farm unit as reported by thefacility in their §3007 survey.

Inorganic Listing Determination Sodium ChlorateListing Background Document August, 200024
Table 3.10 Modeling Results for Process Sludge without Chromium and Lead That is Managed Under the Land Treatment Scenario
Parameter Concentration Waste volume Non-cancer risk(HQ)
Cancer risk(groundwater)
Ingestion risk(HQ)
Cancer risk(ingestion)
Cancer risk(inhalation)
EDC/VCM WWT sludge
Chromium +6 287 mg/kg 624 MT/yr 0.5 0.06 2x10⁻⁶
Cadmium 1.65 0.1 0.002 4x10-11
Zinc 1,810 0.2 0.001
Arsenic 27 1x10⁻⁵ 6x10⁻⁶
Sodium chlorate sludges w/o chromium
Chromium +6 57.3 37.0 MT/yr 0.0012 0.00071 3.0x10⁻⁸
Cadmium 27.4 0.098 0.002 3.9x10⁻¹¹
Zinc 279 0.0018 0.000009
Arsenic 14.3 3.1x10⁻⁷ 1.9x10⁻⁷
Inorganic Listing Determination Sodium ChlorateListing Background Document August, 200025
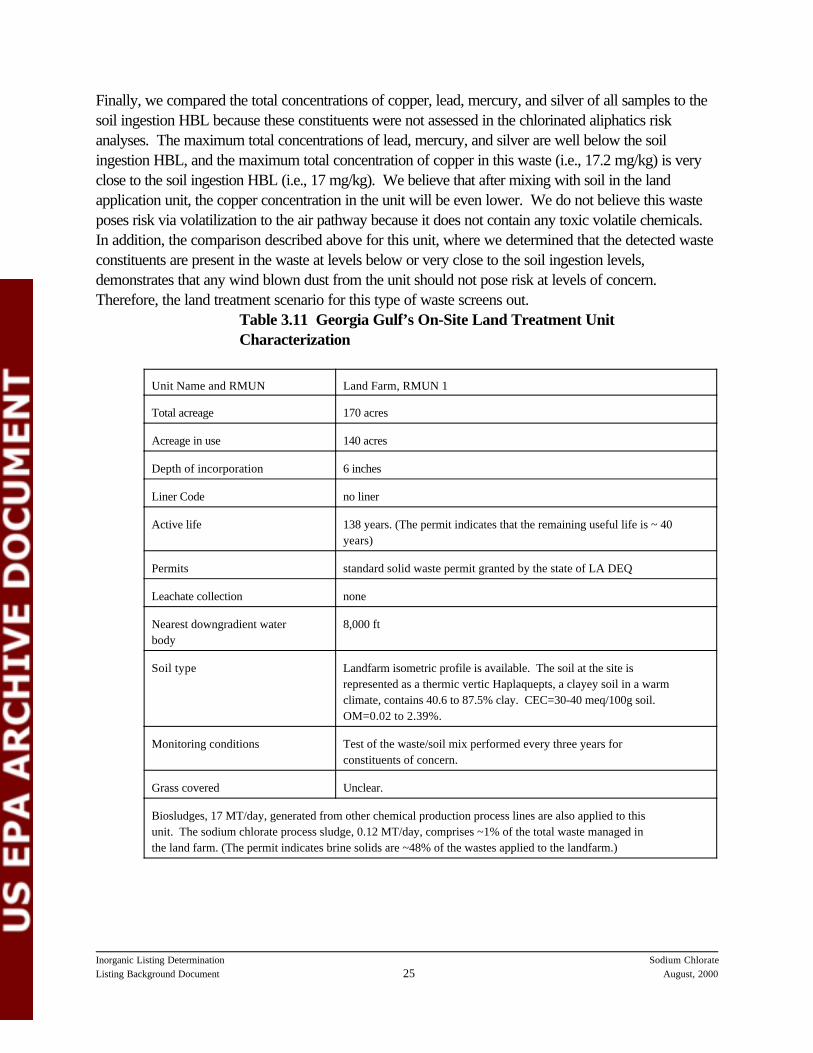
Finally, we compared the total concentrations of copper, lead, mercury, and silver of all samples to thesoil ingestion HBL because these constituents were not assessed in the chlorinated aliphatics riskanalyses. The maximum total concentrations of lead, mercury, and silver are well below the soilingestion HBL, and the maximum total concentration of copper in this waste (i.e., 17.2 mg/kg) is veryclose to the soil ingestion HBL (i.e., 17 mg/kg). We believe that after mixing with soil in the landapplication unit, the copper concentration in the unit will be even lower. We do not believe this wasteposes risk via volatilization to the air pathway because it does not contain any toxic volatile chemicals. In addition, the comparison described above for this unit, where we determined that the detected wasteconstituents are present in the waste at levels below or very close to the soil ingestion levels,demonstrates that any wind blown dust from the unit should not pose risk at levels of concern. Therefore, the land treatment scenario for this type of waste screens out.
Table 3.11 Georgia Gulf’s On-Site Land Treatment UnitCharacterization
Unit Name and RMUN Land Farm, RMUN 1
Total acreage 170 acres
Acreage in use 140 acres
Depth of incorporation 6 inches
Liner Code no liner
Active life 138 years. (The permit indicates that the remaining useful life is ~ 40years)
Permits standard solid waste permit granted by the state of LA DEQ
Leachate collection none
Nearest downgradient waterbody
8,000 ft
Soil type Landfarm isometric profile is available. The soil at the site isrepresented as a thermic vertic Haplaquepts, a clayey soil in a warmclimate, contains 40.6 to 87.5% clay. CEC=30-40 meq/100g soil. OM=0.02 to 2.39%.
Monitoring conditions Test of the waste/soil mix performed every three years forconstituents of concern.
Grass covered Unclear.
Biosludges, 17 MT/day, generated from other chemical production process lines are also applied to thisunit. The sodium chlorate process sludge, 0.12 MT/day, comprises ~1% of the total waste managed inthe land farm. (The permit indicates brine solids are ~48% of the wastes applied to the landfarm.)

Inorganic Listing Determination Sodium ChlorateListing Background Document August, 200026
Landfill Scenarios
Three facilities manage their wastes in municipal Subtitle D landfills and one facility manages its waste inan industrial Subtitle D landfill.
The SPLP results of all four relevant samples were used to evaluate the industrial Subtitle D landfillmanagement scenario. As demonstrated in Table 3.10, the SPLP leachate concentration of allconstituents of the four samples of this waste category are below their respective HBLs. The industriallandfill scenario therefore was screened out and not assessed further.
The TCLP results of all four relevant samples were used to assess the municipal Subtitle D landfillscenario. In cases where the TCLP detection limit exceeded the HBL, one half (½) of the detection limitwas used to further assess the potential presence of those constituents of concern in the waste. The initialrisk screening identified four constituents exceeding the drinking water HBLs: lead, manganese, nickel,and zinc. Total arsenic levels were detected in HT-SN-01 at 14.3 mg/kg. In the TCLP results, aresponse for arsenic of 0.03 mg/L was observed below the laboratory reported detection limit (<0.5mg/L). Because the response exceeded the HBL, we assessed arsenic.
Because our initial screening analysis identified constituents of concern, we conducted full riskassessment modeling of this waste. For a more complete description of this analysis, see the RiskAssessment Listing Background Document in the docket for this proposed rulemaking.
We modeled all three volumes reported in the §3007 surveys as being sent to municipal Subtitle Dlandfills. We focused our full risk assessment modeling on the geological regions in the northwestern andsoutheastern areas of the country because of the locations of the facilities and the landfills currently beingused. The constituents we modeled are arsenic, lead, manganese, nickel, and zinc.
Table 3.12 Summary of Process Sludge without Chromium and Lead That Are Managed inLandfill Scenarios
Facility/RIN Volume (MT/yr) Landfill Type/Location
Huron Tech/Augusta,GA/RIN1
135 Municipal county landfill in Elgin, SC
Eka/Columbus, MS/RIN6 130 Municipal D landfill in Starkville, MS
Eka/Moses Lake, WA/RIN1 89 Municipal D landfill in Ephrate, WA
Elf Atochem, OR/RIN1 105.2 Industrial D landfill in Hillsboro, OR

12 The percentage was calculated, based on the information Eka provided, using volumes ofRINs 1 (790 MT/yr x 85% solid content) + RIN 3 (600 MT/yr x 65% solid content)/the off-sitefacility’s annual cement production (477,000 MT/yr).
Inorganic Listing Determination Sodium ChlorateListing Background Document August, 200027
Recycling scenario
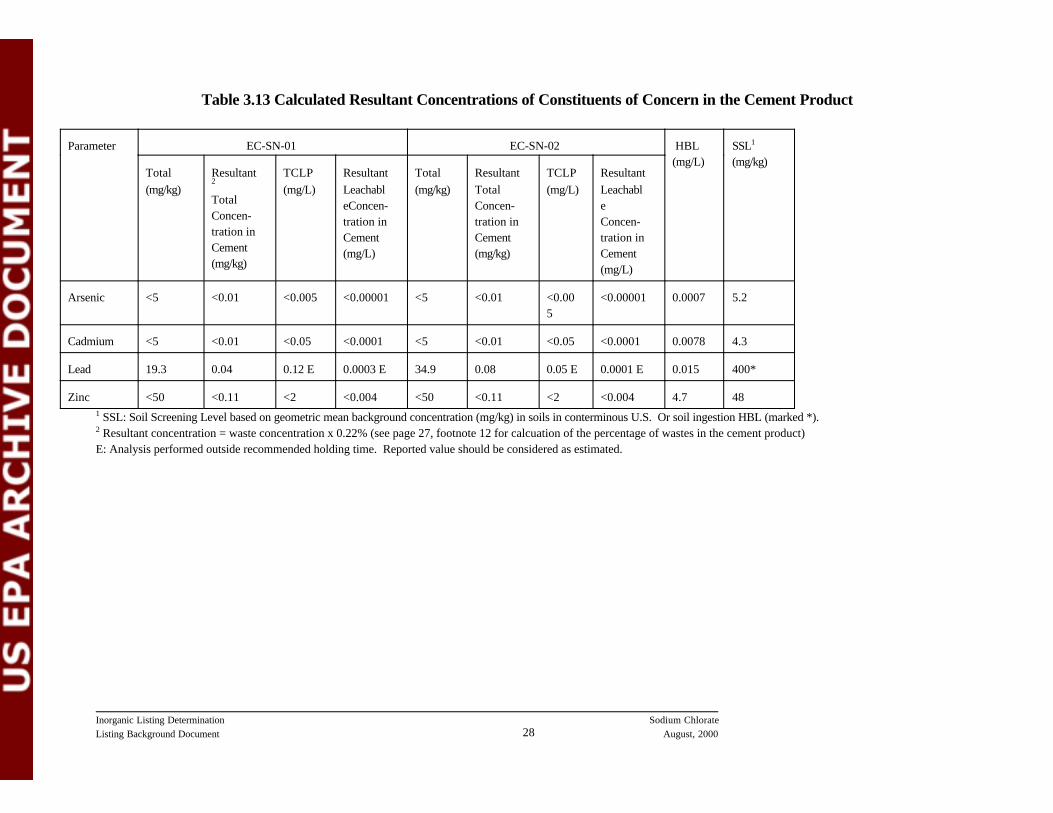
Eka Chemicals, Columbus, MS facility ships their wastes (RINs 1 and 3, total 1390 MT/yr) to an offsitefacility for reuse. The material is added to mined gypsum used to retard the setting of concrete. Twosamples of this waste category were collected (EC-SN-01 and EC-SN-02). As described above forthe landfill scenario and land treatment scenario and presented in Table 3.9, the constituents of concernfrom a leaching perspective are arsenic and lead. The constituents that exceeded the soil screeninglevels included: cadmium and zinc. The volume of Eka’s two waste residuals compared to the off-sitefacility’s annual cement production is quite small (~0.22%12), therefore, the concentrations of theconstituents of concern will be much further diluted and encapsulated in the final cement product. Table3.13 presents the calculated resultant concentrations of constituents of concern in the cement product.
Inorganic Listing Determination Sodium ChlorateListing Background Document August, 200028
Table 3.13 Calculated Resultant Concentrations of Constituents of Concern in the Cement Product
Parameter EC-SN-01 EC-SN-02 HBL(mg/L)
SSL1
(mg/kg)Total (mg/kg)
Resultant2
TotalConcen-tration inCement(mg/kg)
TCLP (mg/L)
ResultantLeachableConcen-tration inCement(mg/L)
Total (mg/kg)
ResultantTotalConcen-tration in Cement(mg/kg)
TCLP (mg/L)
ResultantLeachableConcen-tration inCement(mg/L)
Arsenic <5 <0.01 <0.005 <0.00001 <5 <0.01 <0.005
<0.00001 0.0007 5.2
Cadmium <5 <0.01 <0.05 <0.0001 <5 <0.01 <0.05 <0.0001 0.0078 4.3
Lead 19.3 0.04 0.12 E 0.0003 E 34.9 0.08 0.05 E 0.0001 E 0.015 400*
Zinc <50 <0.11 <2 <0.004 <50 <0.11 <2 <0.004 4.7 481 SSL: Soil Screening Level based on geometric mean background concentration (mg/kg) in soils in conterminous U.S. Or soil ingestion HBL (marked *).2 Resultant concentration = waste concentration x 0.22% (see page 27, footnote 12 for calcuation of the percentage of wastes in the cement product)E: Analysis performed outside recommended holding time. Reported value should be considered as estimated.

Inorganic Listing Determination Sodium ChlorateListing Background Document August, 200029
3.3.4 Spent Filters with Chromium or Lead
Waste Generation
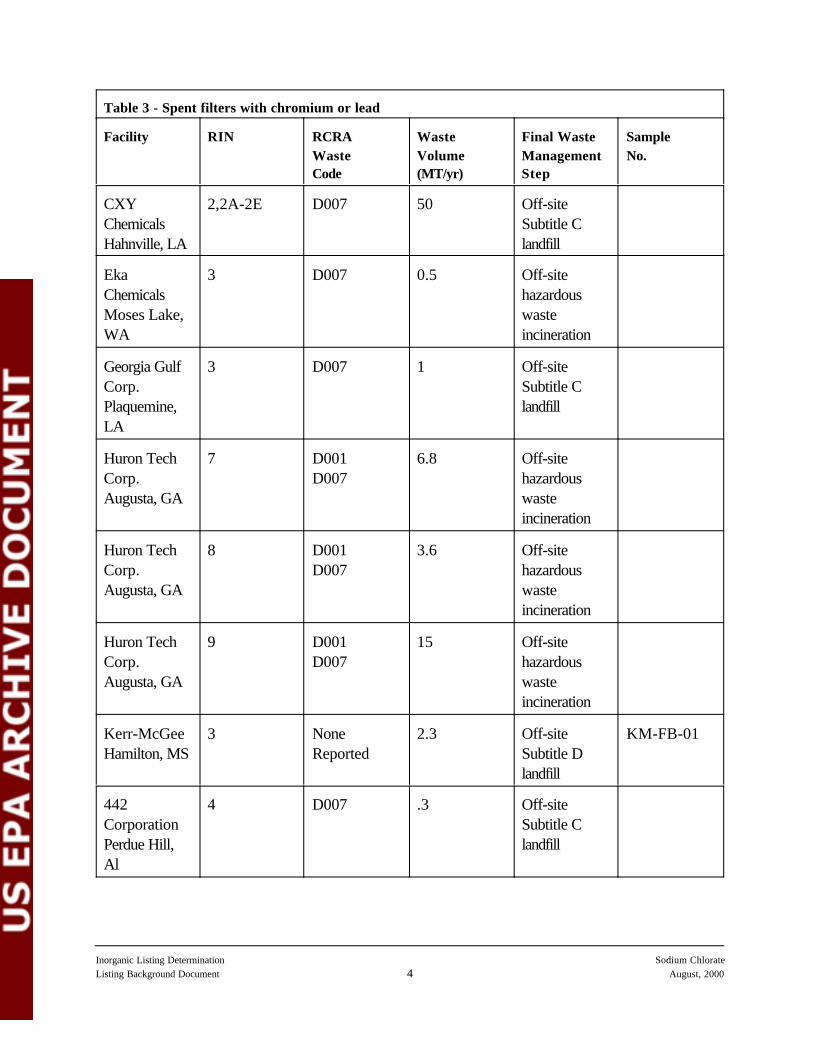
Seven facilities reported generating this wastestream. The filters are generated at several points in theproduction process but most are generated after the electrolysis of the brine solution when the motherliquor is filtered to remove impurities before the mother liquor proceeds through the production process. These filters are generated at various rates from less than 1 MT/yr to 15 MT/yr. Appendix A, Table 3lists wastestreams of this waste category, including the waste generators, RINs, RCRA waste codes,waste volumes, final waste management step, and record sample numbers.
Waste Management
In general spent filters with chromium or lead are generated in small volumes. Six of the seven facilitiesmanage their spent filters in C landfills or incinerator. One exception, Kerr-McGee, Hamilton,Mississippi facility washes their spent filters with dilute hydrochloric acid prior to landfilling at anindustrial D landfill in MS. Table 3.14 presents the volume and final management step used by thefacilities for this wastestream.
Table 3.14 Waste Management Summary for Spent Filters with Chromium or Lead
Final Management Total Volume (MT/yr)
Off-site Subtitle C landfill 54.7
Incineration 25.9
Off-site industrial Subtitle D landfill 2.3
Waste Characterization
These filters carry hazardous waste codes D001, D007 or D008.Two sources of residual characterization were developed during the industry study:
• RCRA § 3007 questionnaire• One record sample was collected from one facility and analyzed by EPA.
This wastestream is a mixture of cellulosic filter aid or polypropylene filter bags and impurities removedfrom the sodium chlorate solution as it exits the electrolytic cells. Facilities report chemical impuritiessuch as arsenic, aluminum, zinc, calcium carbonate, sodium chloride and magnesium hydroxide. Thewastestream is contaminated with hexavalent chromium.

Inorganic Listing Determination Sodium ChlorateListing Background Document August, 200030
Physical properties reported are pH in the 7 to 8 range and moisture content in the 10% range.
We collected one sample of the spent filter that was decharacterized prior to being sent to an industrialSubtitle D landfill. We did not sample any of the six facilities that already adequately managed the wasteunder Subtitle C regulations. Table 3.15 shows the sample of spent filters with chromium or leadcollected and its corresponding sample number.
Table 3.15 Record Sample, Filter Wastes with Chromium or Lead
Facility Sample No.
Kerr-McGee, Hamilton, MS KM-FB-01
KM-FB-01 is generated as part of the brine treatment step where impurities are filtered from the brinesolution.
Table 3.16 presents the analytical results for the total and leaching analyses of the waste sample forarsenic, total and hexavalent chromium, and lead. Full analyses are summarized in Appendix B and indetail in “Sampling and Analytical Data Report for Record Sampling and Characterization ofWastes from the Inorganic Sodium Chlorate Manufacturing Sector- Kerr-McGee Corporation,Hamilton, Mississippi, August 10, 1999" in the docket for this proposal..
Table 3.16 Analytical Results of Sampling Spent Filters with Chromium or Lead Wastestream
Parameter Total(mg/kg)
TCLP(mg/L)
SPLP(mg/L)
Drinking Water HBLs(mg/L)
Arsenic <0.5 <0.5 0.005 0.00074
Chromium 41.0 <0.05 <0.05 23
Chromium +6 16.8 NA* <0.02** 0.05
Lead <5 <0.5 <0.03 0.015*NA Not applicable.** Typical TCLP leachant is not suitable for leachable hexavalent chromium. Most (or all)hexavalent chromium in TCLP waste leachates were converted to trivalent chromium. Theleach test for hexavalent chromium was modified by replacing the typical (TCLP/SPLP)leachants with deionized water.
Results of Initial Risk Screening Analysis

Inorganic Listing Determination Sodium ChlorateListing Background Document August, 200031
Chromium and lead are the two primary constituents of concern in wastes of this category. KerrMcGee does not use anodes with lead coating, thus lead was not present in this sample. The onlyconstituent detected in TCLP/SPLP leachates above the HBL is arsenic. [Note that the total arsenicresults were further assessed and no response was found below the revised detection limit of 0.5 mg/kg.]
We did not conduct risk assessment on wastes managed in Subtitle C facilities because listing would notprovide any significant incremental control of wastes already managed under Subtitle C. We evaluatedthe small volume waste (i.e., 2.3 MT/yr) generated by Kerr McGee that decharacterizes its wastebefore landfilling in an industrial Subtitle D landfill. Because the volume of Kerr McGee’s waste isrelatively small, we used the de minimis waste quantity analysis to screen the potential risk togroundwater associated with landfilling this waste. We found that the SPLP data for arsenic screens outbecause the volume of the waste generated by Kerr McGee’s Hamilton, MS facility is insufficient torelease arsenic at levels of concern. For a more complete description of de minimis waste quantityanalysis, see “Risk Assessment for the Listing Determinations for Inorganic ChemicalManufacturing Wastes” (August 2000) in the docket for this proposal.
3.3.5 Spent Filters without Chromium and Lead
Waste Generation
Four facilities reported generating this wastestream. This residual is usually generated as part of theinitial brine purification steps where impurities are removed from the brine solution. One other source ofspent filters without chromium is from the filtering of the Dechrome product during the packagingprocess. The filters are disposable cartridges, bag filters and sock filters. The generation rate for thisresidual varies from less than 1 MT/yr to approximately 2 MT/yr. Appendix A, Table 4 listswastestreams of this waste category, including the waste generators, RINs, RCRA waste codes, wastevolumes, final waste management step, and record sample numbers.
Waste Management
This waste is managed in a variety of ways: disposal in municipal and industrial Subtitle D landfills andSubtitle C landfills. Table 3.17 presents the volume and final management step used by the facilities forthis wastestream.

Inorganic Listing Determination Sodium ChlorateListing Background Document August, 200032
Table 3.17 Waste Management Summary for Spent Filters without Chromium or Lead
Final Management Total Volume (MT/yr)
Off-site municipal Subtitle D landfill 2.8
Off-site industrial Subtitle D landfill 0.6
Off-site Subtitle C landfill 0.12
Waste Characterization
These filters are reported as nonhazardous waste.Two sources of residual characterization were developed during the industry study:
• RCRA § 3007 questionnaire
Physical properties reported were pH of 10 and moisture content of 2% -85%. Chemicalconstituents reported are calcium carbonate, magnesium hydroxide, arsenic, aluminum, titaniumand lead.
• Two record samples were collected from one facility and analyzed by EPA.
Two samples were taken at Huron Tech- Augusta, GA facility. Table 3.18 shows the filter wasteswithout chromium samples collected and the sample numbers.
Table 3.18 Record Samples, Filter Wastes without Chromium or Lead
Facility Sample No.
Huron Tech, Augusta, GA HT-FB-01HT-FB-02
HT-FB-01 is a combination of two filter bags generated at different points in the process: after the initialpurification step in the brine treatment process and after the sodium chlorate redissolve step where thecrystals are dissolved in water and then filtered. HT-FB-02 are the solids that are filtered from thesodium chlorate product after it comes from the crystallizers and is redissolved in pure water.

Inorganic Listing Determination Sodium ChlorateListing Background Document August, 200033
Results of Initial Risk Screening Analysis
Table 3.19 presents the constituents detected or not detected the TCLP or SPLP waste leachates atlevels above their HBLs.
Table 3.19 Analytical Results of Sampling Spent Filters without Chromium or LeadWastestream
Analytical Results for Spent Filters Without Chromium or Lead
Parameter HT-FB-01 HT-FB-02 HBL (mg/l)
Total(mg/kg)
TCLP(mg/l)
SPLP(mg/l)
Total(mg/kg)
TCLP(mg/l)
SPLP(mg/l)
Antimony 34.1 0.018 <0.005 <5 0.012 <0.005 0.006
Arsenic 7.3 0.014 0.003 5.3 <0.005 <0.005 0.0007
Boron <50 6.1 <0.05 <50 0.67 <0.5 1.4
Cadmium 22.5 <0.05 <0.05 <5 <0.05 <0.05 0.008
Cr, +6 <0.8 NA <0.02 2.8 L NA 0.19 L 0.05
Lead 8.7 0.024 0.06 7.1 0.020 0.012 0.015L: Concentration reported from analysis performed outside required holding time. Valueshould be considered biased low.
We found that antimony, arsenic, boron, hexavalent chromium, and lead in the TCLP or SPLP wasteleachates exceeded their HBLs. We also found that cadmium was not detected in the leachates at adetection level of six times higher than its HBL due to dilution to minimize sample matrix interferences.
The scenarios of concern are the municipal and industrial landfill scenarios, based on reportedmanagement practices. These wastes are generated in very small volumes; the highest individual volumeis 2.3 MT/yr and the total volume for the industry is 3.52 MT/yr.
We used the SPLP leachate concentrations to evaluate the industrial landfill scenario. The constituentsof concern that exceeded their respective HBLs in the SPLP results were arsenic, hexavalent chromium,and lead. We evaluated these constituents using the de minimis volume screening analysis. The analysissuggests that hexavalent chromium and lead are not of concern. We then modeled arsenic using ourstandard groundwater model for the industrial landfill scenario using waste volume 0.6 MT/year.
Inorganic Listing Determination Sodium ChlorateListing Background Document August, 200034
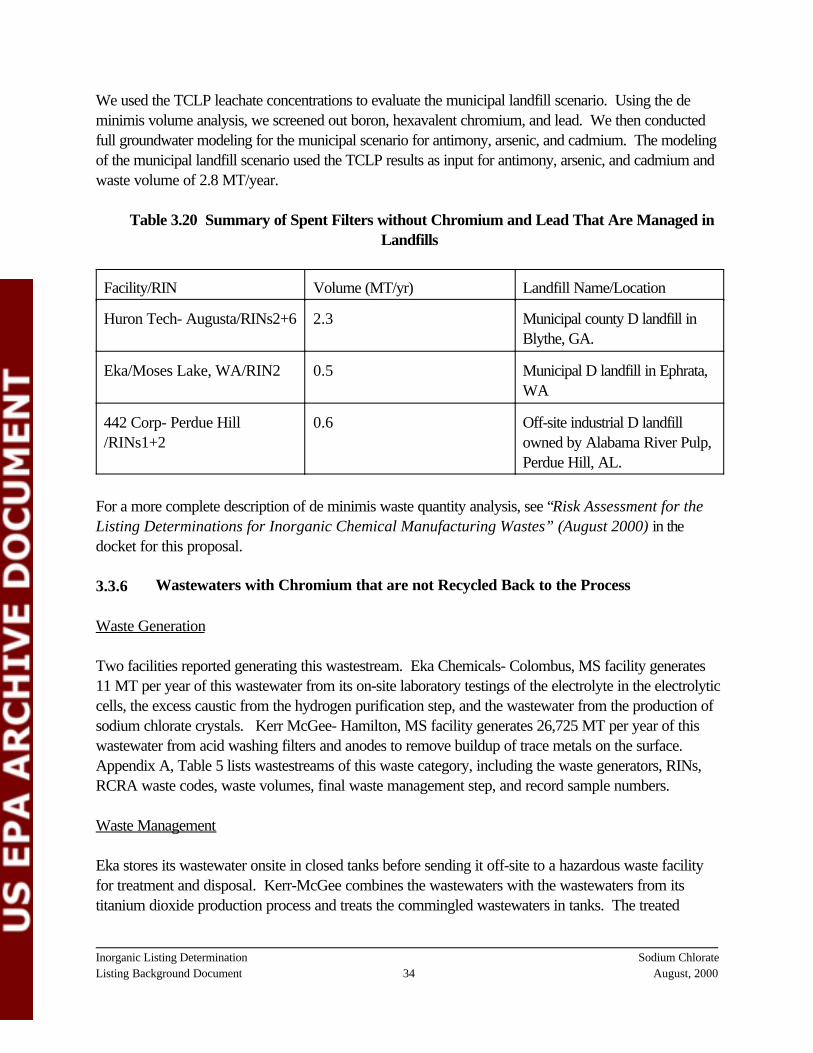
We used the TCLP leachate concentrations to evaluate the municipal landfill scenario. Using the deminimis volume analysis, we screened out boron, hexavalent chromium, and lead. We then conductedfull groundwater modeling for the municipal scenario for antimony, arsenic, and cadmium. The modelingof the municipal landfill scenario used the TCLP results as input for antimony, arsenic, and cadmium andwaste volume of 2.8 MT/year.
Table 3.20 Summary of Spent Filters without Chromium and Lead That Are Managed inLandfills
Facility/RIN Volume (MT/yr) Landfill Name/Location
Huron Tech- Augusta/RINs2+6 2.3 Municipal county D landfill inBlythe, GA.
Eka/Moses Lake, WA/RIN2 0.5 Municipal D landfill in Ephrata,WA
442 Corp- Perdue Hill/RINs1+2
0.6 Off-site industrial D landfillowned by Alabama River Pulp,Perdue Hill, AL.
For a more complete description of de minimis waste quantity analysis, see “Risk Assessment for theListing Determinations for Inorganic Chemical Manufacturing Wastes” (August 2000) in thedocket for this proposal.
3.3.6 Wastewaters with Chromium that are not Recycled Back to the Process
Waste Generation
Two facilities reported generating this wastestream. Eka Chemicals- Colombus, MS facility generates11 MT per year of this wastewater from its on-site laboratory testings of the electrolyte in the electrolyticcells, the excess caustic from the hydrogen purification step, and the wastewater from the production ofsodium chlorate crystals. Kerr McGee- Hamilton, MS facility generates 26,725 MT per year of thiswastewater from acid washing filters and anodes to remove buildup of trace metals on the surface. Appendix A, Table 5 lists wastestreams of this waste category, including the waste generators, RINs,RCRA waste codes, waste volumes, final waste management step, and record sample numbers.
Waste Management
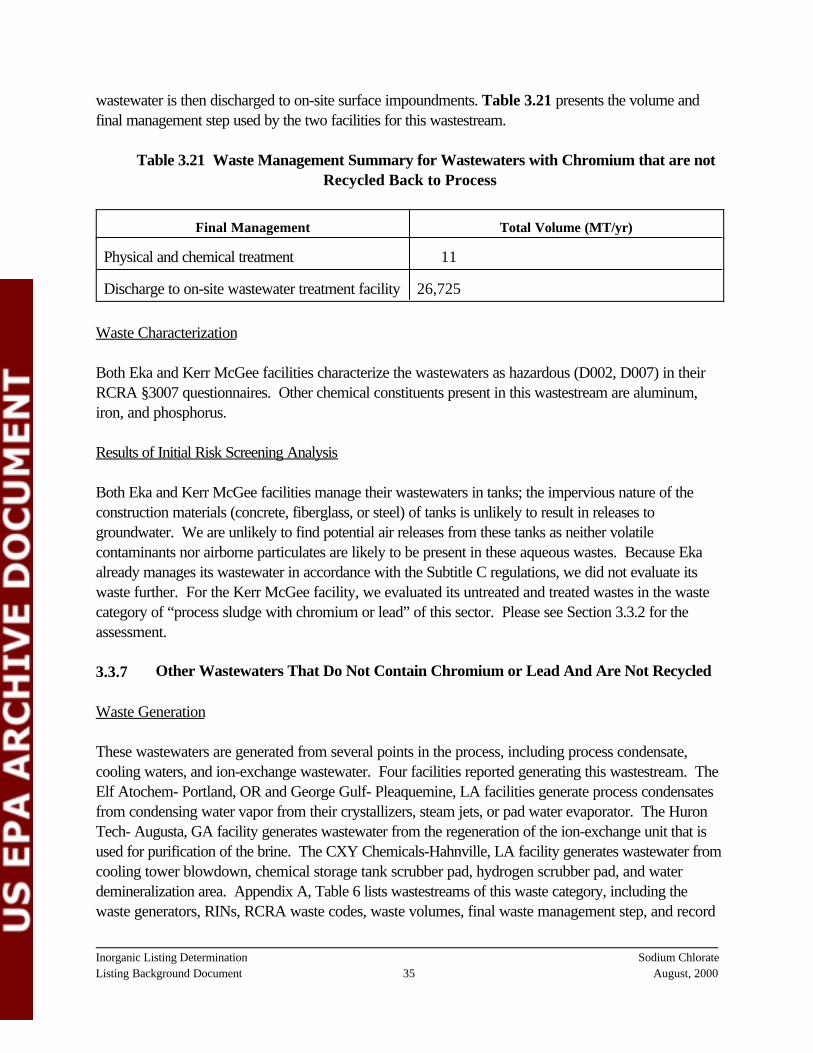
Eka stores its wastewater onsite in closed tanks before sending it off-site to a hazardous waste facilityfor treatment and disposal. Kerr-McGee combines the wastewaters with the wastewaters from itstitanium dioxide production process and treats the commingled wastewaters in tanks. The treated
Inorganic Listing Determination Sodium ChlorateListing Background Document August, 200035
wastewater is then discharged to on-site surface impoundments. Table 3.21 presents the volume andfinal management step used by the two facilities for this wastestream.
Table 3.21 Waste Management Summary for Wastewaters with Chromium that are notRecycled Back to Process
Final Management Total Volume (MT/yr)
Physical and chemical treatment 11
Discharge to on-site wastewater treatment facility 26,725
Waste Characterization
Both Eka and Kerr McGee facilities characterize the wastewaters as hazardous (D002, D007) in theirRCRA §3007 questionnaires. Other chemical constituents present in this wastestream are aluminum,iron, and phosphorus.
Results of Initial Risk Screening Analysis
Both Eka and Kerr McGee facilities manage their wastewaters in tanks; the impervious nature of theconstruction materials (concrete, fiberglass, or steel) of tanks is unlikely to result in releases togroundwater. We are unlikely to find potential air releases from these tanks as neither volatilecontaminants nor airborne particulates are likely to be present in these aqueous wastes. Because Ekaalready manages its wastewater in accordance with the Subtitle C regulations, we did not evaluate itswaste further. For the Kerr McGee facility, we evaluated its untreated and treated wastes in the wastecategory of “process sludge with chromium or lead” of this sector. Please see Section 3.3.2 for theassessment.
3.3.7 Other Wastewaters That Do Not Contain Chromium or Lead And Are Not Recycled
Waste Generation
These wastewaters are generated from several points in the process, including process condensate,cooling waters, and ion-exchange wastewater. Four facilities reported generating this wastestream. TheElf Atochem- Portland, OR and George Gulf- Pleaquemine, LA facilities generate process condensatesfrom condensing water vapor from their crystallizers, steam jets, or pad water evaporator. The HuronTech- Augusta, GA facility generates wastewater from the regeneration of the ion-exchange unit that isused for purification of the brine. The CXY Chemicals-Hahnville, LA facility generates wastewater fromcooling tower blowdown, chemical storage tank scrubber pad, hydrogen scrubber pad, and waterdemineralization area. Appendix A, Table 6 lists wastestreams of this waste category, including thewaste generators, RINs, RCRA waste codes, waste volumes, final waste management step, and record

Inorganic Listing Determination Sodium ChlorateListing Background Document August, 200036
sample numbers.
Two facilities (Elf Atochem and George Gulf) reported wastewater generation about 5,000 MT/yr. Other two facilities (CXY and Huron Tech) did not report volumes of their wastewater generations.
Waste Management
The Elf Atochem and George Gulf facilities store their process condensates in closed tanks. ElfAtochem neutralizes their condensate prior to discharging it to an NPDES permitted outfall. GeorgeGulf does not treat their condensate, but tests to ensure it meets the Louisiana State Pollutant DischargeElimination System permit prior to discharge to a river. Huron Tech generates wastewater fromregeneration of the ion-exchange unit that is used for purification of the brine. The wastewater iscollected in a tank for pH neutralization before it is discharged to a POTW. CXY generates wastewaterfrom cooling tower blowdown, chemical storage tank scrubber pad, hydrogen scrubber pad, and waterdemineralization area. These wastewaters are piped to its on-site NPDES facility to be processed anddischarged. Table 3.22 presents the volume and final management step used by the facilities for thiswastestream.
Table 3.22 Waste Management Summary for Other Wastewaters That Do not ContainChromium or Lead and are not Recycled
Final Management Total Volume (MT/yr)
Discharge to NPDES permitted outfall 10,744
Discharge to POTW Not reported
Waste Characterization These wastewaters are reported to have an approximate pH of 7.
Results of Initial Risk Screening Analysis
We evaluated these wastewaters that are stored and treated in tanks or in a NPDES permitted facility. We found that these wastewaters do not pose risks warranting regulation during treatment because thereare no exposure pathways of concern. The wastewater treatment tanks and the wastewater treatmentfacility provide sufficient structural integrity and have secondary containment areas to minimize potentialreleases to groundwater. We are unlikely to find potential air releases from these tanks or the permittedfacility as neither volatile contaminants nor airborne particulates are likely to be present in thesewastewaters. Finally, these wastewaters are subject to regulation under the Clean Water Act (CWA)program or a state program. No additional risk assessment was done for this wastestream.

Appendix A
Summary of Waste Generation and Management

Inorganic Listing Determination Sodium ChlorateListing Background Document August, 20001
Table 1 - Process sludge with chromium or lead
Facility RIN RCRAWasteCode
WasteVolume(MT/yr)
Final WasteManagementStep
SampleNo.
CXY ChemicalsHahnville, LA
1 D007 486.8 Off-site SubtitleC landfill
Eka ChemicalsColumbus, MS
5 NoneReported
46 Off-site SubtitleC landfill
EC-SC-01
Eka ChemicalsMoses Lake, WA
4 D007 18 Off-site SubtitleC landfill
Elf Atochem North America,IncPortland, OR
4 None Reported
.27 Off-site SubtitleC landfill
Georgia Gulf Corp.Plaquemine, LA
2 D007 365 Off-site SubtitleC landfill
Georgia Gulf Corp.Plaquemine, LA
5 D007 10 Off-site SubtitleC landfill
Huron Tech Corp.Augusta, GA
3 D001D007
43 Off-sitehazardouswasteincineration
HT-SC-01
Huron Tech Corp.Augusta, GA
4 D001D007
3.6 Off-sitehazardouswasteincineration
HT-SC-01
Huron Tech Corp.Augusta, GA
5 D001D007
18.2 Off-sitehazardouswasteincineration
HT-SC-02
Kerr-McGee Chemical LLCHamilton, MS
1 D007 6000 Discharge toon-sitewastewatertreatment facility

Table 1 - Process sludge with chromium or lead
Facility RIN RCRAWasteCode
WasteVolume(MT/yr)
Final WasteManagementStep
SampleNo.
Inorganic Listing Determination Sodium ChlorateListing Background Document August, 20002
Kerr-McGee Chemical LLCHamilton, MS
2 D007 5300 Discharge toon-sitewastewatertreatment facility
Kerr-McGee Chemical LLCHamilton, MS
5 D007 500 Discharge toon-sitewastewatertreatment facility
Kerr-McGee Chemical LLCHamilton, MS
8 D007 4000 Discharge toon-sitewastewatertreatment facility
Kerr-McGee Chemical LLCHamilton, MS
9 D007 11000 Discharge toon-sitewastewatertreatment facility
442 CorporationPerdue Hill, AL
3 D007 1.4 Off-site SubtitleC landfill
Sterling Pulp ChemicalsValdosta, GA
1 D001 630* Off-site SubtitleC landfill
Sterling Pulp ChemicalsValdosta, GA
2 NoneReported
NR Off-site SubtitleC landfill
Sterling Pulp ChemicalsValdosta, GA
3 NoneReported
NR Off-site SubtitleC landfill
Western ElectrochemicalCedar City, UT
4 D001D008
125 Off-site SubtitleC landfill
* The total volume include RINs 2 and 3. Total 28,547 MT/yr

Inorganic Listing Determination Sodium ChlorateListing Background Document August, 20003
Table 2 - Process sludge without chromium and lead
Facility RIN RCRAWasteCode
WasteVolume(MT/yr)
Final WasteManagementStep
SampleNo.
EkaChemicalsColumbus,MS
1 NoneReported
790 Recycling EC-SN-01
EkaChemicalsColumbus,MS
6 NoneReported
130 Off-sitemunicipalSubtitle Dlandfill
EC-SN-03
EkaChemicalsColumbus,MS
3 NoneReported
600 Off-sitemunicipalSubtitle Dlandfill
EC-SN-02
EkaChemicalsMoses Lake,WA
1 NoneReported
89 Off-sitemunicipalSubtitle Dlandfill
Elf AtochemNorthAmerica, IncPortland, OR
1 NoneReported
105.2 Off-siteindustrialSubtitle Dlandfill
Georgia GulfCorp.Plaquemine,LA
1 NoneReported
37 Permittedsolid wastelandfarm
Huron TechCorp.Augusta, GA
1 Nonereported
135 Off-sitemunicipalSubtitle Dlandfill
HT-SN-01
Total 1,886.2 MT/yr
Inorganic Listing Determination Sodium ChlorateListing Background Document August, 20004
Table 3 - Spent filters with chromium or lead
Facility RIN RCRAWasteCode
WasteVolume(MT/yr)
Final WasteManagementStep
SampleNo.
CXYChemicalsHahnville, LA
2,2A-2E D007 50 Off-siteSubtitle Clandfill
EkaChemicalsMoses Lake,WA
3 D007 0.5 Off-sitehazardouswasteincineration
Georgia GulfCorp.Plaquemine,LA
3 D007 1 Off-siteSubtitle Clandfill
Huron TechCorp.Augusta, GA
7 D001D007
6.8 Off-sitehazardouswasteincineration
Huron TechCorp.Augusta, GA
8 D001D007
3.6 Off-sitehazardouswasteincineration
Huron TechCorp.Augusta, GA
9 D001D007
15 Off-sitehazardouswasteincineration
Kerr-McGeeHamilton, MS
3 NoneReported
2.3 Off-siteSubtitle Dlandfill
KM-FB-01
442CorporationPerdue Hill,Al
4 D007 .3 Off-siteSubtitle Clandfill

Facility RIN RCRAWasteCode
WasteVolume(MT/yr)
Final WasteManagementStep
SampleNo.
Inorganic Listing Determination Sodium ChlorateListing Background Document August, 20005
442CorporationPerdue Hill,Al
5 D007 .3 Off-siteSubtitle Clandfill
442CorporationPerdue Hill,Al
6 D007 .1 Off-siteSubtitle Clandfill
WesternElectrochemical CompanyCedar City,UT
1 D008 1 Off-siteSubtitle Clandfill
WesternElectrochemical CompanyCedar City,UT
2 D008 2 Off-siteSubtitle Clandfill
Total 82.9 MT/yr

Inorganic Listing Determination Sodium ChlorateListing Background Document August, 20006
Table 4 - Spent filters without chromium and lead
Facility RIN RCRAWasteCode
WasteVolume(MT/yr)
Final WasteManagementStep
SampleNo.
EkaChemicalsMoses Lake,WA
2 NoneReported
0.5 Off-sitemunicipalSubtitle Dlandfill
Huron TechCorp.Augusta, GA
2 NoneReported
0.9 Off-sitemunicipalSubtitle Dlandfill
HT-FB-01
Huron TechCorp.Augusta, GA
6 Nonereported
1.4 Off-sitemunicipalSubtitle Dlandfill
HT-FB-02
442CorporationPerdue Hill,Al
1 Nonereported
0.3 Off-siteindustrialSubtitle dlandfill
442CorporationPerdue Hill,Al
2 Nonereported
0.3 Off-siteindustrialSubtitle Dlandfill
Sterling Pulp ChemicalsInc.Valdosta, GA
4 Nonereported
0.12 Off-siteSubtitle Clandfill
Total 3.52 MT/yr

Inorganic Listing Determination Sodium ChlorateListing Background Document August, 20007
Table 5 - Wastewaters with chromium that are not recycled back to process
Facility RIN RCRAWasteCode
WasteVolume(MT/yr)
Final WasteManagementStep
Sample1
No.
EkaChemicalsColumbus,MS
4 D002D007
11 Off-sitehazardouswastetreatmentfacility
Kerr-McGeeHamilton, MS
1 D007 6000 On-sitewastewatertreatmentfacility
Kerr-McGeeHamilton, MS
4 D002D007
200 On-sitewastewatertreatmentfacility
Kerr-McGeeHamilton, MS
6 D002D007
525 On-sitewastewatertreatmentfacility
Kerr-McGeeHamilton, MS
10 D007 20000 On-sitewastewatertreatmentfacility
Total 26,736 MT/yr
1 KM-SC01: sampled at a dedicated sump (waters from sodium chlorate process, combined RINs)

Inorganic Listing Determination Sodium ChlorateListing Background Document August, 20008
Table 6 - Other wastewaters that do not contain chromium or lead and are not recycled
Facility RIN RCRAWasteCode
WasteVolume(MT/yr)
Final WasteManagementStep
SampleNo.
CXYChemicalsHahnville, LA
Not assigned NoneReported
Not Reported POTW
Elf AtochemPortland, OR
3 NoneReported
4879 NPDESpermittedoutfall
Georgia GulfPlaquemine,LA
4 NoneReported
5865 LouisianaState PDESpermittedoutfall
Huron TechAugusta, GA
Not assigned NoneReported
Not Reported POTW

Inorganic Listing Determination Sodium ChlorateListing Background Document August, 2000
Appendix B
Record Sampling Analytical Data Reports


![Untitled-1 [] Chloride, Stable Bleaching Powder and Sodium Chlorate. Despite keen competition and adverse market conditions, your Company could generate Gross Profit of Rs.506 Crore](https://static.documents.pub/doc/80x56/5acf5b5b7f8b9a8b1e8ca0d0/untitled-1-chloride-stable-bleaching-powder-and-sodium-chlorate-despite-keen.jpg)


![Sodium chlorate - Krishna districtkrishna.nic.in/PDFfiles/MSME/Chemical/SODIUM CHLORATE[1].pdf · effluent from the bleaching plant. Sodium chlorate, ... (solution of common salt](https://static.documents.pub/doc/80x56/5a9372b07f8b9a8b5d8c39da/sodium-chlorate-krishna-chlorate1pdfeffluent-from-the-bleaching-plant-sodium.jpg)
