101
SDC-90-00122 soc SOLENOIDAL DETECTOR NOTES HYBRID CEl\TJRAL 1RACKING CHAMBER COllABORATION, Summary Report - Part I: Progress Report for FY90 Contact person: A. T. Goshaw August 1990
SDC-90-00122
socSOLENOIDAL DETECTOR NOTES
HYBRID CEl\TJRAL 1RACKING CHAMBER COllABORATION,Summary Report - Part I: Progress Report for FY90
Contact person: A. T. Goshaw
August 1990
Hybrid Central Tracking Chamber Collaboration
Summary Report - Part I: Progress Report for FY90
Submitted to
Physics Research DivisionSSCLaboratOty
2550 BeckJeymeade Avenue. Dallas. TX 75237
"
..."" .
. ..•...... '........
!"" .
•
~~, ""-", ~\.\'~\ ,\ i
... ,• • •
;,,"~" ...... ~
•··
..
'" I"-..;: _.t " ..'~' ". ". ..... I, .,M ~\ ..."
-\:". . f~, ........~ "'\.. ',. . i.,,,, :'. ,~\ .a J'".. ... .,,, '\',; '.,.....:" -...,;.;~
---tt- ~ .. ","'." J~, • III' ea-
•
••
... .it ..
. .. ". ':-:. -'."' ~;." ."• •
•
•
Prepared by
Continuous ElectronBeamAccelerator Facility
Duke UniversityFlorida State UniversityGeneral Electric Canada Inc.KEKNorth Carolina State University
Northeastem UniversityOak Ridge National LaboratoryQuantum Research ServicesSupercomputer Computations
Research InstituteTRIUMFUniversity of Pennsylvania
August 1990

Collaboration Members
r
•
•
Continuous Electron Beam AcceJeratorFaci!iIy[tl)M
Duke University\J.N1 v-
Florida State University\' I,.,'!" "/',;,.JJ,:!,:J
General Electric Canada Inc.( . i r," -',,', /0 j.. ,-. .." e
LNonh Carolina State lJihiversjty
[Northeastern Bniversity
[Oak Rid~S)\'ation3.1 Laboratory
Ouantum Research Services. Inc.I, .• (f>G?:.. £, ..) .. ,... l«(,:_' f' ,1>1,
Supercomputer Computation Research Instituter (""'O!, S->.AC (). I
) .
University of Pennsvlvanja( l.,,' vPrimarv Contact Person'
ii
Dr. Stan MajewskiDr. CarIZOmDr. Alfred T. Goshaw (Co-spokesman)Dr. SeogOhDr. William RobertsonDr. Vaskan HagopianMr. Phil RulonDr. Robert McIntyreDr. HenriDautetDr. Hirokazu IkedaDr. YasuoArai
Dr. John PaulosDr. Thomas S. EllemanDr. Stephen Reucroft (Co-spokesman)Dr. George AlversonMr. Addison GrimesDr. Mike GlaubmanDr. Ian LeedomDr. Tony GabrielMr. GaryAlleyMr. Hugh BrashearMr. Charles L. Britton, Jr.Mr. Michael EmoryDr. Raymond E. Garvey, IIIDr. Charles GloverDr. Richard A. LillieMr. Brad NelsonMr. Ted RyanMr. DavidVandergriffDr. William L. DunnDr. Fearghus O'FoghludhaMr. Joseph D. SimpkinsDr. A.M. YacoutDr. Martyn CordenDr. Mike Mermikides
Dr. Martin SolomonDr. RobertHendersonDr. WayneFraszerMr. Robert OpenshawDr. Rick Van BergDr. Alfred T. GoshawPhysics DepartmentDuke UniversityDurham, NC 27706(919) 684·8134Dt:KJ TI:P;:GOSlIA',V
Hybrid Central Tracking Chamber Collaboration
Abstract
This summary report is submitted to the SSC Laboratory in partial fulfillment of theterms of the Memorandum of Understanding (MOU) between the Hybrid Central TrackingChamper(H'CTC) Collaboration and the sse Laboratory for FY90. Part I: Progress Reportfor FY90 provides a comprehensive account of the research and development carried outunder the MOU during the current fiscal year; Part IT: Proposal for FY91 presents theproposed work scope for the coming fiscal year, identifies task timelines and milestones,discusses the responsibilities of collaboration personnel, and summarizes budgets by taskand by institution. The two parts are separately bound for convenience of review, andtogether form the collaboration's first-year summary report. The HCTC collaboration hasadded three new members (CEBAF, KEK, and University of Pennsylvania) and now has 12member institutions. The Executive Summary presents in brief an overview of the HCTC
,r--- design and the major accomplishments of FY90; each of the four tasks defined in the MOUare discussed in more detail in individual sections. The second-year proposal is similarlydivided into an executive summary and task descriptions, but also has an administrativesection. During FY90, we have made considerable progress toward our goal of developing
t a large volume tracking detector for the SSC that borrows desirable features of twopromising technologies, straw tubes and plastic scintillating fibers (PSF). Our researchconfirms our prior position that the hybrid straw-tube/PSF approach offers significantadvantages in cost and performance and is a viable candidate for central tracking in a largegeneral-purpose detector for the SSe.
iii
I
Hybrid Central Tracking Chamber Collaboration
Summary Report - Part I: Progress Report for FY90
Section
1.0 Execurive Summary1.1 Introduction1.2 Overview of the HCTC design1.3 Overview of major R&D results from FY90
2.0 Straw Tube Drift Chambers (Task I)2.1 Electrostatic stability of straw tubes2.2 Superlayer construction and operation2.3 Electronics for straw tube readout2.4 Gas selection and aging study2.5 Other radiation hardness studies
3.0 Scintillating Fibers (Task 2)3. I Fiber and ribbon manufacture3.2 Avalanche photodiode readout3.3 Other radiation hardnessstudies
t
I
•
4.04.14.24.34.4
5.05.15.25.3
Mechanical Engineering (Task3)Stable base cylinder designEnd plate designSuperlayer SUPPOI1 structureAssembly and automation
Monte Carlo Simulationof HCTC (Task 4)Detector response simulationReconstruction studiesHCTC design parameters
References
Appendix A. Neutron Irradiation Sample Holder and Dosimetry
iv

I .
1.0 Executive Summary
1.1 Introduction
This report describes the progress made over the past year by the Hybrid CentralTracking Chamber (HCTC) Collaboration toward the development of a largevolume tracking detector for the SSe. In particular, the HCTC R&D effort has beenfocused on the tracking region outside a radius of about 40 em and within thecentral rapidity region IT] I < 1.6. Our design studies have lead us to conclude thatthe best tracking system in this region will be a combination of straw tube driftchambers and scintillating fibers, hence the name Hybrid CTC. Other SubsystemR&D Groups are designing inner and intermediate tracking systems which wouldsupplement the HCTC in a complete SSC detector. Our R&D work is applicable, infull or in part, to several of the detectors that have recently been proposed via Eol'sto the SSC Laboratory. However, as the design of the HCTC becomes moreadvanced, it has been necessary to make some decisions which are detector specific.When this is required, we focus our design on a tracking system which is compatiblewith the SDC detector. The SDC detector poses the greatest challenge to our designsince it requires the largest tracking volume.
The purpose of this Progress Report is to present a comprehensive review ofthe R&D results obtained by the twelve institutions which are contributing to theHCTC design. These results are grouped into four major tasks: straw tube driftchambers, scintillating fibers, mechanical engineering and Monte Carlo simulationof the HCTC detector. The detailed presentations can be found in Sections 2through 5. In the remainder of this Executive Summary we present an overview ofthe complete HCTC concept and a brief summary of the major R&D results obtainedover the past year.
1.2 Overview of the HerC Design
The HCTC detector is conceptually simple. The detection elements, straw tubesor scintillating fibers, are laid in superlayers on the outer surfaces of concentricsupport cylinders whose central axes coincide with that of the colliding beam(z axis). A cross section cut along the z axis of a HCTC detector is shown in Fig 1-1.A cross section transverse to the z axis through a straw tube super layer is shown in
1-1
Sclnlllialing FI~rI
Support Cylinder
t"A .
-~~.<.~II
i%
Siraw lube'
Hybrid Central Tracking Detail- - ->- %
Figure 1-1. Cutaway view of one quarter section of a HCTC detector, witheight straw tube superlayers (z wires) and three outer scintillatingfiber superlayers (stereo, u-v fibers).
1-2
I .
I
I
..
Fig 1-2. This figure shows an eight deep superlayer composed of four mm diameterstraw tubes. In our design, all straw tubes are parallel to the z axis and therefore asuperlayer is simply supported on the surface of the cylinder. The straw tube driftcells measure points in r and phi (using standard cylindrical coordinates). Asuperlayer provides a line segment of length 2.8 em projected into the r,phi plane.
The scintillating fibers are also placed on the outer surface of the supportcylinders. Since the fibers are flexible, they can be laid either parallel to the z axis orwound on the cylinders at small angles with respect to the axis. The HCTC designuses scintillating fibers to provide stereo superlayers which measure the zcoordinates of the tracks. A stereo superlayer consists of four scintillating fiberlayers, two at +5° and two at _5° with respect to the z axis. Fibers used in stereosuperlayers will have a diameter of about one mm,
Fig. 1-3 shows a Monte Carlo simulation of the readout from particles passingthrough adjacent straw tube and scintillating fiber superlayers. The simulation isdescribed in detail in Section 5 and is presented here to simply illustrate themeasurement concept. The straw tube electronics provide a drift timemeasurement which is converted to a distance and represented as a circle aroundthe known wire location. The scintillating fiber hits are simply latched indicatingwhich fiber was struck <squares in Fig. 1-3). The pattern recognition programconstructs line segments tangent to the drifttime circles and uses the fiber stereodisplacement to measure the z coordinate <the complications caused by particle andsignal propagation times are discussed in Section 5). The goal of the HCTC design isto provide point measurements in the r.phi plane to an accuracy of better than 200microns and the z coordinate to about one em.
A HCTC detector using the concepts described above will provide hermetic,uniform and precise particle detection over large tracking volumes. The stable basesupport cylinders are at the center of the design concept. Our preliminary studiesindicate that a support structure using large carbon composite cylinders (see Section4) will provide the required alignment precision and long term stability for thestraw tubes and scintillating fibers. This can be accomplished with cylinders withradii as large as two meters and lengths over six meters, having walls as thin as 0.3%of a radiation length. This means that the HCTC detector can span the full length ofthe central tracking region without requiring support structures or end plates at zero
1-3
I'AltTlCI.! TIIACK
STIlAlI TUUES
l:AIlIJUN t'Al:F. snsrr
CAnUON IIUNEYl:OMII COilE(on IlUIIAl:Et.I. FOAM EQUAl.)
Figure 1-2. Cross section of a straw tube superlayer.
I p I101
molFigure 1-3. Monte Carlo simulation of straw tube and stereo scintillating
fiber superlayers. The circles represent the distances measuredfrom the straw tube drift times. The small squares indicatescintillating fiber hits. The left track is at z=O, the right at z=4 an(note the stereo displacement of the fiber hits).
1-4
r
rapidity. The thickness of an eight deep straw tube superlayer is 0.9% of a radiationlength (straw tube elements plus support structure)
The design of a specific central tracking detector based upon the HCTC conceptrequires knowledge of the supplementary tracking detectors and the generalexperiment requirements. As an example of this we focus on the SDC detector. Ashas been proposed for this detector, we assume an inner silicon strip tracker of thetype being designed by the Silicon Tracking Subsystem Collaboration (PC022, Seidenet. al.), and supplementary intermediate tracking as proposed, for example, by theWire Chamber Subsystem Collaboration (PC024, Hanson et. al.).
Assuming this supplemental tracking and using the geometric constraintsimposed by the SOC Solenoid, the HCTC detector would take on the general formshown in Fig. 1-4. Within these constraints, the optimal detector parameters willnaturally depend on the assumed SSC operating luminosity. Our approach has beento design the lowest cost detector for SDC operation at turncn (luminosity -1033)
and provide a simple, cost-effective upgrade path to the ultimate SSC luminosity(-1034). The initial HCTe configuration, illustrated in Figs. 1-1 and 1-4, consists ofeight straw tube superlayers, each containing eight straw tubes, for a total of 64 pointmeasurements in the r.phi plane. The straw tubes would span the entire length ofthe detector, but be isolated electrically into two sections which are readout at eachend. This requires the development of a mid-length termination scheme as
t described in the attached proposal. The total number of straw tube readout channels
in this detector is 245,000. In addition there are three stereo scintillating fiber layerslocated on support cylinders just outside the last three straw tube super layers. Eachtrack would therefore have three z measurements at the outer extreme of the HCTedetector plus the z information provided by the inner silicon strip tracker. The totalnumber of scintillating fiber readout channels required is 136,000 assuming one mm
fibers in the outer most layer and half mm fibers grouped in triplets in the twoinner most layers.
•
Obviously the details of the HCTC design for the SOC detector are still understudy and must be fixed by more detailed Monte Carlo simulations. The purpose ofthis overview is to show that the general requirements of particle tracking for theSOC detector can be well met by the HCTe. An application of the HCTC concept tothe L' detector is being independently pursued in a new Subsystem Proposal; A
1-5
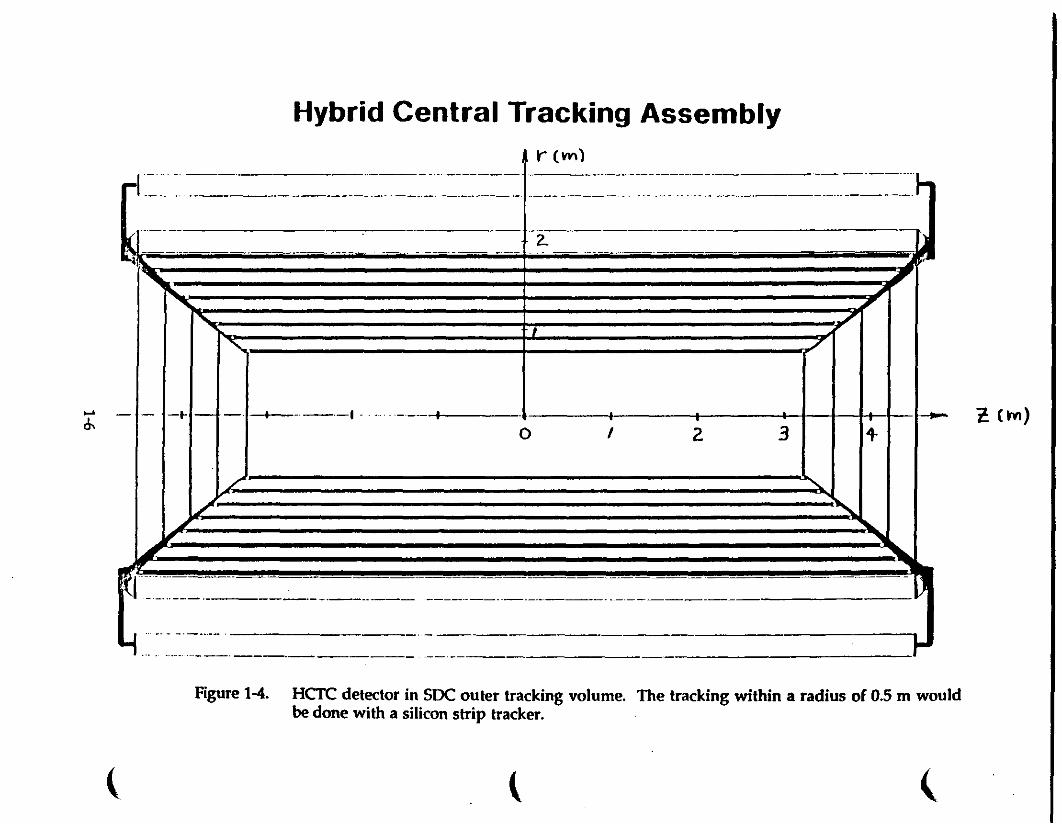
Hybrid Central Tracking Assembly... (m)
-"_._.._- ------- --.----~-- _______- _~~_-~~_~~-=~-_____________-==~~~-r~L ____ - ---------------_. -------
~r--_ 2. h-
ktj~ ~'I'. ~
.... ~
...... -',<, ,/
- - -t- - -- I -----1 - - ----- I
0 I 2 3 4-
f <,
/' .....~ ....~ "'
~r_~_____ - - - -
-_.-_._-.._-- ._--_._-_.._---_._-----> .-_._-----
~ -- --- -------- --- ----- ..
d: -1- I-t-I-f-I I ---I - _d I -, I I I H-t+-t-+-- ~ (m)
Figure 1-4. HCTC detector in SOC outer tracking volume. The tracking within a radius of 0.5 m wouldbe done with a silicon strip tracker.
( l (
r
I
Compact Central Tracker (S. Ahlen, et. al.), The carbon fiber composite
cylinders being developed for the HCTC detector are also of interest to the
Scintillating Fiber Subsystem Collaboration (PC023, Atac, Elias, Ruchti, et. a1.). We
have been working particularly closely with this subgroup to avoid unnecessary
duplication of mechanical design efforts and to strive for interchangability of the
straw tube, and scintillating fiber superlayers.
1.3 Overview of Major R&D Results from FY1990
This section briefly summarizes some of the specific R&D results that have
come from our HCTC Subsystem research.
• Wire support in small diameter straw tubes (Section 2.1): The wire supportallows gas flow through the tubes and permits wire stringing after the tubesand supports have [>c"j1 assembled.
• Construction of ar. S jeep straw tube superlayer (Section 2.2): We have inoperation a long (2.7 m) straw tube superlayer composed of 4 mm diameterstraw tubes.
• Advancement of straw tube end plate design (Sections 2.3 and 4.2): Wehave refined the end plate design (electronics, gas manifolds and cooling)and have a first order prototype on the 2.7 m superlayer.
• Radiation hardness studies (Sections 2.4, 2.5, 3.2, and 3.3): Radiationhardness studies of straw tubes, gases and scintillating fibers have beenundertaken. The first quantitative measurement of the neutronsusceptibility of avalanche photodiodes, operated in the geiger mode atroom temperature, was made.
• Finite element analysis of carbon fiber cylinders (Section 4.1): A detailedengineering analysis has shown that the large, rigid, low density cylindersneeded for the HCTC design can be constructed.
• Superlayer support and assembly automation (Sections 4.3 and 4.4):Progress has been made on the design of an overall support structure for theHCTC superlayers. Preliminary ideas for straw tube assembly automationhave been developed.
• Monte Carlo simulation of complete HCTC detector (Section 5): A detailedsimulation of the HCTC detector response to SSC interactions has beenmade. Preliminary pattern recognition studies have been carried out.
1-7
The above results are distributed throughout the four tasks which comprise theHCTC Subsystem Program: Section 2, Straw Tube Drift Chambers (Task 1); Section 3,Scintillating Fibers (Task 2); Section 4, Mechanical Engineering (Task 3); and Section5, Monte Carlo Simulations (Task 4). The section numbers refer to this ProgressReport and the task numbers to those assigned in our Memorandum ofUnderstanding. The total funding for the HCTC Subsystem Program in FYl990 was$330K from the SSC Laboratory. Appreciable additional support of our effort wasprovided directly by Oak Ridge National Laboratory and the SupercomputerComputations Research Institute.
The second-year funding request appears in the companion document "HybridCentral Tracking Chamber Collaboration, Summary Report - Part II: Proposal forFY91." Three groups have formally jointed the collaboration since the proposal forthe first years was submitted; they are CEBAF, KEK, and the University ofPennsylvania. CEBAF joins because of the involvement of Drs. Stan Majewski andCarl Zorn, who were part of the original collaboration when they were at theUniversity of Florida. KEK is a new partner who will assist with straw tubeelectronics. Penn was involved on an informal, cooperative basis last year and hasjoined as a collaboration member this year.
1-8

2.0 Straw Tube Drift Chambers (Task 1)
This section reviews the progress made toward the development of the strawtube superlayers needed for the HCTC detector. There are four components to thispart of our R&D program. Section 2.1 presents a study of the electrostatic stability of4 mm diameter straw tube drift cells and describes a solution to the wire supportproblem. Section 2.2 discusses the construction and testing of a 2.7 meter longsuperlayer composed of 60 4 mm diameter straw tubes. We consider this to be an
important step toward the construction of a large-scale straw tube superlayer.Section 2.3 describes some preliminary studies of front end electronics and signalpropagation properties. Sections 2,4 and 2.5 present gas selection and measurementsof the radiation hardness of gases and other straw tube components.
This R&D program gives us a confidence that long straw tube superlayers of thetype required for the HCTC detector can be constructed to the required accuracy.Only preliminary studies of the readout electronics and radiation hardness havebeen done. Considerable work needs to be done on the design of a realistic end plate
r"> ring and on the development of mass assembly procedures for straw tubesuperlayers,
2.1 Electrostatic stability of straw tubes
..
The straw tube design for the HCTC detector calls for 4 mm diameter detectorelements. The sense wire would be operated at -2 kV to achieve gas gains whichgive suitable signal pulses. The ideal case in which the sense wire is exactly centeredwithin a perfectly cylindrical cathode is electrostatically stable. Practically, however,the sense wire will not be exactly centered due to positioning error and gravitationalsag, and the straw tube cathode will be neither perfectly cylindrical nor perfectlystraight. Therefore it is important to determine the conditions under which anoperational straw tube detector element will perform satisfactorily.
We have constructed a straw tube model of stainless steel tubing which has aninner diameter of 3.9 mm. The steel tube is placed in a horizontal orientation and amanifold on one end allows gas flow through the tube. We have used CH4, C02and CF4 as stable gases. We find that the longest cell that is stable above 2.5 kV witha 25 urn sense wire centered in the tube under 50 grams tension is about one meter.
2-1
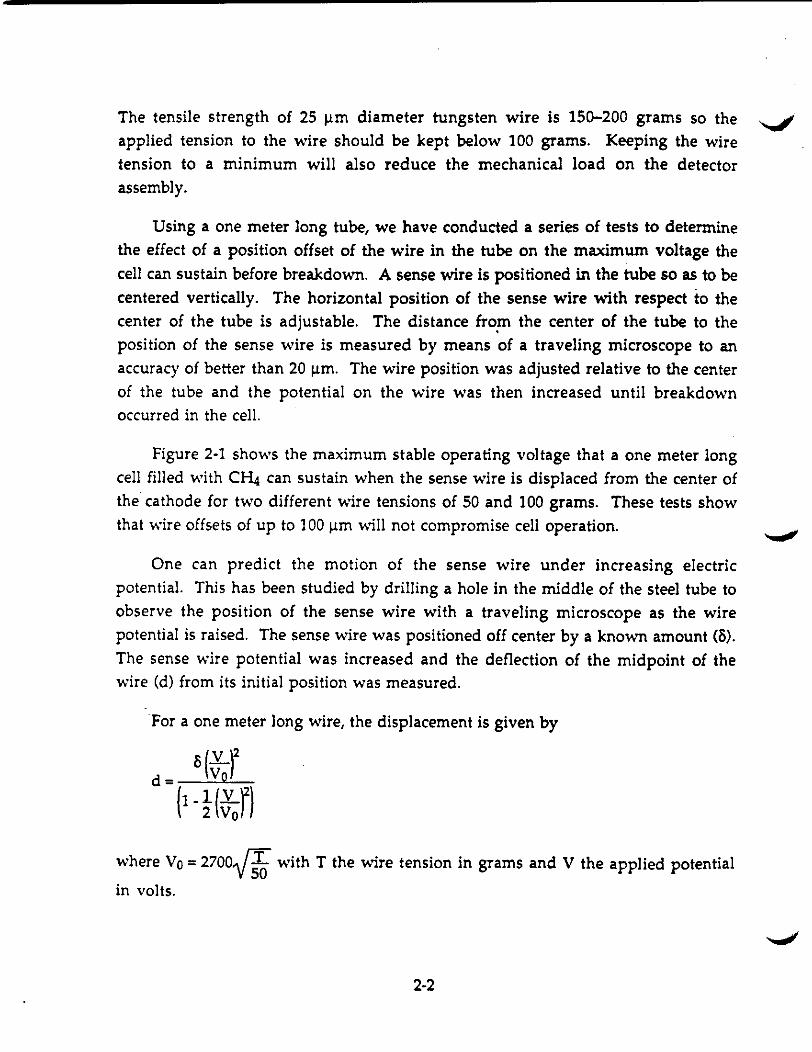
The tensile strength of 25 urn diameter tungsten wire is 150-200 grams so the """applied tension to the wire should be kept below 100 grams. Keeping the wiretension to a minimum will also reduce the mechanical load on the detectorassembly.
Using a one meter long tube, we have conducted a series of tests to determinethe effect of a position offset of the wire in the tube on the maximum voltage thecell can sustain before breakdown. A sense wire is positioned in the tube so as to becentered verticalIy. The horizontal position of the sense wire with respect to thecenter of the tube is adjustable. The distance from the center of the tube to theposition of the sense wire is measured by means of a traveling microscope to anaccuracy of better than 20 urn, The wire position was adjusted relative to the centerof the tube and the potential on the wire was then increased until breakdownoccurred in the cell.
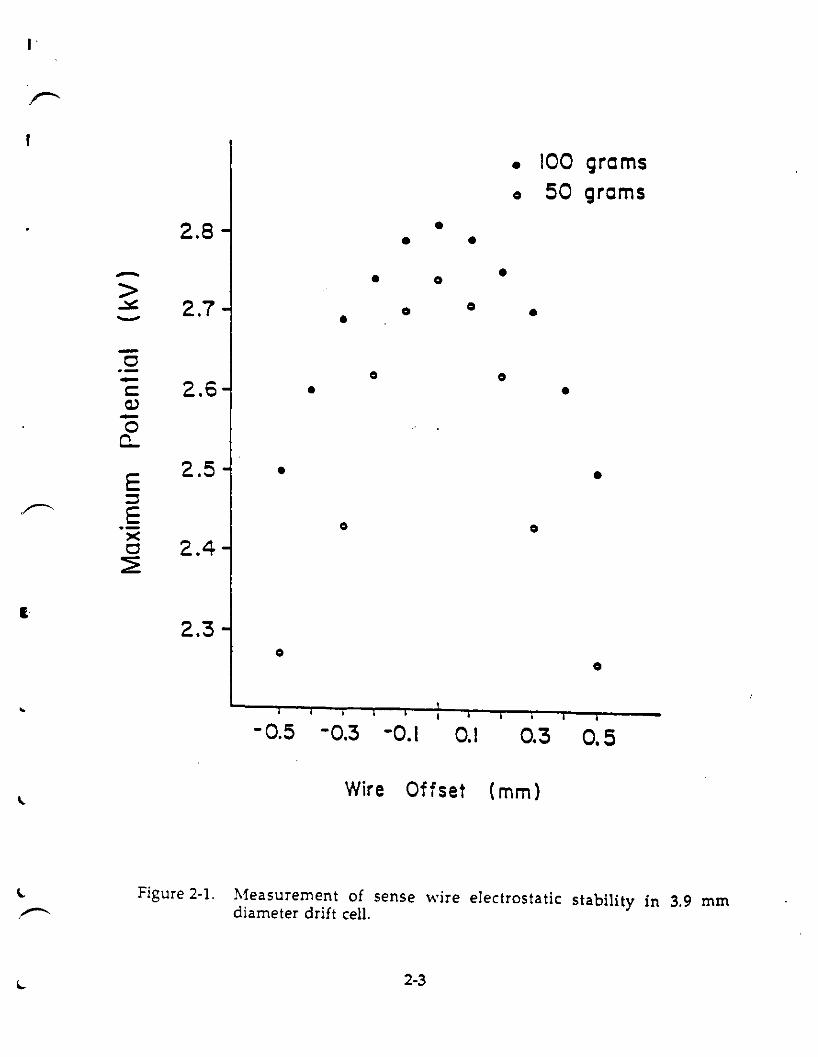
Figure 2-1 shows the maximum stable operating voltage that a one meter longcelI filled with CI-4 can sustain when the sense wire is displaced from the center ofthe cathode for two different wire tensions of 50 and 100 grams. These tests showthat wire offsets of up to 100 urn "..ill not compromise celI operation.
One can predict the motion of the sense wire under increasing electricpotential. This has been studied by drilling a hole in the middle of the steel tube toobserve the position of the sense wire with a traveling microscope as the wirepotential is raised. The sense wire was positioned off center by a known amount (/).The sense wire potential was increased and the deflection of the midpoint of thewire (d) from its initial position was measured.
For a one meter long wire, the displacement is given by
where Vo =2700{li with T the wire tension in grams and V the applied potential
in volts.
2-2
I
r>
• 100 grams
0 50 grams
2.8 •• ••- • 0>
0.::t:. 2.7 0 •- •0.- 0 0- 2.6 •= •Q)-00-
2.5 • •E::J
.r< E 0 0')<2.40
~
I2.3
00
- 0.5 -0.3 -0.1 0.1 0.3 0.5
Wire Offset (rnrn)
~ Figure 2-1. Measurement of sense wire electrostatic stability in 3.9 mm~ diameter drift cell.
2-3
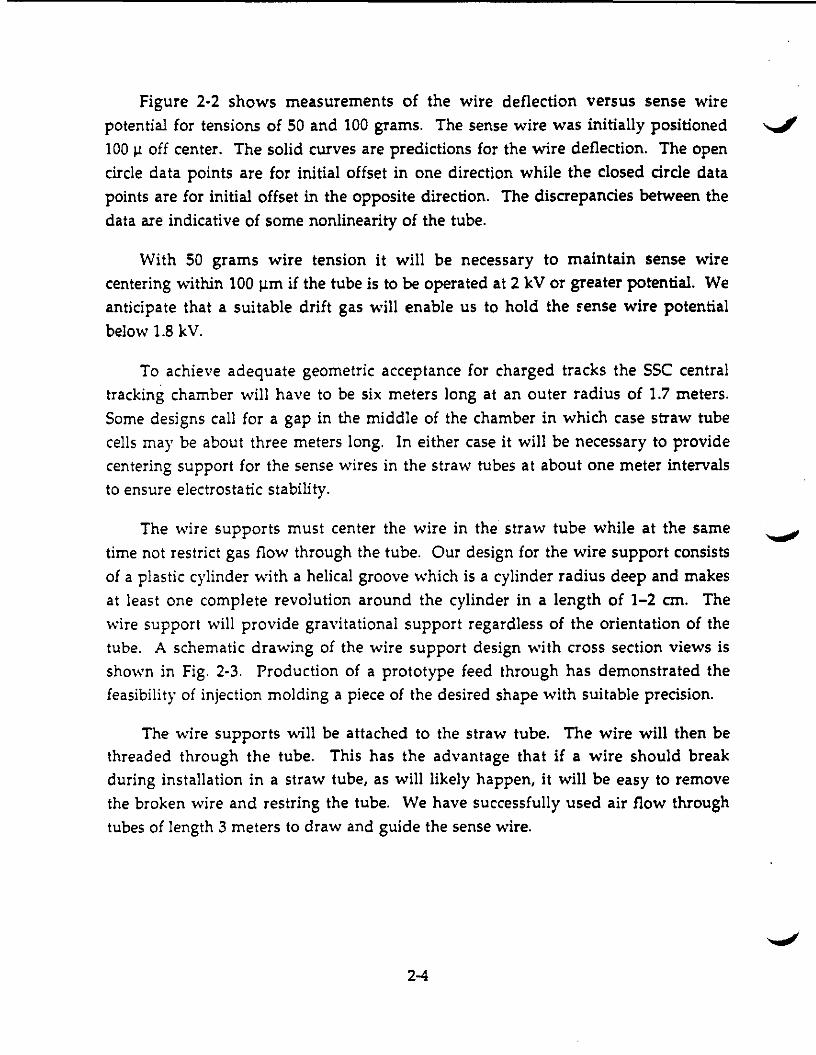
Figure 2-2 shows measurements of the wire deflection versus sense wirepotential for tensions of 50 and 100 grams. The sense wire was initially positioned10011 off center. The solid curves are predictions for the wire deflection. The opencircle data points are for initial offset in one direction while the closed circle datapoints are for initial offset in the opposite direction. The discrepancies between thedata are indicative of some nonlinearity of the tube.
With 50 grams wire tension it will be necessary to maintain sense wirecentering within 100 urn if the tube is to be operated at 2 kV or greater potential. Weanticipate that a suitable drift gas will enable us to hold the sense wire potentialbelow 1.8 kV.
To achieve adequate geometric acceptance for charged tracks the sse centraltracking chamber will have to be six meters long at an outer radius of 1.7 meters.Some designs call for a gap in the middle of the chamber in which case straw tubecells may be about three meters long. In either case it will be necessary to providecentering support for the sense wires in the straw tubes at about one meter intervalsto ensure electrostatic stability.
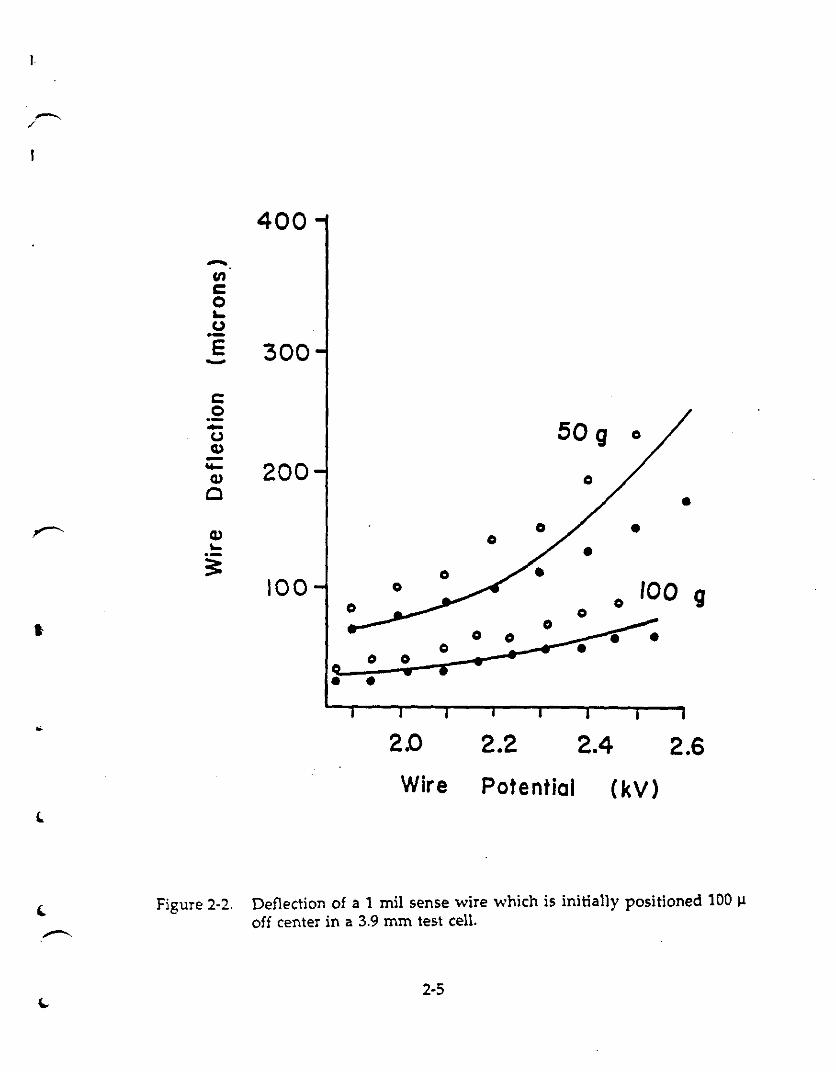
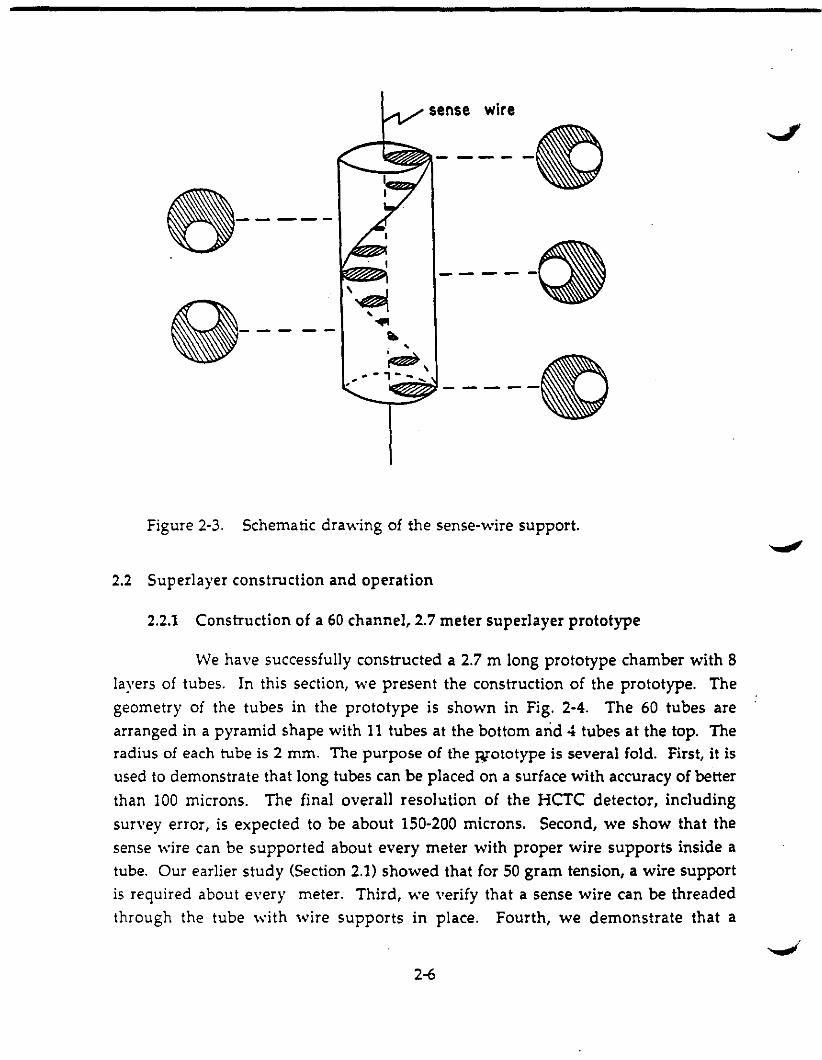
The wire supports must center the wire in the straw tube while at the sametime not restrict gas flow through the tube. Our design for the wire support consistsof a plastic cylinder with a helical groove which is a cylinder radius deep and makesat least one complete revolution around the cylinder in a length of 1-2 em. Thewire support will provide gravitational support regardless of the orientation of thetube. A schematic drawing of the wire support design with cross section views isshown in Fig. 2-3. Production of a prototype feed through has demonstrated thefeasibility of injection molding a piece of the desired shape with suitable precision.
The wire supports will be attached to the straw tube. The wire will then bethreaded through the tube. This has the advantage that if a wire should breakduring installation in a straw tube, as will likely happen, it will be easy to removethe broken wire and restring the tube. We have successfully used air flow throughtubes of length 3 meters to draw and guide the sense wire.
2-4
I
400
-enc0a-U.-E 300-c.2- 50 9ucu- 200cu 0
C •cu 0 •~
0.- •3= 0
100 0 1000 0 9
0
t 0 o ---.---;0
0 I • •0 0 •0 • •• •
2.0
Wire
2.2 2.4 2.6
Potential CkV)
Figure 2-2. Deflection of a 1 mil sense wire which is initially positioned 100 ~
off center in a 3.9 mm test cell.
2-5
e-----Q----- ,
~..... , ...... \" ,
wire
-----CJ-----()
-----CJFigure 2-3. Schematic drawing of the sense-wire support.
2.2 Superlayer construction and operation
2.2.1 Construction of a 60 channel, 2.7 meter superlayer prototype
We have successfully constructed a 2.7 m long prototype chamber with 8layers of tubes. In this section, we present the construction of the prototype. The
geometry of the tubes in the prototype is shown in Fig. 2-4. The 60 tubes arearranged in a pyramid shape with 11 tubes at the bottom and 4 tubes at the top. Theradius of each tube is 2 mm. The purpose of the wototype is several fold. First, it isused to demonstrate that long tubes can be placed on a surface with accuracy of better
than 100 microns. The final overall resolution of the HCTC detector, including
survey error, is expected to be about 150-200 microns. Second, we show that thesense wire can be supported about every meter with proper wire supports inside atube. Our earlier study (Section 2.1) showed that for 50 gram tension, a wire supportis required about every meter. Third, we verify that a sense wire can be threadedthrough the tube with wire supports in place. Fourth, we demonstrate that a
2-6
figure 2-4(al. Cross section of the straw tube superlayer. The shaded tubeswere ins trumented wi th sense wires.
Fi"'lH' 2-4(bl. I'hotozraph of superlaver .
.., --,
chamber with a large number oj straws can be made operational without difficulty.
In the past, it was shown that chambers with a few tubes could be operational. And
last, the prototype demonstrates the feasibility of assembling a large central trackingchamber for SSe. The technique we have developed to construct this prototype can
be easily adapted to construct the full size central tracking chamber,
The construction of the 2.7 m prototype starts with a sturdy base, The base
could be something like an optical table or a rail. It is important that the base has aflat surface to support the straw tubes. Our base looks like the bottom third of a disk.
It is 3.3 meters long with a 7 ern wide machined face as shown in Fig. 2·5, Thesurface was scanned with a survey telescope and found to be flat to better than 25microns over the en tire surface.
Four aluminum plates with machined grooves are placed on the top of the
base. The grooves on the plates are to guide the straw tube placement. The plates
are aligned among themselves using a survey instrument.
Figure 2-5. Overview of straw tube superlayer showing stable base supportand completed prototype.
2·8
I
I
I
Straw tubes were assembled prior to placing on the aluminum plate. Threesections of length about 90 em were cut. Before the tubes were connected using thinaluminum cylinders, wire supports were inserted inside tubes as shown in Fig. 2-6.Because we were not able to obtain the wire support shown in Fig. 2·3 in time foruse in the prototype, we have used two V shaped disks back to back (Fig. 2-6).Although the disks were machined carefully, measurement using a microscopeshowed that they are in tolerance to about 75 microns. As we have found out,joining tubes was not the best approach since the tube joints introduced cumulativeerrors along the vertical direction at the joint. The next prototype will not havejoints and the production wire supports (Fig. 2-3) will be inserted from the ends ofthe straws.
Once enough tubes are assembled for a layer, they are attached to the end plates(Fig. 2-7) and placed in the grooves of the aluminum plate. In order to attach to theend plates, the tubes are bent slightly. To obtain better accuracy, tubes are pressedslightly using finger shaped jigs from the top. After tubes are properly placed, asmall amount of fast drying glue (trade name: cyanoacrylate) is used to glue tubes tothe plate. The gluing has two purposes. First, the fixed tubes act like the grooves onthe aluminum plates, so that the next layer of tubes can be aligned accurately.Second, it straightens the tubes.
Each end plate consists of two walls. Tubes are attached to one plate by a thinwall cylinder and sense wires are tensioned from the other wall (Fig. 2-7). The spacebetween the two walls serve as a plenum to provide gas flow to each tube.
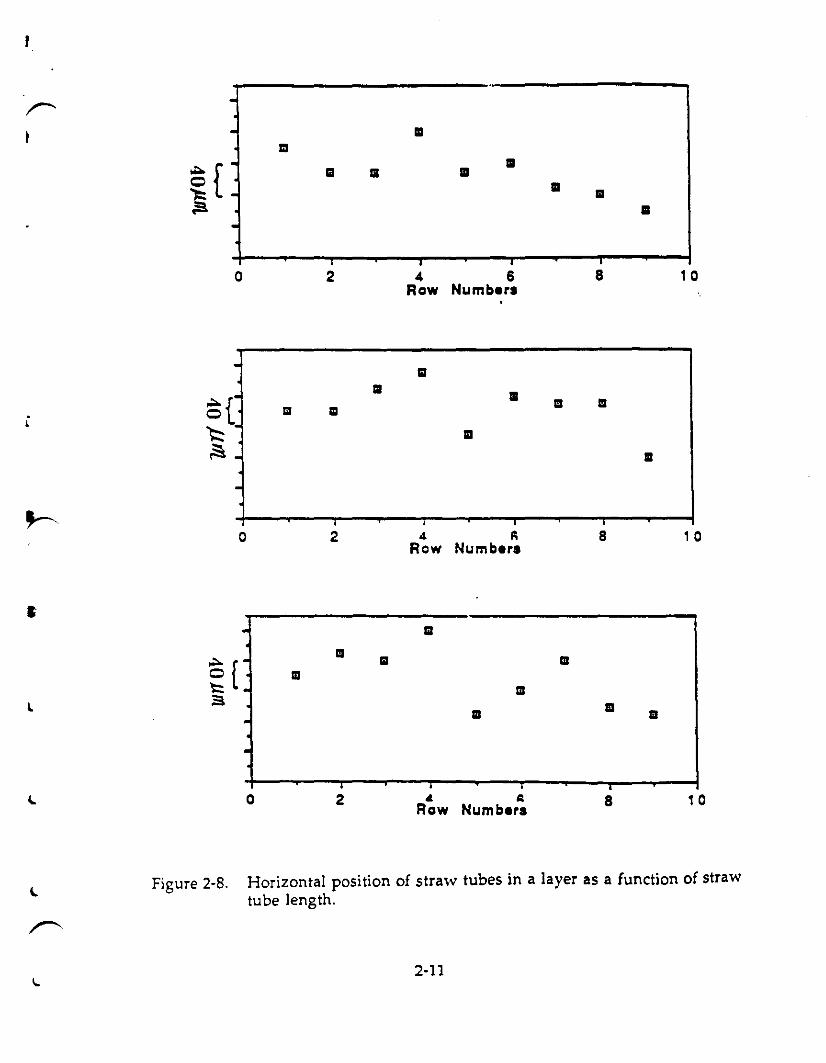
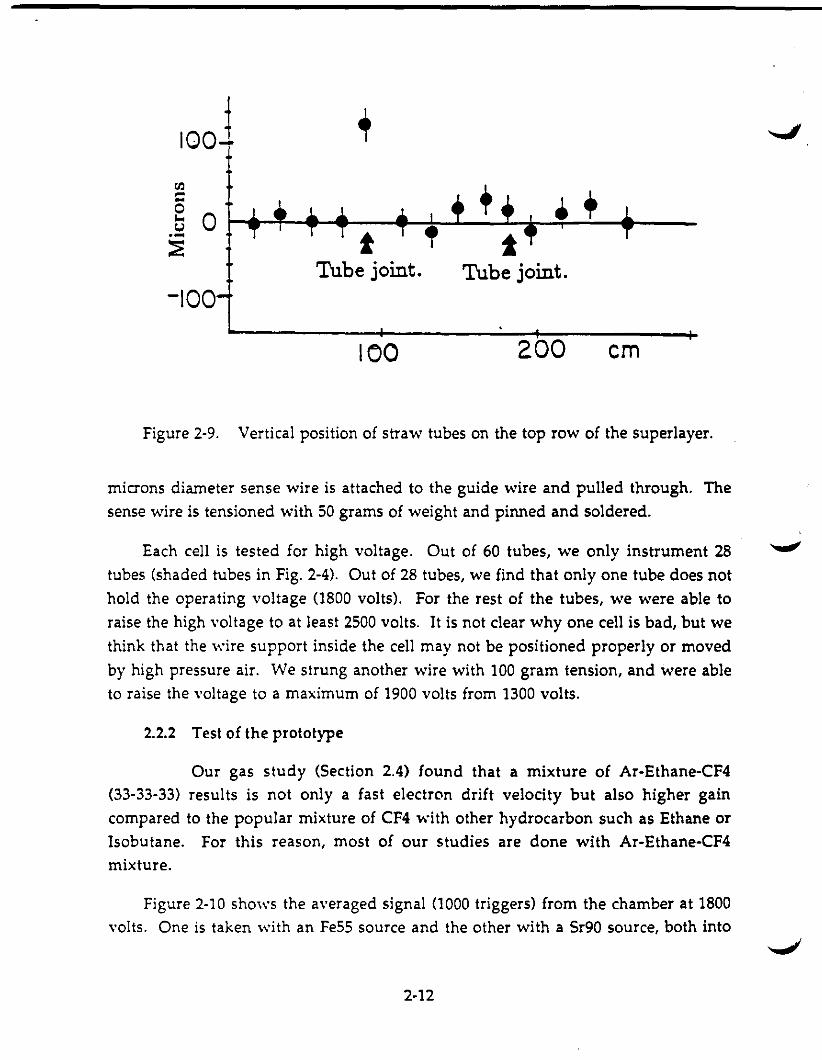
As we place each layer, the vertical and horizontal position of the tubes aremeasured. Figure 2-8 shows that horizontal position of tubes of a layer at differentlocations along the tube length. The figure shows that tubes can be positioned to anaccuracy of JOO microns or better. Figure 2-9 shows the vertical position of the toplayer (Sth layer) measured along the tube length. As we mentioned earlier, one ofthe locations of tube joints is out of place by about 150 microns (at 90 em) .
After all tubes are placed and glued, sense wires are strung. To accomplish this,air with high pressure (we used 20 psi air from a tube with 3 mm diameter) is blowfrom one end of a tube to string a guide wire with 100 micron diameter. A 25
2-9
Connectm; cylinder.
~-Tu-b-es-.-0. (2. __a ..~_.O-Tu-be-s:'_"" ~ ~
To End plate V shaped wire support
Figure 2-6. Tube assembly with tube connector and wire supports in the strawtube. .
\
(
f!Pj\\
r----,I
Figure 2-7. End plates used in prototype straw tube superlayer.
2-10
r- ·I · II
III
~c iii iii IIII
)::: . II ..oS II
·• I • I
0 2 4 6 8 10Row Numbers
· II
sfIII
IIIII III
III
I ~ ". II
.:::s. III
·• •
0 2 4 II 8 1 0Row Numbers
I~ ..
sC IIIiii III
iii~. iii
l :sIII II
III..
• , , •0 2 4 iii 8 10Row Numbers
Figure 2-8. Horizontal position of straw tubes in a layer as a function of strawtube length.
2·11
100
tilc:
t 0.-:E
-100
100
.. +
200 em
Figure 2·9. Vertical position of straw tubes on the top row of the superlayer.
microns diameter sense wire is attached to the guide wire and pulled through. The
sense wire is tensioned with 50 grams of weight and pinned and soldered.
Each cell is tested for high voltage. Out of 60 tubes, we only instrument 28
tubes (shaded tubes in Fig. 2·4). Out of 28 tubes, we find that only one tube does nothold the operating voltage (1800 volts). For the rest of the tubes, we were able to
raise the high voltage to at least 2500 volts. It is not clear why one cell is bad, but we
think that the wire support inside the cell may not be positioned properly or moved
by high pressure air. We strung another wire with 100 gram tension, and were ableto raise the voltage to a maximum of 1900 volts from 1300 volts.
2.2.2 Test of the prototype
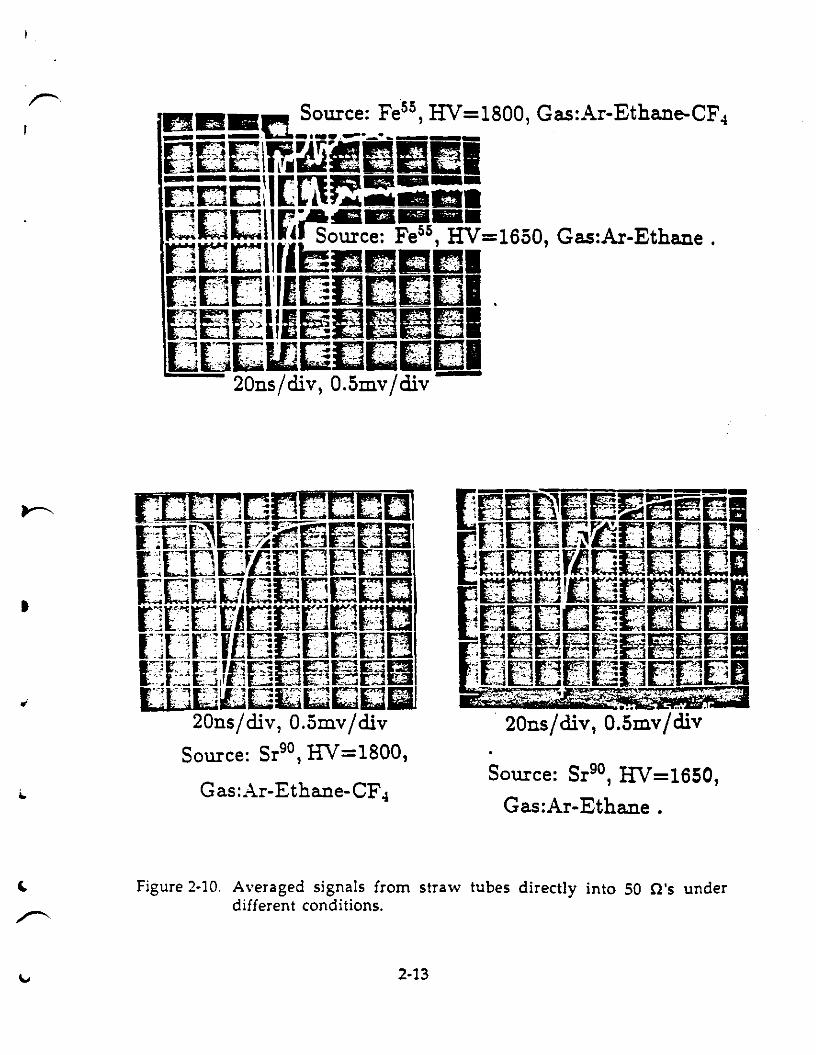
Our gas study (Section 2.4) found that a mixture of Ar-Ethane·CF4(33·33·33) results is not only a fast electron drift velocity but also higher gaincompared to the popular mixture of CF4 with other hydrocarbon such as Ethane orIsobutane, For this reason, most of our studies are done with Ar-Ethane-CF4mixture.
Figure 2·10 shows the averaged signal (1000 triggers) from the chamber at 1800volts. One is taken with an Fe55 source and the other with a Sr90 source, both into
2-12
t
•
Source: Sr90 , HV=1650,
Gas:Ar-Ethane .
Figure 2-10. Averaged signals from straw tubes directly into 50 n's underdifferent conditions.
2-13
50 ohms. The rise time is about 2-3 ns, 30 ns later, the signal is reduced toabout 15% of the peak. For comparison, the same is shown for Ar-Ethane (50-50)gas. When the chamber is operating with Ar-Ethane mixture, the high voltage isreduced to 1600 volts to maintain a similar gain.
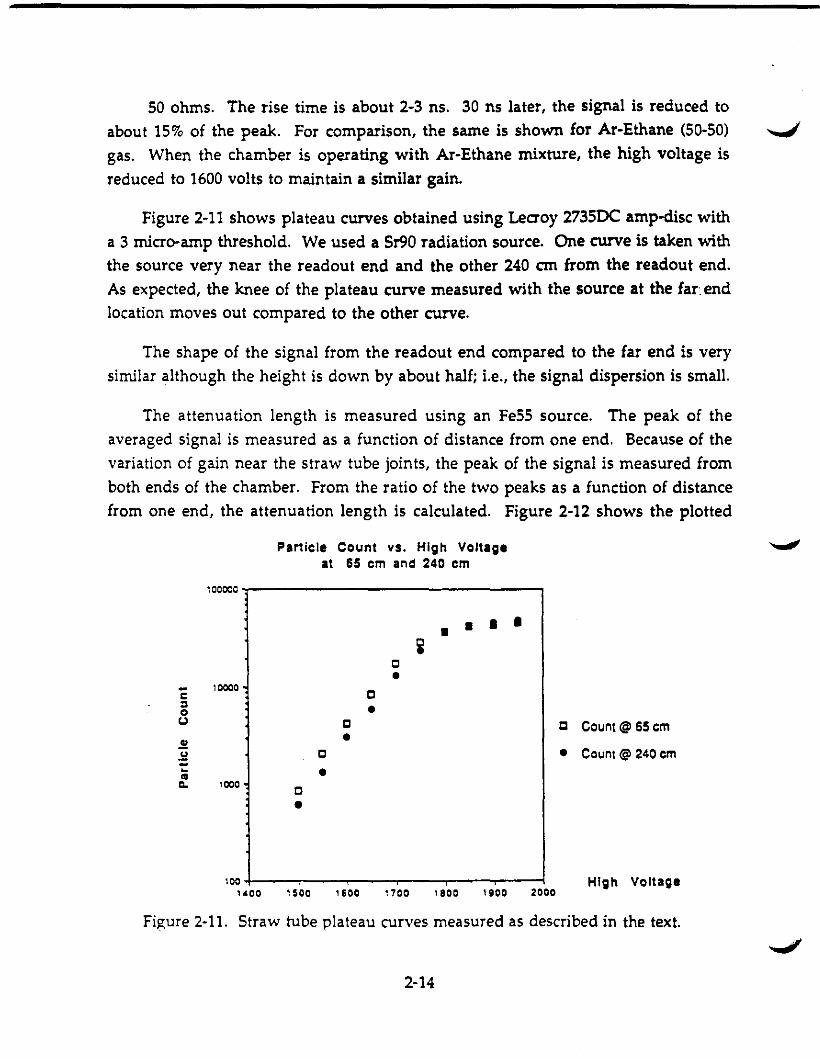
Figure 2-11 shows plateau curves obtained using Lecroy 2735DC amp-disc witha 3 micro-amp threshold. We used a Sr90 radiation source. One curve is taken withthe source very near the readout end and the other 240 em from the readout end.As expected, the knee of the plateau curve measured with the source at the far. endlocation moves out compared to the other curve.
The shape of the signal from the readout end compared to the far end is verysimilar although the heigh t is down by about half; i.e., the signal dispersion is small.
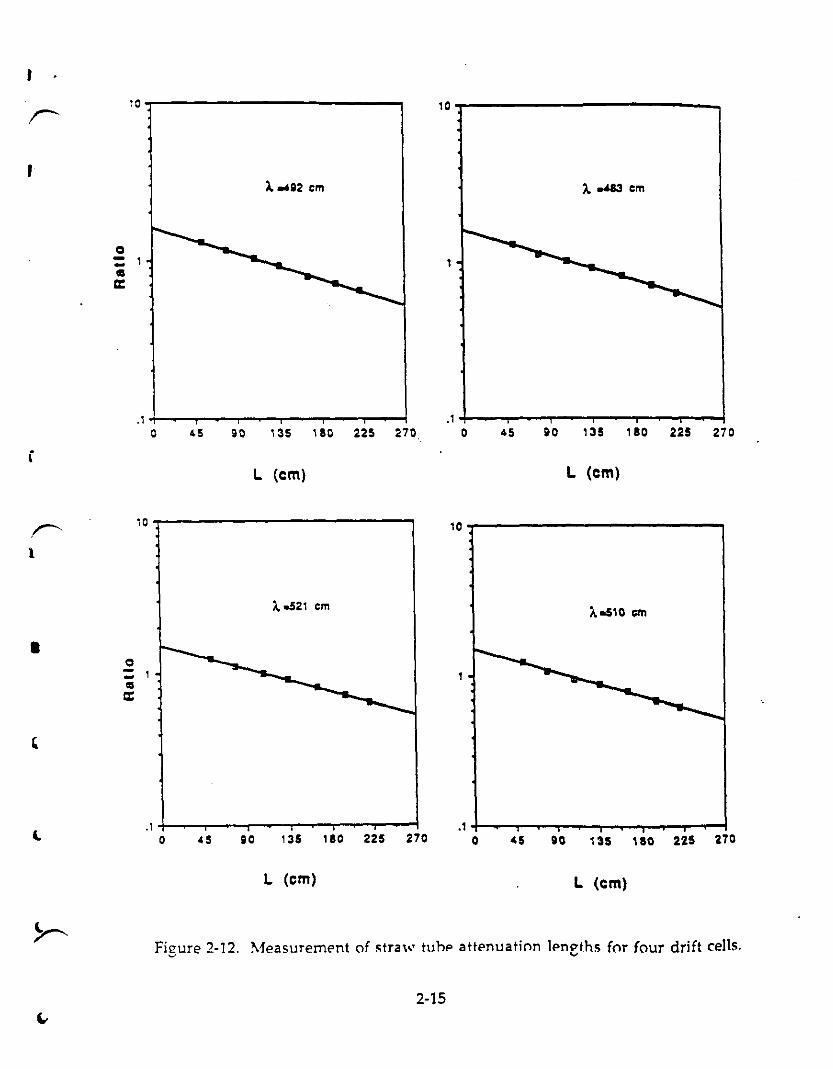
The attenuation length is measured using an Fe55 source. The peak of theaveraged signal is measured as a function of distance from one end. Because of thevariation of gain near the straw tube joints, the peak of the signal is measured fromboth ends of the chamber. From the ratio of the two peaks as a function of distancefrom one end, the attenuation length is calculated. Figure 2-12 shows the plotted
Particle Count vs. Hlg" Voltag.at 65 em and 240 em
100000.,---------------....,
• • ••c•_ 10000
C::>oc.J
.!!
.!:!--IIC. 1000 c
•
c
•
c•
C
•C Count @ 65 em
• Count @ 240 em
100 -!--.....,--...,....--r----,---.,.---i, 400 ~ 500 , 600 ~ 700 ~ 800 1900 2000
Hlg" Voltage
Figure 2-11. Straw tube plateau curves measured as described in the text.
2-14
I
10..,...--------------,10 T"-------------...,
IA. ..I!l2 em i. -"3 em
o--•a:
., .10 45 !l0 135 180 225 270 0 45 !l0 135 180 225 270
iL (em) L (em)
10r-- 10
l
•
,
i.. -521 em
e--•a:
se 135 180 225 27045.1 +-_..,..--.--,-..........,.--.-...-..-.,..........-j
o135 180 225 270!l045.1 +---r---;-----,,--..-..-........,....--l
ol
L (em) L (em)
Figure 2-12. Measurement of straw tuhe attenuation !eneths for four drift cells.
2-15

ratio for several channels. The overlapped curves are fitted using an exponentialfunction. Although there are some variations between tubes, an averageattenuation length of 500 em is obtained.
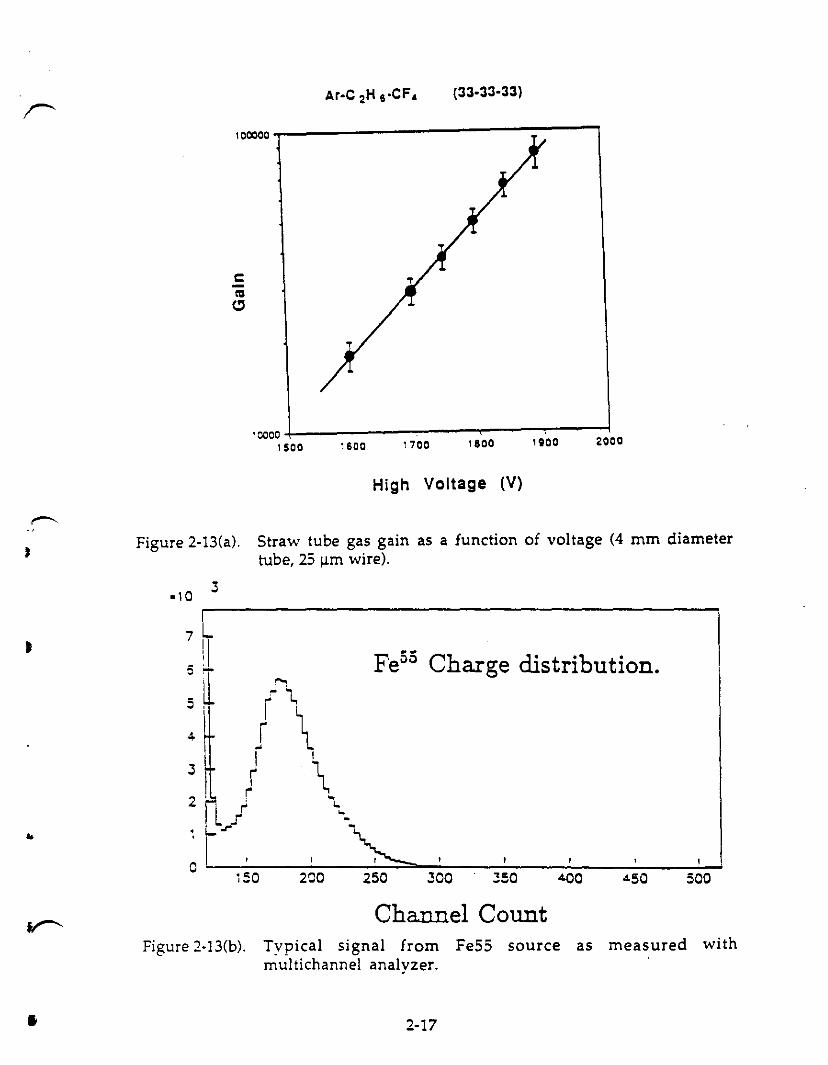
Figure 2-13(a) shows the measured gain as a function of high voltage. Thesignal from Fe55 is amplified using an Ortec amplifier and fed into a multichannelanalyzer. Figure 2-13(b) shows a typical histogram from the multichannel analyzer.From each histogram, the peaks are plotted as a function of high voltage and shownin Figure 2-13(a). In order to obtain the absolute gain, a known amount of charge isfed to the multichannel analyzer for calibration. Due to the systematics in theprocess, we estimate that there is about a 15% uncertainty in the gain scale shown inFigure 2-13(a).
Presently, the 28 channels are being instrumented with preamps,discriminators and TOCs for the resolution measurement as a function of distancefrom the readout end. We are using a Lecroy 2735DC preamp-discriminator for areference measurement. As frontend electronics becomes available from Penn andKEK (see Section 2.3), the Lecroy 2735DC will be replaced for a performancecomparison.
2.3 Electronics for straw tube readout
2.3.1 Overview
The goals for the electronics section of the project during the past yearhave been as follows.
1. To support the mechanical prototyping effort by providing readoutinstrumentation for the 2.7 m prototype.
2. To study signal readout from long straw tubes.
3. To evaluate front end Ie's developed by other groups.
To date we have designed, fabricated and done initial tests of first generationcomponents of front end readout electronics instrumentation to an array of 4 mmstraw tubes. The results obtained to date do demonstrate the feasibility of accuratereadout of large straw tube systems with acceptable packing density and powerdissipation. These results are summarized below. Our greatest concern remains
2-16
(33·33-33)
100000...-------------:~-__,
CIIICl
2000,gOO18001700'0000 +- ....,-----.---.-----1
'500
High Voltage (V)
Figure 2-13(a), Straw tube gas gain as a function of voltage (4 mm diametertube, 25 urn wire),
500"'50400350300
Fe55 Charge distribution.
250200
~w ,I
41
.'0 3rl-----------------------,
~ ~o ,..
..
Channel CountFigure 2·13(b), Typical signal [rom Fe55 source as measured with
multichannel analyzer,
I 2·17
noise resulting from crosstalk and electromagnetic interference. The larger scaleprototype planned for fiscal 1991 will pose a more rigorous test of the severity of thisproblem and provide an opportunity to explore creative solutions.
2.3.2 Prototype Instrumentation
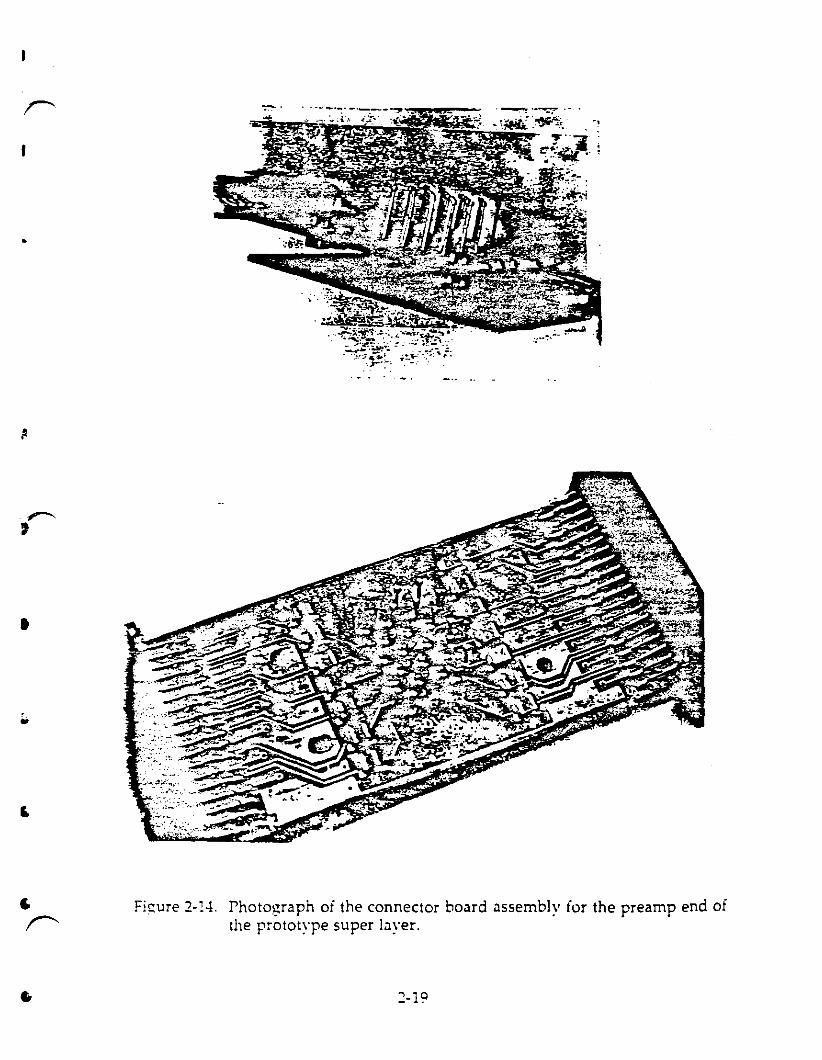
Complete instrumentation of the 2.7 m prototype was desired to providea means to evaluate the resolution obtainable from a complete mechanical andelectrical system. This work involved the design of connector boards for theprototype end plate which provide electrical contact to the central wire of each tube.Although the current design will require modification for use in a truly large scalesystem, it does demonstrate some useful design concepts. A photograph of theassembled connector boards for the preamp end of the stack is provided in Fig. 2-14.Mounted on the board surface adjacent to the sense wires is an array of springloaded pins which make electrical contact with the sense wires. The signals feedthrough to the reverse side of the first board, which contains the AC couplingcapacitors and PCB traces that feed to a standard edge connector. The high voltagesupply is brought in on the second board and distributed to the first board via anintervening array of current limiting resistors.
In the next generation design, these axial resistors will be replaced with surfacemounted chip resistors resulting in a much more compact assembly. The nextgeneration connector board assembly will be integrated with the PCB on which thefront end electronics are mounted. A prototype integrated module will beassembled that will instrument a few hundred channels of super layer. Thesemodules will then be registered and attached to the structural end plate. So,although the structural end plate is monolithic, the electronics will sit oninterchangeable modules.
During the month of September, tracking studies will be performed on the 2.7m straw tube stack using the connector boards with LeCroy preamp/discriminatorcards and TOC's for readout. The LeCroy preamplifiers will be modified to providethe proper termination for the straw tubes (around 300 Ohms).
2-18
,
•
•
•
,
•
Figure 2-1·t Photograph of the connector board assembly for the preamp end ofthe prototype super layer.
., • q_-1.
2.3.3 Readout From Long Straw Tubes
A preliminary study of signal transients on long straw tubes has been
performed including both direct measurements and transmission line simulations.
Of particular concern are reflections caused by incorrect termination and signal
attenuation and dispersion. Direct measurements of charge collection transients
were obtained using a digitizing oscilloscope set to 50 n with a 250 n resistor placed
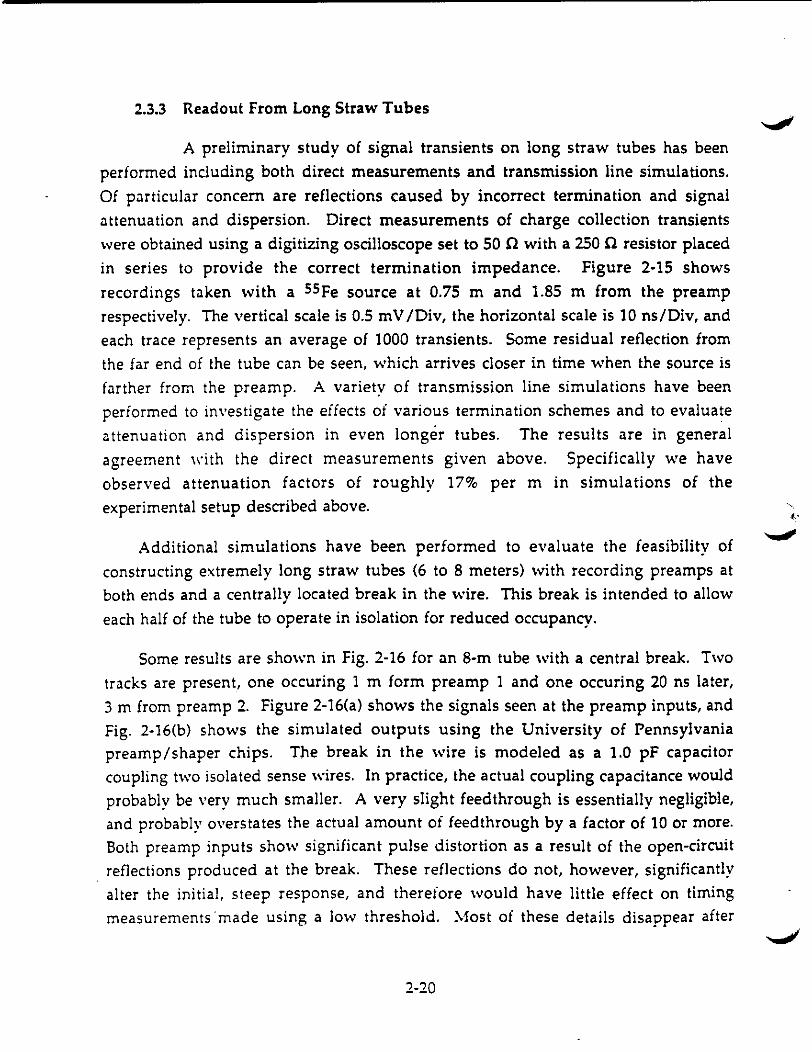
in series to provide the correct termination impedance. Figure 2-15 shows
recordings taken with a 55Fe source at 0.75 m and 1.85 m from the preamprespectively. The vertical scale is 0.5 mV /Div, the horizontal scale is 10 ns/Dlv, and
each trace represents an average of 1000 transients. Some residual reflection fromthe far end of the tube can be seen, which arrives closer in time when the source is
farther from the preamp. A variety of transmission line simulations have been
performed to investigate the effects of various termination schemes and to evaluate
attenuation and dispersion in even longer tubes. The results are in general
agreement with the direct measurements given above. Specifically we have
observed attenuation factors of roughly 17% per m in simulations of the
experimental setup described above.
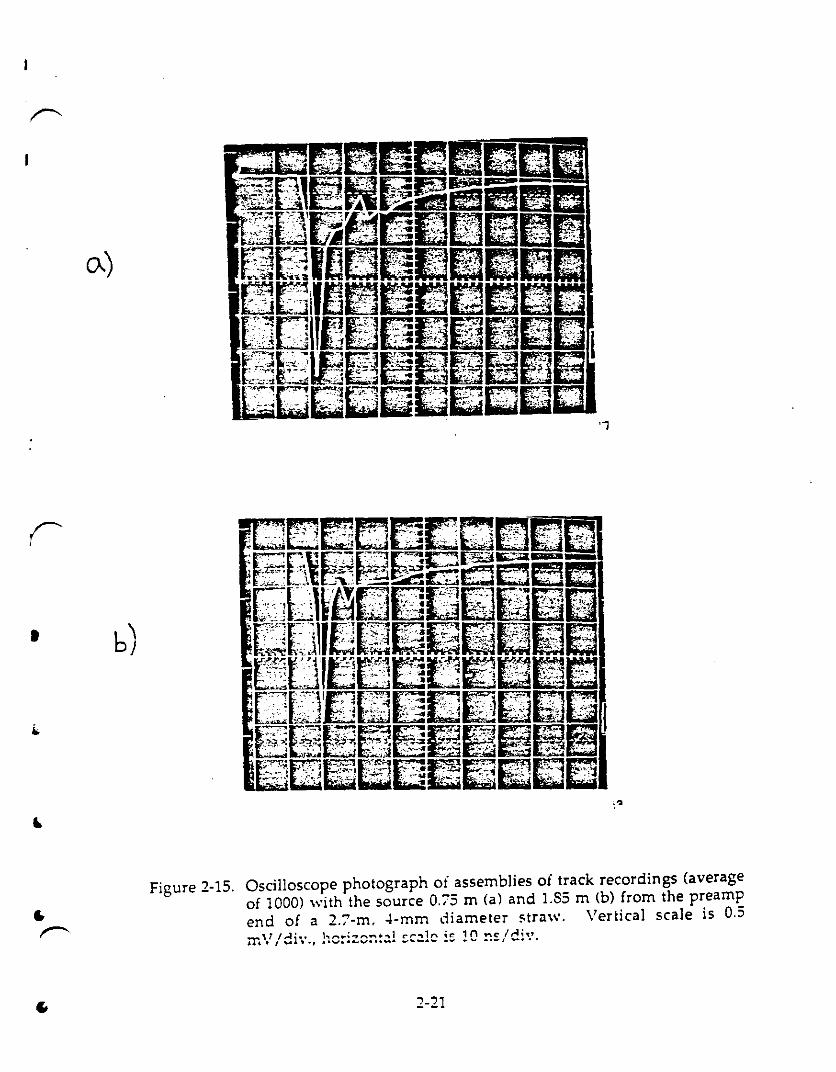
Additional simulations have been performed to evaluate the feasibility of
constructing extremely long straw tubes (6 to 8 meters) with recording preamps atboth ends and a centrally located break in the wire. This break is intended to allow
each half of the tube to operate in isolation for reduced occupancy.
Some results are shown in Fig. 2-16 for an 8-m tube with a central break. Two
tracks are present, one occuring 1 m form preamp 1 and one occuring 20 ns later,
3 m from preamp 2. Figure 2-16(a) shows the signals seen at the preamp inputs, andFig. 2-16(b) shows the simulated outputs using the University of Pennsylvaniapreamp/shaper chips. The break in the wire is modeled as a 1.0 pF capacitorcoupling two isolated sense wires. In practice, the actual coupling capacitance would
probably be very much smaller. A very slight feed through is essentially negligible,and probably overstates the actual amount of feed through by a factor of 10 or more.Both preamp inputs show significant pulse distortion as a result of the open-circuit
. reflections produced at the break. These reflections do not, however, significantly
alter the initial, steep response, and therefore would have little effect on timingmeasurements made using a low threshold. Most of these details disappear after
2-20
t·
r:
•
0.)
Figure 2-15. Oscilloscope photograph of assemblies of track recordings (averageof 1000) with the source 0.75 m (a) and 1.85 m (b) from the p~eamJ:end of a 2.7-m. -i-mm diameter straw. Vertical scale IS 0.::>
11 I~I'H , ,...~~ l r-,..",,1,..;1':' 1n"C' I~;";r~. I'"'" "., _ .. _ _ .. - .- -' _ .
2-21
000\ r-i---------------......-1"pnnt.ouc~.4··
5.4
1.1e·7
.....................
S.·8
0< x < l.:e·7 inc c ::e·8·0.003 < y < 0.001 inc", 5.4
60·8
......................'
: ....
.........2.
o~-----------------------------------------',,:'u~
·5.4
Q}-0.001
·0.00151.
-0.002
·O.OO2S
·0.0030 ::e-8
"pnnt.out:2.3"
,,.,. .......... _-_.__........._-"P/,.3"
o <. _
o< x < l.:e-7 inc • :1:-8-1 < Y < 0.: inc • 0.2
,;••;
iz:•
,•,
......•;,I,•,
.........................~:~:~:::~::.:~::..' ..... .,-
,., ......._......
,.,-
.... ,,-........ I ,0 .'
......~.. ,.,
\I•;;. "
f1 \• •,; .. ./
\ ...1
.....
·0.2
·0.4
·0.6
-0.8
.,oj
1.2e.71.-,8.·860·8.J :----:-'-:----:-'..-:---.......:---......---"-__......Jo
Figure 2-16. Simulated preamplifier inputs (a) and outputs (b) for a 8-m tubewith a central break in the presence of two tracks (see text).
2-22

~ shaping the Penn preamp/shaper circuits. We believe that these simulations
I demonstrate the feasibility of the use of long straw tubes which span the entire
tracking chamber,
2.3.4 Front End Electronics
Combination preamplifier and shaper chips from the University of
Pennsylvania and from Japan's National Laboratory for High Energy Physics (KEK)
have been used to record transients on the 2.i m prototype. Both chips seem to
perform well based on recordings averaged from 1000 transients. Both of these chips
make single-ended ra ther than differential measurements, which exacerbates the
noise coupling problems. The Penn chip redesign which will provide true
differential operation has been delayed and will not be received until October. \\'e
anticipate that this will provide a significant reduction in noise pick-up.-"
2.4 Gas selection and aging study
2.4.1 Gas selection
t
,
•
Due to the short bunch crossing time 06 ns) of the SSC machine, it is
important to use a gas (or a gas mixture) with fast electron drift velocity. It has been
shown that CF4 produces drift velocities larger than 100 micron/ns for the electric
held inside tubes. However, CF4 alone does not produce good spatial resolution, so
it is commonly mixed with hydrocarbon gases, such as methane, ethane or
isooutane to obtain 01 satisfactorv resolution (-100 microns of intrinsic resolution),
For these gas mixtures, in order to obtain an adequate gain (-20,000), the operating
voltage has to be greater than 2,000 volts. Since the wire instability grows as a
function of the voltage squared, it is desirable to lower the operating voltage as
much as possible.
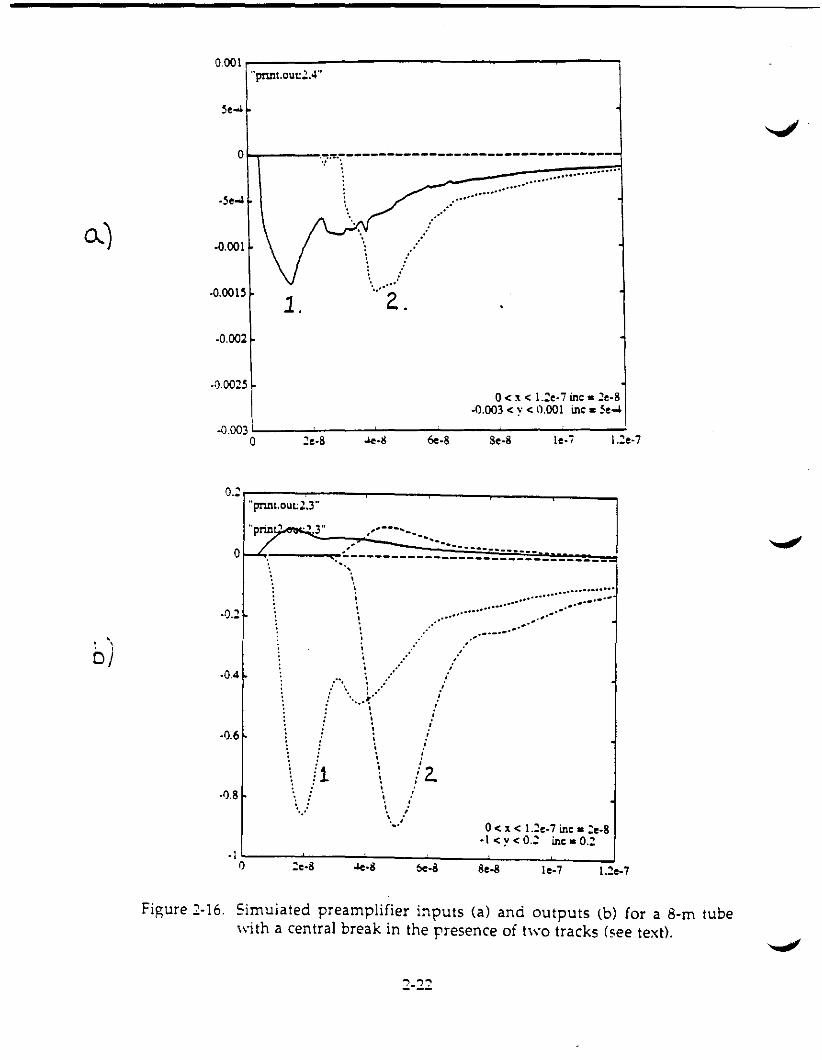
We have discovered that we can lower the operating voltage by -20% without.Jffecting the drift velocity and resolution by adding argon to gas mixtures of CF4 and
hydrocarbon gases. In Fig. 2-1i(a), the time distribution from a 4 mm diameter straw
tube chamber using a mixture of CF4-Ethane (50-50l is plotted. The voltage used for
this gas is 2,200 volts. The width of the distribution is about 20 ns, which
corresponds to a drift velocitv of 100 rnicron zns. In Fig, 2-1i(b), the same is plotted
CF4-Ethane ( 50-50 ), HV = 2200 Volts.
70
60
:0
40
30
:0
10
050
"- J'..
75 100 125 150 !75 200 225 250
TIME (Half nano second)
(a) CF-1-Ethane (50-50); V = 2,200volts.
Ax-Ethane- CF4 ( 33-33-33 ), HV=1850 Volts.
125 150 175 200 225 250
TIME (half nanc second )
(b) Ar-Ethane-CF4 (33-33-33); V = 1,850 volts.
:: t:t30
20.10
050
"l. _"I. ...,.r-
75 100
Fi<7mp )-17. Time distributions ior 4 mm diameter straw tubes (see text).'-'
2-2-1
t
..
•
ior CF4-Ethane-Ar (33-33-33) mixture. The operating voltage for this gas mixture is
1,850 volts jar the same gain. The width is still about 20 ns.
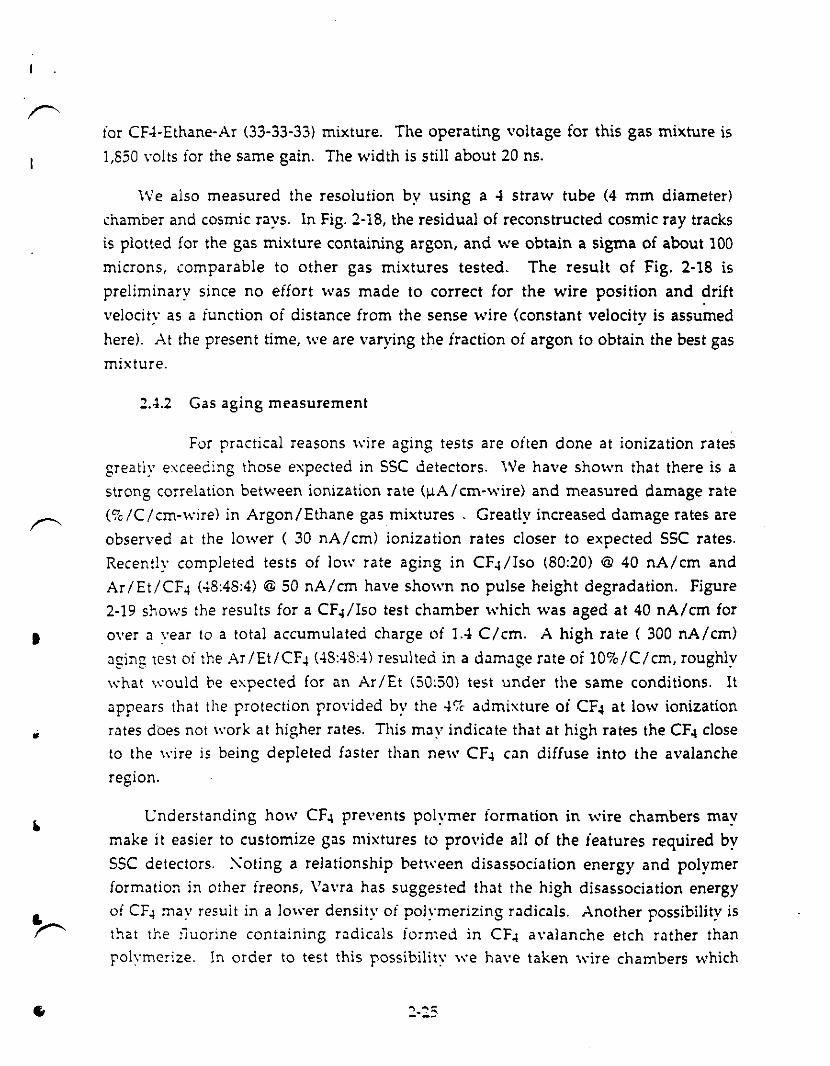
We also measured the resolution by using a 4 straw tube (4 mm diameter)
chamber and cosmic rays. In Fig. 2-18, the residual of reconstructed cosmic ray tracksis plotted for the gas mixture containing argon, and we obtain a sigma of about 100
microns, comparable to other gas mixtures tested. The result of Fig. 2-18 is
preliminary since no effort was made to correct for the wire position and drift
velocity as a junction of distance from the sense wire (constant velocity is assumed
here). At the present time, we are varying the fraction of argon to obtain the best gas
mixture.
2....2 Gas aging measurement
For practical reasons wire aging tests are often done at ionization rates
greatly exceeding those expected in SSC detectors. We have shown that there is astrong correlation between ionization rate (flAlcm-wire) and measured damage rate
(%/Clcm-wire) in Argon/Ethane gas mixtures. Greatly increased damage rates are
observed at the lower ( 30 nAIern) ionization rates closer to expected SSC rates.
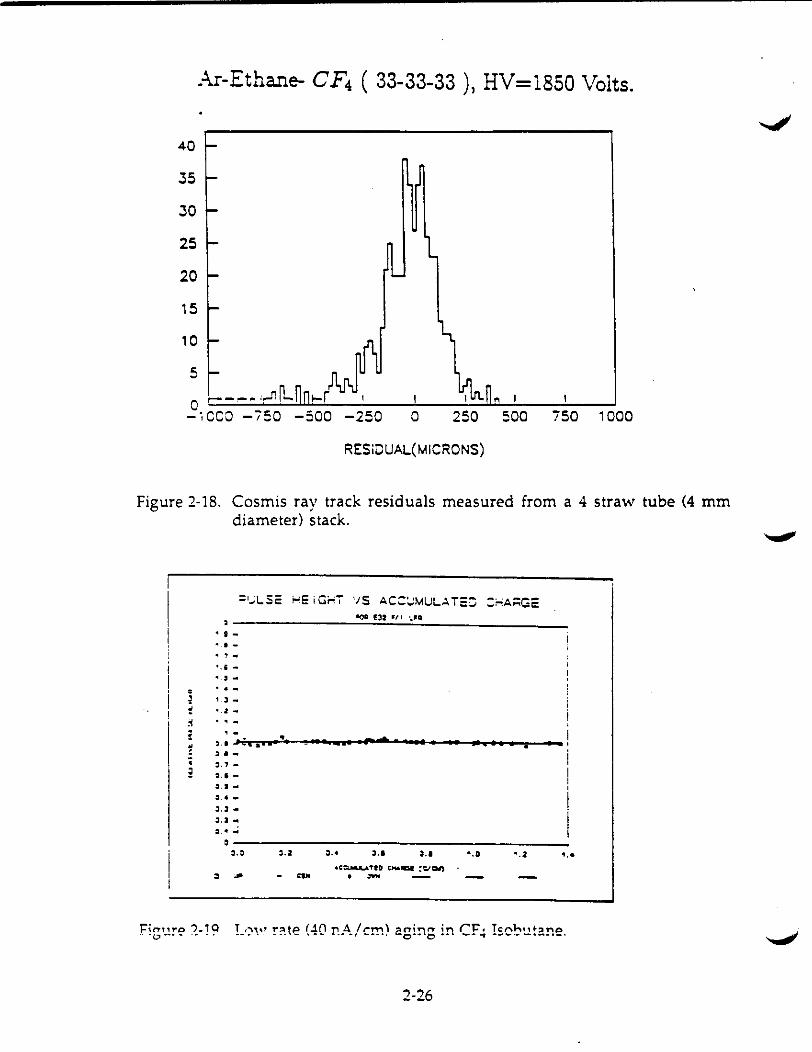
Recently completed tests of low rate aging in CF4/Tso (80:20) @ 40 nAlcm and
Ar/Et/CF4 (..8:48:4) @ 50 nAlcm have shown no pulse height degradation. Figure
2-19 shows the results for a CF4/Iso test chamber which was aged at 40 nA/cm forover a vear to a total accumulated charge of 1.-1 CI ern, A high rate ( 300 nAIem)
aging test oi the Ar/Et/CF4 (..8:48:4) resulted in a damage rate of 109c/Clcm, TOughly
what would be expected for an Ar /Et (50:50\ test under the same conditions. It
appears that the protection provided by the "'7c admixture of CF4 at low ionizationrates does not work at higher rates. This mav indicate that at high rates the CF4 closeto the wire is being depleted faster than new CF4 can diffuse into the avalanche
region.
Understanding how CF4 prevents polymer formation in wire chambers may
make it easier to customize gas mixtures to provide all of the features required by
SSC detectors. \."oting a relationship between disassociation energy and polymerformation in other freons. Vavra has suggested that the high disassociation energyof CF4 may result in a lower density of polymerizing radicals. Another possibility isthat the lluorine containing radicals formed in CF4 avalanche etch rather thanpo!vmerize. In order to test this possibilnv we have taken wire chambers which
Ar-Ethane- CF4 ( 33-33-33 ), HV=1850 Volts.
40
I
750 10001
250 500o
5
o --- ,-~[l h
-;CCO -750 -500 -250
10
15
J5
JO
25
20
RESiDUAL(MICRONS)
Figure 2-18. Cosmis ray track residuals measured from a 4 straw tube (4 mmdiameter) stack.
:'''';LSc !WE iGi-o!i" '"/S AC=~MUL~T=~ :~AI=iGE
-Oil 132 ~'I ","11
.CCUoU...ATtO c....ca ::lCII). ,..
" ,-·.-· , -.. -" •-
~ ·-" -: -.' -, "-i " - ",..I Ii wu.t • •-.. ,., -• .., -••-.. -,., -..,-, .~,,., ,..
0 ... - ,..
•••
0.'
,....
'.1
,
'.1
....
".0 '.'
2-26
I
i
•
..
•
show clear damage (visual observation of deposits on wires, reduced pulse heights,
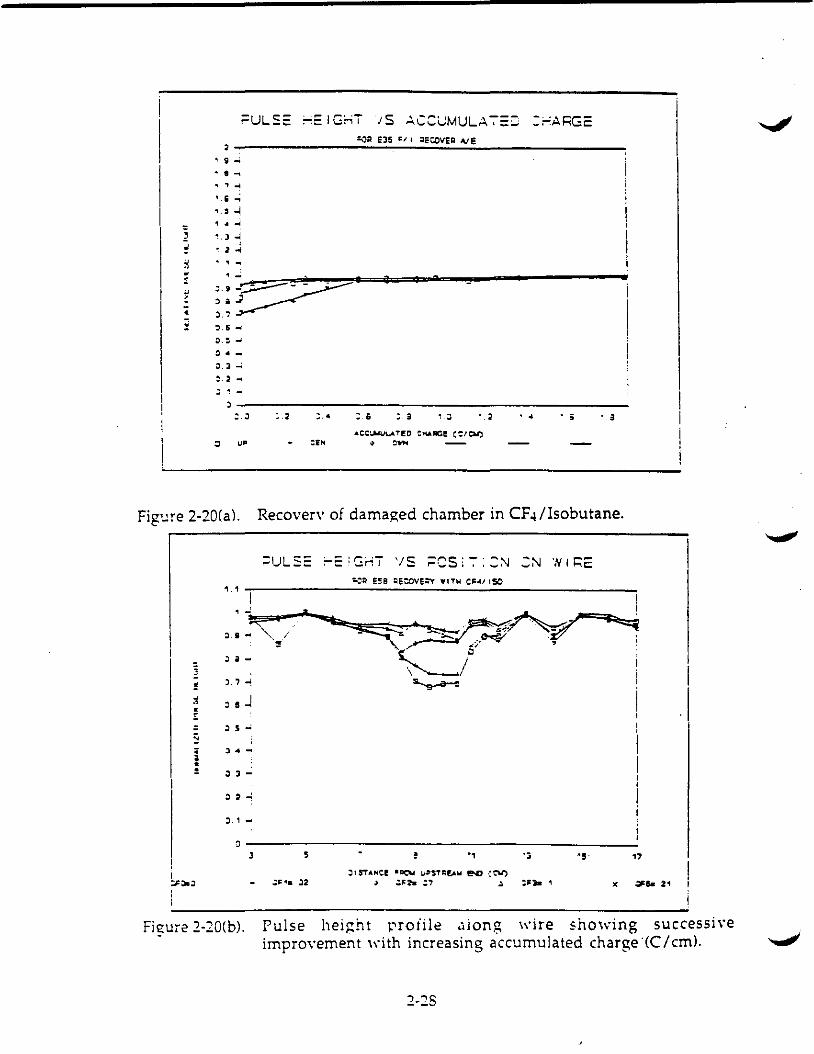
etc.) after aging in ArlEt (50:50) and then "aged" them in a CF./Iso. Figures 2-20(a)
and 2-20(b) demonstrate the complete recovery in performance seen after exposure
in CF4/Iso. Table 2-1 describes the test parameters and results of 5 chambers we have
treated this way. In all but one case virtually complete recovery was seen after 0.5CI ern, The reason for the slow recovery of E34 may be due to the extremely lowionization rate in CF4/Iso or it may be because the damage originally occurred in a
high rate Ar IEt/CEI chamber.
After recovery in CEt/lso the anode wires were observed visually and with anElectron Microscope (E!\1) and with Auger Electron Spectroscopy (AESl. In most
cases the wires appeared very clean and bright gold colored. Even in the partially
recovered E3-4 the deposits seen were substantially less than those seen before
treatment in CF4/1so. E!\1 photographs revealed no significant deposits on E47 andE-48, a very thin fuzzy deposit on E36, and scattered thick deposits on E34. The
results of the AES analysis of fresh wire, two totally recovered chambers. a partially
recovered chamber and an unrecovered chamber damaged in Ar lET are shown in
Table 2-2. The thickness of the surface layer on the fresh wire, E47 and E36 is
calculated from the relative attenuation of the 69 eV and 2025 eV Auger peaks from
the underlying gold wire. The calculation assumes the attenuation is due to a
smooth homogeneous hydrocarbon layer over the gold. The Auger results indicate
that there is very little difference between fresh wire and the wires completely
etched in CF./Iso. Since AES is a surface analysis sensitive to depths of only 50", the
reduced Si content in E3-4 compared to E50 may indicate preferential etching of Si
over C.
2,4.3 Development of new test facilities at TRIUMF
Recently TRIU~1F has started testing chambers which have two strawtubes mounted in a frame similar to chambers of Fig. 2-21. Because of concernsabout electrostatic instability of the wire at the voltages necessary to achieve gains of
approximatelv S X 10' in straw tubes, our preliminary tests are using both CF41lso
and a gas mixture of Ar IEt/CF4 (33:33:331 which has a lower operating voltage.Preliminary measurements have been unreliable due to small random changes inthe anode to cathode distance caused by pressure exerted by the gas tubing on thechamber irame. Tests with an improved (h~T!lber design are just commencing.
.,-.,-- -'
, J ~,• 2 .o!
, .~
~ ., ~
l.& ..;,., ~
, .~
··•~
. , .,...; .. I
~.:~, ," & -I
1,
0.: ...o • _
c. J ....
:: ~ -. ,. ;..: ,• D::'.,--------------------
::.:1
o UD :1'".CCIAolUL.A,T!D el'VolilC! (:/001')
~ ::"'"
Figure 2·20(a). Recover" of damaged chamber in CF4lIsobutane.
;ULSE ~E:G~T \/s ~CSi7;:~ :N WI~E
~=R E~B ~E:OVE;Y WIT~ CF4!,SO
, .-..,•r
,.- I
I.1
, J •
:1. 1 -
"'J! .,5,,-------------- --1
::II $'TAoHe! .~ LI~$Tl::!Aw e-c ,:t\l')
~ ':l=h;7 ~ x
figure 2-20(b). Pulse height pro ri le aion g wire showing successiveimprovement with increasing accumulated charge·(C/cm).
2·:8
Table 2-1. Recovery parameters in CF4IISO 80:20
Aging G<lS Current Initial Recovered Total RecoveryCell Type G<lS Gain Density PIs Ht (relative pulse Charge Rate
I~Cm) height in %) lc/cm) (%/c/cml
E34 ARIET/CF4 5x 10" 0.04 89 93 0.4 10
E36 ARIET 5xl0" 0.27 n 99 1.9 60
E47 , ARIET IxlO5 US 86 98 3.9 35
E48 ~ ARIET 5x I0" 0.63 82 100 2.1 45
E58 3 ARlET 5xl0" 0.20 74 97 0.3 180
Table 2-2. Relative elemental abundance in deposits by AES
Atomic Abundance Relative to Carbon
Deposit
t Cell Description C 5i 5 0 ThicknessI<IS 5iO:!) (A)
Fresh Wire 1 0 0.19 0.14 11
E·+7 ARIET deposit etched by CF..\/Iso 1 0 0.08 n. 11 6
E36 ARJET deposit etched by CF..\llso 1 o 0.06 0.14 33
E3..\ ARJET deposit partially etched 1 n.39 0.12 0.g8 ..E56 ARJET deposit uneiched 1 0.63 0.45 1.7 -10.000
~ .• \'or measured
• 2-29
I\NODE WIREGI\S IN 011\. 20lull GAS OUT
[':[JI~tJ~TlUlLULll ~~TTUTllllILlrrllL1LL
~~I7lff§£!£!O'£!j'tilj;=:::::= 'r r-rr , r , r-r :;r:;}fIICDI
LLL-LLLJ....' ( l I ( I I
.-__1.-------- - ------ 200 mm ------- ..... I--~.~
r~~r;rc1fff\c'c
r),'-'o E
E.'1I 2 I. - co- ... em IW'~ t
~l _----.--- - t-_.- -_ ..-
TYPE I
-~I 1... 6.3mm> > I II 17
CATIIODE\
ANODE
TYPE 2 .L
~:"~m 10mm.... T
TYPE 3 .L6.3111111
~T
( -
Figure 2-21. New radiation damage test cells being developed at TR(UMF.
( (
I.
,
•
2.4.4 Development of test facilities at CEBAF
Due to budgetary constraints, CEBAF decided to limit itself to the
purchase of several items relevant to pursuing studies of gas aging in drift chambersand straw tubes: (1) an MKS Gas Flow Control system (S6.8K), (2) a Laminar Flow
l3enchtop (S2.1K), and (3) a NESLAB Refrigerated Bath Circulator ($1.3K). These are
all essential devices for the aging studies, drift module preparation, and gas mixing
and flow system. A first test drift chamber is expected to be tested in September aitercompletion of this system. We now have an x-ray generator (X-Tech) for generating
ionizing radiation within the test module. Thus the major equipment now exists
for beginning aging studies complementary to those undertaken by TRIUMF.
Future gas aging studies at CEBAF will be performed in cooperation with the work
going on at TRTI.:~1F.
2.5 Other radiation hardness studies
The work by Zhou, et OIL [1] indicates that straw tubes can be expected to operate
at neutron fluences up to at least 1.1x1013 cm-2. Groom [2] estimates that the
neutron albedo in the central tracking region of a typical SSC detector will vary fromabout 4x10¹¹ to 4x1012 cm-2 per SSC-year over the pseudorapidity range 0 $ '!1 s 1.5
the approximate range of the proposed HCTC. Over a nominal ten-year operatinglife and allowing for a possible order-of-magnitude increase in SSC luminosity,HCTC components could thus be expected to see total fluences up to 4x1014 cm-2. To
be conservative, we thus began our testing bv irradiating several straw tube samples
to total fast neutron fluences of about lOI~ to 4xlOl5 em':, to see how much, if any,
degradation in mechanical performance could be measured.
In this first year, the major emphasis was on comparing the mechanical
integrity of the straw tubes themselves, and of glues used in fixing the straw tubes,before and after irradia tions to mixed neu iron-photon fields. The mechanicaltesting was performed at the Duke University physics laboratory and the irradiationswere performed at the North Carolina State University PULSTAR research reactor.
Before the irradiations could be performed. it was necessary to design and build an
irradiation capsule and to perform neutron dosimetry. This effort, which wascommon to both the straw tube and PSF radiation hardness studies, is summarized
in Appendix .'".. The neutron dosimetry results are summarized in Fig. 2-22.
- 10 1-"~~N
10 1E.l:M
=10 1ii:
10 1
3 I~
"":>-.')
r-, "l
i'-,1
I . -,0
• Fast~ Thermal
o 3 6 9 12 15 1B 21 24 27 30
Dist.nco from Bottom of Capsulo lin.)
Figure 2-22. Full-power fast and thermal flux profiles at the capsule center inthe PULSTAR reactor irradiation port Y.
Four separate irradiations of several 4-mm diameter straw tube samples were
conducted on two separate days. The straw tubes were fabricated by Stone Industrialof College Park, MD, from a spirally wrapped ribbon of 50 urn thick mylar film. Theoverlapping seams of adjacent spiral windings were bonded with a polyester
adhesive. The samples were mounted at known positions onto a rod that centers
itself within the irradiation capsule. For all tests, the reactor pool temperature was
between 105°F and 109°F. The test conditions are summarized in Table 2-3.
A single 49-cm straw tube was irradiated for thirty minutes at full power (one
MW). On the basis of the known flux distribution, supplemented by nickel and
cobalt wire dosimeters placed at three locations along the centering rod during theirradiation, the straw received a neutron fluence profile (see Fig. 2-23) that variedfrom about 1.1xl015 to 3.7xl015 cm-2, fast, and from about 1.0xl016 to 2.3xl016 cm-2,
thermal. The gamma-ray dose was estimated to be on the order of 0.5 Mrad. In
order to test the integrity of the seams after the irradiation, the 49-cm long straw was
pressurized to determine its burst strength. The straw was able to sustain a gauge
pressure of 40 psi, which was the maximum to which it was subjected, andrepresents many times the expected gas flow pressure in the tubes.
2-32
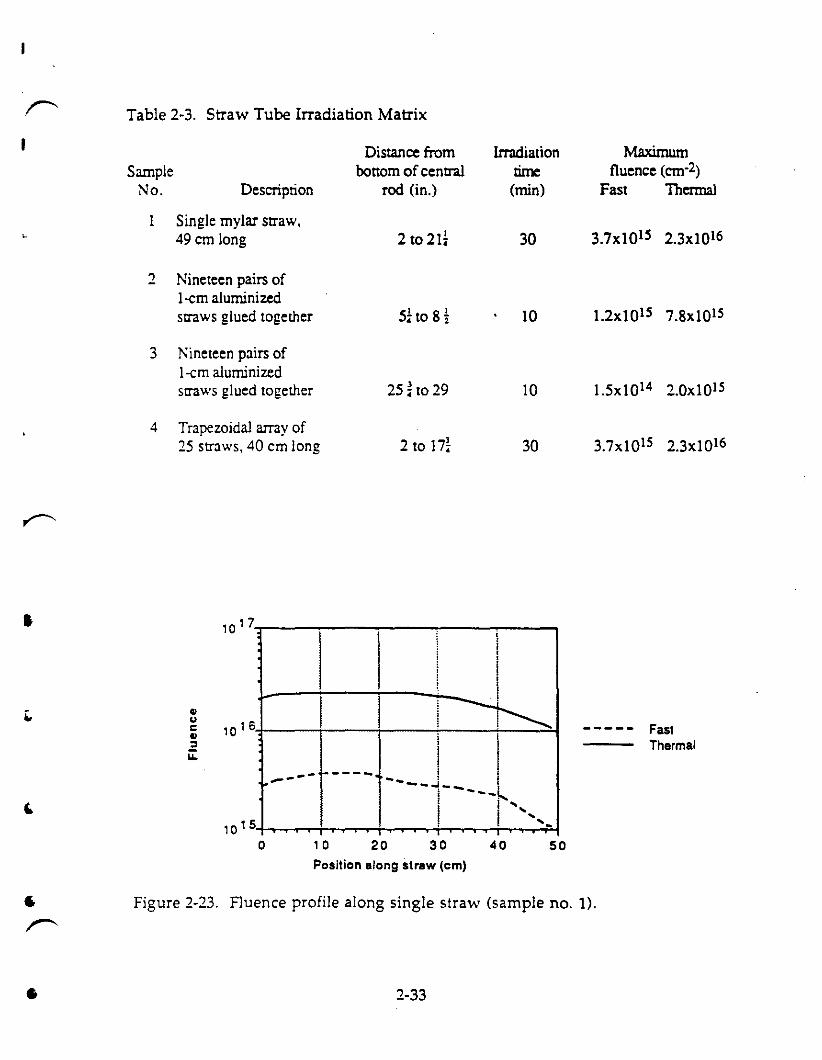
r-" Table 2-3. Straw Tube Irradiation Matrix
Distance from Irradiation MaximumSample bonom of central time fluence (em-2)
No. Description rod (in.) (min) Fast Thermal
1 Single mylar straw,,. 49 em long 2 to 2l~ 30 3.7x101S 2.3xlO16
2 Nineteen pairs ofl-cm aluminizedstraws glued together sh08! 10 1.2x101S 7.8xl01S
3 Nineteen pairs ofl-cm aluminizedstraws glued together 25 ~ to 29 10 l.5xl014 2.0xl01S
4 Trapezoidal array of25 straws, 40 cm long 2 to 17~ 30 3.7xl01S 2.3xl016
I 10' 7."....__-:-__-,-__.....,.. ----,
""c".a...
,0'6+---+--+---+----+---""'-1
----- -----
FastThermal
5040, .
30201 010 1 5,-f-,........~+........~+......~._+~...,....._+~,....,....~
oPosition along straw (em)
" Figure 2-23. Fluence profile along single straw (sample no. 1).
r'
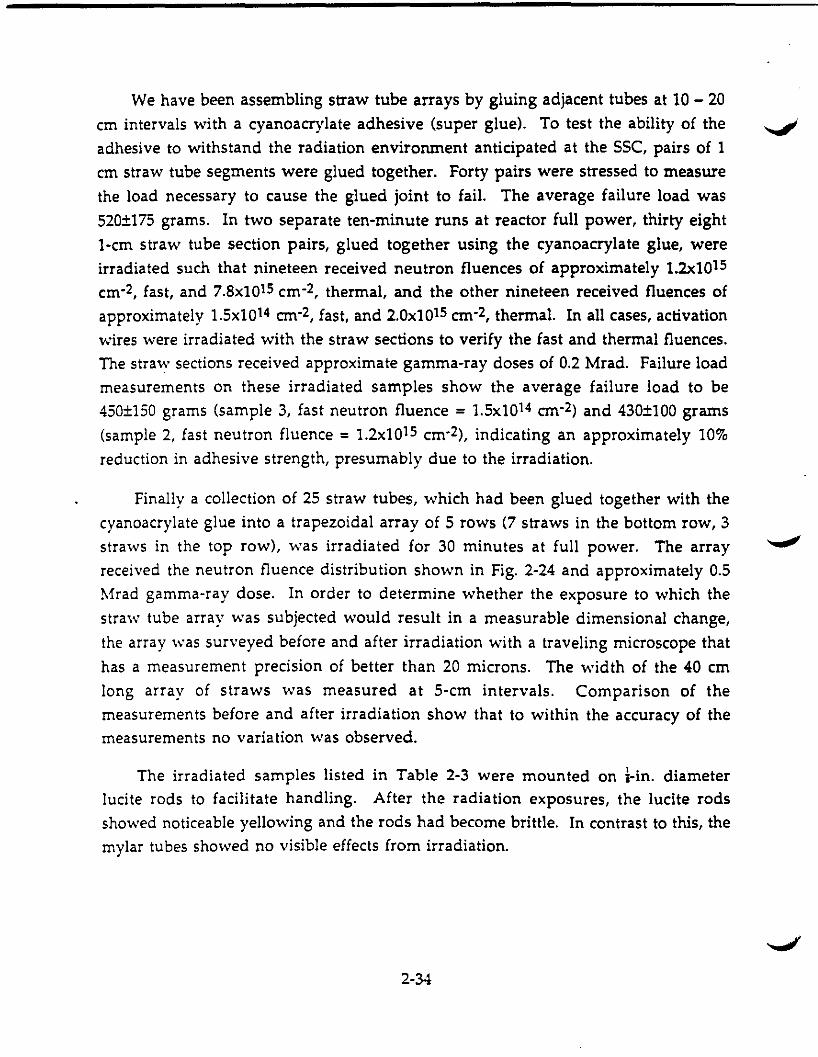
We have been assembling straw tube arrays by gluing adjacent tubes at 10 - 20
cm intervals with a cyanoacrylate adhesive (super glue). To test the ability of the
adhesive to withstand the radiation environment anticipated at the SSC, pairs of 1
cm straw tube segments were glued together. Forty pairs were stressed to measure
the load necessary to cause the glued joint to fail. The average failure load was
520±175 grams. In two separate ten-minute runs at reactor full power, thirty eight
I-em straw tube section pairs, glued together using the cyanoacrylate glue, wereirradiated such that nineteen received neutron fluences of approximately 1.2x10¹⁵
cm-2, fast, and 7.8xI015 cm-2, thermal, and the other nineteen received fluences of
approximately 1.5x1014 cm-2, fast, and 2.0x1015 cm-2, thermal. In all cases, activation
wires were irradiated with the straw sections to verify the fast and thermal fluences.The straw sections received approximate gamma-ray doses of 0.2 Mrad. Failure load
measurements on these irradiated samples show the average failure load to be
450±150 grams (sample 3, fast neutron fluence = 1.5xl014 cm-2) and 430±100 grams
(sample 2, fast neutron fluence =1.2xl015 cm-2), indicating an approximately 10%
reduction in adhesive strength, presumably due to the irradiation.
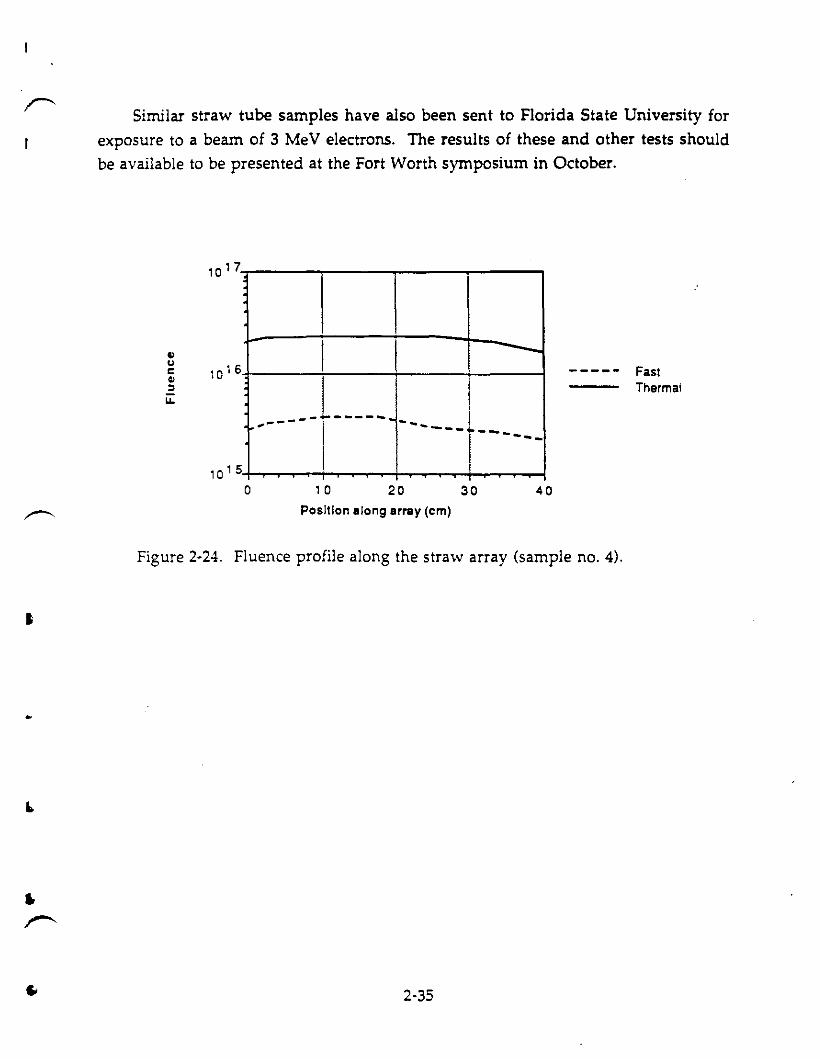
Finally a collection of 25 straw tubes, which had been glued together with the
cyanoacrylate glue into a trapezoidal array of 5 rows (7 straws in the bottom row, 3straws in the top row), was irradiated for 30 minutes at full power. The array
received the neutron fluence distribution shown in Fig. 2-24 and approximately 0.5Mrad gamma-ray dose. In order to determine whether the exposure to which the
straw tube array was subjected would result in a measurable dimensional change,
the array was surveyed before and after irradiation with a traveling microscope that
has a measurement precision of better than 20 microns. The width of the 40 ern
long array of straws was measured at 5-cm intervals. Comparison of themeasurements before and after irradiation show that to within the accuracy of themeasurements no variation was observed.
The irradiated samples listed in Table 2-3 were mounted on ~-in. diameterlucite rods to facilitate handling. After the radiation exposures, the lucite rods
showed noticeable yellowing and the rods had become brittle. In contrast to this, themylar tubes showed no visible effects from irradiation.
2-34
Similar straw tube samples have also been sent to Florida State University for
exposure to a beam of 3 MeV electrons. The results of these and other tests shouldbe available to be presented at the Fort Worth symposium in October.
I -III,
,----------- ... ------t------I
.,"e.,"...
10 20 30
Posillon along array (em)
40
----- FastThermal
I
Figure 2-24. Fluence profile along the straw array (sample no. 4).
2-35
I
•
•
3.0 Scintillating Fibers (Task 2)
The plastic scintillating fiber (PSF) research task associated with the HCTCcollaboration has concentrated on three study areas. These involve: a continuation ofthe PSF fiber and ribbon studies which were started with the original SSC GenericDetector R&D program [3); initial studies of the avalanche photodiode (APD) as afiber readout device; PSF and APD radiation hardness studies. Our fiber and ribbonmanufacture work has concentrated almost totally on the determination of theoptical characteristics of individual fibers. Detailed ribbon work will be part of oursecond year program. All three of the sub-tasks are discussed in more detail in thefollowing three sections.
3.1 Fiber and Ribbon Manufacture
Four industrial concerns are now involved with our PSF research program.These are Bicron (USA), Kurary (Japan), Optectron (France) and NE(GB) [4). Because
of the absence of funding for this particular section of the scintillating fiber task wehave been working this last year with free samples from all four companies. To dateBicron, Kurary and Optectron have all provided us with fiber samples to test. FromKurary we have samples in 0.5 mm circular, 1 m long with a white coating; typesSCSN·81 (standard blue), 3HF (green/radiation hard) and SCSN-81YR3 (red). FromBicron we have samples in 0.5 mm circular, 1.6 m long with a white coating; typesBCF-B, BCF-H and BCF-RH1 (all blue emitters). Optectron has sent a small sample ofstandard blue emitting 0.5 mm diameter uncoated fiber and plan to send usaluminium coated fibers in the near future. For every fiber We receive we measureits light curve on arrival at NU so that any change to the fiber which affects its opticalproperties can be recorded and evaluated. Bicron, Kurary and Optectron all claim thatthey can guarantee a fiber diameter tolerance of under 5% and most likely under 2%.Bieron and Kurary both claim that they can manufacture ribbons wherein theindividual fiber straightness standard deviation is 50 microns or less. Optectron areproposing a totally different ribbon making technique and have not yet given us anytolerance estimates. Kurary have previously provided us with ribbons composed of700 micron by 1000 micron rectangular fibers in which we have confirmed anindividual fiber straightness standard deviation of 70 microns. Manufacturingribbons of rectangular fibers is more difficult than ribbons of circular fibers.
3·1
3.2 Avalanche photodiode readout
3.2.1 Introduction
The purpose of the program at General Electric Canada Inc., Electro OpticsOperations (formerly RCA Inc., Electro Optics) is severalfold:
1. To select a suitable approach to using APD's (Geiger mode or linear mode)with scintillating fibers.
2. Demonstrate the feasibility of this approach with existing APD's and 0.5' mmscintillating fibers.
3. Evaluate the sensitivity of these devices to neutron damage.
4, Develop a prototype diode array which could be integrated with fiber ribbons.
3.2.2 Detection Technique
Although previous analysis has shown that APD's can be used in eitherthe Geiger mode, or in the linear mode in conjunction with a low-noise amplifier,with single-photon detection efficiencies ranging from 20 to 50% (depending on thediode type and operating conditions), it was decided that the operation in the Geigermode was more suitable for this application. This decision was made on the basisthat:
1. The expected "hit" rate of individual fibers is likely to be considerably lessthan 106/sec, so that the long recovery time (200-500 ns) in the Geiger modeis not a serious barrier.
2, The cost of low-noise amplifiers necessary for operation in the linear mode islikely to be prohibitive.
3. Diode gain uniformity is much less critical in the Geiger mode than in thelinear mode.
4. The signal out of the diode in the Geiger mode (l08-109 electrons in a fewnsec) is sufficient to drive a son line with no further amplification.
5. The expected chip cost in quantity (a few dollars/chip) is expected to be smallcompared to the packaging cost (estimated to be $lS·$20/channel).
3-2
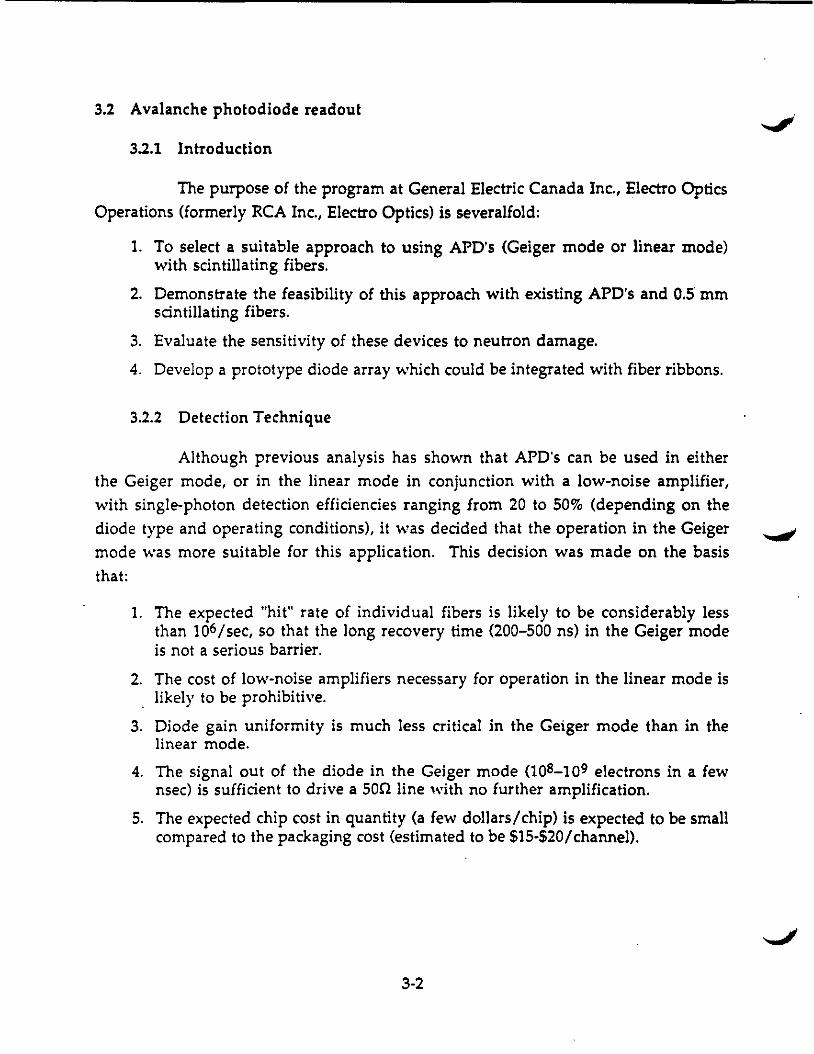
r"> 3.2.3 Feasibility Demonstration
I As a first step to demonstrate feasibility of this mode of operation, anumber of standard product APD's (C30921S) were modified for this application. Thestandard device is designed for use with optical fibers and consists of a 0.5 mrn APDand a 250 urn diameter light pipe eN.A. =0.55) which is accessible on the outside ofthe package and which conducts the light to within a few thousands of an inch of thediode surface (see Fig. 3-1). The modifications were to replace the 250 um light pipewith a 500 urn diameter light pipe and to AIR coat the diode for good response in theblue-green range. It should be pointed out that this experiment was fordemonstration only, it is not a particularly good design in that losses due tomisalignment of the light pipe and detector could be as high as 30-40%.Furthermore, good detection efficiency depends on good coupling from the fiber tothe light pipe. Five (5) of these devices were delivered to Northeastern Universityand tested with scintillating fibers. These devices had relatively low dark count rates(5000-10000 cps at VB+l0 V and 22°C). The detection efficiency was found to be about90% of that of the PMT used for comparison when biased at VB+l0 V. Betterdetection efficiencies should be achievable at higher bias voltages, and by using adiode large enough to collect all the light from the fiber.
3.2.4 Radiation Damage Tests
I
•
Twenty (20) of the modified C30921S units were delivered to QuantumResearch Services for neutron damage studies. Preliminary results confirm previousmeasurements at CERN that the dark count rate at room temperature increases byabout a factor of 3 for a fast neutron fluence of about 5xl06 cm-2 (see Section 3.3.3).
3.2.5 Prototype Array Experiment
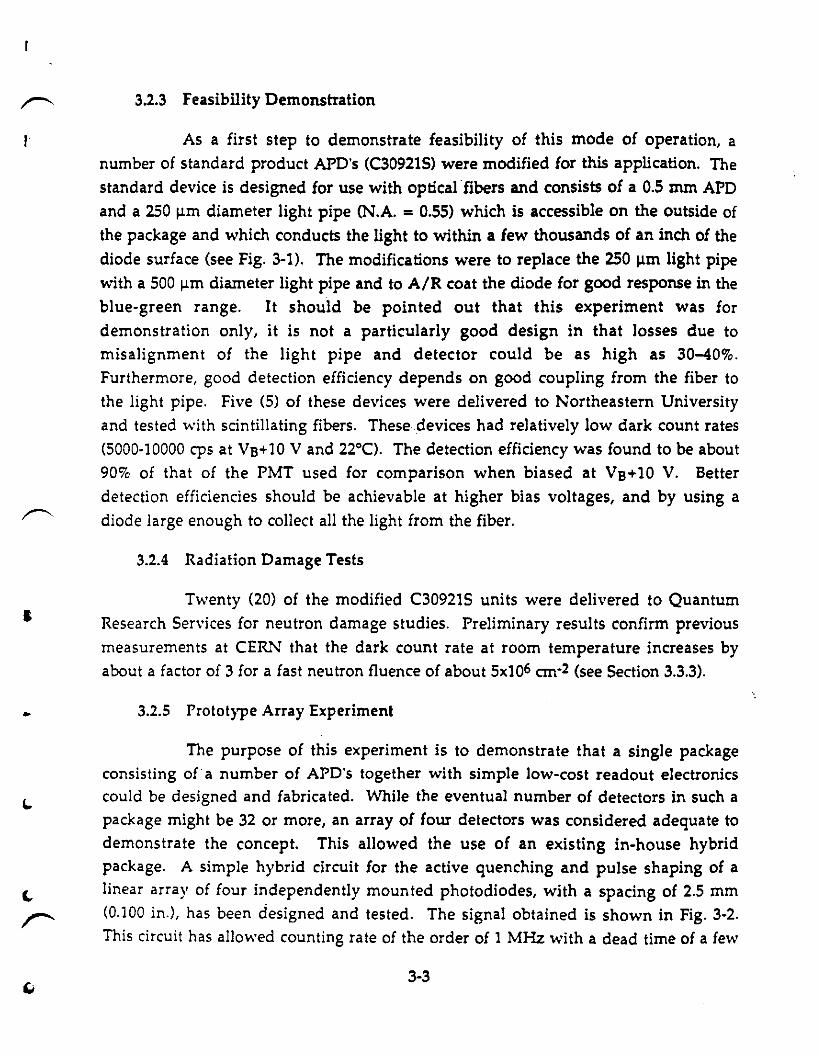
The purpose of this experiment is to demonstrate that a single packageconsisting of a number of APD's together with simple low-cost readout electronicscould be designed and fabricated. While the eventual number of detectors in such apackage might be 32 or more, an array of four detectors was considered adequate todemonstrate the concept. This allowed the use of an existing in-house hybridpackage. A simple hybrid circuit for the active quenching and pulse shaping of alinear array of four independently mounted photodiodes, with a spacing of 2.5 mm(0.100 in.), has been designed and tested. The signal obtained is shown in Fig. 3-2.This circuit has allowed counting rate of the order of 1 MHz with a dead time of a few
3-3
LIGHT PIPE
PHOTODIODE
Figure 3-1. Cross-section of C30921S package. Light pipe core diameter anddetector sensitive diameter are both 0.5 mm.
:~
;5.21 mV/div -321.21 mV 221.21 ns/div -621.2121 ns
I I I
!\ !I ! i 1 I
i \ i I I I I\!I I !v . I
I I
Figure 3·2. Signal obtained with prototype of hybrid circuit.
3-4
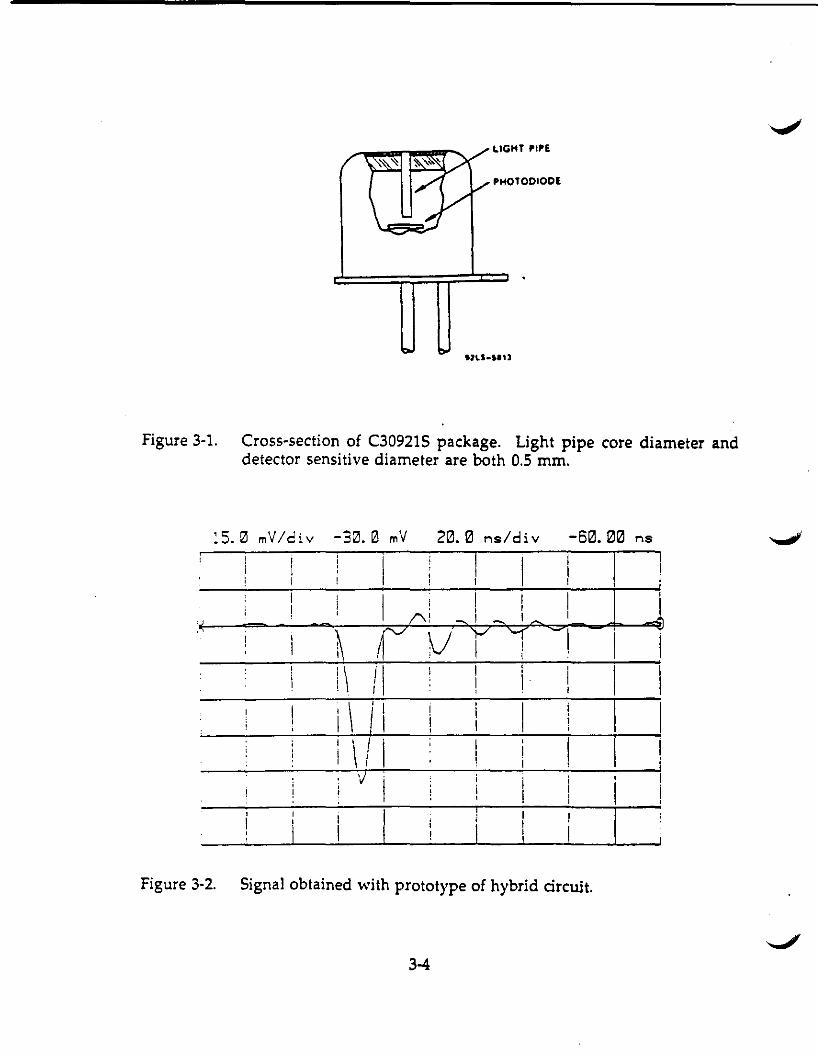
hundreds of nanoseconds. The ensemble, diodes, pulse shaping and reset circuit, fits
in a small package of 3.5 x 13 x 33 nun and is displayed in Fig. 3-3. The free space on
the right has been reserved for improvement as may be required in the future - i.e.,to increase the counting rate using an integrated internal and individual reset.
Manufacturing of these modules is in progress and it is expected than one will be
delivered to Northeastern University shortly.
3.3 Radiation hardness studies
Four collaboration members were involved in radiation hardness studies of PSF:CEBAF, Florida State University (FSU), North Carolina State University (NCSU), and
Quantum Research Services. Although the various investigations were closely
coordinated with each other and with Northeastern University, the geographicdistribution of the institutions necessitated that the work be carried out at three
separate locals: Virginia, Florida, and North Carolina. The following discussion
summarizes each of these efforts.
33.0 1'11'1
I:3.2:'"'\1'"'1.
,
•1£ r'V" I I~~c
~l mrcIf ~~B-
II-
~-/ ~.......-:=r "li.li=f"III . I"~~.~~
,Ia
RFUDiode 4Diode 3Diode 2Diode 1RFUResetH.V.
34MI[[J= TI= 0 = JJF====="- '-- 4 APDs .. light g"'ide
GViciling pins distonce cente'" 'to cente:r"l 0.100"<2.54 1'11'1)
Figure 3-3. Schematic drawing of the package for a linear 4 elementphotodiode array showing the photodiodes and the associatedelectronics.
3-5
3.3.1 CEBAF
At present, this is an additional and unfunded project for the CEBAFgroup within the context of the HCTC collaboration. However, the relevant
experience of the group and the importance of this topic have driven us to continuesome past experiments at a "low-budget" level. As in the past, the group iscontinuing to carry out high-dose-rate irradiations of new and interesting scintillatingfiber formulations. The results of this group's previous studies have been reportedelsewhere [5-8]. We have contacts with all the major scintillating fibermanufacturers: Kuraray <formerly Kyowa), Bicron, Nuclear Enerprises, andOptectron. In consultation with these manufacturers, we are obtaining samples oftheir most innovative formulations for appraisal. The selection of fiber samplesreflects a broad spectrum of current formulational interests: (1) Kuraray 3HF, Bicron3HF, Bicron RH-l, Bicron PIT-based fibers (both blue- and green-emitting), and (2) aselection of Bicron experimental variations on past fibers, plus the first set of NuclearEnterprise fibers (PVT-based NE-l02 formulation).
We have constructed a fiber scanner designed to measure the attenuationcharacteristics of fibers up to 4 meters in length. Figure 3·4 is a schematic of thisdevice. It represents a low cost method of obtaining reasonable attenuationcharacteristics of scintillating fibers. Figure 3·5 displays the attenuation curves of arepresentative group of fibers obtained with this scanner. Radiation damage affectsboth the attenuation and light output characteristics of the fibers. Since our currentsetup does not allow for highly reproducible optical coupling of the fiber to thephototube, a method (simulated in Fig. 3-6) has been devised by which thescintillation losses and attenuation changes can be decoupled. By shielding the first20 em of the fiber from irradiation, the light output of the shielded portion can beassumed to be identical before and after irradiation. Hence the post-irradiation datacan be renormalized to the pre-irradiation data for the first 20 em of fiber. In this way,the scintillation losses can be effectively decoupled from the attenuation changes.
We are also conducting low-dose-rate irradiations of a variety of 1 m length, 1mm diameter scintillating fibers. These formulations cover a range of parametervariations including type of base (polystyrene versus PVT), fluors, and theirconcentrations. Furthermore, they have been split into two identical groups: one in aflowing air (oxygen-containing) atmosphere, and the other in a flowing argon(oxygen-free) atmosphere. Past studies have indicated that at high dose rates, oxygen
3-6
PMI' FRONI\flEW
.::::;zzzz;; k
TOP \flEW
m~
STEPPERMOTOR
, 1h- · !
~~-,:;.
I
X-RAYTIJBE
Figure 3-4. Scintillating fiber scanner.
• 1 .
5040302010.01------------
oDistance to PMT (in)
Figure 3·5. Some fiber attenuation data measured on CEBAF scanner.
3·7
. __ - .._.._-_.._---_._-_._-\
.\
...__....._-_.,
..._-----j
I-:-------------~Relative :.Output
Post-imdiation
15050 100Distance (em)
.1-------------o
Figure 3-6. Change in output and attenuation after irradiation
is an important element in the recovery of the scintillator to some residual level of
damage. However there have been indications (in acrylic scintillator) that at a
sufficiently low dose rate, oxygen can actually increase the level of damage over what ~
would be observed at a high dose rate (after recovery). It is critically important to
evaluate the role of oxygen in situations with a more realistic dose rate. The current
(first) experiment uses the facilities of the University of Virginia Reactor Facility. A
set of 60Co gamma rod sources is used to irradiate the fibers (in a water pool) at a rate
of 700 rads/hr. The irradiation was started in mid-July (1990) and will be terminated
in mid-September (1990) for a total dose of 1 Mrad. In addition to the dose rate checks
made by the University of Virginia personnel, numerous samples of radiochromicdye film have been included in the sample holders. These will provide an accuratecross check of the absorbed dose. A full report of this experiment will be made at theupcoming Symposium for Detector Research and Development for the SSC (October
15-18, 1990 at Fort Worth, Texas).
In addition to these projects, we have had, in the past few weeks, the opportunityof running some preliminary tests of the 256 channel Hamamatsu H4140 phototube.By instrumenting 100 central channels, and then grouping these four at a time to
form 25 outputs. we have observed for ourselves the significant decrease in crosstalk
3-8
t
I
&
when the PMT is placed in an axial magnetic field (up to 1 kgauss in our case). Some
preliminary timing tests at William and Mary (by Charles Perdrisat) indicate a timing
resolution of 1.6 ns. Shortly, we will obtain the 64-channel H4139 tube for longer
term tests. This latter will probably be more appropriate for a CEBAF-spec:ific tracking
application which will use scintillating fibers. An aspect that we wish to test is the
center-of-cluster method of obtaining good position accuracy and resolution as this is
supposed to provide good position resolution quickly and cheaply (as opposed to the
center-of-gravity method).
3.3.2 Florida State University
Plastic scintillating fiber is a serious candidate to be the active tracking
medium at the SSC because of its triggerability and speed. Plastic scintillator in plate
form with either plate wave shifter or fiber wave shifter is a leading contender to be
the active medium for the barrel calorimetry at the SSC, both because of its speed and
its ability to achieve compensation without uranium. Both applications critically
depend on the ability of the active medium to receive large doses of radiation without
degrading instrument performance to an unacceptable degree.
In November 1988, Florida State University and the University of Florida
initiated a collaboration to investigate radiation damage to plastic scintillator. During
the collaboration, which lasted until December 1989, we developed techniques for
controlled irradiation at the FSU 3-MeV electron linac and did comparative studies of
the radiation resistance of scintillating fibers as well as composition and temperature
effect studies. These results were reported at the Tuscaloosa Workshop on
Calorimetry for the SSC, March 1989, at the Berkeley Meeting on the Radiation
Survivability of Scintillating Calorimeters, July 1989, Berkeley, California, (SSC-N650), and in the literature (9).
Radiation damage manifests itself as a decrease in the attenuation length and adecrease in the local light yield. Our fiber investigations have led to partial remedies
to both problems. The first fruitful result was the demonstration that the use of a
large Stokes' shift fluor results in tremendous advantages, namely, a tenfold increase
in radiation hardness and very long attenuation lengths. 3-HF, the first such fluor tobe used, was originally investigated by FSU chemists. Its use as a fluor and the
expected advantages to be accrued were first suggested by S. Majewski, who recognized
::'a: ~t:!iz::1£ long wavelengths would by-pass color centers in 3 d3maged plastic base,
3-9
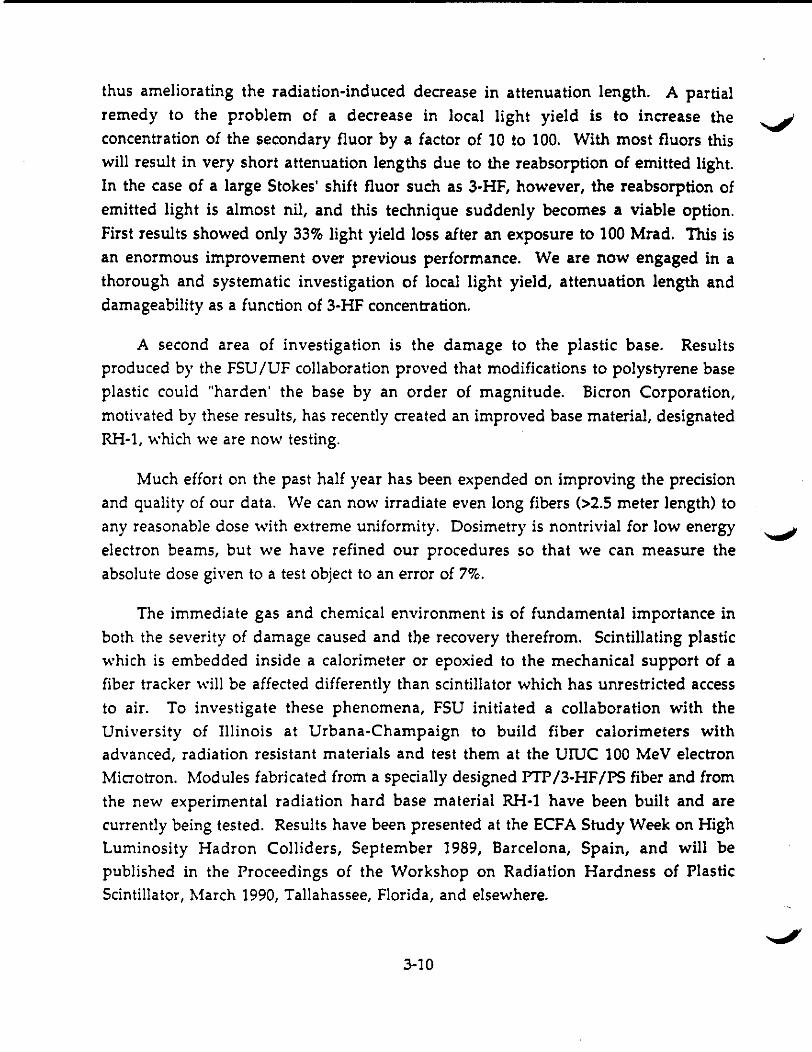
thus ameliorating the radiation-induced decrease in attenuation length. A partial
remedy to the problem of a decrease in local light yield is to increase the ......"concentration of the secondary fluor by a factor of 10 to 100. With most fluors thiswill result in very short attenuation lengths due to the reabsorption of emitted light.In the case of a large Stokes' shift fluor such as 3-HF, however, the reabsorption ofemitted light is almost nil, and this technique suddenly becomes a viable option.First results showed only 33% light yield loss after an exposure to 100 Mrad. This isan enormous improvement over previous performance. We are now engaged in athorough and systematic investigation of local light yield, attenuation length anddamageability as a function of 3·HF concentration.
A second area of investigation is the damage to the plastic base. Resultsproduced by the FSU/UF collaboration proved that modifications to polystyrene baseplastic could "harden' the base by an order of magnitude. Bieron Corporation,motivated by these results, has recently created an improved base material, designatedRH-l, which we are now testing.
Much effort on the past half year has been expended on improving the precisionand quality of our data. We can now irradiate even long fibers (>2.5 meter length) toany reasonable dose with extreme uniformity. Dosimetry is nontrivial for low energy -oJelectron beams, but we have refined our procedures so that we can measure theabsolute dose given to a test object to an error of 7%.
The immediate gas and chemical environment is of fundamental importance inboth the severity of damage caused and the recovery therefrom. Scintillating plasticwhich is embedded inside a calorimeter or epoxied to the mechanical support of afiber tracker will be affected differently than scintillator which has unrestricted accessto air. To investigate these phenomena, FSU initiated a collaboration with theUniversity of Illinois at Urbana-Champaign to build fiber calorimeters withadvanced, radiation resistant materials and test them at the UIDC 100 MeV electronMicrotron. Modules fabricated from a specially designed PTP13-HFIPS fiber and fromthe new experimental radiation hard base material RH·l have been built and arecurrently being tested. Results have been presented at the ECFA Study Week on HighLuminosity Hadron Colliders, September 1989, Barcelona, Spain, and will bepublished in the Proceedings of the Workshop on Radiation Hardness of PlasticScintillator, March 1990, Tallahassee, Florida, and elsewhere.
3-10
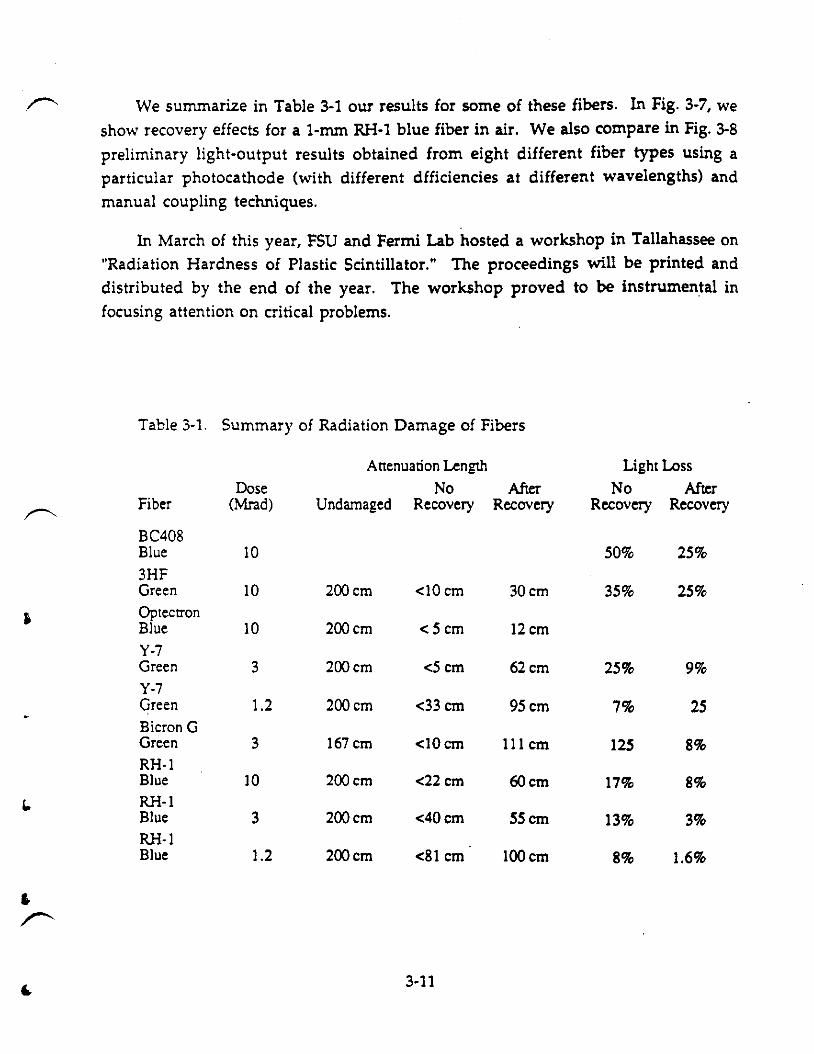
We summarize in Table 3-1 our results for some of these fibers. In Fig. 3-7, we
show recovery effects for a 1-mm RH-1 blue fiber in air. We also compare in Fig. 3-8
preliminary light-output results obtained from eight different fiber types using a
particular photocathode (with different dfficiencies at different wavelengths) and
manual coupling techniques.
In March of this year, FSU and Fermi Lab hosted a workshop in Tallahassee on
"Radiation Hardness of Plastic Scintillator." The proceedings will be printed and
distributed by the end of the year. The workshop proved to be instrumental in
focusing attention on critical problems.
Table 3-1. Summary of Radiation Damage of Fibers
Attenuation Length Light LossDose No After No After
Fiber (Mrad) Undamaged Recovery Recovery Recovery Recovery
BC408Blue 10 50% 25%3HFGreen 10 200em <10cm 30em 35% 25%OptectronBlue 10 200em <5cm 12cmY·7Green 3 200em <5cm 62 em 25% 9%Y-7Green 1.2 200em <33cm 95 em 7% 25BicronGGreen 3 167 em <10cm III em 125 8%RH·IBlue 10 200em <22 em 60 em 17% 8%
I. RH-lBlue 3 200em <40 em 55 em 13% 3%RH-lBlue 1.2 200em <81 em 100em 8% 1.6%
,»<
3-11
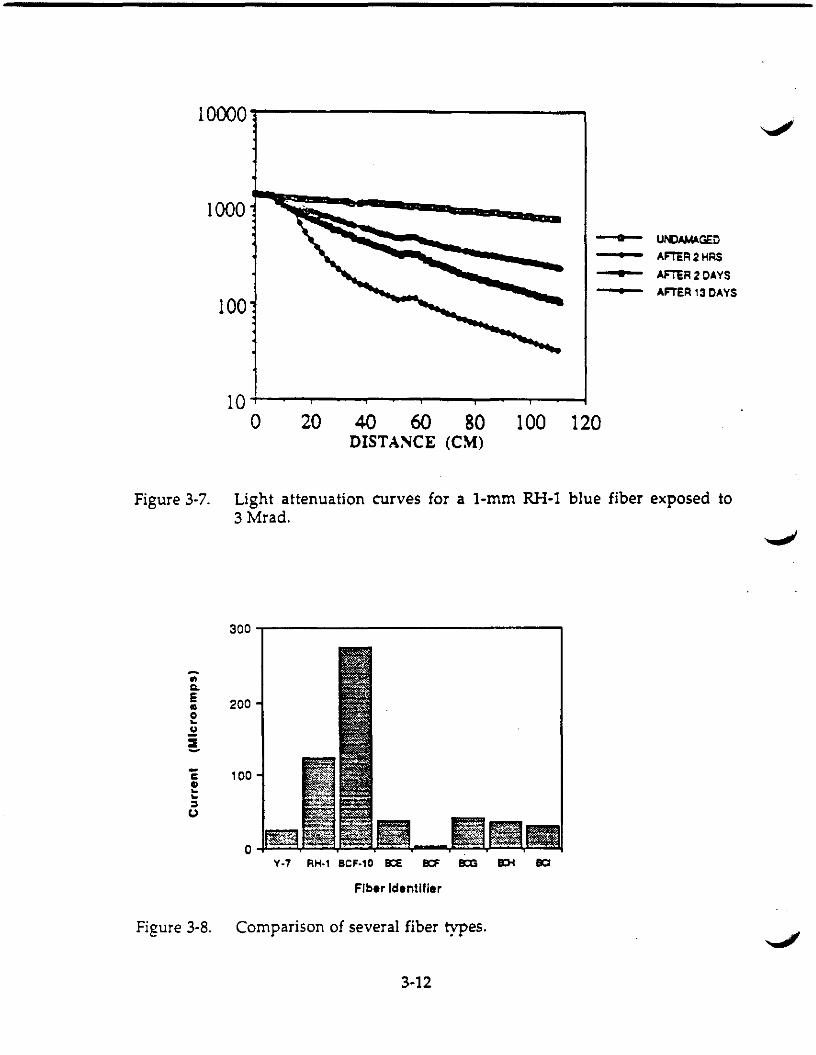
10000~------------'
1000
100
II
II
UI'«).IMAGED
AFTER2HRS
AmR2 OAYS
AFTER' 3 OAYS
100 12020 40 60 80DISTASCE (CM)
1O+-.....-.....--..,......-.,....-....----r--~
o
Figure 3·7. Light attenuation curves for a t-mm RH-l blue fiber exposed to3 Mrad.
300 ....----------------,
-.....! 200e.!:!!.
C 100II~
~
=u
ay.? RH.' BCF·'O Ea BCF Il:G EDi BCI
FIber Identifier
Figure 3-8. Comparison of several fiber types.
3-12
I
r 3.3.3 North Carolina State University/Quantum Research Services
I Ten GE Electro Optics modified C309215 APO's were irradiated in theNCSU PULSTAR reactor at low power (1 watt), at preset positions within the capsule
described in Appendix A, for various times from 10 to 240 sec. The following datawere collected before and after irradiation: breakdown voltage, VB; dark count rate,rd, at VB+10 V; and dark current, 10, at VB-I0 V. Room temperature at the time ofdata collection was 72±1°F. An ultra-stable power supply and a high-precisionvoltmeter were used to record the variation inherent in dark count rate as the biaswas varied by ±O.S volts about the nominal VB+I0 V. This variation, and thestatistical count-rate variances, were used to estimate the uncertainty in the ratio, R,
of dark count rate after irradiation to that before.
The APD's were loaded inside the aluminum sample-holder tube (see AppendixA) at two selected levels using spacing rods; flux foils were inserted with the APO's.Since exposure times were typically rather short, the following irradiation procedurewas used:
I
•
• The sample holding capsule was suspended by a string and lowered intovertical exposure port Y within the reactor pool.
• The capsule was allowed to drop by gravity to the bottom of the port; a presettimer was started as the capsule reached the core, as evidenced by thereactivity change displayed on the reactor instrumentation.
• When the preset time expired, the operator scrammed the reactor,immediately shutting off the neutron supply.
• The capsule was withdrawn to the top of the pool and the samples removed.
The results of the ten exposures are summarized in Table 3-2. We plot in Fig. 3·9 thedark count ratio, R, as a function of fast fluence for nine of the ten exposures(excepting no. 7). The results indicate a damage threshold at approximately 4x10⁶
cm-2, as evidenced by a rapid increase in R above the no-damage value of unity,indicative of higher dark count rates due to radiation damage. The dark currents, onthe other hand, were unaffected by the neutron exposures. Estimates of gamma-raydose received during the irradiations are a few rads or less.
3-13
Table 3-2. Results of neutron irradiations of avalanche photodiodes
Test FJuence (cm·2) Dark countrate Dark count Dark currentNo. Fast Thermal Before After Ratio, R Ratio
I J.lxl06 1.6xl07 4778 5383 1.13 0.86
2 2.2x10⁶ 3.2x10⁷ 6052 5785 0.96 1.00
3 5.5x10⁶ 8.0x10⁷ 6900 8993 1.30 0.90
4 5.5x10⁶ 8.0x10⁷ 5776 21,255 3.68 1.00
5 i.ixio? 1.6xl08 5798 21,055 3.63 1.10
6 1.8xl07 2.6x10⁸ 7693 24,342 3.16 0.94
7 2.6x10⁷ 5763 45,724 7.93 1.00
8 2.6x10⁷ 3.8x10⁸ 6836 39,556 5.79 0.87
9 1.6x10⁷ I.3xl08 5500 60,700 11.04 0.86
10 3.2x10⁷ 2.6x10⁸ 5190 68.062 13.11 0.83
15
.sOi 10-'E"0..
J<t 5-IIQ
i I
•! i I
• • •10 7
Fast fluanca (cm·2)
Figure 3-9. Variation with fast neutron fluence of the ratio of dark count rateafter irradiation to that before irradiation.
3-14
I
..
,r>
In Test no. 7 the APO was covered entirely by cadmium, which filters outthermal neutrons (the cadmium cutoff is near 0.3 eV). The fact that the dark countratios (7.9±O.9, for test 7, and 5.8±O.7, for test 8) represent comparable damage indicatesthat the damage is due to fast neutrons, which is consistent with the fact that thesilicon elastic scattering cross section exhibits a significant increase at and above 0.15MeV. We plan in the next month to perform a few more tests in order to confirm thedamage threshold at about 4xl06 cm-2, fast fluence.
A study of long-term recovery (over months) of the damaged APO's isunderway. Quantum personnel are testing the damaged APO's at approximately onemonth intervals. Early indications are that damaged APO's do experience modestrecovery 00-20% reduction in dark count rate in one month) if they receive nofurther exposure.
The major conclusion to be drawn is that APO's operated in the geiger mode atroom temperature begin to exhibit noticeable radiation damage at fast fluences ofapproximately 4xl06 cm-2. Thus, if used in the HCTC, they would likely have to beshielded, since annual fluences inside the central tracking region will be order of107 cm-2 or greater, even at zero pseudorapidity. If the APO's can be housed outsidethe calorimeter, coupled to the PCF's by optical fibers, such shielding could easily beachieved at modest cost.
Irradiation of PSF will be performed in September. In the first test, at least twofibers from each of three types will be irradiated at the same time to total fluences ofapproximately 5xl012 cm-2, fast, and 3xl013 cm-2, thermal. A sample holder, as shownin Fig. 3-10, has been constructed that can hold up to eight fibers. In order to obtain anapproximately uniform exposure, the 60-in capsule will be withdrawn halfwaythrough the irradiation, rotated by 180·, and reinserted in the irradiation port for thesecond half of the irradiation. The irradiated fibers will be returned to NortheasternUniversity along with one unirradiated fiber of each type and light attenuationcurves will be measured. More extensive testing of PSF is planned for project year 2.
3-15
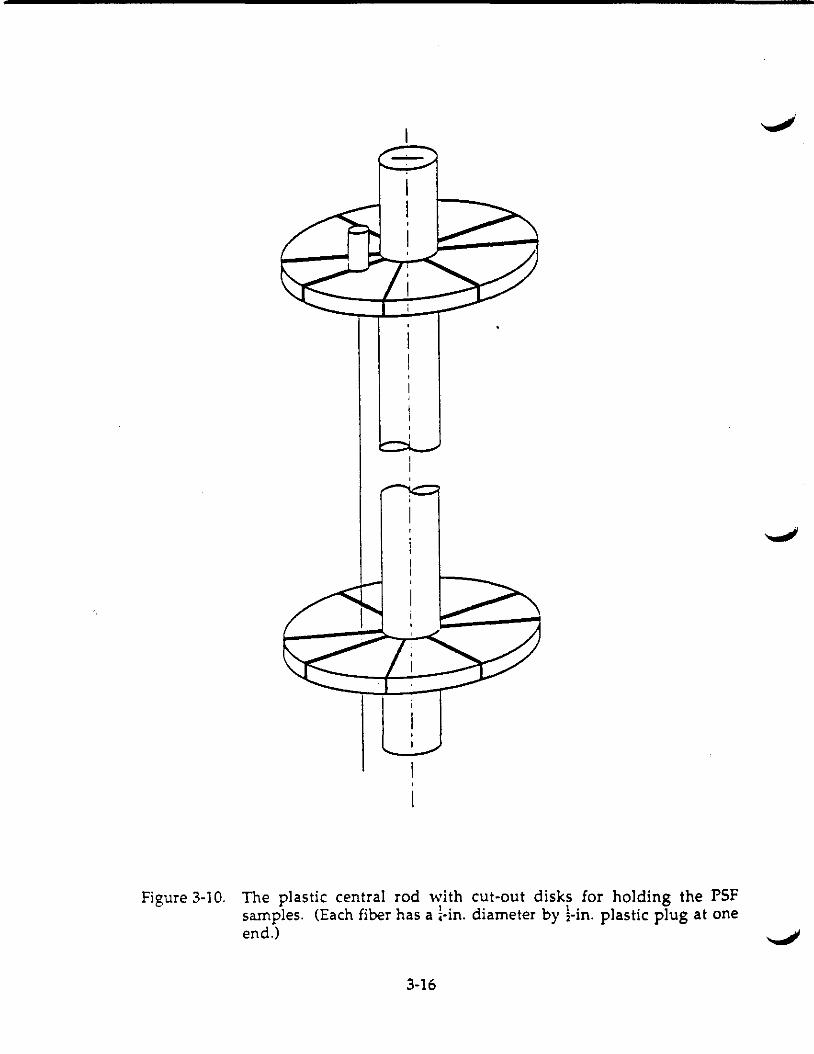
Figure 3-10. The plastic central rod with cut-out disks for holding the PSFsamples. (Each fiber has a loin. diameter by I-in. plastic plug at oneend.)
3-16
4.0 Mechanical Engineering (Task 3)
Advancement of the Hybrid Central Tracking Chamber (HCTC) from thedevelopment stage to a full scale SSC version requires substantial input from theengineering community. The mechanical engineering of the HCTC will, to a greatextent, determine the accuracy and reliability of the measurements obtained fromthis device. In FY1990, a significant effort has been placed on the design of thesupporting structures for the components of the HCTC. Our analysis shows that avery low density support structure based upon large carbon composite cylindersappears desirable over alternative approaches.
The mechanical engineering goals for FY1990 were to evaluate the variousfabrication and assembly methods and to determine their feasibility and costeffectiveness. Four specific components in this process have been addressed withregard to how they measure up to required criteria. The first item is the overallsupport for the tracking components of the HCTC. This is called the stable basecylinder. It is basically a full length composite cylinder that is supported only at theends. The second area of attention is the end plate region. The end plates will bethe termination point for the straw tubes and will provide the support for theelectronics as well as cooling and gas manifolding. The third mechanical issue is theoverall support structure for the superlayers. This determines how the individualsuperlayers will be related to one another as well as to the overall detector. The
R final point of discussion is the assembly and construction automation of the entireHCTC. Based on the quantity of components to be handled in the assembly,automation will be required to some extent to reduce the labor costs associated withfabrication. Each of these issues has been addressed this year and the preliminaryfindings will be carried forward in FY1991 to help generate a formal engineeringdesign of the HCTC.
These studies, described in detail below, were carried out at Oak Ridge NationalLaboratory (ORNL) in consultation with the Duke high energy physics group. TheORNL effort, representing a mechanical engineering effort of over one man-year,was a contribution to the HCTC Subsystems R&D and received no funding from theSSC Lab.
4-1
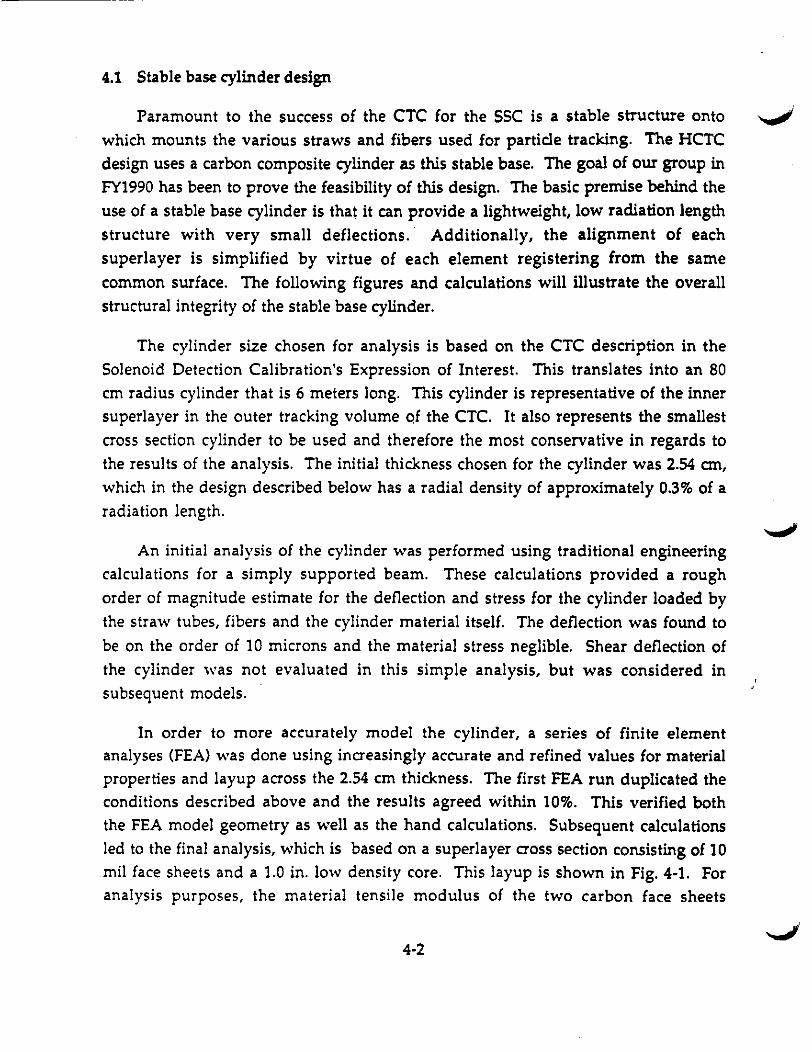
4.1 Stable base cylinder design
Paramount to the success of the eTC for the SSC is a stable structure ontowhich mounts the various straws and fibers used for particle tracking. The HCTCdesign uses a carbon composite cylinder as this stable base. The goal of our group inFY1990 has been to prove the feasibility of this design. The basic premise behind theuse of a stable base cylinder is that it can provide a lightweight, low radiation lengthstructure with very small deflections.· Additionally, the alignment of eachsuperlayer is simplified by virtue of each element registering from the samecommon surface. The following figures and calculations will illustrate the overallstructural integrity of the stable base cylinder.
The cylinder size chosen for analysis is based on the CTC description in theSolenoid Detection Calibration's Expression of Interest. This translates into an 80ern radius cylinder that is 6 meters long. This cylinder is representative of the innersuperlayer in the outer tracking volume of the CTC. It also represents the smallestcross section cylinder to be used and therefore the most conservative in regards tothe results of the analysis. The initial thickness chosen for the cylinder was 2.54 em,which in the design described below has a radial density of approximately 0.3% of aradiation length.
An initial analysis of the cylinder was performed using traditional engineeringcalculations for a simply supported beam. These calculations provided a roughorder of magnitude estimate for the deflection and stress for the cylinder loaded bythe straw tubes, fibers and the cylinder material itself. The deflection was found tobe on the order of 10 microns and the material stress neglible. Shear deflection ofthe cylinder was not evaluated in this simple analysis, but was considered insubsequent models.
In order to more accurately model the cylinder, a series of finite elementanalyses (FEA) was done using increasingly accurate and refined values for materialproperties and layup across the 2.54 em thickness. The first FEA run duplicated theconditions described above and the results agreed within 10%. This verified boththe FEA model geometry as well as the hand calculations. Subsequent calculationsled to the final analysis, which is based on a superlayer cross section consisting of 10
mil face sheets and a 1.0 in. low density core. This layup is shown in Fig. 4-1. Foranalysis purposes, the material tensile modulus of the two carbon face sheets
4-2
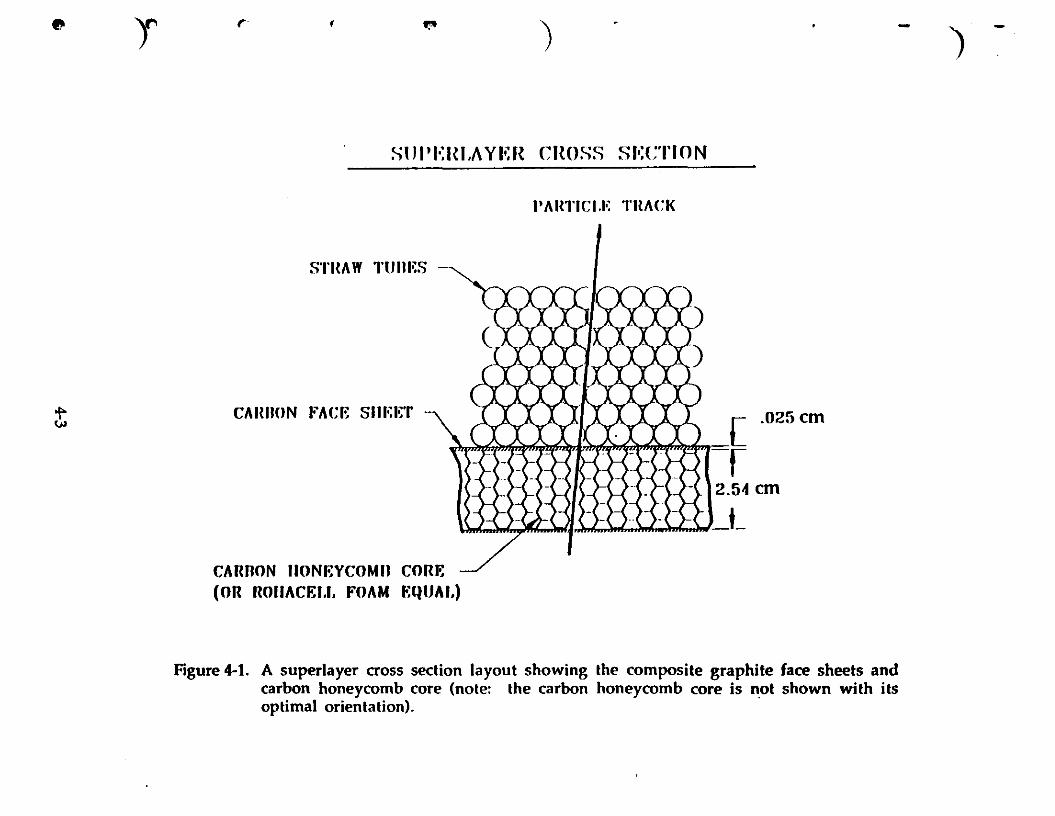
.. J r· , f!" ) - )
StJI'Io:Ht.i\Ylm CROSS SI';CTION
I'AHTICI.I~ THACI{
1".."
STHAlY TUIll~S
CAJUION I~ACE snnrr[
.025em
y\y},{'f.p.,(~..t~j:~f~'(!Jt~~'1 r2.501 em
\),."(...M')u'..~(J.,)",C,.. ) •.l..~.),,I; ..JJ L
CARnON HONEYCOMB CORE(OR ROIIACEI.I. FOAM ":QUAI,)
Figure 4-1. A superlayer cross section layout showing the composite graphite face sheets andcarbon honeycomb core (note: the carbon honeycomb core is not shown with itsoptimal orientation).
was set a 0.7xl06 kg/cn2. This value was determined using the GENRAD compositematerial analyzer code. This program allows the user to input varying composite "",;Imaterials and layup orientations. For this analysis, we chose standard strength IM6composite material with a wind pattern of [90/45/-45/0]s, a symmetric layup givingthe properties of a quasi-isotropic material, i.e., the same material properties in boththe axial and transverse directions.
The material chosen for inclusion in the analysis for the carbon honeycomb'core was based on the properties of the Hexcel Corporation HFT-G-3/16-6.0 GraphiteReinforced Honeycomb core, however, any similar core material may be chosenbecause the analysis code, MSC/Nastran, ignores the bending properties of corematerial and only requires input of the shear modulus. The number included in
this analysis is sufficiently low that it does not affect the results of the bendinganalysis and is representative of any number of core materials including foam. Corematerial properties only affect the shear deflection, which is trivial in this geometricconfiguration.
The results of this analysis indicate that the maximum deflection for a cylinderwith radial density of approximately 0.3% of a radiation length is once againapproximately 10 microns. Figure 4-2 displays in more detail the results of the FEAperformed on this stable base cylinder. The basic cylinder is sufficiently stable that itcan be used with confidence as a support structure for the straw tubes andscintillating fibers. This support structure which shows minimal deflectionprovides a sufficient base but does not sacrifice the need for low radiation lengthsupport. Additional analysis is needed to optimize the material sizing and furtherreduce the radiation lengths. Radiation lengths for the layup described here areshown in Table 4-1. Other issues to be addressed include handling and localloadings that may be induced upon the cylinder. The production of a prototypecylinder would be helpful in analyzing these concerns as well as establishingfabrication techniques needed to produce the cylinders in larger quantities with theaccuracy required by the SSe.
The final cylinder design issue that was evaluated was the compression loadingdue to the tension in the sense wires. This loading amounts to approximately 2250kg/superlayer. This portion of the analysis examined the bucking load and thecritical compression load for the described cylinder. In each case, the compression
4-4
•
Figure 4-2. Color coded deflection analysis of the stable base cylinder.
See following page
4-5
• ) .. ( t .. ) \. - )
•
~,;:., ir;,4:,~,,~~
I~~Ji;1,".~;ijl~'1:!!,'~:ti~:i:~~i'
1.59-06---...
-1.63-05
(METERS)
-1.27-05
-1.39-05
M X 6 M
Ifi
...---xz
STABLE BASE ANALYSIS - 1.6CARBON SANDWICH DEFLECTION

Table 4-1. Thickness of the Support Cylinder and Straw Tube SyperlayerShown in Figure 4-1
ICarbon face sheets = 0.051 ern
Carbon honeycomb core (typical> = 0.018 em carbon equivalent
Total support thickness = 0.069 en carbon
= 0.3% of a radiation length (Xc>
Straw tubes, gas, wires = 0.6% Xo
Total superlayer thickness = 0.9% Xo
strength of the cylinder far exceeded the loads applied by the sense wires. Based onthis analysis and the analysis described above, the stable base cylinder provides thestructural integrity needed to justify the continuation of the study of its use for theHCTe.
4.2 End plate design
The end plates for the HCTC perform multiple functions. They will serve asthe origin and termination points for the straw tubes, provide support for theelectronic circuit boards, and manifolding and distribution of the ion gas suppliesand the electronics cooling fluids. The end plates will provide stiffening to the ends
• of the stable base cylinder. The analyses discussed here represent the latest in an ongoing iterative design process of the end plates.
..
•
•
The general end-plate concept is illustrated in Fig. 4·3. This design assumesthat the sense wires will be operated at high voltage and the cylindrical cathodes atground. Other alternatives are being studied, but for a preliminary evaluation ofmechanical consideration, we have used the model shown in Fig. 4-3.
The end plates will be bonded to the cylinder and thus become an integral partof its structure. Each end plate will be drilled on a close-pack hexagonal pattern forthe cylindrical straw tubes. These drilled holes will be approximately one-half the 4mm diameter of the straw tubes to allow for the insertion of the end plugs attachedto each straw tube. The centerline to centerline spacing of the holes will befractionally larger than 4 mm to prevent interference from tolerance buildup of the
4-6
) ')
TYPICAL I';ND P)'ATI~ SI';CTION
)
t
runs
COOI.lNG GAS POHT
---- -- Loftil'x;;;]
__ _ _ .-rW-~
- I'<~
_.__.- - ._-- i ~t~
--- - [;.;ritiii§:!,J. "
-, I~I.I~CTHICAI, CONNECTiON
/' winE "oWING PINII··:=1r GI() PC UOA HIJS/
~lIi .-1._- 2()()O V CAPACITOR
__ .. II r ELECTRONICS
rl r: INSllJ,ATION
COOtlNG FIN
ornl
Figure 4-3. End plate design showing the straw tube connections, gas cooling ports and electricalconnectors.
t
straw tubes. An end plug has been designed to provide an interface to theelectronics, and will continue to be evaluated in the following months.
After the straw tubes have been placed on the cylinder and the end plugs
aligned with the end plates, a sense wire will be inserted through each straw. As
described in Section 2.2 of this progress report, we have shown that air flow can beused to blow the wire through long straw tubes. These wires will be tensioned andconnected to a first set of electronic circuit boards. These will be supported on andaligned by the end plates. The alignment of the electronics boards is accomplishedby machining or molding of an appropriate cavity in the end plates. The accuracy ofthe alignment will be adequate to position the sense wires and provide the sealingnecessary for the ion gas flow and the electronics cooling fluid.
•
•
•
The end plates provide passages for the various fluids and gases associated withthe HCTC. The current end plate models provide individual ports for the fluids toenter from and external manifold. Proposals for future end plates would includethis manifolding as an integral part of the end plate. In addition to the structuraldesign work on the fluid passages, an effort has been made to design adequate iongas and electronics cooling fluid systems to remove the heat generated by thevarious components during the tracking process. .....,
In the study of straw tube heating, it was assumed that all the heat generated inthe straw tubes by the ionization of the gas would be carried away by the ion gas.Additionally, the straw tubes were assumed to be 50% blocked in several locations tosimulate the presence of the sense wire supports. The tube length used was 3 metersand the gas was taken as 80% CF4, 20% Isobutane. The heat generated by the tubeswas assumed to be a maximum of 2 milliwatts. The graphs in Figs. 4-4 and 4-5display the temperature rise and pressure drop for various flow rates of the ion gas.The results of these analyses indicate that if the flow rate is maintained in the rangeof 1 em/sec, there is no appreciable pressure drop or temperature rise. Additionally,if the environment outside the superlayers is maintained at a temperature lowerthan the straw tubes themselves, a significant amount of heat will be conductedaway through the walls of the straw tubes.
Cooling the electronics of he HCTC has also been addressed. The assumptionfor these calculations is that each channel of straw tubes, approximately 30,000 persuperlayer generates 15 milliwatts of \. •.• -r-we methods a' ·00"--' 'e-~ analyzed:u Ja~" J, I a J U a~L;:' VI. .llt'c:Ll • .I. " ..... .u1~UIV ;:, ... '" AU.le ,,\= ,,~a.l J •
4-8
) )
SOC CENTRAL TRACKING COOLING
)
~
30
28
STRAW TUBEGAS TEMf'ERilnJRE I1lSE
... _. ~---~--_._---------------.----~-
""..0
g
WlI!
~W0.~
r!
26
:14
n20
18
16
14 I
1:1
10
I
I
4
:1 -
GAS:BO% CF4,20% ISOBUTANE
Tube length: 3 meters
o -r--t iii I , T-T I I , i -, iiI r-i-j I I i -,---
0.1 0.:1 0.3 0.4 0.5 0.8 0.7 0.' 0' I U 1.:1 1.3 t.4 t.5 U 1.7 t.I U 2 :1.1 :1.:1:13 :1.4 :1.5
GASflOW RATE(cm/S)
OAN!.. 6190
Figure 4-4. The effect of gas flow rate on the temperature rise in the straw tube gas.
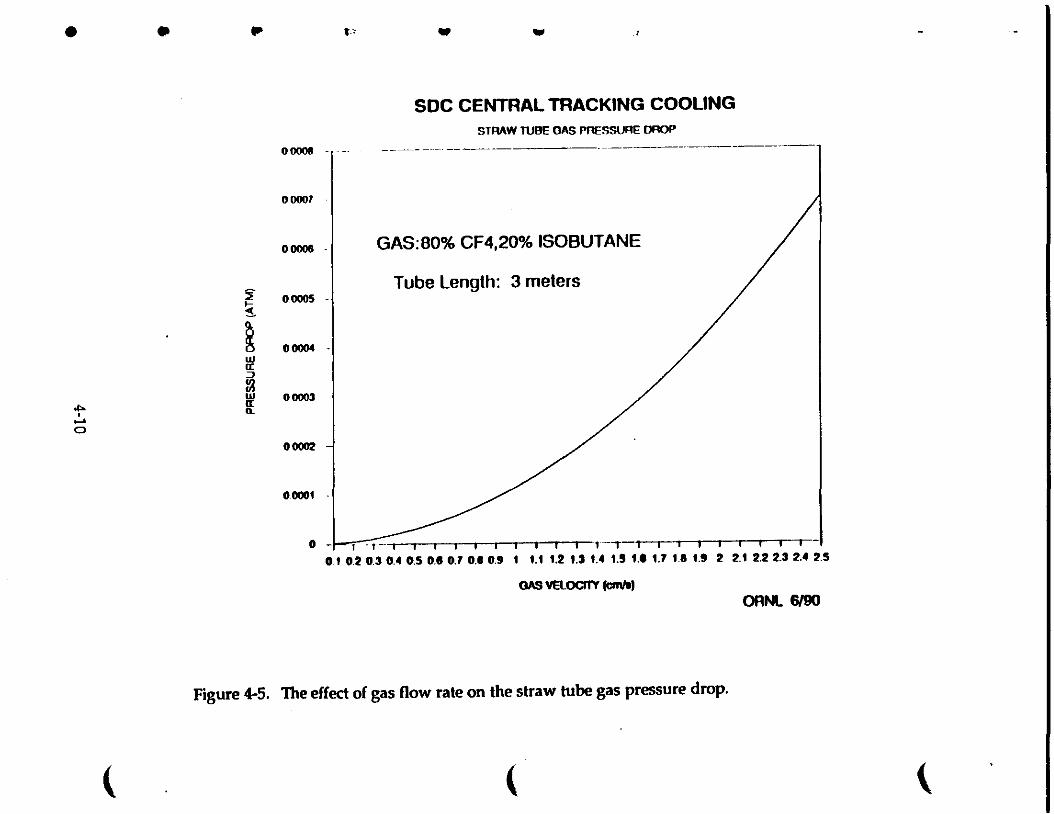
• • .. p • •
SOC CENTRAL mACKING COOLINGSTRIIW TUBE OIlS PRESSURE OROI'
ooooe --.--
00001
-_.-~_.._- ------ ------ --_._._-------
"'",.....o
~
~
~II!~I[
ooooe -
00005 -
00004 -
00003
00002
00001 .
GAS:BO% CF4,20% ISOBUTANE
Tube Length: 3 meters
{
o -~-·i iii' I Iii i 1---, I , Iii ii' ,
01 0.2 0.3 0.4 0.5 D.• 0.7 D.• D.' I 1.1 1.2 1.3 1.4 1.5 I.' 1.7 U I.' 2 2.1 2.22.3 2.4 2.5
GAS VElOCItY I~IORNt 6190
Figure 4-5. The effect of gas flow rate on the straw tube gas pressure drop.
{ \
gas cooling with either air or nitrogen, or cooling with water. Each has its ownadvantages and disadvantages. The tradeoffs will have to be further evaluated todetermine the most appropriate choice. The purpose of this analysis was todetermine the requirements of the various methods for this application. For the gascooling methods, a parallel system with an inlet supply pressurized toapproximately 100 psi blowing across cooling fins attached to the electronics boardswould be required. The fins would be thin aluminum sheets approximately 30 mmby 10 mm, located radially on the outer circuit board. The water cooling methodwould require much less flow due to the higher thermal transfer coefficient. Waterwould be piped around the perimeter of the end plates and flow across thecomponents to remove the generated heat. The general concept is illustrated in Fig.4·6. The use of a water cooling system would necessitate a return system, whichmay be optional in a gas cooled environment. Additional work will size the waterand gas passages, reduce the pressure drop, and minimize the temperature rise.
Finally, the end plates serve as a stiffening ring' for the stable base cylinder.This stiffening ring allows the stable base cylinder a minimum cross sectionthickness, while retaining a high degree of stiffness. It provides a stiffened regionfor mounting the stable base to the superlayers and to the detector. These issueshave been evaluated and included in the design and analysis already performed.The end plate must be optimized for radiation length while retaining all of thefeatures specified herein.
Overall, the end plate design has matured considerably this year. Evaluationmust continue to resolve the specifics of the issues outlined. Once again, it is highlydesirable that a prototype end plate be fabricated to verify the function and"manufacturability" of this device.
4.3 Superlayer support structure
Supporting the various superlayers in relation to one another and to thedetector as a whole is an area of concern in the final alignment and assembly of theHCTC. This structure, or combination of structures, must provide a means ofassembling the tracking chamber, and be sufficiently rigid to assure and maintainthe overall system alignment. The support structure must provide routing passagesfor the various electrical and fluid services that are required. The design of thisstructure is an integral part of the overall detector. It must provide mounting for
4-11
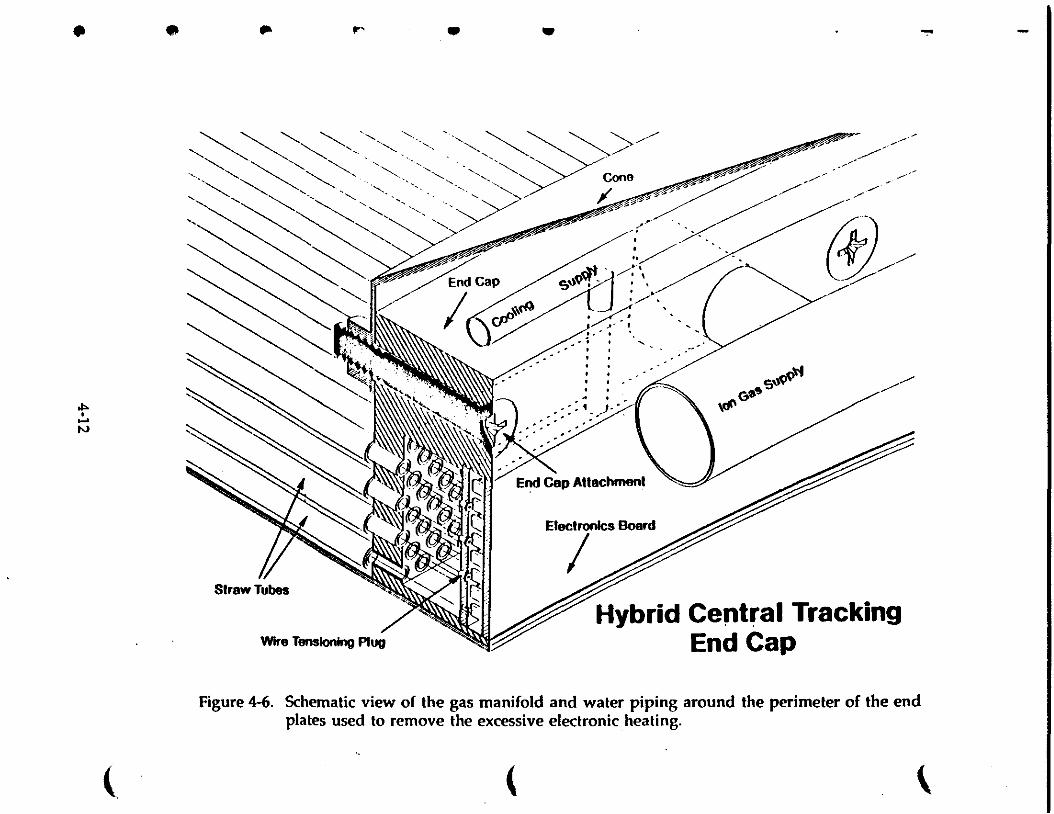
• • .. '", • • ..,.
Hybrid Central TrackingEnd Cap
//Ge~S~'c4vi"
.-
. .;> ' . .-1:/"
ElecTs Board
End ClIp Attachmenl
,,~~<:~"'~'''::''''-'''~~~>// .' .' /././~/,.,.~" <, "'" "', '~., ''-'''- .".', <, Cone ~.". ,,/., .. ' .> »>
'<, ~ ~" . -; '. <, " " / /<, <, <, -.......................... , ". ",- ................... / , w:::w' " /,,/ ~~....., '-~"~' ',..»: "'.- /<, <, <. . ." ~ .
'-'~ ""," ? '(>"" r~~ ../ '" '1f j .-/
~ /' ~ -'" ././ ~\\~
" cJf1 --i?rf.~ , . ......· ,· .· .• •• •• •· ...,.,....
tv
Figure 4-6. Schemalic view of the gas manifold and waler piping around the perimeter of the endplates used to remove the excessive electronic healing.
( ( \
the inner tracking and the intermediate tracking, and establish mounting locationsfor the magnet coil. These issues will be addressed more completely by theintegration group, but the overall integration task must not be overlooked. Aneffort has been made to look at initial design concepts to support these tasks.
As an example, the current design for the SDC CTC has the outer superlayerextending to approximately 4.5 meters (half-length). The inner superlayer has alength of 3 meters. This arrangement presents a tapered effect at the end of thesuperlayers as they progress from the inner to the outer layer. We are currentlyexploring the use of a cone or series of cones to support the ends of the superlayerswhich will maintain the progression. This arrangement has several benefits: itreduces the amount of material required for the cylinder support; it has both radialand longitudinal stability, and the conical shape. This method also provides asmooth transition to the support structure for the entire tracking chamber. Thefocus of this design is on methods to achieve the support requirements withoutsacrificing accessibility to the end plates.
Figure 4·7 illustrates the connection of the overall CTC to the outer chambers.This connection also provides the interface for electrical and mechanical services. Abulkhead similar to the one shown will likely be used for the majority of theseconnections, allowing for easier installation of the HCTC. Obviously, theseconnections to the overall detector will be dependant on the configuration ofcomponents outside the CTC.
The interface and support connection for the CTC inner (silicon) tracking andthe intermediate (forward) tracking must evolve with the design of thesecomponent. The design of the HCTC must be such that it can readily incorporatesupports for these modules within its structure. Designers have looked at providing"bolting rings" for attaching the other components. Any method used mustprovide very accurate registering for these components as their locational accuracyrequirements are extremely stringent.
In summary, each of the components of the superlayer structure support havereceived preliminary mechanical design attention. These initial studies indicatethat the general concept we have developed for support of the HCTC detector issound. We are currently proceeding to more quantitative evaluation and design
4·13
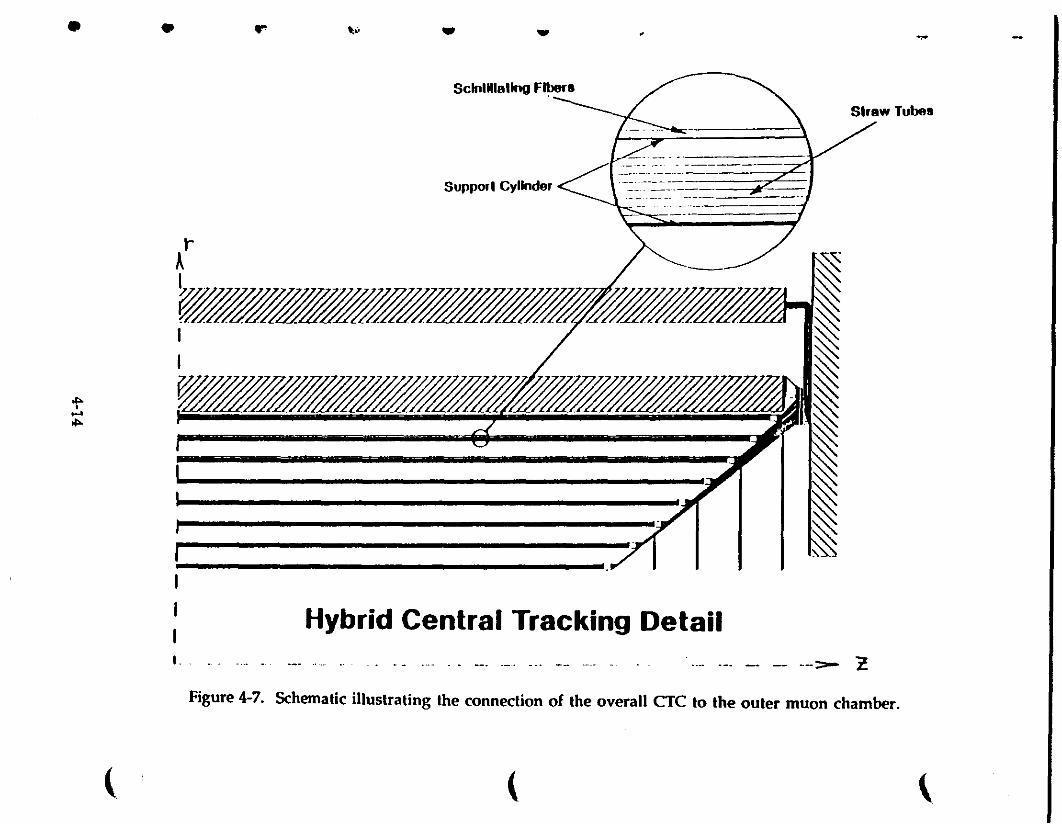
• • ... \" • .. - ~
Sclnllliollno Fibers
Slrow Tubes
--- ------ y
-- .----------- ---.-Support Cylinder
.----- -' - ---------------;::s. -:--------
)
{" "------_.----/ ~
..,#~,.,;,~ ~I ~I ~
* .,~I~IAP~.....~I ::;;;;1 I I~
~'~~
Hybrid Central Tracking Detaill. -___ _n_ • - . __ . _. n_. ---- .-..-. _. _ --:::>- X
Figure 4-7. Schematic illustrating the connection of the overall CTC to the outer muon chamber.
( i ( \

L
which will be tested with a series of prototypes. This program is described in detailin the HCTC progress report for FY1991.
4.4 Assembly and automation
The final assembly of the Hybrid Central Tracking Chamber will involvehundreds of thousands of components. Manual assembly of this device would beburdensome. Automated assembly techniques are being pursued to simplify theconstruction. Figure 4-8 represents one method being considered to automate thestraw tube layup process. This method would take partially assembled straw tubesand place them on the stable base cylinder in an orderly and accurate manner. Thedevice would require constant attention to verify that the process was in control atall times, however, for a system as critical as the central tracking chamber, fullautomation is not desirable.
Additional automation techniques are being considered for such tasks asinserting the sense wires in the straw tubes; for tensioning and terminating thesense wires at the end plates; for placing scintillating fibers onto the stable basecylinder; and for other areas where automation is an economical consideration.Additional work will be performed on these areas in the following months.
4·15
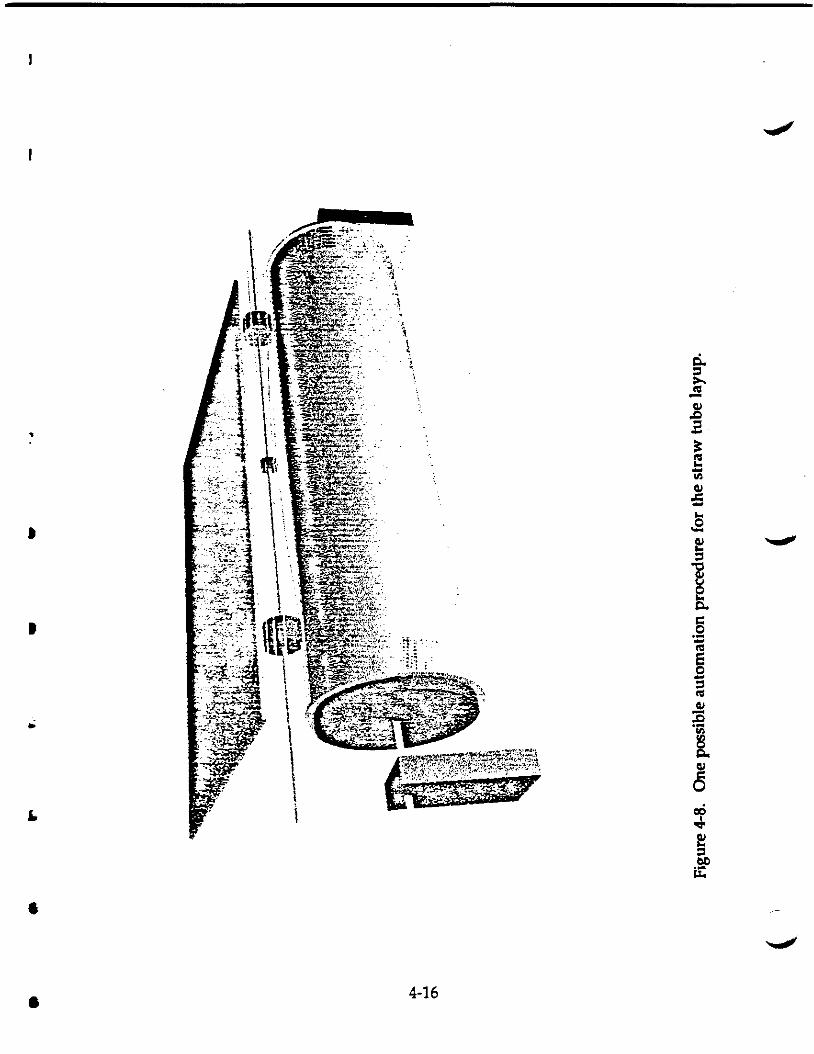
I
•
•
. ~... -.~
-»:-~.
~,
4-16
5.0 Monte Carlo Simulation of HCTC (Task 4)
5.1 Detector response simulation
The detector simulation makes use of the SSCSIM [10] application of theGEANT program. All interactions of energetic charged and neutral particles withthe material of the detector are simulated. A beam pipe and an inner silicon vertexdetector corresponding with 6% of a radiation length are assumed. In addition to atriggering event (most often, a Higgs decaying into four muons), background eventsare generated at a rate corresponding to the S5C luminosity, both of the triggeringbeam crossing and for the three preceding and two subsequent beam crossings. Theeffect of delayed particles from interactions in the preceding microsecond fallingwithin the sensitive time window (corresponding to about 10% of the backgroundhits), is approximately represented by equally delayed particles from the backgroundevents explicitly simulated.
Trigger events have been generated using ISAJET to simulate Higgs bosonproduction, mostly decaying via a ZO pair into four muons with PYTHIA used tosimulate the background events. Simple single and multiple particle generators arealso available.
The detector simulated here consists of eight cylindrical superlayers, eachcomposed of eight axial layers of 4 mm diameter straw tubes in a close-packedconfiguration. The superlayer radii span the interval from 70 to 180 em from thebeam. There are two identical detector modules upstream and downstream of thenominal interaction point. The straw tube lengths range from 2 meters for theinner superlayer to 3 meters for the three outer superlayers. The three outersuperlayers are also equipped with 6 layers of 500 micron of axial, +5 and -5 degreestereo layers. All fibers are 3 meters long. Each superlayer is supported by a carbonfiber mandrel 1 mm thick. The inner superlayers correspond to 0.8% of a radiationlength at normal incidence, the three outer ones to 1.5%. The straw material isrepresented by concentric cylindrical layers of thickness 1t times the wall thickness of50 microns, but the exact circular, close-packed geometry is used for the strawdigitization.
5-1
•
I
•
•
The detector is contained in a uniform, solenoidal magnetic field of 2 Tesla.The straw tube gas is assumed to have an effective drift velocity in the magnetic ..., .
field of 6.6 em/usee 00 em/usee in zero field), corresponding to a maximum drift
time of about 30 nsec. The position resolution is assumed Gaussian, with G
increasing linearly from 100 microns at radii beyond 1 mm to 150 microns close to
the sense wire. The signal propagation speed along the wire is taken as 25 em/nsec,
as is the light propagation speed along the scintillating fibers. The straw tubes are
digitized within a 40 nsec time window, starting 10 nsec after the triggering beam
crossing. Only the earliest hit within this time interval is recorded. The
scintillating fibers are assumed to be sensitive for an interval of 16 nsec, starting 10nsec after the triggering beam crossing. Pulse height information is simulated for
both straws and fibers, but is not used at present.
The progressive effect of the various contributions to the observed time
spectrum for trigger events without pileup is show in Fig. 5-1: drift time (Fig. 5-1(a»,
drift time resolution (diffusion, etc.) (Fig. 5-lCb», signal propagation along the wire(Fig. 5-1(c», and particle time of flight (Fig. 5-1(d». There is an anticorrelation
between the propagation time along the wire and the time of flight for fast particles.
The expected spectrum of digitized drift times (one hit per wire only), is shown
in Fig. 5-2(a). Taking a 40 nsec time window from +10 to +50 nsec acceptsapproximately 73% of the generated digitizings associated with the trigger. The
digitizings missed come primarily from slow particles with long times of flight.
Figure 5-2(b) shows superposed drift time spectra for trigger events only, all
events from the triggering bunch crossing, all events, and the digitized time
spectrum for all events limited to one hit per straw tube. At a luminosity of 1033
cm-2-sec-1, just over half of the hits come from the triggering event, and just underhalf from the minimum bias background. Figure 5-2(c) shows the relative numbersof hits in the 40 nsec window coming from different bunch crossings. Apreliminary, low statistics simulation at a luminosity of 1034 shows roughly oneeighth of all hits coming from the trigger event, as expected (Fig. 5-2(d».
Graphical displays of simulated events in a single chamber module arepresented in Fig. 5-3, corresponding to a luminosity of 1033.
5-2
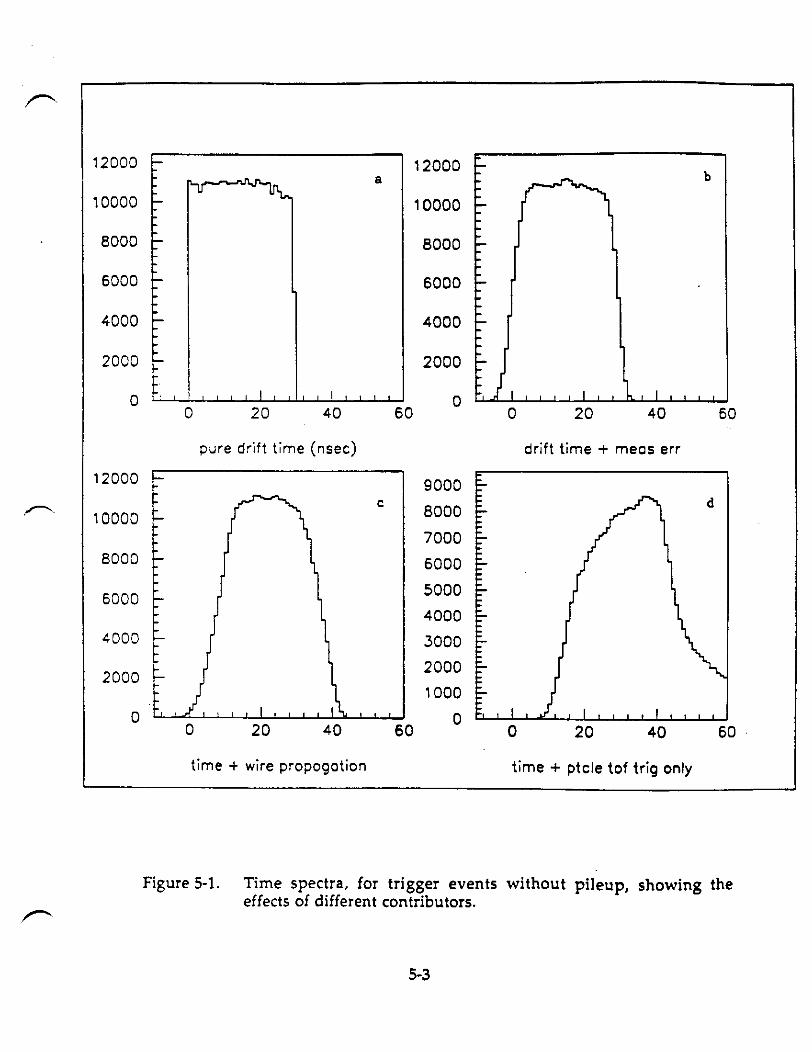
12000 "- 12000-" a b
Itt10000 "- 10000
8000 "- 8000
6000 ~ 6000
4000 ~ 4000
2000 ~ 2000~~.
I I0 00 20 40 60 0 20 40 60
pure drift time (nsec) drift time + meos err
12000 9000c
8000d
,~10000
70008000 6000
6000 5000
40004000 .3000
20002000
1000
0 00 20 40 60 0 20 40 60
time + wire propogotion time + ptcle tof trig only
Figure 5-1, Time spectra, for trigger events without pileup, showing theeffects of different contributors.
5-3
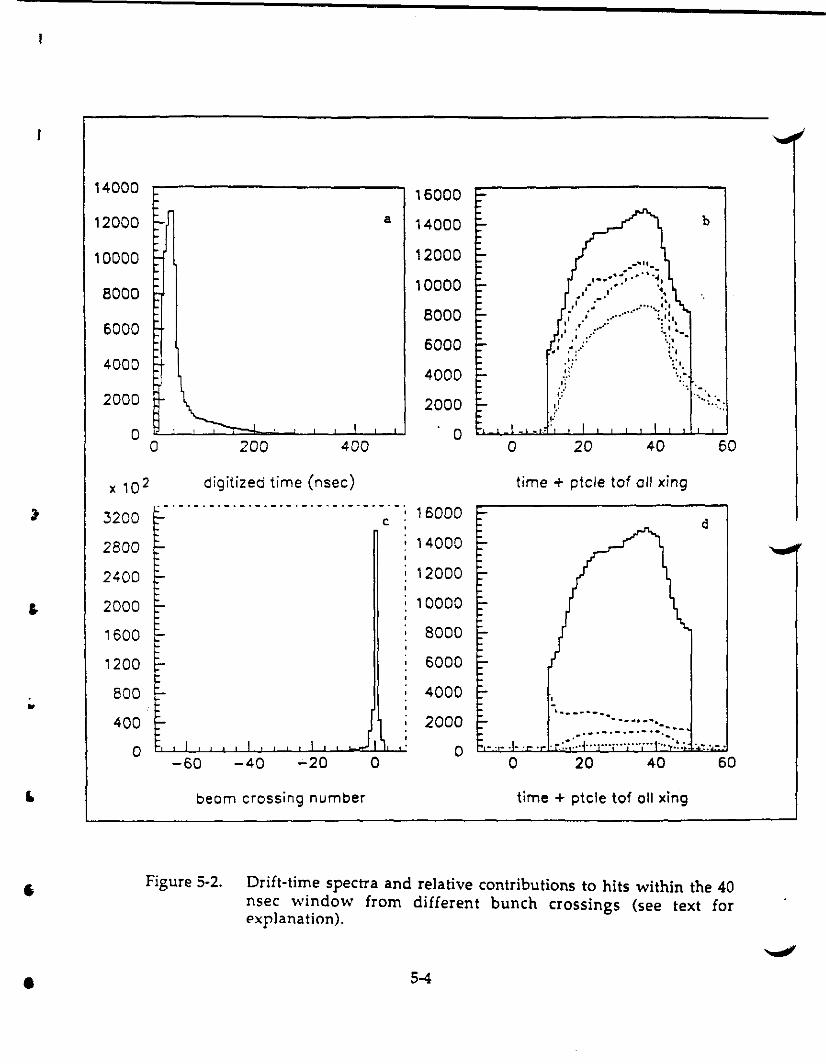
digitized time (nsec) time + ptcle tof 011 xing
60
d
4020
,..........- ..... ......................
............... ....-..~: . ~ .....
time + ptcle tof all xing
c
14000
. - . - .- . - .- . - . - . - . - . - . - . - . - . - . _.. ; 16000
2400 12000
2000 10000
1600 8000
1200 6000
800 4000
400 2000
0 0-60 -40 -20 0
beom crossing number
3200
2800
..
• Figure 5-2. Drift-time spectra and relative contributions to hits within the 40nsec window from different bunch crossings (see text forexplanation).
• 5-4
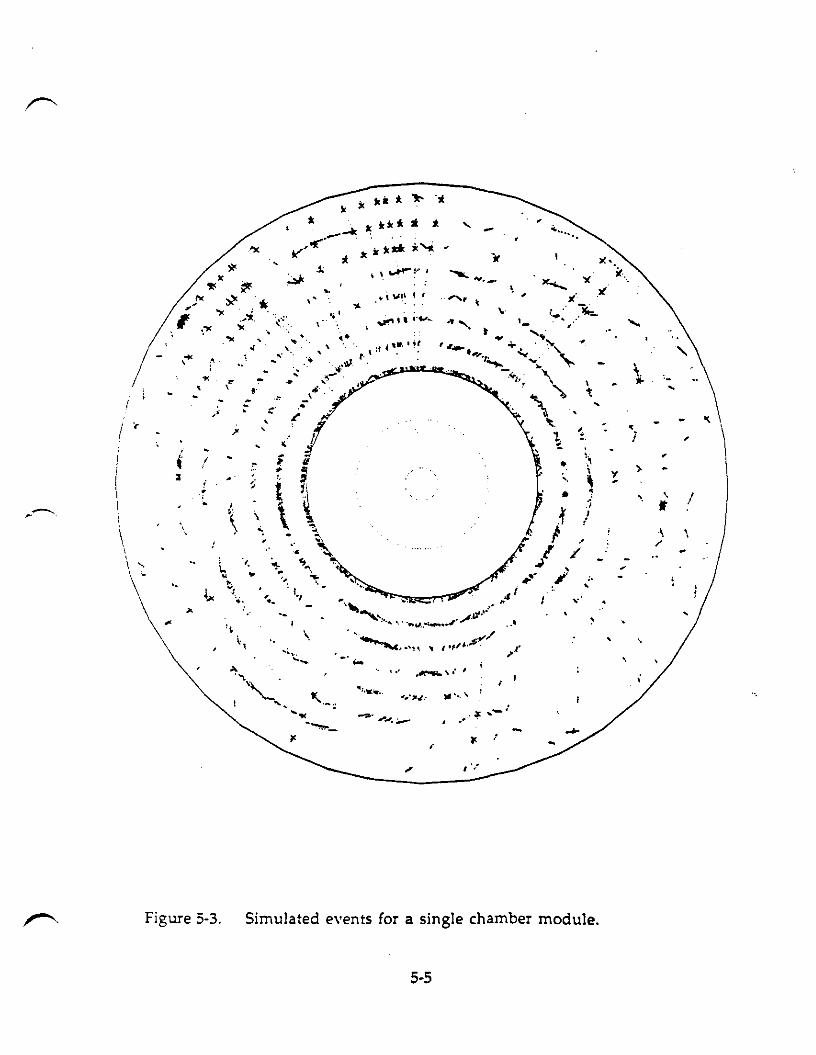
i
>( "
it,..
,'.
,{
-\
1
i·,
':.
,.
'.~ .. ,
,
..'
, t
",
... ~ ....-.
"" .
I .~.
"'71..1.- ,,'.....
t t \#1\ I I
..' ~, .. ,
:..r." t' ..........
..:.........
.'"
•.
,
'" .
"
\
I.,
~,.. '-,
,'.
'.
~•.,v......"
"...", ,
'" ~ .., ,"
".
"<,
» ,, l ,~
i " ~•I
'\ \, ..,
.
,\
\
\ .~
Figure 5-3. Simulated events for a single chamber module,
5-5
r
Occupancies of the various detector elements at a luminosity of 1033 have beendetermined under the above conditions, and are tabulated below:
Straws
Layer 1Layer 3Layer 5Layer 8
Fibers
Layer 6Layer 8,
L= 1033
17%11%
7%3%
0.4%0.2%
L =1()34
about 28%about 25%about 15%about 8%
about 1%about 0.5%
SuperlayerInner Radius
70 em100 em130 em175 em
145 em175 em
t
•
"
•
•
The straw tube occupancy varies between 3% and 17%. The inner layers arequite active, but at a level that still permits local track segment finding (Fig. 5·3(a».The fiber occupancies are an order of magnitude lower than the straw tubeoccupancies at similar radius, as expected from the smaller cell size and shortersensitive time.
Preliminary estimates have been made of occupancies at a luminosity of 1034.
These have significant statistical errors, and should be treated with caution. Theyshow the eifect of the factor of ten increase in background tracks. At this luminosity,the inner straw tube layers are becoming congested, and it will likely be necessary toconcentrate on global methods of finding fast tracks rather than looking for localtrack segments. The fiber occupancy in the outer layer at 1034 is consistent withindependent estimates made for a fiber-only detector at a similar radius.
5.2 Reconstruction studies
Some track finding and fitting software has been developed for the straw tubesof the HCTC, in order to evaluate the detector performance. Track segments arefound in projection locally in each superlayer, using the tube pattern only.Segments are searched for at angles up to about 30 degrees to the radial direction.This limits the whole track finding to transverse momenta above approximately 0.5GeVIe. A straight line fit is then made to each segment, using the drift times. This
5-6
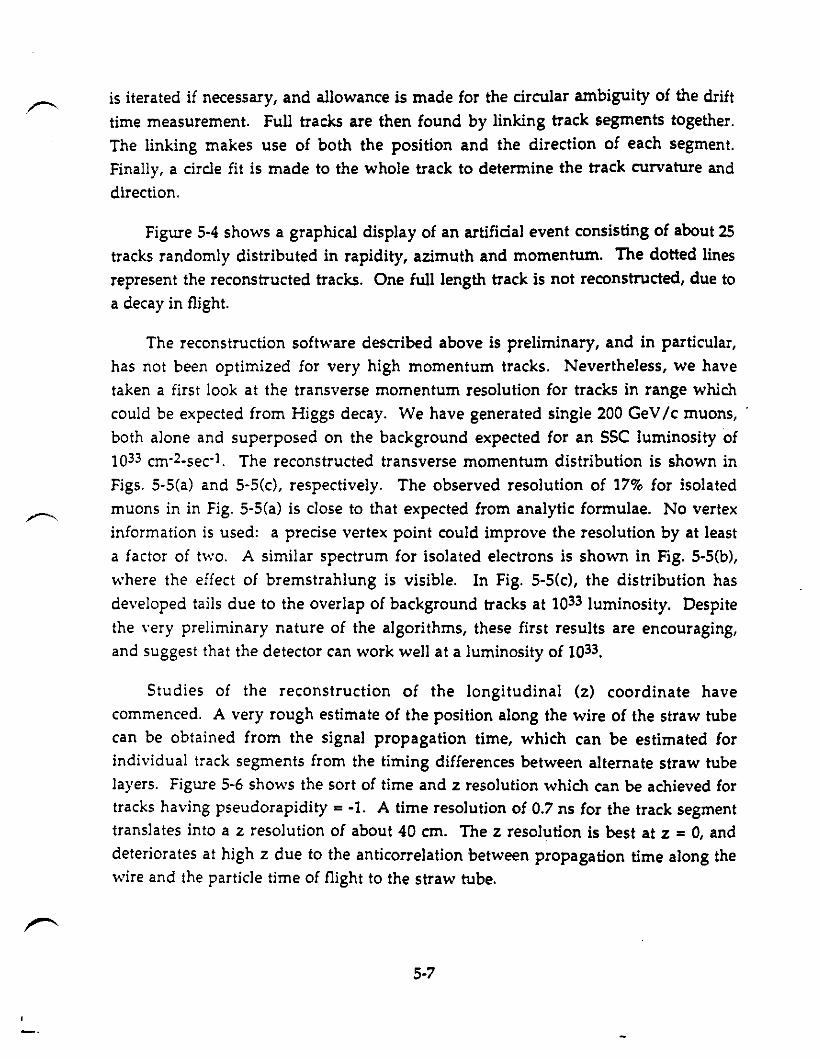
is iterated if necessary, and allowance is made for the circular ambiguity of the drifttime measurement. Full tracks are then found by linking track segments together.The linking makes use of both the position and the direction of each segment.Finally, a circle fit is made to the whole track to determine the track curvature anddirection.
Figure 5-4 shows a graphical display of an artificial event consisting of about 25tracks randomly distributed in rapidity, azimuth and momentum. The dotted linesrepresent the reconstructed tracks. One full length track is not reconstructed, due toa decay in flight.
The reconstruction software described above is preliminary, and in particular,has not been optimized for very high momentum tracks. Nevertheless, we havetaken a first look at the transverse momentum resolution for tracks in range whichcould be expected from Higgs decay. We have generated single 200 GeVIc muons,both alone and superposed on the background expected for an sse luminosity of1033 cm-2-sec·1. The reconstructed transverse momentum distribution is shown inFigs. 5-5(a) and 5-5(c), respectively. The observed resolution of 17% for isolatedmuons in in Fig. 5-5(a) is close to that expected from analytic formulae. No vertexinformation is used: a precise vertex point could improve the resolution by at leasta factor of two. A similar spectrum for isolated electrons is shown in Fig. 5·5(b),where the effect of bremstrahlung is visible. In Fig. 5-5(c), the distribution hasdeveloped tails due to the overlap of background tracks at 1033 luminosity. Despitethe very preliminary nature of the algorithms, these first results are encouraging,and suggest that the detector can work well at a luminosity of 1033•
Studies of the reconstruction of the longitudinal (z) coordinate havecommenced. A very rough estimate of the position along the wire of the straw tubecan be obtained from the signal propagation time, which can be estimated forindividual track segments from the timing differences between alternate straw tubelayers. Figure 5-6 shows the sort of time and z resolution which can be achieved fortracks having pseudorapidity = -1. A time resolution of 0.7 ns for the track segmenttranslates into a z resolution of about 40 em, The z resolution is best at z = 0, anddeteriorates at high z due to the anticorrelation between propagation time along thewire and the particle time of flight to the straw tube.
5-7
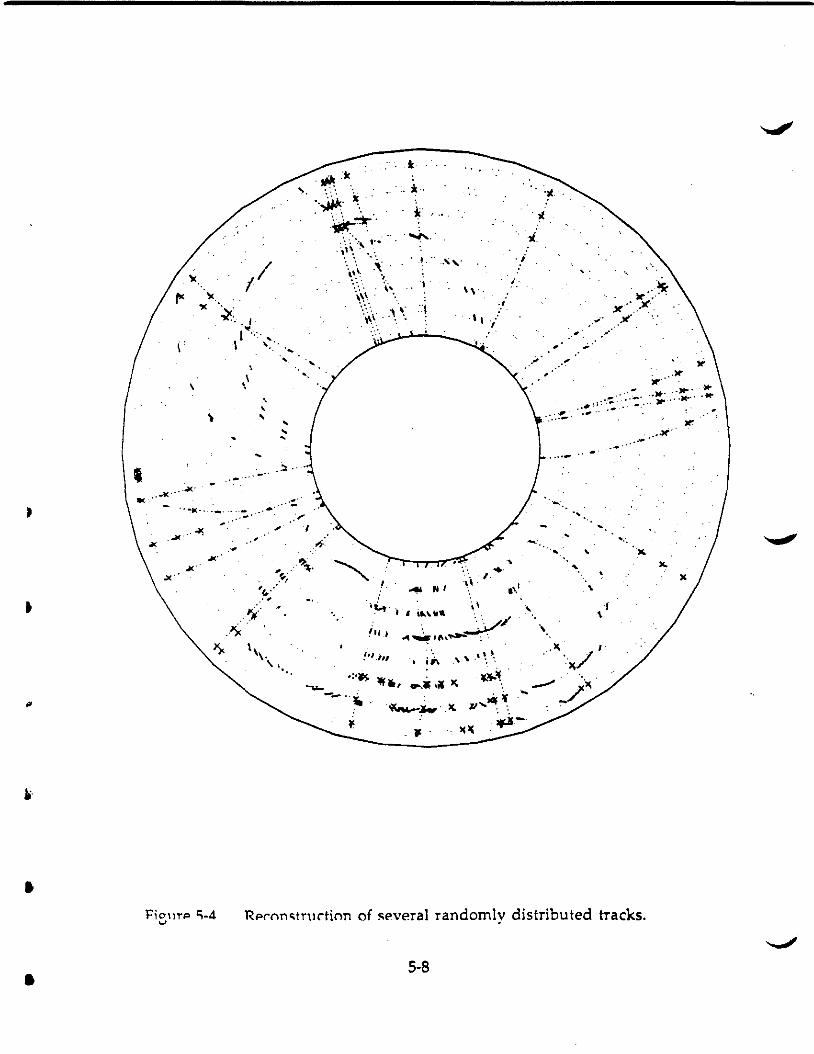
.'
.,",..;. ..~ ..:.:..~ .. ,
...
..- .,><"
'.
)1(..~.
......
."."
., ."
"
, ..~
,
I\
'. ,
, ,
....-
...., .....-
"
.."
-
·1
'..,
·l, 'j
'\
i··
..... 'I'_.~
<,! .
.,
..... I
•... ':'"'
.,,;..
~,\.~~:.,
,,,,..,.'-'
."iI'...~ ..
Y)<
,
.~ ... ~
.' -tC. • ..li('
'"
•FiO'llT"P ~-4.., RpN\Mlru("tinn of several randomly distributed tracks.
• 5-8
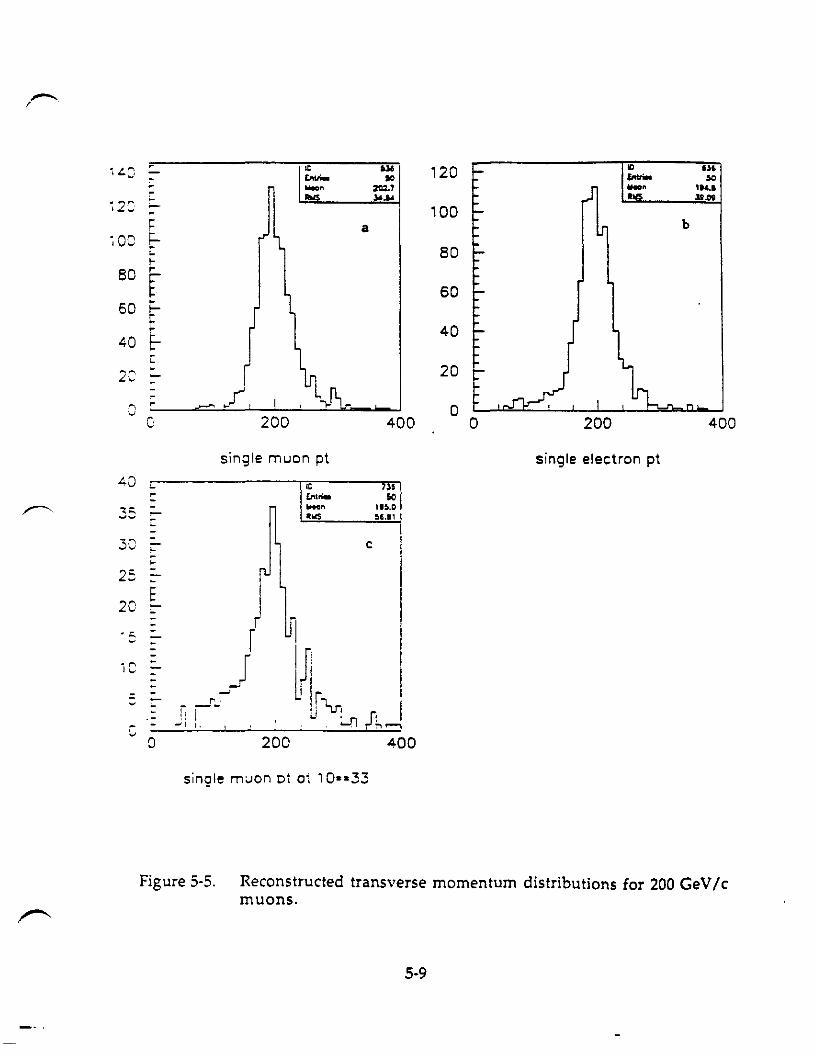
,.'"
.,.120 " IUito:] - ........ 10 - 10
" -" =, -" '14.1~ .... )4'" ... .....
~ 2C' - 100c a b~OC ~ 8080 ~
f 6060
~ 4040 E-
~-c
-" 20L"
r., r- ~/, I 0vG 200 400 0 200 400
single muon pt single electron pt
40 v iC ,).C [rItn. 50
35 """ lU.D
- .... !l1.S1-30 - cv
c25 --~20
E:-- I
~.'" - r--I~
-- )." -Iv -.:
U r::: - ,....,- _ -"J- v
LJ~ 11- 'I ''I I~ t • . ,~, h,...,
\.-200 4000
single muon ct ct 10·.33
Figure 5-5. Reconstructed transverse momentum distributions for 200 GeVIcmuons.
5·9
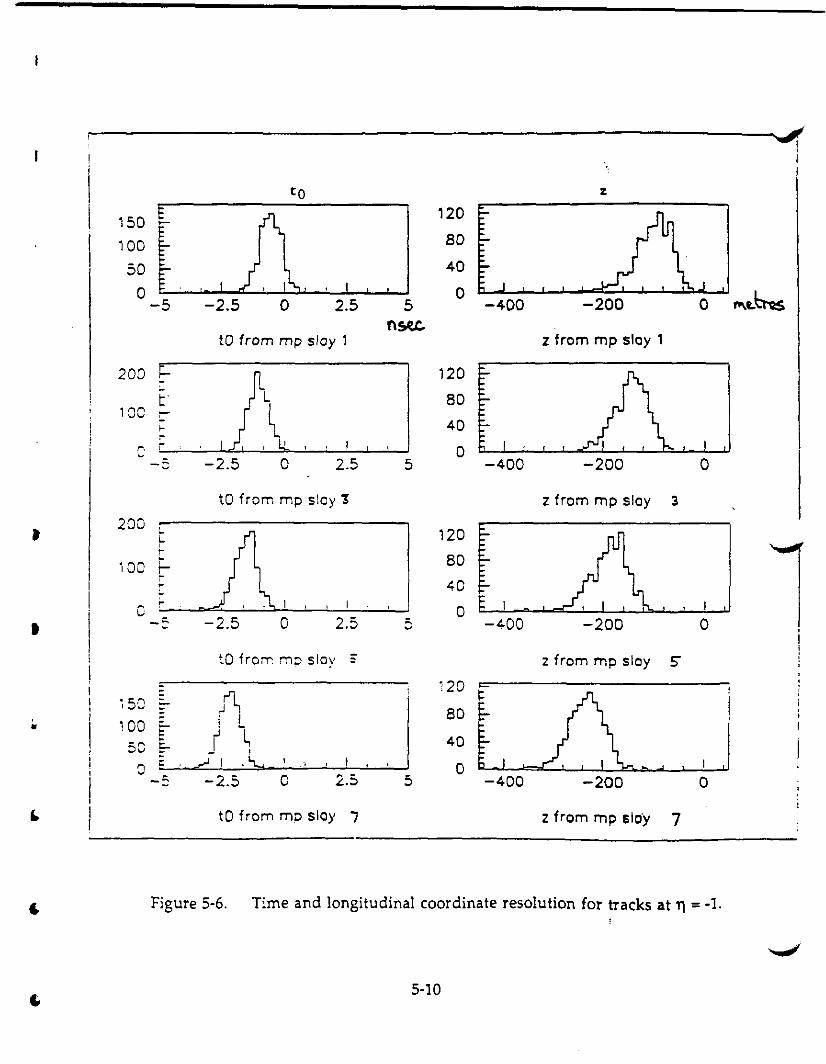
Figure 5-6. Time and longitudinal coordinate resolution for tracks at T\ = -1.
5-10
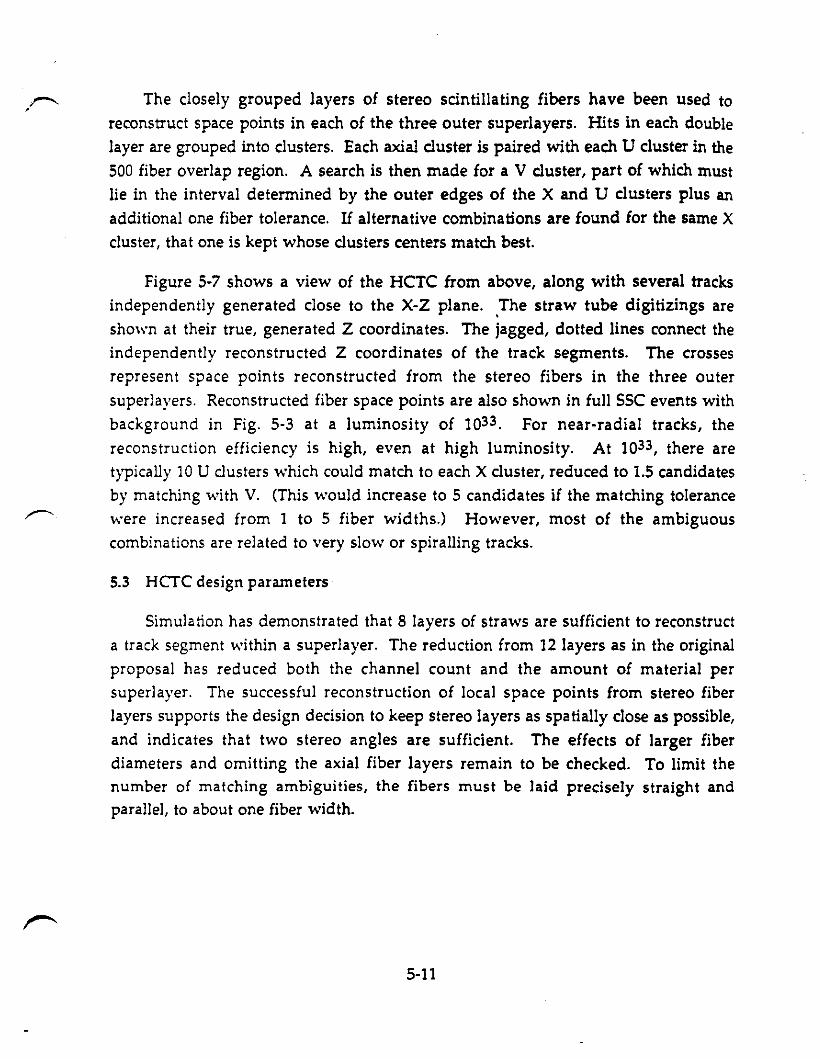
rr-. The dosely grouped layers of stereo scintillating fibers have been used to,reconstruct space points in each of the three outer superlayers. Hits in each doublelayer are grouped into clusters. Each axial cluster is paired with each U cluster in the500 fiber overlap region. A search is then made for a V cluster, part of which mustlie in the interval determined by the outer edges of the X and U clusters plus anadditional one fiber tolerance. If alternative combinations are found for the same Xduster, that one is kept whose clusters centers match best.
Figure 5-7 shows a view of the HCTC from above, along with several tracksindependently generated dose to the X-Z plane. ,The straw tube digitizings areshown at their true, generated Z coordinates. The jagged, dotted lines connect theindependently reconstructed Z coordinates of the track segments. The crossesrepresent space points reconstructed from the stereo fibers in the three outersuperlayers. Reconstructed fiber space points are also shown in full SSC events withbackground in Fig. 5-3 at a luminosity of 1033. For near-radial tracks, thereconstruction efficiency is high, even at high luminosity. At 1033, there aretypically 10 U dusters which could match to each X cluster, reduced to 1.5 candidatesby matching with V. (This would increase to 5 candidates if the matching tolerancewere increased from 1 to 5 fiber widths.) However, most of the ambiguouscombinations are related to very slow or spiralling tracks.
5.3 HCTC design parameters
Simulation has demonstrated that 8 layers of straws are sufficient to reconstructa track segment within a superlayer. The reduction from 12 layers as in the originalproposal has reduced both the channel count and the amount of material persuperlayer. The successful reconstruction of local space points from stereo fiberlayers supports the design decision to keep stereo layers as spatially close as possible,and indicates that two stereo angles are sufficient. The effects of larger fiberdiameters and omitting the axial fiber layers remain to be checked. To limit thenumber of matching ambiguities, the fibers must be laid precisely straight andparallel, to about one fiber width.
5-11
I
•
,.
! "
,
"
.'
•
•
• • •
. ,
-',
~._--_.
,.
•
"
,•
"
i ...k••..••.........••....•.....•.•..•.••••.• .:.
•
•
Figure 5-7. Top view of the HCTC showing several independently generatedtracks,
5·12

References
1. Zhou, B., Warner, D., Rohlf, J., Osborne, D., Marin, A., Lu, W.W., Hopkins, G.,Coan, T., and Beatty, J., Performance of Small-Radius Thin-Wall Drift Tubes inan SSC Radiation Environment at the MIT Research Reactor, Preprint BUHEP90-2, Boston University (1989).
2. Groom, D.E. (Ed.), Radiation Levels in the sse Interaction Regions, SSCR·SR·1033, sse Central Design Group (1988).
3. Grimes, A., et al., Some Aspects of the Theory of Plastic Based ScintillatingFibers, Preprint !\.TUB-2943, Northeastern University (1988).
4. Most of our earlier fibers were provided by Kyowa, a company which hasrecently been absorbed by Kurary. Optectron now has a branch inMassachusetts and this is making it easier to deal efficiently with them. NEused to be known as Nuclear Enterprises. Bicron is now owned by SaintGobain (France).
5. Zorn, c., Designing a Radiation-Hard Plastic Scintillator for High LuminosityHadron Colliders, to be published in the Proc, Workshop on RadiationHardness of Plastic Scintillator, Tallahassee, FL (March 19-21, 1990).
6. Hertzog, D.W., et al., Can a Pb/SCIFI Calorimeter Survive the SSC?, to bepublished in the Proc. Workshop on Radiation Hardness of Plastic Scintillator,Tallahassee, FL (March 19-21, 1990).
7. Zorn, c., Studies in the Radiation Resistance of Plastic Scintilla tors, to bepublished in Proc. 1989 IEEE Nuclear Science Symposium, San Francisco, CA(January 1990).
8. Majewski,S., et al., Comparative Studies of the Radiation Resistance of SelectedPlastic Scintillating Fibers, Proc, ECFA Study Week on InstrumentationTechnology for High-Luminosity Hadron Co/liders, CERN Report 89-10, pp.239-249, E. Fernandez and G. Jarlskog (Eds.) (1989).
9. Nuc. Instr. Meth. A281:500-507 (1989).
10. Linn, S.L, SSCSIM User's Guide V2.0, SCRI Report.
R-I

I
,
•,.
•
•
Appendix A
Neutron Irradiation Sample Holder and Dosimetry
AppendixA
Neutron Irradiation Sample Holder and Dosimetry
Capsule Description
An irradiation capsule was designed and constructed that allows thesimultaneous or sequential irradiation of scintillation fibers, straw tubes andelectronic diodes. The capsule was machined from high purity aluminum andcontains an active irradiation volume that is cylindrical with a length ofapproximately five feet and a diameter of two inches. The center of the capsulecontains either an aluminum tube or a plastic rod, each with a diameter of 0.5 in.,which runs the full length of the capsule.
Circular plates surrounding the center tube serve to position the tube in thecenter of the capsule and to also accommodate straw tube samples. Approximatelysix straw tubes of any length up to 58 in. each can be inserted in a series of holes inthe positioning plates which are held in place by blank faced end plates andaluminum sleeves that slide over the inner tube. Figure A-l identifies thedimensions and principal features of the capsule and support structures. A Cdsleeve can be inserted in the space between the guide plates and the capsule wall toallow irradiations in which thermal neutrons have been absorbed. Slots in thecircular plates provide for the positioning of gamma ray or neutron dosimeters anddosimeters may also be inserted in the center tube when small components areirradiated in the center section.
Diodes have been irradiated at much lower fluences than scintillation fibers orstraw tubes and are positioned inside of the center tube on plates containingdosimeters in the irradiations performed to date. Because the neutron fluxdecreases sharply along the tube length, it has been possible to place diodes inpositions that provide roughly an order of magnitude spread in exposure during asingle irradiation. Fibers can be mounted on circular disks that can be positioned atarbitrary positions along the plastic rod, which centers inside the capsule. Eight slitshave been cut into the disks to accommodate the fibers, and the loin. plastic endplug sits on top of the top disk.
A-2
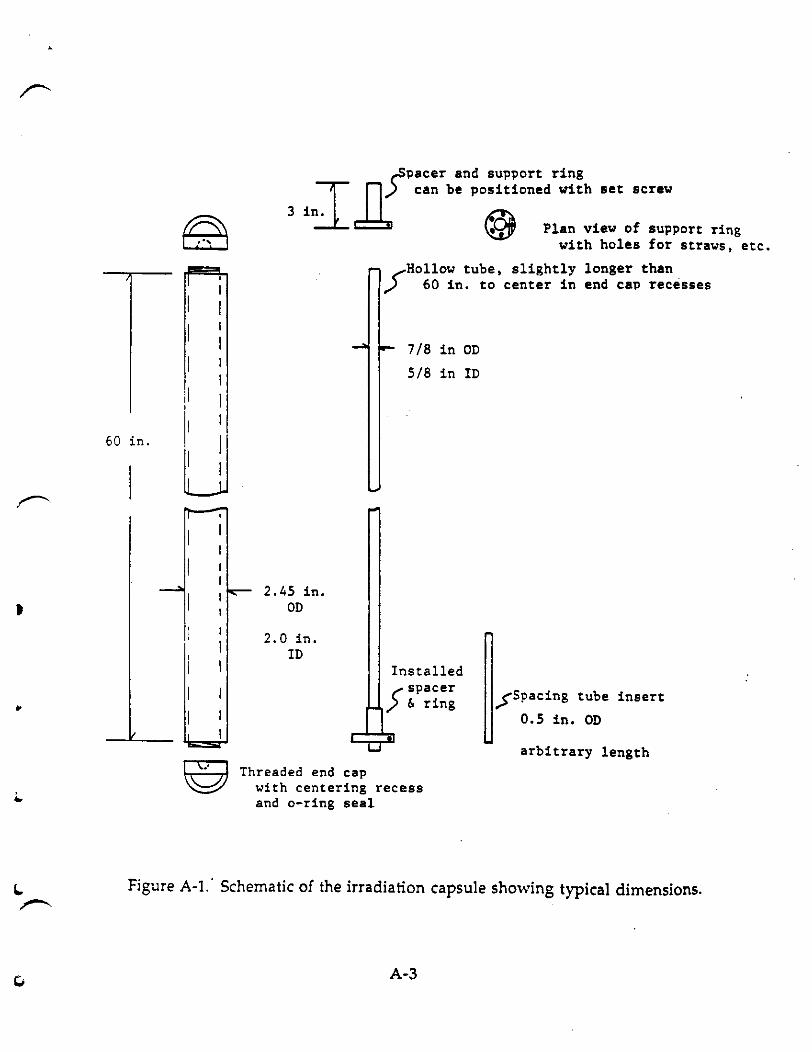
60 in.
~,I
I II 1
II I
II II I
III1
,s~acer and su~~ort ring
Jll) can be positioned with set screw
3 in. ~
~ Plan view of support ringwith holes for straws, etc.
('Hollow tube, slightly longer than.,I 60 in. to center in end ca~ recesses
7/8 in OD
5/8 in ID
2.45 in.OD
Threaded end capwith centering recessand o-ring seal
arbitrary length
;(Spacing tube insert
0.5 in. OD
Installed(" spacer
,; [, ring
2.0 in.ID
,
I II
I I
->1 :~I
, IiI,
I I
I I
I II
Figure A-l.' Schematic of the irradiation capsule showing typical dimensions.
A-3
The active reactor core face is two feet high, so thermal and fast neutron fluxesbegin to decrease sharply approximately twenty inches above the reactor base plate.The capsule is designed to be inverted when long specimens are inserted so that thefast and thermal flux distributions along the full specimen length is approximatedby a skewed Gaussian curve that peaks about four inches from the capsule end andis symmetrical about the tube midpoint, with fluences depressed several orders ofmagnitude at the tube mid-point. Uniform irradiations of long specimens istherefore not possible but a uniform fast and thermal neutron exposure can beobtained near the capsule end over a length of about four inches.
In the irradiations performed to date, the capsule was inserted into a waterfilled tube (VEP position Y shown in Fig. A-2) immediately in front of the reactorcore face and was rotated in longer irradiations to ensure exposure uniformity acrossthe capsule width.
Dosimetry
It will be necessary in different irradiations to obtain accurate measurement ofthermal neutron flux, fast neutron flux and gamma ray dose rates as a function ofreactor core position. The thermal and fast fluxes should maintain constant ratiosin given positions in the absence of strong neutron absorbers but the gamma raydose rate is a function of past reactor operation and can exhibit variability,particularly in the case of low dose irradiations that immediately follow anirradiation at higher power. The irradiations performed to date have started with"cold core" conditions (reactor shut down for prior twelve hours) to provide some
uniformity in gamma ray exposures for exposed specimens.
Thermal and fast neutron fluxes were measured at three inch separations alongthe capsule tube length using indium and cadmium covered indium foils. Indiumabsorbs thermal and epithermal neutrons at predictable rates to yield measurablequantities of radioactive In116m in accordance with the reaction:
The Cd shielded foils remove thermal neutrons and provide a measure of thefast flux with a threshold cutoff of 1.5 eV. Figure A-3 shows the thermal and fastflux distributions as functions of position along the irradiation capsule. The fastneutron fluxes are roughly an order of magnitude below the thermal fluxes near the
A-4
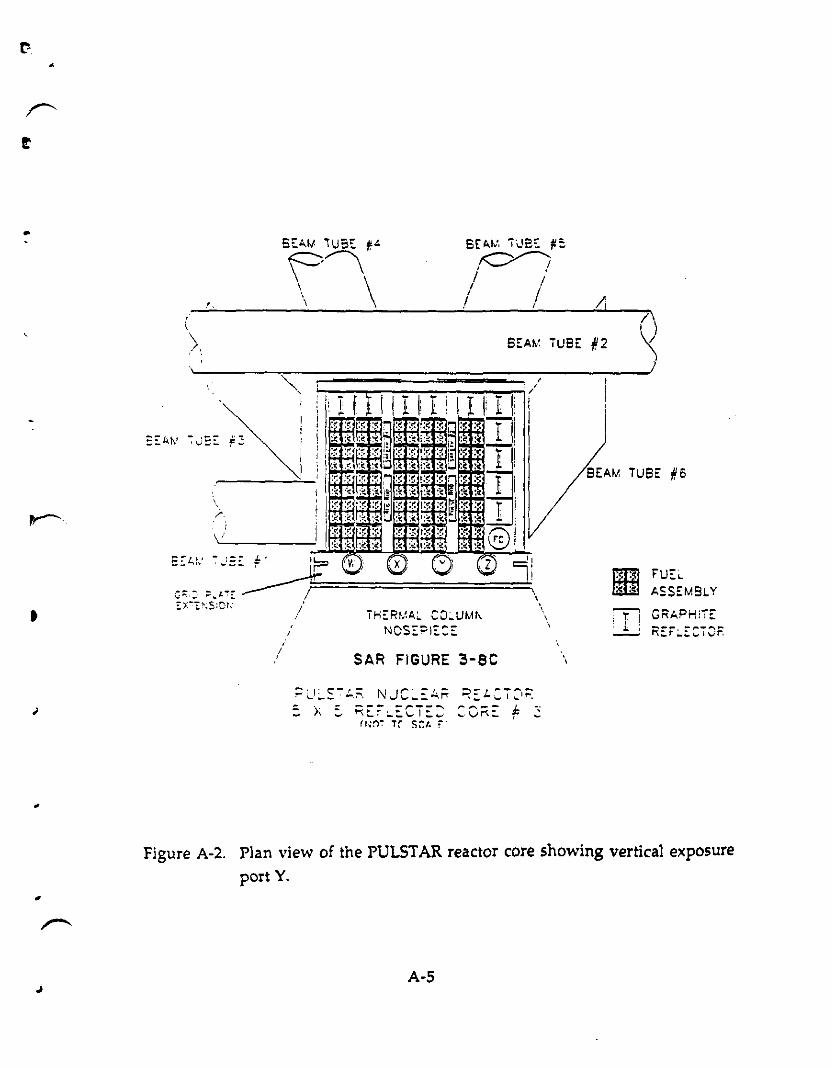
\
\
BEAt.:, ivS:: ~~
,~/ .
I /, /! , Ii
SEAM iUSE #2
FUE"ASSEM9LYGRAPH]T~
ImllmJ.-,-.,; r I....
"
\,
I
I/I
I ,I
,
ISEAM iUSE #6
TH[Rt...~A~ CO;"'UMf\NCSE=IE::E
SAR FIGURE 3-8C
,,,
,I
•
; --- -,..---....... t.r~:. ..... l j; .....
(w')":' "r 5::/. r'
~:: L,:7 :1;::.O~~ # :.;
Figure A-2. Plan view of the PULSTAR reactor core showing vertical exposureport Y.
A-5
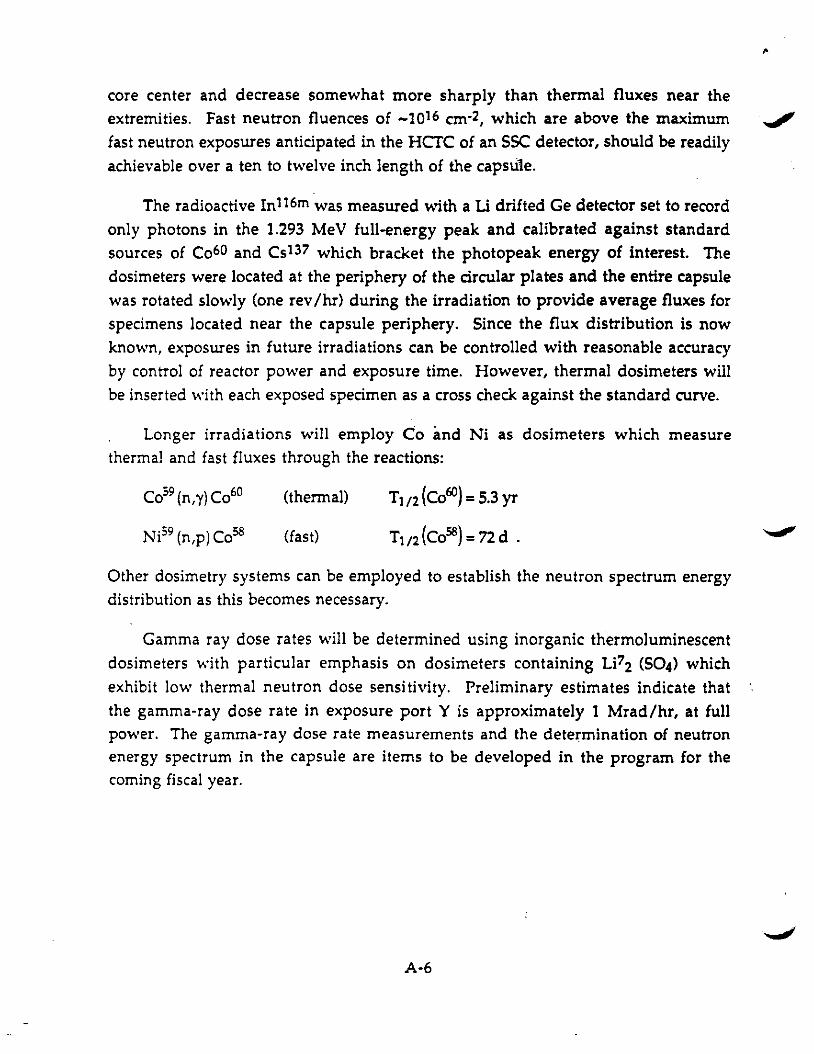
core center and decrease somewhat more sharply than thermal fluxes near theextremities. Fast neutron fluences of -1016 cm-2, which are above the maximumfast neutron exposures anticipated in the HCTC of an sse detector, should be readilyachievable over a ten to twelve inch length of the capsule.
The radioactive In116m was measured with a Li drifted Ge detector set to recordonly photons in the 1.293 MeV full-energy peak and calibrated against standardsources of C0 60 and Cs137 which bracket the photopeak energy of interest. Thedosimeters were located at the periphery of the circular plates and the entire capsulewas rotated slowly (one rev /hr) during the irradiation to provide average fluxes forspecimens located near the capsule periphery. Since the flux distribution is nowknown, exposures in future irradiations can be controlled with reasonable accuracyby control of reactor power and exposure time. However, thermal dosimeters willbe inserted with each exposed specimen as a cross check against the standard curve.
Longer irradiations will employ Co and Ni as dosimeters which measurethermal and fast fluxes through the reactions:
C059(n,y) C060
Ni59 (n.p] Coss
(thermal)
(fast)
Tl/2 (Co60) = 5.3 yr
Tl/2(COSS}=72d.
Other dosimetry systems can be employed to establish the neutron spectrum energydistribution as this becomes necessary.
Gamma ray dose rates will be determined using inorganic thermoluminescentdosimeters with particular emphasis on dosimeters containing Li72 (S04) whichexhibit low thermal neutron dose sensi tivity. Preliminary estimates indicate thatthe gamma-ray dose rate in exposure port Y is approximately 1 Mrad/hr, at fullpower. The gamma-ray dose rate measurements and the determination of neutronenergy spectrum in the capsule are items to be developed in the program for thecoming fiscal year.
A-6
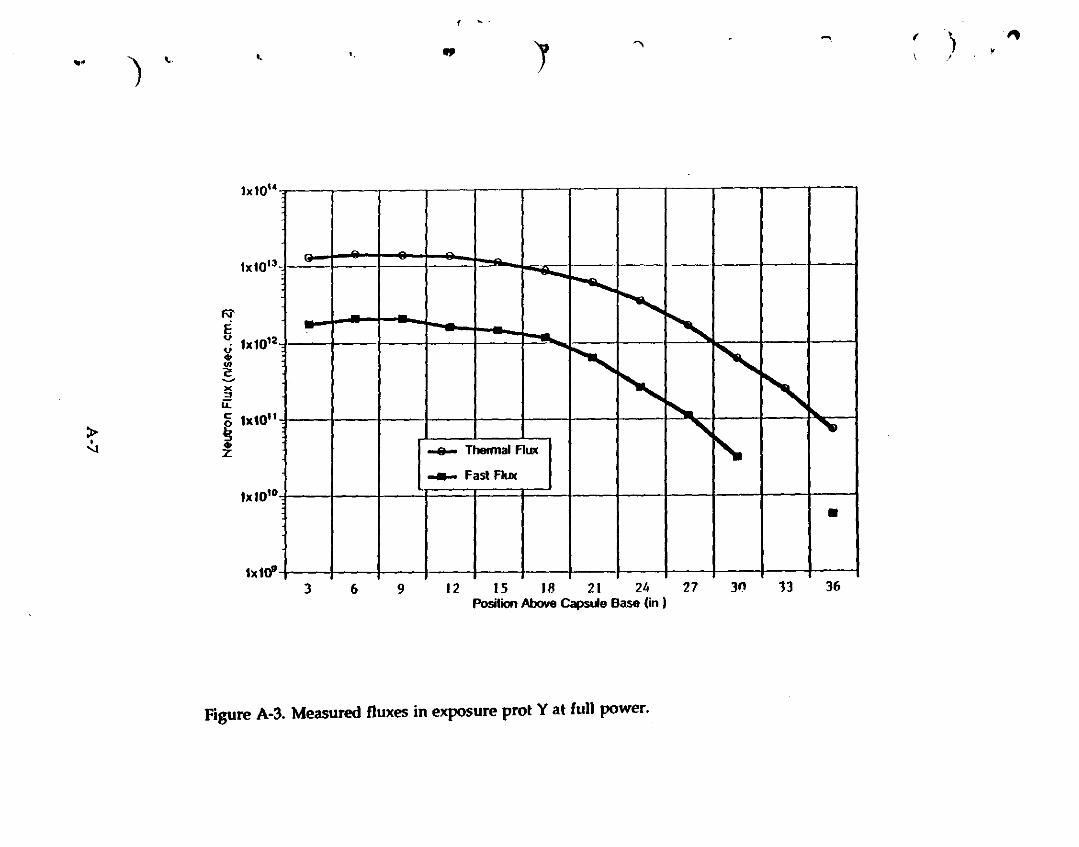
, _.
... ')~. '. .. J '"
... r ), • '"
361331112 15 18 21 21.0 27Position Above Capsule Base (in I
963
I- -.-.....
"-~..,
~f'
r-,
'""-, h..
'" "__ Them1al Aux r-,__ Fast Flux
•
lxlD"
!xIO
tx10'°
fJ'
§<i !xl0'..~~
~u:cg lxl0'
l
!xIO'
>,'-l
Figure A-3. Measured fluxes in exposure prot Y at full power.


![Untitled3 [lss.fnal.gov]lss.fnal.gov/archive/other/sdc/sdc-90-151.pdf · 2009. 8. 12. · SD~-'tO-OO,s-l Or Letter of Intent OT by the SOLENOIDAL DETECTOR COLLABORATION to construct](https://static.documents.pub/doc/80x56/5fd2004678236530e445a345/untitled3-lssfnalgovlssfnalgovarchiveothersdcsdc-90-151pdf-2009-8.jpg)


![SDC-12/SDC-15 · 2018-01-14 · Introduction 6 SDC-12/SDC-151080pD-ILA3D Front Projector2013 User’s Manual AdditionalOptionalAccessories Replacementlamps: •FormodelsSDC-12andSDC-15[2013productionandbeyond]orderlampWC-LPU230](https://static.documents.pub/doc/80x56/5f30eb9530d2254a2869f490/sdc-12sdc-15-2018-01-14-introduction-6-sdc-12sdc-151080pd-ila3d-front-projector2013.jpg)


