240
SOLVAY 2016 Annual Integrated Report MORE FUTURE

Solvay · 2016 Annual Integrated Report01
2016Annual Integrated Report
More Future

Solvay · 2016 Annual Integrated Report
About this report
Our first integrated repOrt
This 2016 Annual Integrated Report is a major milestone in Solvay’s journey towards integrated reporting, which was initiated two years ago, as our introductory section is based on the framework established by the International Integrated Reporting Council (IIRC). It underpins our commitment to sustainable and long-term value creation.
At Solvay, we are convinced that value creation is meaningful only if it is truly enduring. The standards by which we judge our success can only be those in which the sustainability of the planet and the well-being of its people are central concerns.
We take financial and extra-financial criteria into consideration in operational management and strategic decisions. This is why we unveiled the alignment between financial and extra-financial mid-term objectives in 2016 – covering the 13 issues categorized as being “priority” or “high materiality” topics in a comprehensive materiality analysis that we fully reviewed in 2015.
Another first for Solvay: this Annual Integrated Report is aligned with the Global Initiative Reporting (GRI) standards and the information provided serves as a progress report on the implementation of the ten principles of the United Nations Global Compact.
For greater insight into the Group, visit our corporate website: www.solvay.com
Solvay’s strategic objectives
Accounting policies
Further content online
FURTHER READING & FEATURES
Overview In short
This report is also available online with expanded content, including interactive GRI Content Index: annualreports.solvay.com/2016/en
Further reading in the report
2016 highlights
HOw tO apprOacH tHis repOrt
The “Overview” section of this report follows an integrated approach, aligning and simplifying content and putting it into the perspective of our vision and strategy, linking material information, and providing an outlook to the future. The Overview focuses on priority topics for Solvay, presenting the objectives that the Group has pursued over the last few years and its recent key achievements. The Management Report supplements the information provided in this Overview, including a focus on high materiality issues.
Sections with the Sustainable Development Goals (SDGs) icon show how the individual goals are implemented.
Sections with this icon have been audited.

Solvay · 2016 Annual Integrated Report
Table of conTenTs
Solvay is a multi-specialty chemical company, committed to developing chemistry that addresses key societal challenges. Solvay innovates and partners with customers in diverse global end markets. Its products and solutions are used in planes, cars, smart and medical devices, batteries, in mineral and oil extraction, among many other applications promoting sustainability. Its lightweighting materials enhance cleaner mobility, its formulations optimize the use of resources and its performance chemicals improve air and water quality.
Solvay is headquartered in Brussels with around 27,000 employees in 58 countries. Net sales were € 10.9 billion in 2016, with 90% from activities where Solvay ranks among the world’s top three leaders. Solvay SA (SOLB.BE) is listed on Euronext Brussels and Paris (Bloomberg: SOLB.BB - Reuters: SOLB.BR) and in the United States its shares (SOLVY) are traded through a level-1 ADR program.
WHO We ARe
OveRvieW 01
In short 02
2016 key figures 02
Our model for creating sustainable value 04
Chairmen’s message 06
Our performance and outlook 08
Our scorecard 08
Our main indexes 13
Our outlook for 2017 13
Our business environment 14
A fast-changing world 14
Our markets 16
Our strategic positioning 20
Our vision 20
Our strategy 21
Our governance and decision-making processes 24
Our governance bodies 24
Our management bodies 27
Fundamentals guiding our actions 27
MAnAgeMent RepORt 32
Corporate governance statement 33
Risk management 57
Business review 72
Extra-financial statements 96
Financial statements 130
Auditor’s report & Declaration by the persons responsible 225

02Solvay · 2016 Annual Integrated Report
2016 Key figures
UnDERlyIng EBITDAin € million
FREE CAsh FlOwin € million
nET sAlEsby zone
EmplOyEEsby zone
OCCUpATIOnAl ACCIDEnTs AT gROUp sITEs3
per million hours worked
gREEnhOUsE gAs InTEnsITyKg CO
2 eq. per € EBITDA
UnDERlyIng pROFIT ATTRI- BUTABlE TO sOlvAy shARE
in € million
sUsTAInABlE sOlUTIOns (spm)
as percentage of group sales
Europe Latin AmericaAsia Pacific North America
In shOrtOveRvieW
2016 underlying figures; 2015 pro forma and restated information (except for environmental and social figures).
Solvay · 2016 Annual Integrated Report03
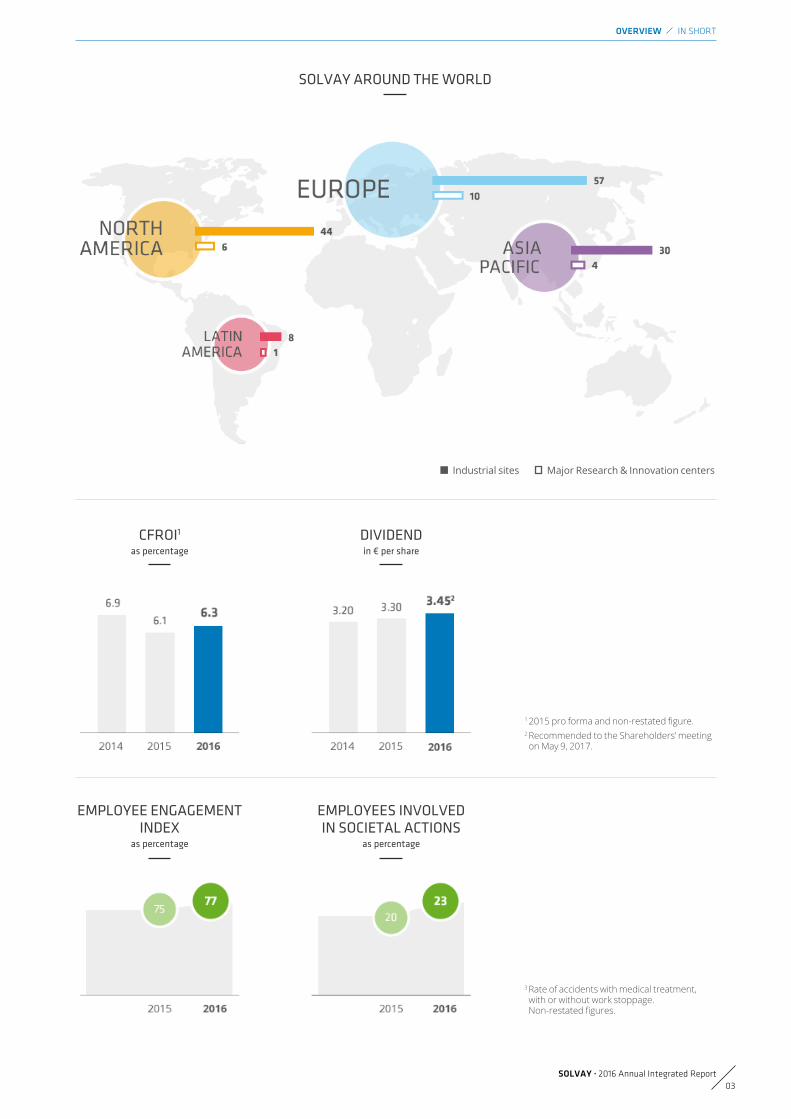
sOlvAy AROUnD ThE wORlD
CFROI1
as percentage
EmplOyEEs InvOlvED In sOCIETAl ACTIOns
as percentage
DIvIDEnDin € per share
EmplOyEE EngAgEmEnT InDEx
as percentage
Industrial sites Major Research & Innovation centers
1 �2015�pro�forma�and�non-restated�figure.2 Recommended to the Shareholders’ meeting on May 9, 2017.
3 �Rate of accidents with medical treatment, with or without work stoppage. Non-restated�figures.
OveRvieW In shOrt

04Solvay · 2016 Annual Integrated Report
Our ambition is to build a new model of sustainable chemistry to help answer some of society’s challenges.
We are convinced that “asking more from chemistry” will enable us to use the resources we need in our business as sparingly as possible in order to create sustainable solutions that hold potential for future generations.
We are transforming into a multi-specialty chemical solutions-provider. We are developing new innovative products and solutions in close partnership with our customers, including some of the world’s leading players in the aeronautics, automotive, electronics, and consumer goods sectors.
OveRvieW OUr MODEL FOr CrEAtInG sUstAInABLE VALUE
HOW We dO business
Our organization ensures that all our business units operate in close proximity to their customers. They anticipate changes in their markets and environments and react with agility, tailoring their products and solutions in response to changing needs. All of our actions are guided by our fundamental principles, to which all our employees are expected to adhere strictly.
ThE REsOURCEs wE UsEA mUlTI-spECIAlTy ChEmICAl
sOlUTIOns-pROvIDER
R&I effort
€ 350Capex from continuing operations
€ 929million
million
ECOnOmIC InpUT 1
Equity attributable to solvay share2
Underlying net debt3
€ 6.6billion€ 7.5
billion
groundwater
165million m3
EnvIROnmEnTAl InpUT
Energy consumption
138Total water intake
580million m3petajoules
9%
sOCIAl InpUT
27,000
23%of women of R&I staff
employees
Through our specialized technological expertise and industrial know-how, leveraging our unique ways of doing business based on a framework of core principles and ethics, we create value for our stakeholders at economic, social, and environmental levels. Only by ensuring the sustainability of the value we create can we truly satisfy our ambition of securing more future for our people, our businesses, the planet, and society at large.
our MoDel for creaTing susTainable Value
• people model & management model
• solvay way
• Code of conduct
More about the fundamentals guiding our actions annualreports.solvay.com/2016/en

Solvay · 2016 Annual Integrated Report05
OveRvieW OUr MODEL FOr CrEAtInG sUstAInABLE VALUE
A Multi-speciAlty cHeMicAl sOlutiOns-pROvideR
With a balanced portfolio – both in terms of markets and geography – we work in close partnership with our customers to develop innovative solutions that create sustainable value today and tomorrow.
ThE vAlUE wE CREATE
Building and Construction
10% of net sales
• Energy performance • Protection & Safety• Resource management
Consumer goods and healthcare
18% of net sales
• Consumer goods• Healthcare
Industrial applications
of net sales18%• Industrial & protective coatings• 3D printing•Metal & surface treatment • Industrial equipment protection
Agro, Feed and Food
10% of net sales
• Agriculture • Feed• Food
Automotive and Aeronautics
28% of net sales
• Lightweighting• Powertrain�efficiency• Electrification• Green technologies
Electrical and Electronics
5% of net sales
• Design & connectivity • Safety• Sustainable solutions• Process�efficiency
Resources and Environment
11% of net sales
• Oil & Gas •Mining• Energy solutions • Environmental protection
patent applications
240group net promoter score
27%
Dividend related to 2016
€ 356million
sales of products released in < 5 years
15%
ECOnOmIC OUTpUT 1
underlying ebitdA
€ 2.3billion
Underlying profit attri-butable to solvay share
€ 846million
sOCIAl OUTpUT
Income taxes paid
€ 212Occupational accidents at group sites4
0.77per million hours worked
million
employee engagement index
77%
employees involved in societal actions
23%
EnvIROnmEnTAl OUTpUT
greenhouse gas intensity
5.86Kg CO2 eq. per € EBITDA 1,000 tons
Industrial hazardous waste not disposed of in a sustainable way
50.30nitrogen oxides
1,000 tons11.10
Air emissions
non-methane volatile organic compounds
1,000 tons4.97
sulfur oxides
1,000 tons5.40
of Group sales
sustainable solutions (spM)
43%
Strategic objective
cFROi
6.3%
cash conversion
59%
million
Free cash flow
€ 876
1 2016�underlying�figures.�2 Excluding perpetual hybrid bonds.3 Including perpetual hybrid bonds.
4 �Rate of accidents with medical treatment, with or without work stoppage. Non-restated�figures.
06Solvay · 2016 Annual Integrated Report
OveRvieW ChAIrMEn’s MEssAGE
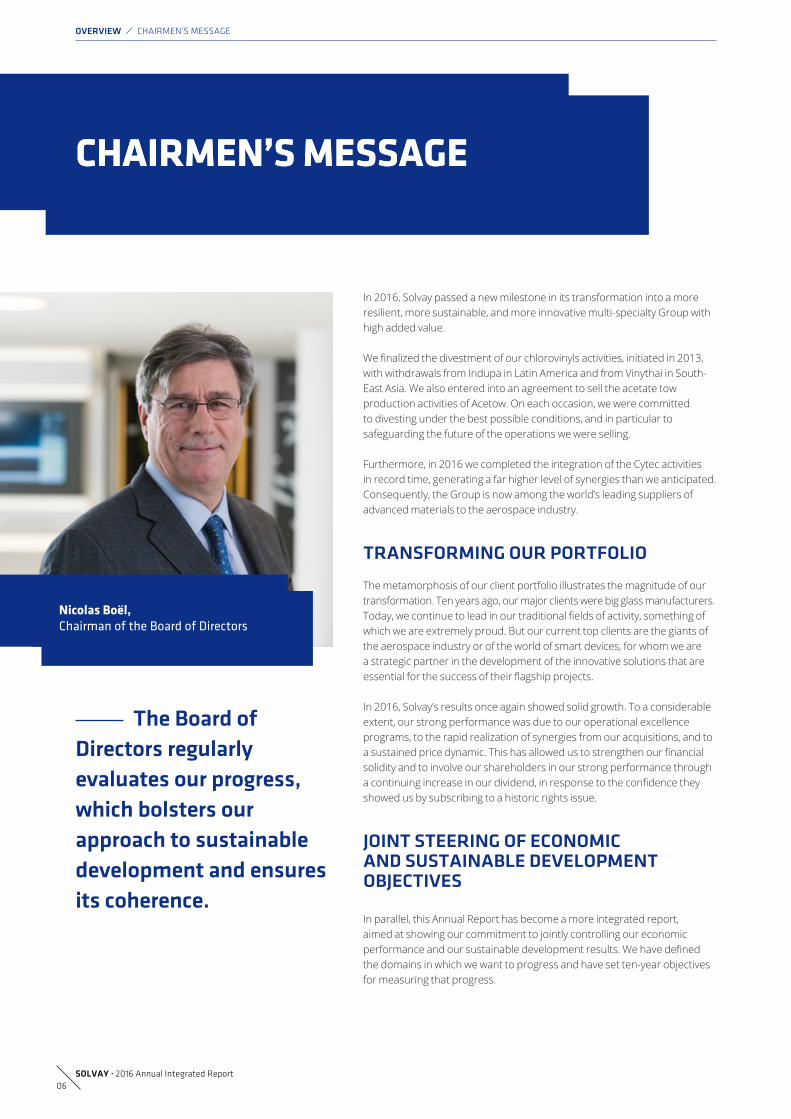
cHairMen’s Message
the board of directors regularly evaluates our progress, which bolsters our approach to sustainable development and ensures its coherence.
In 2016, Solvay passed a new milestone in its transformation into a more resilient, more sustainable, and more innovative multi-specialty Group with high added value.
We�finalized�the�divestment�of�our�chlorovinyls�activities,�initiated�in�2013,� with withdrawals from Indupa in Latin America and from Vinythai in South-East Asia. We also entered into an agreement to sell the acetate tow production activities of Acetow. On each occasion, we were committed to divesting under the best possible conditions, and in particular to safeguarding the future of the operations we were selling.
Furthermore, in 2016 we completed the integration of the Cytec activities in record time, generating a far higher level of synergies than we anticipated. Consequently, the Group is now among the world’s leading suppliers of advanced materials to the aerospace industry.
tRAnsFORMing OuR pORtFOliO
The metamorphosis of our client portfolio illustrates the magnitude of our transformation. Ten years ago, our major clients were big glass manufacturers. Today,�we�continue�to�lead�in�our�traditional�fields�of�activity,�something�of�which we are extremely proud. But our current top clients are the giants of the aerospace industry or of the world of smart devices, for whom we are a strategic partner in the development of the innovative solutions that are essential�for�the�success�of�their�flagship�projects.
In 2016, Solvay’s results once again showed solid growth. To a considerable extent, our strong performance was due to our operational excellence programs, to the rapid realization of synergies from our acquisitions, and to a�sustained�price�dynamic.�This�has�allowed�us�to�strengthen�our�financial�solidity and to involve our shareholders in our strong performance through a�continuing�increase�in�our�dividend,�in�response�to�the�confidence�they�showed us by subscribing to a historic rights issue.
JOint steeRing OF ecOnOMic And sustAinAble develOpMent ObJectives
In parallel, this Annual Report has become a more integrated report, aimed at showing our commitment to jointly controlling our economic performance�and�our�sustainable�development�results.�We�have�defined�the domains in which we want to progress and have set ten-year objectives for measuring that progress.
nicolas boël,Chairman of the Board of Directors
cHairMen’s Message

Solvay · 2016 Annual Integrated Report07
OveRvieW ChAIrMEn’s MEssAGE
Watch Jean-pierre clamadieu’s video annualreports.solvay.com/2016/en
Today, these objectives form an integral part of our ambition to create value. For example, in 2016 we reduced the carbon intensity of our operations significantly�–�by�19%�–�thanks�to�the�transformation�of�our�portfolio.�At�the�same time, the Group’s employee engagement rate is progressing. On the other hand, we have failed to make progress with respect to safety, although our performance is among the best in the chemical sector. As a result, we�are�boosting�our�efforts�in�this�field.
To ensure that our sustainable development permeates the entire organization, the short-term compensation policy includes a sustainable component for all of the Group’s employees. The long-term compensation of management goes even further, integrating a carbon intensity reduction target�taking�effect�as�of�2017.�The�Board�of�Directors�regularly�evaluates�our progress, which bolsters our approach to sustainable development and ensures its coherence.
2017 ObJective: gROWtH
Thanks to the transformation of the portfolio and to the investments in personnel that the Group has made in recent years, 2017 should be a year of growth, especially in terms of volume growth in our Advanced Materials and Advanced Formulations segments.
We are operating in an uncertain geopolitical climate. But�the�diversity�of�our�fields�of�activity,�our�positions�of leadership in innovative activities, our well-balanced global�presence,�and�our�uninterrupted�efforts�in�the pursuit of excellence are the guarantees of the continuity of the Group and of its growth model.
It�is�with�confidence�that�we�are�advancing�towards� our target of building a solid and innovative Group that is capable of creating value for its shareholders and for every one of its stakeholders.
Jean-Pierre clamadieu, Chairman of the Executive Committee and CEO
nicolas boël Jean-pierre clamadieu

08Solvay · 2016 Annual Integrated Report
OveRvieW OUr pErFOrMAnCE AnD OUtLOOk
our PerforMance anD ouTlooK
UnDERlyIng EBITDA
Our 2016 performance
• Underlying EBITDA grew 7.5%, € 2,284 million in 2016
• The EBITDA margin reached a record level of 21% (from 19% in 2015)
• Pricing power: sustained for three years based on excellence programs
• Lower�fixed�costs�benefiting�from�excellence�programs�and�synergies
• Stable�volumes:�specific�market�headwinds�offset�by�growth�elsewhere
Key levers to reach our objective
• Overall demand is anticipated to remain healthy and operational excellence momentum is expected to continue, albeit in an environment of rising raw material prices
2018 underlying ebitdA growth1
Mid-to-high single digit
in € billion
Accelerated synergies with Cytec
When we announced plans to acquire Cytec in 2015, our synergy target was € 100 million within 3 years. In 2016, the integration process went more smoothly than we originally anticipated. As a result,�we�are�confident�that�by�the�end�of�2018�we�will�have�delivered�synergies�of�at�least�€�150�million,�50%�more�than�first�thought.�The�acquisition�was�already�cash�accretive�in�2016.
OBjECTIvE
Strategic objectives: Economic Environmental Social
2016 underlying figures; 2015 pro forma and restated information (except for environmental and social figures).
1At constant forex & scope.
In 2016, we unveiled medium-term value objectives that will accelerate our drive to create sustainable and long-term value as a multi-specialty chemical company. These new goals encompass sustainability as well as�financial�delivery,�creating�value�that�stands�the�test�of�time�and�reinforcing long-lasting market leadership positions.
OuR scORecARd
strategic objectives to drive sustainable value creation

Solvay · 2016 Annual Integrated Report09
OveRvieW OUr pErFOrMAnCE AnD OUtLOOk
FREE CAsh FlOw
CFROI1
Our 2016 performance
• Free Cash Flow in 2016 was € 876 million, up € 384 million year on year
• Continuing operations accounted for € 736 million, up € 342 million
• Discontinued operations accounted for € 140 million
• Cash conversion: 59% in 2016 compared to 50% in 2015
Key levers to reach our objective
• Stronger EBITDA
• Reduced capital expenditure
• Disciplined working capital management
Our 2016 performance
• CFROI improved to 6.3% (vs. 6.1% in 2015).
• This�rise�reflects�our�increasingly�strong�performance,�which�more�than�compensated�for�the�negative�effect�of�0.2�percentage�point�due�to�the�divestments
• Higher EBITDA and lower Capex led to higher Free Cash Flow
Key levers to reach our objective
• Focusing�on�growth�in�profits�and�cash�generation,�while�reducing�in�capital�intensity�will�generate�higher returns, is an integral part of increasing Solvay’s value creation
2018
billion cumulative> € 2.4
2018
basis points increase
50 – 100
in € million
as percentage
Improving cash returns on investments
Solvay’s�cash�flow�return�on�investment�has�continued�to�improve,�from�6.1%�in�2015�to�6.3%�in�2016.�Independently calculated by Credit Suisse, HOLT CFROI measures the cash returns a business earns on the investments it makes. Solvay is focused on growing its underlying EBITDA and Free Cash Flow, while reducing its capital expenditure to drive an improvement in CFROI by 50 – 100 basis points over the 2015 to 2018 period as announced at Solvay’s Capital Markets Day in September 2016.
Worldwide capex management
Expanded production around the world included extra capabilities for composites in Germany, the launch of highly dispersible silica production in South Korea and a new hydrogen peroxide plant in China. Among growth projects still under construction in 2016 were a hydrogen peroxide plant in Saudi�Arabia,�a�PEEK�polymers�plant�in�the�United�States�and�the�second�phase�of�a�fluoro-polymers�plant in China.
OBjECTIvE
OBjECTIvE
Strategic objectives: Economic Environmental Social12015�pro�forma�and�non-restated�figure.

10Solvay · 2016 Annual Integrated Report
OveRvieW OUr pErFOrMAnCE AnD OUtLOOk
gREEnhOUsE gAs InTEnsITy
sUsTAInABlE sOlUTIOns (spm)
Our 2016 performance
• Solvay’s greenhouse gas intensity fell by 19% in 2016 compared with 2015
• The Group’s global greenhouse gas emissions fell by 5.7% in 2016 compared with 2015 while the EBITDA grew by 7.5%
• Changes in Solvay’s portfolio are the primary reason for this evolution
• Our SOLWATT®�energy�efficiency�program�and�process�improvement projects enabled us to save 0.2 Mt CO2 eq. (1.5% of Group emissions) in 2016
Key levers to reach our objective
• Continuously�improve�our�energy�efficiency�through�SOLWATT® and Manufacturing Excellence programs
• Improve the CO2 footprint of our energy mix through initiatives such as:
• Primary�energy�switching�and�conversion�to�biomass�firing
• Renewable electricity sourcing
• Reduce greenhouse gas emissions released from our chemical processing operations
• Optimize the Group portfolio
Our 2016 performance
• At�the�end�of�2016,�43%�of�our�net�sales�were�classified�as�“Sustainable Solutions”, against 33% in 2015
• Revenue in “Sustainable Solutions” enjoys annual growth of 9%, roughly three times growth in GDP
• Transformation of the Group portfolio (integration of Cytec and divestments) accounts for the main part
• Innovation programs aimed at developing more sustainable solutions also contributed to this improvement
Key levers to reach our objective
• The Sustainable Portfolio Management (SPM) analysis is part of the Group’s and the GBUs’ key business processes. It helps analyze the portfolio and allocate resource to elevate it. To be considered a “Solution”, a product must serve in an application that�demonstrates�direct,�significant�and�measurable�social�and/or�environmental�benefits�to�society�at�large
• All innovation and acquisition projects and Capex investments above € 10 million are evaluated using the SPM tool to enhance their contribution to more sustainable and higher growth
2018
compared to 2015-20%
2018
of Group sales40%
2025
compared to 2014-40%
Kg CO2 eq. per € EBITDA
as percentage of group sales
2025
of Group salesat least50%
Transitioning to a low-carbon economy
In 2016, we began to apply an internal price of € 25 per metric ton of CO2 equivalent on greenhouse gas emissions in all our investment decisions. Consequently, climate-related impacts are incorporated into our strategic choices. By implementing a “carbon price signal”, the Group is clearly establishing its commitment to the transition to a low-carbon economy.
Leverage data generated for SPM to bring additional value for customers
At the request of leading surgical device manufacturer Medacta, Solvay provided data generated for its Sustainable Portfolio Management (SPM) initiative to enable documentation of the safety�and�environmental�benefits�of�Medacta’s�novel�GMK® Efficiency�single-use�instrumentation�system.��Injection-molded�from Solvay’s high performance medical grade polymers, GMK® Efficiency�instruments�reduce�the�risk�of�hospital-acquired�infections,�save�significant�quantities�of�water�by�eliminating�the�need for repeated washing and sterilization, and were judged as “CO2-neutral” using an ISO recognized methodology when compared to conventional metal reusable instrument sets.
OBjECTIvE
OBjECTIvE
Strategic objectives: Economic Environmental Social

Solvay · 2016 Annual Integrated Report11
OveRvieW OUr pErFOrMAnCE AnD OUtLOOk
OCCUpATIOnAl ACCIDEnTs AT gROUp sITEs1
2025
of occupational accidents with MTAR < 0.50
-50%
per million hours worked
Our 2016 performance
• Our Medical Treatment Accident Rate (MTAR), an indicator that takes account of the severity of accidents, was stable this year at 0.77 compared to 2015, after four years of progress
• All�Solvay’s�GBUs�have�defined�their�own�specific�Health,�Safety,�and�Environment�roadmaps�which�take the Group’s requirements into account
• 146 sites had behavioral safety programs in place at year end
• As part of the commitment by all managers to promote safety, 1,580 leadership safety visits took place, leading to greater implementation of safety measures
• Despite�our�continuous�efforts�to�improve�occupational�safety,�we�have�experienced�several�severe�accidents and a fatality at a production facility in India
Key levers to reach our objective
• Develop a safety mindset through our Solvay Safety Excellence Plan to drive continuous improvement and sustainability in our performance
• Promote best practices sharing
• Promote the reporting of “near misses” and analyze those with high potential for severity
• Reinforce Solvay Life-Saving Rules, whose objective is to prevent high-severity accidents
• Develop�Safety�Leadership�with�specific�training�for�all�our�site�managers
• Launch of a campaign to prevent hand injuries, which currently account for 50% of Medical Treatment Accidents
Safety Days in all the Group’s sites
To establish a safety culture in all our sites, local teams organize safety-focused events at least once a year involving their employees (and sometimes their subcontractors). In 2016, all of our sites held Safety Days. Programs vary from site to site – often involving trainings and also awards, quizzes, competitions and demonstrations – with the objective of making sure that everyone knows and applies our Life-Saving Rules and abides by our Health, Safety, and Environment policy, “Think Twice, Act Once”. Attention to safety very often goes beyond the workplace: for instance, our Bulgarian Devnya plant has launched a campaign to encourage children to sit in the rear of the car and wear safety belts!
OBjECTIvE
Strategic objectives: Economic Environmental Social1 �Rate of accidents with medical treatment, with or without work stoppage. Non-restated�figures.
12Solvay · 2016 Annual Integrated Report
OveRvieW OUr pErFOrMAnCE AnD OUtLOOk
EmplOyEEs InvOlvED In sOCIETAl ACTIOns
EmplOyEE EngAgEmEnT InDEx
as percentage
as percentage
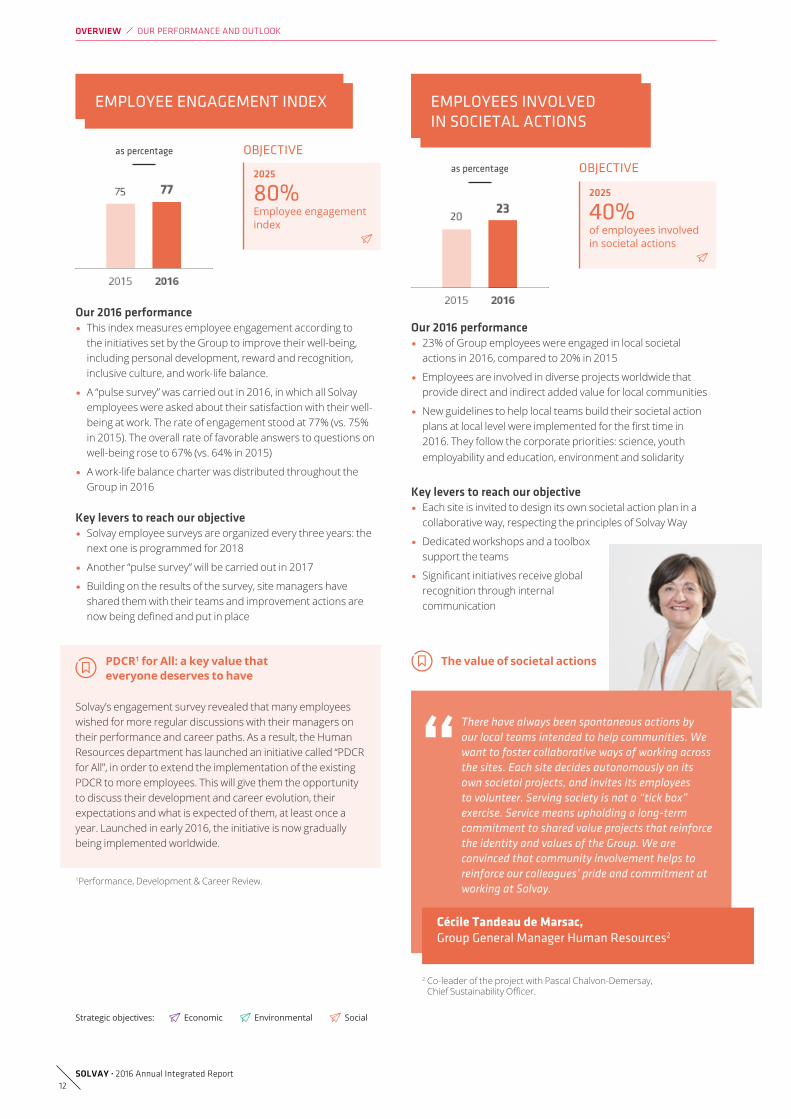
Our 2016 performance
• This index measures employee engagement according to the initiatives set by the Group to improve their well-being, including personal development, reward and recognition, inclusive culture, and work-life balance.
• A “pulse survey” was carried out in 2016, in which all Solvay employees were asked about their satisfaction with their well-being at work. The rate of engagement stood at 77% (vs. 75% in 2015). The overall rate of favorable answers to questions on well-being rose to 67% (vs. 64% in 2015)
• A work-life balance charter was distributed throughout the Group in 2016
Key levers to reach our objective
• Solvay employee surveys are organized every three years: the next one is programmed for 2018
• Another “pulse survey” will be carried out in 2017
• Building on the results of the survey, site managers have shared them with their teams and improvement actions are now�being�defined�and�put�in�place
Our 2016 performance
• 23% of Group employees were engaged in local societal actions in 2016, compared to 20% in 2015
• Employees are involved in diverse projects worldwide that provide direct and indirect added value for local communities
• New guidelines to help local teams build their societal action plans�at�local�level�were�implemented�for�the�first�time�in�2016. They follow the corporate priorities: science, youth employability and education, environment and solidarity
Key levers to reach our objective
• Each site is invited to design its own societal action plan in a collaborative way, respecting the principles of Solvay Way
• Dedicated workshops and a toolbox support the teams
• Significant�initiatives�receive�global�recognition through internal communication
PDCR1 for All: a key value that everyone deserves to have
Solvay’s engagement survey revealed that many employees wished for more regular discussions with their managers on their performance and career paths. As a result, the Human Resources department has launched an initiative called “PDCR for All”, in order to extend the implementation of the existing PDCR to more employees. This will give them the opportunity to discuss their development and career evolution, their expectations and what is expected of them, at least once a year. Launched in early 2016, the initiative is now gradually being implemented worldwide.
2025
Employee engagement index
80% 2025
of employees involved in societal actions
40%
OBjECTIvE
OBjECTIvE
There have always been spontaneous actions by our local teams intended to help communities. We want to foster collaborative ways of working across the sites. Each site decides autonomously on its own societal projects, and invites its employees to volunteer. Serving society is not a “tick box” exercise. Service means upholding a long-term commitment to shared value projects that reinforce the identity and values of the Group. We are convinced that community involvement helps to reinforce our colleagues’ pride and commitment at working at Solvay.
cécile Tandeau de Marsac,group general manager human Resources2
The value of societal actions
“
1Performance, Development & Career Review.
2 Co-leader of the project with Pascal Chalvon-Demersay, Chief�Sustainability�Officer.
Strategic objectives: Economic Environmental Social

Solvay · 2016 Annual Integrated Report13
OuR OutlOOK FOR 2017
Solvay�strives�at�all�times�to�earn�and�retain�the�confidence�and�support�of�all�its�stakeholders.�We�firmly�believe in the need to balance both short- and long-term value creation. The process of transforming the�Group�needs�to�be�financed�by�effective�performance�in�terms�of�profit,�cash�and�returns.�Yet�the�creation of value should be enduring, making a positive impact on the planet and on people.
For 2017, based on the market conditions prevailing at the beginning of the year, Solvay expects underlying EBITDA to grow by mid-single digit, mainly driven by Advanced Materials and Advanced Formulations. Overall demand is anticipated to remain healthy and operational excellence momentum is expected to continue, albeit in an environment of rising raw material prices. The EBITDA outlook is based on constant scope and foreign exchange rates1.
We�endeavor�to�perform�strongly�on�both�financial�and�extra-financial�indexes.�Solvay�is�included�in:
OuR MAin indexes
OveRvieW OUr pErFOrMAnCE AnD OUtLOOk
Free Cash Flow from continuing operations is expected to exceed € 800 million in 2017, compared to € 736 million in 2016, driven by higher EBITDA and reduced capital expenditures.
An�integral�part�of�our�sustainable�value�creation�is�the�targeted�improvement�in�extra-financial�objectives. After the strong delivery in 2016, we expect to continue to improve our greenhouse gas intensity, and to further enhance the prominence of sustainable solutions in our portfolio.
Our expectations for 2017 are very much in line with the mid-term objectives shared with investors during our Capital Markets Day in September 2016.
• the BEL 20 index
• the CAC 40 index
• the Euronext 100 index
• the DJ Stoxx, DJ Euro Stoxx, FTSE 300, MSCI and other indexes
• the FTSE4Good Index
• the Euronext Vigeo World 120 Index
• the Ethibel Sustainability Index Excellence Europe in which Solvay�has�been�reconfirmed�as�a�constituent
In addition, Solvay is rated as a “Prime” company by Oekom Research AG, one of the world’s leading rating agencies for sustainable investment.
1� Solvay�is�exposed�to�foreign�exchange�fluctuations.�The�main�currency�exposure�is�to�the�US�dollar,�Chinese�yuan,�Thai�baht,�Brazilian�real,�Russian�ruble,�Japanese yen and Korean won.
Advanced Materials • growth will be driven by most markets, including aerospace,
automotive, consumer goods & healthcare and electronics.
Advanced Formulations • growth is projected in several end markets including agro,
coatings and mining, with improving conditions in oil & gas.
Performance Chemicals • is expected to show stable to modest growth, with anticipated headwinds�in�the�soda�ash�market�offset�by�operational�excellence and Solvay’s capacity increase in peroxides.
Functional Polymers • is�projected�to�be�flat,�retaining�the�growth�achieved�in�2016.�
Corporate & Business Services • are�committed�to�excellence�measures�to�offset�inflation.

14Solvay · 2016 Annual Integrated Report
our business enVironMenT
OveRvieW OUr BUsInEss EnVIrOnMEnt
Major global economic and social trends such as demographic shifts, evolving consumer behavior, faster innovation and�resource�scarcity�are�redefining�the�way�people�interact,�communicate,�move�around,�and�shop.�Chemistry�plays a key role in meeting these challenges that our world faces. Standing side-by-side with its customers to better understand their needs, Solvay helps them innovate and turn their challenges into market opportunities through sustainable and value-added solutions.
A FAst-cHAnging WORld
Chemical companies have to adapt to structural changes along with growing uncertainties. Key macro-economic trends such as emerging markets (including China) transitioning to new economic models, slower-for-longer global growth, the end of the commodities super-cycle (e.g. oil and�gas),�and�higher�volatility�(in�raw�materials,�currencies,�financial�markets)�are continuing to drive these changes. In this challenging environment, consolidation is accelerating within each segment of the chemical industry. The main players are reshaping their portfolios, reallocating resources towards a more coherent portfolio of assets. Solvay is committed to adapt to this new equation to capture future growth through anticipation, innovation and agility.
Going further in understanding our challenges
Two years ago, we fully reviewed our materiality analysis in order to better understand the impacts of global and industry trends on Solvay’s activities and strategy, and to identify emerging topics. This has allowed us to identify 13 topics which are critical for the Group. These topics cover environmental, social, human, business model and innovation, leadership and governance issues, for which action plans were defined�and�which�remain�under�scrutiny.�This�materiality analysis approach is a basis for our dialog with stakeholders.
Evolving demography and consumer behavior
Growing world population, urbanization, changing balance of economic power and booming middle class in Asia and Africa are transforming societal and economic paradigms.
These�evolutions�are�redefining�collective�and�individual�behaviors,�leading�to deep mutations in the way people interact, communicate, and move around.
Our responseConstantly gaining better knowledge of our customers, we are increasingly developing innovative and competitive�solutions,�helping�them�adopt�simplified�and accessible products and services that are tailored to the present and future demands of their end-consumers.
To get closer to our customers, we regularly hold Tech Days with key actors in our markets (e.g. aeronautics, automotive, agro, etc.) to demonstrate the added value and potential they can derive from chemistry (in eco-mobility, for instance). We have also adapted our organization to foster agility and customer-centricity.
2020
25%By 2020, 25% of the world’s population is expected to live in cities.
2050 2050
+60 years 9.1 billionThe number of people over 60 will more than double by 2050, and will represent more than a quarter of the world population.
Feeding a world population of 9.1 billion people in 2050 would require raising overall food production by some 70%.

Solvay · 2016 Annual Integrated Report15
OveRvieW OUr BUsInEss EnVIrOnMEnt
Innovation acceleration
Resource constraints and demand for sustainability
2030 2030
2030
+40% -20%
3.9 billion
By 2030, greenhouse gas emissions will increase by 40%, leading to an average temperature rise of 0.5-1.5°C.
By 2030, available agricultural land per person will decline by 20% to 0.4 acres (0.16 ha.).
By 2030, water scarcity will worsen, affecting over 3.9 billion people.
2024
89%By 2024, 89% of new cars will have embedded connectivity (vs. 15% in 2014).
+60%End products using additive- manufacturing form the industry’s fastest-growing segment, with a 60% annual growth rate.
2020
$233.3 billionThe size of the global digital health market is expected to reach $233.3 billion in 2020.
The�boom�of�digital�technologies�and�mobility,�scientific�development,�combined with accelerated innovation cycles are transforming how we work and how we live and consume, reshaping most of the industries. Competitiveness and sustainability are not just about keeping costs and prices low anymore, they are about innovating to meet the customer’s constantly evolving expectations.
Our responseInnovation allows us to provide our customers with sustainable chemical solutions that help them address some of their challenges.
Nurturing an innovative ecosystem by working in close proximity to our customers and key partners, we often innovate through co-development. Internally, our Corporate Research & Innovation team assists the Group’s Business Units in their innovation projects, not only helping them innovate more, but accelerating the speed of innovation.
Climate change, competition for resources and space usage, sustainability of�public�financing�challenge,�etc.:�resource�constraints�and�increasing�demands for sustainability are leading to critical management of environmental,�financial�and�human�resources.�Industries�will�have�to�search�for�new�sustainable�solutions�to�both�prevent�and�fight�these�changes.
Our responseOur solutions contribute to meeting tomorrow’s sustainability challenges, whether by providing cleaner forms of energy for a growing number of consumers, satisfying the increasing demand for food or creating cost-effective�and�urban-focused�mobility�solutions.�
To accelerate our shift towards a more sustainable product portfolio, we have embedded Sustainable Portfolio Management (SPM) in all our key processes. This�methodology�allows�us�to�define�the�ratio�of�environmental�cost�to�benefit�for�the�planet�for�each�solution we develop, helping us measure our progress towards our ambition of raising the proportion of sustainable solutions to 40% of net sales by 2018.

16Solvay · 2016 Annual Integrated Report
OuR MARKets
COnsUmER gOODs AnD hEAlThCARE
Our activities focus on markets to which we bring value by developing innovative and competitive solutions that help our customers respond to the constantly evolving challenges faced by the planet and its people. We tailor high value-added solutions to the current demands of end users and anticipate their future needs.
On the basis of our core technologies, expertise, and skills we have developed solid positions on seven distinct markets with high growth potential: consumer goods and healthcare, automotive and aeronautics, resources and environment, agro, feed and food, electrical and electronics, building and construction, and industrial applications.
OveRvieW OUr BUsInEss EnVIrOnMEnt
improving the quality of lifeConsumer behavior is changing as populations in mature economies are growing older and the middle classes in Africa, Asia and Latin America are increasing. Consumers want easy-to-use and multifunctional solutions that are tailor-made, safe and sustainable and that contribute to their health and well-being.
Turning challenges into market opportunities in partnership with our customers
In all the main value-added businesses in our portfolio, we work ever more closely with our customers on each market, learning about their businesses and their ecosystems. With the knowledge and understanding that come from such close collaboration, we are in an excellent position to innovate alongside our customers. Anticipating their needs, we can devise new chemical solutions that, in turn, further stimulate our customers’ product development and help them create more value.
“sophie Desormière, group general manager marketing & sales
consumer goodsFrom smart textiles to personal care, our broad portfolio offers�innovative,�sustainable�and�competitive�solutions.�We�are constantly improving the performance of our products by combining innovation and sustainability, as we have done with EURECO® organic peroxide for detergents and the global license agreement on encapsulation technology recently signed with Revolymer.
HealthcareWe�offer�a�unique�range�of�thermoplastics�for�implantable�and�non-implantable medical devices. Our portfolio of advanced medical-grade polymers includes RADEL® PPSU, which has excellent impact strength, and VERADEL® HC PESU, which is resistant to high temperatures. We are also active in the pharmaceuticals sector: our BICAR® sodium bicarbonate is widely used�for�effervescent�tablets.
of net sales18%
Expanding our key customer base
Over the past few years, our top customers have�significantly�changed,�and�now�include some of the world’s leading players in aircraft, automotive, tires, smart devices and consumer goods – who we provide with unique solutions that are critical for the success of their programs. Solvay has become a unique supplier of product material formulations, key to the performance of its customers.

Solvay · 2016 Annual Integrated Report17
OveRvieW OUr BUsInEss EnVIrOnMEnt
cleaner mobilityManufacturers have to comply with ever more stringent regulations on CO2 and particulate emissions while meeting consumer demand for safer and more environmentally sustainable travel. Our solutions contribute to cleaner, safer and more�energy-efficient�modes�of�transportation.
lightweightingWe are an integrated player with a comprehensive portfolio of lightweight materials that make vehicles and aircraft more fuel-efficient�and�cost-effective.�These�range�from�high-performance�polymers�to�long-fiber�compounds,�tapes,�foams�and�the�most advanced composite solutions for semi-structural and structural applications. For the automotive industry, they include SOLVALITE™ thermoset composites and EVOLITE™ thermoplastic
of net sales28%
composites, which enable short cycle times and superior toughness. Among Solvay’s aerospace solutions is TEGRACORE™, a�structural�foam�with�excellent�resistance�to�fire�and�water.
powertrain efficiencyOur�polymers�and�fluorinated�products�provide�effective�thermal�control solutions, optimized acoustic systems and corrosion protection for automobile powertrains. NOCOLOK® Flux, a high-quality�fluxing�agent�used�for�brazing�aluminum�components,�is�an industry standard for aluminum heat exchangers.
electrificationThe future of electromobility depends on batteries with higher energy density, greater power and lower cost. Solvay develops solutions that meet the highest requirements in terms of safety and of temperature and chemical resistance. They address the�needs�of�the�entire�battery�system,�with�a�specific�focus�on a new generation of electrolyte additives, salts, binders and separators improve lithium-ion battery performance. Our SOLEF®�PVDF�electrode�binders�offer�enhanced�adhesion�and�cohesion properties required for high-energy electric vehicle drives.�Meanwhile,�our�TECHNYL® engineering plastics have now expanded�with�TECHNYL® REDx, a specialty polymer developed to resist the higher continuous heat stress of new-generation engines.
green technologiesPremium SW, our range of Highly Dispersible Silica (HDS), helps reduce the rolling resistance of tires, thereby lowering both fuel consumption and CO2�emissions.�OPTALYS®, one of our rare earth catalytic materials, reduces emissions of NOx and other gaseous pollutants. It can be customized to exactly meet customer�specifications.
ElECTRICAl AnD ElECTROnICs
connectivity and energy efficiencyWe work closely with manufacturers of electrical and electronic equipment, to ensure that our miniaturization technology and advanced materials are fully geared to their needs and provide them with new perspectives in terms of design, safety and energy performance.
5% of net sales
design & connectivityOur strong and rigid KALIX® HPPA polyamides are used to manufacture slim and stylish smart phones.
safetyOur�polyamide�solutions�allow�electrical�equipment�to�offer�higher�temperature�resistance,�more�efficient�fire�protection�and user safety. Our specialty polyamide AMODEL®�PPA�offers�particularly good resistance to continuous heat, and can replace metals in high-temperature automotive applications.
sustainable solutionsFor low-energy lighting solutions, we provide materials for LED lighting applications. Energy-saving light bulbs using LUMINOSTAR® product range consume up to seven times less energy than incandescent bulbs.
process efficiencyWith increasingly small device geometries, the need for advanced cleaning solutions to manufacture the future generation of semiconductors�is�growing�very�significantly.�Our�INTEROX® PICO hydrogen peroxide is the reference for semiconductor manufacturers.
AUTOmOTIvE AnD AEROnAUTICs

18Solvay · 2016 Annual Integrated Report
AgRO, FEED AnD FOOD
sustainable living, environmental protectionThe growing global population requires greater agricultural yields and better resource management. Solvay’s unique portfolio of innovative solutions supports customers from farmers to food processors, helping them operate responsibly and sustainably.
AgricultureOur�eco-efficient�bio-polymers�and�RHODIASOLV® POLARCLEAN solvents improve crop protection and yields. Our AGRHO™ solutions, which promote water and nutrient retention in plants, enable our customers to reduce the use of resources and environmental�impact.�PROCROP™�is�an�effective�and�sustainable�alternative to conventional pesticides in grain silos.
FeedOur silica and sodium bicarbonate-based solutions meet the quality, food safety and productivity requirements of this market. A feed supplement for livestock, BICAR® Z sodium bicarbonate, helps�fight�acidosis�and�thus�contributes�to�animal�health.�Our�PARAMOVE® solution is a hydrogen peroxide-based solution for the�fish�farming�industry�that�controls�sea�lice�in�salmon.
FoodWith more than 130 years of expertise in producing vanilla aroma, we�recently�introduced�two�new�natural�VANIFOLIA™�flavor�brands and broadened our GOVANIL® range in order to help reduce sugar and fat content in food products. We also produce numerous products with applications in the food packaging sector, including SOLVERA®�PFPE,�a�fluorinated�fluid�used�as�surface treatment for oil- and grease-resistant packaging.
OveRvieW OUr BUsInEss EnVIrOnMEnt
10% of net sales
Affordable resources and environment protection Solvay’s sustainable solutions for the oil and gas, mining, and energy�generation�and�storage�sectors�help�its�customers�offer�their�own�consumers�energy-efficient�and�environmentally-friendly products and services.
Oil & gasWe�supply�products�tailored�to�the�specific�needs�of�all�the�key�phases in the oil and gas value chain: exploration, production, stimulation,�transport�and�refining.�SOLEF® PVDF is used to manufacture pipelines that resist corrosion and high temperatures, and avoid leakage. Our solutions for oil extraction include additives like natural guar derivatives and surfactants that increase yields and limit the environmental impact of drilling.
REsOURCEs AnD EnvIROnmEnT
11% of net sales
MiningWe are a leading supplier of specialty mining reagents, which enable customers in the mining industry to improve productivity and reduce operating costs for the recovery of many metals and minerals, especially copper, alumina, gold, silver, uranium, nickel/cobalt and polymetallic ores. Our INTEROX® hydrogen peroxide both�enhances�the�recovery�of�metals�and�detoxifies�water�elements after metal extraction.
energy solutionsOur solutions are used in the production and storage of renewable�energies�and�to�improve�energy�efficiency.�HALAR® ECTFE brings high performance and UV protection to photovoltaic panels. Our LiTFSI lithium salt makes Li-Ion batteries last up to 20% longer while improving safety and performance. We were a partner in the recently concluded LIFE+ GLEE project, which focused on replacing organic solvents with water in the Li-Ion battery manufacturing process.
environmental protectionOur solutions support air and water treatment and soil remediation�using�filtration,�gas�separation,�absorption,�and chemical reactions. Both UDEL® PSU and ALGOFLON® PTFE�ensure�better�water�filtration�in�membrane�processes,�while INTEROX® hydrogen peroxide is widely used in drinking water treatment. SOLVAIR® Solutions are a range of products and systems for air emission control and associated waste management that meet the demands of waste-to-energy incineration, industrial boilers, cement manufacturing, etc.

Solvay · 2016 Annual Integrated Report19
OveRvieW OUr BUsInEss EnVIrOnMEnt
InDUsTRIAl ApplICATIOns
efficiency and valueStriving to comply with ever stricter regulations, industrial players seek to introduce bold innovations that make their production more�efficient�and�their�products�more�competitive.�We�develop�materials and processes that help manufacturers get more out of their equipment in a more responsible way.
BUIlDIng AnD COnsTRUCTIOn
sustainability and energy efficiencyDemand is growing for longer-lasting buildings that reduce energy consumption and enhance their users’ well-being. Our solutions�focus�on�meeting�the�ever�more�stringent�certification�systems that measure environmental performance in passive residential and commercial buildings.
energy performanceOur solutions are used in foam wall insulation for low-energy housing. POLIDAN®�PEX�offers�excellent�heat�and�hydrolysis�resistance and is a polyethylene particularly suitable for cable insulation�and�sheathing.�SODA�SOLVAY® soda ash, which acts as�a�fluxing�agent�for�glass,�is�used�in�the�manufacture�of�high-performance energy-saving triple-glazed windows.
10% of net sales
of net sales18%
protection & safetyWe provide materials that give buildings greater safety and longevity�through�increased�resistance�to�fire,�corrosion�and�UVs.�These include a wide range of VOC1 -free and APE2 -free additives in our RHODOLINE® products, which also provide exceptional color strength for industrial coatings and architectural paints. Meanwhile,�our�CYASORB�CYNERGY�SOLUTIONS® stabilizer provides�construction�OEMs�with�a�UV-resistant�polyolefin�suitable�for�roofing�components.
Resource managementOur high-performance plastics ensure the robustness of water supply systems and drinking water quality. Our bio-sourced TECHNYL�eXten® range of materials for plumbing applications was recently awarded full drinking water contact approvals in the U.S., the UK, France and Germany. Solvay is one of the few material�suppliers�worldwide�to�offer�full�European�and�American�certification.�
industrial & protective coatingsWe�offer�a�wide�range�of�binders,�solvents,�pigments�and�additives. Our eco-friendly RHODIASOLV® IRIS biodegradable solvent is used in industrial cleaning, resin clean-up, foundry resins, paint stripping, paints and coatings.
3d printingWe�offer�3D�printing�polymers�like�SINTERLINE®�TECHNYL® for prototyping, widely used in the aerospace and automotive industries. This range was recently strengthened to accommodate a predictive simulation platform.
Metal & surface treatmentOur�solutions�improve�the�performance�of�finished�products.�The�RHODOCLEAN® formulation for industrial cleaning and the bio-based AUGEO® SL191 solvent for leather processing exemplify our environmentally responsible solutions.
industrial equipment protectionOur ranges of SOLEF®�fluoropolymers�and�TECHNYL® high-performance�polyamides�offer�superior�resistance�to�corrosion,�high temperatures and chemical aggression.
1VOC: Volatile Organic Compounds2APE: Alkyl Phenol Ethoxylates

20Solvay · 2016 Annual Integrated Report
OuR visiOn
We are one of the world’s foremost industrial groups in the specialty chemical segment. We are committed to developing the role of chemistry in introducing sustainable solutions that will help resolve challenges faced by the planet and society. Our vision consists in creating “more future” – a future with more potential, for ourselves, our children, our planet, and its people.
It is chemistry that will shape this future by making the impossible possible. Our pioneering spirit is inherited from our founder, Ernest Solvay. We are just as determined today as he was 150 years ago to dedicating our expertise in chemistry to acting responsibly and furthering our desire to make the world a better place.
throughout our 150-year history, we have always been driven by the strong belief that innovative chemistry holds the solutions for future generations. Asking more from chemistry, our ambition is to play a crucial role in bringing more future to our people, our customers, and society.
People are at the heart of our vision. We are a company of people, and we strive to give them a better future by helping them develop, honing their skills, and recognizing their talents. Their mindset – characterized by agility, collaboration, curiosity, and courage – guarantees our success and performance; it is the vital resource that drives us to achieve more innovative sustainable solutions with less depletion of natural reserves and less waste.
Our progress has always been all about continuously reinventing what we do and how we do it. The courage to transform ourselves is a fundamental building block of our success.
OveRvieW OUr strAtEGIC pOsItIOnInG
our sTraTegic PosiTioning
150 years of innovation and scientific progress
Our�Group�can�look�back�on�a�scientific�and�entrepreneurial�heritage.�Solvay�is�the�fruit� of the resolution and determination of a young self-taught visionary surrounded by a small network of associates. Passionate about science, Ernest Solvay patented a process for producing soda ash in 1863 and set up a company to manufacture it.

Solvay · 2016 Annual Integrated Report21
OveRvieW OUr strAtEGIC pOsItIOnInG
OuR stRAtegy
Our strategy is to develop as a multi-specialty chemical solutions-provider that contributes to addressing the world’s challenges by focusing on the innovative sustainable solutions we bring to our customers. We see a lot of opportunities in our challenging and fast-changing environment. We are continuing to execute our transformation to generate stronger growth, more resilience, and greater returns for our shareholders.
Pursuing functional excellence in order to be at the forefront of our industry, innovating to create new sustainable solutions that focus on return on investment.
Establishing a strong position in segments where we are already active and transforming our portfolio towards more advanced materials and formulations.
“The way we achieve results” with our four key business pillars, including customer-centricity, collaborative innovation, relentless excellence, and superior Group performance.
ExECUTIng OUR TRAnsFORmATIOn
portfolio upgrade
excellence and
synergies
Management Model
2016 has been a strong year of delivery for the Group, in which we met our objectives by achieving key milestones on each of our strategic levers – Portfolio upgrade, Excellence and Synergies, Management Model.
stROngeR gROup

22Solvay · 2016 Annual Integrated Report
excellence And syneRgies
More global, resilient, sustainable, and innovative
pORtFOliO upgRAde
For several years now, we have been reshaping our portfolio to include more advanced technologies, positioning ourselves as a solution provider to help our customers increase their competitiveness. By transforming the Group into a multi-specialty chemical solutions-provider, with specialties which in 2016 comprised two-thirds of our business, we will make it more global, resilient, sustainable, and innovative. Our transformation also takes account of geographical location: as a global player, Solvay is now balanced in terms of the geographical distribution of its activities. 50% of our businesses are in markets expected to grow at GDPplus.
Acquisitions and divestments represent key steps in Solvay’s transformation into a group with a higher growth profile,�by�enhancing�customized�solution�offerings�and�reducing cyclical and low-growth businesses exposure. In 2016,�the�very�quick�and�effective�integration�of�the�Cytec�businesses strongly contributed to this transformation. In�addition,�the�Group�finalized�the�divestment�of�its�European PVC business, completed the sale of its stake in Solvay Indupa to the Brazilian chemical group Unipar, and�signed�a�definitive�agreement�to�sell�its�stake�in�Vinythai to AGC Asahi Glass. The Group also reached an agreement to sell its cellulose acetate tow business.
“Innovate more and faster”
Our Research & Innovation is at the core of our business. As we transform ourselves into a multi-specialty business, innovation has a capital role to play. It is crucial to our differentiation and our growth strategy as well as to our understanding of key market players, so that we continue to lead the way in developing pioneering technologies. To innovate more and faster, we have articulated our organization and ways of working to optimize synergies and collaborative projects. The success of the 13-year technological partnership with Solar Impulse showed Solvay’s ability to tackle issues regarding energy saving and lightweighting, in a highly demanding environment, enabling this electrical plane to fly around the globe without fuel.
“
nicolas cudré-Mauroux, group general manager Research & Innovation
2,340Employees
240Patent applications
€ 350 millionR&I effort
€ 80 millionInvested in funds and start-ups
InnOvATIOn In FIgUREs
Establishing a strong position in segments where we are already active and transforming our portfolio towards more advanced materials and formulations.
Pursuing functional excellence in order to be at the forefront of our industry, innovating to create new sustainable solutions that focus on return on investment.
OveRvieW OUr strAtEGIC pOsItIOnInG

Solvay · 2016 Annual Integrated Report23
Integration of Cytec businessesMAnAgeMent MOdel
The integration of Cytec has been a textbook example of blending the cultures and strengths of both organizations, to quickly identify and achieve higher-than-expected synergies. The businesses have now been incorporated seamlessly into our portfolio, and multiple collaborations across all businesses are in the process of developing new innovations that address our customers’ most important industry challenges.
To implement its strategy, solvay relies on:
“The way we achieve results” with our four key business pillars, including customer-centricity, collaborative innovation, relentless excellence, and superior Group performance.
OveRvieW OUr strAtEGIC pOsItIOnInG
Tech Days: getting closer to our customers
Solvay regularly organizes events called “Tech Days” with customers as well as key prescribers in their industries, who are best positioned to understand the needs of the end consumers and are driving market trends. These events allow Solvay to better understand its customers’ challenges and to raise the visibility of its portfolio of technologies and solutions.
developing the technologies that will deliver sustainable solutions
Sustainable Portfolio Management (SPM): a strategic tool for our businesses
Solvay uses its SPM tool to identify and analyze opportunities that will have a positive impact on its extra-financial�objectives.�By�analyzing�the�manufacturing�steps�and all possible product-application combinations, SPM allows us to focus our portfolio, innovation projects, and acquisitions on the most environmentally friendly and socially responsible technologies and businesses. These may be familiar solutions – such as biodegradable products for soaps and shampoos and renewable-based solvents for paints and coatings – or more complex solutions, for example enabling consumers to ultimately reduce their energy consumption or generate less food waste.
Solvay’s objective is to achieve at least 50% of its net sales with “sustainable solutions” by 2025.
Solvay�has�set�up�around�20�Group�Tech�Days�over�the�last�five�years, involving leading players in such industries as automotive, aeronautics, oil & gas, agro and coatings. These events – held in Europe,�Asia,�and�the�Americas�–�have�had�a�significant�impact�for the Group. They have been attended by more than 2,500 representatives of customers and have given rise to tangible business opportunities for the Group (e.g. through joint development agreements).
gaining a thorough understanding of customers, being able to anticipate what they will need in five years’ time
developing talents capable of understanding customers’ needs and enabling technologies
Talent Days: developing our people
Solvay has set up a range of initiatives to give guidance to each employee in the Group’s transformation and ensure the development of each individual’s potential.
Talent Days are one of these initiatives, a powerful vehicle for managing and developing talents through learning, personal contact, and networking. This two-day event provides participants with an opportunity to boost their career paths by enhancing their visibility and understanding of business challenges. Face-to-face meetings with senior managers and the subsequent feedback help them clarify their aspirations and develop soft skills such as self-awareness, and impact and influence.
Feedback shows that Talent Days deliver outcomes in terms of commitment, engagement, and energy from both participants and managers. In 2016, 26 participants and 22 managers took part in the European Talent Days; there were similar numbers in Latin America, while 30 talents and 30 leaders�participated�in�Asia�Pacific.

24Solvay · 2016 Annual Integrated Report
OveRvieW OUr GOVErnAnCE AnD DECIsIOn-MAkInG prOCEssEs
our goVernance anD Decision-MaKing Processes
Solvay’s Board of Directors is committed to embracing and promulgating good governance practices that add sustainable value and promote a transparent dialog with all key stakeholders. The Board sets the general strategies and policies and ensures their implementation, and appoints the top executives. To support its decisions, it gathers experienced professionals from a variety of backgrounds.
7 5
8 96%
Nationalities Women
Meetings Attendance rate
1 Chairman
10 Independent Directors
1 Executive Director
3 Non-Independent Directors
board of directors
supported by four specialized committees
As of December 31, 2016, the Board consisted of 15 members, including its Chairman, Nicolas Boël, and the Chairman of the Executive Committee and CEO, Jean-Pierre Clamadieu. The Board has set up four specialized committees which provide advisory opinions in their own area of competence.
AUDIT COmmITTEE
6 6 100%Members Meetings Attendance rate
6 3 100%Members Meetings Attendance rate
nOmInATIOn COmmITTEE
FInAnCE COmmITTEE
6 4 100%Members Meetings Attendance rate
6 2 100%Members Meetings Attendance rate
COmpEnsATIOn COmmITTEE
OuR gOveRnAnce bOdies
15Directors
An experienced, diversified and proactive Board of Directors
2016 figures
Solvay · 2016 Annual Integrated Report25
OveRvieW OUr GOVErnAnCE AnD DECIsIOn-MAkInG prOCEssEs
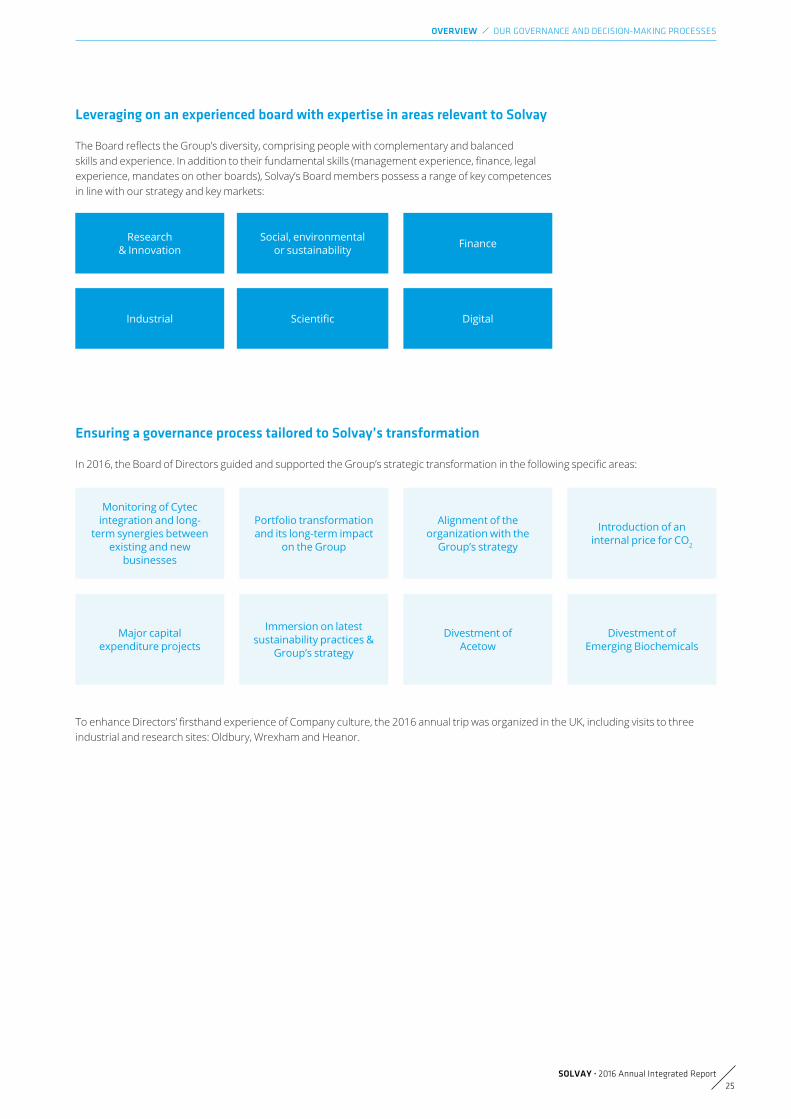
ensuring a governance process tailored to solvay’s transformation
The�Board�reflects�the�Group’s�diversity,�comprising�people�with�complementary�and�balanced�skills�and�experience.�In�addition�to�their�fundamental�skills�(management�experience,�finance,�legal�experience, mandates on other boards), Solvay’s Board members possess a range of key competences in line with our strategy and key markets:
Research & Innovation
Social, environmental or sustainability
Industrial Scientific
Finance
Digital
In�2016,�the�Board�of�Directors�guided�and�supported�the�Group’s�strategic�transformation�in�the�following�specific�areas:
Monitoring of Cytec integration and long-
term synergies between existing and new
businesses
Introduction of an internal price for CO2
Immersion on latest sustainability practices &
Group’s strategy
Major capital expenditure projects
Alignment of the organization with the
Group’s strategy
Portfolio transformation and its long-term impact
on the Group
Divestment of Acetow
Divestment of Emerging Biochemicals
To�enhance�Directors’�firsthand�experience�of�Company�culture,�the�2016�annual�trip�was�organized�in�the�UK,�including�visits�to�three�industrial and research sites: Oldbury, Wrexham and Heanor.
leveraging on an experienced board with expertise in areas relevant to solvay

26Solvay · 2016 Annual Integrated Report
OveRvieW OUr GOVErnAnCE AnD DECIsIOn-MAkInG prOCEssEs
Jean-Pierre clamadieuChairman of the Executive
Committee and CEO
Pascal Juéry Vincent De cuyperKarim HajjarChief Financial Officer
roger Kearns
The principal executive organ of governance is the Group’s Executive Committee. Guided by the�general�strategy�defined�by�the�Board,�the�Executive�Committee�gives�shape�to�the�strategy,�steers the Group’s business portfolio, and ensures that value creation targets are met. It is also responsible for optimizing the allocation of resources among the Global Business Units. The Executive Committee is collectively responsible for Solvay’s overall performance and protecting the Group’s interests.
On�December�31,�2016,�it�consisted�of�five�members,�each�overseeing�a�number�of�GBUs,�Functions, or Zones.
An entrepreneurial Executive Committee fostering operational agility
4Nationalities
100%Attendance rate
17Meetings
A regular and constructive dialog between Nicolas Boël, Chairman of Solvay’s Board of Directors, and Jean-Pierre Clamadieu, Chairman of the Executive Committee and CEO, plays a key role in achieving harmony and coordination at the highest level. At the basis of quality decisions, this partnership enhances the sharing of information and embodies the importance of collaboration at the highest level.
The following measures have been introduced to achieve this:
• The two Chairmen meet as often as necessary on matters of common �interest,�in�addition�to�a�monthly�meeting�to�review�financial�reporting.
• The�Chief�Executive�Officer�is�a�member�of�the�Board�of�Directors�and� is responsible for presenting the Executive Committee’s proposals to the Board.
• The Chairman of the Board has access to all information necessary for him to exercise his function.
Constructive dialog between the Board of Directors and the Executive Committee
Solvay · 2016 Annual Integrated Report27
OveRvieW OUr GOVErnAnCE AnD DECIsIOn-MAkInG prOCEssEs
Good corporate governance is the foundation on which we create sustainable value for our stakeholders. At Solvay, every employee adheres to a code of ethics and a single set of core principles and systems that guide their actions every day.
FundAMentAls guiding OuR ActiOns
We ensure that all our people are committed to building a new model of sustainable chemistry in their daily activities by guiding them with fundamental approaches and texts such as Solvay Way and our People and Management models, as well as our Code of Conduct.
A common framework of references
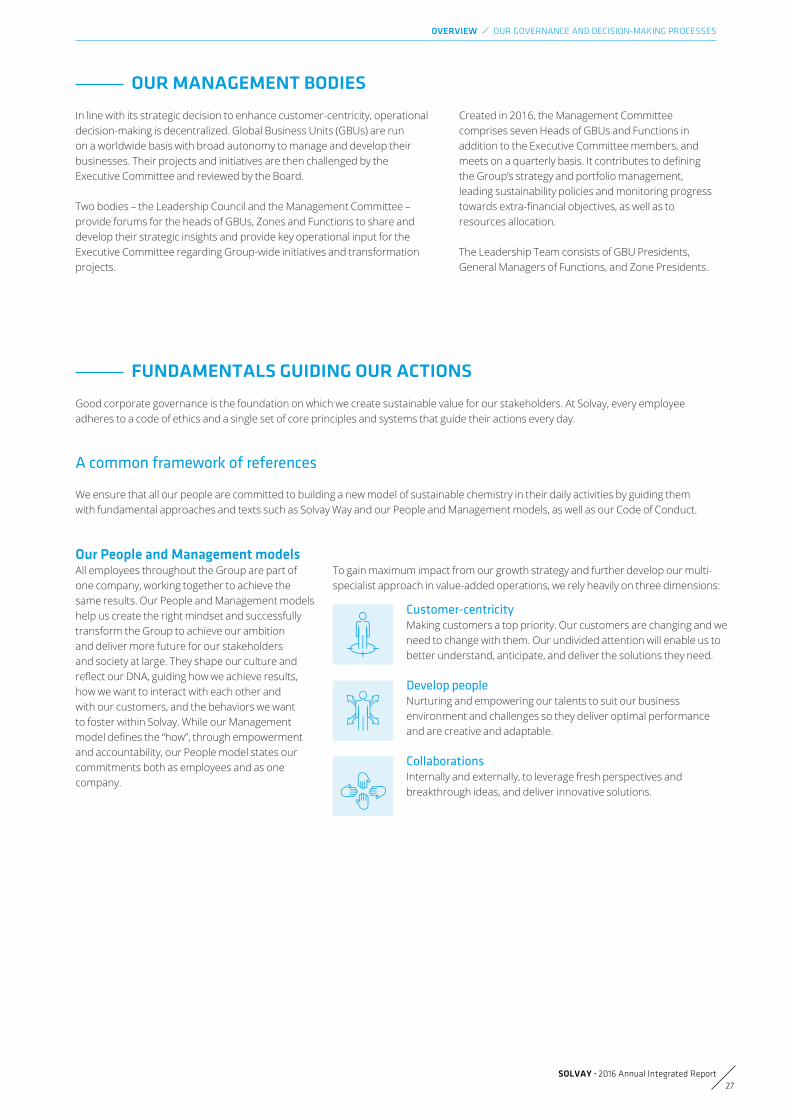
Our people and Management modelsTo gain maximum impact from our growth strategy and further develop our multi-specialist approach in value-added operations, we rely heavily on three dimensions:
Customer-centricity Making customers a top priority. Our customers are changing and we need to change with them. Our undivided attention will enable us to better understand, anticipate, and deliver the solutions they need.
In line with its strategic decision to enhance customer-centricity, operational decision-making is decentralized. Global Business Units (GBUs) are run on a worldwide basis with broad autonomy to manage and develop their businesses. Their projects and initiatives are then challenged by the Executive Committee and reviewed by the Board.
Two bodies – the Leadership Council and the Management Committee – provide forums for the heads of GBUs, Zones and Functions to share and develop their strategic insights and provide key operational input for the Executive Committee regarding Group-wide initiatives and transformation projects.
OuR MAnAgeMent bOdies
Created in 2016, the Management Committee comprises seven Heads of GBUs and Functions in addition to the Executive Committee members, and meets�on�a�quarterly�basis.�It�contributes�to�defining�the Group’s strategy and portfolio management, leading sustainability policies and monitoring progress towards�extra-financial�objectives,�as�well�as�to�resources allocation.
The Leadership Team consists of GBU Presidents, General Managers of Functions, and Zone Presidents.
All employees throughout the Group are part of one company, working together to achieve the same results. Our People and Management models help us create the right mindset and successfully transform the Group to achieve our ambition and deliver more future for our stakeholders and society at large. They shape our culture and reflect�our�DNA,�guiding�how�we�achieve�results,�how we want to interact with each other and with our customers, and the behaviors we want to foster within Solvay. While our Management model�defines�the�“how”,�through�empowerment�and accountability, our People model states our commitments both as employees and as one company.
Develop people Nurturing and empowering our talents to suit our business environment and challenges so they deliver optimal performance and are creative and adaptable.
Collaborations Internally and externally, to leverage fresh perspectives and breakthrough ideas, and deliver innovative solutions.

28Solvay · 2016 Annual Integrated Report
OveRvieW OUr GOVErnAnCE AnD DECIsIOn-MAkInG prOCEssEs
solvay Way, our approach to sustainabilityFor us at Solvay, “asking more from chemistry” means being responsible in the way we act and innovate while contributing to society.
Solvay�Way,�the�Group’s�approach�to�sustainability,�defines�the�way�we�act�on a daily basis, from the highest level of management to the operational level. It covers all the Group’s management systems: Health, Safety and Environment, Human Resources, Ethics Charter for Suppliers, Anti-corruption, Code of Conduct, Ethics in Business Conduct, etc.
Our objective is to create value; the way we do this integrates social and environmental factors alongside economic criteria. As a result, the company’s management and strategy take account of our stakeholders’ changing expectations, which ensures sustainable value creation shared with the Group’s stakeholders (customers, employees, planet, investors, suppliers and communities).
• A global network of more than 200 “Champions” and “Correspondents” who ensure its active deployment within gBUs’ sites and the corporate Functions.
• Each year, 100% of sites, gBUs and functions assess their progress in terms of Corporate social Responsibility.
• Aligned with the iso 26000 standard.
• Code of Conduct available in 14 languages.
• 6,973 people trained in 2016.
• Dedicated confidential helpline available in more than 40 languages on the web.
• Aligned with the 10 principles of the Un global Compact.
committed to the highest standards of legal compliance and business ethicsAll Solvay employees are required to follow the Group’s Code of Conduct at all times, inheriting a strong tradition of values deeply rooted in the company’s culture. The cornerstone of our Ethics and Compliance program, this�document�lays�down�a�series�of�principles�that�define�the�standards�of�ethics and integrity in the workplace, in doing business and as a corporate citizen. To counsel employees and ensure that the Code is well known by all,�Compliance�officers�have�been�appointed�in�all�four�geographical�zones�where the Group operates.
A risk management system to ensure sustainable performance
In a context of global economic and political uncertainty, evolving power balances, changing growth dynamics, the shortening of market�cycles,�raw�material�and�energy�volatility,�and�rapid�technological�evolution,�Solvay�believes�that�effective�monitoring�and�management of risks is key to achieving its strategic objectives. The risk assessment process – endorsed by the Board – helps the Group�to�reach�its�business�objectives�while�pursuing�its�ambitious�extra-financial�objectives�and�remaining�in�compliance�with�laws,�regulations, and the Solvay Code of Conduct.
enterprise Risk Management (eRM): a key tool for achieving solvay’s short, medium, and long-term objectivesSolvay’s�business�is�complex,�entrepreneurial,�and�international.�Our�operations�are�subject�to�a�number�of�significant�risks.� Consequently, we have designed a dynamic process where key players assess the risks in their areas of responsibility or expertise.

Solvay · 2016 Annual Integrated Report29
OveRvieW OUr GOVErnAnCE AnD DECIsIOn-MAkInG prOCEssEs
monitoring
Critical risks for the Group are closely monitored by the Group Risk Committee, with members of the Comex appointed as Risk Sponsors, to ensure that these risks are adequately addressed. Particular attention is paid to cross-checking the analysis with the work done by the Sustainable Development Function.
Economic impact
Impact on people
Impact on environment
Impact on reputation
Risk analysisSolvay’s systematic risk management approach, integrated with strategy, business decisions, and operations, ensures that the�Group’s�leaders�identify,�assess,�and�manage�all�potentially�significant�risks.�Risk�assessment�is�related�to�the�creation�of�short, medium, and long-term value, and is always considered in the context of sustainability. Two of the four main types of impacts�that�are�used�to�assess�risks�reflect�our�growing�sensitivity�to�extra-financial�issues,�namely�impact�on�people�and�on�the environment. The other two – economic impact and impact on reputation – relate directly to the Group’s operational and financial�performance.�In�line�with�Solvay’s�strategic�objectives,�risks�are�then�categorized�as�follows:�“main�risks”�(rated�as�the�most critical), “emerging risks” and “other risks”.
Implementation of risk management actions
Adequate risk management is a key success factor for us, to mitigate risks associated with the solutions we provide. Solvay’s Enterprise Risk Management methodology includes improvements aiming to allow better prioritization of relevant risks and a more focused risk response by each GBU and Function, as well as at Group level. A dedicated dashboard is updated twice a year both for progress on mitigating actions and for new developments in the risk environment.
Decision on how to manage critical risks
All�risks�and�opportunities�–�involving�financial�and�extra-financial�criteria�–�are�fully�integrated�into�both�day-to-day�and�strategic decision-taking.
*Emerging�risk:�newly�developing�or�changing�risks�that�may�have�on�the�long-term,�a�significant�impact�which�will�need�to�be�assessed�in�the�future.
Criticality Risk Trend
HighClimate change*
Security
Transport accidents
Moderate to High
Chemical product usage
Ethics and Compliance
Information protection and cyber-risk
Moderate Industrial safety
Environmental strategy* N/A
A risk assessment involving all gBUs embedded in the annual strategic review process
evolution of solvay's main risks

30Solvay · 2016 Annual Integrated Report
1 2 3 4 5
global business uniTs
funcTionsleaDersHiP
council 1
grouP risK coMMiTTee 2
eXecuTiVe coMMiTTee
boarD of DirecTors
• Review and update their own risk matrices
• Define�risk�owners�to�lead� mitigation of most critical risks
Identifies�a�list�of�Group risks – the most critical ones – to be subjected
to a deeper assessment phase
Decides on and closely monitors
these Group risks
Each of these Group risks is sponsored by an Executive Committee
member
Oversees and endorses
OveRvieW OUr GOVErnAnCE AnD DECIsIOn-MAkInG prOCEssEs
1Executive Committee and General Managers of the Human Resources, Industrial, Legal, and Sustainable Development Functions.2Executive Committee, GBU Presidents, Function General Managers, Zone Presidents and Solvay Business Services General Manager.
Assessing major projects linked to the group’s transformationAn�appropriate�risk�assessment�methodology�is�applied�to�significant�projects,�whether�acquisitions,�major�capital�investments,� or transversal projects.
A variable remuneration covering 100% of solvay’s workforceThe compensation of all employees is linked to Solvay’s performance through either a short-term incentive for managers or a Global Performance Sharing Plan for the rest of our employees. The latter was developed in 2015 in consultation with the European Works Council,�and�allows�all�employees�to�share�financially�in�the�Group’s�performance.�Global�performance�sharing�is�calculated�using�both�financial�and�extra-financial�objectives.
corPoraTe risK DeParTMenT
Supports and coordinates risk management throughout the Group
A sound risk management system embedded at all levels of the groupAll�risks�are�defined�and�classified�according�to�a�highly-decentralized�process�that�relies�on�significant�contributions�both�from�the�GBUs�and the Functions, with the support of the Corporate Risk Department. This means that detailed knowledge is available when assessing risk, and operational managers can react rapidly in the event of changing circumstances.
A balanced remuneration encouraging sustainable value creation
The compensation of all Solvay employees – starting with the Chief Executive and the members of the Executive Committee – is closely linked to the successful implementation of the Group’s strategy and to meeting its targets.
Our remuneration policy has been structured for all employees in a way that encourages sustainable value creation.
The objectives are twofold:
• Reflecting solvay’s global performance by covering both economic and sustainability objectives.
• Encouraging the creation of sustainable value that stands the test of time while ensuring the achievement of short-term imperatives.

Solvay · 2016 Annual Integrated Report31
OveRvieW OUr GOVErnAnCE AnD DECIsIOn-MAkInG prOCEssEs
1New metric introduced in 2017.
ceO remuneration
CEO total compensation at target for 2016
target sti: 100% of base salary
target lti: 150% of base salary
29 %
43 %
40 %
Base salary
29 %
sTi (short-term incentives)
lTi (long-term incentives)
Group performance – Underlying EBITDA under cash constraint
Underlying EBITDA growth
Individual objectives
CFROI improvement
Sustainable development
Greenhouse gas emissions1
Performance measures
PSUPerformance
measures
sh
OR
T TER
m (Th
Is y
EA
R)
LOn
G tE
rM
50 %
stOCk OptIOns
50 %
psU
50 %
10 %
40 %
40 %
By striving to meet sustainability objectives, every employee contributes to Solvay’s sustainable value creation. The Group has integrated the goals of a more sustainable development into all its managerial processes – including its remuneration policy. This impacts all employees, including the CEO and Executive Committee members.
“Pascal chalvon-Demersay, Chief sustainability Officer
compensation of the chairman of the executive committee: a balanced policy to encourage value creation that stands the test of timeBased on proposals by the Compensation Committee and set by the Board of Directors, the compensation of the Chairman of the Executive Committee, Jean-Pierre Clamadieu, aims at reinforcing the link between variable pay and overall business performance.
In�line�with�market�practices,�and�in�addit1ion�to�a�fixed�base salary, the CEO’s compensation package includes Short-Term Incentives (STI) and Long-Term Incentives (LTI). STI payout is based on the assessment of the achievement of both individual objectives and Group collective�economic�and�extra-financial�indicators.�As part of our LTI, a new metric on greenhouse gas emissions is being introduced in 2017 in the Performance Share Units (PSU) payout calculation to further reinforce Solvay’s position on sustainable value creation,�encompassing�both�financial�and�extra-financial�performance�criteria.
20 %
Solvay’s sustainable value creation embedded into our remuneration policy.

32sOlvAy · 2016 Annual Integrated report
ManageMenT rePorT
cORpORAte gOveRnAnce stAteMent 33
RisK MAnAgeMent 57
business RevieW 72
extRA-FinAnciAl stAteMents 96
FinAnciAl stAteMents 130
AuditOR’s RepORts & declARAtiOn by tHe peRsOns RespOnsible 225
glOssARy 232
sHAReHOldeR’s diARy 236

1. INTRODUCTION 34
2. CAPITAL, SHARES AND SHAREHOLDERS 34
2.1. Capital and shares 34
2.2. Shareholders 34
3. RELATIONS WITH SHAREHOLDERS ANDINVESTORS 35
3.1. Performance of the Solvay share 35
3.2. Active financial communication 36
3.3. Individual investors 36
3.4. Roadshows and meetings for institutionalstakeholders 36
3.5. Dedicated web pages 36
4. BOARD OF DIRECTORS AND BOARDCOMMITTEES 37
4.1. Board of Directors 37
4.2. Board committees 41
5. EXECUTIVE COMMITTEE 42
6. COMPENSATION REPORT 43
6.1. Governance 43
6.2. Board of Directors compensation 43
6.3. Executive Committee compensation 44
6.4. Stock options and PSU allotted in 2016 to ExecutiveCommittee members 51
6.5. Most important provisions of their contractualrelationships with the Company and/or an affiliatedcompany, including the provisions relating tocompensation in the event of early departure 52
7. MAIN CHARACTERISTIC OF RISKMANAGEMENT AND INTERNAL CONTROLSYSTEMS 52
7.1. The control environment 52
7.2. The risk assessment process 53
7.3. Control activities 53
7.4. Information and communication 54
7.5. Internal control monitoring 54
8. EXTERNAL AUDIT 55
9. ITEMS TO BE DISCLOSED PURSUANT TOARTICLE 34 OF THE BELGIAN ROYAL DECREE OFNOVEMBER 14, 2007 55
Management Report
CORPORATE GOVERNANCESTATEMENTRisk management 57
Business review 72
Extra-financial statements 96
Financial statements 130
Declarations: Auditor’s reports & Declaration by the persons responsible 225
SOLVAY 2016 Annual Integrated Report33

As a company headquartered in Belgium with a commitmentto the highest standards of corporate governance, the Boardof Directors of Solvay SA (“Solvay” or the “Company”) adopteda Charter of Corporate Governance (the “Charter”) onDecember 13, 2016. The Charter is available on the Company’swebsite and describes the main aspects of the corporategovernance of the Solvay group (the “Group”), including itsgovernance structure, and the internal rules of the Board ofDirectors, the Executive Committee, and other committees set upby the Board of Directors.
The Group applies the principles set forth in the 2009 BelgianCorporate Governance Code, which is its reference code ingovernance matters. The 2009 Belgian Corporate GovernanceCode is available on the Belgian Corporate GovernanceCommittee website.
This Corporate Governance Statement with respect to 2016applies the recommendations of the 2009 Belgian CorporateGovernance Code, in accordance with the “comply or explain”principle.
In accordance with this principle, none of the rules describedin this Corporate Governance Statement depart from the 2009Belgian Corporate Governance Code.
The capital of the Company has not been modified in 2016 andamounts to €1,588,146,240 and is represented by 105,876,416shares.
Solvay’s main shareholder is Solvac SA, with a holding of morethan 30% in the share capital of Solvay.
Solvac SA is a public limited liability company established underBelgian law, the shares of which are admitted to trading onEuronext Brussels.
Solvac has approximately 13,000 shareholders. Among them,more than 2,000 persons are related to the founding families ofSolvay and of Solvac. These persons hold approximately 77% ofthe shares of Solvac.
The following table shows the current shareholders’ structurebased on the notifications made to the Company and to theBelgian Financial Services and Markets Authority (“FSMA”) by theshareholders specified below, according to i) the Belgian law ofMay 2, 2007 on the notification of significant shareholdings oraccording to Solvay’s by-laws or ii) Article 74 of the Belgian law ofApril 1, 2007 on public take-over bids or iii) based on more recentinformation from public disclosures.
Date Number of shares % of totalSolvay July 29, 2016 32,511,125 30.71%
Solvay Stock Option Management July 4, 20162,632,690
(+ 559,374 purchase options) 3.01%
On July 29, 2016 Solvac gave notice that it holds 30.71%(32,511,125 shares) in the share capital of Solvay.
Solvay Stock Option Management SPRL, an indirect subsidiaryof Solvay, notified Solvay on July 4, 2016 that its shareholdingamounted to 3.01% of the 105,876,416 shares issued by Solvay,representing 2,632,690 shares and 559,374 purchase options.These purchase options are part of the Group's risk hedgingstrategy linked to stock options granted by Solvay to seniorexecutives of the Group.
Blackrock Inc. gave notice on November 18, 2016 that it holdsa 3.04% interest (3,219,775 shares) in the share capital of theCompany and on November 30, 2016 that it had fallen below thestatutory threshold of 3% in the Company’s share capital.
The latest transparency notifications are available on the website(www.solvay.com).
The shares for which no transparency notifications have beenfiled with Solvay and the FSMA are held by:
At the Ordinary Shareholders’ Meeting held on May 10, 2016,shares were deposited and votes cast in respect of 58.16% ofSolvay SA’s capital.
INTRODUCTION1. CAPITAL, SHARES ANDSHAREHOLDERS
2.
Capital and shares2.1.
Shareholders2.2.Major shareholder2.2.1.
Shareholders’ structure2.2.2.
individual shareholders who hold shares directly in Solvay
European and international institutional shareholders, whosenumber and interest can be measured by the intensity ofcontacts at many roadshows, by the regular publication ofanalysts’ reports and by the level of trading volumes overrecent years.
CORPORATE GOVERNANCE STATEMENT
34SOLVAY 2016 Annual Integrated Report

Solvay shares have a dual listing on Euronext Brussels – theprimary listing – and, since January 2012, on Euronext Parisunder the unique mnemonic code of SOLB. Furthermore, Solvayjoined the CAC 40 stock index on September 21, 2012. Boththese events reflect the Group’s long history in France as well asits economic weight.
During 2016, the average price was € 92.41, while the highestprice was € 112.30.
Average daily trading volume as reported by Euronext was335,719 shares in 2016, compared with 325,619 shares in 2015.
RELATIONS WITH SHAREHOLDERSAND INVESTORS
3.
Performance of the Solvay share3.1.
Solvay share prices and trading volumes from January 1, 2016 to December 31, 2016
The Solvay share compared with indexes from January 1, 2016 to December 31, 2016
CORPORATE GOVERNANCE STATEMENT
SOLVAY 2016 Annual Integrated Report35
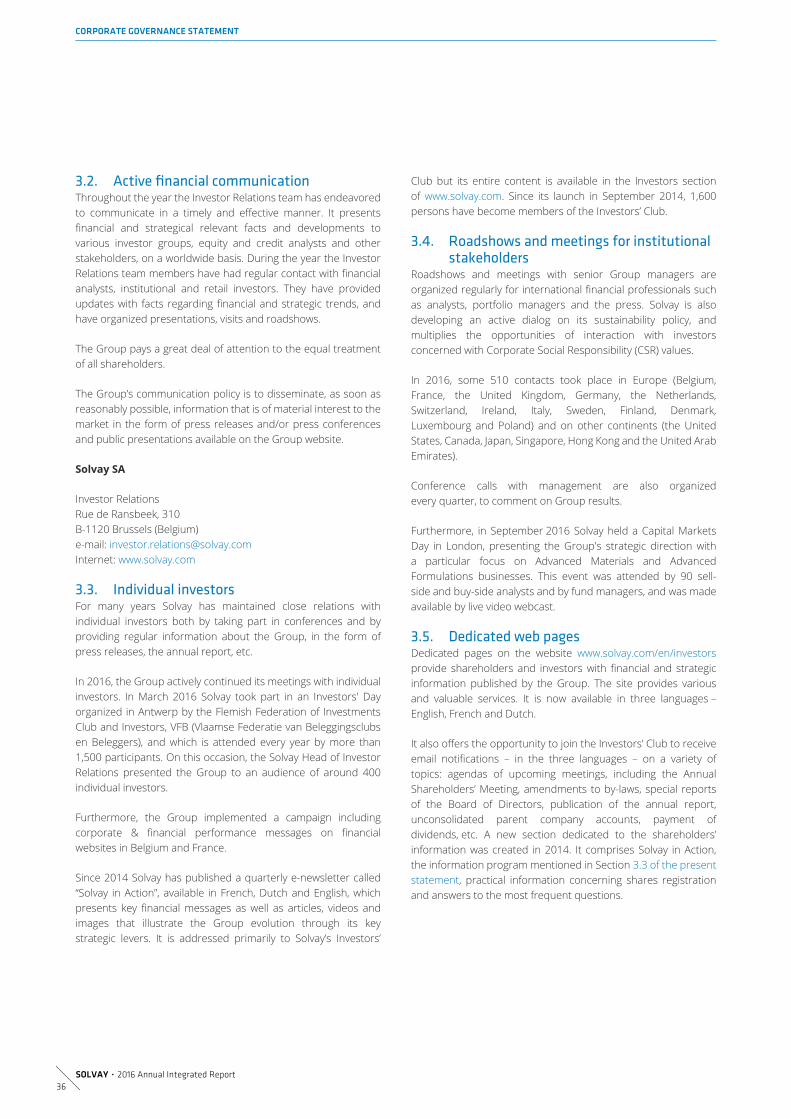
Throughout the year the Investor Relations team has endeavoredto communicate in a timely and effective manner. It presentsfinancial and strategical relevant facts and developments tovarious investor groups, equity and credit analysts and otherstakeholders, on a worldwide basis. During the year the InvestorRelations team members have had regular contact with financialanalysts, institutional and retail investors. They have providedupdates with facts regarding financial and strategic trends, andhave organized presentations, visits and roadshows.
The Group pays a great deal of attention to the equal treatmentof all shareholders.
The Group’s communication policy is to disseminate, as soon asreasonably possible, information that is of material interest to themarket in the form of press releases and/or press conferencesand public presentations available on the Group website.
Solvay SA
Investor RelationsRue de Ransbeek, 310B-1120 Brussels (Belgium)e-mail: [email protected]: www.solvay.com
For many years Solvay has maintained close relations withindividual investors both by taking part in conferences and byproviding regular information about the Group, in the form ofpress releases, the annual report, etc.
In 2016, the Group actively continued its meetings with individualinvestors. In March 2016 Solvay took part in an Investors' Dayorganized in Antwerp by the Flemish Federation of InvestmentsClub and Investors, VFB (Vlaamse Federatie van Beleggingsclubsen Beleggers), and which is attended every year by more than1,500 participants. On this occasion, the Solvay Head of InvestorRelations presented the Group to an audience of around 400individual investors.
Furthermore, the Group implemented a campaign includingcorporate & financial performance messages on financialwebsites in Belgium and France.
Since 2014 Solvay has published a quarterly e-newsletter called“Solvay in Action”, available in French, Dutch and English, whichpresents key financial messages as well as articles, videos andimages that illustrate the Group evolution through its keystrategic levers. It is addressed primarily to Solvay’s Investors’
Club but its entire content is available in the Investors sectionof www.solvay.com. Since its launch in September 2014, 1,600persons have become members of the Investors’ Club.
Roadshows and meetings with senior Group managers areorganized regularly for international financial professionals suchas analysts, portfolio managers and the press. Solvay is alsodeveloping an active dialog on its sustainability policy, andmultiplies the opportunities of interaction with investorsconcerned with Corporate Social Responsibility (CSR) values.
In 2016, some 510 contacts took place in Europe (Belgium,France, the United Kingdom, Germany, the Netherlands,Switzerland, Ireland, Italy, Sweden, Finland, Denmark,Luxembourg and Poland) and on other continents (the UnitedStates, Canada, Japan, Singapore, Hong Kong and the United ArabEmirates).
Conference calls with management are also organizedevery quarter, to comment on Group results.
Furthermore, in September 2016 Solvay held a Capital MarketsDay in London, presenting the Group's strategic direction witha particular focus on Advanced Materials and AdvancedFormulations businesses. This event was attended by 90 sell-side and buy-side analysts and by fund managers, and was madeavailable by live video webcast.
Dedicated pages on the website www.solvay.com/en/investorsprovide shareholders and investors with financial and strategicinformation published by the Group. The site provides variousand valuable services. It is now available in three languages –English, French and Dutch.
It also offers the opportunity to join the Investors’ Club to receiveemail notifications – in the three languages – on a variety oftopics: agendas of upcoming meetings, including the AnnualShareholders’ Meeting, amendments to by-laws, special reportsof the Board of Directors, publication of the annual report,unconsolidated parent company accounts, payment ofdividends, etc. A new section dedicated to the shareholders’information was created in 2014. It comprises Solvay in Action,the information program mentioned in Section 3.3 of the presentstatement, practical information concerning shares registrationand answers to the most frequent questions.
Active financial communication3.2.
Individual investors3.3.
Roadshows and meetings for institutionalstakeholders
3.4.
Dedicated web pages3.5.
CORPORATE GOVERNANCE STATEMENT
36SOLVAY 2016 Annual Integrated Report

The role and mission, functioning, size, composition, training andevaluation of the Board of Directors are described in detail in theCharter. In addition, the internal rules of the Board of Directorsare attached to the Charter.
The evolutions and changes during the year 2016 in thecomposition of the Board of Directors are listed below:
The mandate of Mr. Jean-Marie Solvay was renewed for a four-year term at the Ordinary Shareholders’ Meeting of May 10, 2016so that his mandate will expire at the end of the ordinaryShareholders’ Meeting to be held in May 2020.
At the Ordinary Shareholders’ Meeting of May 9, 2017 the Boardof Directors will propose:
This means that the number of members of the Board ofDirectors will increase from 15 members today to 16 members.That will be a temporary increase until the Ordinary Shareholders’Meeting of 2019, when the term of Yves-Thibault de Silguyexpires.
As at December 31, 2016, the Board of Directors was composedof the following 15 members:
Year ofbirth
Yearof first
appoint-ment
Solvay SA mandates, and expiry date ofdirectorship Diplomas and activities outside Solvay
Presenceat Board
meetingsin 2016
Mr. NicolasBoël (B)
1962 1998 2017Chairman of the Board of Directors,Chairman of the Finance Committee andChairman of the CompensationCommitteeMember of the Nomination Committee
MA in Economics (Catholic University ofLouvain), Master of BusinessAdministration (College of William andMary – USA).Director of Sofina.
8/8
Mr. Jean-PierreClamadieu(F)(1)
1958 2012 2017Chairman of the Executive Committee andCEO, Director and Member of the FinanceCommittee
Engineering degree from the École desMines (Paris).Director of Axa, Faurecia.Chairman of Cytec Industries Inc.
8/8
Mr. Bernard deLaguiche (F/BR)
1959 2006 2017Member of the Executive Committee untilSeptember 30, 2013, DirectorMember of the Finance Committee andMember of the Audit Committee sinceMay 13, 2014
MA in Economics and BusinessAdministration, HSG (University of St.Gallen, Switzerland).Managing Director of Solvac SA, Chairmanof the Board Peroxidos do Brasil Ltda,Curitiba.
8/8
Mr. Jean-MarieSolvay (B)
1956 1991 2020DirectorMember of the Innovation Board
Advanced Management Programme –Insead.CEO of Albrecht RE Immobilien GmbH &Co. KG., Berlin (Germany), Chairman of theBoard of the International SolvayInstitutes.
8/8
Mr. DenisSolvay (B)
1957 1997 2018DirectorMember of the Compensation andNomination Committees
Business engineering – Solvay BusinessSchool (Université Libre de Bruxelles).Abelag Holding, SA. Voluntary Director ofthe healthcare Institute ANBCT and QueenElisabeth Musical Chapel.
8/8
Prof. Dr.BernhardScheuble (D)
1953 2006 2018Independent DirectorChairman of the Audit Committee
MSc, Nuclear Physics & PhD, DisplayPhysics (Freiburg University – Germany).Former Chairman of the ExecutiveCommittee of Merck KGaA, (Darmstadt)and former Member of the E. Merck OHGBoard of Directors.
7/8
(1) Full-time activity in the Solvay group.
BOARD OF DIRECTORS AND BOARDCOMMITTEES
4.
Board of Directors4.1.Structure and composition4.1.1.
the renewal of the directorship of Mr. N. Boël, Mr. J-P.Clamadieu, Mr. B. de Laguiche, Mr. Hervé Coppensd’Eeckenbrugge, Mrs. E. du Monceau, Mrs. F. de Viron and Mrs.A. Moraleda for a four-year term
the appointment of Mrs. A. Lemarchand as a new independentdirector for a four-year term, and to prepare a replacementfor Mr. Y-Th. de Silguy at the Ordinary Shareholders’ Meeting of2019, when he reaches the age limit and his term expires.
CORPORATE GOVERNANCE STATEMENT
SOLVAY 2016 Annual Integrated Report37

Year ofbirth
Yearof first
appoint-ment
Solvay SA mandates, and expiry date ofdirectorship Diplomas and activities outside Solvay
Presenceat Board
meetingsin 2016
Mr. CharlesCasimir-Lambert (B)
1967 2007 2019Independent DirectorMember of the Audit Committee
MBA Columbia Business School (NewYork)/London Business School (London),Master’s degree (lic.oec.HSG) ineconomics, management and finance(University of St. Gallen – Switzerland).Management of family’s global interests.
8/8
Mr. HervéCoppensd’Eeckenbrugge(B)
1957 2009 2017Independent DirectorMember of the Finance and AuditCommittees
MA in Law from the University of Louvain-la-Neuve (Belgium), Diploma in Economicsand Business, ICHEC (Belgium).Until June 30, 2013, Group DirectorPetercam sa, Director of Vital RenewableEnergy Company LLC (Delaware).Independent Director, VISONARITY AG(Basel, Stwitzerland).
8/8
Mr. Yves-Thibault deSilguy (F)
1948 2010 2019Independent directorMember of the Compensation Committeeand Chairman of the NominationCommitteeMember of the Finance Committee
MA in Law from the University of Rennes,DES in public law from the Université deParis I, graduate of the Institut d’ÉtudesPolitiques de Paris and the ÉcoleNationale d’Administration.Vice-Chairman and Lead Director of theVINCI group, Director of LVMH, Chairmanof the Supervisory Board of Sofisport(France), Director of VTB bank (Moscow),and Chairman of YTSeuropaconsultants.
7/8
Mrs. Evelyn duMonceau (B)
1950 2010 2017Independent directorMember of the Compensation andNomination Committees
MA in Applied Economics from theCatholic University of Louvain.Vice Chair of the Board and Chair of theRemuneration and NominationCommittee of UCB SA, Member of theBoard of Directors of La Financière deTubize SA, , Member of the CommissionCorporate Governance.
8/8
Mrs. Françoisede Viron (B)
1955 2013 2017Independent Director Member of theCompensation and NominationCommittees
Doctorate of Science (UCL, Louvain-la-Neuve). Master in Sociology (UCL, Louvain-la-Neuve).Professor in the Faculty of Psychology andEducation Sciences and Louvain School ofManagement (UCL), Academic Member ofthe Center of Research EntrepreneurialChange and Innovative Strategies, ofInterdisciplinary Group of Research inSocialization, Education and Training, ofthe Interdisciplinary Research Group inAdult Education at UCL. Chairman andDirector AISBL EUCEN – EuropeanUniversities Continuing Educationnetwork.
7/8
(1) Full-time activity in the Solvay group.
CORPORATE GOVERNANCE STATEMENT
38SOLVAY 2016 Annual Integrated Report

Year ofbirth
Yearof first
appoint-ment
Solvay SA mandates, and expiry date ofdirectorship Diplomas and activities outside Solvay
Presenceat Board
meetingsin 2016
Mrs. AmparoMoraledaMartinez (ES)
1964 2013 2017Independent Director Member of theCompensation and NominationCommittees
Degree in Industrial Engineering, ICAI(Spain) MBA, IESE Business School (Spain).Former General Manager for IBM Spain,Portugal, Greece, Israel and Turkey.Former Chief Operating Officer,International Division (Spain) and ActingCEO, Scottish Power (UK) of Iberdrola.Member of the Boards of the followinglisted companies: Airbus Group, Faurecia(France), Caixabank (Spain). Member ofthe Consejo rector of Consejo Superior ofInvestigaciones Cientificas. Member of theAcademy of the Spanish Royal Academy ofEconomics and Financial sciences.
7/8
Mrs. RosemaryThorne (UK)
1952 2014 2018Independent DirectorMember of the Audit Committee
Honours Degree in Mathematics andEconomics from the University of Warwick.Fellow of Chartered Institute ofManagement Accountants FCMA andCGMA.Fellow Association of CorporateTreasurers FCT.Former Chief Financial Officer for J.Sainsbury, Bradford & Bingley andLadbrokes.Member of the Board and Chair of AuditCommittee of Santander UK (until endJune 2015) and Smurfit Kappa Group(Ireland). First Global Trust Bank (UK), untilOctober 19, 2016.
8/8
Mr. GillesMichel (F)
1956 2014 2018Independent DirectorMember of the Finance Committee
École Polytechnique.École nationale de la statistique et del’administration économique (ENSAE).Institut d’Études Politiques (IEP).Former CEO “Ceramics & Plastics”, Saint-Gobain, France.Former Member of the ManagementBoard, PSA, France.Former CEO, Fonds stratégiqued’Investissement (FSI), France.Chairman & CEO, Imerys, France(listed).Independent Director IBL.
8/8
Mrs. MarjanOudeman (NL)
1958 2015 2019Independent Director Member of theAudit Committee since May 12, 2015
Law degree, State University of Groningen.Summer Program American Law,Columbia University (NY), USA, Universityof Amsterdam and University of Leiden.Masters Degree in BusinessAdministration, Simon E. Business School,University of Rochester, New York, USAand Erasmus University, Rotterdam.Member of the Board of Statoil ASA.Member of the Board of SHV HoldingsN.V., the Netherlands.President of the Executive Board UtrechtUniversity.Member of the Supervisory Board ofKoninklijke Concertgebouw, theNetherlands.Chairman of the Board of RonaldMcDonald Children’s Fund.Member of the Supervisory Board of theRijksmuseum, the Netherlands.
7/8
(1) Full-time activity in the Solvay group.
CORPORATE GOVERNANCE STATEMENT
SOLVAY 2016 Annual Integrated Report39

The composition of this Board is as follows:
In 2016, the Board held eight meetings. Attendance by eachdirector is provided in the chart in section 4.1.1. Structure andcomposition!
During 2016, the Board of Directors’ main areas of discussion,review and decisions were: the annual review of the Groupstrategy, the review of the strategic projects (acquisitions,divestments, capital expenditures, etc.), the approval of thequarterly financial statements and dividend proposal to the AGM,the quarterly financial reporting, the reports of the BoardCommittees, the Corporate Governance, the corporate socialresponsibility and the sustainability policy, the risk management,the compensation policy and the long-term incentive plan, theBoard and management succession planning, intragrouprestructurings, and the reports and resolution proposals to theGeneral Meeting.
There were no transactions or contractual relationships in 2016between the Group and its Board members giving rise toconflicts of interests.
In 2016, the Board of Directors concluded its evaluation by anindependent competent third party in order to advise the Boardon opportunities for further improvement in line with bestpractices. Such evaluation takes place every two to three yearsand focuses primarily on the composition, the functioning, theinformation and the interactions of the Board with executivemanagement, as well as the composition and functioning of theCommittees created by it. Board members were invited toexpress their views on these various points during interviewsbased on a questionnaire and per-formed by an externalconsultant.
The evaluation underlined an overall progress of the functioningof the Board and its Committees since the previous evaluation in2013.
The improvements identified at the end of this evaluation arerelated to the optimization of the content of meeting, visit andtrip programs, the level of detail of the reports of the variousCommittees to the Board of Directors, and the identification oftraining needs.
In 2016, the CEO involved a number of key executives inpresentations to the Board about topics regarding operationsand functional domains, allowing the Board to get ongoinginformation on topics not requiring an immediate decision.
As every year, the Board of Directors also visited industrial andresearch sites. In 2016, the Board visited industrial units, R&I andcustomer centers of the GBU Composite Materials (ex-Cytec) inthe UK.
Furthermore, a training session on sustainable development wasorganized, so as to further expand the knowledge and awarenessof the Board on that topic and its evolution, the implementationof the relevant Group policy, and the realization of the relatedobjectives.
14 of the 15 directors on the Board are non-executive
Ten of the 15 Directors have been recognized as independentby the Ordinary Shareholders’ Meeting, according to thecriteria defined by the Belgian law and further refined by theBoard of Directors
International composition: seven different nationalities
5 out of 15 Board members are women
very high attendance at Board meetings: 95.8%
Functioning of the Board of Directors4.1.2.
Evaluation4.1.3.
Training4.1.4.
CORPORATE GOVERNANCE STATEMENT
40SOLVAY 2016 Annual Integrated Report

The Board of Directors has set up on a permanent basis thefollowing specialized Committees: the Audit Committee, theFinance Committee, the Compensation Committee and theNominations Committee.
All the mandates of the members of these various Committeesexpired on May 10, 2016 at the date of the OrdinaryShareholders’ Meeting. They were renewed for a period of twoyears, ending on the date of the Ordinary Shareholders’ Meetingto be held in 2018.
The composition of the four Board Committees is as follows:
Audit Committee Finance CommitteeCompensationCommittee
NominationsCommittee
Mr. Nicolas Boël Chairman Chairman MemberMr. Jean-Pierre Clamadieu MemberMr. Bernard de Laguiche Member MemberMr. Denis Solvay Member MemberProf. Dr. Bernhard Scheuble ChairmanMr. Charles Casimir-Lambert MemberMr. Hervé Coppens d’Eeckenbrugge Member MemberMr. Yves-Thibault de Silguy Member Member ChairmanMrs. Evelyn du Monceau Member MemberMrs. Françoise de Viron Member MemberMrs. Amparo Moraleda Martinez Member MemberMrs. Rosemary Thorne MemberMr. Gilles Michel MemberMrs. Marjan Oudeman Member
The Board has set up an Audit Committee whose composition,role and missions and functioning are described among other inits internal rules, which form an Appendix to the Charter.
The Audit Committee is composed of at least three non-executivedirectors and a majority of them are independent. The directorson this Audit Committee fulfill the criterion of competence byvirtue of their training and the experience gained during theirprevious functions (see section 4.1.1 regarding the compositionof the Board of Directors). The secretariat of this Committee isprovided by a member of the Group’s internal legal staff.
This committee met six times in 2016, including four times beforethe various Board meetings at which the publication of periodicresults (quarterly, semiannual and annual) was scheduled forconsideration. Attendance by the Audit Committee members atthe meetings was very high (100%).
At each meeting, the Audit Committee hears reports from theChief Financial Officer, the head of the Group Internal Audit andthe auditor in charge of the external audit (Deloitte, representedby Mr. Michel Denayer). It also examines the quarterly report bythe Group General Counsel on significant ongoing legal disputesand reports on tax and intellectual property disputes. It meetsalone with the auditor in charge of the external audit wheneverit deems such a meeting useful. The Chairman of the Executive
Committee and CEO (Mr. Jean-Pierre Clamadieu) and all otherBoard members are invited, once a year, to discuss the majorrisks to which the Group is exposed.
The Board has set up a Finance Committee whose composition,role, mission and functioning are described among other in itsinternal rules, which form an Appendix to the Charter.
Mr. Karim Hajjar (Executive Committee member and CFO) isinvited to attend the Finance Committee meetings.
The Secretary of this Committee is Mr. Michel Defourny.
This Committee met four times in 2016. Attendance by themembers of the Finance Committee was very high (100%)
The Committee gives its opinion on financial matters such asthe amounts of the interim and final dividends, the levels andcurrencies of indebtedness in the light of interest ratedevelopments, the hedging of foreign exchange and energy risks,the hedging policy of the long-term incentive plans, the content offinancial communication, and the financing of major investments.It finalizes the preparation of the press releases announcingthe quarterly results. It may also be called upon to give opinionson Board policies on these matters.
Board committees4.2.
The Audit Committee4.2.1.
The Finance Committee4.2.2.
CORPORATE GOVERNANCE STATEMENT
SOLVAY 2016 Annual Integrated Report41

The Board has set up a Compensation Committee whosecomposition, role, mission and functioning are described amongother in its internal rules, which form an Appendix to the Charter.
A majority of the members of this Committee have independentdirector status within the meaning of the law. The CompensationCommittee has the expertise necessary to perform its mission.
The Chairman of the Executive Committee is invited to meetings,except for matters that concern him personally.
The Secretary of this committee is Mr. Michel Defourny.
The meetings are prepared by the Group General ManagerHuman Resources, who attends the meetings.
This committee met twice in 2016. Attendance by the membersof the Compensation Committee was very high (100%).
The Compensation Committee fulfills the mission imposed onit by law. In particular, it advises the Board of Directors onCompensation policy and compensation levels for members ofthe Board of Directors and the Executive Committee, and isinformed every year about the compensation of GeneralManagement. It also gives its opinion to the Board of Directorsand/or Executive Committee on the Group’s principalcompensation policies (including long-term incentive plans). Italso prepares the report on compensation.
The Board has set up a Nominations Committee whosecomposition, role, mission and functioning are described in itsinternal rules, which form an Appendix to the Charter.
A majority of the members of the Nominations Committee areindependent non-executive directors.
The Chairman of the Executive Committee is invited to meetings,except for matters that concern him personally.
The Secretary of this Committee is Mr. Michel Defourny.
The committee met three times in 2016. Attendance by themembers of the Nomination Committee was very high (100 %)
The Nominations Committee gives its opinion on appointments tothe Board of Directors (Chairman, new members, renewals andcommittees), to Executive Committee positions (Chairmanship andmembers) and to general management positions.
The role, mission, composition, functioning and evaluation of theExecutive Committee are described in detail in the Charter. Inaddition, the internal rules of the Executive Committee areattached to the Charter.
As at December 31, 2016, the Executive Committee wascomposed of the following five members.
Year of birthYear of first
appointmentTerm of
office ends Diplomas and main Solvay activitiesPresence at
meetings in 2016Mr. Jean-PierreClamadieu (F)
1958 2011 2017 Engineering degree from the École des Mines(Paris).Chairman of the Executive Committee and CEO.
17/17
Mr. VincentDe Cuyper (B)
1961 2006 2018 Chemical engineering degree (Catholic University ofLouvain), Master in Industrial Management (CatholicUniversity of Leuven), AMP Harvard.Executive Committee member.
17/17
Mr. Roger Kearns(US)
1963 2008 2018 Bachelor of Science – Engineering Arts (GeorgetownCollege – Georgetown), Bachelor of Science –Chemical Engineering (Georgia Institute ofTechnology – Atlanta), MBA (Stanford University).Executive Committee member.
17/17
Mr. Karim Hajjar(UK)
1963 2013 2017 BSC (Hons) Economics (The City University, London).Chartered Accountancy (ICAEW) Qualification.Executive Committee member and CFO.
17/17
Mr. Pascal Juéry(F)
1965 2014 2018 Graduate of the European Business School of Paris(ESCP – Europe).Executive Committee member.
17/17
On May 1, July 1, and January 1, 2016 the Board of Directors renewed the respective mandates of Vincent De Cuyper, Roger Kearns, andPascal Juéry as members of the Executive Committee for a two-year term. Their respective mandates therefore expire on May 1, July 1,and January 1, 2018.
The Compensation Committee4.2.3. The Nominations Committee4.2.4.
EXECUTIVE COMMITTEE5.
CORPORATE GOVERNANCE STATEMENT
42SOLVAY 2016 Annual Integrated Report

The Compensation Committee, as a consultative body of theBoard of Directors, fulfills the tasks assigned to it by Article 526quater, §5 of the Companies Code. It advises the Board ofDirectors on:
The Compensation Committee also prepares the annualcompensation report for the Corporate Governance Statementand it is informed every year about the compensation of GeneralManagement.
The Compensation Committee has the necessary expertise toperform its mission.
Directors of Solvay SA are remunerated with fixed emoluments,the common basis of which is set by the Ordinary Shareholders’Meeting, and any complement thereto by the Board of Directorson the basis of Article 26 of the by-laws, which states that:
The Chairman of the Board of Directors is the sole non-executivedirector having permanent support provided by the Group(office, secretariat, car). The other non-executive directors receivelogistics support from the General Secretariat as and whenneeded. The Company also carries customary insurance policiescovering the activities of Board members in carrying out theirduties.
COMPENSATION REPORT6.
Governance6.1.
the Company’s compensation policy and principles;
the compensation levels for members of the Board ofDirectors and the Executive Committee;
the determination of the Chairman of the ExecutiveCommittee’s compensation, short-term incentives and long-term incentives, and performance assessment;
the allocation of long-term incentives (performance share unitsand stock options) to the Company’s senior managers.
Board of Directors compensation6.2.
“Directors shall receive emoluments payable from overheadcosts; the Shareholders’ Meeting shall determine the amountand terms of payment”;
“That decision shall stand until another decision is taken”;
“The Board of Directors shall be authorized to grant directorswith special duties (the Chairman, vice-Chairmen, directorscharged with day-to-day management, members of theExecutive Committee) fixed emoluments in addition to thoseprovided for in the above paragraph”;
“Each of the Directors responsible for day-to-day managementis also entitled to variable compensation determined by theBoard of Directors on the basis of their individual results andof the consolidated results of the Solvay group”;
“The sums referred to in the two preceding sub-sections arealso paid out of overhead costs”.
Board of Directors individual compensation6.2.1.the Ordinary Shareholders’ Meetings of June 2005 andMay 2012 (for Board attendance fee) decided to set directors’pay, starting from the 2005 financial year, and to grant:
an annual gross fixed compensation of € 35,000 per directorand additionally an individual attendance fee of € 4,000gross per Board meeting attended
–
€ 4,000 gross for members of the Audit Committee and€ 6,000 gross for its Chairman for each meeting of thecommittee attended
–
€ 2,500 gross per member of the Compensation Committee,Nominations Committee and Financial Committee and€ 4,000 gross for the chairmen of these committees for eachmeeting attended, on the understanding that a directorsitting on both the Compensation Committee and theNominations Committee does not receive doublecompensation
–
the Chairman of the Board, the Chairman of the ExecutiveCommittee and the executive directors do not receiveattendance fees for taking part in these committees
–
for the Chairman of the Board of Directors, the Board ofDirectors has made use of the authorization conferred on itby Article 27 of the by-laws to grant an additional yearly fixedcompensation of € 250,000 gross in 2016 by reason of theworkload and the responsibility attached to this
non-executive directors do not receive any variablecompensation linked to results or other performance criteria.They are not entitled to stock options or performance shareunits, nor to any supplemental pension scheme
the Company reimburses directors’ travel and subsistenceexpenses for meetings and while exercising their Board andBoard Committee functions.
CORPORATE GOVERNANCE STATEMENT
SOLVAY 2016 Annual Integrated Report43

Compensation
2016 2015
In € Gross amount
Including Board ofDirectors and
Committeesattendance fees Gross amount
Including Board ofDirectors and
Committeesattendance fees
N. BoëlFixed emoluments + attendance fees 67,000 32,000 75,000 40,000“Article 27” supplement 250,000 250,000
D. Solvay 74,500 39,500 82,500 47,500J-P. Clamadieu 67,000 32,000 75,000 40,000J-M. Solvay 67,000 32,000 75,000 40,000G. de Selliers de Moranville(1) 41,701 29,000B. de Laguiche 101,000 66,000 99,500 64,500B. Scheuble 99,000 64,000 101,000 66,000C. Casimir-Lambert 91,000 56,000 95,000 60,000H. Coppens d’Eeckenbrugge 101,000 66,000 103,500 68,500E. du Monceau 74,500 39,500 78,500 43,500Y-T. de Silguy 85,000 50,000 93,000 58,000A. Moraleda 66,500 31,500 82,500 47,500F. de Viron 74,500 39,500 82,500 47,500G. Michel 77,000 42,000 87,500 52,500R. Thorne 91,000 56,000 95,000 60,000M. Oudeman(2) 87,000 52,000 50,298 28,000
1,473,000 698,000 1,567,500 792,500
(1) Until May 12, 2015.(2) From May 12, 2015.
Solvay compensation policy aims to ensure that our ExecutiveCommittee is rewarded according to its success in contributing toSolvay’s performance.
Overall, Solvay seeks to position itself at or around the relevantmarket median for base salary and benefits. Variablecompensation, both short-term and long-term, is designed toensure superior performance. Our high performers may achievearound upper quartile on actual total compensation.
The Solvay Compensation System is designed in line with thefollowing principles:
Amount of the compensation and other benefits granted directly or indirectly to directors(executive and non-executive) by the Company or by an affiliated company
6.2.2.
Gross compensation and other benefits granted to directors
Executive Committee compensation6.3.Solvay compensation philosophy6.3.1.
Total compensation is designed to be competitive in therelevant market, so as to attract, retain and motivate the righttalents.
Short-term and long-term variable compensation is tieddirectly to the achievement of strategic targets to drivesustainable performance and recognize superior results.
Compensation decisions are compliant and equitable, andbalance cost and value appropriately.
CORPORATE GOVERNANCE STATEMENT
44SOLVAY 2016 Annual Integrated Report

Solvay’s compensation structure for our Executive Committee isdesigned in accordance with the “pay-for-performance” approachapproved by the Board of Directors, focusing on the Company’sshort and long-term performance.
The level and structure of the compensation are aligned withmarket practices for similar functions in a comparableorganization.
To assess relevant competitive practice, Solvay takes as its frameof reference a selection of European chemical and industrialmanufacturing companies with international operations andannual sales revenues and a headcount reasonably close to itsown. The composition of this selected group is reviewed on aperiodic basis to assure that it continues to reflect the Company’sstrategic orientation.
It is currently composed of 17 European-based multinationalcompanies headquartered in six different European countries(Belgium, France, Germany, Netherlands, UK and Switzerland)and active in the chemical sector and/or the industrial sector.
For data relating to the international market, the services of theinternationally recognized compensation consultant WillisTowers Watson have been retained.
No major changes in the structure of the compensation packageof the Chairman and the members of the Executive Committeeare expected in 2017 and 2018.
(*) The corresponding number of stock options (SOP) is determined at grant date, based on the fair market value of the SOP. The PSU value is the closing shareprice on the grant date.
The base salary reflects role responsibilities, job characteristics,experience and skill sets. It is paid monthly in cash. Base salary isreviewed annually and may increase if justified by external market(peer group).
The primary purpose of pension and insurance plans is toestablish a level of security for our employees and theirdependents with respect to age, health, disability and death.
Compensation structure6.3.2. Umicore
Air Liquide
Arkema
Michelin
Saint Gobain
Vallourec
BASF
Bayer
Evonik
Lanxess
Akzo Nobel
DSM
Rolls Royce
GKN
BAE Systems
Johnson Matthey
Syngenta
The compensation structure consists of the following components:
Base salary Pension and other benefits
CORPORATE GOVERNANCE STATEMENT
SOLVAY 2016 Annual Integrated Report45

The short-term incentive is linked partly to the Groupperformance and partly to the individual performance.
The long-term incentives consist of a 50/50 mix of stock options(SOP) and performance share units (PSU).
Each annual LTI plan is subject to prior Board approval.
In its sole discretion the Executive Committee (or the Board ofDirectors for the Executive Committee members) may decide/recommend individual grants of + or -50% of the target to rewardspecial or unique achievements or circumstances or toacknowledge insufficient performance, while respecting the 50/50 split between SOP and PSU grants.
The plan offers a competitive Long Term Incentive (LTI) vehiclealigned with Belgian practices. It is aimed at incentivizing Solvay’sexecutive leadership team to work towards achieving robustsustainable returns for the shareholders while offering a robustretention tool to the Company.
The SO plan provides each beneficiary with the right to buy Solvayshares at a strike price corresponding to the fair market value ofthe shares upon grant. They bear no intrinsic value at that pointin time and will only generate a potential gain for the beneficiariesif the stock price rises.
In accordance with Belgian legislation, taxes on stock options arepaid at grant. Therefore, in accordance with Belgian practices,there is no performance attached to the stock options vestingperiod.
Every year, the Board of Directors determines the volume ofstock options available for distribution, based on an assessmentof the economic fair value at grant, using the Black Scholesfinancial formula. The total volume of options available is thenallocated to the top executives of the Company based on theimportance of their individual contribution/position to thesuccess of the Solvay group.
The performance share unit program (PSU) ensures thealignment with market practices, helping Solvay to remaincompetitive in the market place in order to attract and retain keyexecutives while offering a more performance-contingent vehicleto incentivize key executives to make a contribution towardsSolvay’s roadmap ambitions.
The PSU plan, settled in cash, provides for a possible payoutin three years’ time if a combination of pre-set performanceobjectives are met (underlying EBITDA and CFROI long-termevolution based on this three-year period), with a +/-20%adjustment depending on the actual performance versus theinitial pre-set objective. The minimum payout can vary from zeroif the minimum performance required or “threshold” is not met,to 80% if the performance minimum “threshold” is met, and upto 120% for a performance exceeding a pre-defined ceilingperformance.
The Board of Directors determines annually the envelopeavailable for distribution based on the closing value of the Solvayshare at grant date. The total volume of PSUs available is thenallocated to the senior managers of the Company based on theirexpected ability to contribute substantially to the achievement ofSolvay’s ambitions.
Short-term incentive
Group performance is measured against the annualunderlying EBITDA (under a specific Free Cash Flow constraint)and a Sustainable Development indicator.
Individual performance is measured against a set of pre-determined annual objectives, approved by the Board ofDirectors.
Long-term incentive
Stock options
Key features:
Options are granted at the money
Eight years duration
Options become exercisable for the first time after three fullcalendar years following grant
Options are not transferrable inter vivos
The plan includes a bad leaver clause.
Performance share units
CORPORATE GOVERNANCE STATEMENT
46SOLVAY 2016 Annual Integrated Report

In its sole discretion, the Executive Committee (or the Boardof Directors for executive members) assesses the achievementof the targets and the Executive Committee (or the Board ofDirectors for executive members) may also re-evaluate thetargets in cases of material change of perimeter or otherunexpected circumstances.
The 2013 PSU program payout was at 45.5% of the target basedon CFROI and underlying EBITDA achievements for the period2013-2015.
The Board of Directors decided that such payout did not reflectthe exceptional Group transformation required by the Cytecacquisition and the integration over the period 2013-2015. Ittherefore decided to increase the payout to 54.25% (dividendand share price variation included).
As of 2017 plan, new metric will be introduced into the PSUplan. Solvay has publicly reinforced its position on value creationthat encompasses both financial and extra-financial indicators(sustainable development).
In order to align LTIs with Solvay's broader definition ofsustainable value creation, a proportion of the value willhenceforth be linked to improving Solvay's sustainabilityperformance in respect of greenhouse gas intensity. The newcriteria, applicable with effect from LTIs granted in 2017, will thusbecome:
The remuneration package of the Chairman of the ExecutiveCommittee is in full compliance with Art. 520 ter of theCompanies’ Code and is set by the Board of Directors based onrecommendations by the Compensation Committee.
Art. 520 ter of the Companies’ Code provides that from 2011onwards, in the absence of statutory provisions to the contraryor express approval by the General Meeting of Shareholders, atleast one quarter of the variable compensation must be basedon predetermined criteria of performance that are objectivelymeasurable over a period of at least two years, and at leastanother quarter should be based on predeterminedperformance criteria that are objectively measurable over aperiod of at least three years.
The base salary of the Chairman of the Executive Committeeremains unchanged at € 1.1 million and matches the marketmedian of Solvay's peer group.
In the area of extra-legal pension rights, given his self-employedstatus in Belgium, the CEO has his own separate contractualregime, with pension, death-in-service and disability rules, whichreflect the conditions he had previously at Rhodia.
Key features:
The plan is purely cash-based and does not encompass anytransfer of shares to beneficiaries
It contains the following two performance targets – 50% basedon EBITDA target aligned with Solvay’s roadmap and 50%based on CFROI target
Condition of employment up to achievement of performancetargets
Payout in cash based on the value of Solvay shares on targetdate.
2013 LTI performance share units payout
Future LTI performance share units plan
40% on underlying EBITDA growth
40% on CFROI improvement
20% on Greenhouse Gas (GHG) Intensity reduction.
Chief Executive Officer6.3.3.
Base salary
Pension & benefits
CORPORATE GOVERNANCE STATEMENT
SOLVAY 2016 Annual Integrated Report47
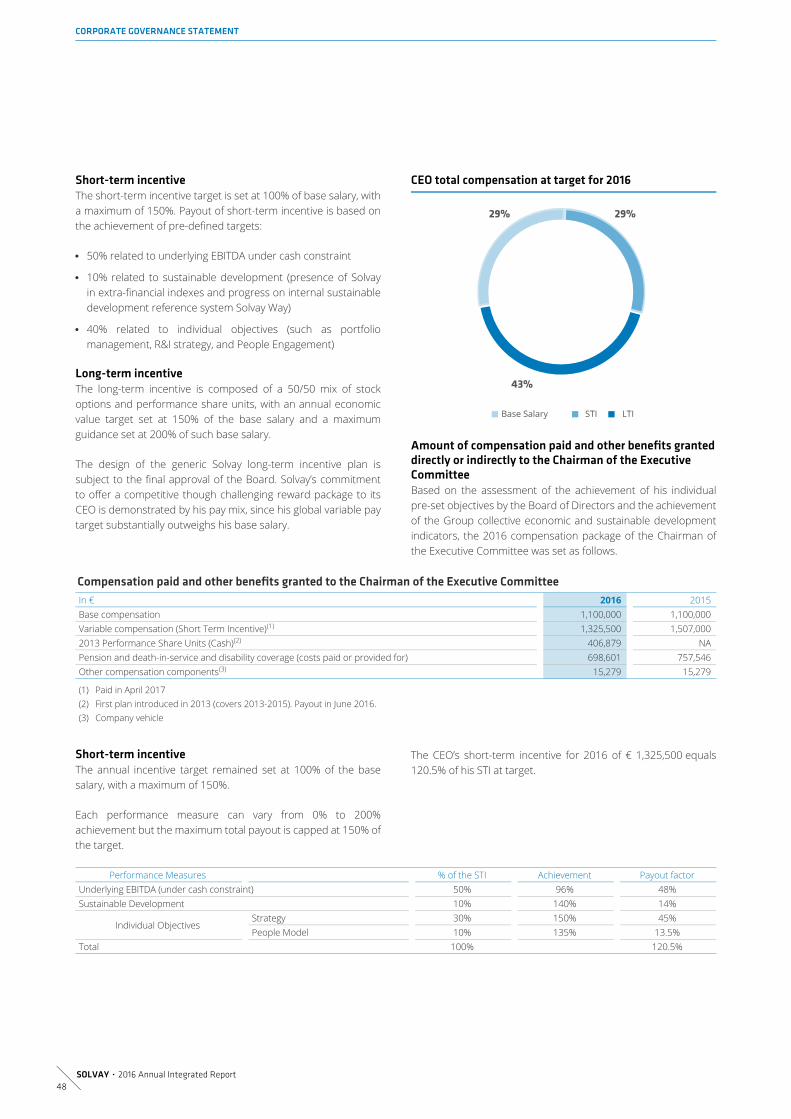
The short-term incentive target is set at 100% of base salary, witha maximum of 150%. Payout of short-term incentive is based onthe achievement of pre-defined targets:
The long-term incentive is composed of a 50/50 mix of stockoptions and performance share units, with an annual economicvalue target set at 150% of the base salary and a maximumguidance set at 200% of such base salary.
The design of the generic Solvay long-term incentive plan issubject to the final approval of the Board. Solvay’s commitmentto offer a competitive though challenging reward package to itsCEO is demonstrated by his pay mix, since his global variable paytarget substantially outweighs his base salary.
Based on the assessment of the achievement of his individualpre-set objectives by the Board of Directors and the achievementof the Group collective economic and sustainable developmentindicators, the 2016 compensation package of the Chairman ofthe Executive Committee was set as follows.
Compensation paid and other benefits granted to the Chairman of the Executive Committee
In € 2016 2015Base compensation 1,100,000 1,100,000Variable compensation (Short Term Incentive)(1) 1,325,500 1,507,0002013 Performance Share Units (Cash)(2) 406,879 NAPension and death-in-service and disability coverage (costs paid or provided for) 698,601 757,546Other compensation components(3) 15,279 15,279
(1) Paid in April 2017(2) First plan introduced in 2013 (covers 2013-2015). Payout in June 2016.(3) Company vehicle
The annual incentive target remained set at 100% of the basesalary, with a maximum of 150%.
Each performance measure can vary from 0% to 200%achievement but the maximum total payout is capped at 150% ofthe target.
The CEO’s short-term incentive for 2016 of € 1,325,500 equals120.5% of his STI at target.
Performance Measures % of the STI Achievement Payout factorUnderlying EBITDA (under cash constraint) 50% 96% 48%Sustainable Development 10% 140% 14%
Strategy 30% 150% 45%Individual Objectives
People Model 10% 135% 13.5%Total 100% 120.5%
Short-term incentive
50% related to underlying EBITDA under cash constraint
10% related to sustainable development (presence of Solvayin extra-financial indexes and progress on internal sustainabledevelopment reference system Solvay Way)
40% related to individual objectives (such as portfoliomanagement, R&I strategy, and People Engagement)
Long-term incentive
CEO total compensation at target for 2016
Amount of compensation paid and other benefits granteddirectly or indirectly to the Chairman of the ExecutiveCommittee
Short-term incentive
CORPORATE GOVERNANCE STATEMENT
48SOLVAY 2016 Annual Integrated Report

Base salary xTarget
incentive xPerformance
factor = Final awardSTI Payout € 1,100,000 x 100% x 120.5% = € 1,325,500
2016 has been a solid year for Solvay as far as financialperformance is concerned and it was also marked by anotherstep in the Group’s transformation: the successful acquisition ofCytec.
Solvay’s CEO delivered on all objectives set by the Board ofDirectors on Strategy – including notably Cytec integration &Synergies, Divestments, and Corporate R&I strategy – and ondeployment of the People Model, which includes TalentManagement and the Executive Committee succession planwithin the framework of the long-term and short-term financialequilibriums of the Group.
Tied to the successful acquisition of Cytec with synergiesestimated at US$ 100 million, the Board decided, following thepay for performance principle, to grant an acquisition award to
the CEO comprising € 200,000 cash and 35,149 stock optionsunits; the latter is blocked for three years and will only pay out ifand when the share price increases.
Since then, the synergies have been revised up toUS$ 150 million.
In 2016, the face value of his overall LTI award totaled€ 1.65 million, in line with his LTI target of 150% of base salary.The gain which will eventually be derived on payout date willdepend upon achievement of the performance thresholdsimposed on his PSUs as well as of the performance of the Solvayshares on the stock market. The resulting numbers of stockoptions and PSU’s are calculated according to the Black Scholesmodel.
Annual Base x Target award = Grant ValueLTI – Perf. Share Units € 1,100,000 x (150% / 2) = € 825,000
LTI – Stock Option € 1,100,000 x (150% / 2) = € 825,000LTI – Total € 1,650,000
2013 PSUtarget award x Payout factor = Cash Payout
Perf.Share Units (cash) € 750,000 x 54.25% = € 406,879
Payout calculation
Acquisition award
Long-term incentive2016 Award
2013 PSUs payout
CORPORATE GOVERNANCE STATEMENT
SOLVAY 2016 Annual Integrated Report49

The Executive Committee members are entitled to retirement,death-in-service and disability benefits on the basis of theprovisions of the plans applicable in their home country. Otherbenefits, such as medical care and company cars or car
allowances, are also provided according to the rules applicablein the host country. The nature and magnitude of these otherbenefits are largely in line with the median market practice.
Target in % of base salary Performance Measures % of the STIUnderlying EBITDA (under cash constraint) 60%
Sustainable Development 10%Individual Objectives 30%
70%
Total 100%
The target annual incentive for the members of the ExecutiveCommittee is 70% of base salary. The target short-term incentiveconsists of three components weighted as follows:
The actual annual incentive can vary from 0% in cases of poorperformance to 200% of target in cases of outstanding collectiveand individual performance.
Tied to the successful acquisition of Cytec with synergiesestimated at US$ 100 million, the Board decided to grant anacquisition award of 66,197 stock options units to the ExecutiveCommittee. This award is made in accordance with the pay forperformance principle since it is blocked for three years and willthen only pay out to the extent that the share price has increasedin the meantime.
Since then, the synergies have been revised up toUS$ 150 million.
Performance Shares Units (PSU’s) Stock OptionsTarget Grant Target Grant
Executive Committee€ 250,000 € 250,000
Compensation paid and other benefits granted to the other members of the Executive Committee
In € 2016(1) 2015(2)
Base compensation 2,259,531 2,182,396Variable compensation(3) 1,802,934 1,648,1332013 Performance Share Units (Cash)(4) 406,880 NAPension and death-in-service and disability coverage (costs paid or provided for) 672,567 936,092Other compensation components(5) 118,151 128,057
(1) V. De Cuyper, R. Kearns, K. Hajjar, P. Juéry(2) V. De Cuyper, R. Kearns, K. Hajjar, P. Juéry.(3) 2015 payout based on 60% of base salary at target 2016 payout based on 70% of base salary at target. Payout in April of the following year.(4) K. Hajjar excluded (joined after the 2013 LTI grant)(5) Representation allowance, luncheon vouchers, company car.
Variable compensation consisted of an annual incentive based on the performance achieved towards pre-set collective Group economicand sustainable development performance objectives, and towards the performance of the manager as measured against a set of pre-determined individual objectives.
Other members of the Executive Committee6.3.4.Pension and other benefits
Short-term incentive
60% linked to the actual performance achieved towards acombination of annual pre-set collective Group economicperformance objectives (underlying EBITDA under a specificFree Cash Flow constraint)
10% related to a Group sustainable development indicator
30% depending on the individual performance of the manageras measured against a set of pre-determined objectives
Acquisition award
Long-term incentive
Global amount of compensation paid and other benefits granted directly or indirectly to the other members of theExecutive Committee by the Company or an affiliated company
CORPORATE GOVERNANCE STATEMENT
50SOLVAY 2016 Annual Integrated Report
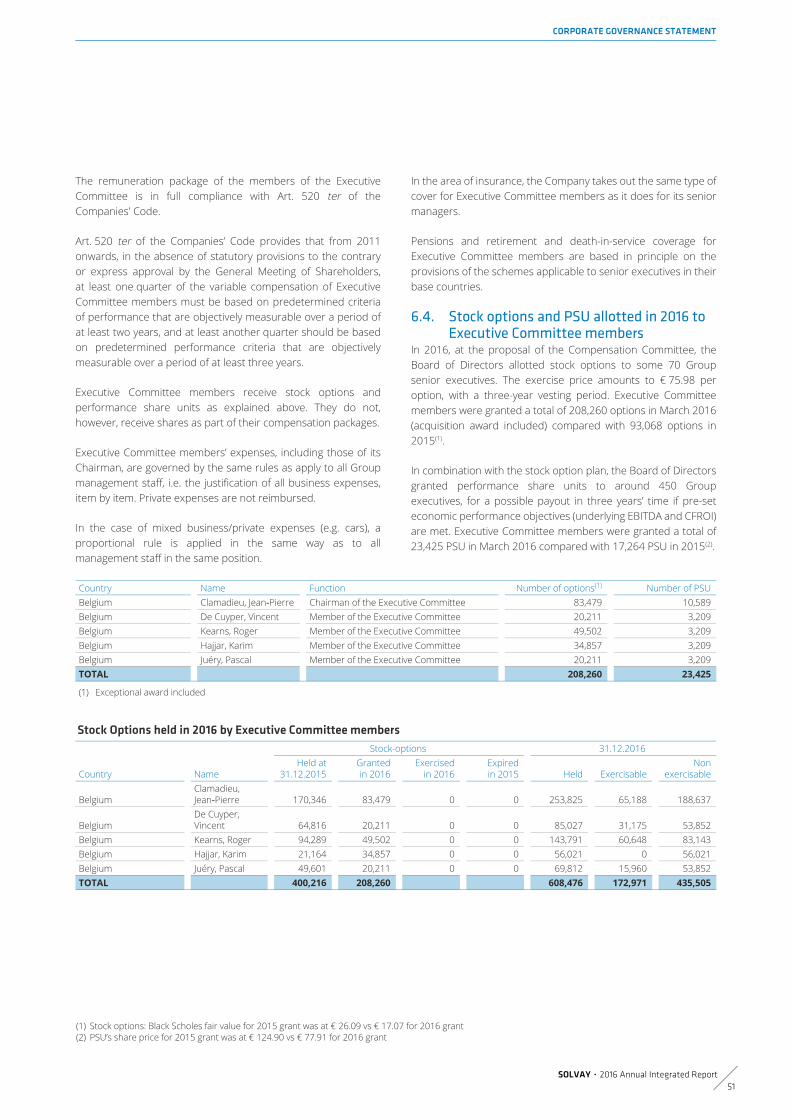
The remuneration package of the members of the ExecutiveCommittee is in full compliance with Art. 520 ter of theCompanies' Code.
Art. 520 ter of the Companies’ Code provides that from 2011onwards, in the absence of statutory provisions to the contraryor express approval by the General Meeting of Shareholders,at least one quarter of the variable compensation of ExecutiveCommittee members must be based on predetermined criteriaof performance that are objectively measurable over a period ofat least two years, and at least another quarter should be basedon predetermined performance criteria that are objectivelymeasurable over a period of at least three years.
Executive Committee members receive stock options andperformance share units as explained above. They do not,however, receive shares as part of their compensation packages.
Executive Committee members’ expenses, including those of itsChairman, are governed by the same rules as apply to all Groupmanagement staff, i.e. the justification of all business expenses,item by item. Private expenses are not reimbursed.
In the case of mixed business/private expenses (e.g. cars), aproportional rule is applied in the same way as to allmanagement staff in the same position.
In the area of insurance, the Company takes out the same type ofcover for Executive Committee members as it does for its seniormanagers.
Pensions and retirement and death-in-service coverage forExecutive Committee members are based in principle on theprovisions of the schemes applicable to senior executives in theirbase countries.
In 2016, at the proposal of the Compensation Committee, theBoard of Directors allotted stock options to some 70 Groupsenior executives. The exercise price amounts to € 75.98 peroption, with a three-year vesting period. Executive Committeemembers were granted a total of 208,260 options in March 2016(acquisition award included) compared with 93,068 options in2015(1).
In combination with the stock option plan, the Board of Directorsgranted performance share units to around 450 Groupexecutives, for a possible payout in three years’ time if pre-seteconomic performance objectives (underlying EBITDA and CFROI)are met. Executive Committee members were granted a total of23,425 PSU in March 2016 compared with 17,264 PSU in 2015(2).
Country Name Function Number of options(1) Number of PSUBelgium Clamadieu, Jean‑Pierre Chairman of the Executive Committee 83,479 10,589Belgium De Cuyper, Vincent Member of the Executive Committee 20,211 3,209Belgium Kearns, Roger Member of the Executive Committee 49,502 3,209Belgium Hajjar, Karim Member of the Executive Committee 34,857 3,209Belgium Juéry, Pascal Member of the Executive Committee 20,211 3,209TOTAL 208,260 23,425
(1) Exceptional award included
Stock Options held in 2016 by Executive Committee members
Stock-options 31.12.2016
Country NameHeld at
31.12.2015Grantedin 2016
Exercisedin 2016
Expiredin 2015 Held Exercisable
Nonexercisable
BelgiumClamadieu,Jean‑Pierre 170,346 83,479 0 0 253,825 65,188 188,637
BelgiumDe Cuyper,Vincent 64,816 20,211 0 0 85,027 31,175 53,852
Belgium Kearns, Roger 94,289 49,502 0 0 143,791 60,648 83,143Belgium Hajjar, Karim 21,164 34,857 0 0 56,021 0 56,021Belgium Juéry, Pascal 49,601 20,211 0 0 69,812 15,960 53,852TOTAL 400,216 208,260 608,476 172,971 435,505
Stock options and PSU allotted in 2016 toExecutive Committee members
6.4.
(1) Stock options: Black Scholes fair value for 2015 grant was at € 26.09 vs € 17.07 for 2016 grant(2) PSU’s share price for 2015 grant was at € 124.90 vs € 77.91 for 2016 grant
CORPORATE GOVERNANCE STATEMENT
SOLVAY 2016 Annual Integrated Report51

Executive Committee members, including the Chairman, havedirectorships in Group subsidiaries as a function of theirresponsibilities.
Where such directorships are compensated, they are included inthe amounts given above, regardless of whether the position isdeemed to be salaried or undertaken on a self-employed basisunder local legislation.
No Executive Committee member, including the Chairman, willbenefit from any departure indemnity linked to the exercise oftheir office. If their service ends early, only the legal systemapplies.
Mr. Jean-Pierre Clamadieu’s contract includes a 24-month non-competition clause, but with no more than 12 months’ pay.
Executive Committee members’ contracts do not contain a clauseproviding a right of claw-back of variable compensation in casesof erroneous financial information.
The Group has set up an internal control system designed toprovide a reasonable assurance that (i) current laws andregulations are complied with, (ii) policies and objectives set bygeneral management are implemented, (iii) financial and extra-financial information is reliable, and (iv) internal processes areefficient, particularly those contributing to the protection of itsassets.
A reasonable assurance level means a high, but not absolute,level; any internal control system has limitations linked to humanerror, wrong decisions or to the choices made in terms of cost/benefit of control.
This system has five components: the control environment, arisk assessment process, control activities, information andcommunication, and the internal control monitoring.
The control environment is the foundation of the internal controlsystem, as it promotes the awareness and the compliantbehavior of all employees. It is made up of various elements
that set up a clear structure of principles, rules, roles andresponsibilities, while showing the commitment of generalmanagement.
The Management Book explains the organization andgovernance of the Group: its guiding principles, the roles andresponsibilities of the Executive Committee (Comex), GlobalBusiness Units and functions are defined, as well as their scope.It also set forth a management framework expressed in theGroup’s Management and People Models, includingaccountability and transparency. The Management Book alsocontains an approval matrix, displaying the level of authorityrequired for the approval of major decisions (financialcommitments, sales or purchase contracts, capital investments,acquisitions or divestments, and legal settlements). Finally, itcontains 25 “red lines” that are tackling key risks of the Group.These rules are mandatory for all employees.
The Code of Conduct highlights the principles that are intendedto guide employees in their daily activities. It is based on a strongtradition of values that are deeply rooted in the Company’sculture. As to the financial reporting, the Code states thatemployees must ensure that it is accurate and compliant withapplicable regulations.
An Ethics Helpline, managed by a third party, is being madeavailable to employees to enable them to report potentialviolations of the Code of Conduct, in case they cannot go throughtheir managers or through the Compliance organization, or wishto report anonymously. The Helpline is available for reportingconcerns via the internet in more than 45 specific countries/regions as well as in the general category “other location”. Thus,anyone may contact the Ethics Helpline from wherever he or shemay be located in the world. In addition, the Ethics Helpline webtool is available in more than 40 languages. The phone line hasmore than 20 languages available by prompt, depending on thenumber dialed. Toll-free access is given to Solvay employees andis available 24 hours a day, 365 days a year.
All these documents are accessible widely through the Groupintranet, and regular training courses on the Code of Conduct areprovided to all employees.
Standardized human resources processes are in place to allowdevelopment, training and appraisal of personnel. The jobdescriptions for key positions are organized consistently byprofessional family: Finance has its own job description referencesystem, covering the key positions that ensure the timeliness,compliance and quality of the financial reporting.
Most important provisions of theircontractual relationships with theCompany and/or an affiliated company,including the provisions relating tocompensation in the event of earlydeparture
6.5.
MAIN CHARACTERISTIC OF RISKMANAGEMENT AND INTERNALCONTROL SYSTEMS
7.
The control environment7.1.
CORPORATE GOVERNANCE STATEMENT
52SOLVAY 2016 Annual Integrated Report

It is an inherent aspect of the business and operations of theGroup to deal with risks, while remaining in compliance with laws,regulations and the Code of Conduct, and pursuing its ambitioussustainable development targets.
The Enterprise Risk Management (ERM) policy of Solvay isexplained in the Management Book: it states that the Group willidentify, quantify, assess and manage all potentially significantbusiness risks and opportunities by applying systematic riskmanagement integrated with strategy, business decisions andoperations. Enterprise Risk management is seen as an essentialmanagement tool and aid in making the decisions needed toachieve the Company’s short, medium, and long-term objectives.
The Comex approves the risk management policies andprocesses used throughout the Group. The Internal Audit & RiskManagement Department (IA/RM) is in charge of setting up aglobal and consistent system of risk management across theGroup.
The process of risk management takes into account theorganization’s strategic objectives and is structured in followingphases:
The enterprise risk management effort is structured aroundthree main pillars:
Moreover, the approach to designing internal controls on majorprocesses includes a step of risk assessment, defining which keycontrol objectives are to be tackled.
This is the case in particular for processes at subsidiary, sharedservice, GBU or corporate level, leading to the production of thefinancial reporting.
More information on risks can be found in the “Management ofrisks” section of the annual report, in particular with regard tothe Group’s main risks and the actions taken to avoid or reducethem.
Solvay uses a systematic approach to designing andimplementing control activities in the most relevant processes.The key responsibilities in this approach are defined in Solvay’sManagement Book. The corporate process owner (CPO) is thetop management, function general manager, sponsor ofprocesses (and sub processes). The corporate process manager(CPM) is responsible for the definition of a standard process forthe Group. He should:
The Internal Audit and Risk Management Department assists thecorporate process managers in identifying the most significantrisks in the processes and in designing control activities inproportion to the stakes inherent in each process. It also helpsthem to set up their annual internal control plan (indicating whichissues and controls are to be a priority for the coming year, aswell as the roll-out plan). This plan is validated each year by anInternal Control Steering Committee chaired by the Group CFO,and comprising all function general managers. At each level ofthe Group (corporate, Shared Services platforms and GBUs), themanagement operating the various processes is responsible forthe execution of the controls.
The risk assessment process7.2.
risk analysis (identification and evaluation)
decision on how to manage the critical risks
implementation of risk management actions
monitoring of those actions.
an annual top-down exercise initiated at Leadership Councillevel (Comex, GBU presidents, function general managers,zone presidents, Solvay Business Services general managerand selected senior managers). It is complemented by abottom-up exercise using the risk assessments at GBU/functions level, and is finalized by a review and validation of alist of Group risks by the Group Risk Committee (Comex andGeneral Managers of the HR, Industrial, Legal, and SustainableDevelopment functions). The Comex receives regularly aGroup Risks Dashboard following up on those Group risks andthe status of mitigating actions undertaken
an exercise covering all GBUs and functions, with amethodology adapted to their size and embedded in theannual strategic review process. This exercise involves all thesenior managers of the GBU or function to identify and assessthe major risks for their unit. The management team and thepresident of the GBU (or the function general manager) arethen in a position to assign the ownership of all critical risks toone of the GBU’s managers. A regular follow-up of the actionsmitigating critical risks is required from all GBUs
specific risk assessments for major projects (investments,acquisitions or major function projects).
Control activities7.3.
1. identify risks and assess them;
2. set up procedures and control activities relevant to thoserisks;
3. roll out those controls across the Group.
CORPORATE GOVERNANCE STATEMENT
SOLVAY 2016 Annual Integrated Report53

General controls on the information systems cover both thesecurity aspects, aimed at securing the protection of data, andthe quality aspects, aimed at ensuring the best suitability ofsolutions (management of changes and projects) and services(management of information system operations) to the needs ofthe users.
With regard to the controls on financial data, these controls areimplemented throughout the Record-to-Report process.Furthermore, a Financial Reporting Guide explains how theIFRS rules should be applied throughout the Group.
The financial elements are consolidated monthly and analyzed atevery level of responsibility of the Company (such as, for example,Solvay Business Services, the finance director of the entity, GroupAccounting and Reporting and the Executive Committee) andin various ways, such as variance analysis, plausibility andconsistency checks, ratio analysis and comparison with forecasts.
The results are also validated quarterly by the Audit Committee,taking into account the work carried out by the external auditor.
The Group Communication function defines and ensures theimplementation of an external communication policy and pressrelations policy. This function validates the externalcommunications with potential impact at the Group level (a redline that is not to be crossed).
The Group maintains extensive communication channels thatallow all relevant information to move fluidly down from topmanagement level and up from operational level.
The communication from top management to all the employeesis supported by a number of tools, such as the Group intranet orelectronic newsletters, which are used in presentations by seniormanagement to various teams throughout the world.
Besides the monthly reporting analysis prepared by the GroupControlling, the Comex makes a thorough quarterly review of theGBU performance, through the business forecast reviews.
The information systems for the whole Group are managed bySolvay Business Services. A large majority of the operations ofthe Group are supported by a small number of integrated ERPsystems. The financial consolidation is supported by a dedicatedtool.
As to the financial reporting disclosure, Solvaypublishes quarterly results. Before each quarterly closing, theGroup Accounting and Reporting department circulates writtendetailed instructions to all concerned actors.
The publication of the results is subject to various checks andvalidations carried out in advance:
The Audit Committee is in charge of monitoring the effectivenessof internal control systems. It supervises the work of InternalAudit and Risk Management with regard to financial, operational,and compliance monitoring. In particular, it is informed of thescope, programs and results of the internal audit work andreceives the assurance that the audit recommendations areproperly implemented. The role and missions of the AuditCommittee are further detailed in the Charter.
Internal audit is an independent objective assurance andconsulting activity designed to add value and improve the Groupoperations. It helps the Group to accomplish its objectives bybringing a systematic, disciplined approach to evaluating andimproving the effectiveness of risk management, control andgovernance processes.
The internal audit assignments are planned and defined in termsof content on the basis of a risk analysis; the diligences focuson the areas perceived as having the highest risks. All theconsolidated entities within the Group are visited by InternalAudit at least every three years.
The recommendations of Internal Audit are implemented by themanagement.
Other entities carry out activities of the same type in very specificareas. For example:
Information and communication7.4.
publication is carried out under the supervision and control ofthe Executive Committee
the Audit Committee validates it, ensuring in particular that theIFRS accounting principles are complied with and that it gives afair and relevant picture of the business of the Group
the Board of Directors approves it.
Internal control monitoring7.5.
the Health Safety & Environment department carries outhealth, safety, and environmental audits
the Solvay Business Services Compliance and RiskManagement department conducts information system auditassignments, in coordination with Internal Audit;
the Ethics and Compliance department coordinatesinvestigations in cases of potential infringement of the Code ofConduct.
CORPORATE GOVERNANCE STATEMENT
54SOLVAY 2016 Annual Integrated Report

The audit of the Company’s financial situation, its financialstatements, and the conformity of the statements – and theentries to be recorded in the financial statements in accordancewith the Companies’ Code and the by-laws – is entrusted to oneor more auditors appointed by the Shareholders’ Meeting fromamong the members, either physical or legal persons, of theBelgian Institute of Company Auditors.
The mission and powers of the auditor(s) are those set by law.
The Shareholders’ Meeting sets the number of auditors and fixestheir emoluments in accordance with the law. Auditors are alsoentitled to reimbursement of their travel expenses for auditingthe Company’s sites and administrative offices.
The Shareholders’ Meeting may also appoint one or morealternate auditors. Auditors are appointed for three-yearrenewable terms, which may not be revoked by the Shareholders’Meeting other than for good reason.
The audit mandate of Deloitte Reviseurs d’Entreprises SC s.f.d.SCRL expired at the Ordinary Shareholders’ Meeting of 2016.
Based on the recommendation of the Audit Committee, theBoard of Directors proposed to the Ordinary Shareholders’Meeting held on May 10, 2016 to renew the audit mandate ofDeloitte Reviseurs d’Entreprises SC s.f.d. SCRL, represented byMr. Michel Denayer, for three years. The Board has alsoproposed to appoint Corine Magnin as alternate representativeof Deloitte Reviseurs d’Entreprises SC s.f.d. SCRL, for three years.
The Ordinary Shareholders’ Meeting of May 10, 2016 approvedboth resolutions.
The yearly 2016 audit fees for Solvay SA were set at € 1.1 million.They include the audit of the statutory and consolidated accountsof Solvay SA.Additional audit fees for Solvay affiliates in 2016 amount to€ 5.1 million, and include Cytec legacy for the full year 2016.
Supplementary non audit fees of € 1.4 million were paid in 2016by Solvay Affiliates.
According to Article 34 of the Belgian Royal Decree ofNovember 14, 2007, the Company hereby discloses the followingitems:
As at December 21, 2015, the capital of the Company amountedto € 1,588,146,240 represented by 105,876,416 ordinary shareswith no par value, fully paid up.
All Solvay shares are entitled to the same rights. There are nodifferent classes of shares.
Solvay’s by-laws do not contain any restriction on the transfer ofits shares.
The Company has been informed that certain individualshareholders who hold shares directly in Solvay have decidedto consult one another when questions of particular strategicimportance are submitted by the Board of Directors to theShareholders’ Meeting. Each of these shareholders, however,remains free to vote as he or she chooses. None of thesepersons, either individually or in concert with others, reaches theinitial 3% transparency notification threshold.
Solvay is not aware of any other voting agreements among itsshareholders or of the existence of a concert between itsshareholders.
There are no such securities.
There is no employee share scheme with such a mechanism.
EXTERNAL AUDIT8. ITEMS TO BE DISCLOSED PURSUANTTO ARTICLE 34 OF THE BELGIANROYAL DECREE OF NOVEMBER 14,2007
9.
Capital structure and authorizationsgranted to the Board
9.1.
Transfer of shares and shareholders’arrangements
9.2.
Holders of securities with special controlrights
9.3.
Control mechanism of any employee sharescheme where the control rights are notexercised directly by the employees
9.4.
CORPORATE GOVERNANCE STATEMENT
SOLVAY 2016 Annual Integrated Report55

Each Solvay share entitles holders thereof to exercise one vote atShareholders’ Meetings.
Article 11 of the Company’s by-laws provides that the exercise ofvoting rights and other rights attached to shares that are jointlyowned, or of which the usufruct and bare ownership rights havebeen separated or which are pledged, are suspended pendingthe appointment of a single representative to exercise the rightsattached to the shares.
The voting rights attached to the shares in Solvay held by SolvayStock Option Management are, as a matter of law, suspended.
The by-laws of the Company provide that the Company is to bemanaged by a Board of Directors composed of no less than fivemembers, their number being determined by the Shareholders’Meeting (Article 14).
Directors are appointed by the Shareholders’ Meeting for fouryears (and may be reappointed).
The Board of Directors submits directors’ appointments,renewals, resignations or dismissals to the OrdinaryShareholders’ Meeting for approval. It also submits to suchShareholders’ Meeting the vote on the independence of thedirectors fulfilling the related criteria, after informing the Works’Council of the same. It first seeks the prior advice of theNominations Committee, whose mission is to define and assessthe profile of any new candidate using the criteria of appointmentand of specific competences it sets.
The Ordinary Shareholders’ Meeting decides on proposals madeby the Board of Directors in this matter by a simple majority.
When a directorship becomes vacant during a term of office,the Board of Directors may appoint a new member, subject toratification by the next following Ordinary Shareholders’ Meeting.
Amendments to the Company’s by-laws require a resolution ofthe Shareholders’ Meeting, provided that at least 50% of theshare capital or Solvay is present or represented at the meetingand, in principle, a majority of 75% of the votes cast.
If the attendance quorum is not met at the first ExtraordinaryShareholders’ Meeting, a second Shareholders’ Meeting can beconvened and will decide without any attendance quorum havingto be reached.
For certain other matters (e.g. amendment of the purpose of theCompany), higher voting majorities may be applicable.
The Board of Directors is the highest management body of theCompany.
It is entrusted with all the powers that are not reserved, by law orby the by-laws, to the Shareholders’ Meeting.
The Board of Directors has kept responsibility for certain keyareas for itself and has delegated the remainder of its powers toan Executive Committee (further detailed in the Charter).
In all matters for which it has exclusive responsibility, the Boardof Directors works in close cooperation with the ExecutiveCommittee, which in particular is responsible for preparing mostof the proposals for decisions by the Board of Directors.
The Board of Directors was authorized, until December 31, 2016,to increase the registered capital by contributions in cash thatamount to a maximum of € 1.5 billion, of which a maximumamount of € 1,270,516,995 will be allocated to the account“capital” and the remainder to the account “issuance premium”in the framework of the acquisition of Cytec industries Inc. Suchacquisition was completed on December 9, 2015 and in orderto finance part of it, the Board of Directors proceeded with ashare capital increase for an amount of € 317,629,245 by issuing21,175,283 new ordinary Solvay shares, with an issuancepremium of € 1,182,216,050. This special authorization istherefore no longer relevant.
The Shareholders’ Meeting has currently not authorized theBoard of Directors to acquire or dispose of Solvay’s own shares.
The Ordinary Shareholders’ Meeting of May 10, 2016 approvedthe change of control provisions relating to the December 2015euro-denominated senior and hybrid bonds and the USD-denominated senior notes issued to finance the acquisition ofCytec and the general corporate purposes of the Solvay group.
N/A
Restrictions on the exercise of voting rights9.5.
Appointment, renewal, resignation anddismissal of directors
9.6.
Amendment of Solvay’s by-laws9.7.
Powers of the Board of Directors, inparticular to issue and buy back shares
9.8.
Powers of the Board of Directors9.8.1.
9.8.2. The Board’s authorizations to issue andbuy back shares
Significant agreements or securities thatmay be impacted by a change of control onthe company
9.9.
Agreements between the Company and itsdirectors or employees providing forcompensation if directors resign, are goodleavers or in the case of a public takeoverbid
9.10.
CORPORATE GOVERNANCE STATEMENT
56SOLVAY 2016 Annual Integrated Report

1. INTRODUCTION 58
2. MAIN RISKS 59
Climate change – emerging risk 59
Security 60
Transport accident 60
Chemical product usage 60
Ethics and compliance 61
Information protection and cyber risk 62
Industrial safety 62
Environmental strategy – emerging risk 63
3. OTHER RISKS 63
Market and growth – Strategic risk 63
Supply chain and manufacturing reliability risk 64
Project selection and management 65
Regulatory, political and legal risk 66
Financial risk 67
Occupational diseases and pandemic risk 69
Environmental risk 69
IT risk 70
IMPORTANT LITIGATION 70
Management Report
Corporate governance statement 33
RISK MANAGEMENTBusiness review 72
Extra-financial statements 96
Financial statements 130
Declarations: Auditor’s reports & Declaration by the persons responsible 225
SOLVAY 2016 Annual Integrated Report57

Risk is the possibility of an event occurring that will have anegative impact on the people, assets, environment, reputation,or strategic objectives of the Group, including forgoing potentialopportunities. Calculated risk-taking within a pre-established riskappetite endorsed by the Board is an inherent aspect of theactivities of Solvay. This risk appetite is translated through anumber of Group policies approved by the Comex, and especiallythrough the 25 “red lines” set out in the Solvay Management Bookas mandatory rules.
The Group’s systematic risk management is integrated withstrategy, business decisions and operations through theEnterprise Risk Management (ERM) approach, facilitated by theInternal Audit and Risk Management (IA/RM) department. Thisapproach ensures that Solvay leaders identify, assess, andmanage all potentially significant business risks andopportunities. Risk management is integrated into strategic andoperational decision-making; it is seen as an essentialmanagement tool and an important aid in making the decisionsneeded to achieve the Company’s short, medium, and long-termobjectives. In a context of global economic and politicaluncertainty, changing power balances, different growthdynamics, shortening market cycles, raw-material and energyprice volatility, and quick technological evolution, Solvay alsobelieves that monitoring and managing risks effectively is key toachieving its sustainability objectives.
The ERM methodology was refined in 2014, and then rolled outacross the whole Group in 2015. The revisions introducedimprovements that allow a better prioritization of relevant risksand a more focused risk response by individual GBUs andfunctions, and at Group level.
GBU Risk Coordinators were appointed in 2016, and their rolehas been clarified. They are part of a network facilitated by IA/RM to share best practices and methodology improvements. Alsoin 2016, GBUs updated their risk maps to take into account thestatus of the risk treatment actions launched previously.
The key steps of the ERM process are:
The mitigating actions and their status are monitored andreported by the IA/RM team in a Group risk dashboard. Thisdashboard is updated, published and formally reviewed by theGroup Risk Committee twice during the year. The committeeassesses both progress on mitigating actions and newdevelopments in the risk environment. Group risks are alsoconsidered annually by the Audit Committee of the Board ofDirectors.
Internal control is one aspect of risk management. Please referto section 8 of the Corporate Governance section of this AnnualReport for a detailed description of the Solvay Group riskmanagement and internal control system.
Crisis Preparedness, another important aspect of the responseto risk, operates a structured network within the Group. Assignedmembers perform tasks and implement programs to ensure thereadiness of their business units and functions. These programsinclude crisis simulations, media training for potentialspokespersons, maintenance of key databases, and analysis ofrelevant internal and external events. The risks identified throughthe ERM approach influence the scenarios used in thesimulations.
The description of the risks relevant to Solvay and the actions theGroup takes to reduce those risks are listed below. The mitigationefforts described do not guarantee that risks will not materializeor impact the Group, but they show how Solvay is proactivelymanaging risk exposures.
INTRODUCTION1.
an initial series of risk management exercises in which eachGBU and each function, assisted by the IA/RM team, reviewsand updates its own risk matrix, and also defines risk ownersresponsible for mitigating the most critical risks.
a second phase in which a risk identification is conducted withthe Leadership Council: building on an IA/RM team analysis ofindividual GBU/function transversal or correlated risks, a listof Group risks is generated and then assessed. This year, thecorrelation analysis has been extended to ensure a better riskresponse;
in a further phase, Group risks (considered as the most criticalrisks for the Group) are closely reviewed by the Group RiskCommittee (composed of the Executive Committee and thegeneral managers of the Industrial, Legal & Compliance,Human Resources, and Sustainable Development functions).For each Group risk, a member of the Comex is appointed tobe the risk sponsor and to ensure that the risk is adequatelyaddressed.
Finally, the Group risks update is presented at an extendedAudit Committee session dedicated to this subject, where theChairman of the Board, the CEO, and other Board membersare present. The CEO presents and explains the key changes.
RISK MANAGEMENT
58SOLVAY 2016 Annual Integrated Report
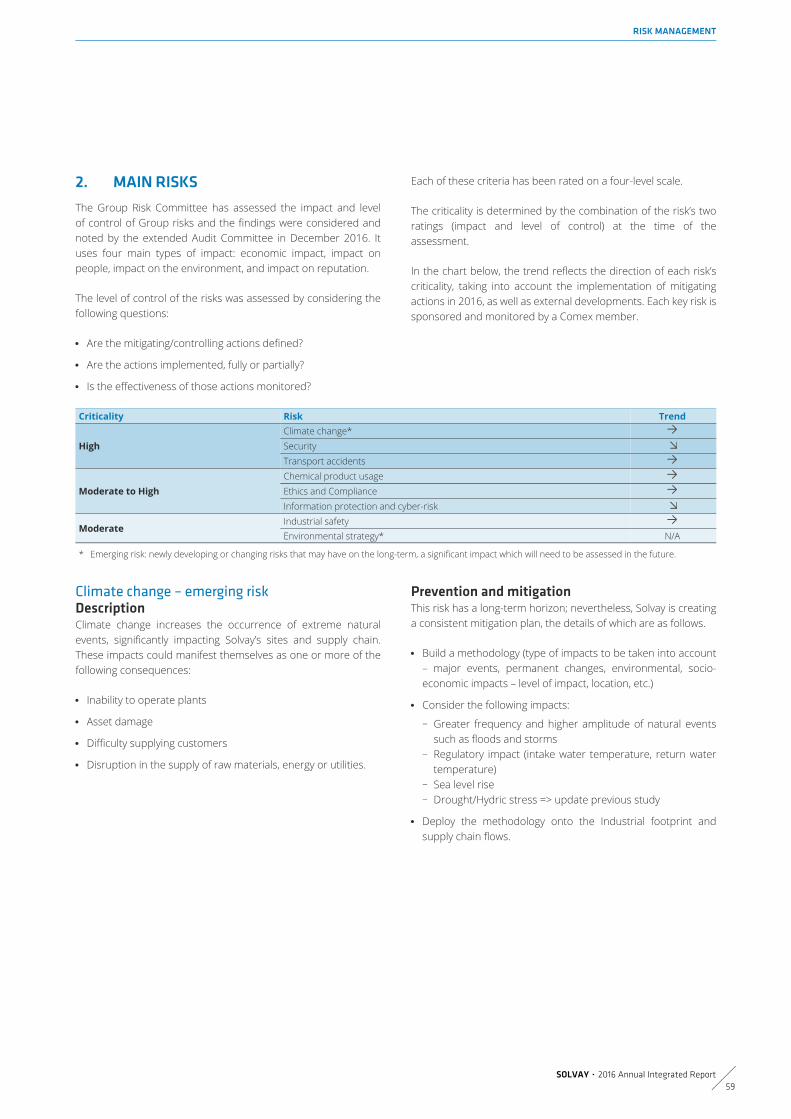
The Group Risk Committee has assessed the impact and levelof control of Group risks and the findings were considered andnoted by the extended Audit Committee in December 2016. Ituses four main types of impact: economic impact, impact onpeople, impact on the environment, and impact on reputation.
The level of control of the risks was assessed by considering thefollowing questions:
Each of these criteria has been rated on a four-level scale.
The criticality is determined by the combination of the risk’s tworatings (impact and level of control) at the time of theassessment.
In the chart below, the trend reflects the direction of each risk’scriticality, taking into account the implementation of mitigatingactions in 2016, as well as external developments. Each key risk issponsored and monitored by a Comex member.
Criticality Risk TrendClimate change*SecurityHighTransport accidentsChemical product usageEthics and ComplianceModerate to HighInformation protection and cyber-riskIndustrial safety
ModerateEnvironmental strategy* N/A
* Emerging risk: newly developing or changing risks that may have on the long-term, a significant impact which will need to be assessed in the future.
Climate change increases the occurrence of extreme naturalevents, significantly impacting Solvay’s sites and supply chain.These impacts could manifest themselves as one or more of thefollowing consequences:
This risk has a long-term horizon; nevertheless, Solvay is creatinga consistent mitigation plan, the details of which are as follows.
MAIN RISKS2.
Are the mitigating/controlling actions defined?
Are the actions implemented, fully or partially?
Is the effectiveness of those actions monitored?
Climate change – emerging riskDescription
Inability to operate plants
Asset damage
Difficulty supplying customers
Disruption in the supply of raw materials, energy or utilities.
Prevention and mitigation
Build a methodology (type of impacts to be taken into account– major events, permanent changes, environmental, socio-economic impacts – level of impact, location, etc.)
Consider the following impacts:
Greater frequency and higher amplitude of natural eventssuch as floods and storms
–
Regulatory impact (intake water temperature, return watertemperature)
–
Sea level rise–Drought/Hydric stress => update previous study–
Deploy the methodology onto the Industrial footprint andsupply chain flows.
RISK MANAGEMENT
SOLVAY 2016 Annual Integrated Report59

This heading includes intentional attacks on Solvay sites,information and people, with the intent to cause harm, damageor negative consequences.
The risk of causing injury to neighbors or the public may be aconsequence of an accident during transport activities.
The risk of an accident in connection with hazardous chemicalstransportation is reduced by optimizing transport routes, relyingon selected and audited hauliers, and calling upon worldwideemergency assistance from the Carechem service in the eventof an accident. In addition, every effort is made to minimize thenumber of transportation activities by operating with integratedproduction units for hazardous intermediates. Solvay follows thesafety recommendations of associations such as Eurochlor andCTEF (Comité Technique Européen du Fluor), and programs suchas Responsible Care®.
SecurityDescription
Prevention and mitigationSolvay has a threat-based security risk-based approach toprotecting sites, information and people.
A Group Security Director, appointed in 2016, coordinates allsecurity activities globally in order to ensure efficient mitigationof security risks.
The Executive Committee has endorsed the creation of twogovernance bodies:
a Security Board, chaired by the CFO and another Comexmember
–
a Security Coordination Working Group, chaired by theGroup Security Director, with the objective of driving acontinuous security threat monitoring program and anoptimized security program for the Group
–
In response to the heightened terror threat in Europe,immediate measures were taken to increase protection at anumber of sites.
Solvay Business Services (SBS) has launched a number ofinitiatives to mitigate cyber security risks.
A travel security program has been approved andimplemented to increase protection for business travelers.
Transport accidentDescription
Prevention and mitigation
Chemical product usageDescription
Product-liability risk: Solvay’s exposure stems from thepossibility of injury to third parties or damage to their propertyarising from the use of a Solvay product, as well as from theresulting litigation.
The possible consequences of a faulty product includeexposure to liability for injury and damage, and product recalls.Product liability risk is generally higher for products used inhealthcare and food & feed applications.
Solvay is also exposed to adverse outcomes while developingnew products and technologies or scaling up a process.
Prevention and mitigationSolvay Product Stewardship Management System (PSMS)manages product risks ensuring safety across the full-productlife cycles.
In-house product stewardship experts identify and assess thehazards and risks of Solvay products.
The Group characterizes and manages risks related to the usesand applications of its products, and – in collaboration withthe GBUs – prioritizes mitigation actions relating to potentialinappropriate use.
Stewardship programs give adequate information andtechnical assistance to customers, ensuring a goodunderstanding of safe use and handling.
Solvay Safety Data Sheets (SDS) ensure harmonized content byimplementing a common worldwide SAP system for the Group.Control by SDS shipping allows confirmation that any productmarketed by Solvay is accompanied by a compliant SDS. Solvaymonitors the discrepancies registered during checks andmanages failures due to shipping.
The Group also develops and deploys recall procedures asprescribed by the product stewardship programs, a productstewardship management system, and a product safetymanagement process that includes healthcare.
Solvay takes out insurance to reduce the financial impact of aproduct liability risk, including for first and third-party productrecall.
RISK MANAGEMENT
60SOLVAY 2016 Annual Integrated Report

Risk arises from a potential failure to comply with:
Examples:
The Code of Conduct, policies and procedures adopted toenhance good governance apply to all employees wherever theyare located. In addition:
Compliance organization:
Training:
Reporting violations:
Ethics and complianceDescription
The Solvay Code of Conduct
Supporting policies and procedures
Laws and regulations in the jurisdictions in which Solvayoperates.
Failure to implement good governance in a joint venture
Direct or indirect involvement in human rights violations
Intentional misstatement of financial reporting, corruption andby-passing of internal controls.
Prevention and mitigation
Third parties are expected to act within the framework of theCode of Conduct.
All critical suppliers must confirm that they adhere to theprinciples set out in the Solvay Supplier code.
Majority-owned joint ventures are held to the Solvay Codeof Conduct or to a separate code adopted based on similarprinciples.
This organization operates under the leadership of the GroupGeneral Counsel to enhance a Group-wide culture based onethics and compliance. It also monitors compliance withapplicable laws, the Code of Conduct, and supporting policiesand procedures.
Regional Compliance Officers serve in all four zones where theGroup operates to ensure communication of the Code and theprinciples on which it is based.
Every global business unit and function within Solvay appointsCompliance Liaisons to enhance adherence to complianceobjectives and to instill a commitment to compliancethroughout Solvay.
Courses are developed internally and presented by the Legal& Compliance function to ensure understanding and adoptionand to address behavioral risks in certain areas such as anti-trust, anti-bribery and corruption, human rights, and otheraspects of Corporate Social Responsibility. Multi-lingual onlinetraining is also being developed.
Special campaigns to maintain and/or enhance the level ofawareness within the Group are identified and adoptedannually.
New employee training is organized as part of the orientationprocess.
Is encouraged as a condition of employment through variousinternal avenues, including management, Human Resources,Legal & Compliance, and Internal Audit.
An external third-party helpline active 24 hours a day, 365 daysa year allows employees to ask questions, raise concerns or filereports. The Solvay Ethics Helpline is available on the web orby phone, operationally via the internet in 46 specific regionsin more than 40 languages, and via the phone in more than 20languages.
This Group-wide Speak Up program is overseen by the AuditCommittee of the Board of Directors.
RISK MANAGEMENT
SOLVAY 2016 Annual Integrated Report61

Information and cyber risk includes theft, manipulation ordestruction of information, and the inability to ensure continuityof services or to protect confidential, critical or sensitiveinformation.
Solvay’s cyber security and confidential information lossprevention program was further enhanced in 2016:
In 2017, Solvay will continue to enhance its overarching cybersecurity strategy and governance, develop the corporateinformation security program, and explore other functions/capabilities to enrich the company’s security posture and abilityto respond to a cyber-related threat.
While the Company has a comprehensive, regularly updatedcyber security program, a significant cyber attack couldnevertheless result in the loss of critical business informationand/or could negatively impact the company’s operations andresults.
Solvay is insured against the potential financial impact of a cyberevent with respect to assets, business interruptions, and cases offraud.
Occupational safety is the highest priority in managing theactivities of Solvay. The Group has a long track record of goodsafety performance, and has made significant progress bysharing good practices.
Information protection and cyber riskDescription
Prevention and mitigationCyber security program
Outside experts conducted independent assessments,including penetration tests.
Solvay Business Services (SBS) renewed its qualitymanagement program (ISO9001:2015) for all its activities andthe ISO27001:2013 certification that encompassescybersecurity for the majority of our information systemsactivities is ongoing (all SBS will be certified ISO27001 by end of2017).
Training on information systems security policies and bestpractices was completed for all SBS information systemsprofessionals.
End-user security training remains mandatory for allemployees. Cybersecurity tips are published regularly toincrease employee awareness.
New fraud management tools have been implemented toidentify and preempt fraud attempts.
Insurance
Industrial safetyDescription
Accidents on industrial sites may cause injury to employees,contractors, or members of the public adjacent to those sites,especially in the context of major releases of chemicalsubstances.
Accidents involving employees or third-party individuals onSolvay’s sites are generally linked to a failure of safetymanagement relating to risks at the workplace.
Accidents involving contractors include falls during work atheight, in construction and maintenance activities, use of tools,and interaction with equipment during maintenance, as wellas accidents due to non-compliance with work permitprocedures.
Risks of causing injury to neighbors or the public are mostlya consequence of major process accidents at manufacturingsites or during transport activities.
Prevention and mitigation
Safety results are considered monthly both at ExecutiveCommittee and GBUs level.
The Health, Safety and Environment (HSE) departmentimplements a management system entitled “Solvay CareManagement System (SCMS)”, integrating all Solvayrequirements for HSE and fulfilling the international standardsISO14001 and OHSAS 18001. A new version of thebenchmarks will be released in 2017.
The HSE department supports sites and GBUs by collecting,validating, and distributing return on experience, lessonslearned bulletins on typical accident scenarios andconsequences. It is also part of external research, andacademic and inter-company developments to identify newsafety approaches: ICSI (Institut pour une Culture de SécuritéIndustrielle), EPSC (European Process Safety Centre) and CEFIC(European Chemical Industry Council) initiatives.
Some actions in 2016: the first Solvay Safety Excellence Plan2015-2016 to boost safety performance (being reviewed forthe 2017-2018 period). The plan focuses on: defining clearexpectations at management level, defining customized actionplans through site and GBU roadmaps, and generating a safetyexcellence mindset. The most familiar initiative of this plan isthe eight "Solvay Life Saving Rules", which address the eightmost dangerous work-related activities (such as working atheight).
RISK MANAGEMENT
62SOLVAY 2016 Annual Integrated Report

This risk was added to the main risks in 2016 because it wasbecoming potentially significant for the Group.
The potential impact of adverse events is continuously assessedand managed at both the GBU and corporate levels. This year,there was a particular focus on:
Environmental strategy – emerging risk
DescriptionSolvay’s activities impact the environment through:
Use of raw materials based on fossil or non-renewableresources
–
Consumption of energy–Use of water–Production of waste (solid or liquid, hazardous or safe)–Greenhouse gases emission–NOx, SOx, Volatile Organic Compounds (VOC) or dustemission.
–
Failure to adapt to changing market dynamics or totechnological developments triggered by those environmentalconcerns may damage the Group’s reputation. It may causethe Company to be undervalued by or unappealing to long-term investors, and cause it to lose competitiveness.
Prevention and mitigationThe Group’s strategy focuses on businesses with higher addedvalue and less environmental exposure.
Every year, the Sustainable Portfolio Management (SPM) toolassesses the environmental exposure of our sales and ourinnovation projects portfolio.
The Carbon Intensity action plan has a 40% reduction targetfor 2025 (reference year 2014).
Solvay has a new environmental plan and targets for 2020 onair emissions (SOx, NOx, VOC), water usage, and hazardouswaste.
Research & Innovation focuses on selected megatrends,including sustainability opportunities and concerns.
OTHER RISKS3.
Market and growth – Strategic riskDescription
Strategic risk refers to Solvay’s exposure to developments in itsmarkets or its competitive environment, and the risk of makingerroneous strategic decisions.
Examples of risks:
Economic downturn, drastic changes in energy and rawmaterial prices and availability
–
Reduction of demand in the Group’s main markets as aconsequence of either new legislation or competitiveactions, or events affecting its most important customers
–
New entrants in a market, a price war, or significantimbalances between supply and demand in its markets
–
Technological leaps leading to the development ofsubstitute products or more competitive manufacturingprocesses
–
Lack of success of a new product.–
Prevention and mitigation
Systematic and formal analysis of markets and marketingchallenges on investments and innovation project ramp-ups.
Development of GDP+ growth markets: Automotive &Aerospace, Resources & Environment, Electrical & Electronicsand Agro, Feed & Food.
Development of customized, mission-critical solutions with ourkey accounts.
Adaptation of operations to new energy and CO2 markets.
Stronger focus on cash conversion and generation.
RISK MANAGEMENT
SOLVAY 2016 Annual Integrated Report63

The integration of Cytec has already delivered on its promisein 2016, significantly exceeding targets for synergies and cashgeneration. The addition has already enabled the Group toexpand its presence in the fast-growing advanced aerospacematerials market. In 2016 the development of new aircraftplatforms with high composite content was offset by lowerproduction rates of older generation aircraft. However, Solvayremains well-positioned for growth as production of new aircraftprograms (growth expected on A320neo, B737 MAX, and JointStrike Fighter) with higher composite content.
The portfolio transformation continued in 2016, with the Groupscaling back cyclical and low-growth businesses by selling stakesin Inovyn, Vinythai and Indupa, and by divesting the celluloseacetate business.
Supply chain and manufacturing risk in production units andtransportation refers to risks related to raw materials, energy,suppliers, production, storage units, and inbound/outboundtransportation. Risks include major equipment failure or damage,natural disasters, strikes, and drastic shortages of raw materials,utilities or critical equipment.
The geographic distribution of production units around the worldreduces the overall impact of one production unit beingdamaged or interrupted. Some specialty products are, however,produced only in a single plant.
Key risk areas are addressed with relevant dedicated policiesand risk control programs, such as the property loss preventionprogram, process safety management procedures, the supplierqualification and assessment process, integrated resourceplanning and supply chain optimization systems, ERP (EmergencyResponse Plans), corporate and local crisis management
procedures, business continuity planning (including for pandemicrisk), and networking groups for manufacturing and supply chainmanagers.
Solvay takes out insurance to reduce the financial impact ofevents that could cause extensive damage and materialbusiness interruption. It deploys a property loss preventionprogram with the support of a large network of risk engineersassigned by the insurers. The program focuses on the preventionand mitigation of damage to assets and loss of profit due to fire,explosion, accidental chemical release, and other adverse events.The program has been reinforced across the Group and includes:engineering visits to all locations, monitoring and providingupdates on the status of agreed risk improvement actions forall locations, meetings with the GBUs on reducing property andbusiness interruption risks, road maps designed to reduceproperty and business interruption risks, business impactanalysis and, loss prevention training for plant employees.
To identify supply chain risk, Solvay takes into accountenvironmental, social, security of supply, and innovation criteriaand identifies a mitigation action for each specific risk. Thesestrategic management reviews take place on a regular basis.
Supply chain and manufacturing reliability riskDescription
Prevention and mitigation
Some suppliers are identified as critical based on theirstrategic importance or because they might represent abusiness, country, or product risk. Those suppliers have toengage in a CSR assessment and a continuous improvementprocess. All critical suppliers must also formally confirm thatthey adhere to principles that are consistent with those set outin the Solvay Supplier Code;
Solvay owns several mines and quarries for the extraction oftrona, limestone, and salt. This reduces the risk of a disruptionin its raw material supplies (availability, reliability, and price),as key suppliers are included in the property loss preventionprogram whenever possible.
RISK MANAGEMENT
64SOLVAY 2016 Annual Integrated Report

In the field of energy supply, Solvay has consistentlyimplemented programs to reduce its energy consumption formany years. While Solvay has industrial activities with high energyconsumption, mainly in Europe (synthetic soda ash plants,polyamides), it also operates a range of industrial activities whoseenergy content is relatively low as a percentage of sales price,particularly in the fluorinated polymers business. The Groupconsiders secure and reliable energy supplies to be particularlyimportant and has taken the following strategic initiatives:
Solvay Energy Services optimizes energy purchasing andconsumption for the Group and helps GBUs manage energy andCO2 emissions.
The allocation of resources to projects (capital expendidure(capex), mergers and acquisitions) could be misaligned withSolvay’s growth strategy, leading to an inefficient use of Groupfinancial resources and resulting in poor cash conversion. Also, amajor project could experience difficulties and so fail to reach itsobjectives.
To increase the likelihood that project objectives are met, theGroup has set up processes to manage both capital investmentsand acquisitions, including risk identification, assessment, andmitigation steps.
The methodology used to tackle major capital projects has beenextended to the GBUs: they can apply it for their medium-sizedprojects.
The Group has progressively deployed a Capex Excellencemethodology for project portfolio optimization on smallerprojects.
The combination of these actions has led to much better controlover EBITDA conversion into cash and a conversion levelcomparable to similar companies in the Industry.
technological leadership in processes and high-performanceindustrial operations to minimize energy consumption;
diversification and flexible use of the different types andsources of primary energy;
upstream integration in steam and electricity generation (gascogeneration, biomass or secondary fuels cogeneration, etc.);
periodic review of the condition of industrial sites’ energyassets and connections;
a strategy of supply coverage with long-term partnerships andmedium- to long-term contracts, with price-hedging protectionmechanisms when needed;
direct access to energy markets when possible (gas hubs,electrical grids, financial spot and futures exchanges);
regular forecast reports on energy and raw material pricetrends sent to business to anticipate sales prices realignments.
Project selection and managementDescription
Prevention and mitigation
The model of governance for major/medium-sized capexprojects is designed to ensure that only the most effectivecapital projects are authorized and executed in the bestpossible way.
The Investment Committee provides the Comex an analyticalview of the capex allocation efficiency for the Group and thecapex plan, consistent with the Roadmaps and BusinessStrategy Reviews of the GBUs.
A performance analysis after implementation is conducted toassess the Capex efficiency. The lessons learned are used tocontinuously improve how the Group approaches thechallenges inherent in the marketing, financial and industrialaspects of investment projects.
RISK MANAGEMENT
SOLVAY 2016 Annual Integrated Report65

Political risk refers to Solvay’s exposure to circumstances wherethe normal exercise of public authority is disrupted. This couldbe the consequence of a social crisis, political instability, civilwar, nationalization, or terrorism in countries where the Groupoperates or sells products, resulting in delays or failure to deliverproducts, or an unavailability of raw materials or utilities, orlogistical or transport facilities.
All risks that could trigger an eventual exposure (irrespective ofprobability of outcomes) are monitored centrally and are sharedwith Comex and with the Audit committee every quarter,whereby developments in the intervening period are consideredand suitability of financial provisions considered.
Regulatory, political and legal riskDescriptionRegulatory risk
Regulatory risk refers to Solvay’s exposure to changes inlegislation and regulations. Solvay could be exposed tosignificant cost increases or business interruptions as aconsequence of new legislation or regulations, or a more strictinterpretation or application of current regulations by courts orauthorities.
Solvay must obtain and maintain regulatory approval tooperate its production facilities and sell its products.Withdrawal of any previously granted approval or failure toobtain an authorization may have an adverse effect on itsbusiness continuity and operating results.
For Europe in particular, all chemical substancesmanufactured, imported, or used by Solvay require registrationunder the REACH Regulation and must meet the deadlinesimposed by this regulation. This is in addition to other, alreadyexisting requirements. 451 dossiers were successfullyregistered with the European Chemical Agency between 2010and May 31, 2013. Around 332 substances have to beregistered before the next REACH registration deadline ofMay 31, 2018. With respect to these, the registration scheduleis on track as of the end of 2016. 123 dossiers had alreadybeen registered as of December 1, 2016.
Political risk
Legal riskLegal risk refers to the exposure to actual and potential judicialand administrative proceedings.
The simple fact of doing business exposes Solvay to disputesand litigation, and adverse outcomes are always possible (seethe Important Litigation section below).
The Group may become a party to judicial or administrativeproceedings in the conduct of its normal course of business,particularly in the areas of product liability, contractualobligations, antitrust laws, patent infringement, taxassessments, and environmental matters (see the ImportantLitigation section below).
The Group’s operations depend on the control of its keytechnologies and on the capacity to innovate. Legal challengesto the right of Solvay to use certain technologies could have animpact on its operations.
Prevention and mitigationThe Group’s geographic spread around the world helps reducethe impact of adverse regulatory and political developments.
Properly designing and testing products and their productionprocesses helps contain regulatory and legal risks, as doesmaking sure that applications for necessary approvals aretimely and thorough.
Regulatory and political risk both within and outside theEuropean Union is reduced through the continuous work ofSolvay’s Government and Public Affairs department, whichworks with public authorities and through the local BelgianEmbassy.
To manage its legal risk, Solvay maintains in-house legal andintellectual property professionals, as well as regulatoryresources and tools. It also retains external professionalresources when appropriate.
Financial provisions are made based on Solvay’s awareness oflegal risks. Awareness is raised by dedicated training, sharing ofinformation, self-assessment procedures, and internal audits.
Trade secrets and patents protect Solvay’s technological know-how on new products and processes, and continuous effortsare made to protect its proprietary information and its positionas a leader in technological know-how for its productionprocesses.
With respect to political risks, Solvay’s actions include risk-sharing with local or institutional partners, as well asmonitoring of political developments in sensitive areas.
RISK MANAGEMENT
66SOLVAY 2016 Annual Integrated Report

Below is a list of Solvay’s financial risks and how they apply to theCompany:
Financial risks are analyzed, assessed, and managed by theCorporate Finance function broadly, and more specifically, by theTreasury, Group Accounting & Reporting, and Tax departments.Loss prevention and mitigation efforts guide the Group’s financialpolicies and their strict monitoring:
Financial riskDescription
Liquidity risk (see note F32 Financial instruments and financialrisk management to the consolidated financial statements)
To repay and refinance financial debt on time–To fund its business operations and generate cash fromoperations
–
To extract cash from divestments and not over-payacquisitions
–
To preserve the Group “Investment grade” rating.–
Foreign exchange risk (see note F32 Financial instruments andfinancial risk management to the consolidated financialstatements)
The Group’s largest forex exposure is to the euro and USdollar
–
The Group’s overall activities generate an important netpositive US dollar flow; thus, a depreciation of the US dollarwill generally result in lower revenues and lower profit.
–
Furthermore, and to a significantly lesser extent, the Groupis also exposed to the euro/Japanese yen, euro/Chineseyuan and Brazilian real/US dollar rates
–
Interest-rate risk (see note F32 Financial instruments andfinancial risk management to the consolidated financialstatements)
Exposure to fluctuating interest rates–
Counterparty risk (see note F32 Financial instruments andfinancial risk management to the consolidated financialstatements)
Exposure to financial intermediates through its treasuryactivities and through the Group’s commercial relationships
–
Pension obligation risk (see note F32 Financial instrumentsand financial risk management to the consolidated financialstatements):
Exposure to a number of defined benefit plans subject tofluctuations in discount rates, expected inflation rates andsocial security coverage and expected longevity, as well asasset/liability matching, all of which may result in a majorimpact on the Group’s net pension liability
–
Exposure of under-funded plans to interest rate andinflation risks
–
Tax litigation risk (see note F32 Financial instruments andfinancial risk management to the consolidated financialstatements)
Exposure to increasing tax audit queries and theintroduction of changing tax regulations.
–
Prevention and mitigation
A prudent financial profile, conservative financialdiscipline and strong liquidity reservesA prudent financial profile and conservative financialdiscipline:
After the acquisition of Cytec in December 2015, the twoleading rating agencies confirmed the Group’s InvestmentGrade status, with a Baa2/P2 rating (negative outlook) byMoody’s and a BBB-/A3 rating (stable outlook) by Standard &Poor’s.
Strong liquidity reserves:
As of the end of 2016, the Group has € 1.1 billion in cashand equivalents (namely, other current financial instruments),as well as € 2.4 billion in liquidity reserves composed ofcommitted credit facilities (two syndicated credit facilities of€ 1.5 billion and € 550 million, respectively), and an additional€ 350 million from bilateral facilities with key internationalbanking partners.
The Group has access to a Belgian Treasury Bill program for€ 1 billion, and alternatively, to a US commercial paperprogram for US$500 million.
Investment grade rating:
The Group aims at preserving its investment grade rating andin that context maintains a prudent financial profile. Moreover,the Group’s portfolio management and investment decisions,as well as cash flow generation objectives, take explicit accountof their impact on the Group’s credit metrics. Solvay has alsodeveloped a comprehensive financial methodology, and isadvised by independent experts, making it possible tounderstand and anticipate impacts on credit worthinessderived from prospective financial and businessdevelopments.
Solvay promotes transparent and regular discussions withleading rating agencies.
RISK MANAGEMENT
SOLVAY 2016 Annual Integrated Report67

Geographic diversification of the manufacturing footprintand sales naturally mitigates foreign exchange risk, as incomestreams are matched with expenses in the same currency.
Solvay monitors the foreign exchange market closely and takeshedging measures, principally for terms shorter than one yearand generally not exceeding 18 months, whenever deemedappropriate.
The Group locks the majority of its net indebtedness with fixedinterest rates. Solvay monitors the interest rate market closelyand enters into interest rate swaps whenever they are deemedappropriate.
For its treasury activities, Solvay works with bankinginstitutions of the highest creditworthiness (selection based onmajor rating systems) and minimizes the concentration of riskby limiting its exposure to each of these banks to a certainthreshold, set in relation to the institution’s credit rating. Inaddition, Solvay may invest money with highly-rated moneymarket funds, as well as in short-term debt securities from highly-rated sovereign issuers when appropriate.
For its commercial activities, Solvay’s external customer riskand cash collection are monitored by a strong network of creditmanagers and cash collectors located in the Group’s variousoperating regions and countries. Their controls are supported bya set of detailed procedures and managed through Corporateand GBU Credit Committees. These loss mitigation measureshave led, over the past few years, to a record low rate of customerdefaults.
Pension governance: Solvay has set guidelines to maximizeits influence over local pension fund decisions within the limitsprovided by domestic laws, including investment and funding,
selection of advisors, appointment of employer-nominatedtrustees to local pension fund boards, and other costmanagement actions.
Pension plan optimization: This consists primarily of reducingthe Group’s exposure to defined benefit plans by eitherconverting existing plans into pension plans with a lower riskprofile for future services or closing them to new entrants.Examples of such lower risk plans include hybrid plans thatcombine cash balance plans and defined contribution plans.
A global ALM (Asset Liability Management) analysis of the Group’spension plans, representing about 90% of the Group’s gross ornet pension obligations, is performed on a triennial basis, inorder to identify and manage corresponding risks on a globalbasis. Solvay conducted an ALM study in 2016.
Control processes for tax regulation compliance includemonitoring procedures and systems, thorough internal reviews,and audits performed by reputable external consultants. Effortsto prevent tax litigation risk include thorough analyses of theinternal financing of affiliates, mergers, acquisitions, anddivestments, or proposed changes in the business organizationand operations. The Group seeks the assistance of externalexperts or law firms when the amounts at stake warrant it.
Transfer pricing policies, procedures and controls areaimed at meeting the requirements of the authorities. Transferpricing documentation is prepared annually for each relevantGroup legal entity that requires such documentation, in line withlocal national laws and practices. This is done with the assistanceof internal or external experts to demonstrate the arm’s lengthnature of cross-company pricing. The Internal Audit departmentregularly verifies the existence and timeliness of thedocumentation. Internal transfer pricing specialists assist thebusiness in setting intra-Group prices that comply with thetransfer pricing policy.
Moreover, Solvay’s Tax department pays close attention to thecorrect interpretation and application of new tax rules to avoidfuture litigation. In this regard, among other things it implementsthe G20/OECD base erosion and profit shifting (BEPS)recommendations at the country level in order to ensure that taxpositions remain consistent with changing requirements.
Geographic diversification and foreign exchange hedgingpolicy
Currency hedging policy
To hedge forex exchange exposure, Solvay uses forward andoption contracts designed to secure the value of future cashflows in foreign currency.
The Group manages its foreign exchange risk for receivables,payables and borrowings centrally for all affiliates of the Groupwhere it is possible to enter into such transactions, andthrough local financial affiliates for other regions.
Interest rate hedging policy
Monitoring of Group counterparties’ ratings
Pension governance and pension plan optimization
Control processes for tax regulation compliance andtransfer pricing policies
RISK MANAGEMENT
68SOLVAY 2016 Annual Integrated Report

Occupational diseases are work-related diseases recognized asresulting from exposure to occupational hazards, generallyrepeated exposure. In most cases, health effects appear after along period of latency, e.g. asbestos-related diseases or cancers.
Pandemic risk can affect employees, their families, and society atlarge.
Occupational diseases and pandemic riskDescription
Prevention and mitigationConservative approaches to risk identification, assessment andmanagement help avoid a real risk of exposure, including whennew hazards are revealed.
Solvay monitors occupational disease standards worldwideand a strong industrial hygiene program focused oncomprehensive assessments of compliance with occupationalhygiene standards.
Conservative exposure limits are defined and shared bySolvay’s worldwide toxicology team, supported by the internal“Solvay Acceptable Exposure Limit” Committee, whichestablishes Solvay Acceptable Exposure Limits (SAELs) forsubstances with no official occupational exposure limit (OEL)or an OEL considered insufficiently protective. High priority isgiven to nano-materials and technology, endocrine disruptors,SVHCs (Substances of Very High Concern) and health-relatedapplications of Solvay products.
All Solvay industrial sites and major administrative sites arerequired to ensure periodic medical monitoring of workersbased on individual risk profiles and on Grouprecommendations, thereby helping to prevent the onset ofoccupational diseases and any other adverse health effectsdue to work.
Internal industrial hygiene and occupational health IT tools areintegrated at site level. With these tools, local teams benefitfrom easy and efficient management of – and access to –comprehensive hygiene assessments and medical surveillancedata on their personnel. These tools help to identify andanticipate the occurrence of potential new occupationaldisease cases, improve the traceability of individual andcollective exposure and medical data, and facilitate the dailywork of Solvay physicians and hygienists.
A global pandemic preparedness plan covering all plants andbusinesses, supported by a network of coordinators, has beendeveloped. This plan can be reactivated to initiate a regional orlocal response.
Environmental riskDescription
Managing or remediating historical soil contamination at anumber of sites and complying with future changes inenvironmental legislation are top priorities.
There is a global trend of legislation introducing an increasinglybroader scope of environmental legal liabilities. However, inEurope, the legislation is reinterpreted in a pragmatic wayusing site-specific risk-based analyses to define interventionvalue and remedial objectives.
Prevention and mitigationISO 14001 or integrated HSE management systems equivalentto ISO 14001 (Solvay Care Management System) for theenvironment are implemented in all manufacturing sites.
Policies and risk control programs are applied in all productionunits and other facilities, and are implemented progressively innewly acquired plants. The Group takes the necessary steps tomeet and even exceed regulatory standards concerning majorrisks, which includes detailed accident prevention measures.
Sites facing historical soil contamination are carefullymonitored and managed. A dedicated worldwide team isregularly trained and undertakes regular updates ofappropriate provisions for monitoring and remediationaccording to a defined audit process.
As a matter of policy, all concerned sites employ a riskcharacterization approach. It contains a diagnosis of potentialproblems based on hydrogeological studies and soilcharacterizations, an evaluation of the risks to aquifers, andthe implementation of relevant remediation or confinementactions with authorities.
Local regulatory monitoring is performed at all Solvay sites.Corrective actions are implemented whenever necessary, inclose cooperation with environmental authorities.
Solvay takes out insurance to reduce the financial impact of anenvironmental risk materializing. Solvay monitors the effects ofclimate change, as related risks and opportunities may affectthe Group’s business objectives. The risk is hedged to anextent through the geographic spread of both productionunits and markets for its products.
RISK MANAGEMENT
SOLVAY 2016 Annual Integrated Report69

For Solvay, information and information service-related risks referto the inability to ensure continuity of services or provideinformation services adapted to the business needs.
With its variety of activities and its geographic reach, the SolvayGroup is exposed to legal risks, particularly in the areas ofproduct liability, contractual relations, antitrust laws, patentdisputes, tax assessments, and HSE matters. In this context,litigation cannot be avoided and is sometimes necessary so as todefend the rights and interests of the Group.
The outcome of proceedings cannot be predicted with certainty.It is therefore possible that adverse final court decisions orarbitration awards could lead to liabilities (and expenses) that arenot covered or not fully covered by provisions or insurance, andthat could have a material impact on the revenues and earningsof the Group.
Ongoing legal proceedings involving the Solvay Group that arecurrently considered to involve significant risks are outlinedbelow. The legal proceedings described below do not constitutean exhaustive list.
The fact that litigation proceedings are reported below isunrelated to the merits of the cases. In all the cases cited below,Solvay is defending itself vigorously and believes in the merits ofits defenses.
For certain cases, Solvay has created reserves/provisions inaccordance with the accounting rules to cover financial risk anddefense costs (see note 35D, “Provisions for litigation to theconsolidated financial statements” of the present document).
IT riskDescription
Prevention and mitigationThe Group uses a dedicated data network and regionalinternet gateways that are managed by a trusted serviceprovider. The critical data and applications are hosted in adata center operating in accordance with professional goodpractices, ensuring recovery capabilities in the event of anincident.
In 2016, disaster recovery and crisis management tests werecarried out for the data center as well as the main servicecenters and regional offices of Solvay’s Business Services (SBS),involving various crisis scenarios.
IT general controls are applied to critical information systemsand are audited for compliance both internally and externally.Solvay has developed an annual IT audit program to ensurecompliance with information systems security policies.
IMPORTANT LITIGATION
RISK MANAGEMENT
70SOLVAY 2016 Annual Integrated Report
In 2006, the European Commission imposed fines against Solvay(including Ausimont SpA, acquired by Solvay in 2002) for allegedbreaches of competition rules in the peroxygens market,amounting after appeal to € 139.5 million for Solvay SA and€ 12.8 million for Solvay Specialty Polymers Italy SpA. Joint civillawsuits were filed before the Court of Dortmund (Germany) in2009 against Solvay and other manufacturers based on thealleged antitrust violation, claiming damages from themanufacturers on a joint and several basis. The value of theclaims is approximately € 240 million (excluding interest) againstall six defendants. Several questions on the jurisdiction of theCourt of Dortmund have been submitted to the European Courtof Justice, and proceedings before the Court of Dortmund arepending.
In Brazil, Solvay is facing administrative claims related to allegedcartel activities in various markets. CADE (the Brazilian antitrustauthority) issued fines against Solvay and others in May 2012relating to H202 activity and in February 2016 related toperborate activity (Solvay’s shares of these fines amount to€ 29.6 million and € 3.99 million respectively). Solvay has filed aclaim contesting these administrative fines before the BrazilianFederal Court.
In October 2009, the public prosecutor of the Criminal Courtof Alessandria (Italy) charged several individuals (includingemployees and former employees of Solvay and Ausimont SpA,now Solvay Specialty Polymers Italy) in relation to alleged criminalviolations of environmental laws (a failure to remediate) andpublic health legislation (intentional poisoning of potable waters).Solvay Specialty Polymers Italy - SSPI (formerly Solvay Solexis andAusimont), a subsidiary of Solvay and legal successor to AusimontSpA, named in the trial as the civilly liable party together withEdison SpA, may be exposed to claims for civil liability in theevent of a negative outcome of the proceedings. The civil partiesadmitted to the trial have provisionally quantified their civildamages claims at about € 105 million. In December 2015 theAssize Court of Alessandria sentenced three SSPI managers tojail for 2.5 years and awarded civil damages of about € 400k. Thisjudgment, which is not enforceable as it is not final, was appealedby all the parties and is currently pending before the CriminalAssize Court of Appeal of Turin.
In May 2008, the public prosecutors of the Criminal Court ofPescara (Italy) charged several individuals in relation to allegedcriminal violation of environmental laws (environmental disaster)and to alleged crimes against public health (intentional poisoningof potable waters) that had taken place before 2002 (i.e. beforeAusimont SpA’s acquisition by Solvay). These individuals includedformer employees of Ausimont SpA, acquired by Solvay in 2002;no Solvay employee was charged, and Solvay SA and SolvaySpecialty Polymers Italy were admitted to the trial as civil parties.The Assize Court of Chieti dismissed the intentional poisoningcharge and found the former Ausimont employees guilty ofculpable environmental pollution, but declared that this matterwas time-barred. The public prosecutors and the civil partieslodged an appeal against this decision and the case is currentlypending before the Criminal Assize Court of Appeal of L’Aquila.
As of the end of 2016, 17 civil proceedings had been broughtbefore the Civil Court of Livorno by past workers and relativesof deceased workers at the Rosignano Site seeking damages(provisionally quantified at € 9 million) in relation to diseasesallegedly caused by exposure to asbestos. The defendants inthese civil proceedings are Solvay SA and Solvay Chimica ItaliaSpA, respectively the owner and manager of the Rosignano site.
In the context of the sale of the pharmaceutical activities inFebruary 2010, the contractual arrangements have definedterms and conditions for the allocation and sharing of liabilityarising out of the activities before the sale.
Subject to limited exceptions, Solvay’s exposure forindemnifications to Abbott for liabilities arising out of soldactivities is limited to an aggregate amount representing€ 500 million and is limited in duration.
This includes indemnification against certain potential liabilitiesfor the US hormone replacement therapy (HRT) litigation, re-activated Qui Tam litigation focusing on promotional andmarketing practices that allegedly influenced sales of the drugsACEON®, LUVOX®, and ANDROGEL®, and more recently filedtestosterone replacement therapy (TRT) litigation also focusingon the drug ANDROGEL®. These claims are proceeding at varyingrates of resolution.
Antitrust proceedings
HSE-related proceedingsPharmaceutical activities (discontinued)
RISK MANAGEMENT
SOLVAY 2016 Annual Integrated Report71

1. OVERVIEW OF THE CONSOLIDATED RESULTS 73
Key financial figures 73
Historical key financial figures 74
2. PREPARATION BACKGROUND 75
Comparability of results 75
Underlying versus IFRS income statement 75
Alternative performance metrics (APM) 75
Description of the operational segments 76
3. NOTES TO THE GROUP UNDERLYING FIGURES 78
NOTE B1 Net sales 78
NOTE B2 Underlying raw material & energy costs 78
NOTE B3 Underlying EBITDA 79
NOTE B4 Underlying depreciation & amortization 79
NOTE B5 Underlying net financial charges 80
NOTE B6 Underlying income taxes 80
NOTE B7 Underlying profit from discontinued operations 80
NOTE B8 CAPEX 81
NOTE B9 Free Cash Flow 82
NOTE B10 Net working capital 82
NOTE B11 Net debt 83
NOTE B12 CFROI 84
NOTE B13 Research & Innovation 84
4. NOTES TO THE UNDERLYING SEGMENTFIGURES 85
NOTE B14 Advanced Materials 86
NOTE B15 Advanced Formulations 87
NOTE B16 Performance Chemicals 88
NOTE B17 Functional Polymers 89
NOTE B18 Corporate & Business Services 90
5. RECONCILIATION OF UNDERLYING WITH IFRSFIGURES 90
NOTE B19 IFRS EBITDA 91
NOTE B20 IFRS EBIT 92
NOTE B21 IFRS net financial charges 92
NOTE B22 IFRS income taxes 92
NOTE B23 IFRS profit from discontinued operations 92
NOTE B24 IFRS profit for the period 92
6. NOTES TO THE FIGURES PER SHARE 93
NOTE B25 Earnings per share 94
NOTE B26 Dividend 94
7. OUTLOOK 2017 95
Management Report
Corporate governance statement 33
Risk management 57
BUSINESS REVIEWExtra-financial statements 96
Financial statements 130
Declarations: Auditor’s reports & Declaration by the persons responsible 225
72SOLVAY 2016 Annual Integrated Report

IFRS(1) Underlying
In € million Notes FY 2016FY 2015
pro forma % yoy FY 2016FY 2015
pro forma % yoyNet sales B1 10,884 11,415 (4.7)% 10,884 11,415 (4.7)%
Net operating costs, excluding depreciation &amortization B2 (8,753) (9,559) 8.4% (8,600) (9,290) 7.4%
EBITDA B3 2,131 1,857 15% 2,284 2,125 7.5%EBITDA margin B3 21% 19% 2.4pp
Depreciation, amortization & impairments B4 (1,169) (1,103) (6.0)% (750) (727) (3.1)%EBIT 962 754 28% 1,534 1,398 9.7%
Net financial charges B5 (339) (320) (5.7)% (469) (441) (6.4)%Income taxes B6 56 (35) n.m. (291) (300) 3.2%
Tax rate B6 28% 32% (4.8)ppProfit for the period from discontinuedoperations B7 (6) 50 n.m. 133 175 (24)%Profit for the period attributable to non-controlling interests (-) (53) (48) 11% (61) (65) (6.6)%
Profit attributable to Solvay share 621 400 55% 846 768 10%Basic earnings per share (in €) B25 6.01 3.86 56% 8.19 7.40 11%Dividend(2) B26 3.45 3.30 (4.3)% 3.45 3.30 (4.3)%Capex B8 (981) (1,160) 15% (981) (1,160) 15%
Capex from continuing operations B8 (929) (1,057) 12% (929) (1,057) 12%Cash conversion B8 59% 50% 9.0pp
Free cash flow B9 876 492 78% 876 492 78%Free cash flow from continuing operations B9 736 394 87% 736 394 87%
Net working capital B10 1,396 1,557 (10)% 1,396 1,557 (10)%Net working capital / sales B10 15.3% 13.4% 1.9pp
Net debt(3) B11 (4,356) (4,379) – (6,556) (6,579) –Underlying leverage ratio(3)(4) B11 2.60 2.82 (0.21)
CFROI(5) B12 6.3% 6.1% 0.3ppResearch & innovation B13 (350) (361) 3.0%
Research & innovation intensity B13 3.2% 3.2% 0.1pp
(1) A full reconciliation of IFRS and underlying income statement data can be found in section 5 of the Business Review.(2) Recommended 2016 dividend, pending General Shareholders meeting on May 9, 2017.(3) Underlying net debt includes the perpetual hybrid bonds, accounted for as equity under IFRS.(4) The 2016 underlying leverage ratio is calculated based on the underlying EBITDA including the discontinued operations Acetow and Vinythai.(5) The 2015 pro forma CFROI has not been restated for the discontinuation of Acetow and Vinythai.
OVERVIEW OF THE CONSOLIDATED RESULTS1.
Key financial figures
BUSINESS REVIEW
SOLVAY 2016 Annual Integrated Report73

As publishedIn € million 2012 2013 2014 2015(1) 2016Income statement data
Sales a 12,831 10,367 10,629 11,047 11,403Net sales b 12,435 9,938 10,213 10,578 10,884Underlying EBITDA c 2,067 1,663 1,783 1,955 2,284
Underlying EBITDA margin d 17% 17% 17% 18% 21%IFRS EBIT e 1,275 647 652 833 962Underlying profit for the period f 907IFRS profit for the period g 601 315 13 454 674Underlying profit attributable tosolvay share h 622 680 846IFRS profit attributable to Solvayshare i 584 270 80 406 621
Cash flow dataCapex k (785) (810) (987) (1,037) (981)
Capex from continuingoperations l (785) (708) (861) (969) (929)Cash conversion m = (c+l)/c 62% 57% 52% 50% 59%
Free cash flow n 787 524 656 387 876Balance sheet data
Net working capital p 1,379 1,217 1,101 1,557 1,396Net working capital / sales q = µ(p/a)(2) 12.4% 12.9% 13.5% 13.4% 15.3%
Underlying net debt(3) r = s+t (1,125) (2,302) (1,978) (6,579) (6,556)Perpetual hybrid bonds s – (1,200) (1,200) (2,200) (2,200)IFRS net debt t (1,125) (1,102) (778) (4,379) (4,356)
Total equity u 6,574 7,453 6,778 9,668 9,956Equity attributable to non-controlling interests v 443 378 214 245 250Perpetual hybrid bonds inequity w – 1,194 1,194 2,188 2,188Equity attributable to Solvayshare x = u-v-w 6,131 5,881 5,369 7,234 7,518
Underlying leverage ratio(4) y = -r/c 0.5 1.4 1.1 2.8 2.6Other key data
CFROI(5) A 6.5% 6.9% 6.9% 6.9% 6.3%Research & innovation B (300) (280) (287) (320) (350)
Research & innovationintensity C = -B/b 2.4% 2.8% 2.8% 3.0% 3.2%
(1) 2015 data are not presented on pro forma basis, i.e. excude Cytec.(2) Average of the quarters.(3) Underlying net debt includes the perpetual hybrid bonds, accounted for as equity under IFRS.(4) The 2016 underlying leverage ratio is calculated based on the underlying EBITDA including the discontinued operations Acetow and Vinythai. The 2015
underlying leverage ratio is calculated based on the underlying pro forma EBITDA, including Cytec.(5) The 2012 CFROI is calculated before discontinuation of Indupa.
The table above presents the historical figures of the Group aspublished at the reference date. These data have not beenaffected by possible subsequent restatements due to perimeterchanges, IFRS/IAS standards evolution, etc.
Over the reference periods, the following main changes haveintervened:
Historical key financial figures
2012:
Latin American chlorovinyls activities Indupa presented asdiscontinued and assets held for sale;
–
2013:
European chlorovinyls activities presented as discontinuedand assets held for sale;
–
Acquisition of Chemlogics, consolidated as from November 1;–
BUSINESS REVIEW
74SOLVAY 2016 Annual Integrated Report

Following the announcements at the end of 2016 of the intendeddivestments of the Acetow and Vinythai businesses, thesebusinesses are reclassified as discontinued operations and asassets held for sale. For comparative purposes, the 2015 incomestatement has been restated.
The results of former Cytec are consolidated in the Group’sincome and cash flow statements since January 1, 2016.Comparative information for the fourth quarter and full year2015 is presented on an unaudited pro forma basis as if theacquisition of Cytec had taken place on January 1, 2015.
Besides IFRS accounts, Solvay also presents underlying IncomeStatement performance indicators to provide a more consistentand comparable indication of the Group’s financial performance.The underlying performance indicators adjust IFRS figures forthe non-cash Purchase Price Allocation (PPA) accounting impactsrelated to acquisitions, for the coupons of perpetual hybridbonds, classified as equity under IFRS but treated as debt inthe underlying statements, and for other elements that woulddistort the analysis of the Group’s underlying performance. Theseadjustments consist of:
Solvay believes that these measurements are useful for analyzingand explaining changes and trends in its historical results ofoperations, as they allow performance to be compared on aconsistent basis. The underlying income statement figures arenon-audited metrics, but are derived from the audited IFRSaccounts.
Solvay uses alternative performance metrics to measure itsfinancial performance, which can be found below:
2014:
Application of IFRS 11;–Eco Services activities presented as discontinued and assetsheld for sale, and divested on December, 2;
–
2015:
European chlorovinyls activities contributed to the Inovynjoint venture (50% Solvay, 50% Ineos) on July 1;
–
Acquisition of 100% of the shares of Cytec Industries Inc.on December 9. Cytec opening balance sheet has been fullyconsolidated within the Solvay group as fromDecember 31, 2015. Cytec’s results and cash flows for theperiod between December 9 and December 31 are notmaterial, except for acquisition-related expenses presentedas portfolio management and reassessment. Consequently,Cytec has not contributed to the Group’s profit or cash flowsin 2015.
–
2016:
Divestment of Solvay's share in Inovyn joint venture on July, 7;–Acetow and Vinythai businesses presented as discontinuedoperations and as assets held for sale;
–
Divestment of Latin American chlorovinyls activities Indupaon December, 27.
–
PREPARATION BACKGROUND2.
Comparability of results
Underlying versus IFRS income statement
Results from portfolio management and reassessments;
Results from legacy remediation and major litigations;
M&A related impacts, mainly including non-cash PurchasePrice Acquisition impacts (e.g. inventory step-up andamortization of intangibles) and retention bonuses relative toChemlogics and other acquisitions;
Net financial results related to changes in discount rates,hyperinflation, coupons of hybrid bonds considered asdividends under IFRS and debt management impacts (mainlyincluding gains/(losses) related to the early repayment of debt);
Adjustments of equity earnings for impairment gains or lossesand unrealized foreign exchange gains or losses on debt;
Results from available-for-sale financial assets;
Tax effects related to the items listed above and tax expenseor income of prior years;
All adjustments listed above apply to both continuing anddiscontinuing operations, and include the impacts on non-controlling interests.
Alternative performance metrics (APM)
The term “net sales” refers to the sales of goods and value-added services corresponding to Solvay’s know-how and corebusiness. Net sales exclude other revenues primarilycomprising commodity and utility trading transactions andother revenues deemed as incidental for the Group;
EBITDA = Earnings Before Interest and Taxes, Depreciation andAmortization charges;
EBIT = Earnings Before Interest and Taxes;
Tax rate = Income taxes / (Result before taxes – Earnings fromassociates & joint ventures – Interests & realized foreignexchange results on RusVinyl joint venture). The adjustmentof the denominator regarding associates and joint ventures ismade as these contributions are already net of income taxes;
BUSINESS REVIEW
SOLVAY 2016 Annual Integrated Report75

These alternative performance metrics are used internally foranalyzing the Group's results as well as its business units. Theyare also used in the calculation of management remuneration.The alternative performance metrics are non-IFRS auditedmetrics, but are derived from the audited IFRS accounts.
As a leader in markets with high entry barriers and strong returnson investment, the Advanced Materials is a major contributorto the Group’s performance and growth. Innovation edge,unmatched portfolio breadth, customer intimacy and marketknowledge combined with global presence provide a compellingcompetitiveness to industries seeking increased energy efficiencyand use of less polluting alternatives.
With over 1,500 products, Specialty Polymers offers the widestrange of high performance polymers in the world. The GBUaddresses highly diversified and dynamic markets (such asautomotive, aerospace, smart devices, energy, healthcare andwater treatment) driven by light weighting and worldwidedemand for "clean" technologies.
Composite Materials is a top tier supplier to the aerospaceengineered materials market known for its technology leadershipand the added value to its customers: scale and technicalcapability. Its products allow to lightweight aircrafts, therebyreducing their environmental footprint. Besides the aeronauticssector it also serves other applications in wind energy, sports,sailing boats, and notably automotive, where the lightweightingproperties create substantial development potential.
Special Chem produces fluor and rare-earth formulations forautomotive, semi-conductor and lighting applications. With itsindustrial know-how, global presence and R&I proximity, SpecialChem has positioned itself as a strategic partner for theautomotive sector as a producer of materials used in emissioncontrol catalysis and aluminum brazing, and as a producer ofcleaning and polishing materials for electronics.
Silica focuses on highly dispersible silica, primarily used in fuel-efficient and performance tires. It develops innovative solutionsfor global tire manufacturers, as well as Silica ranges for manyother market segments like toothpaste, food, industrial products,and rubber articles.
Free cash flow measures cash flow from operating activities,net of investments. It excludes any M&A or financing relatedactivities, but includes elements like dividends from associatesand joint-ventures, pensions, restructuring costs, etc. It isdefined as cash flow from operating activities (excluding cashflows from expenses incurred in connection with acquisitionsof subsidiaries) and cash flow from investing activities(excluding cash flows from acquisitions and disposals ofsubsidiaries and other investments and excluding loans toassociates and non-consolidated investments, as well asrelated tax elements);
Capital expenditure (capex) is cash paid for the acquisition oftangible and intangible assets;
Cash conversion is a ratio to measure the conversion ofEBITDA into cash. It is defined as (Underlying EBITDA + Capexfrom continuing operations) / Underlying EBITDA;
Net debt = Non-current financial debt + current financial debt– cash & cash equivalents – other financial instrumentreceivables. Underlying net debt represents the Solvay shareview of debt, reclassifying as debt 100% of the hybrid perpetualbonds, considered as equity under IFRS;
Leverage ratio = Net debt / Underlying EBITDA of last 12months. Underlying leverage ratio = Underlying net debt /Underlying EBITDA of last 12 months);
CFROI or Cash Flow Return On Investment measures the cash returnsof Solvay’s business activities. This uses a reasonable estimate of thereplacement cost of assets and avoids accounting distortions, e.g. forimpairments. It is calculated as the ratio between recurring cash flowand invested capital, where:
Recurring cash flow = Underlying EBITDA + (Dividends fromassociates and joint ventures – Earnings from associates andjoint ventures) + Recurring capex + Recurring income taxes;
–
Invested capital = Replacement value of goodwill and fixedassets + Net working capital + Carrying amount of associatesand joint ventures;
–
Recurring capex is normalized at 2% of the replacementvalue of fixed assets net of goodwill values;
–
Recurring income tax is normalized at 30% of (UnderlyingEBIT – Earnings from associates and joint ventures);
–
Research & Innovation measures the total cash effort inresearch and innovation, regardless as to whether the costswere expensed or capitalized. It consists of research &development costs from the income statement before nettingof related subsidies and royalties, and where depreciation andamortization are replaced by related capital expenditure;
Research & innovation intensity is the ratio of research & innovation tonet sales;
Net working capital: includes inventories, trade receivables andother current receivables, netted with trade payables andother current liabilities.
Description of the operational segmentsAdvanced Materials
Specialty Polymers
Composite Materials
Special Chem
Silica
BUSINESS REVIEW
76SOLVAY 2016 Annual Integrated Report

As one of Solvay’s growth engines, the Advanced Formulationsbusinesses stand out for their applications, customer-drivenapproach and relatively low capital intensity. Their offeringsaddress major societal trends, meeting ever stricterrequirements with respect to the environment and energysavings as well as the challenges of the mass consumer markets.
Novecare develops and produces formulations that alter theproperties of liquids. It offers solutions to the oil and gas industryusing the world’s largest chemicals portfolio. Novecare alsoprovides specialty solutions for certain industrial applications,agricultural and coatings markets.
Technology Solutions is a global leader in specialty miningreagents, phosphine-based chemistry, and solutions forstabilization of polymers. Its portfolio includes world class,leading-edge technologies and unrivalled technical service andapplications expertise that support our customers in developingtailored solutions, in particular for mining, where Solvay'sproducts allow customers to extract metal concentrates fromincreasingly more complex and depleted ores.
Aroma Performance is the world’s largest integrated producerof vanillin for food, flavors & fragrances industries and syntheticintermediates used in perfumery.
Operating in mature, resilient markets, this operating segment’ssuccess is based on economies of scale, competitiveness andquality of service. Solidly cash-generating, the PerformanceChemicals businesses are engaged in programs of excellence tocreate additional sustainable value.
Soda Ash & Derivatives is the world’s largest producer of sodaash and sodium bicarbonate, sold primarily to the flat andcontainer glass industries but also used in detergents, agro andfood industries. It provides resilient profitability thanks to goodpricing, dynamics growing at mid-single digit rate, underpinnedby high-quality assets.
Solvay is the market leader in hydrogen peroxide, both in marketshare and technology. Hydrogen peroxide (H2O2) is mainly usedby the paper industry to bleach pulp. Its properties are also ofinterest to many markets like chemicals, food, textiles and theenvironment.
Coatis is a provider of glycerine-based sustainable solventssolutions and specialty phenols mainly for the Latin Americanmarket. It enjoys an undisputed market leadership position inBrazil for Phenol & Derivatives used in the production of syntheticresins employed in foundries, construction and abrasives.
Functional Polymers includes the polyamide-related businessesgroups, which produce polyamide compounds used in high-performance plastics, and polyamide yarn, as well as housingSolvay’s participation in its chlorovinyls joint venture RusVinyl inRussia.
The GBU is one of the rare operators in the market to controlthe entire polyamide chain from upstream (production ofintermediates and polymers) to downstream (development ofhigh value-added engineering plastics) serving mainly theautomotive, electrical/electronics and different consumer goodmarkets. It also includes a downstream business activity in LatinAmerica, which manufactures and commercializes textile andindustrial yarns and staple fibers, based on polyamide 6.6, forfinal use in clothing and industrial applications.
The Russian chlorovinyls activity consists of the RusVinyl JV whichstarted operation in 2014 and is consolidated using the equitymethod.
Solvay Energy Services delivers innovative and sustainable tailor-made services designed to improve energy performance andreduce the CO2 footprint of the Solvay group and energy-intensive third-party industrial clients. These services range fromenergy sourcing and energy efficiency to price risk managementand operation of co-generation plants.
Business Services covers, in a global shared services organization,all the Group’s IT services and its main administrativedepartments (accounting, credit, customer service, customs,payroll and personnel administration and procurement).
Advanced formulations
Novecare
Technology Solutions
Aroma Perfomance
Performance Chemicals
Soda Ash & Derivatives
Peroxides
Coatis
Functional Polymers
Polyamide
Chlorovinyls
Corporate & Business ServicesSolvay Energy Services
Other Corporate and Business Services
BUSINESS REVIEW
SOLVAY 2016 Annual Integrated Report77

Net sales totaled € 10,884 m, down (4.7)%. Volumes were stableoverall. Sales prices decreased, however, while foreign exchangefluctuations had a negative conversion impact and the scopereduced slightly.
Volumes were largely flat, with growth in Functional Polymersoffsetting a decrease in Advanced Formulations. InAdvanced Materials, solid growth in consumer goods, healthcareand automotive markets more than compensated for lower civilaviation build rates and smart devices demand, including theimpact of inventory adjustments in those markets. Oil and gasmarkets started recovering in the second half of the year, butthe activity remained well below the 2015 level, weighing onAdvanced Formulations’ performance. This was mitigated,however, by growth in other areas, including agro and foodproducts. In Performance Chemicals, volumes were flat overallacross businesses. Functional Polymers’ volumes were up thanksto solid market demand for polyamide 6.6 intermediates andengineered materials.
Average price reductions of (2.3)% reflected primarily the pass-through impact of lower raw materials costs, as well as pricepressure in the oil and gas sector and on the Latin Americanmarket.
Foreign exchange fluctuations had a slightly negative impact onconversion of (1.5)%, linked to the depreciation of the Chineseyuan and Venezuelan bolivar.
The scope effect accounted for (0.9)%, and related to the sale ofthe refrigerants and PCC businesses in 2015.
Underlying cost of goods sold totaled € (8.2) bn, of which some40% are taken by raw material and energy costs.
The overall raw materials expense of the Group mounted to circa€ 2.5 bn in 2016, some 16% lower compared to 2015. The rawmaterials expense can be split into several categories: crude oilderivatives circa 46%, minerals derivatives circa 23% (e.g. glassfiber, sodium silica, calcium silicate, phosphorus, sodiumhydroxide…), natural gas derivatives (circa 13%), biochemicalscirca 12% (e.g. wood pulp, glycerol, guar, fatty alcohol, ethylalcohol…), others (circa 7%).
Net energy costs represented about € 0.64 bn in 2016, circa 10%lower versus 2015. Energy sources were spread over electricityand gas (circa 71%), coke, coal and anthracite (circa 22%) andsteam and others (circa 7%). Fossil fuels represented circa 73%.More than half of the costs were incurred in Europe (circa 56%)followed by the Americas (24%), Asia and rest of the world (circa20%). The Group has pursued an active energy policy for manyyears. As a major energy consumer, the Group produces its ownelectricity through on-site cogeneration plants and steamturbines for a total capacity of circa 800 MWe.
NOTES TO THE GROUP UNDERLYING FIGURES3.
NOTE B1Net sales
Net sales evolution
NOTE B2Underlying raw material & energy costs
BUSINESS REVIEW
78SOLVAY 2016 Annual Integrated Report

Within the Group, Solvay Energy Services (SES) focuses onoptimizing the Solvay’s energy costs and carbon emissions.Furthermore, SES has continued deploying its operating energyefficiency excellence initiative called SOLWATT®, which aims atreducing energy consumption and optimizing energy productionon industrial sites. By the end of 2016, SOLWATT® has beengradually rolled out and covers almost all the Group’s
manufacturing sites. As of December 2016(1), 2205 actions for atotal of €91 million of savings per annum have been identifiedafter the diagnosis phase. More than half of these actionsrepresenting €35.5 million and circa 359 kt of CO2 of annualsavings have been implemented since 2011(1). The Soda Ash &Derivatives and Specialty Polymers GBUs are among the topbeneficiaries.
Underlying EBITDA grew 7.5% to € 2,284 m, driven by pricingpower and fixed cost reduction benefits. Operational excellenceexceeded € 200 m, while completion of the Cytec integrationdelivered € 70 m of synergies, well ahead of the initial plan. Therewere no significant effects from volume/mix changes. Foreignexchange fluctuations and scope had a slightly negative impact.
Volumes were largely flat and had no overall impact on EBITDA.
Continued pricing power pushed net pricing up 5.9% year onyear. Lower sales prices were more than compensated by lowerraw material costs and delivery of operational excellenceinitiatives in all segments, except in Advanced Formulationswhere the price pressure in the oil & gas market proved tooheavy. Solvay’s rolling hedging policy protected the pricing poweragainst short-term currency fluctuations.
Fixed costs were down, adding 2.9% to EBITDA, supported byoperational excellence and synergies delivery, thereby more thancompensating for inflation and the additional costs fromincreased production capacity.
The net foreign exchange impact on conversion was (1.9)%,mainly linked to the significant depreciation of the Venezuelanbolivar and Chinese yuan.
The scope effect on EBITDA accounted for (0.4)%.
The underlying EBITDA margin reached 21%, up 2.4 pp versus2015, thereby exceeding 20% for the first time.
Amortization and depreciation charges were € (750) m, 3% up on€ (727) m in 2015, which results from the higher capex level inrecent years.
NOTE B3Underlying EBITDA
Underlying EBITDA evolution
NOTE B4Underlying depreciation & amortization
(1) 2016 Solwatt® figures still include actions related to Acetow and Vinythai
BUSINESS REVIEW
SOLVAY 2016 Annual Integrated Report79

UnderlyingIn € million FY 2016 FY 2015 pro formaNet cost of borrowings a (226) (210)
Coupons on perpetual hybrid bonds b (111) (112)Interests and realized foreign exchange gains (losses) on the RusVinyl jointventure c (26) (27)Cost of discounting provisions d (106) (92)Result from available-for-sale financial assets e – –
Net financial charges(1) f = a+b+c+d+e (469) (441)
(1) Underlying net financial charges include the coupons on perpetual hybrid bonds, which are accounted as dividends under IFRS, and thereby excludedfrom the income statement, as well as the financial charges and realized foreign exchange losses in the RusVinyl joint venture, which under IFRS are partof the earnings from associates & joint ventures and thereby included in the IFRS EBITDA.
Underlying net financial charges rose to € (469) m from € (441) min 2015.
UnderlyingIn € million FY 2016 FY 2015 pro forma
Profit for the period before taxes a 1,065 957Earnings from associates & joint ventures b 69 44Interests and realized foreign exchange gains (losses) on the RusVinyl jointventure c (26) (27)Income taxes d (291) (300)
Tax rate e = -d/(a-b-c) 28% 32%
Underlying income taxes were € (291) m versus € (300) m in2015, reflecting a lower tax rate of 28% versus 32% in 2015,which is linked to a change in the geographical mix of pre-taxearnings.
Discontinued operations include the Latin American PVC activityIndupa, which was sold at the end of December 2016, and therecently discontinued acetate tow businesses Acetow and AsianPVC activity Vinythai. The latter’s contribution was lower year onyear, as in 2015 discontinued operations still included the € 57 mcontribution of the European PVC activity, which has beenincorporated in the Inovyn joint venture mid-2015.
NOTE B5Underlying net financial charges
The underlying net cost of borrowings increased to € (226) mcompared to € (210) m a year ago, with currency swappingcosts and higher average interest rates offsetting the effects oflower indebtedness and reduced cost of carry.
The coupons on perpetual hybrid bonds were € (111) m, in linewith 2015.
Financial charges on the RusVinyl joint venture were largelystable at € (26) m versus € (27) m last year.
Non-cash discounting costs on pension and environmentalliabilities were € (106) m, compared to € (92) m in 2015. Theincrease is due to positive one-off effects in 2015 on post-retirement benefits.
NOTE B6Underlying income taxes
NOTE B7Underlying profit from discontinued operations
BUSINESS REVIEW
80SOLVAY 2016 Annual Integrated Report

In € million FY 2016FY 2015
pro forma(1)
Acquisition (-) of tangible assets a (883)Acquisition (-) of intangible assets b (98)
Capex c = a+b (981) (1,160)Capex flow from discontinued operations d (51) (103)
Capex from continuing operations e = c-d (929) (1,057)
(1) The 2015 detailed cash flow statement was not presented on a pro forma basis and was not restated for the discontinuation of Acetow and Vinythai. Thecapex for 2015 is however presented both on a pro forma and restated basis and therefore can’t be reconciled with the detailed cash flow statement.
In € million FY 2016 FY 2015 pro formaCapex from continuing operations a (929) (1,057)
Underlying EBITDA b 2,284 2,125Cash conversion c = (a+b)/b 59% 50%
Capex from continuing operations was € (929) m, € 127 m lowerthan in 2015, in line with the planned reduction of capexintensity. Cash conversion thereby rose from 50% to 59%.
Besides health, safety & environment and maintenance capitalexpenditures, the Group selectively invested in a number ofstrategic projects, with priority given to businesses andgeographies with superior and sustainable growth potential.
Production expansions across the globe to serve customers wererealized in 2016. The most significant are:
A number of growth projects represented significant capitalexpenditures in 2016, but are still under construction:
NOTE B8CAPEX
the announcement of extra composite capabilities with a state-of-the-art resin facility at an upgraded site in Germany.Production should begin in the second quarter of 2017 aftercustomer qualifications, to supply the LEAP engine for Airbusand Boeing programs;
the launch of Highly Dispersible Silica production at its newSouth Korean plant to meet strong and growing regionaldemand for energy saving tires;
The new hydrogen peroxide plant, in China, began productionfor high-quality applications, serving growing demand forelectronics, water treatment and aquaculture industries, aswell as supplying Solvay’s own semiconductor and flavorbusinesses.
the new mega Hydrogen Peroxide for Propylene Oxide (HPPO)plant (330kt/year) in Saudi Arabia in joint venture with SadaraAramco and Dow, which was largely finished by end 2015 butdue to open in 2016 only;
the construction of a second PEEK polymers plant for SpecialtyPolymers, built in the United States (Georgia) ;
the second phase of the fluoro-polymers plant in China(Changshu) for Specialty Polymers, to start-up in 2017.
BUSINESS REVIEW
SOLVAY 2016 Annual Integrated Report81

In € million FY 2016FY 2015
pro forma(1)
Cash flow from operating activities a 1,788of which cash flow related to acquisition of subsidiaries, excluded from freecash flow b 7
Cash flow from investing activities c (807)Acquisition (-) of subsidiaries d (23)Acquisition (-) of investments - Other e 4Loans to associates and non-consolidated companies f (25)Sale (+) of subsidiaries and investments g 144Income taxes paid on sale of investments h –
Free cash flow i = a-b+c-d-e-f-g-h 876 492Free cash flow from discontinued operations j 140 98
Free cash flow from continuing operations k = i-j 736 394
(1) The 2015 detailed cash flow statement was not presented on a pro forma basis and was not restated for the discontinuation of Acetow and Vinythai. Thefree cash flow for 2015 is however presented both on a pro forma and restated basis and therefore can’t be reconciled with the detailed cash flowstatement.
Free cash flow from continuing operations nearly doubled to € 736 m versus € 394 m in 2015. In addition to the € 159 m rise in EBITDAthis was the result of lower capex and strict working capital management. Including the free cash flow from discontinued operations, thetotal free cash flow was € 876 m versus € 492 m in 2015.
2016 2015In € million December September(1) June(1) March(1) December(1)(2)
Inventories a 1,672 1,754 1,753 1,761 1,867Trade receivables b 1,621 1,728 1,730 1,664 1,615Other current receivables c 736 666 976 1,050 655Trade payables d (1,547) (1,410) (1,414) (1,336) 1,559Other current liabilities e (1,085) (985) (926) (999) 1,021
Net working capital f = a+b+c-d-e 1,396 1,753 2,119 2,140 1,557Sales g 2,933 3,048 3,053 3,052 3,109Annualized quarterly total sales h = 4*g 11,731 12,193 12,214 12,206 12,434
Net working capital / sales i = f / h 11.9% 14.4% 17.4% 17.5% 12.5%Year average(2) j = µ(Q1,Q2,Q3,Q4) 15.3% 13.4%
(1) The data from September 2016 and before have not been restated for the discontinuation of Acetow and Vinythai.(2) Average of the quarters. The data from September 2015 and before, used for the calculation of the average, are not on pro forma basis, i.e. exclude Cytec.
Outflow from working capital was € (75) m. The average net working capital to sales ratio over the quarters was 15.3% versus 13.4% in2015 on non-restated basis, inflated by the outstanding receivable on the Inovyn exit price in the first half of 2016.
NOTE B9Free Cash Flow
NOTE B10Net working capital
BUSINESS REVIEW
82SOLVAY 2016 Annual Integrated Report

2016 2015In € million December September(1) June(1) March(1) December(1)
Non-current financial debt a (4,087) (4,976) (5,063) (5,540) (5,628)Current financial debt b (1,338) (505) (953) (732) (892)
Gross debt c = a+b (5,426) (5,481) (6,016) (6,272) (6,520)Other financial instrument receivables d 101 119 124 155 111Cash & cash equivalents e 969 1,060 1,080 1,555 2,030
Total cash and cash equivalents f = d+e 1,070 1,179 1,204 1,711 2,141IFRS net debt g = c+f (4,356) (4,302) (4,812) (4,561) (4,379)
Perpetual hybrid bonds h (2,200) (2,200) (2,200) (2,200) (2,200)Underlying net debt i = g+h (6,556) (6,502) (7,012) (6,761) (6,579)Underlying EBITDA (last 12 months)(2) j 2,284 2,433 2,394 2,345 2,336
Underlying EBITDA of Acetow & Vinythai k 235 – – – –Adjusted underlying EBITDA for leveragecalculation l = j+k 2,519 2,433 2,394 2,345 2,336Underlying leverage ratio(3) m = -i/l 2.6 2.7 2.9 2.9 2.8
(1) September 2016 data and before were not restated for the discontinuation of Acetow and Vinythai.(2) The underlying EBITDA is based on the last 12 months, i.e. the underlying EBITDA of the last four quarters.(3) As net debt at the end of 2016 does not reflect yet the net proceeds to be received on the divestment of the discontinued Acetow and Vinythai
businesses, whereas the underlying EBITDA excludes the contribution of these discontinued businesses already, the underlying EBITDA was adjusted forthe purpose of calculating the leverage ratio.
Underlying net debt reached € (6,556) m, stable compared tothe end of 2015. The strong free cash flow more than covered€ (300) m in financial charges, which include € (84) m coupons onperpetual hybrid bonds, and higher dividend pay-out, of which€ (337) m to Solvay shareholders. The net cash inflow fromacquisitions and divestments primarily reflects the sale of Solvay’sstake in Inovyn and the net cash outflow linked to the sale of
Indupa. Other changes in net debt of € (237) m comprise thenon-cash effect of foreign exchange fluctuations on financial debtand related instruments, primarily the conversion impact of thehigher US dollar and Brazilian real on gross debt, and of thelower Venezuelan bolivar on cash. Net debt on an IFRS basiswas € (4,356) m and excludes 100% of the € (2,200) m hybridperpetual bonds considered as equity under IFRS.
NOTE B11Net debt
Underlying net debt evolution
BUSINESS REVIEW
SOLVAY 2016 Annual Integrated Report83

FY 2016 FY 2015 pro forma(1)
In € millionAs publi-
shedAdjust-
mentAs calcu-
latedAs publi-
shed AdjustmentAs calcu-
latedUnderlying EBIT(2) a 1,534 (69) 1,465 1,550 (43) 1,506Underlying EBITDA(2) b 2,284 (69) 2,214 2,336 (43) 2,292Dividends received fromassociates & joint ventures(3) c 22 – 22 13 – 13Recurring capex(4) d = -2%*k (363) (388)Recurring income taxes(4)(5) e = -30%*a (439) (452)
Recurring "CFROI" cash flowdata f = b+c+d+e 1,434 1,465
Tangible assets g 6,472 6,946Intangible assets h 3,600 3,919Goodwill i 5,679 5,840
Replacement value of goodwill& fixed assets(6)(7) j = g+h+i 15,751 4,669 20,420 16,705 5,193 21,898
of which fixed assets k 18,134 19,422Investments in associates &joint ventures(6) l 497 (52) 445 398 12 410Net working capital(6) m 1,396 355 1,751 1,557 231 1,787
"CFROI" invested capital n = j+l+m 22,615 24,095CFROI n = f/m 6.3% 6.1%
(1) 2015 data have not been restated but are provided on a pro forma basis.(2) The adjustment excludes earnings from associates & joint ventures.(3) The adjustment excludes discontinued operations.(4) Currently estimated at 2% of replacement value of fixed assets.(5) Currently estimated at 30% of underlying EBIT.(6) The adjustment reflects the quarterly average over the year.(7) The adjustment reflects the difference between the estimated replacement value of goodwill and fixed assets, and the accounting value. The changes over
time come from foreign exchange variations, new investments and portfolio moves.
CFROI improved to 6.3%, versus 6.1% pro forma in 2015 on a non-restated basis. This reflects Solvay’s growing performance, despite a(0.2) pp impact from the discontinuation of Acetow and Vinythai.
In € million FY 2016 FY 2015 pro formaIFRS research & development costs a (305) (318)
Grants & royalties netted in research & development costs b 33 32Depreciation, amortization & impairments included in research & developmentcosts c (54) (39)Capex in research & innovation d (66) (50)
Research & innovation e = a-b-c+d (350) (361)Net sales f 10,884 11,415Research & innovation intensity g = -e/f 3.2% 3.2%
Research & Innovation efforts in 2016 were € -350 million. The 3% gap is mainly related to the Cytec restatement and the reduction ofR&I corporate due to stop of OLED project. 85% of the Group’s R&I investments are directly managed by businesses.
NOTE B12CFROI
NOTE B13Research & Innovation
BUSINESS REVIEW
84SOLVAY 2016 Annual Integrated Report

Research & innovation efforts are driven by the following four innovation levers:
UnderlyingIn € million FY 2016 FY 2015 pro forma % yoyNet sales 10,884 11,415 (4.7)%
Advanced Materials 4,313 4,503 (4.2)%Advanced Formulations 2,668 2,885 (7.5)%Performance Chemicals 2,460 2,526 (2.6)%Functional Polymers 1,436 1,490 (3.6)%Corporate & Business Services 7 11 (39)%
EBITDA 2,284 2,125 7.5%Advanced Materials 1,110 1,079 2.9%Advanced Formulations 484 522 (7.2)%Performance Chemicals 695 628 11%Functional Polymers 222 141 57%Corporate & Business Services (227) (245) 7.3%
EBIT 1,534 1,398 9.7%Advanced Materials 829 798 3.9%Advanced Formulations 327 378 (14)%Performance Chemicals 534 470 14%Functional Polymers 137 58 n.m.Corporate & Business Services (293) (306) 4.4%
Capex from continuing operations (929) (1,057) 12%Advanced Materials (435) (415) (4.8)%Advanced Formulations (134) (225) 40%Performance Chemicals (186) (242) 23%Functional Polymers (95) (71) (34)%Corporate & Business Services (79) (104) 24%
Research & innovation (350) (361) (3.0)%Advanced Materials (155) (160) 3.4%Advanced Formulations (87) (89) 2.6%Performance Chemicals (26) (26) (2.6)%Functional Polymers (30) (31) 1.8%Corporate & Business Services (52) (55) 5.6%
A process of excellence to improve its efficiency and shortentime to market;
An intellectual property policy to drive Solvay’s futuredifferentiation;
An extended network of open innovation (throughpartnerships with academics, SMEs or other industrials) tomaximize its efficiency and tap into the creativity andcompetencies of the external world;
Explanatory partnerships with start-ups and venture capitalfunds which allow Solvay to unleash potential in strategicareas.
NOTES TO THE UNDERLYING SEGMENT FIGURES4.
Segment overview
BUSINESS REVIEW
SOLVAY 2016 Annual Integrated Report85

UnderlyingIn € million FY 2016 FY 2015 pro forma % yoyNet sales 4,313 4,503 (4.2)%
Specialty Polymers 1,922 1,901 1.1%Composite Materials 1,073 1,169 (8.2)%Special Chem 862 912 (5.5)%Silica 455 521 (13)%
EBITDA 1,110 1,079 2.9%EBITDA margin 26% 24% 1.8ppEBIT margin 19% 18% 1.5ppCFROI 9.4% 9.2% 0.2ppCash conversion 61% 62% (0.7)ppResearch & innovation intensity 3.6% 3.6% –
Net sales were € 4,313 m, with the sales shortage mainlyattributable to the divestiture of Special Chem’s refrigerants andPCC businesses in 2015 combined with unfavorable foreignexchange. Lower prices were balanced by modest volumegrowth. Sales grew in Specialty Polymers as strong volumesin diverse applications such as in consumer goods, automotiveand medical sectors more than offset lower demand in smartdevices. Sales volumes in Composite Materials were affectedby the anticipated rate declines of older aircraft programs and
reduced sales to industrial markets. Special Chem reportedgood demand for automotive catalysts and growth from thesemi-conductor market. Silica volume growth across regions inthe energy-efficient tire market was largely offset by thedevaluation of the bolivar in Venezuela.
Underlying EBITDA rose 2.9% to € 1,110 m driven by operationalexcellence programs and Cytec synergies, which increasedEBITDA margin by 1.8 pp to 26%.
NOTE B14Advanced Materials
Net sales evolution
BUSINESS REVIEW
86SOLVAY 2016 Annual Integrated Report
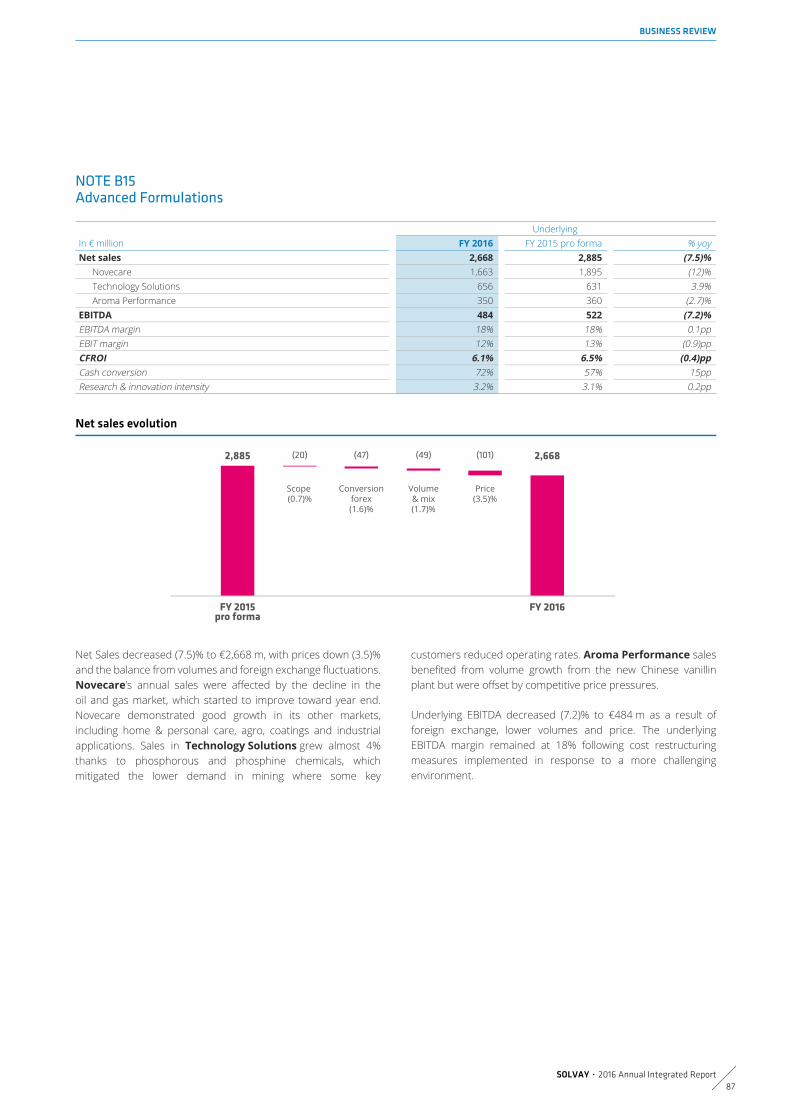
UnderlyingIn € million FY 2016 FY 2015 pro forma % yoyNet sales 2,668 2,885 (7.5)%
Novecare 1,663 1,895 (12)%Technology Solutions 656 631 3.9%Aroma Performance 350 360 (2.7)%
EBITDA 484 522 (7.2)%EBITDA margin 18% 18% 0.1ppEBIT margin 12% 13% (0.9)ppCFROI 6.1% 6.5% (0.4)ppCash conversion 72% 57% 15ppResearch & innovation intensity 3.2% 3.1% 0.2pp
Net Sales decreased (7.5)% to €2,668 m, with prices down (3.5)%and the balance from volumes and foreign exchange fluctuations.Novecare’s annual sales were affected by the decline in theoil and gas market, which started to improve toward year end.Novecare demonstrated good growth in its other markets,including home & personal care, agro, coatings and industrialapplications. Sales in Technology Solutions grew almost 4%thanks to phosphorous and phosphine chemicals, whichmitigated the lower demand in mining where some key
customers reduced operating rates. Aroma Performance salesbenefited from volume growth from the new Chinese vanillinplant but were offset by competitive price pressures.
Underlying EBITDA decreased (7.2)% to €484 m as a result offoreign exchange, lower volumes and price. The underlyingEBITDA margin remained at 18% following cost restructuringmeasures implemented in response to a more challengingenvironment.
NOTE B15Advanced Formulations
Net sales evolution
BUSINESS REVIEW
SOLVAY 2016 Annual Integrated Report87

UnderlyingIn € million FY 2016 FY 2015 pro forma % yoyNet sales(1) 2,460 2,526 (2,6)%
Soda Ash & Derivatives 1,561 1,554 0.4%Peroxides 542 558 (2.8)%Coatis 346 398 (13)%
EBITDA 695 628 11%EBITDA margin 28% 25% 3.4ppEBIT margin 22% 19% 3.1ppCFROI 8.9% 8.5% 0.5ppCash conversion 73% 61% 12ppResearch & innovation intensity 1.1% 1.0% 0.1pp
(1) Following the discontinuation of Acetow, some residual business is still contained in Performance Chemicals’ net sales. These accounted for € 3 m in Q4and € 10 m in FY 2016, compared to € 4 m in Q4 and € 16 m in FY 2015. There was no material contribution to EBITDA.
Net Sales were down (2.6)% to € 2,460 m, due to the loweraverage prices, which reflect the pass-through effect of lower rawmaterial costs. Foreign exchange effects were negative over theyear, mainly with the depreciation of the Brazilian real. Volumeswere stable overall. In Soda Ash & Derivatives, volumes weresimilar to the prior year. Higher bicarbonate sales, supportedby the ramp-up of the new plant in Thailand, offset slightlylower volumes of soda ash, linked to slower market demand atthe start of the year. In Peroxides, the ramp-up of the new plantin China supported volume growth in the traditional wood pulp
bleaching market, offsetting weaker sales in specialties. Overallsales were down due to mix effects. Coatis suffered low demandin its domestic Latin American market.
Underlying EBITDA increased by 11% to € 695 m. Operationalexcellence remained the main driver for the improvement,leading to a record EBITDA margin of 28%.
NOTE B16Performance Chemicals
Net sales evolution
BUSINESS REVIEW
88SOLVAY 2016 Annual Integrated Report
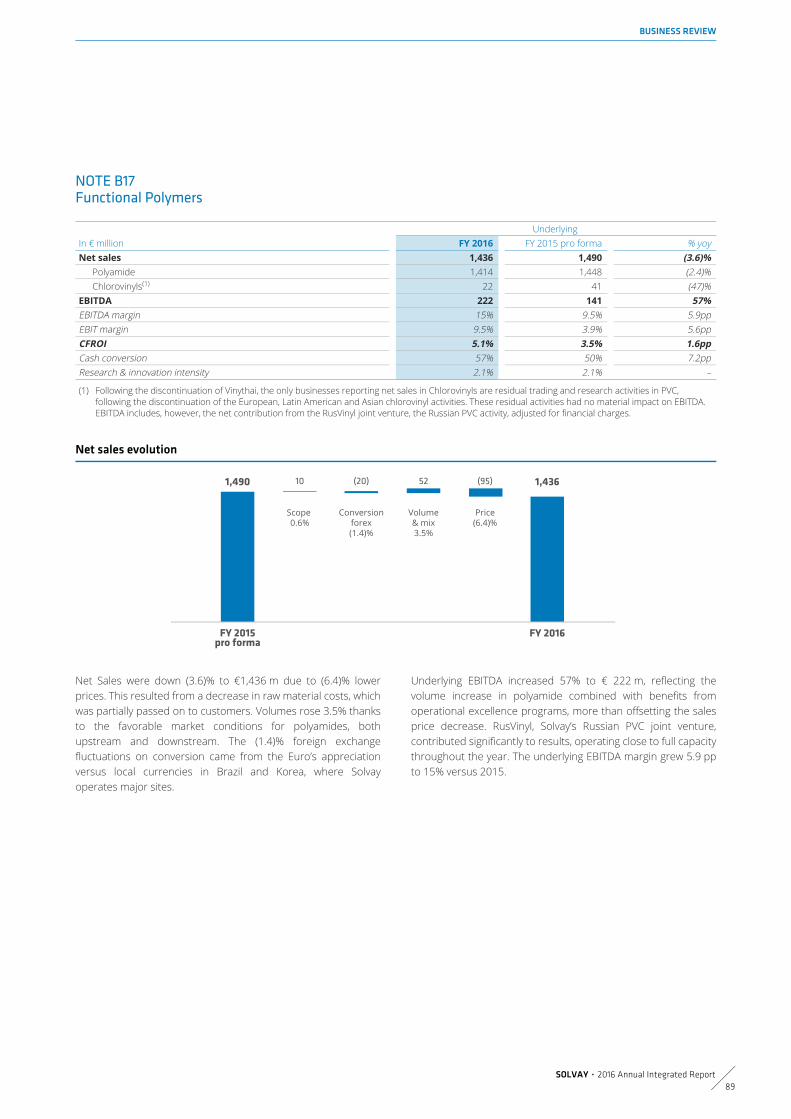
UnderlyingIn € million FY 2016 FY 2015 pro forma % yoyNet sales 1,436 1,490 (3.6)%
Polyamide 1,414 1,448 (2.4)%Chlorovinyls(1) 22 41 (47)%
EBITDA 222 141 57%EBITDA margin 15% 9.5% 5.9ppEBIT margin 9.5% 3.9% 5.6ppCFROI 5.1% 3.5% 1.6ppCash conversion 57% 50% 7.2ppResearch & innovation intensity 2.1% 2.1% –
(1) Following the discontinuation of Vinythai, the only businesses reporting net sales in Chlorovinyls are residual trading and research activities in PVC,following the discontinuation of the European, Latin American and Asian chlorovinyl activities. These residual activities had no material impact on EBITDA.EBITDA includes, however, the net contribution from the RusVinyl joint venture, the Russian PVC activity, adjusted for financial charges.
Net Sales were down (3.6)% to €1,436 m due to (6.4)% lowerprices. This resulted from a decrease in raw material costs, whichwas partially passed on to customers. Volumes rose 3.5% thanksto the favorable market conditions for polyamides, bothupstream and downstream. The (1.4)% foreign exchangefluctuations on conversion came from the Euro’s appreciationversus local currencies in Brazil and Korea, where Solvayoperates major sites.
Underlying EBITDA increased 57% to € 222 m, reflecting thevolume increase in polyamide combined with benefits fromoperational excellence programs, more than offsetting the salesprice decrease. RusVinyl, Solvay’s Russian PVC joint venture,contributed significantly to results, operating close to full capacitythroughout the year. The underlying EBITDA margin grew 5.9 ppto 15% versus 2015.
NOTE B17Functional Polymers
Net sales evolution
BUSINESS REVIEW
SOLVAY 2016 Annual Integrated Report89

UnderlyingIn € million FY 2016 FY 2015 pro forma % yoyNet sales 7 11 (39)%
Energy Services 4 11 (68)%Other Corporate & Business Services 3 – n.m.
EBITDA (227) (245) 7.3%
Net underlying EBITDA costs were € (227) m, € 18 m lowerthan in 2015, reflecting excellence and delivery on Cytecsynergies. Excluding one-off elements in both years, the EBITDAwould have been € 41 m better than in 2015.
Energy Services’ EBITDA was € 3 m, compared to € (3) m in2015. The difference is entirely due to the € (7) m write-offs onCERS in 2015. Results in 2016 benefited from the restructuringof certain renewable energy assets and from improved businessconditions for energy and carbon management services.
Other Corporate & Business Services’ EBITDA costs were€ (231) m. This represented a significant improvement comparedto 2015, which included a € 30 m one-off benefit recognized in2015 related to US post-retirement benefits. Operationalexcellence and synergy benefits more than compensated forinflation throughout 2016.
Besides IFRS accounts, Solvay also presents underlying IncomeStatement performance indicators to provide a more consistentand comparable indication of Solvay’s economic performance.These figures adjust IFRS figures for the non-cash Purchase PriceAllocation (PPA) accounting impacts related to acquisitions, forthe coupons of perpetual hybrid bonds, classified as equity underIFRS but treated as debt in the underlying statements, and forother elements to generate a measure that avoids distortion andfacilitates the appreciation of performance and comparability ofresults over time. The 2016 data are compared to unaudited proforma 2015 data including Cytec, as if the acquisition had takenplace on January 1, 2015.
NOTE B18Corporate & Business Services
RECONCILIATION OF UNDERLYINGWITH IFRS FIGURES
5.
BUSINESS REVIEW
90SOLVAY 2016 Annual Integrated Report

FY 2016 FY 2015 pro forma
In € million Notes IFRSAdjust-ments
Under-lying IFRS
Adjust-ments Underlying
Sales 11,403 – 11,403 11,882 – 11,882of which revenues fromnon-core activities 519 – 519 467 – 467of which net sales 10,884 – 10,884 11,415 – 11,415
Cost of goods sold (B19) (B20) (8,314) 84 (8,230) (8,834) 83 (8,751)Gross margin 3,090 84 3,173 3,048 83 3,131
Commercial & administrativecosts (B19) (B20) (1,465) 50 (1,416) (1,517) 57 (1,459)Research & development costs (B20) (305) 3 (302) (318) – (318)Other operating gains & losses (B20) (222) 231 9 (228) 229 1Earnings from associates &joint ventures (B19) 85 (16) 69 21 22 44Result from portfoliomanagement & reassessments (B19) (B20) (164) 164 – (212) 212 –Result from legacy remediation& major litigations (B19) (56) 56 – (41) 41 –
EBITDA (B19) 2,131 152 2,284 1,857 268 2,125Depreciation, amortization &impairments (B20) (1,169) 419 (750) (1,103) 376 (727)
EBIT (B20) 962 571 1,534 754 644 1,398Net cost of borrowings (B21) (226) – (226) (235) 25 (210)Coupons on perpetual hybridbonds (B21) – (111) (111) – (112) (112)Interests and realized foreignexchange gains (losses) on theRusVinyl joint venture (B21) – (26) (26) – (27) (27)Cost of discounting provisions (B21) (118) 12 (106) (77) (14) (92)Result from available-for-salefinancial assets (B21) 5 (5) – (8) 8 –
Profit for the period beforetaxes 624 441 1,065 434 524 957
Income taxes (B22) 56 (347) (291) (35) (265) (300)Profit for the period fromcontinuing operations 680 94 774 399 259 657
Profit for the period fromdiscontinued operations (B23) (6) 138 133 50 126 175
Profit for the period (B24) 674 233 907 448 385 833attributable to Solvay share (B24) 621 225 846 400 368 768attributable to non-controllinginterests (B24) 53 7 61 48 17 65
EBITDA on an IFRS basis totaled € 2,131 m versus € 2,284 mon an underlying basis. The difference of € 152 m is explainedby the following adjustments to IFRS results, in order to improvecomparability of underlying results:
FY consolidated income statement
NOTE B19IFRS EBITDA
€ 82 m for the non-cash impact of purchase price allocation(PPA), consisting of recycling into profit or loss of Cytecinventory step-ups, which are adjusted in “Cost of goods sold”;
€ 9 m for legacy acquisition costs, in this case the Chemlogicsretention premiums, which are adjusted in "Commercial &administrative costs";
€ (16) m in “Earnings from associates & joint ventures” for theforeign exchange gains on the euro-denominated debt of theRusVinyl joint venture, following the revaluation of the Russianruble since the start of the year, netted with the financialcharges of the joint venture. These elements are reclassified in“Net financial charges”;
BUSINESS REVIEW
SOLVAY 2016 Annual Integrated Report91

EBIT on an IFRS basis totaled € 962 m versus € 1,534 m on anunderlying basis. The difference of € 571 m is explained by theabove-mentioned € 152 m adjustments on EBITDA level and €419 m on “Depreciation, amortization & impairments”. The latterconsist of:
Net financial charges on an IFRS basis were € (339) m versus €(469) m on an underlying basis. The € (130) m adjustment madeto IFRS net financial charges consists of:
Income taxes on an IFRS basis represented a gain of € 56 mversus a cost of € (291) m on an underlying basis. The € (347) madjustment consists of:
Discontinued operations generated a loss for the period of €(6) m on an IFRS basis, but a profit of € 133 m on an underlyingbasis. The € 138 m adjustment made to the IFRS profit consistsof:
Profit for the period attributable to Solvay share on an IFRS basiswas € 621 m after subtracting the € 53 m profit attributableto non-controlling interests. On an underlying basis the profitattributable to non-controlling interests represented € 61 m,after subtraction of € 7 m for the impact of the aboveadjustments. This resulted in a profit for the period attributableto Solvay share of € 846 m on an underlying basis.
€ 21 m for net costs in “Result from portfolio managementand reassessments”, excluding depreciation, amortization andimpairment elements. These include restructuring costs of €(116) m, primarily related to restructuring plans in Corporate &Business Services, Special Chem and Soda Ash & Derivatives,as well as € (46) m costs and losses related to acquisition anddivestments. These costs were partially offset by the net capitalgain of € 72 m made on the exit of Inovyn, the € 49 m gain forthe release to Solvay of Chemlogics holdback payments and anet capital gain on sale of land of € 20 m;
€ 56 m for net costs in “Result from legacy remediation andmajor litigations”.
NOTE B20IFRS EBIT
€ 277 m for the non-cash impact of purchase price allocation(PPA), consisting of amortization charges on intangible assets,which are adjusted in “Cost of goods sold” for € 2 m,"Commercial & administrative costs" for € 41 m, "Research& innovation costs" for € 3 m and "Other operating gains &losses" for € 231 m;
€ 143 m for the net impact of impairments, which are non-cash in nature and are reported in “Portfolio management andreassessments”. These primarily related to the mothballing ofthe soda ash plant in Egypt for € (82) m and renewable energyassets for € (49) m.
NOTE B21IFRS net financial charges
€ (26) m reclassification of financial charges and realizedforeign exchange result on the euro-denominated debt ofRusVinyl as net financial charges. The € 42 m delta with theadjustment made to EBITDA is attributed to unrealized foreignexchange gains;
€ (111) m reclassification of coupons on perpetual hybridbonds, which are treated as dividends under IFRS, and asfinancial charges in underlying results;
€ 12 m for the net impact of decreasing discount rates on thevaluation of environmental liabilities in the period;
€ (5) m for the “Result from available-for-sales financial assets”.
NOTE B22IFRS income taxes
€ (145) m for the tax impacts of the adjustments made to theunderlying result before taxes (as described above);
€ (202) m for tax elements related to prior years, mainly fromrecognition of deferred tax assets in Belgium and the UK.
NOTE B23IFRS profit from discontinued operations
€ 129 m for Indupa, including adjustments to fair value and€54 m for the recycling of negative currency translationadjustments at the closing of the divestment in December;
€ 26 m for costs related to the divestment of Acetow andVinythai, including PPA depreciation;
€ (17) m related to gains on the divested pharma activities, asunderlying results exclude post-closing elements.
NOTE B24IFRS profit for the period
BUSINESS REVIEW
92SOLVAY 2016 Annual Integrated Report

As published2012 2013 2014 2015 2016
Number of shares (in 1000 shares)Issued shares at end of year a 84,701 84,701 84,701 105,876 105,876Treasury shares at end of year b 1,735 1,530 1,719 2,106 2,652Shares held by Solvac c 25,559 25,559 25,578 32,116 32,511Outstanding shares at the end of the year d = a-b 82,966 83,171 82,982 103,770 103,225Average outstanding shares (basic calculation) e 82,305 83,151 83,228 83,738 103,294Average outstanding shares (dilutedcalculation) f 82,696 83,843 83,890 84,303 103,609
Data per share (in €)Equity attributable to Solvay share g = .../d(2) 73.90 70.71 64.71 69.72 72.83Underlying profit for the period (basic) h = .../e(2) 8.19IFRS profit for the period (basic) i = .../e(2) 7.10 3.25 0.96 4.85 6.01IFRS profit for the period (diluted) j = .../f(2) 7.06 3.22 0.96 4.81 5.99Gross dividend(3) k 3.20 3.20 3.40 3.30 3.45Net dividend(3) l = k*(1-…%)(4) 2.40 2.40 2.55 2.41 2.42
Share price data (in €)Highest(5) m 109.80 121.05 129.15 141.10 112.30Lowest(5) n 62.11 97.20 100.15 88.01 70.52Average(5) o = v/u 87.33 109.42 114.35 105.74 89.32At the end of the year p 109.35 115.00 112.40 98.43 111.35Underlying price/earnings q = p/h 13.6IFRS price/earnings r = p/i 15.4 35.4 116.6 20.3 18.5Gross dividend yield s = k/p 2.9% 2.8% 3.0% 3.4% 3.1%Net dividend yield t = l/p 2.2% 2.1% 2.3% 2.4% 2.2%
Stock market data(6)
Annual volume (in 1000 shares) u 77,144 53,643 48,600 82,718 86,280Annual volume (in € m) v 6,737 5,870 5,557 9,218 7,707Market capitalisation, end of year (in € bn) w = p*d 9,262 9,741 9,520 10,421 11,789Velocity x = u/a 91% 63% 57% 78% 81%Velocity adjusted for free float y = u/(a-b-c) 134% 93% 85% 115% 122%
(1) 2015 data are not presented on pro forma basis, i.e. excude Cytec.(2) The numerator can be found under the same label in the historic key financial data table in section 1 of the Business review.(3) Recommended 2016 dividend, pending General Shareholders meeting on May 9, 2017.(4) Belgian withholding tax applicable in year of dividend payment, i.e. the following year: 25% in 2013-2015, 27% in 2016, 30% in 2017.(5) The 2015 share price data use the share price adjusted by a factor 93.98% for the period until December 3, 2015. The adjustment reflects the distribution
of rights during the capital increase completed in December 2015.(6) The stock market data are based on all trades registered by Euronext.
NOTES TO THE FIGURES PER SHARE6.
Historical key share data
BUSINESS REVIEW
SOLVAY 2016 Annual Integrated Report93

20162015
pro forma % yoyProfit attributable to Solvay share (in € m)
Underlying profit for the period a 846 768 10%Underlying profit from continuing operations b 729 618 18%
IFRS profit for the period c 621 400 55%IFRS profit from continuing operations d 640 366 75%
Number of shares (in 1000 shares)Issued shares at end of year e 105,876 105,876 –Treasury shares at end of year f 2,652 2,106 26%Outstanding shares at the end of the year g = e-f 103,225 103,770 (0.5)%Average outstanding shares (basic calculation)(1) h 103,294 103,770 (0.5)%Average outstanding shares (diluted calculation)(1) i 103,609 104,470 (0.8)%
Data per share (in €)Underlying profit for the period (basic) j = a/h 8.19 7.40 11%
Underlying profit from continuing operations (basic) k = b/h 7.06 5.95 19%IFRS profit for the period (basic) l = c/h 6.01 3.86 56%
IFRS profit from continuing operations (basic) m = d/h 6.20 3.52 76%IFRS profit for the period (diluted) l = c/i 5.99 3.83 11%
IFRS profit from continuing operations (diluted) m = d/i 6.18 3.50 19%
(1) The average number of outstanding shares used for 2015 pro forma are those at the end of the year, as the capital increase in December 2015 wouldotherwise distort the calculation.
The Board of Directors decided to recommend to the GeneralShareholders’ Meeting of May 9, 2017, payment of a total grossdividend of €3.45 per share (€ 2.415 net per share).
The dividend for the fiscal year 2016, up 4.5% compared to thedividend for the fiscal year 2015, is in line with the Group’sdividend policy of maintaining a stable to increasing dividendwhenever possible and, as far as possible, never reducing it.
Given the interim dividend of €1.32 gross per share (€ 0.924 netper share ) paid on January 18, 2017, the balance of the dividendin respect of 2016, equal to €2.13 gross per share (€ 1,491 netper share ), which will be paid on May 16, 2017, provided prioragreement by General Shareholders Meeting.
NOTE B25Earnings per share
NOTE B26Dividend
BUSINESS REVIEW
94SOLVAY 2016 Annual Integrated Report

Solvay expects underlying EBITDA to grow by mid-single digit.Overall demand is anticipated to remain healthy and operationalexcellence momentum is expecting to continue, albeit in anenvironment of rising raw material prices.
The EBITDA outlook is based on constant scope and foreignexchange rates(1).
Underlying depreciation & amortization charges are expectedto be at around € (750) m and exclude PPA amortization chargesof approximately € (290) m.
OUTLOOK 20177.
EBITDA
Advanced Materials growth will be driven from its diversifiedend markets including aerospace, automotive, consumer &healthcare, and electronics.
Advanced Formulations growth is projected in several endmarkets including agro, coatings and mining, with improvingconditions in oil & gas.
Performance Chemicals is expected to show stable tomodest growth, with anticipated headwinds in the soda ashmarket offset by operational excellence and Solvay’s capacityincrease in peroxides.
Functional Polymers is projected to be flat, retaining thegrowth achieved in 2016.
Corporate & Business Services are committed to excellencemeasures to offset inflation.
Financial charges & taxesUnderlying net financial charges expected at €(425) m,excluding the impact of foreign exchange fluctuations
Underlying net cost of borrowings at around € (230) m;–Coupons to be paid on the perpetual hybrid bonds of€ (112) m;
–
Non cash recurring discounting costs are estimated atapproximately € (80) m, of which some three quartersrelates to pensions and one quarter to health, safety &environmental (HSE) provisions.
–
Underlying income tax rate is expected to remain at around 30%.
Cash flowFree cash flow from continuing operations is expected toexceed €800 m in 2017, compared to €736 m in 2016, drivenby higher EBITDA and reduced capital expenditures.
Capital expenditure from continued operations is expectedto decrease further to around € (800) m.
The total pension cash outflow is projected at € (210) m.
(1) Solvay is exposed to foreign exchange fluctuations. The main currency exposure is to US dollar, Chinese yuan, Thai baht, Brazilian real, Russian ruble,Japanese yen and Korean won. EBITDA sensitivity to US dollar is about €120 m per US$ (0.10) change, of which some 60% on conversion and 40% ontransaction. Net debt sensitivity to US dollar is approximately € (200) m per US$ (0.10) change.
BUSINESS REVIEW
SOLVAY 2016 Annual Integrated Report95

1. SUMMARY TABLE 97
2. SUSTAINABILITY MANAGEMENT 99
2.1. Sustainability at the heart of the Group’s culture 99
2.2. Voluntary external commitments 99
2.3. Solvay Way approach and management 102
2.4. Sustainable business solutions 104
3. BASIS OF PREPARATION 104
3.1. Reporting principles 104
3.2. Materiality analysis 105
3.3. Stakeholder engagement 106
4. NOTES TO THE EXTRA-FINANCIALSTATEMENTS 108
NOTE S1 Sustainable Portfolio Management 108
NOTE S2 Greenhouse gas emission management 111
NOTE S3 Energy management 112
NOTE S4 Air quality management 114
NOTE S5 Water management 115
NOTE S6 Environmental accidents and remediation 117
NOTE S7 Hazardous materials management 118
NOTE S8 Employee health and safety management 120
NOTE S9 Employee engagement and wellnessmanagement 122
NOTE S10 Community development management 124
NOTE S11 Management of the Legal, Ethics andRegulatory framework 127
NOTE S12 Process safety, emergency preparedness andresponse 127
NOTE S13 Customer satisfaction 129
Management Report
Corporate governance statement 33
Risk management 57
Business review 72
EXTRA-FINANCIAL STATEMENTSFinancial statements 130
Declarations: Auditor’s reports & Declaration by the persons responsible 225
96SOLVAY 2016 Annual Integrated Report

Units Notes 2016 2015 2014 2013 2012Sustainable business solutions
Product portfolio assessed % S1 84 88 79 64 –
Sustainable solutions % S1 43 33 25 19 –
Greenhouse gas emissions
Greenhouse gas intensityKg CO2 eq. per
€ EBITDA S2 5.86 7.26 8.08 8.84 7.12
Direct and indirect CO2 emissions (Scope 1 & 2) Mt CO2 S2 10.9 11.6 11.7 12.0 11.8Other greenhouse gas emissions according to Kyoto Protocol(Scope 1) Mt CO2 eq S2 2.4 2.6 2.7 2.7 2.6
Total greenhouse gas emissions (Kyoto protocol) Mt CO2 eq S2 13.4 14.2 14.4 14.7 14.4Other greenhouse gas emissions not according to KyotoProtocol (Scope 1) Mt CO2 eq S2 0.1 0.1 0.1 0.1 0.1
Energy management
Energy consumption
PetajoulesLow Heating
Value S3 138 175 179 181 179
Energy efficiency index % S3 94 96 99 99 100
Air quality management
Nitrogen oxides – NOx Metric tons S4 11,098 12,210 12,679 10,980 11,548
Nitrogen oxides intensityKg per
€ EBITDA S4 0.0058 0.0063 0.0071 0.0068 0.0057
Sulfur oxides – SOx Metric tons S4 5,395 6,563 6,620 10,336 12,023
Sulfur oxides intensityKg per
€ EBITDA S4 0.0028 0.0034 0.0037 0.0064 0.0059
Non-methane volatile organic compounds – NMVOC Metric tons S4 4,968 6,781 7,158 7,464 7,974
Non-methane volatile organic compounds intensityKg per
€ EBITDA S4 0.0026 0.0035 0.0040 0.0046 0.0039
Water management
Freshwater withdrawal Million m3 S5 491 537 535 554 –
Freshwater withdrawal intensityLitres per€ EBITDA S5 0.26 0.28 0.30 0.34 –
Chemical oxygen demand Tons O2 S5 7,539 8,834 9,652 9,715 –
Chemical oxygen demand intensityKg per
€ EBITDA S5 0.0040 0.0045 0.0054 0.0060 –
Environmental incidents and remediation
Medium severity incidents with environmental consequences Number S6 40 46 55 – –Medium severity incidents with environmental consequencesin which the limits of the operating permit were exceeded Number S6 26 26 – – –
Environmental provision € million S6 737 730 723 636 800
SUMMARY TABLE1.
EXTRA-FINANCIAL STATEMENTS
SOLVAY 2016 Annual Integrated Report97

Units Notes 2016 2015 2014 2013 2012Hazardous materials management
Non-hazardous industrial waste1,000 Metric
tons S7 1,463 1,453 1,637 – –
Hazardous industrial waste1,000 Metric
tons S7 194.2 202.0 194.6 – –
Total hazardous industrial waste1,000 Metric
tons S7 1,657 1,655 1,831 – –Industrial hazardous waste not disposed of in a sustainableway
1,000 Metrictons S7 50.3 47.1 49.7 – –
Industrial hazardous waste not disposed of in a sustainablemanner
Kg per€ EBITDA S7 0.0265 0.0241 0.0279 – –
Substances of very high concern (SVHC) according to REACHcriteria present in products put on the market Number S7 20 20 25 23 –SVHC according to REACH criteria present in products put onthe market for which this presence is due to raw materials Number S7 10 10 18 39 –SVHCs reviewed for potential substitution with saferalternatives % S7 18 5 0 0 0
Employee health and safety management
Medical Treatment Accident Rate - Employee, contractorsand temporary workers (MTAR)
Accident permillion hours
worked S8 0.77 0.77 0.97 1.06 2.59
Lost time accident rate - employees, contractors, andtemporary workers (LTAR)
Accident permillion hours
worked S8 0.76 0.75 0.98 0.8 0.81
Fatal accidents Number S8 1 0 2 2 0Industrial Hygiene program: sites where hygiene specialistshave been trained to new industrial hygiene standards % S8 65 73 24 3 –Advanced Health Monitoring program: sites with advancedrisk based medical surveillance % S8 18 28 26 26 –
Employee engagement and wellness management
Solvay engagement index % S9 77 75 – 72 –
Coverage by collective agreement % S9 87.8 77 82.2 85 85
Community development managementSolvay Group donations, sponsorship, and own projects € million S10 7.38 5.25 – – –
Employees involved in societal actions % S10 23 20 – – –
Management of the legal, ethics, and regulatoryframeworkHSE compliance audits during last five years % S11 75 50 – – –HSE regulatory watch process in place % S11 82 50 – – –
Process safety, emergency preparedness, and responsePercentage of product lines having a risk analysis updated inthe last five years % S12 65 69 64 58 –
Number of "Risk Sheets Level 1" at the end of the year Number S12 46 94 217 11 111
Percentage of level 1 risk situations resolved within one year % S12 100 100 100 100 –
Risk level 1 situation resolved Number S12 98 232 23 111 111Site with a process safety management system correspondingto their risk level % S12 90 84 – – –
Process safety rate % S12 0.7 0.6 0.4 – –
Customer satisfactionNet Promoter Score % S13 27 24 14 – –
EXTRA-FINANCIAL STATEMENTS
98SOLVAY 2016 Annual Integrated Report

Solvay Way outlines the Group’s approach to sustainability. Itillustrates the integration of social, societal, environmental, andeconomic factors into the Company’s management, strategy,decision-making, and operating practices, with the objective ofcreating value that stands the test of time.
Solvay’s culture of responsibility is part of its historical identity.Starting at its inception, the Group pioneered a number ofinitiatives to benefit its workers, including the provision of internalsocial security (1878), the adoption of an eight-hour workday(1897), and the provision of paid vacation (1913). It was one of thefirst companies to engage employees in meaningful social dialogand has built a strong safety culture. These early experienceswere formative in shaping the Group's values and commitment tocorporate social responsibility. Throughout its 150-year history,Solvay adapted its business model to respond to societal trendsand concerns, reflecting its pioneering spirit. As it continues totransform itself today, the Company is guided by its past and isfocused on creating responsible sustainable value.
For Solvay, “Asking more from Chemistry” means beingresponsible in the way we act, innovate, generate value for ourkey stakeholders, and contribute broadly to science and society.Responsibility is a fundamental part of our identity. It is a valuethat manifests itself in our key choices and actions.
Our first scope of responsibility is the way our people manageour sites through Solvay Way. We have three key indicators:greenhouse gas intensity, safety, and people engagement.
We consider that we also have an impact in the way we manageour product portfolio. We create innovative sustainable solutionsthat should help our customers and society to answer today’schallenges. Our role is to turn these challenges into sustainablemarket opportunities, which in turn will help to propel ourrevenue and earnings growth over time.
Our conviction is that we are able to create economic value andthat this value is indeed enhanced as we make both scientificand social progress. It is our firm belief that, as a responsiblechemist, our broader contribution to society will ensure that ourleadership positions are enhanced.
Solvay has set voluntary external commitments:
For a responsible chemical industry: Solvayis committed to the “Responsible Care®” WorldCharter. This global chemical industry initiativeaims to achieve continuous improvement in the
safe handling of chemical substances from their initialdevelopment to their final use.
For human rights: Solvay participates in theUN Global Compact and is committed toupholding its principles, contributing to theemergence of a sustainable and inclusive globaleconomy which delivers lasting benefits topeople, communities, and markets.
For a global standard in sustainability: Solvay uses thevoluntary international standard ISO 26000 on socialresponsibility as its point of reference. This standard providesguidelines for organizations to operate in a socially responsiblemanner. Solvay Way incorporates the requirements of thisinternational standard.
SUSTAINABILITY MANAGEMENT2.
Sustainability at the heart of the Group’sculture
2.1.
150 years of transformation
Asking more from chemistry
Voluntary external commitments2.2.
EXTRA-FINANCIAL STATEMENTS
SOLVAY 2016 Annual Integrated Report99

For a responsible dialog: on December 17,2013, Solvay signed a Corporate Social andEnvironmental Agreement for the whole Groupwith IndustriALL Global Union. This agreement,one of the first of its kind in the chemical
industry, gives tangible expression to Solvay’s determination toensure that basic labor rights and the Group’s social standards inthe areas of health, safety, and environmental protection arerespected on all of its sites. This agreement applies to all Solvayemployees. Every year, a Solvay site is assessed to ensure thecommitments made by the Group are being applied correctly atgrassroots level, based on International Labor Organization (ILO)standards and the principles of the United Nations GlobalCompact (UNGC).
To ensure compliance with the IndustriALL Global UnionAgreement by all employees, it has been integrated as anemployee practice in the Solvay Way reference framework, andeach year the Solvay Way assessment evaluates how well it isdeployed and understood.
Improving young people’s chances of employment: atthe Enterprise 2020 Summit, the European Commissionand business leaders including Mr. Jean-Pierre Clamadieu,CEO of Solvay, launched the “European Pact for Youth” tocreate 10,000 partnerships between business andeducation to boost young people’s chances of employment.The initiative aims to improve the quality of training andskills that young people can acquire, including transversal,digital, entrepreneurial, green, and soft skills.
In 2015, along with other steps taken during the COP21conference in Paris to participate in the fight against globalclimate change, Solvay committed to reducing by 40% thegreenhouse gas intensity of its activities by 2025. The Group hasalso announced the adoption of an internal carbon price. SinceJanuary 2016, Solvay uses an internal price of €25 per metric tonof CO2 for all greenhouse gas emissions worldwide to account forclimate challenges in its investment decisions.
Reinforcing its commitment to operating responsibly andsustainably, Solvay has accelerated its efforts to reduce itsgreenhouse gas intensity in the run-up to the COP22 climatechange conference in Marrakech in November 2016: the Grouphas set an intermediary target of a one-fifth reduction ingreenhouse gas intensity by 2018.
European Pact for Youth
Solvay's commitment to reducing the greenhousegas intensity of its activities
EXTRA-FINANCIAL STATEMENTS
100SOLVAY 2016 Annual Integrated Report

As a member signatory of the UN Global Compact, Solvay has animpact and contributes to all of the UN Sustainable DevelopmentGoals (SDGs) through its daily business and its products and
solutions. Through its strategy, three circles of responsibility andmateriality analysis, Solvay has chosen to focus on seven of theUN’s 17 SDGs as particularly important in setting its performancetargets. In the following sections, SDG icons indicate links tospecific Solvay actions.
Baseline 2014
How Solvay supports the UN SustainableDevelopment Goals
How Solvay's strategic objectives for 2025 contribute to the SDGs
EXTRA-FINANCIAL STATEMENTS
SOLVAY 2016 Annual Integrated Report101

Solvay Way encompasses all aspects of the Group’s sustainableapproach to doing business. It ensures that social andenvironmental implications are integrated into the company’sstrategy, operations and decision-making. It is applied at all lifecycle stages of Solvay’s products, including design, manufacture,consumption of resources, application, and end-of-life. It alsotakes into account the consequences for society of theirmanufacture and use.
The presidents of each global business unit and the functionleaders are accountable for the effective implementation ofSolvay Way across their businesses and functions. Thedeployment is supported and overseen by Solvay’s SustainableDevelopment function. Further, the Sustainable Developmentfunction runs a global network of more than 200 “Champions”and “correspondents" drawn from across all businesses and
functions covering all key geographies. They play a key role inensuring the deployment of the Solvay Way approach and thesharing of best practices and experiences, and promotecollaborative working to ensure that processes and practices arecontinuously improved.
To drive improvement throughout the company, each businessunit, research center, function, and production site conductsannual self-assessments by reference to the Solvay Wayframework. The self-assessment findings are supplemented bythe results from internal audits and from independent assurancereviews. Findings – encompassing lessons learned, best practices,strengths, and improvement opportunities – are shared acrossbusinesses and functions and motivate a culture of continuousimprovement. The Sustainable Development function presentsthe key assessment results to the Executive Committee and theBoard of Directors.
Solvay Way approach and management2.3.Solvay Way, constantly improving how we do business
Solvay Way, constantly improving how we do business – A continuous improvement process based on four scales
EXTRA-FINANCIAL STATEMENTS
102SOLVAY 2016 Annual Integrated Report

Solvay Way also provides a framework, consistent with ISO26,000, based on stakeholder inputs on issues of sustainabledevelopment. Solvay has made 22 commitments to six majorstakeholders (customers, employees, investors, suppliers,communities, and the planet), translated into 49 associatedpractices. Solvay Way commitments are aligned with the interestsidentified for each stakeholder group, which are used as areference to help guide its actions.
Solvay’s Sustainable Development function is responsible forimplementing the findings and conclusions reached throughdialog with stakeholders to achieve progress.
To ensure rapid progress, the Group has integrated the goals ofsustainable development at every stage of people managementand business cycle.
Solvay Way is integrated into its people management processesand its Code of Conduct. The Group’s compensation policy links10% of the variable remuneration for all managers to SolvayWay assessment results. All employees benefit from an incentivelinked to financial and extra-financial targets. For seniorexecutives, 20% of Long Term Incentive will, with effect fromJanuary 2017, also be driven by improvement in the Group'sgreenhouse gas intensity.
Solvay Way allows for a deeper integration of the Group’ssustainability policy within the operational deployment of itsstrategy in the short, middle, and long term. For the businesscycle, Solvay assesses current products (portfolio and processes)and future spending (innovation, acquisitions) as part of its one-year outlook, using the Sustainable Portfolio Management (SPM)methodology. Afterwards, all these elements are audited.
Within the five-year business strategic plan, both the SPM andGroup targets performance will be challenged, priorities agreed,resources allocated, and improvement commitments secured.
Mobilizing employees at every level of the Company
Sustainability integrated in the managementprocesses
EXTRA-FINANCIAL STATEMENTS
SOLVAY 2016 Annual Integrated Report103

The Sustainable Portfolio Management (SPM) tool enables Solvayto make strategic decisions that steer its portfolio, supportprogress toward its sustainability objectives and integratesustainability into its operating decisions. Operating sustainablyalso broadens opportunities for business. Solvay providessolutions in a variety of specialty areas. As such, the Groupresponds to the sustainability needs of the marketplace byconceiving solutions that address changes in its environment,and that meet client and stakeholder expectations both todayand tomorrow.
Some examples include:
The SPM tool is the fact-based compass that enables Solvay toupgrade its product portfolio to achieve higher social andenvironmental standards, and to robustly and systematically mapsustainability concerns and opportunities in the marketplace,including from its own suppliers and customers.
The methodology aims at informing decision-makers so that theycan detect sustainability risks and opportunities along the entirevalue chain (cradle-to-grave), develop action plans, and deliverthrough innovation while balancing economic, social, andenvironmental values.
Within Solvay, Global Business Units (GBUs) are accountable fordelivering the ambitious Group target for sustainable businessperformance: by 2025, realize €1 of revenue out of every €2 inSustainable Solutions.
The information in this Report aligns with the recently publishedGRI Standards from the Global Reporting Initiatives. This reportalso offers an update on our implementation of the ten principlesof the United Nations Global Compact (UNGC), in accordancewith the Global Compact Advanced Level. More sustainabilityinformation is available on Solvay’s annual report website,including the GRI Content Index.
Unless otherwise stated, all social and environmental indicatorsare consolidated in the same way that Group sales are reported.The financial consolidation scope is described in thecorresponding section of this report. Where relevant, data is alsoreported using an operational scope, which consolidates allactivities under operational control even if not financiallyconsolidated.
Greenhouse gas (GHG) emissions are reported in accordancewith the World Business Council for Sustainable Development’s“Guidance for Accounting & Reporting Corporate GHG Emissionsin the Chemical Sector Value Chain”. By extension, otheremissions are reported according to the same guideline.
For accurate reporting, the convention adopted for selecting CO2emission factors related to acquired electricity meets thefollowing criteria (in decreasing order of priority):
Energy consumption components are converted into primaryenergy, with the following conventions:
Sustainable business solutions2.4.
familiar solutions, such as biodegradable products for soapsand shampoos and renewable-based solvents for paints andcoatings
complex solutions that ultimately enable consumers to reducetheir energy consumption, generate less food waste, orovercome the limitations of aging.
BASIS OF PREPARATION3.
Reporting principles3.1.
Reporting scope and boundaries
Greenhouse gas (GHG ) reporting principles
emission factors resulting from specific instruments such asgreen energy certificates
the emission factor obtained from contract agreements onspecific sources for which there is no emission of specificattributes
the emission factor of the contract with the supply chain orpower supplier
the emission factor which is calculated based on the non-attribute claimed production and reflects the mix after thesubtraction of certified products
if none of the above factors is available, the national emissionfactor published by national authorities, the InternationalEnergy Agency, or for the United States, the state’s emissionfactor as published by the United States EnvironmentalProtection Agency.
Energy reporting principles
fuels, using the net calorific values
steam purchased, taking into account the reference value ofboiler efficiency related to the fuel used for its generation (e.g.90% efficiency based on the net calorific value for natural gas)
electricity purchased, assuming an average efficiency of 39.5%for all types of power production except for nuclear power(33%), based on net calorific value (source IEA).
EXTRA-FINANCIAL STATEMENTS
104SOLVAY 2016 Annual Integrated Report

Chemlogic’s environmental data has been integrated as from2016.
The recently acquired Cytec operations (Technology Solutionsand Composite Materials GBUs) are being progressivelyintegrated in the Group’s environmental reporting. These arenot yet included in the figures of the following Notes, with the
exception of the three sites which were moved from theNovecare GBU to the Technology Solutions GBU (Oldbury,Charleston, and Zhanjiagang Henchang)
Category Moderate materiality High materiality
EnvironmentFuel managementWaste management and effluentsBiodiversity impacts
Greenhouse gas emissionsAir qualityEnergy managementEnvironmental accidents and remediationWater and wastewater managementHazardous materials management (including waste)
Social Capital
Access and affordabilityData security and customer privacyFair disclosure and labellingFair marketing and advertising
Customer satisfactionCommunity development (societal actions)
Human CapitalDiversity and inclusionRecruitment, development and retentionCompensation and benefits
Employee health and safetyEmployee engagement and wellness
Business Model andInnovation
Environmental, social impacts on assets and operationsProduct PackagingProduct quality and safety
Sustainable business solutions
Leadership and Governance
Systemic risk managementRegulatory capture and political influenceMaterials sourcingSupply chain management
Management of the legal, ethics & regulatory frameworkProcess safety, emergency preparedness & response
Priorities
Solvay bases its priorities for sustainability on a “materialityanalysis.” This approach identifies critical economic,environmental and social issues with potential to significantlyimpact Solvay’s performance and/or substantially influencestakeholders’ decisions. The analysis is performed and updatedeach year according to the Sustainability Accounting StandardsBoard (SASB) approach.
The analysis is coordinated by Solvay’s Sustainable Developmentfunction with an internal network of sustainability champions inthe business units and functions. Experts in each CorporateFunction have reviewed the analysis of each aspect, and aparticular attention has been given to consistency with theGroup’s risk analysis.
Environmental reporting principles
NOTE S4 Air quality management
NOTE S5 Water management
Note S7 Hazardous material management.
Materiality analysis3.2.
Process
EXTRA-FINANCIAL STATEMENTS
SOLVAY 2016 Annual Integrated Report105

The list of the Group’s main risks has been updated to reinforceconsistency with the materiality analysis.
As in 2015, the wording of the material issues has been keptconsistent with the SASB Materiality Map™, except in cases wherethe Group’s Executive Committee has made a decision to dootherwise during the validation step in order to broaden thescope of some material issues. For example, the high materialityissue labelled “Employee Engagement and Wellness” includesissues that are labelled “Labor Relations” and “Fair LaborPractices” in the SASB Materiality Map™.
In 2016, particular attention was paid to the work of the TaskForce on Climate-related Financial Disclosures (TCFD). Grouprepresentatives from the Corporate Finance function and theSustainable Development function participated in consultations
and various working groups. The TCFD published itsrecommendations on December 14, 2016, too late to beincluded in this report.
The 2015 Annual Report and the 2015 Complementary AnnualReport on Sustainable Development Information have beensubmitted to the GRI Review Service. The feedback was used toimprove the content and presentation of this report.
In 2015 Solvay won the “Best Belgian Sustainability Report” awardfrom the Belgian Institute of Registered Auditors; following this,a representative from Solvay joined the jury for the 2016 award.This participation made it possible to interact with the othermembers of the jury and learn more about their expectations forsustainability reporting.
The Group received questionnaires from investment funds in2016 relating to its position on substances of very high concern(SVHC), animal testing, and carbon pricing – issues alreadycovered in our reports.
Materiality analysis process
2016 updates
Stakeholder engagement3.3.Investors
EXTRA-FINANCIAL STATEMENTS
106SOLVAY 2016 Annual Integrated Report

The materiality analysis was presented in 2015 to a particulargroup of investors: descendants of the founding families of theSolvay group, who currently represent the largest group ofinvestors. Solvay used a dedicated social media platform topresent the analysis, submitting a questionnaire that asked themto rank material issues (high-moderate-low priority) as listed bythe SASB in their materiality approach. Their feedback ispresented in the 2015 Annual Report.
Engagement is fostered by regular dialog between the managersof the Group and the employees. More specifically, social dialogcovers dialog with employees’ representatives at four levels: sites,countries, Europe, and Group.
For more details about the main topics discussed in 2016, pleasesee the “Social dialog” section of this report.
The materiality analysis of the Group has been presented to theSustainable Development Commission for the Group’s EuropeanWorks Council. No particular comments have been made byemployee representatives on the materiality analysis.
Since 2013, Solvay is committed, through a Global FrameworkAgreement signed with IndustriALL Global Union, to respectingfundamental human rights resulting from ILO conventions andUN Global compact initiatives. Beyond the scope of itsemployees, Solvay expects that this agreement will ensure that itssuppliers and subcontractors respect the same rules. Of specialmention are the visits, organized twice a year in the Solvay siteswith the participation of IndustriALL officers, to assess thecompliance of Solvay with these principles.
Solvay engages in a constructive dialog with public authorities onissues of legitimate interest to Solvay. This includes participationin many trade associations at global and regional level, suchas the World Business Council for Sustainable Development(WBCSD), the International Council of Chemistry Associations(ICCA), BusinessEurope, and European Chemical Industry Council(Cefic). Examples:
The “Community Development” chapter of this report includesexamples of actions initiated locally, in the areas around our sites,within the framework of local community engagement.
Solvay CEO Jean-Pierre Clamadieu signed the “Alliance for YOUth”pledge in the presence of the European Commissioner MarianneThyssen. Solvay’s participation is one part of severalcommitments the Group has made, including the European Pact4 Youth, to stimulate policies on youth employability to enhancebusiness competitiveness.
Solvay puts its customers at the heart of its strategy and iscontinuing its shift towards greater customer centricity. Topursue this aim, Solvay organizes regular Group Tech Days withkey customers, who are best positioned to understand the needsof the end consumers, and who are driving the market trends.
These Tech Days aim to raise Solvay’s visibility as a solutionprovider and enhance its recognition as a strategic partner, bothfor its current product offering and for future customer-focusedco-innovations. During these events, Solvay focuses on ourcustomers’ challenges, which later enables us to match theirneeds.
In the last five years, Solvay has held about 20 Group Tech Dayswith leading players in such industries as automotive,aeronautics, oil & gas, agro, and coatings in Europe, Asia andthe Americas. These events have had a significant impact for thegroup, with more than 2,500 representatives of customers givingrise to tangible business opportunities for the group (e.g. throughjoint-development agreements).
Employees
Planet
COP22: Solvay confirmed its commitment to fighting climatechange at COP22 in Marrakesh. Participating in several high-level meetings with business leaders and ministers from acrossthe globe, Jean-Pierre Clamadieu highlighted the importantrole that innovation from the chemical industry andcollaboration between industry sectors can play inimplementing the Paris agreement.
United Nations Sustainable Development Goals: at itsheadquarters in Brussels, Solvay organized an internalworkshop on the 17 United Nations Sustainable DevelopmentGoals (UNSDGs). The objective of the half-day event was toraise awareness around the UN 2030 Agenda and see howthe five Solvay Sustainable Development targets (as well asthe whole list of the 13 materiality issues) fit in this globalframework. The workshop generated a helpful exchange withsome of the Group’s external stakeholders (United Nations,European Commission, European Parliament, CarbonDisclosure Project, Belgian Federal Institute for SustainableDevelopment, Corporate Social Responsibility Europe).
Communities
Customers
EXTRA-FINANCIAL STATEMENTS
SOLVAY 2016 Annual Integrated Report107

Below are some examples of engagement with suppliers:
SPM considers both:
To be considered a part of the “Solutions”, products must servein an application that demonstrates a direct, significant, andmeasurable benefit (social or environmental) to society at large.
They must not exhibit any sustainability concerns and must havea low environmental manufacturing footprint compared to thevalue they bring to society.
If a sustainability roadblock is identified, or if its environmentalmanufacturing footprint is too high, the product-applicationcombination (PAC) will be ranked in "Challenges".
The results of the SPM analysis are presented by a heat mapshowing the revenue breakdown by category: Solutions, Neutral,and Challenges.
The guide on Solvay SPM methodology will be finalized andpublished before summer 2017 and made available on the Solvaycorporate website.
Suppliers
A suppliers’ online satisfaction survey was conducted at theend of 2015. The survey sought to promote Solvay Waypractices and ensure balanced relationships with suppliers.Of the 790 suppliers invited to participate, 484 responded.Suppliers truly appreciate the strong relationship they havewith Solvay. Suppliers also took the opportunity to raise someareas for improvement, such as communication concerninggeneral news, business, forecasts, and new products.
On September 20, 2016, the Together for Sustainability (TfS)summit took place in Mumbai, India, to build awareness ofthe importance of creating a sustainable supply chain in thechemical industry. Over 500 participants attended theconference, including representatives from suppliers andmembers of the TfS organization, as well as local andinternational associations. For more information about the TfSinitiative, please see http://www.tfs-initiative.com.
Solvay organized an Excellence Award in Latin America event torecognize suppliers that provided exemplary logistics servicesin 2015. The awards were very well received, and generatedpositive feedback both internally and externally. Thisrecognition is put to good use by suppliers with respect to theirteams and customers.
NOTES TO THE EXTRA-FINANCIAL STATEMENTS4.
NOTE S1Sustainable Portfolio Management
How the methodology works
the environmental manufacturing footprint and its correlatedbusiness risks and opportunities,
the marketplace and how, in its specific applications, a productbrings sustainable benefits or faces challenges.
2016 SPM Heat Map
EXTRA-FINANCIAL STATEMENTS
108SOLVAY 2016 Annual Integrated Report

2018 mid-term
40%Raise the proportion of sustainable solutions to 40% ofGroup sales
2025
50%Generate at least 50% of the group sales in “SustainableSolutions”
Baseline 2014
Revenue breakdown by SPM heat map categories
% of turnover 2016 2015 2014Solutions 43 33 25Neutral 33 39 39Challenges 8 16 15Not evaluated 16 12 21
By the end of 2016, 43% of product-application combinationsin the assessed portfolio qualified as “Solutions”, a significantprogress compared with the previous year. This improvementcomprises:
SPM global and systematic assessment involves an evaluation ofthe portfolio in 2016 based on 2015 turnover. Changes in scopeduring the year are taken into account in the scope of 2016 SPManalysis.
Since 2009, Arthur D. Little (ADL), our partner in developing andimproving the SPM methodology, has performed in-depthverification of the Market Alignment results.
In 2016, ADL screened all the PACs in the database and selected150 PACS for deeper review, 100 with higher value for Solvaybased on multiple criteria, and 50 on a random basis. In addition,Solvay submits 50 PACs per year to ADL for review. All the PACsin the database will be reviewed at least every five years. By theend of 2016, ADL had reviewed 48 PACs.
ADL reaches the same conclusion for 89% of PACs, a morepositive conclusion for 9%, and a more negative conclusion for2%. The impact of the corrections is too small to affect publishedfigures.
SPM is designed to boost Solvay’s business performance anddeliver higher growth. Over the last three years, Solvay’s productshave experienced significantly different annual revenue growthrates depending on whether customers and consumers areseeking out Solvay’s products to match their unmet social orenvironmental needs.
Annual growth rate per SPM category:
(based on turnover with same product, same application, andsame SPM ranking over the last three years representing 45% ofGroup revenue).
SOLVAY’S STRATEGIC OBJECTIVES:
Results of the SPM analysis
six percentage points due to changes in scope (Cytecacquisition, Emerging Biochemicals and Acetow divestments)
two percentage point from non-recurring quick wins reflectingfaster growth in Solutions
two percentage points from innovation programs aimed atdeveloping more sustainable business.
External validation
Correlation between SPM analysis and salesgrowth
Solutions (unmet needs to achieve higher social orenvironmental standards): +9%
Challenges (sustainability concerns or roadblocks): -3%
EXTRA-FINANCIAL STATEMENTS
SOLVAY 2016 Annual Integrated Report109

The Corporate Sustainable Development function manages theSustainable Portfolio Management methodology and deploys itin close cooperation with Business Units and Functions in keyprocesses: Strategy, Research and Innovation, CapitalExpenditures, Marketing and Sales, and Mergers andAcquisitions. The SPM methodology is part of the Solvay Wayframework and helps to measure the maturity of Global BusinessUnits and Corporate Functions with regard to how wellsustainability is integrated into their business practices.
Solvay co-chairs two coalitions that are instrumental in setting theindustry reference framework for active portfolio management:
The Composite Materials (CM) GBU has the highest percentageof sales through sustainable solutions covering the two businesslines, Aerospace and Industrial; this is in line with Solvay’sexpectations when it acquired Cytec. The CM business provideslightweighting materials in Aerospace to reduce fuelconsumption. The industrial segment comprises applications forautomotive, tooling, and recreational products, among others.In automotive, CM products help make vehicles safer (thanks totheir excellent energy-absorbing capabilities) and improve theirfuel efficiency.
The market value of products in the CM portfolio versus theirenvironmental impact is very favorable, making them idealalternatives to more environmentally impactful products.
For CM, this was an opportunity to analyze its product portfoliowith fresh eyes. By asking new questions through SPM, CMgained a better understanding of how its products contribute,for example, to aircraft parts that are more durable and have alonger lifespan. These are additional sustainability features thatCM’s marketing efforts can leverage.
For CM, the journey is only beginning. SPM is supporting actionplans such as a deep dive to determine where CM wants to driveits product portfolio and more interactions with key accounts touse SPM findings as a growth lever to help them achieve theirown sustainability goals.
According to the latest figures from the International EnergyAgency (IEA Statistics 2015), transport accounted for 23% ofglobal CO2 emissions, of which road transport represents 75%.The majority of automotive exhaust gas is non-toxic, beingnitrogen (N2), water vapor (H2O), and carbon dioxide (CO2), butincomplete fuel combustion generates toxic substances such ascarbon monoxide (CO), unburnt hydrocarbons (HC), nitrogenoxides (NOx), and particulate matter. The latter item comprisesfine and ultrafine soot particles that cause serious healthproblems.
SPM in key Group processes
The SPM profile is an integral part of the strategic discussionsthat each of the Global Business Units holds with the ExecutiveCommittee.
Mergers and Acquisition (M&A) projects are also evaluatedthrough SPM to analyze the feasibility of the investmentaccording to the Sustainable Portfolio targets. As an example,Composite Materials was expected to deliver 86% of itsrevenue in Solutions according to the SPM analysis done priorto the acquisition of Cytec, and turned out to have reached84% when assessed in depth on its real performance in thefirst year after the acquisition.
Decisions about investments (capital expenditure above€10 million and acquisitions) made by the ExecutiveCommittee or the Board of Directors include a sustainabilitychallenge that encompasses an exhaustive SPM analysis of thecontemplated investment.
In 2016, 576 Innovation projects were evaluated with the SPMmethodology, accounting for 100% of projects for whichresources were allocated. Of those, 60% are expected todeliver additional revenue in Solutions.
In Marketing and Sales, SPM makes it possible to engagecustomers on sustainability fact-based topics aimed atdifferentiating and creating value for Solvay and the customer,such as climate change action, renewable energy, recycling,and air quality.
Towards a reference framework for activeportfolio management
The World Business Council of Sustainable Development’sPortfolio Sustainability Assessment initiative aims at creating ahigh standard and common framework to guide industries onits implementation as a specific methodology for the chemicalindustry. Benchmarking and sharing best practices amongpeers make the SPM methodology more robust and enablebetter decision-making.
TNO’s joint research program on Sustainable ChemicalProduct Performance aims at setting a reference methodologyfor measuring product performance, with a strong scientificbackground.
Business casesComposite Materials completes its first SPM analysis
OPTALYS® product range in road transport emissionscontrol
EXTRA-FINANCIAL STATEMENTS
110SOLVAY 2016 Annual Integrated Report

Internal combustion engines cannot be optimized for highest fuelefficiency and lowest emissions at the same time. The operatingconditions of modern automobile engines are optimized for fuelefficiency, and exhaust after-treatment devices, such as catalyticconverters and particles filters, are required to further reduceengine-out emissions to meet the WHO’s air qualityrecommendations. Solvay’s OPTALYS® range offers high-performance cerium and zirconium oxide products that supportthe new technologies for catalytic converters and particle filtersthat will enable the automotive industry to meet forthcomingemission reduction regulations for both diesel and gasolineengines in the USA, Europe, China, and India.
The Specialty Polymers GBU, working with Medacta International– a leading manufacturer of orthopedic implants, neurosurgicalsystems, and instrumentation – and independent sustainabilityconsultant Swiss Climate, completed a unique study comparingthe carbon footprint of single-use and reusable surgicalinstruments. The study challenges the perception that single-usemedical instruments have a more negative environmental impactthan reusable instruments.
Applying the ISO 14044 standard for life cycle assessment, thegroup focused its study on the cumulative environmental impactof a surgical instrument kit for knee replacement manufacturedby Medacta. The kit is available either with all-metal reusableinstruments (GMK®) or with single-use instruments (GMK®
Efficiency) injection molded from several high-performancemedical grade polymers from Solvay.
The study demonstrated that the annual CO2 equivalentemissions of the GMK® Efficiency single-use instrumentation areneutral when compared with the re-usable metalinstrumentation. The study made metal-to-plastic conversionmore viable for these applications. Additional input from SwissClimate found that the GMK® Efficiency single-useinstrumentation eliminates the need for repeated washing andsterilization, which can save up to 435 liters of water for eachsurgical knee procedure.
Aside from this conclusion on environmental impact, demand forsingle-use instruments is growing quickly due, in part, to theirpotential for reducing hospital-acquired infection.
Building on Solvay Specialty Polymers’ innovative products,Medacta’s latest innovation, GMK® Efficiency, demonstrates aconstant commitment to providing safe and highly competitivesolutions that deliver sustainable economics while respecting theenvironment.
In November 2015, Solvay set a new long-term objectiveregarding greenhouse gas emissions: to reduce its carbonintensity by 40% by 2025. Furthermore, from January 1, 2016,Solvay applies an internal price for CO2 emissions of € 25 permetric ton, to take into account climate challenges in itsinvestment decisions.
An externally verified and structured greenhouse gas emissionreporting system and responses to rating agencies such as theCarbon Disclosure Project help the Group to align its efforts onthe effectiveness of its greenhouse gas challenges.
The greenhouse gas emissions reported by Solvay correspondto the scope of the Kyoto Protocol and comprise the followingcompounds or compound families: CO2/ N2O/ CH4 / SF6/ HFCs/PFCs and NF3. To calculate the impact on climate change, thegreenhouse gas emissions are converted from metric tons tothe CO2 equivalent using the Global Warming Potential (GWP) ofeach gas as published by the Intergovernmental Panel on ClimateChange (IPCC) in its Fifth Assessment Report.
The indicator takes into account:
Specialty Polymers and surgical instruments
NOTE S2Greenhouse gas emission management
Definition of indicators for greenhouse gases(GHG)
direct emissions for each GHG released from Solvay’s industrialactivities (Scope 1 of Kyoto Protocol)
reporting of direct CO2 emissions, including emissions fromthe combustion of all fossil fuels as well as process emissions(e.g. thermal decomposition of carbonated products, chemicalreduction of metal ores)
indirect CO2 emissions related to the steam and electricitypurchased from third parties (Scope 2 of Kyoto Protocol). Forelectricity purchased, indirect emissions are calculated byapplying the market-based methods. For 2016, the calculationdoes not include the use of residual mix, the details of whichare not available.
EXTRA-FINANCIAL STATEMENTS
SOLVAY 2016 Annual Integrated Report111

Greenhouse gas emissions (Scope 1 & 2)
Mt CO2 equ. 2016 2015 2014Direct & indirect CO2 emissions (scopes 1 & 2) Mt CO2 10.9 11.6 11.7Other greenhouse gases (Kyoto Protocol) emissions (scope 1) Mt CO2eq 2.4 2.6 2.7Total greenhouse gases (Kyoto Protocol) emissions Mt CO2eq 13.4 14.2 14.4Other greenhouse gases (non-Kyoto Protocol) CO2 emissions(scope 1) Mt CO2eq 0.1 0.1 0.1
Scope: The manufacturing activities of the companies that are currently consolidated (fully or proportionately). The greenhouse gas emission of the companiesin the financial perimeter represents 83% of the total greenhouse gas emissions of all companies in the operational perimeter.
In 2016 greenhouse gas emissions were 0.8 Mt CO2 eq. lowerthan in 2015. This change is explained mainly by changes inthe reporting scope, which now includes recently acquired Cytecactivities and seven newly added sites, for an increase of 0.4Mt CO2 eq. The divestment of precipitated calcium carbonateactivities and the classification in discontinued assets of
chlorovinyl activities in Thailand and at Acetow led to a decreaseof 0.9 Mt CO2 eq. The rest of the variation (-0.3 Mt CO2 eq.) islinked to emission reduction projects and production changes.
2018 mid-term
- 20%Reduce greenhouse gas intensity by 20% in comparisonwith 2015
2025
- 40%Reduce greenhouse gas intensity by 40% in comparisonwith 2014
Greenhouse gas intensity
In kg CO2 eq / € EBITDA 2016 2015 2014Greenhouse gas intensity 5.86 7.26 8.08
Legend: The greenhouse gas intensity indicator covers Kyoto Protocol greenhouse gases.
Solvay’s 2020 target is to reduce the energy consumption by10% (1.3% per year on average). The reference year is 2012at constant activity scope. To achieve this objective, Solvay willstep up its SOLWATT® energy efficiency program, continuouslyoptimize its industrial processes, develop clean technologies, andincrease the share of renewables in its energy production andsupply.
Solvay has taken concrete steps in the form of large technicalinvestments, such as the recent purchases of two cogenerationunits, one in Spinetta (Italy) and one in Massa Carrara (Italy),and the construction of a cogeneration unit in Oldbury (UnitedKingdom).
Greenhouse gas intensity
SOLVAY’S STRATEGIC OBJECTIVES:
Key achievements:in the trona mine at Green River (Wyoming, United States),partial recovery of the methane emitted during the extractionand combustion of trona has avoided emissions equivalent to100,000 metric tons of CO2 eq. per year since 2011. Since 2012a portion of the heat from the combustion of the recoveredmethane has been used in the manufacturing process,bringing additional energy and CO2 savings
in Brazil, Solvay has developed and operates a biomass-firedcogeneration unit using sugarcane bagasse
thanks to a SOLWATT® energy and carbon efficiency programand other greenhouse gas emission savings from processes,savings are estimated at 100,000 metric tons of CO2 in 2016.
NOTE S3Energy management
EXTRA-FINANCIAL STATEMENTS
112SOLVAY 2016 Annual Integrated Report

Energy consumption is made up of four components:Since 2016, steam and electricity generated from fuels and soldon to a third party are deducted from the total. Energy thatis purchased and sold to a third party afterwards without anytransformation is not accounted for.
In petajoules low heating value (PJ) 2016 2015 2014Energy consumption 138 175 179
Scope: This indicator shows the primary energy consumption over a given year related to the manufacturing activities of the companies that are currentlyconsolidated (fully or proportionately).Legend: The primary energy consumption of the companies in the financial sphere represents 77% of the total primary energy consumption of all companiesin the operational sphere.
In 2016, energy consumption was 37 PJ less than in 2015. Thischange is attributable mainly to a single change in the reportingmethodology and to changes in the reporting scope. To complywith GRI standards, the amount of energy sold to third parties (23TJ) is now deducted from the total. The inclusion in the reportingscope of recently acquired Cytec’s activities and seven newly-added sites accounted for an increase of 6 PJ. The divestmentof precipitated calcium carbonate activities and the classificationin discontinued assets of chlorovinyl activities in Thailand and atAcetow led to a decrease of 16 PJ. The rest of the variation (-4 PJ)is linked to energy savings projects and production changes.
2020
- 10%Reduce energy consumption by 10% at constantactivity scope
Baseline 2012
Energy intensity covers primary energy from fuels (coal, naturalgas, fuel oil, etc.) and from purchased steam and electricity.
Energy efficiency index – Baseline 100% in 2012
In % 2016 2015 2014Energy efficiency index 94 96 99
Legend: Energy index at constant activity scope reflects the change in energy consumption on a comparable basis after adjusting the historical scope to takeinto account scope changes and making adjustments for changes in production volumes from one year to the next.
In 2016, the Group launched its second energy and carbonefficiency program, SOLWATT 2.0®. Energy performancecontracts were signed between Solvay Energy Services and theother GBUs to ensure that the findings of the energy audits areimplemented. The plan follows three approaches in parallel:
In 2016, the Soda Ash & Derivatives GBU significantly enhancedthe energy performances of the soda ash plant in Devnya,Bulgaria, with its World Class Factory plan. New cogenerationunits such as those in Ospiate and Porto Marghera (Italy) are alsobeing studied.
Definition of indicators for energy
non-renewable primary fuels (coal, natural gas, fuel oil, etc.),which are used for internal production of steam, electricity andmechanical energy, and in manufacturing processes (coke inlime kiln, gas in dryers, etc.)
renewable primary fuels (biomass, biogas, etc.)
purchased steam
purchased electricity.
Energy intensity
SOLVAY’S OBJECTIVE:
Reduction of energy consumption
by developing the use of high-efficiency cogeneration plans,the Group is improving the generation efficiency of secondaryenergy such as steam and electricity. In 2016, a newcogeneration unit based on a gas-fired engine was put intooperation in Livorno, Italy, to replace conventional boilers.
The SOLWATT® program aims to identify and implementenergy savings in existing manufacturing units, throughtechnological improvements and management behavior. Bythe end of 2015, SOLWATT® had been gradually rolled out andnow covers almost all of the Group’s manufacturing sites.
new and remodeled plants are being optimized for energyconsumption and generation.
EXTRA-FINANCIAL STATEMENTS
SOLVAY 2016 Annual Integrated Report113

Solvay has committed itself to improving air quality at the localand regional levels, in close cooperation with local stakeholdersand according to industry best practices. In the framework of itsenvironmental plan, Solvay focuses on the following pollutants:nitrogen oxides (NOx), sulfur oxides (SOx), and non-methanevolatile organic compounds (NMVOC).
Absolute air emissions
In metric tons 2016 2015 2014Nitrogen oxides – NOx 11,098 12,210 12,679Sulfur oxides – SOx 5,395 6,563 6,620Non-methane volatile organic compounds – NMVOC 4,968 6,781 7,158
There are several reasons for improvements with respect tonitrogen oxides, including:
The improvements for sulfur oxides result from the following:
The improvements for NMVOC result from the following: :
2020
- 50%of nitrogen oxides emissionsintensity
2020
- 50%of sulfur oxide emissions intensity
2020
- 40%of non-methane volatile organiccompound emissions intensity
Baseline 2015
NOTE S4Air quality management
Nitrogen oxides: sum of nitrogen oxide emissions (NO and NO2,expressed as NO2) excluding N2O. Nitrogen oxide emissions resultmainly from the combustion of fossil fuels such as natural gas. Nitrousoxide (N2O) contributes to global warming but does not have theacidification impact of NO and NO2
Sulfur oxides: emissions of sulfur oxides (SO2) arise mainlyfrom the combustion of anthracite or coal
Non-methane volatile organic compounds (NMVOC): Volatile organiccompounds (VOCs) have a standard boiling point inferior or equal to250°C (EU Solvent Directive 1999/13/EC). NMVOCs are VOCs other thanmethane.Methaneemissions fromSolvay'sminingactivityatGreenRiver(Wyoming, United States) are not included. Their impact is integrated inthe GHG emission indicator.
at the Devnya – Deven site in Bulgaria (-291 metric tons): loweroperation of the older “grate firing boilers” and higher streamfactor of the CFBB (circulating fluidized bed boiler) equippedwith a SNCR (selective non-catalytic reduction) system usingammonia injection
at the Torrelavega site in Spain (-270 metric tons): replacementof the gas turbine of the cogeneration plant
at the Rheinberg site in Germany (-127 metric tons): selectionof a better coal quality and optimization of the SNCR process
at the Tavaux site inFrance (-717 metric tons): coal consumption halvedbecause of technical issues in the boilers and the installation of DeSOx(desulfurization) unit in November 2016.
at the Rheinberg site in Germany (-218 metric tons): operation of thecoal boiler with low-sulfur coal and optimization of the DeSOx process.
the majority of the reduction on this indicator (-1181 metrictons) is due to the deconsolidation of the Acetow business
at the Zhangjiagang Feixiang site in China (-262 metric tons):reduction of methyl chloride emissions due to theimplementation of a cryo-condensation unit in August 2016.
SOLVAY’S OBJECTIVES:
EXTRA-FINANCIAL STATEMENTS
114SOLVAY 2016 Annual Integrated Report

Air emissions intensity
In kg per € EBITDA 2016 2015 2014NOx 0.0058 0.0063 0.0071SOx 0.0028 0.0034 0.0037NMVOC 0.0026 0.0035 0.0040
Solvay's 2016 achievements for NOx and NMVOC intensity are better than the expected 2016 target, whereas for SO2 the Group is slightlybehind the target.
The Group has a Company-wide water policy that includes acommitment to limiting freshwater withdrawals andconsumptions, and to ensuring that the quality status of thewater bodies where effluents are discharged remains good, sothat the impact on humans and natural biota is minimized.
Solvay’s 2015-2020 environmental plan focuses on reducing twoimpacts: freshwater withdrawal, and chemical oxygen demand(COD) emissions. The number of sites potentially exposed towater scarcity is no longer reported, as it reflected a Solvayinternal program with an indicator that cannot be benchmarkedagainst peers.
Water intake and discharge
2016 2015 2014Freshwater withdrawal (million m3) 491 537 535Chemical Oxygen Demand (COD) emissions (metric tons O2) 7,539 8,834 9,652
Due to a change in corporate reporting rules regarding wastewater plants treating effluents from third parties, the COD on thesite of Spinetta-Marengo (Italy) has been recalculated over thewhole period 2014-2016.
The Group’s recent improvement in freshwater intake wasachieved thanks to:
Because of an increased production volume, there was a higherwater intake (+ 7.6 million m3) at the Chalampé site in France.
The Group’s improvement for COD emissions is due to thefollowing beneficial effects:
NOTE S5Water management
Freshwater withdrawal (million m3/year): this is the amount ofincoming water from freshwater sources (surface andgroundwater) and from alternative sources such as drinkingwater.
Chemical Oxygen Demand: this is the amount of reducingsubstances (mainly dissolved organic matter) discharged toaqueous receivers. COD is expressed as metric tons of oxygenper year. In addition to nitrogen and phosphorus species, CODcontributes to aquatic eutrophication.
deconsolidation of the divested Acetow (-29.6 million m3) andEmerging Biochemicals (-3.4 million m3) businesses;
decommissioning or sale of different sites (Bussi sul Tirino, BadZurzach, etc.) for a total of -8.8 million m3;
mothballing of the soda ash plant at Alexandria (Egypt) sinceMarch 2015 (-1.8 million m3).
the Vernon site in the USA (-517 metric tons): reduction inproduction volume and improvement of the efficiency of thewaste water treatment unit;
mothballing of the soda ash plant at Alexandria (Egypt) sinceMarch 2015 (-334 metric tons);
deconsolidation of the divested Acetow and EmergingBiochemicals businesses (-211 metric tons).
EXTRA-FINANCIAL STATEMENTS
SOLVAY 2016 Annual Integrated Report115
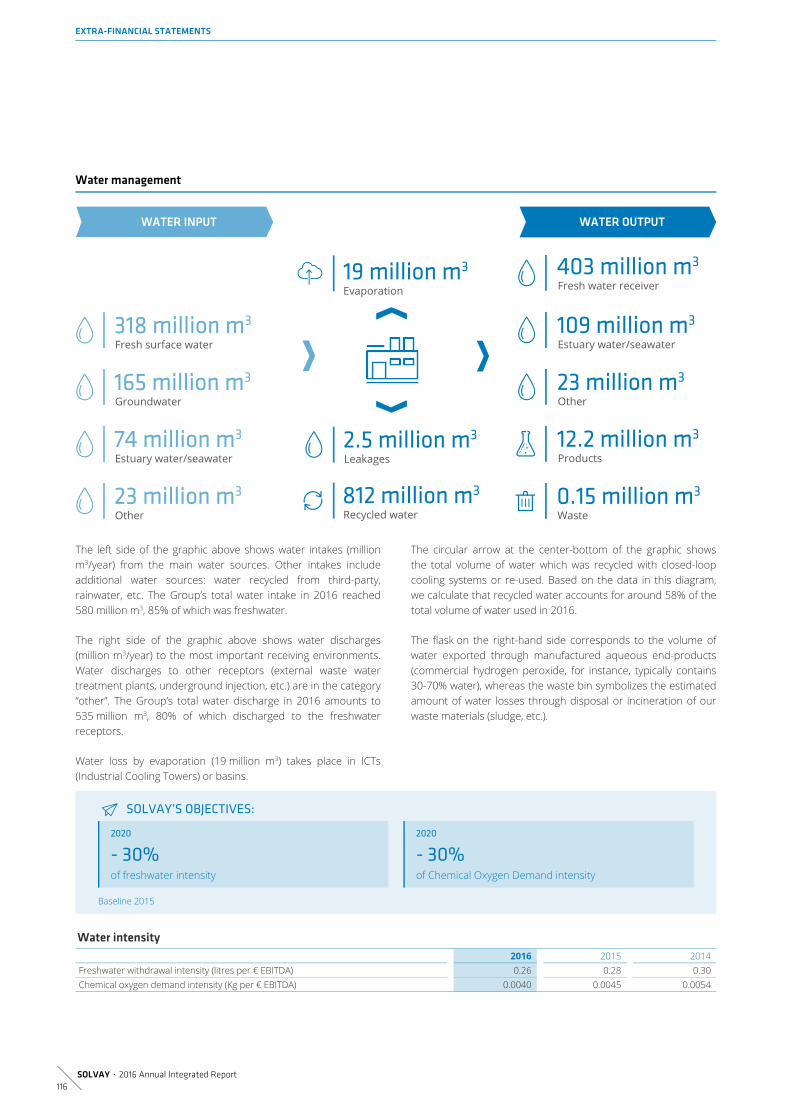
The left side of the graphic above shows water intakes (millionm3/year) from the main water sources. Other intakes includeadditional water sources: water recycled from third-party,rainwater, etc. The Group’s total water intake in 2016 reached580 million m3, 85% of which was freshwater.
The right side of the graphic above shows water discharges(million m3/year) to the most important receiving environments.Water discharges to other receptors (external waste watertreatment plants, underground injection, etc.) are in the category“other”. The Group’s total water discharge in 2016 amounts to535 million m3, 80% of which discharged to the freshwaterreceptors.
Water loss by evaporation (19 million m3) takes place in ICTs(Industrial Cooling Towers) or basins.
The circular arrow at the center-bottom of the graphic showsthe total volume of water which was recycled with closed-loopcooling systems or re-used. Based on the data in this diagram,we calculate that recycled water accounts for around 58% of thetotal volume of water used in 2016.
The flask on the right-hand side corresponds to the volume ofwater exported through manufactured aqueous end-products(commercial hydrogen peroxide, for instance, typically contains30-70% water), whereas the waste bin symbolizes the estimatedamount of water losses through disposal or incineration of ourwaste materials (sludge, etc.).
2020
- 30%of freshwater intensity
2020
- 30%of Chemical Oxygen Demand intensity
Baseline 2015
Water intensity
2016 2015 2014Freshwater withdrawal intensity (litres per € EBITDA) 0.26 0.28 0.30Chemical oxygen demand intensity (Kg per € EBITDA) 0.0040 0.0045 0.0054
Water management
SOLVAY’S OBJECTIVES:
EXTRA-FINANCIAL STATEMENTS
116SOLVAY 2016 Annual Integrated Report
Solvay’s 2016 achievement for freshwater intake intensity isslightly better than the expected 2016 target. For the CODemission intensity, our progress is even 8 % better than foreseen.
The Group pursues two courses of action: preventing accidentalspills and remediating contaminated subsoils.
The first course of action relies on two voluntary approaches that,when combined, are good practices in our industry:
Number of incidents with environmental consequences
2016 2015 2014Number of medium severity incident with environmental consequences 40 46 55
of which with operating permit exceedance 26 26 No data
Scope: Solvay Group Manufacturing and Research and Innovation sites under operational control. The consolidated data for process safety incidents covers132 sites out of a total of 143 operational sites.
In mid-2014, Solvay set up a new reporting system for processsafety incidents, with specific criteria for incidents withenvironmental consequences. No H or C severity incidents havebeen reported, meaning there has been no long term damage offsite for the environment. We succeeded in reducing M incidentsand incidents incurring releases above permit limit.
Soil contamination "legacies" is very carefully managed, with along-term vision, to protect health and the environment. Solvay'smanagement aims to
Solvay always carries out detailed risk assessments as a key steptowards selecting the most appropriate management measures.
NOTE S6Environmental accidents and remediation
Preventing spills
1. Identifying and remediating the highest risk situations, relyingon a voluntary environmental risk assessment program. Thisprogram is monitored at the Group level via the numberof identified and resolved "Risk Sheet 1 situations" ("leadingindicator"). The Group policy requires such situations to beresolved within one year.
2. Managing risks using records and lessons learned fromprevious accidents. Accidents and incidents are monitoredusing a standardized classification ("lagging indicator"). Ascorrective actions, every exceedance of a permit limit isspecifically examined at the GBU level and by the zone HSE
management team to ensure adequate actions are taken toavoid recurrence. Such events are part of the dashboardregularly transmitted to the Executive Committee.
Risk assessment indicator (leading indicator): this indicatormonitors the environmental risk assessments that started in2015, using new Group criteria to determine unacceptablerisks and a comprehensive method to complete riskassessments at all sites, taking account of substances andspecific parameters. Only one new Level 1 environmental risksheet situation was identified in 2016. The mitigation measureswill be defined and implemented within one year. Solvay willensure that the effectiveness of the implemented correctivemeasures is maintained over time. There is a new processfor identifying Risk Level 1 for the environment, and theassessment is currently being completed for the sites for whicha compliance audit has been performed (75% of the industrialsites - see Note 13). A very limited number of Risk Level 1incidents are expected.
Following up incidents with environmental consequences(lagging indicator): since 2014, process incidents withenvironmental consequences have been monitored andclassified according to a scale based on various criteria, suchas quantity of material spilled, consequences on site or offsite, damage to the immediate vicinity, and dead fish. Incidentsare classified by severity (from M - medium severity to C -highest severity). Within the medium severity classification, aspecific criterion is used to reflect events that will lead to theexceedance of permit limits.
Protecting and remediating the subsoil
1. prevent any new soil contamination
2. precisely characterize soil conditions whenever needed atboth active and closed sites, and
3. manage soil and/or groundwater contamination so as toprevent any further dispersion in surrounding areas.
EXTRA-FINANCIAL STATEMENTS
SOLVAY 2016 Annual Integrated Report117

Finding innovative remediation approaches is a permanent goal,for example via the EU research project Nanorem, which is nowcoming to an end. This research project is giving us more insightinto the application limits of a remediation technology for treatingcontamination by chlorinated compounds, based on injectingnanoparticles of iron into the soil subsurface.
Solvay manages soil contamination, and environmental financialprovisions (mainly dedicated to the management of soilcontamination), with a long-term vision. Provisions remainedstable between 2015 and 2016, with slight changes mainly due tofinancial factors (exchange rate movements). Increases between2014 and 2015 were also due to financial factors (discount andexchange rates), and to scope changes.
Environmental provisions
In € million 2016 2015 2014Environmental provisions 737 723 713
Legend: Provisions are reviewed on a quarterly basis in accordance with the IFRS norms.The provisions for recently acquired Cytec are included in the 2016figures.
Solvay currently places over 13,000 products on the market.Solvay is committed to a comprehensive understanding andmanagement of the hazards, risks, and applications related tohazardous materials. Solvay's management of hazardoussubstances addresses the different steps in the value chain.Substances of very high concern (SVHC) in particular are subjectto dedicated management approaches as regards: (1) use as rawmaterials, (2) placing on the market and possible substitution,(3) handling during manufacturing, and (4) managing hazardouswaste. In addition, Solvay pursues a strategy of decreasing theuse of hazardous substances in value chains, and of maintainingconsistent safety information on hazardous substances.
Solvay continues to proactively assess its portfolio of activities(Sustainable Portfolio Management assessment) in order toorient strategic investment and portfolio decisions towardsgreater sustainability. This means scrutinizing, for every newmarketed product, a series of sustainability criteria: SPM is usedto assess every product in each application, including for thepresence of SVHCs in downstream value chains (either stemmingdirectly from the presence of substances of very high concern inSolvay products or from components other than Solvay productsassociated in the final solution on the market).
Solvay centrally manages product safety information for allhazardous substances. This is key to ensuring adequatemanagement of these substances, both in Solvay operations andalong value chains. The following management elements havebeen reinforced and are now fully effective (except for therecently acquired Cytec):
Solvay implements a global voluntary approach for theapproximately 300 substances of very high concern in productsand raw materials, meaning it keeps updated inventories ofSVHCs handled by Solvay operations on the basis of an updatedreference list, handles SVHCs under strictly controlled conditions,and updates risk studies for all SVHCs and where possiblereplaces them with safer alternatives.
Environmental financial provisions
NOTE S7Hazardous materials management
Portfolio strategy
Information on hazardous substances:extended rules
standardized Safety Data Sheets, using shared rules andmodels across the Group
automatic Safety Data Sheet authoring and distribution (rulesfor classification, automatic distribution according to thecountries of sale, Global Labeling System, etc.)
consistent product labels that comply with regulatoryguidelines worldwide
common regulatory data, toxicological and ecotoxicologicaldata, and phrases library.
Substances of very high concern (SVHCs)voluntary approach
EXTRA-FINANCIAL STATEMENTS
118SOLVAY 2016 Annual Integrated Report

The group-wide reference list for SVHCs was established in 2015.To date, 133 sites (77%) have cross-checked their inventory.Solvay’s proactive approach to anticipating substitutionconstraints uses three categories (black, red and yellow) tocharacterize substances’ level of risk management and control:
Business units continuously run programs aimed at the proactivemanagement of SVHCs put on the market, ensuring businesscontinuity while respecting legal duties, Solvay's ResponsibleCare® policies, and sustainable development.
Solvay's programs also aim to have risk studies and to assesspossible substitution alternatives for every new SVHC put on themarket: the 2020 target is to complete 100% of risk assessmentsand analyze possible safer alternatives when available (target2016: 15%). Inventories of SVHCs in marketed products areestablished annually and Analysis of Safer Alternatives (ASA) isperformed accordingly.
2020
100%Complete 100% of risk assessment and analysis ofpossible safer alternatives when available for marketedproducts containing SVHC
Baseline 2015
Number of Solvay's substances of very high concern (SVHC) placed on the market in 2016
SVHCs in products on themarket
For which the SVHCs comefrom raw materials
All SVHCs (list according to REACH registration and EU Authorization process + EUcandidate list)(1) 20 10ASA program for marketed substances(2) (% of completion) 18% (9/49 required assessments)
Scope: Cytec is not included.Scope: All Solvay products - except recently acquired Cytec - put on the market, that are either manufactured by Solvay or form part of the composition of theproducts sold.Legend: SVHCs manufactured by or forming part of the composition of products sold by Solvay worldwide, currently in Europe's "Candidate List" or"Authorization list" of the REACH process. REACH is a regulation of the European Union, adopted to improve the protection of human health and theenvironment from the risks that can be posed by chemicals.(1) The Candidate List includes substances that are also present in the EU restriction process (annex XVII).(2) Analysis of Safer Alternatives for potential substitution of SVHC.
In the context of the 2015-2020 environmental plan, the focus ison industrial waste, and particularly on hazardous waste that isnot disposed of sustainably.
Black list SVHCs: already undergoing a regulatory process ofphasing-out or restriction, with a known deadline in at leastone given country or zone
Red list SVHCs: currently included in regulatory lists ofsubstances that could enter into a process of specialauthorization or restriction in the medium term
Yellow list: substances requiring specific attention (SRA), i.e.substances under scrutiny by authorities, NGOs, scientists, andindustries due to their current hazard properties or potentialeffects.
SVHCs in marketed products
SOLVAY’S OBJECTIVE:
Hazardous and non-hazardous waste Industrial waste: waste stemming from our productionactivities, including packaging and maintenance waste.Industrial waste is composed of a hazardous and a non-hazardous fraction. Industrial waste excludes waste from ourmining activities (541 metric ktons over 2016), which iscomposed almost exclusively of inert materials backfilled intothe mine.
Hazardous industrial waste not disposed of sustainably: of thetotal hazardous industrial waste that is landfilled or incineratedwithout energy recovery.
EXTRA-FINANCIAL STATEMENTS
SOLVAY 2016 Annual Integrated Report119

Absolute volumes
In 1,000 metric tons 2016 2015 2014Non-hazardous industrial waste 1,463 1,453 1,637Hazardous industrial waste 194.2 202.0 194.6Total hazardous industrial waste 1,657 1,655 1,831Industrial hazardous waste not disposed of in a sustainable way 50.3 47.1 49.7
Important corrections were made to the hazardous waste datafrom Chalampé-Butachimie as they were previously notexpressed as dry matter.
The increase at Group level between 2015 and 2016 (+2,400metric tons or +10%) for hazardous industrial waste which islandfilled or incinerated without energy recovery is the resultanteffect of many increases and decreases at individual sites, toomany to be described.
2020
- 30%of industrial hazardous waste not disposed of in asustainable way
Baseline 2015
The 2020 objective is based on known perimeter changes andon estimates of waste reduction projects and recycling initiatives.The target estimate does not include the contribution from theCytec Legacy, which is not yet known.
Waste intensity
In kg per € EBITDA 2016 2015 2014Industrial hazardous waste not disposed of in a sustainable way 0.0265 0.0241 0.0279
Solvay’s 2016 achievement for this type of waste is around 10%behind the 2016 target schedule. It has to be noted that trends inwaste indicators should be interpreted with great care as wastemight be stocked temporarily on sites, presenting spikes dueto turn-around operations or to changes in waste classification(hazardous / non-hazardous).
Solvay has just initiated a corporate waste initiative, in whichexperts from the corporate environment and the Purchasing &Supply Chain Excellence departments will make an inventory ofwaste streams and waste management suppliers. The goal is toidentify opportunities to reduce waste volumes, to recycle as, forexample, by-product), and also to cut overall waste treatmentcosts. This program should contribute to the improvement of thewaste indicator.
Dedicated rules define how SVHCs must be handled in Solvay'sindustrial operations in order to protect the health of thepersonnel.
Solvay's 2025 priority target is an MTAR (Medical TreatmentAccident Rate) lower than 0.5, continuous improvement in Solvayemployee safety, and a halving of the accident numbers recordedon our sites. Solvay's main focus is on the MTAR because thisindicator takes into account the actual severity of accidents anddoes not depend on the local legal context (or practices ofadapted work), which does, however, influence the Lost TimeAccident Rate (LTAR) indicator.
SOLVAY’S STRATEGIC OBJECTIVE:
Handling SVHCs in operations
NOTE S8Employee health and safety management
The challenge to improve further in occupationalsafety
MTAR: number of work accidents leading to medical treatmentother than first aid per million working hours.
LTAR: number of work accidents with lost time (away fromwork) of more than one day per million working hours.
EXTRA-FINANCIAL STATEMENTS
120SOLVAY 2016 Annual Integrated Report

2025
0.5Halve the number of accidents involving medical treatment and reach an MTAR of 0.5
Occupational Accidents at Group Sites
2016 2015 2014Medical Treatment Accident Rate (MTAR) 0.77 0.77 0.97Lost Time Accident Rate (LTAR) 0.76 0.75 0.98
Scope: All sites (including recently acquired Cytec in 2016) in Solvay's operational control for which the Group manages and monitors safety performance. Thisrepresents 235 manufacturing, R&I, administrative and closed sites - Solvay employees and contractors working on sites. The recently acquired Cytec activitieshave been included as from 2016.
Unfortunately, one fatal accident occurred in 2016 in a lift at aproduction facility in India.
In order to best ensure the safety of its employees and earna spot amongst the industry’s top players, Solvay has set anambitious new MTAR target for 2025 and will strengthen itsimplementation of the Solvay Life-Saving Rules introduced in2015.
The Group safety excellence plan has been deployed since 2015.It pursues three key courses of action with the goal of furtherreducing the MTAR and preventing any high severity accident:
All global business units (GBUs) and sites have defined theirdedicated HSE roadmap and have implemented a range of goodsafety practices, in particular:
The Group is making the reporting and investigation of nearmisses a standard process, focusing particularly on those witha potential for serious injuries. In 2016, 423 near misses werereported.
In 2017, it will also launch a series of actions on preventing handinjuries (training, sharing of best practices, and risk awareness),as these represent 50% of total Medical Treatment Accidents(MTA) and their prevalence has increased since the integration ofCytec.
To control potential exposure to chemicals, by 2020 Solvay aimsto complete all risk assessments at the workplace and managethem using the new Solvay standards for industrial hygiene.Hence, the Industrial Hygiene program relies on the followingmeasures, with a particular focus on substances of very highconcern:
SOLVAY’S STRATEGIC OBJECTIVES:
Safety excellence plan
Deployment of Health, Safety, and Environment (HSE)roadmaps in every unit
Clear communication of management expectations
Development of a safety mindset.
safety days (163 sites in 2016)
formalized behavioral safety programs (146 sites in 2016)
commitment by all managers to promote safety (leadershipsafety visits program: 1,580 LSV in 2016), together with safetytours, modeling exemplary behavior, and visibly implementingsafety measures
enforcement of Solvay Life-Saving Rules (started in 2015), toprevent fatalities and high-severity accidents
Industrial hygiene and occupational healthIndustrial hygiene
chemical inventories, with a special focus on the substances ofvery high concern that have a detrimental impact on people'shealth (Solvay Health-SVHC);
standardized and effective tools for screening potential riskof overexposure to chemicals: CTES (Critical Tasks ExposureScreening) is used to quickly spot situations where exposureto chemicals requires special attention and additional controlmeasures
risk assessment for identified potentially critical situations andfor all potential exposure to Solvay Health-SVHC substances;
a new Solvay application (SOCRATES), giving wide and easyaccess via the Intranet to all methods, tools, and databases.
EXTRA-FINANCIAL STATEMENTS
SOLVAY 2016 Annual Integrated Report121

Solvay pursues a voluntary objective of ensuring that medicalsurveillance, most often ensured by external medical services,follows Solvay evolving standards. In particular, Solvay's advancedpolicy requires that the periodic medical surveillance of everyemployee is increasingly adapted to individual health risk profiles,with particular attention to SVHC, noise, and safety-sensitive jobs.Such risk profiles are established in the framework of the in-house Group program for industrial hygiene. This Solvayprogram, and the standardized assessment of workstations, hasbeen leading the way for years amongst industry peers.
As a prerequisite, health teams working for Solvay need accessto occupational hygiene data. Interfaces between the informationtools used by health teams and the new Solvay hygiene IT tooland data, at every site, are an important element of the program.An increasing proportion of sites and medical teams areequipped to perform such advanced medical surveillance, basedon Solvay's standardized industrial hygiene assessments.
2020
100%of sites with an advanced risk-based medicalsurveillance
Health and industrial hygiene programs
In % 2016 2015 2014Industrial Hygiene program: sites where hygiene specialists have been trained to newindustrial hygiene standards 65 73 24Advanced Health Monitoring program: sites with advanced risk based medicalsurveillance 18 28 26
Scope: All sites under operational control.
The pullback in 2016 of both programs is linked to the integrationof Cytec, which will start implementing Solvay's standards in 2017.
Solvay's SVHC list includes all substances that are either:
Solvay pursues comprehensive initiatives and processes tocultivate the engagement and well-being of its employees,including:
The Group 2025 target is an engagement index of 80%. Thisindex is used as a yardstick to decide which actions are neededin these four areas.
2025
80%of Solvay Engagement Index
Advanced health surveillance for employees
SOLVAY’S OBJECTIVE:
Carcinogenic, Mutagenic, or Toxic to Reproduction (CMR), andthat meet the criteria for classification in accordance with thenew Regulation on the Global Harmonized System, known asthe "GHS" Regulation
Persistent, Bioaccumulative, and Toxic (PBT), or very Persistentand very Bioaccumulative (vPvB)
identified, on a case-by-case basis and through scientificevidence, as probably causing serious effects to human healthor the environment that is of an equivalent level of concern tothose above.
NOTE S9Employee engagement and wellnessmanagement
personal development
reward & recognition
inclusive culture
work-life balance.
SOLVAY’S STRATEGIC OBJECTIVE:
EXTRA-FINANCIAL STATEMENTS
122SOLVAY 2016 Annual Integrated Report

In 2016, the Engagement of Solvay's workforce was assessedvia the "Pulse Survey", a shortened annual version of the global"Solvay employee survey" census, last carried out in 2015 andnext scheduled for 2018. More than 23,000 employees answered23 questions regarding their views on employment,management, and the activities of the Group as a whole.
The rate of engagement, deduced from a limited number ofquestions and reflecting the satisfaction of Solvay's personneland their commitment to Solvay's success, stands at 77%, 2percentage point more than in 2015. Site managers have beenbriefed on the results and shared them with personnel so thatthey can define improvement actions.
The survey also assesses perceptions about well-being at work,measured using four questions encompassing workload, mutualrespect, immediate supervisor’s support of efforts to achievework-life balance, and satisfaction with working conditions. Theaverage share of favorable answers increased slightly, to 67%from 64% last year. In 2016, work-life balance guidelines weredrafted and distributed throughout the Solvay Group.
Engagement is also fostered by regular dialog between themanagers of the Group and the employees. It is part of Solvayculture. Solvay considers that maintaining trusting andconstructive relations with employees and their representativesforms the basis for such dialog. This relationship is built on theGroup’s commitment to respecting employees’ fundamentalhuman rights and to guaranteeing their social rights. Theagreement with IndustriALL formalizes the Group’s commitment.
More specifically, social dialog covers dialog with employees’representatives at four levels: sites, countries, Europe, andGroup.
In 2015 Solvay created a global employee representative body,the Solvay Global Forum, composed of eight employeerepresentatives coming from the seven main countries whereSolvay operates. This Global Forum meets with the executivecommittee once a year, in Brussels, during a one-week session.Visio conferences are organized every quarter, between theSolvay Global Forum and the top management of the Group, tocomment and discuss the quarterly results of the Group, and tobe informed of the main new projects.
One of the main topics is the negotiation of the GlobalPerformance Sharing plan, which entitles each employee of theGroup to a share of the Group’s EBITDA, and which also includessustainability criteria (progress in the Solvay Way annual self-assessment).
A permanent dialog has been established for more than 20 yearsbetween Solvay and its European Works Council (EWC). In 2016,the EWC met three times in a plenary session. The sustainabledevelopment EWC commission met twice and the EWCSecretariat met 11 times with senior Group management,allowing these representative bodies to be part of the evolutionof the Group. Subject matters receiving particular attention weremergers and acquisitions, restructuring issues, evolution ofemployment and working conditions in the Group, and strategyand sustainable development issues
The main topics discussed with the Sustainable DevelopmentCommission of the European Works Council in 2016 include thenew societal actions policy, the five priority targets of the Group,the new health and safety plan, the “well-being at work” project,and the results of the Group’s sustainability performanceassessment by extra-financial rating agencies.
Several formal agreements have been concluded with tradeunions at different locations of the group, e.g. 12 sites in theUnited States are covered by healthcare plans based oncollective agreements. Two such agreements exist in France. Thetopic of safety is included in the agreement signed withIndustriALL. The specificity of this global agreement lies in thedesire of both partners to make it operative in a concrete anddynamic way.
Every year, IndustriALL representatives meet Solvay employees tocheck on compliance in the field, with two assessment missionstaking place at two different sites. One mission measures theresults of the Group’s safety policy. The second examines theapplication of the agreement, which, in particular, formally coversthe following health and safety aspects:
Solvay strives to improve even further the level of its social dialog,as the relationship with its employee representatives isconsidered to be crucial for its future development and for itsacceptance in society at large. This topic and its level of maturityis part of the Solvay Way annual self-assessment.
Social dialog
Solvay Global Forum
European Works Council (EWC)
Health and safety topics in the IndustriALL agreement
Ensuring good working conditions
Managing risk as a daily concern
Defining demanding internal policies and their stringentapplication
Improving safety performance and regular monitoring of ownand contractors’ employees
Ensuring healthy working conditions for all personnel,regardless of the job they perform and its associated risks.
EXTRA-FINANCIAL STATEMENTS
SOLVAY 2016 Annual Integrated Report123

Trade unions are present at a majority of Solvay sites around theworld. Union membership is estimated at 20% in Europe, 30%in South America, 10% in North America, and 70% in Asia. Thisincrease in Asia is due to a reevaluation of the percentage of theaffiliate in China (100%).
Collective bargaining agreements can be at local (site), national(company), industry (e.g. chemicals industry), or Group level. Thecontent can cover various topics such as shift work payments orpay structures and increases, working time, treatment of part-timers, training, bonuses, financial participation, retirement plans,employment contracts, and gender equality.
In the majority of cases collective agreements are extended to allemployees, even if they are not members of a union. Coverageby collective agreements is at the level of 87.8% worldwide. This
includes a group collective agreement called Global PerformanceSharing Plan, concluded each year with the Solvay Global Forum,under which all non-exempt employees are covered.
These data indicate that freedom of association is ensured withinthe Group and that its practical application provides mutuallyagreed working conditions for our employees.
Some of the collective bargaining agreements specify noticeperiods for consultation and negotiation. The Global frameworkagreement concluded between Solvay and IndustriALL Globalunion includes a provision for employees and unions (where theyexist) to be informed in advance of any restructuring plans. Insome of the collective bargaining agreements a notice period andprovisions for consultation and negotiation may be specified.
2025
40%of employees involved in societal action
The Group aims to strengthen this commitment by facilitatingemployee involvement in projects that serve society and byoffering Solvay’s expertise to regions where the Group operates.
Societal actions are how we create shared social value. Today,value creation is a collaborative effort both within the companyand between the company and our stakeholders, whether theybe customers, investors, suppliers, communities, or the planet asa whole.
Solvay dedicates time and financial resources both locally andglobally to help improve people’s living environment through:
Budget for societal actions
In € million 2016 2015Solvay Group donations, sponsorships and own projects 7.38 5.25
€ 7.38 million split into € 1.98 million for local societal actions done by sites, € 0.85 million for the Ernest Solvay Fund, and € 4.55 million for Solar Impulse.
Employees are involved in diverse projects worldwide that provide direct and indirect added value for the local economy andemployment, while also supporting local associations and initiatives.
In % of headcount 2016 2015Employees involved in local societal actions 23 20
Legend: Number of employees that participated at least in one societal action in 2016 (even if they are no long present at the company on 31/12/2016)divided by the headcount on 31/12/2016.
Employee Representation Indicator
Coverage of employees by collective agreementsMinimum notice periods regarding operational changes
NOTE S10Community development management
SOLVAY’S STRATEGIC OBJECTIVE:
scientific solutions;
education and youth employment;
environmental actions and solidarity at the local level.
From local involvement ...
EXTRA-FINANCIAL STATEMENTS
124SOLVAY 2016 Annual Integrated Report

The increase in engagement at local level is on track with theobjective for 2025. Note that 2016 was the first year of launchingthe Societal Actions guidelines and that Cytec legacy plants havenot been included in that measurement.
Preliminary work with our auditors has shown that themeasurement of the percentage of people involved in societalactions needs to be more accurate. Further work is required onreporting process and standards.
The most visible Group initiatives are its involvement in SolarImpulse, the Solvay Prize for the Future of Chemistry, and theSolvay International Institutes for Physics and Chemistry.
The Group aims to connect its philanthropic efforts with theGroup’s areas of expertise and support causes where itsproducts or activities can deliver added value.
In 1923, Solvay created the Ernest Solvay Fund to honor thefounder of the Company, who died the year before. Today, themajority of Solvay’s corporate philanthropy goes through theErnest Solvay Fund. This Fund is managed by the independentKing Baudouin Foundation.
Solvay concentrates its philanthropic and funding efforts atcorporate level on science promotion, education, youthemployment, and in some circumstances, support tohumanitarian initiatives in reaction to certain disasters and/orwhere our products or services are of particular value.
The Chemistry for the Future Solvay Prize rewards a majorscientific discovery that could shape tomorrow’s chemistry andaid human progress. The prize perpetuates the strong supportfor scientific research given by Ernest Solvay. It is intended toendorse basic research and underline the essential role ofchemistry, both as a science and an industry, in helping to solvesome of the most pressing issues the world is facing. The€300,000 prize is awarded every two years.
In 2015, the Chemistry for the Future Solvay Prize was given toProfessor Ben Feringa. Professor Feringa’s work on unidirectionalmolecular motors has opened up a new field of research which,for example, paves the way for the development of newtherapeutic and technological applications. Within the next 20to 30 years, his research is likely to lead to the introductionof nanorobots – microscopic robots that can accurately targetspecific molecules during therapeutic treatment. It may alsoenable a new generation of scientists to design artificial musclesor further optimize the storage of information on a molecularscale. For his work and his career, Ben Feringa was awarded the2016 Nobel Prize in Chemistry.
The next Chemistry for the Future Solvay Prize will be awarded in2017.
Examples of local societal actions in France for“Education and youth employment”
"C Génial": this foundation for scientific and technical cultureaims to educate teachers about the technical activities ofprivate sector companies, lend a sense of purpose to theteaching of science at middle and high school levels by usingindustrial applications to bring the subject to life, and giveteachers a better idea of the kinds of scientific and technicalcareers the future holds in the private sector. In 2016, around15 Solvay employees at four sites hosted several teachers.
"Institut Télémaque": this association promotes equality ofopportunity starting in middle school by pairing deserving,motivated young students from underprivileged householdswith co-mentors from their school and the Group. In 2016, 18employees from two Solvay sites signed up as mentors.
"Nos quartiers ont du talent": the goal of this association,whose name means “There’s talent in the neighborhood”, is toaccelerate the entry of ambitious, deserving young people intoprofessional life and ensure equal access to promising, skilledjobs. Since it was launched, the association has been workingto help graduates under the age of 30 with at least threeyears of post-secondary education to access the job market.The program focuses on young people from disadvantagedbackgrounds, some of whom were raised in low-incomehousing. In 2016, 15 Solvay employees at two sites signed upto mentor these young people.
"Elles Bougent: aimed at promoting gender diversity in theGroup’s professions, "Elles Bougent" (“Women on the Move”)raises the profile of female engineers and technicians byarranging meetings between Group professionals and middleschool, high school, and college students. These events aretypically forums organized around topics such as “women incareers”, “the science of engineering”, or “technologicalinnovation challenges”. In 2016, 48 Solvay employeesanswered young women’s questions either in person orthrough a regional mentor.
... to a global commitment
Examples of Group science promotion projectsInspiring the chemists of the future
EXTRA-FINANCIAL STATEMENTS
SOLVAY 2016 Annual Integrated Report125
Following the legendary 1911 Conseil Solvay on “Radiation andthe Quanta” chaired by Nobel Laureate Hendrik Lorentz, theInternational Solvay Institute for Physics was founded by ErnestSolvay in 1912. The International Solvay Institute for Chemistrywas founded a year later, in 1913. The two Institutes mergedin 1970 as the International Solvay Institutes for Physics andChemistry, founded by Ernest Solvay.
The mission of the Solvay Institutes is to support and developcuriosity-driven research in physics, chemistry, and associatedfields with the purpose of “enlarging and deepening theunderstanding of natural phenomena”.
The central activity of the Institutes is the periodic organizationof the celebrated Solvay Conferences on Physics and Chemistry(“Conseils de Physique Solvay” and “Conseils de Chimie Solvay”).This support for fundamental science is complemented by theorganization of open workshops on specific selected topics,international chairs, colloquia, and an international doctoralschool.
In addition to these activities, the Solvay Institutes promote thepopularization of science through the organization of the annualSolvay public lectures devoted to today’s big scientific challenges.
In July 2016, Solar Impulse completed its round-the-world tour that started in March 2015, after covering more than 40,000 kmpowered exclusively by solar energy, flying over two oceans, breaking eight world records.
Since 2003, our dedicated teams of scientists, engineers, visionaries, and innovators have collaborated closely with like-mindedindividuals from Solar Impulse and leading technological partners, with the aim of sweeping convention aside. Instead wedeveloped clean-sheet solutions to dramatically improve the energy chain and to enhance the structure and reduce the weight ofthe solar-powered aircraft, crucial elements that have helped to make this historic flight a success. More than 6000 parts in theSolar Impulse 2 are made out of our high-end thermoplastics and thermoset composites that make the aircraft lighter, along withenergy-efficient technologies such as lubricants and battery components based on fluorine and lithium chemistry.
The idea conceived by Bertrand Piccard and André Borschberg designing, building, and flying a zero-emission aircraft around theworld was totally in line with Solvay's unwavering commitment to developing transformative clean technologies that easedependency on carbon-emitting fossil fuels. A way of demonstrating chemistry’s ability to "make the impossible possible" – anopportunity that Solvay could not miss!
The International Solvay Institutes for Physics andChemistry
Examples of Group science educational projects
The creation at the University of Strasbourg of “bourses dedoctorat d’excellence en chimie”, which support candidatesfrom Imperial College of London, University of Cambridge, andSaint Andrews University.
The annual grant to the Queen Elisabeth Medical Foundation(QEMF), which encourages laboratory research and contactbetween researchers and clinical practitioners, with aparticular focus on neurosciences. The QEMF supports 17university teams throughout Belgium.
The International IUPAC/Solvay Award for Young Chemists,which will reward five young chemists and researchers fromtop universities all over the world.
The “Solvay Awards”, which have been recognizing excellentmasters and doctors from two major universities in Belgium formore than 20 years.
From 2014, Solvay supports VOCATIO scholarships, which aregranted to talented young people to enable them to achieve orstart pursuing their dream.
The creation of the research chair "Chimie et Auto assemblage"at the University of Bordeaux.
Solar Impulse: Solvay, a game-changer in clean technologies to make the impossible possible!
EXTRA-FINANCIAL STATEMENTS
126SOLVAY 2016 Annual Integrated Report

Stronger regulatory compliance checks in health, hygiene,occupational safety, process safety, product safety, andenvironmental matters have recently been implemented locally,at every site. The Group HSE management system also requiresevery site to ensure a systematic regulatory watch, and toefficiently spot any changes in its regulatory obligations.
The Group aims to conduct a compliance audit at least every fiveyears at every manufacturing site, with full completion (100% ofsites) before end 2017. Such compliance audits must be updatedat least every five years or in the event of significant regulatorychange. Audits are carried out by internal auditors or by externalparties under contract.
As regards environmental risk, and in the event that audit findingsgo beyond administrative failures, priorities are set according toan internal matrix, so as to identify and deal first with the highestrisk level situations, and to remediate them within the coming 12months.
Regulatory compliance in health and hygiene, process safety, and environment
In % 2016 2015Compliance audits during last 5 years 75 50Regulatory watch process in place 82 50
Scope: All manufacturing and R&I sites except sites from recently acquired Cytec.
The handling of “Risk Sheet 1” situations is a key element ofSolvay’s process safety, as prescribed by Solvay’s “red line” onhealth, safety, and environment risk management. Red lines areessential Solvay rules that must be respected to the extent thatthey cover issues which constitute major risks for the Group. Allmajor identified risks are validated and reported at corporatelevel.
The Solvay code of conduct and other elements relating tocompliance are discussed in the Corporate Governance sectionof the annual report.
The impact of major litigation is discussed in the Management ofRisks section of the annual report.
Process safety programs continue to ensure the integrity ofoperations and incorporate good design principles alongsidebest engineering and operating practices. Programs focus onpreventing and controlling incidents, especially scenariosinvolving potential catastrophic consequences on people or theenvironment. Solvay's process safety management is risk-based.
Solvay deploys rules and indicators to monitor:
Process safety monthly bulletins are widely distributed in 14languages. They describe incidents that have occurred at Solvaysites and provide recommendations for improvement.
2020
100%of the sites with a risk analysis updated in the last fiveyears, for every production line
The main pillar of Solvay's preventive, risk-based approach is theprocess risk analysis of existing, new, or modified installations.Quantified risk analysis is a best practice among industrialcompanies: standardized risk analysis makes it possible toquantify the risk level of every possible accident scenario,combining severity and probability factors. Risk analysis forms thebackbone of risk control.
NOTE S11Management of the Legal, Ethics and Regulatoryframework
Health, safety and environment
Solvay code of conduct
Major litigation
NOTE S12Process safety, emergency preparedness and response
1. risk analysis programs
2. identification and mitigation of Risk Level 1 situations
3. implementation of process safety management systems at sites
4. incident follow-up and reporting.
Risk analysis program
SOLVAY’S OBJECTIVES:
EXTRA-FINANCIAL STATEMENTS
SOLVAY 2016 Annual Integrated Report127

This makes it possible to identify major accident scenarios andtake the necessary measures to make the level of risk acceptable.Solvay uses tiered risk analysis methods and adapts them to thelevel of potential hazard of every process at every GBU. Many ofSolvay’s GBUs use a simplified method - called PRAMAPOR - forthe section of chemicals with low potential hazards.
Completion of the risk analysis program is part of the Solvay HSEdashboard regularly reviewed by the Executive Committee.
In % 2016 2015 2014Percentage of concerned product lines having a risk analysis updated in the last fiveyears 65 69 64
Scope: Manufacturing and Research and Innovation sites under operational control including recently acquired Cytec with reportings as from 2016. Theconsolidated data for process safety risk analysis cover 134 sites out of a total of 150 operational sites.
A systematic approach is used across the whole Group toefficiently identify and remediate the highest risks. Handling100% of "Level 1 Risk Sheet" situations (situations with thehighest risks) is a key element of Solvay's process safety policy,as prescribed by Solvay's "Red Line" on health, safety, andenvironment risk management. The Group has repeatedlysucceeded in resolving all level 1 risk sheet situations within oneyear.
Red Lines are essential Solvay rules that must be respected tothe extent that they cover issues which constitute major risks forthe Group. All identified "level 1 process safety risk sheets" are
validated and reported at the corporate level. Then, as defined bythe Red Line, they must be mitigated within a maximum of oneyear.
All Level 1 Risk Sheet situations are remediated within the year.
Most level 1 risk sheets identified referred to a single site thatSolvay acquired in China acquired in 2010. This site has gonethrough a comprehensive risk analysis program to complete theprocess risk analysis required by the Solvay Red Line. Many level1 risk sheets have already been identified and mitigated inaccordance with the Group’s second Red Line.
Mitigation of Process Safety (Risk Level 1)
2016 2015 2014Number of “risk sheets level 1” at the end of the year 46 94 217
2020
100%of sites with a process safety management systemcorresponding to their risk level
All Solvay industrial and R&I sites are required to develop andimplement an ad hoc process safety management system (PSM).They must implement the PSM practices required by the Groupand adapted to their risk level, according to a classificationsystem defined in 2015.
In % 2016 2015Sites with required PSM practices, according to their PSM level 90 84
Scope: All manufacturing sites (except recently acquired Cytec sites which will be included in 2017).
The systematic but tiered requirement, with three distinct PSM levels, is a good practice amongst industry peers. PSM systemimplementation is assessed through Solvay internal audits or observations of PSM practices by third parties.
Breakdown of sites according to their Process Safety Management (PSM) level
In % 2016Sites with a PSM level 1 (Low) 54Sites with a PSM level 2 (Medium) 34Sites with a PSM level 3 (High) 11
Mitigation of process safety "Level 1 Risk Sheets"
Process safety management systems (PSM)
SOLVAY’S OBJECTIVE:
EXTRA-FINANCIAL STATEMENTS
128SOLVAY 2016 Annual Integrated Report

Solvay's target is to avoid any high severity incident (H and above)and to reduce the incident rate for medium severity incidents.Solvay's incident rate (PSI rate) is consistent with the methodproposed by the International Council of Chemical Associations(ICCA) and is benchmarkable.
The Group’s reporting on process safety incidents is improvingprogressively. Solvay's incident rate is average relative to itspeers. The increasing trend in the number of reported PSIs
reflects the increasing number of reporting sites, along the newlyintroduced reporting process. Based on the data andexperiences shared amongst the companies taking part in theinitiative by the International Chamber of Chemical Industries(ICCA), in the framework of its pilot program on PSI reporting,Solvay's reporting process appeared to be one of the best, inparticular for its coverage of the different geographical regions.
In % 2016 2015 2014Process safety rate 0.7 0.6 0.4
Legend: Total number of process incidents per 100 full time employee (employees and contractors, assuming 2000 hours of work / worker / year).
Solvay has a worldwide rule for reporting process safety incidentsbased on a severity matrix that takes into account :
Reportable incidents are classified according to severity (medium,high, and catastrophic). No catastrophic incidents have beenreported since 2012.
Number of incidents classified according to severity
2016 2015 2014Medium 259 215 156High 1 1 2
Scope: Solvay group manufacturing and R&I sites under operational control. The consolidated data for process safety incident covers 132 sites out of a total of143 operational sites, including R&I sites.
2020
35%Increase the “Net Promoter Score” to 35%
Since 2014, Solvay has been monitoring and publishing theGroup's Customer Satisfaction results by consolidating the GroupNet Promoter Score (NPS), compiled through GBU-driven "Voiceof the Customer" (VOC) inquiries.
In 2015/16 all GBUs, with the exception of Technology Solutionsand Composite Materials, performed for the first time acomprehensive satisfaction survey covering all major aspects ofthe customer experience.
For the two new GBUs, a light VOC inquiry measuring only theNPS was performed in the last quarter of 2016, owing to timeconstraints related to their integration. The same procedure hadbeen applied in 2014 when the Group's NPS was first measured.
In % 2016 2015 2014Solvay’s Net Promotor Score (NPS) 27 24 14
Legend: Net Promoter Score is a customer loyalty metric developed by (and registered trademark of) Fred Reichheld, Bain & Company, and Satmetrix.
In 2016, the Group made further progress in terms of customer satisfaction with an NPS of 27%, on the right track towards achieving our2020 objective.
Process safety incidents
the consequences for people
for the environment
damages to assets and volumes of chemicals released.
NOTE S13Customer satisfaction
SOLVAY’S OBJECTIVE:
EXTRA-FINANCIAL STATEMENTS
SOLVAY 2016 Annual Integrated Report129

1. CONSOLIDATED FINANCIAL STATEMENTS 131
Consolidated income statement 132
Consolidated statement of comprehensive income 133
Consolidated statement of cash flows 134
Consolidated cash flows from discontinued operations 135
Consolidated statement of financial position 135
Consolidated statement of changes in equity 136
2. NOTES TO THE CONSOLIDATED FINANCIALSTATEMENTS 137
IFRS general accounting policies 137
1. Basis of preparation 137
2. Basis of measurement and presentation 138
3. Principles of consolidation 139
4. Foreign currencies 141
5. CO2 emission rights 141
6. Government grants 141
Critical accounting judgments and key sources ofestimation uncertainty 142
Notes to the consolidated income statement 143
NOTE F1 Segment information 144
NOTE F2 Consolidated income statement by nature 149
NOTE F3 Other operating gains and losses 149
NOTE F4 Earnings from associates and joint ventures 150
NOTE F5 Results from portfolio management andreassessments, legacy remediation and major litigations 150
NOTE F6 Net financial charges 151
NOTE F7 Income taxes 151
NOTE F8 Discontinued operations 156
NOTE F9 Profit for the year 157
NOTE F10 Earnings per share 157
Notes to the consolidated statement of comprehensiveincome 158
NOTE F11 Consolidated statement of comprehensive income 158
Notes to the consolidated statement of cash flows(continuing and discontinued operations) 159
NOTE F12 Depreciation, amortization and impairments 160
NOTE F13 Other non-operating and non-cash items 160
NOTE F14 Income taxes 160
NOTE F15 Changes in working capital 160
NOTE F16 Changes in provisions 161
NOTE F17 Cash flows from investing activities – acquisition/disposal of assets and investments 161
NOTE F18 Proceeds from bond issuance classified as equityand capital increase 162
NOTE F19 Other cash flows from financing activities 163
NOTE F20 Cash flow from discontinued operations 163
Notes to the consolidated statement of financial position 163
NOTE F21 Intangible assets 163
NOTE F22 Goodwill and business combinations 166
NOTE F23 Tangible assets 171
NOTE F24 Leases 174
NOTE F25 Assets held for sale 175
NOTE F26 Investments in associates and joint ventures 176
NOTE F27 Other investments 177
NOTE F28 Impairment of tangible assets, intangible assets,and equity method investees 177
NOTE F29 Inventories 179
NOTE F30 Other receivables (current) 180
NOTE F31 Provisions 180
NOTE F32 Financial instruments and financial riskmanagement 191
NOTE F33 Net indebtedness 206
NOTE F34 Other liabilities (current) 208
NOTE F35 Share-based payments 208
Miscellaneous Notes 210
NOTE F36 Commitments to acquire tangible and intangibleassets 210
NOTE F37 Contingent liabilities 211
NOTE F38 Dividends proposed for distribution 211
NOTE F39 Associates and joint ventures 211
NOTE F40 Joint operations 213
NOTE F41 Non-controlling interests (continuing operations) 214
NOTE F42 Related parties 215
NOTE F43 Events after the reporting period 216
NOTE F44 List of companies included in the consolidationscope 216
3. SUMMARY OF FINANCIAL STATEMENTS OFSOLVAY SA 223
Balance sheet of Solvay SA (summary) 224
Income statement of Solvay SA (summary) 224
Profit available for distribution 224
Management Report
Corporate governance statement 33
Risk management 57
Business review 72
Extra-financial statements 96
FINANCIAL STATEMENTSDeclarations: Auditor’s reports & Declaration by the persons responsible 225
130SOLVAY 2016 Annual Integrated Report

Solvay (the “Company”) is a public limited liability companygoverned by Belgian law and quoted on Euronext Brussels andEuronext Paris. The principal activities of the Company, itssubsidiaries, joint operations, joint ventures, and associates(jointly the “Group”) are described in note F1 Segmentinformation.
The consolidated financial statements were authorized for issueby the Board of Directors on February 23, 2017. They have beenprepared in accordance with IFRS accounting policies, details ofwhich are given below.
On March 16, 2016, Solvay and INEOS announced their intentionto end their 50/50 Inovyn chlorovinyls joint venture earlier thanoriginally foreseen, with INEOS becoming the sole shareholder.Solvay and INEOS formed Inovyn in July 2015, with Solvay's exitoriginally planned in July 2018. On March 31, 2016, Solvay andINEOS announced they had signed the binding agreement to endtheir Inovyn chlorovinyls joint venture, following their intentionsannounced on March 16, 2016. On July 7, 2016, upon completionof the transaction, Solvay received a payment of € 335 millionand INEOS became Inovyn’s sole shareholder. The exit of thejoint venture followed regulatory clearances from the relevantauthorities. In 2017, Solvay will pay a total price adjustmentapproximating € 80 million.
On April 25, 2016 Solvay issued a formal notification for theexercise of the first call option on the € 500 million hybrid bond(maturing in 2104), after having notified the Luxembourg StockExchange, where the bond was listed, as well as the bondholders.This bond, which carried an annual interest rate of 6.375% inthe first ten years, had previously been classified as a long-termfinancial debt in the consolidated statement of financial position,and was repaid on June 2, 2016. The financing of this repaymentwas secured in December 2015, together with the bonds issuedto finance the Cytec acquisition.
On May 2, 2016, Solvay entered into a Share PurchaseAgreement with Unipar Carbocloro for the sale of its equityinterests held in Solvay Indupa. During the third quarter of 2016,the fair value less cost to sell has been updated, so as to reflectthe impact of the worsening of the business environment onthe deal. An impairment loss in the amount of € 63 million wasrecognized in 2016. On December 7, 2016, Solvay obtainedclearance from the Brazilian antitrust authority, CADE, for theagreed sale of its 70.59% stake in Solvay Indupa to chemicalgroup Unipar Carbocloro. Completion of the transaction, at atotal enterprise value of US$ 202.2 million, took place onDecember 27, 2016.
On May 19, 2016, Solvay and Eastman Chemical Company signeda definitive agreement to end their cellulose acetate productionjoint venture Primester with Solvay acquiring Eastman’s 50%stake in the U.S.-based plant and becoming its sole owner.Following the transaction, Eastman will provide the long-termsupply of basic utilities and raw materials to the plant, based inKingsport, Tennessee. The closing occurred on June 2, 2016.
On December 7, 2016, Solvay reached an agreement to sell itscellulose acetate tow business, Acetow, to private equity fundsmanaged by Blackstone. The transaction is based on anenterprise value of about € 1 billion, representing around 7 xEBITDA multiple. The net proceeds will contribute to thecontinued deleveraging of Solvay. Completion of the transactionis expected in the first half of 2017 and is subject to thecustomary social procedures and approval by the relevantantitrust authorities. In view of the materiality of the transaction,Solvay has considered the business to be a discontinuedoperation and has restated its results in accordance with IFRS.
On December 14, 2016, Solvay signed a definitive agreement tosell its 58.77% stake in its Thai subsidiary Vinythai PCL toJapanese company AGC Asahi Glass, thereby exiting its Asianpolyvinyl chloride (PVC) activities. The transaction is based ona total enterprise value of 16.5 billion Thai Baht (€ 435 million),representing a multiple of 8x mid-cycle EBITDA. Completion ofthe transaction was subject to customary closing conditions,including antitrust approvals, and was closed on February 22,2017. In view of the materiality of the transaction, Solvay hasconsidered the business to be a discontinued operation and hasrestated its results in accordance with IFRS.
CONSOLIDATED FINANCIALSTATEMENTS
1.
Main changes in consolidation scope during theyear
FINANCIAL STATEMENTS
SOLVAY 2016 Annual Integrated Report131

In € million Notes 2016 2015Sales (F1) 11,403 10,083
of which revenue from non-core activities 520 467of which net sales 10,884 9,615
Cost of goods sold (8,314) (7,517)Gross margin 3,090 2,566Commercial and administrative costs (1,465) (1,296)Research and development costs (305) (271)Other operating gains and losses (F3) (222) (84)Earnings from associates and joint ventures (F4) 85 21Results from portfolio management and reassessments (F5) (164) (205)Results from legacy remediation and major litigations (F5) (56) (36)EBIT (F2) 962 695Cost of borrowings (F6) (188) (108)Interest on lendings and short term deposits (F6) 13 9Other gains and losses on net indebtedness (F6) (50) (47)Cost of discounting provisions (F6) (118) (69)Income/loss from available-for-sale financial assets (F6) 5 (8)Profit for the year before taxes 624 472Income taxes (F7) 56 (69)Profit for the year from continuing operations 680 403Profit (loss) for the year from discontinued operations (F8) (6) 51Profit for the year (F9) 674 454attributable to:
Solvay share 621 406non-controlling interests 53 48
Basic earnings per share from continuing operations (€) 6.20 4.42Basic earnings per share from discontinued operations (€) (0.18) 0.42Basic earnings per share (€) (F10) 6.01 4.85Diluted earnings per share from continuing operations (€) 6.18 4.39Diluted earnings per share from discontinued operations (€) (0.18) 0.42Diluted earnings per share (€) (F10) 5.99 4.81
Consolidated income statement
FINANCIAL STATEMENTS
132SOLVAY 2016 Annual Integrated Report

In € million Notes 2016 2015Profit for the year 674 454Other comprehensive incomeRecyclable componentsHyperinflation (F11) 0 42Gains and losses on available-for-sale financial assets (F11) 9 3Gains and losses on hedging instruments in a cash flow hedge (F11) 36 15Currency translation differences - Subsidiaries and joint operations (F11) 278 208Currency translation differences - Associates and joint ventures (F11) 51 (22)Non recyclable componentsRemeasurements of the net defined benefit liability (F11) (275) 279Income tax relating to recyclable and non recyclable components (F11) 56 (20)Other comprehensive income, net of related tax effects (F11) 155 505Comprehensive income for the year 830 959attributable to:
Solvay share 762 892non-controlling interests 67 67
Consolidated statement of comprehensive income
FINANCIAL STATEMENTS
SOLVAY 2016 Annual Integrated Report133

The amounts below include both continued and discontinued operations.
In € million Notes 2016 2015Profit for the year 674 454Adjustments to profit for the year
Depreciation, amortization and impairments (F12) 1,302 978Earnings from associates and joint ventures (86) (21)Other non operating and non cash items (F13) (16) 128Net financial charges and income/loss from available-for-sale financialassets 374 257Income tax expense (F14) (21) 134
Changes in working capital (F15) (99) (103)Changes in provisions (F16) (151) (302)Dividends received from associates and joint ventures 22 14Income taxes paid (excl. income taxes paid on sale of investments) (F14) (212) (250)Cash flow from operating activities 1,788 1,289of which cash flow linked to acquisition of subsidiaries and excluded fromFree Cash Flow(2) 7 (98)Acquisition (-) of subsidiaries (F17) (23) (4,835)Acquisition (-) of investments - Other (F17) 4 (28)Loans to associates and non consolidated companies (25) 11Sale (+) of subsidiaries and investments (F17) 144 70Income taxes paid on sale of investments (F17) 0 (232)Acquisition (-) of tangible assets (F17) (883) (952)Acquisition (-) of intangible assets (F17) (98) (85)Sale (+) of tangible and intangible assets (F17) 76 31of which cash flow related to the sale of real estate in the context ofrestructuring/dismantling/remediation 35 5Dividends from available-for-sale financial assets 0 1Changes in non-current financial assets (2) 4Cash flow from investing activities (807) (6,014)Capital increase (+) / redemption (-) (F18) 0 1,477Proceeds from perpetual hybrid bond issuance (F18) 0 991Acquisition (-) / sale (+) of treasury shares (F35) (55) (59)Increase in borrowings (F33) 1,133 4,628Repayment of borrowings (F33) (2,300) (1,219)Changes in other current financial assets (F33) (50) 225Interests paid (216) (156)Coupons paid on perpetual hybrid bonds (F18) (84) (57)Dividends paid (386) (323)Other (F19) 7 (31)Cash flow from financing activities (1,951) 5,475Net change in cash and cash equivalents (970) 750Currency translation differences (12) 13Opening cash balance 2,037 1,275Closing cash balance(1) (F33) 1,054 2,037
(1) Including cash in assets held for sale (€ 85 million in 2016 and € 7 million in 2015).(2) Costs linked to the acquisition of subsidiaries are presented as part of cash flow from operating activities. Such resulted in a transfer from cash flow from
investing activities to cash flow from operating activities in the comparative 2015 numbers (€ 94 million in other non operating and non cash items and € 4million in changes in working capital). Such does not impact the Group’s Free Cash Flow, which excludes costs related to the acquisition of subsidiariesand which is presented in the Business Review section.
Consolidated statement of cash flows
FINANCIAL STATEMENTS
134SOLVAY 2016 Annual Integrated Report

In € million Notes 2016 2015Cash flow from operating activities 191 205Cash flow from investing activities (84) (103)Cash flow from financing activities (65) (63)Net change in cash and cash equivalents (F20) 41 40
In € million Notes 2016 2015ASSETSNon-current assets 17,548 18,716Intangible assets (F21) 3,600 3,919Goodwill (F22) 5,679 5,840Tangible assets (F23) 6,472 6,946Available-for-sale financial assets (F32) 44 34Investments in associates and joint ventures (F26) 497 398Other investments (F27) 55 92Deferred tax assets (F7) 890 1,059Loans and other assets (F32) 312 427Current assets 6,597 6,613Inventories (F29) 1,672 1,867Trade receivables (F32) 1,621 1,615Income tax receivables 166 158Dividends receivables 2 0Other financial instrument receivables (F32) 101 111Other receivables (F30) 736 655Cash and cash equivalents (F33) 969 2,030Assets held for sale (F25) 1,331 177Total assets 24,145 25,329EQUITY & LIABILITIESTotal equity 9,956 9,668Share capital (F18) 1,588 1,588Reserves 8,118 7,835Non-controlling interests 250 245Non-current liabilities 9,188 11,330Provisions for employee benefits (F31) 3,118 3,133Other provisions (F31) 860 831Deferred tax liabilities (F7) 909 1,456Financial debt (F33) 4,087 5,628Other liabilities 214 282Current liabilities 5,001 4,331Other provisions (F31) 291 310Financial debt (F33) 1,338 891Trade payables (F32) 1,547 1,559Income tax payables 197 130Dividends payables 139 144Other liabilities (F34) 1,086 1,022Liabilities associated with assets held for sale (F25) 403 275Total equity & liabilities 24,145 25,329
Consolidated cash flows from discontinued operations
Consolidated statement of financial position
FINANCIAL STATEMENTS
SOLVAY 2016 Annual Integrated Report135

Equity attributable to equity holders of the parentRevaluation reserve
(Fair value)
In € million NotesShare
capital
Sharepre-
miums
Trea-sury
shares
Perpet-ual
hybridbonds
Re-tainedearn-
ings
Cur-rencytrans-lationdiffer-ences
Available-for-sale
financialassets
Cashflow
hedges
Definedbenefit
pensionplan
Totalre-
serves
Non-con-
trollinginter-
estsTotal
equityBalance at 31December 2014 1,271 18 (171) 1,194 5,753 (527) (4) (43) (927) 5,293 214 6,778Profit (loss) forthe year 406 406 48 454Items of othercomprehensiveincome (F11) 35 169 3 15 264 486 19 505Comprehensiveincome 441 169 3 15 264 892 67 959Capital increase (F18) 318 1,151 1,151 1,469Perpertualhybrid bondsissuance (F18) 994 994 994Cost of stockoptions 11 11 11Dividends (313) (313) (40) (354)Coupons ofperpetual hybridbonds (57) (57) (57)Acquisition (-) /sale of treasuryshares (59) 3 (56) (56)Increase /decrease (-)through changesin ownershipinterests insubsidiaries thatdo not result inloss of control (118) 5 (1) 32 (82) 5 (77)Balance at 31December 2015 1,588 1,170 (230) 2,188 5,720 (353) (2) (28) (630) 7,834 245 9,668Profit (loss) forthe year 621 621 53 674Items of othercomprehensiveincome (F11) 0 313 10 23 (205) 141 14 155Comprehensiveincome 621 313 10 23 (205) 762 67 830Cost of stockoptions 9 9 9Dividends (336) (336) (45) (381)Coupons ofperpetual hybridbonds (84) (84) (84)Acquisition (-) /sale of treasuryshares (44) (13) (57) (57)Increase /decrease (-)through changesin ownershipinterests insubsidiaries thatresult in loss ofcontrol (19) 7 (12) (17) (29)Balance at 31December 2016 1,588 1,170 (274) 2,188 5,899 (39) 8 (5) (828) 8,117 250 9,956
Consolidated statement of changes in equity
FINANCIAL STATEMENTS
136SOLVAY 2016 Annual Integrated Report

This information was prepared in accordance with EuropeanRegulation (EC) 1606/2002 on the application of internationalaccounting standards dated July 19, 2002. The Group’sconsolidated financial statements for the year endedDecember 31, 2016 were prepared in accordance withIFRS (International Financial Reporting Standards) as publishedby the International Accounting Standards Board (IASB), andendorsed by the European Union.
The accounting standards applied in the consolidated financialstatements for the year ended December 31, 2016 areconsistent with those used to prepare the consolidated financialstatements for the year ended December 31, 2015.
No new standards, interpretations, or amendments that have amaterial impact on the Group’s consolidated financial statementshave become applicable for the first time in 2016.
No new standards, interpretations, or amendments that areexpected to have a material impact on the Group’s consolidatedfinancial statements are applicable for the first time in 2017.
For annual periods beginning on or after January 1, 2017, inaccordance with the amendments to IAS 7 Statement of CashFlows that are part of the IASB’s Disclosure Initiative, the Groupwill provide disclosures that enable users of financial statementsto evaluate changes in liabilities arising from financing activities,including both changes arising from cash flows and non-cashchanges.
IFRS 15 Revenue from Contracts with Customers (applicable forannual periods beginning on or after January 1, 2018). IFRS 15was issued in May 2014 and establishes a five-step model toaccount for revenue arising from contracts with customers.Under IFRS 15, revenue is recognized at an amount that reflectsthe consideration to which an entity expects to be entitled inexchange for transferring goods or services to a customer. Thenew revenue standard will supersede all current revenuerecognition requirements under IFRS. The Group plans to adoptthe new standard on the required effective date. During 2016,
the Group performed a preliminary assessment of IFRS 15, whichis subject to changes arising from a more detailed ongoinganalysis. Furthermore, the Group is considering the clarificationsissued by the IASB in April 2016 and will monitor any furtherdevelopments.
NOTES TO THE CONSOLIDATEDFINANCIAL STATEMENTS
2.
IFRS general accounting policiesBasis of preparation1.
Standards, interpretations, and amendments applicablefor the first time in 2016
Standards, interpretations, and amendments applicablefor the first time in 2017
Standards, interpretations, and amendments applicablefor the first time after 2017
a. Sale of goods: As the Group is in the business of sellingchemicals, contracts with customers generally concern thesale of goods. The Group expects the revenue recognitionto occur at a point in time when control of the chemicalsis transferred to the customer, generally on delivery of thegoods. In preparing for IFRS 15, the Group is considering thefollowing:
i. Distinct elements: The revenue of the Group consistsmainly of sales of chemicals, which qualify as separateperformance obligations. Value-added services – mainlycustomer assistance services – corresponding to Solvay’sknow-how are rendered predominantly over the periodthat the corresponding goods are sold to the customer.Ancillary services, such as training, are not material.Based on preliminary results, the Group does not expecta more than insignificant adjustment to its currentpractice.
ii. Variable consideration: Some contracts withcustomers provide trade discounts or volume rebates.Currently, the Group recognizes revenue from the saleof goods measured at the fair value of the considerationreceived or receivable, net of returns and allowances,trade discounts, and volume rebates. If revenue cannotbe measured reliably, the Group defers revenuerecognition until the uncertainty is resolved. Suchprovisions give rise to variable consideration under IFRS15, and will be required to be estimated at contractinception. IFRS 15 requires the estimated variableconsideration to be constrained, to prevent over-recognition of revenue. The Group is assessing individualcontracts to determine the estimated variableconsideration and related constraints. Based onpreliminary results, the Group does not expect a morethan insignificant adjustment to its current practice.
iii. Moment of recognition of revenue: The Group sellsits chemicals to its customers, (a) directly, (b) throughdistributors, and (c) with the assistance of agents. TheGroup is analyzing whether the moment control of thegoods passes, as described in IFRS 15, would result ina different moment to recognize the revenue. Based onpreliminary results, the Group does not expect a morethan insignificant adjustment to its current practice.
FINANCIAL STATEMENTS
SOLVAY 2016 Annual Integrated Report137

During 2017, the Group will decide which of the transitionalmethods and practical expedients it will retain.
IFRS 9 Financial Instruments (applicable for annual periodsbeginning on or after January 1, 2018). IFRS 9 brings together allthree aspects of the accounting for the financial instrumentsproject: classification and measurement, impairment, and hedgeaccounting. Except for hedge accounting, retrospectiveapplication is required, but providing comparative informationis not compulsory. For hedge accounting, the requirements aregenerally applied prospectively, with some limited exceptions.The Group plans to adopt the new standard as fromJanuary 1, 2018. During 2016, the Group performed a high-levelimpact assessment of all three aspects of IFRS 9. The assessmentis subject to changes arising from a more detailed analysis during2017. IFRS 16 Leases (applicable for annual periods beginning on or
after January 1, 2019, not yet endorsed by the EU). The impactof the application of this standard is currently being assessed.We expect an impact mainly for leases currently classified asoperating leases and for which Solvay is the lessee. In thisrespect, we refer to note F24 Leases for more information onexisting operating leases.
Other standards, interpretation, and amendments applicable forthe first time after 2017 are not expected to have a materialimpact on the Group’s consolidated financial statements.
The consolidated financial statements are presented in millionsof euros, which is also the functional currency of the parentcompany.
The preparation of the financial statements requires the useof estimates and assumptions that have an impact on theapplication of accounting policies and the measurement ofamounts recognized in the financial statements. The areas forwhich the estimates and assumptions are material with respectto the consolidated financial statements are presented in thesection Critical accounting judgments and key sources ofestimation uncertainty.
b. Presentation and disclosure requirements: IFRS 15provides presentation and disclosure requirements, whichare more detailed than under current IFRSs. Thepresentation requirements represent a change from currentpractice and increase the volume of disclosures requiredin the Group’s financial statements. Many of the disclosurerequirements in IFRS 15 are new. The Group is analyzingthose disclosure requirements, including the need forpolicies, procedures, and internal controls to collect anddisclose the required information.
a. Classification and measurement: The Group does notexpect a significant impact on its consolidated statement offinancial position or equity on applying the classification andmeasurement requirements of IFRS 9. It expects to continuemeasuring at fair value all financial assets currently held atfair value. The available for sale financial assets reservecurrently presented as accumulated OCI will be openingbalance of retained earnings. The equity shares in non-listedcompanies, currently presented as available for sale, areintended to be held for the foreseeable future. The Groupexpects to apply the option to present fair value changes inOCI, and therefore believes the application of IFRS 9 wouldnot have a significant impact. In this case, the fair value gainsor losses accumulated in the other comprehensive incomewill no longer be subsequently reclassified to profit or loss,which is different from the current treatment. This wouldaffect the consolidated statement of comprehensive income,yet it would not have an impact on the Group’scomprehensive income for the year. If the Group were notto apply that option, the shares would be held at fair valuethrough profit or loss, which would increase the volatility ofrecognized profit or loss. Loans and trade receivables areheld to collect contractual cash flows and are expected togive rise to cash flows representing solely payments ofprincipal and interest. Thus, the Group expects that thesewill continue to be measured at amortized cost under IFRS9. However, the Group will analyze the contractual cash flow
characteristics of those instruments in more detail beforeconcluding whether all those instruments meet the criteriafor amortized cost measurement under IFRS 9.
b. Impairment: IFRS 9 requires the Group to recognizeexpected credit losses on all of its debt securities, loans, andtrade receivables, either on a 12-month basis or a lifetimebasis. The Group expects to apply the simplified approachand recognize lifetime expected losses on all tradereceivables. The Group does not expect a significant impacton its equity following the unsecured nature of its loans andreceivables, but it will perform a more detailed analysisduring 2017 that considers all reasonable and supportableinformation, including forward-looking elements todetermine the extent of the impact.
c. Hedge accounting: The Group believes that all existinghedge relationships that are currently designated in effectivehedging relationships will still qualify for hedge accountingunder IFRS 9. As IFRS 9 does not change the generalprinciples of how an entity accounts for effective hedges, theGroup does not expect a significant impact as a result ofapplying IFRS 9. The Group will assess in greater detail in thefuture any possible changes related to the accounting for thetime value of options, forward points, or the currency basisspread.
Basis of measurement and presentation2.
FINANCIAL STATEMENTS
138SOLVAY 2016 Annual Integrated Report

The consolidated financial statements incorporate the financialstatements of the Company, and:
Where necessary, adjustments are made to the financialstatements of the investees so as to align their accountingpolicies with those of the Group.
In accordance with the principle of materiality, certain companieswhich are not of significant size have not been included in theconsolidation scope. Companies are deemed not to be significantwhen, during two consecutive years, they do not exceed any ofthe three following thresholds in terms of their contribution tothe Group’s accounts:
Companies that do not meet these criteria are, nevertheless,consolidated where the Group believes that they have a potentialfor rapid development, or where they hold shares in othercompanies that are consolidated based on the above criteria.
In the aggregate, the non-consolidated companies have animmaterial impact on the consolidated financial statements ofthe Group.
The full list of companies is filed with the National Bank ofBelgium as an attachment to the Annual Report, and can beobtained from the Company head office.
A subsidiary is an entity over which the Group has control.Control is achieved when the Group has (a) power over aninvestee, (b) exposure, or rights, to variable returns from itsinvolvement with the investee, and (c) the ability to use its power
over the investee to affect the amount of the investor’s returns.To assess whether the Group has control, potential voting rightsare taken into account. Subsidiaries are fully consolidated. Theresults of subsidiaries are included in the consolidated incomestatement from the effective date of acquisition and up to theeffective date of disposal.
Intra-group transactions, balances, income, and expenses areeliminated on consolidation.
Non-controlling interests in subsidiaries are presented separatelyfrom the Group’s equity. Non-controlling interests are initiallymeasured, either at fair value (full goodwill method), or at thenon-controlling interests’ proportionate share in the recognizedamounts of the acquiree’s identifiable net assets (proportionategoodwill method). The choice of measurement is made on anacquisition-by-acquisition basis. Subsequent to the acquisition,the carrying amount of non-controlling interests is the amountof those interests at initial recognition plus the non-controllinginterests’ share of subsequent changes in equity. Totalcomprehensive income is attributed to non-controlling interestseven if this results in the non-controlling interests having a deficitbalance.
Changes in the Group’s equity interest in a subsidiary that donot result in a loss of control are accounted for as equitytransactions. The carrying amounts of the Group’s interests andthe non-controlling interests are adjusted to reflect the changesin their relative interests in the subsidiary. Any differencebetween the amount by which the non-controlling interests areadjusted and the fair value of the consideration paid or receivedis recognized directly in equity.
When the Group loses control of a subsidiary, the profit or losson disposal is calculated as the difference between (i) theaggregate of the fair value of the consideration received and thefair value of any retained interest, and (ii) the previous carryingamount of the assets (including goodwill) and liabilities of thesubsidiary and any non-controlling interests. Amounts previouslyrecognized in other comprehensive income in relation to thesubsidiary are accounted for (i.e. reclassified to profit or loss ortransferred directly to retained earnings) in the same manneras would be required if the relevant assets or liabilities weredisposed of. The fair value of any investment retained in theformer subsidiary at the date when control is lost is considered tobe the fair value on initial recognition for subsequent accountingin accordance with IAS 39 Financial Instruments: Recognition andMeasurement or, when applicable, the cost on initial recognitionof an investment in an associate or joint venture in accordancewith IAS 28 Investments in Associates and Joint Ventures.
Principles of consolidation3.Consolidation scope3.1.General3.1.1.
entities controlled by the Company (including through itssubsidiaries) and that hence qualify as subsidiaries (see 3.1.2.below);
arrangements over which the Company (including through itssubsidiaries) exercises joint control, and that qualify as jointoperations (see 3.1.3. below);
arrangements over which the Company (including through itssubsidiaries) exercises joint control, and that qualify as jointventures (see 3.1.4. below);
entities over which the Company (including through itssubsidiaries) has significant influence and that hence qualify asassociates (see 3.1.4. below).
sales of € 30 million;
total assets of € 15 million;
headcount of 150 persons.
Investments in subsidiaries3.1.2.
FINANCIAL STATEMENTS
SOLVAY 2016 Annual Integrated Report139
A joint operation is a joint arrangement whereby the parties thathave joint control of the arrangement have rights to the assets,and obligations for the liabilities, relating to the arrangement.Joint control is the contractually agreed sharing of control of anarrangement, which exists only when decisions about relevantactivities require the unanimous consent of the parties sharingcontrol. In its consolidated financial statements, the Grouprecognizes its share of the joint operations’ assets, liabilities,revenue, and expenses, based on its ownership interest in thejoint operations.
An associate is an entity over which the Group has significantinfluence and that is neither a subsidiary nor an interest in a jointarrangement. Significant influence is the power to participate inthe financial and operating policy decisions of the investee but isnot control or joint control over those policies.
A joint venture is a joint arrangement whereby the parties thathave joint control of the arrangement have rights to the netassets of the arrangement. Joint control is the contractuallyagreed sharing of control of an arrangement, which exists onlywhen decisions about relevant activities require the unanimousconsent of the parties sharing control.
The results, assets, and liabilities of associates and joint venturesare incorporated in the consolidated financial statements usingthe equity method of accounting, except when the investmentis classified as held for sale, in which case it is accounted forin accordance with IFRS 5 Non-current Assets Held for Sale andDiscontinued Operations. Under the equity method, on initialrecognition, investments in associates and joint ventures arerecognized in the consolidated statement of financial position atcost, and the carrying amount is adjusted for post-acquisitionchanges in the Group’s share of the net assets of the associateor joint venture, less any impairment of the value of individualinvestments. Losses of an associate or joint venture in excessof the Group’s interest in that associate or joint venture (whichincludes any long-term interests that, in substance, form part ofthe Group’s net investment in the associate or joint venture) arerecognized only to the extent that the Group has incurred legalor constructive obligations or made payments on behalf of theassociate or joint venture.
Any excess of the cost of acquisition over the Group’s shareof the net fair value of the identifiable assets and (contingent)liabilities of the associate or joint venture recognized at the dateof acquisition is goodwill. The goodwill is included within thecarrying amount of the investment and is assessed forimpairment as part of that investment.
Where a Group entity transacts with an associate or joint ventureof the Group, profits and losses are eliminated to the extent ofthe Group’s interest in the relevant associate or joint venture.
On July 1, 2015, Solvay sold its chlorovinyls activities to theINOVYN joint venture (50% Solvay, 50% INEOS) (see note F8Discontinued operations).
On December 9, 2015, Solvay acquired 100% of the shares ofCytec Industries Inc. (see note F22 Goodwill and businesscombinations).
The main impacts of this acquisition have been finalized withinthe measurement period (i.e. the 12 months followingDecember 9, 2015) and have been taken into account in theconsolidated statement of financial position as ofDecember 31, 2016:
Investments in joint operations3.1.3.
Investments in associates and joint ventures3.1.4.
Main changes in consolidation scope in prior year3.1.5.
The Cytec opening balance sheet has been fully consolidatedwithin the Solvay Group as from December 31, 2015 and isbased on the following:
the consideration for Cytec (€ 5,047 million);–the identifiable assets acquired and liabilities assumed afterremeasurement to fair value at acquisition date(€ 2,472 million); and
–
the final goodwill (€ 2,575 million versus provisional goodwillof € 2,598 million disclosed at year end 2015) correspondingto the difference between consideration and net assetsacquired, measured at fair value.
–
Cytec’s results and cash flows for the period betweenDecember 9 and December 31, 2015 were not material,except for acquisition-related expenses presented as resultsfrom portfolio management and reassessments.Consequently, Cytec did not contribute to the Group’s IFRS netincome or cash flows in 2015.
The acquisition was funded through a capital increase andperpetual hybrid bonds issuance (see note F18 Proceeds frombond issuance classified as equity and capital increase) anddebt issuance (see note F33 Net indebtedness).
In order to provide a reference frame for the results goingforward, on March 17, 2016 Solvay published unaudited proforma consolidated income statement and main cash flowmetrics for the year 2015. The figures represent a situation as ifthe acquisition had taken place on January 1, 2015 – see 2015Financial Management Report.
FINANCIAL STATEMENTS
140SOLVAY 2016 Annual Integrated Report

The individual financial statements of each Group entity areprepared in the currency of the primary economic environmentin which the entity operates (its functional currency). For thepurpose of the consolidated financial statements, the results andfinancial position of each Group entity are expressed in euros(EUR), which is the functional currency of the Company and thepresentation currency of the Group’s consolidated financialstatements.
In preparing the financial statements of the individual entities,transactions in currencies other than the entities’ functionalcurrency are recognized at the exchange rates prevailing at thedates of the transactions. At the end of each reporting period,monetary items denominated in foreign currencies are translatedat the closing rate.
Non-monetary items carried at fair value that are denominated inforeign currencies are translated at the rate when the fair valuewas measured. Non-monetary items that are measured in termsof historical cost in a foreign currency are not translated at theclosing rate.
Exchange differences are recognized in profit or loss in theperiod in which they arise except for:
The main exchange rates used are:
Year-end rate Average rate2016 2015 2016 2015
1 Euro =Argentine Peso ARS 16.7006 14.1601 16.3226 10.2349Brazilian Real BRL 3.4297 4.3117 3.8558 3.7014Yuan Renminbi CNY 7.3231 7.0608 7.3516 6.9729Pound Sterling GBP 0.8551 0.7340 0.8195 0.7259Japanese Yen JPY 123.3626 131.0700 120.1886 134.3069Russian Ruble RUB 64.2959 80.6736 74.1393 68.1152Thai Baht THB 37.7353 39.2480 39.0409 38.0270US Dollar USD 1.0538 1.0887 1.1068 1.1094
With respect to the mechanism set up by the European Unionto encourage manufacturers to reduce their greenhouse gasemissions, the Group was granted carbon dioxide (CO2) emissionrights for some of its installations. The Group is also involvedin the Clean Development Mechanism (CDM) under the Kyotoprotocol. Under these projects, the Group has deployed facilitiesin order to reduce greenhouse gas emissions at the relevant sitesin return for Certified Emission Reductions (CER).
In the absence of any IFRS regulating the accounting treatmentof CO2 emission rights, the Group applies the Trade/Productionmodel, according to which CO2 emission rights are presented asinventories if they will be consumed in the production processor as derivatives if they are held for trading. Energy Servicesis involved in CO2 instrument trading, arbitrage, and hedgingactivities. The net income or expenses from these activities arerecognized in other operating income for the industrialcomponent, where Energy Services sells the CO2 emission rightsgenerated by Solvay, as well as for the trading component, whereEnergy Services acts as a trader/broker with respect to those CO2emission rights.
Government grants are not recognized until there is reasonableassurance that the Group will comply with the conditionsattaching to them and that the grants will be received.
Government grants relating to the purchase of property, plant,and equipment are deducted from the cost of those assets. Theyare recognized in the consolidated statement of financial positionat their expected value at the moment of initial recognition. Thegrant is recognized in profit or loss over the depreciation periodof the underlying assets as a reduction of depreciation expense.
Other government grants are recognized as income on asystematic basis over the periods in which the related costs,which they are intended to compensate, are recognized.Government grants that are receivable as compensation forexpenses or losses already incurred or for the purpose of givingimmediate financial support to the Group with no future-relatedcosts are recognized in profit or loss in the period in which theybecome receivable.
Foreign currencies4.
exchange differences on foreign currency borrowings relatingto assets under construction for future productive use, whichare included in the cost of those assets when they areregarded as an adjustment to interest costs on those foreigncurrency borrowings;
exchange differences on transactions entered into in order tohedge certain foreign currency risks (see note F32 Financialinstruments and financial risk management for hedgeaccounting policies); and
exchange differences on monetary items receivable from orpayable to a foreign operation for which settlement is neitherplanned nor likely to occur in the foreseeable future (thereforeforming part of the net investment in the foreign operation),which are recognized initially in other comprehensive incomeunder “currency translation differences”.
CO2 emission rights5. Government grants6.
FINANCIAL STATEMENTS
SOLVAY 2016 Annual Integrated Report141

The Group performs annual impairment tests on (groups of)CGUs to which goodwill has been allocated, and each time thereare indicators that their carrying amount might be higher thantheir recoverable amount. This analysis requires management toestimate the future cash flows expected to be generated by theCGUs and a suitable discount rate in order to calculate presentvalue.
Further details are provided in note F28 Impairment of tangibleassets, intangible assets, and equity method investees.
The carrying amount of the deferred tax assets is reviewed ateach reporting date. The carrying amount of a deferred tax assetis reduced to the extent that it is no longer probable that theGroup will earn sufficient taxable profits against which thedeductions can be utilized. Any such reduction is reversed to theextent that it becomes probable that sufficient taxable profits willbe available.
Deferred tax assets other than tax loss carryforwards areanalyzed on a case-by-case basis, taking into account all relevantfacts and circumstances. For example, a zero taxable profit, afterdeducting the amounts paid to retirees under a defined benefitplan and for which a deductible temporary difference existed,can justify the recognition of the underlying deferred tax assets.Recognition of deferred tax assets for tax loss carryforwardsrequire a positive taxable profit during the year that enables theutilization of tax losses that originated in the past. Because ofuncertainties inherent to predicting such positive taxable profit,recognition of deferred tax assets from tax loss carryforwards isbased on a case-by-case analysis, which is usually based on five-year profit forecasts, except with respect to financial companiesfor which ten-year financial profit forecasts are considered highlypredictable and are consequently used.
The corporate tax reporting team, which has the overview of theGroup deferred tax positions, is involved in assessing deferredtax assets.
Further details are provided in note F7.B. Deferred taxes in theconsolidation statement of financial position.
The actuarial assumptions used in determining the definedbenefit obligations at December 31, as well as the annual cost,can be found in note F31 Provisions. All main employee benefitsplans are assessed annually by independent actuaries. Discountrates and inflation rates are defined centrally by management.The other assumptions (such as future salary increases andexpected rates of medical care cost increases) are defined at alocal level. All plans are supervised by the Group’s central HumanResources department with the help of a central actuary to checkthe acceptability of the results and ensure consistency inreporting.
Further details are provided in note F31.A. Provisions foremployee benefits.
Environmental provisions are managed and coordinated jointlyby the Environmental Rehabilitation department and the Financedepartment.
The forecasts of expenses are discounted to their present value.
The discount rates fixed by geographical area correspond to theaverage risk-free rate on 10-year government bonds. These ratesare set annually by the Finance department and can be revisedbased on the evolution of economic parameters of the countryinvolved.
To reflect the passage of time, the provisions are increased eachyear at the discount rates described above.
Further details are provided in note F31.B. Provisions other thanfor employee benefits.
Any significant litigation (tax and other, including threat oflitigation) is reviewed by Solvay’s in-house lawyers with thesupport, when appropriate, of external counsels at least everyquarter. This review includes an assessment of the need torecognize provisions and/or remeasure existing provisionstogether with the Finance department and the Insurancedepartment.
Further details are provided in note F31.B. Provisions other thanfor employee benefits.
Critical accounting judgments and key sources ofestimation uncertaintyImpairment
Deferred tax assets
Employee benefits obligations
Environmental provisions
Provisions for litigations
FINANCIAL STATEMENTS
142SOLVAY 2016 Annual Integrated Report

In accordance with IFRS 3 Business Combinations, the Groupmeasures the identifiable assets acquired and (contingent)liabilities assumed in a business combination at fair value. Fairvalue adjustments are based on external appraisals or valuationmodels, e.g. for contingent liabilities and intangible assets whichwere not recognized by the acquiree. Internal benchmarks areoften used for valuing specific production equipment. All of thesevaluation methods rely on various assumptions such asestimated future cash flows, remaining useful economic life, etc.
Further details are provided in note F22 Goodwill and businesscombinations.
Assets are classified as held for sale if their carrying amountwill be recovered through a sale transaction rather than throughcontinuing use. This condition is regarded as met only when thesale is highly probable and the asset is available for immediatesale in its present condition. Amongst other conditions,management must be committed to the sale, which should beexpected to qualify for recognition as a completed sale withinone year from the date of classification. However, in some cases,an asset may remain classified as held for sale for a periodexceeding one year if it remains unsold due to events orcircumstances beyond the Group’s control.
As a disposal within 12 months was considered highly probableon December 31, 2015, Solvay Indupa remained classified asnon-current assets held for sale and discontinued operationsat that date. On December 7, 2016, Solvay obtained clearancefrom the Brazilian antitrust authority, CADE, for the agreed saleof its 70.59% stake in Solvay Indupa to chemical group UniparCarbocloro. Completion of the transaction, at a total enterprisevalue of US$ 202.2 million, took place on December 27, 2016.The related impairment has been derived from the expected netcash flows.
On December 7, 2016, Solvay reached an agreement to sell itscellulose acetate tow business, Acetow, to private equity fundsmanaged by Blackstone. Completion of the transaction isexpected in the first half of 2017 and is subject to the customarysocial procedures and approval by the relevant antitrustauthorities.
On December 14, 2016, Solvay signed a definitive agreement tosell its 58.77% stake in its Thai subsidiary Vinythai PCL toJapanese company AGC Asahi Glass, thereby exiting its Asianpolyvinyl chloride (PVC) activities. Completion of the transactionwas subject to customary closing conditions, including antitrustapprovals, and was closed on February 22, 2017.
Further details are provided in note F25 Assets held for sale.
Solvay contributed its chlorovinyls business in the joint ventureInovyn on July 1, 2015.
The fair value of the derivative financial instrument representingthe additional performance-based payment that Solvay wouldreceive for its exit from Inovyn amounted to € 244 million atDecember 31, 2015. Its fair value was based largely on level 3inputs, namely contractually defined REBITDA multiples,comparing the expected exit price against the fair value ofSolvay’s 50% equity share held in Inovyn. It increased to€ 335 million following the binding agreement signed with INEOSon March 31, 2016 for an early exit. It was settled on July 7, 2016.
Further details are provided in note F32 Financial instrumentsand financial risk management.
Solvay considers that it continues to control the key relevantactivities of its Venezuelan operations. In case of a loss of controlover the Venezuelan legal entity, currency translationadjustments of € (60) million would be recycled to theconsolidated income statement.
Preliminary comment: consistent with the presentation in theconsolidated income statement, the notes to the consolidatedincome statement as presented hereinafter do not include theconsolidated income statement impacts from discontinuedoperations that are presented on a separate line. Those aredisclosed in note F8 Discontinued operations. As a consequence,the comparative numbers presented in the notes hereinafter aredifferent from the ones published in the 2015 Annual Reportdue to the impacts from Acetow and Emerging Biochemicals thatwere presented as discontinued operations as from 2016.
Fair value adjustments for business combinations
Classification as held for sale
Solvay Indupa
Acetow
Emerging Biochemicals
Fair value level 3 assessmentInovyn
Control assessment
Notes to the consolidated income statement
FINANCIAL STATEMENTS
SOLVAY 2016 Annual Integrated Report143
An Operating Segment is a component of the Group thatengages in business activities from which it may earn revenuesand incur expenses, whose operating results are regularlyreviewed by the entity’s chief operating decision maker, and forwhich discrete financial information is available. The SolvayGroup’s chief operating decision maker is the Chief ExecutiveOfficer.
Net sales comprise the sales of goods and value-added servicescorresponding to Solvay’s know-how. Net sales and otherrevenue are measured at the fair value of the considerationreceived or receivable, net of returns, rebates and trade benefitsgranted, and sales tax.
Revenue from non-core activities primarily includes commodityand utility trading transactions and other revenue deemedincidental by the Group.
Net sales and other revenue are recognized when all thefollowing conditions have been satisfied:
Solvay is organized into five Operating Segments. As ofJanuary 1, 2016, following the acquisition of Cytec, Solvay has re-organized its business segments to enhance strategic coherenceand improve business alignment. Cytec’s former “AerospaceMaterials” and “Industrial Materials” activities are included inAdvanced Materials as the GBU “Composite Materials”, while its“In Process Separation” and “Additive Technologies” activities areincluded in Advanced Formulations, largely as the GBU“Technology Solutions“. Solvay's GBU “Coatis” is transferred toPerformance Chemicals.
NOTE F1Segment information
Accounting policy
the Group has transferred to the buyer the significant risksand rewards of ownership of the goods or, with respect tothe rendering of services, the stage of completion can bemeasured reliably;
the Group retains neither continuing managerial involvementto the degree usually associated with ownership nor effectivecontrol over the goods sold;
the amount of revenue can be measured reliably;
it is probable that the future economic benefits associatedwith the transaction will flow to the Group; and
the costs incurred or to be incurred in respect of thetransaction can be measured reliably.
General
Advanced Materials offers high-performance materials formultiple applications primarily in the automotive, aerospace,electronics, and health markets. In particular, it providessustainable mobility solutions, reducing weight and improvingCO2 and energy efficiency.
Advanced Formulations serves primarily the consumer goods,agro and food, as well as energy markets. It offers customizedspecialty formulations that impact surface chemistry and alterliquid behavior, to optimize efficiency and yield, whileminimizing the environmental impact.
Performance Chemicals operates in mature and resilientmarkets with leading positions in chemical intermediates.Success is based on economies of scale and state-of-the-artproduction technology. It serves mainly the consumer goodsand food markets.
Functional Polymers produces and sells polyamide and PVCpolymers and compounds and has leading positions indifferent regions, with a focus on excellence initiatives. It mainlyserves the automotive, construction, consumer goods, andbuilding markets.
Corporate & Business Services includes corporate and otherbusiness services, such as the Research & Innovation Center.It also incorporates the GBU Energy Services, whose mission isto optimize energy consumption and reduce CO2 emissions.
FINANCIAL STATEMENTS
144SOLVAY 2016 Annual Integrated Report

2016In € millionIncome statement items
AdvancedFormulations
AdvancedMaterials
PerformanceChemicals
FunctionalPolymers
Corporate &Energy Group Total
Net sales (including the inter-segment sales) 2,671 4,313 2,481 1,442 7 10,914Inter-segment sales (3) 0 (21) (6) 0 (30)
Net sales 2,668 4,313 2,460 1,436 7 10,884Gross margin 695 1,398 724 254 18 3,090Depreciation and amortization 292 413 250 104 111 1,169Earnings from associates and joint ventures 8 8 20 50 (1) 85Underlying EBITDA(1) 484 1,110 695 222 (227) 2,284EBIT 962Net financial charges (339)Income taxes 56Profit (loss) for the year from discontinuedoperations (6)Profit (loss) for the year 674
(1) Underlying EBITDA is a key performance indicator followed by management (see Business Review section).
2016In € millionStatement of financial position and other items
AdvancedFormulations
AdvancedMaterials
PerformanceChemicals
FunctionalPolymers
Corporate &Energy Group Total
Capital expenditures (continuing operations) 134 435 186 95 79 929Capital expenditures (discontinued operations) 37 14 51Investments (continuing operations) 16 4 0 0 44 64Investments (discontinuing operations) 33 33
Working capitalInventories 388 794 279 199 11 1,672Trade receivables 365 571 417 186 82 1,621Trade payables 293 429 357 213 255 1,547
Capital expenditures are related to tangible and intangible assets.
In 2016, the investment of € 44 million within Corporate & Energy relates to the Cytec acquisition.
Information per segment
FINANCIAL STATEMENTS
SOLVAY 2016 Annual Integrated Report145

Information per segment for 2015 as presented below takes into account the new organization of the Operating Segments applicable asfrom 2016.
2015In € millionIncome statement items
AdvancedFormulations
AdvancedMaterials
PerformanceChemicals
FunctionalPolymers
Corporate &Energy Group Total
Net sales (including the inter-segmentsales) 2,258 3,341 2,561 1,543 11 9,715
Inter-segment sales (3) (7) (35) (53) 0 (99)Net sales 2,254 3,334 2,526 1,490 11 9,615Gross margin 548 1,107 686 219 5 2,566Depreciation and amortization 181 267 165 106 72 791Earnings from associates and jointventures 9 8 20 (14) (1) 21Underlying EBITDA(1) 348 836 628 141 (209) 1,744EBIT 695Net financial charges (222)Income taxes (69)Profit (loss) for the year fromdiscontinued operations 51Profit (loss) for the year 454
(1) Underlying EBITDA is a key performance indicator followed by management. In the Business Review section, 2015 Underlying EBITDA (€ 2,125 million) isreported on a pro forma basis as if Cytec had been consolidated as from January 1, 2015, which leads to add Cytec 2015 Underlying EBITDA (€ 381 million)to the Underlying EBITDA without Cytec (€ 1,744 million).
2015In € millionStatement of financial position and otheritems
AdvancedFormulations
AdvancedMaterials
PerformanceChemicals
FunctionalPolymers
Corporate &Energy Group Total
Capital expenditures (continuingoperations) 204 340 267 81 77 969Capital expenditures (discontinuedoperations) 0 68 68Investments (continuing operations) 23 22 0 13 4,901 4,960
Working capitalInventories 409 892 324 221 21 1,867Trade receivables 342 540 458 221 54 1,615Trade payables 277 439 356 229 259 1,559
Capital expenditures are related to tangible and intangible assets.
In 2015, the investment of € 4,901 million within Corporate & Energy relating to Cytec. It represented the difference between the totalconsideration plus acquisition-related expenses (€ 5,099 million) and the cash acquired from Cytec (€ 198 million).
FINANCIAL STATEMENTS
146SOLVAY 2016 Annual Integrated Report
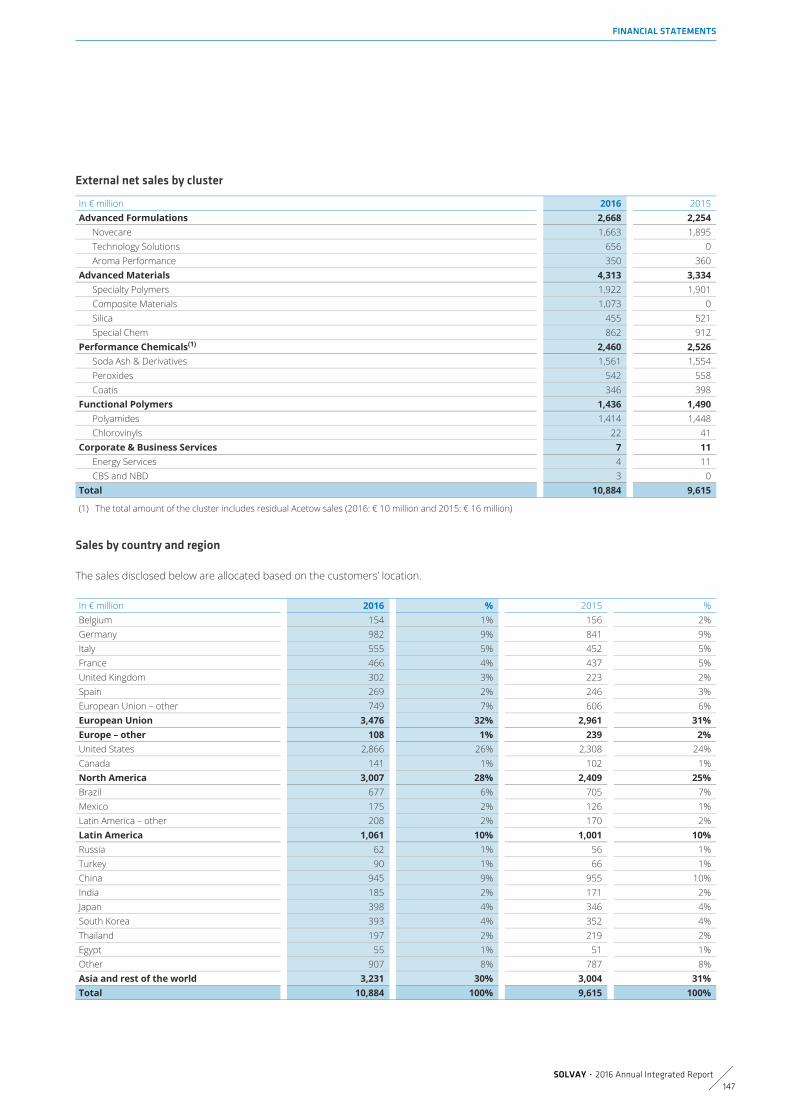
In € million 2016 2015Advanced Formulations 2,668 2,254
Novecare 1,663 1,895Technology Solutions 656 0Aroma Performance 350 360
Advanced Materials 4,313 3,334Specialty Polymers 1,922 1,901Composite Materials 1,073 0Silica 455 521Special Chem 862 912
Performance Chemicals(1) 2,460 2,526Soda Ash & Derivatives 1,561 1,554Peroxides 542 558Coatis 346 398
Functional Polymers 1,436 1,490Polyamides 1,414 1,448Chlorovinyls 22 41
Corporate & Business Services 7 11Energy Services 4 11CBS and NBD 3 0
Total 10,884 9,615
(1) The total amount of the cluster includes residual Acetow sales (2016: € 10 million and 2015: € 16 million)
The sales disclosed below are allocated based on the customers’ location.
In € million 2016 % 2015 %Belgium 154 1% 156 2%Germany 982 9% 841 9%Italy 555 5% 452 5%France 466 4% 437 5%United Kingdom 302 3% 223 2%Spain 269 2% 246 3%European Union – other 749 7% 606 6%European Union 3,476 32% 2,961 31%Europe – other 108 1% 239 2%United States 2,866 26% 2,308 24%Canada 141 1% 102 1%North America 3,007 28% 2,409 25%Brazil 677 6% 705 7%Mexico 175 2% 126 1%Latin America – other 208 2% 170 2%Latin America 1,061 10% 1,001 10%Russia 62 1% 56 1%Turkey 90 1% 66 1%China 945 9% 955 10%India 185 2% 171 2%Japan 398 4% 346 4%South Korea 393 4% 352 4%Thailand 197 2% 219 2%Egypt 55 1% 51 1%Other 907 8% 787 8%Asia and rest of the world 3,231 30% 3,004 31%Total 10,884 100% 9,615 100%
External net sales by cluster
Sales by country and region
FINANCIAL STATEMENTS
SOLVAY 2016 Annual Integrated Report147

Invested capital Capital expenditures and investmentsIn € million 2016 % 2015 % 2016 % 2015 %Belgium 2,155 12% 2,838 14% (28) 3% (17) 0%Germany 765 4% 746 4% (46) 5% (59) 1%Italy 743 4% 762 4% (83) 8% (86) 1%France 1,922 10% 1,952 10% (188) 19% (160) 3%United Kingdom 235 1% 205 1% (40) 4% (8) 0%Spain 142 1% 147 1% (18) 2% (17) 0%European Union– other 408 2% 678 3% (55) 6% (63) 1%EuropeanUnion 6,370 35% 7,328 37% (458) 46% (410) 7%Europe – other 81 0% 4 0% 0 0% (15) 0%United States(1) 9,008 49% 9,075 46% (309) 31% (5,126) 86%Canada 212 1% 212 1% (8) 1% 0 0%North America 9,220 50% 9,287 47% (317) 32% (5,126) 86%Brazil 570 3% 447 2% (37) 4% (49) 1%Argentina 0 0% 20 0% (2) 0% 0 0%Latin America –other 63 0% 91 0% (3) 0% (1) 0%Latin America 633 3% 559 3% (41) 4% (50) 1%Russia 228 1% 141 1% 0 0% (14) 0%Thailand 127 1% 424 2% (4) 0% (21) 0%China 798 4% 869 4% (66) 7% (165) 3%South Korea 269 1% 230 1% (69) 7% (31) 1%India 237 1% 230 1% (8) 1% (16) 0%Singapore 81 0% 80 0% (3) 0% (24) 0%Japan 84 0% 87 0% (1) 0% (2) 0%Egypt 10 0% 111 1% 0 0% (1) 0%Other 266 1% 229 1% (29) 3% (54) 1%Asia and restof the world 2,099 11% 2,402 12% (181) 18% (327) 6%Total 18,404 100% 19,579 100% (997) 100% (5,927) 100%
(1) In 2015, the amounts reported included the acquisition of Cytec (see note F22 Goodwill and business combinations)
Invested capital includes the non-current assets (excluding the deferred taxes), inventories, and trade receivables and payables. Capitalexpenditures and investments include acquisitions of tangible and intangible assets, investments in subsidiaries, and other investments.Both exclude discontinued operations.
Invested capital, capital expenditures, and investments by country and region
FINANCIAL STATEMENTS
148SOLVAY 2016 Annual Integrated Report
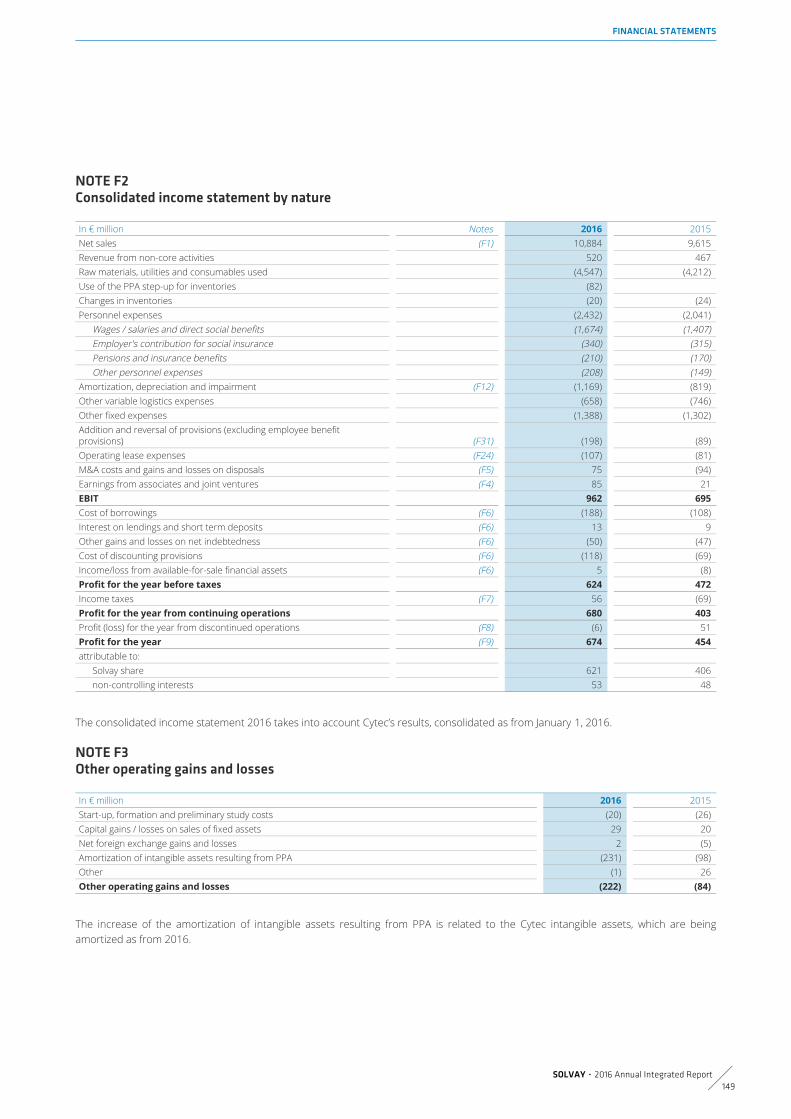
In € million Notes 2016 2015Net sales (F1) 10,884 9,615Revenue from non-core activities 520 467Raw materials, utilities and consumables used (4,547) (4,212)Use of the PPA step-up for inventories (82)Changes in inventories (20) (24)Personnel expenses (2,432) (2,041)
Wages / salaries and direct social benefits (1,674) (1,407)Employer's contribution for social insurance (340) (315)Pensions and insurance benefits (210) (170)Other personnel expenses (208) (149)
Amortization, depreciation and impairment (F12) (1,169) (819)Other variable logistics expenses (658) (746)Other fixed expenses (1,388) (1,302)Addition and reversal of provisions (excluding employee benefitprovisions) (F31) (198) (89)Operating lease expenses (F24) (107) (81)M&A costs and gains and losses on disposals (F5) 75 (94)Earnings from associates and joint ventures (F4) 85 21EBIT 962 695Cost of borrowings (F6) (188) (108)Interest on lendings and short term deposits (F6) 13 9Other gains and losses on net indebtedness (F6) (50) (47)Cost of discounting provisions (F6) (118) (69)Income/loss from available-for-sale financial assets (F6) 5 (8)Profit for the year before taxes 624 472Income taxes (F7) 56 (69)Profit for the year from continuing operations 680 403Profit (loss) for the year from discontinued operations (F8) (6) 51Profit for the year (F9) 674 454attributable to:
Solvay share 621 406non-controlling interests 53 48
The consolidated income statement 2016 takes into account Cytec’s results, consolidated as from January 1, 2016.
In € million 2016 2015Start-up, formation and preliminary study costs (20) (26)Capital gains / losses on sales of fixed assets 29 20Net foreign exchange gains and losses 2 (5)Amortization of intangible assets resulting from PPA (231) (98)Other (1) 26Other operating gains and losses (222) (84)
The increase of the amortization of intangible assets resulting from PPA is related to the Cytec intangible assets, which are beingamortized as from 2016.
NOTE F2Consolidated income statement by nature
NOTE F3Other operating gains and losses
FINANCIAL STATEMENTS
SOLVAY 2016 Annual Integrated Report149

The net income of the associates and joint ventures amounts to € 85 million in 2016 against € 21 million in 2015. The increase is duemainly to RusVinyl’s improved operating and financial performance.
Following the ESMA Guidelines on Alternative PerformanceMeasures issued on June 30, 2015 and effective as fromJuly 3, 2016, Solvay has split the non-recurring items into twoitems: (a) Results from portfolio management andreassessments, and (b) Results from legacy remediation andmajor litigations. The sum of these two items is equal to what waspreviously labeled “non-recurring items”, before reclassificationto discontinued operations.
Results from portfolio management and reassessments include:
Results from legacy remediation and major litigations include:
In € million 2016 2015Restructuring costs and impairment (239) (111)M&A costs and gains and losses on disposals 75 (94)Results from portfolio management and reassessments (164) (205)
In € million 2016 2015Major litigations (14) 8Remediation costs and other costs related to non-ongoing activities (42) (45)Results from legacy remediation and major litigations (56) (36)
In 2016, these items relate primarily to:
NOTE F4Earnings from associates and joint ventures
NOTE F5Results from portfolio management and reassessments, legacy remediation and major litigations
Accounting policy
gains and losses on the sale of subsidiaries, joint operations,joint ventures, and associates that do not qualify asdiscontinued operations;
acquisition costs of new businesses;
gains and losses on the sale of real estate not directly linked toan operating activity;
restructuring charges driven by portfolio management andreassessment, including impairment losses resulting from theshutdown of an activity or a plant; and
impairment losses resulting from testing of CGUs.
the remediation costs not generated by on-going productionfacilities (shut-down of sites, discontinued productions,previous years’ pollution); and
the impact of significant litigations.
Results from portfolio management and reassessments
Results from legacy remediation and major litigations
restructuring costs and impairment relating to:
the mothballing of the Soda Ash plant in Egypt (€ (112)million);
–
the divestment decision of the US torrefied biomasselectricity generation project (€ (39) million);
–
the resizing of Solvay’s shared services due to the changes inthe Group’s portfolio (€ (40) million);
–
the impact of adverse market conditions on the Brazilianelectricity cogeneration assets (€ (28) million);
–
M&A costs and gains and losses on disposals:
gain on Inovyn divestment (€ 71 million);–loss on the disposal of a peroxide business in Bussi (Italy) (€(13) million);
–
gain following additional reversal of the holdback included inthe Chemlogics purchase price and subject to performanceconditions not reached in 2016 (€ 49 million); and
–
M&A acquisition costs for € (25) million.–
FINANCIAL STATEMENTS
150SOLVAY 2016 Annual Integrated Report

In 2015, these items related primarily to:
In addition, an amount of € 3 million was transferred to discontinuedoperations,sothatthesumoftheabovementioneditemsrelatingto2015is equal to what was previously presented as non-recurring in the 2015IFRS consolidated financial statements.
Interest on borrowings is recognized in costs of borrowings asincurred, with the exception of borrowing costs directlyattributable to the acquisition, construction, and production ofqualifying assets (see note F23 Tangible assets).
Net foreign exchange gains or losses on financial items andchanges in fair value of derivative financial instruments arepresented in “Other gains and losses on net indebtedness”, withthe exception of changes in fair value of derivative financialinstruments that are hedging instruments in a cash flow hedgerelationship, and which are recognized on the same line as thehedged item, when the latter affects profit or loss.
In € million 2016 2015Cost of borrowing (188) (108)Interest on lendings and short term deposits 13 9Other gains and losses on net indebtedness (50) (47)Net cost of borrowing (226) (146)Cost of discounting provisions (118) (69)Income/loss from available-for-sale financial assets 5 (8)Net financial charges (339) (222)
Details are included in note F33 Net indebtedness.
The increase of the cost of borrowing is explained mainly by:
The other gains and losses on net indebtedness increasedslightly from € (47) million in 2015 to € (50) million in 2016. Thisincrease is explained mainly by:
The increase of cost of discounting provisions relates to post-employment benefits (€ (23) million) and to environmentalprovisions (€ (26) million) and is mainly explained by the evolutionof the applicable discount rates.
The current tax payable is based on taxable profit of the year.Taxable profit differs from profit as reported in the consolidatedincome statement because of items of income or expense thatare taxable or deductible in other years and items that are nevertaxable or deductible. The Group’s liability for current tax iscalculated using tax rates that have been enacted orsubstantively enacted by the end of the reporting period.
restructuring costs and impairment relating to:
restructuring costs (€ (57)million), duemainly to theresizing ofSolvayFunctions following the changes in the Group’s portfolio (€ (35)million);
–
the fluorite mine in Bulgaria (€ (25) million);–the divestment of Plextronics (€ (8) million);–
M&A costs and gains and losses on disposals:
Cytec acquisition-related expenses (€ (130) million) mainlycomposed of advisory services (see note F22 Goodwill andbusiness combinations); and
–
M&A costs impacted mainly by a partial reversal of the holdback(€ 25 million) included in the Chemlogics purchase price andsubject to performance conditions not reached in 2015.
–
NOTE F6Net financial charges
Accounting policy
the costs relating to the bonds issued in December 2015 forfinancing the acquisition of Cytec (€ 2,250 million senior €notes and US$ 1,600 million senior US$ notes), and to the US$732 million senior notes of Cytec Industries which amount to €123 million in 2016 (€ 8 million in December 2015); and
the lower costs (€ (30) million) relating to the repayment of the€ 300 million European Investment Bank (EIB) loan in January2016 and of the € 500 million hybrid bond in June 2016.
€ (48) million of currency swaps (mainly €/US$ swaps onintercompany financing of the Cytec acquisition and BRL/US$swaps on intercompany financing) as against € (19) million in 2015;and
a loss of € (25) million in 2015 due to Venezuelan hyperinflationaccounting – see note F11 Consolidated statement ofcomprehensive income).
NOTE F7Income taxes
Accounting policy
Current taxes
FINANCIAL STATEMENTS
SOLVAY 2016 Annual Integrated Report151

Deferred tax is recognized for temporary differences betweenthe carrying amounts of assets and liabilities in the consolidatedfinancial statements and their corresponding tax bases used inthe computation of taxable profit.
Deferred tax assets are generally recognized for all deductibletemporary differences, to the extent that it is probable thattaxable profits will be available against which those deductibletemporary differences can be utilized.
Deferred tax liabilities are generally recognized for all taxabletemporary differences.
No deferred tax liabilities are recognized following the initialrecognition of goodwill. In addition, no deferred tax assets orliabilities are recognized with respect to the initial recognition of anasset or liability in a transaction which is not a business combinationand affects neither accounting profit nor taxable profit.
Deferred tax liabilities are recognized for taxable temporarydifferences associated with investments in subsidiaries, jointoperations, joint ventures, and associates, except where theGroup is able to control the timing of the reversal of thetemporary difference and it is probable that the temporarydifference will not reverse in the foreseeable future.
The carrying amount of the deferred tax assets is reviewed at eachreporting date. The carrying amount of a deferred tax asset isreduced to the extent that it is no longer probable that the Group willearn sufficient taxable profits against which the deductions can beutilized. Any such reduction is reversed to the extent that it becomesprobable that sufficient taxable profits will be available.
Deferred tax assets other than tax loss carryforwards areanalyzed on a case-by-case basis, taking into account all relevantfacts and circumstances. For example, a zero taxable profit, afterdeducting the amounts paid to retirees under a defined benefitplan and for which a deductible temporary difference existed,can justify the recognition of the underlying deferred tax assets.Recognition of deferred tax assets for tax loss carryforwardsrequire a positive taxable profit during the year that enables the
utilization of tax losses that originated in the past. Because ofuncertainties inherent to predicting such positive taxable profit,recognition of deferred tax assets from tax loss carryforwards isbased on a case-by-case analysis, which is usually based on five-year profit forecasts, except with respect to financial companiesfor which ten-year financial profit forecasts are considered highlypredictable and are consequently used.
The corporate tax reporting team, which has the overview of theGroup deferred tax positions, is involved in assessing deferred taxassets.
Further details are provided in note F7.B.
Deferred tax assets and liabilities are measured at the tax ratesthat are expected to apply in the period in which the liabilityis settled or the asset is realized, based on tax rates (and taxlaws) that have been enacted or substantively enacted by theend of the reporting period. The measurement of deferred taxliabilities and assets reflects the tax consequences that wouldfollow from the manner in which the Group expects, at the endof the reporting period, to recover or settle the carrying amountof its assets and liabilities.
Deferred tax assets and liabilities are offset when there is alegally enforceable right to set off current tax assets againstcurrent tax liabilities, and when they relate to income taxes leviedby the same taxation authority and the Group intends to settleits current tax assets and liabilities on a net basis.
Current and deferred taxes for the period are recognized as anexpense or income in profit or loss, except when they relateto items that are recognized outside profit or loss (whether inother comprehensive income or directly in equity), in which casethe tax is also recognized outside profit or loss, or when theyarise from the initial accounting for a business combination. Inthe case of a business combination, the tax effect is taken intoaccount in the accounting for the business combination.
In € million Notes 2016 2015Current taxes related to current year (213) (178)Current taxes related to prior years 4 112Deferred income taxes 270 (6)Deferred tax impact of changes in the nominal tax rates (5) 2Total income taxes recognized in the consolidated income statement 56 (69)
In € million Notes 2016 2015Income tax on items recognized in other comprehensive income (F11) 56 (20)
Deferred taxes
Current and deferred taxes for the period
F7.A. Income taxes
FINANCIAL STATEMENTS
152SOLVAY 2016 Annual Integrated Report

The current taxes relating to prior years (€ 4 million) include thenet tax adjustments for transfer pricing audits in Belgium and inSpain.
The specific items of the year that significantly contribute to thedeferred tax income include mainly:
In 2015, the current taxes relating to prior years (€ 112 million)include the reversal of provisions for tax risks (€ 66 million) andtrue-ups in the United States after significant changes inportfolio.
The effective income tax expense has been reconciled with thetheoretical tax expense obtained by applying to the pre-tax profitof each Group entity the nominal tax rate prevailing in thecountry in which it operates.
In € million 2016 2015Profit for the year before taxes 624 472Earnings from associates and joint ventures 85 21Profit for the year before taxes excluding earnings from associates and joint ventures 539 451Reconciliation of the tax chargeTotal tax charge of the Group entitites computed on the basis of the respective local nominal rates (141) (173)Weighted average nominal rate 26% 38%Tax effect of permanent differences 36 136Tax effect on distribution of dividends (17) (4)Tax effect of changes in tax rates (4) 1Tax effect of current and deferred tax adjustments related to prior years 12 5Changes in unrecognized deferred tax assets 170 (35)Effective tax charge 56 (69)Effective tax rate (9)% 15%
The weighted average nominal rate in 2016 was 12% lower thanin 2015, due to the lower weight of earnings before tax incountries with a higher tax rate (mainly United States) and tothe higher weight of earnings before tax (including results fromportfolio management and reassessment) in countries with alower tax rate.
Significant changes in effective tax rate from 15% in 2015 to (9)%in 2016 result from:
The gain arising from the early exit in 2016 from the joint venturewith INEOS (€ 76 million in Solvay Chlorovinyls Holding) and the€ 19 million reversal of a provision in Solvay Pharmaceuticals hadno tax impact in the consolidated income statement as they wereoffset against unrecognized prior year tax losses.
the deferred tax income resulting from the amortization of thePurchase Price Allocation step-up (€ 100 million);
the recognition of previously unrecognized deferred tax assetson (a) employee benefits obligations and other temporarydifferences in Solvay SA (€ 65 million) and (b) tax losscarryforwards (€ 39 million) due to improved profitabilityexpectations at the level of Solvay SA for future years; and
the recognition of previously unrecognized deferred tax assetson employee benefits obligations and other temporarydifferences in the United Kingdom (€ 93 million) due to theGroup Relief regime which allows the deduction of the lossesof Solvay Solutions UK from the post-acquisition profits ofCytec companies.
Reconciliation of the income tax expense
recognition of higher deferred tax assets in 2016 (€ 205 millionversus 2015) mainly for previously unrecognized deferred taxassets in Belgium (€ 104 million) and in the United Kingdom (€93 million)
partially offset by the negative tax impact of lower permanentdifferences in 2016 (€ (100) million versus 2015), due to thereversal of provisions for tax litigation for € 66 million in 2015and non-deductible capital losses in 2016.
FINANCIAL STATEMENTS
SOLVAY 2016 Annual Integrated Report153

2016In € million
Openingbalance
Recognizedin incomestatement
Recognized inother
comprehensiveincome
Exchangerate
effectCytec
acquisition
Otheracquisition/
disposal
Transferto assetheld for
sale OtherClosingbalance
TemporarydifferencesEmployee benefitsobligations 328 92 71 3 (29) 0 (29) 1 435Provisions other thanemployee benefits 199 36 (3) 9 7 0 (3) (1) 244Tangible and intangibleassets (1,361) 64 (36) 16 (3) 76 (1) (1,246)Goodwill 23 (7) 0 (1) 15Tax losses 373 44 7 6 (1) (5) 19 444Tax credits 86 (8) (1) (43) 0 35Assets held for sale (2) (3) 6Other (44) 48 (11) (1) 61 0 2 1 55Total (net amount) (396) 266 56 (19) 16 (4) 37 25 (19)Deferred tax assets inthe consolidatedstatement of financialposition 1,059 890Deferred tax liabilities inthe consolidatedstatement of financialposition (1,456) (909)
In 2016, the total of deferred tax assets amounts to€ 3,667 million of which € 2,777 million are not recognized.
The unrecognized deferred tax assets result from (i) lossescarried forward (€ 7,190 million mainly in holding companiesincluding Solvay SA and Rhodia SA since 2011) for which deferredtax assets (€ 2,235 million) have not been recognized and (ii)deferred tax assets on other temporary differences (€ 542 millionacross the Group), mainly on employee benefits obligations inFrance (€ 351 million).
The line Other includes deferred tax liabilities relating tounremitted earnings from Solvay affiliates, and amounting to€ 23 million in 2016 (€ 23 million in 2015). In that respect, anamount of € 62 million (excluding Cytec) is not recognized, asthe Group controls the timing of the reversal of the temporary
differences and as it is probable that they will not reverse inthe foreseeable future. The Cytec unremitted earnings will bepermanently reinvested, including for pre-acquisition and post-acquisition profits, and accordingly no deferred tax liabilities havebeen recognized.
Recognized deferred tax assets, for which utilization dependson future taxable profits in excess of the profit arising from thereversal of existing taxable temporary differences within entitiesthat have suffered a tax loss in either current or preceding yearin the related tax jurisdiction, amount to € 475 million. Thisrecognition is justified by favorable expectations as to futuretaxable profits.
F7.B. Deferred taxes in the consolidated statement of financial position
FINANCIAL STATEMENTS
154SOLVAY 2016 Annual Integrated Report

2015In € million
Openingbalance
Recognizedin incomestatement
Recognized inother
comprehensiveincome
Exchangerate effect
Cytecacquisition
Otheracquisition/
disposal
Transferto
asset heldfor sale Other
Closingbalance
TemporarydifferencesEmployee benefitsobligations 234 (13) (13) 7 97 (2) 6 11 328Provisions other thanemployee benefits 136 (19) 1 3 59 7 13 (1) 199Tangible and intangibleassets (521) 29 (7) (6) (862) 1 4 1 (1,361)Goodwill 31 (8) 23Tax losses 386 1 (6) 2 0 (12) 373Tax credits 11 29 1 44 2 86Assets held for sale 8 3 (14) 3Other 57 (28) (1) 3 (76) (2) 3 (44)Total (net amount) 333 0 (20) 2 (735) 7 0 17 (396)Deferred tax assets inthe consolidatedstatement of financialposition 710 1,059Deferred tax liabilities inthe consolidatedstatement of financialposition (378) (1,456)
In 2015, the total of deferred tax assets amounts to€ 4,129 million of which € 3,070 million are not recognized.
The unrecognized deferred tax assets result from (i) lossescarried forward (€ 7,070 million mainly in holding companiesincluding Solvay SA and Rhodia SA since 2011) for which relativedeferred tax assets (€ 2,283 million) were not recognized and (ii)deferred tax assets on other temporary differences (€ 787 millionacross the Group), mainly on employee benefits obligations(€ 502 million, most of them in Belgium (€ 70 million), France(€ 333 million), and the United Kingdom (€ 82 million)).
The deferred taxes on tangible and intangible assets relating tothe Cytec acquisition relate mainly to the step-up to fair value onintangible assets.
For the majority of the Group’s tax loss carryforwards, nodeferred tax assets have been recognized. The unrecognized taxlosses are located mainly in countries where they can be carriedforward indefinitely.
The tax loss carryforwards generating deferred tax assets aregiven below by expiration date.
In € million 2016 2015Within 1 year 5 8Within 2 years 17 16Within 3 years 21 28Within 4 years 42 32Within 5 or more years 278 174No time limit 1,035 937Total of tax losses carried forward which have generated recognized deferred tax assets 1,397 1,194Tax losses carried forward for which no deferred tax assets were recognized 7,190 7,070Total of tax losses carried forward 8,587 8,263
In 2016, the tax losses carryforwards (€ 1,397 million) havegenerated deferred tax assets of € 444 million.
In 2015, the tax losses carryforwards (€ 1,194 million) havegenerated deferred tax assets of € 373 million.
Other information
FINANCIAL STATEMENTS
SOLVAY 2016 Annual Integrated Report155

A discontinued operation is a component of the Group which theGroup has disposed of or which is classified as held for sale (seenote F25 Assets held for sale), and which:
A component of the Group consists of operations and cash flows,which can be clearly distinguished, operationally and for financialreporting purposes, from the rest of the Group.
In the consolidated statement of comprehensive income, theconsolidated statement of cash flows, and disclosures,discontinued operations are re-presented for prior periods.
2016In € million Indupa Acetow
EmergingBiochemicals Other Total
Sales 478 531 404 0 1,414Breakdown discontinued operationsLoss recognised as result ofremeasurement to fair value less costs tosell (63) (63)EBIT(1) (95) 116 30 16 68Financial result (31) (4) (2) 0 (37)Tax (3) (33) 0 0 (36)Profit (loss) from discontinuedoperations (129) 79 28 16 (6)
attributable to:Solvay share (126) 79 12 16 (19)non-controlling interests (3) 0 16 0 13
(1) Including recycling of currency translation adjustments for Indupa (€ (55) million).
2015In € million Indupa Chlorovinyls Acetow
EmergingBiochemicals Other Total
Sales 529 965 526 437 0 2,456Breakdown discontinued operationsLoss recognised as result ofremeasurement to fair value less costs tosell (88) (88)EBIT (68) 102 116 22 (16) 156Financial result (33) (2) (3) (1) 0 (39)Tax 5 (41) (28) 0 (2) (66)Profit (loss) from discontinuedoperations (96) 59 85 21 (18) 51
attributable to:Solvay share (86) 44 85 11 (18) 36non-controlling interests (10) 15 0 10 0 15
NOTE F8Discontinued operations
Accounting policy
represents a separate major line of business or geographicalarea of operations
is part of a single coordinated plan to dispose of a separatemajor line of business or geographical area of operations or
is a subsidiary acquired exclusively with a view to resale.
FINANCIAL STATEMENTS
156SOLVAY 2016 Annual Integrated Report

Profit for the year amounts to € 674 million as against € 454 million in the previous year.
Due to the changes in consolidation scope, the Business Review section provides an analysis of profit for the year on a pro forma basisas if Cytec had been acquired on January 1, 2015.
The basic earnings per share are obtained by dividing profit for the year by the number of shares.
The diluted earnings per share are obtained by dividing profit for the year by the number of shares plus the number of potentiallydiluting shares attached to the issuance of share options. For the purpose of calculating diluted earnings per share, there were noadjusting elements to profit for the year (Solvay share).
Basic and diluted amounts per share for discontinued operations are presented in the consolidated income statement.
Number of shares (in thousands) 2016 2015Weighted average number of ordinary shares (basic) 103,294 83,738Dilution effect of subscription rights 315 565Weighted average number of ordinary shares (diluted) 103,609 84,303
2016 2015In € million Basic Diluted Basic DilutedProfit for the year (Solvay share) includingdiscontinued operations (in € thousands) 620,964 620,964 405,835 405,835Profit for the year (Solvay share) excludingdiscontinued operations (in € thousands) 640,017 640,017 370,259 370,259Earnings per share (including discontinuedoperations) (in €) 6.01 5.99 4.85 4.81Earnings per share (excluding discontinuedoperations) (in €) 6.20 6.18 4.42 4.39
The weighted average number of shares for 2015 takes intoaccount the shares issued on December 21, 2015, which wereoutstanding for a period of 10 days.
Full data per share, including dividend per share, can be found inthe Business Review section.
The average closing price during 2016 was € 92.41 per share(2015: € 115.08 per share). Based on this average closing price allshare options were in the money, and therefore dilutive, for thepresented period (see note F35 Share-based payments).
NOTE F9Profit for the year
NOTE F10Earnings per share
Accounting policy
FINANCIAL STATEMENTS
SOLVAY 2016 Annual Integrated Report157

In accordance with IAS 1 Presentation of Financial Statements,the Group elected to present two statements – a consolidatedincome statement immediately followed by a consolidatedstatement of comprehensive income.
The components of other comprehensive income (OCI) arepresented before related tax effects with one amount shownfor the aggregate amount of income tax relating to thosecomponents. Tax impacts are further disclosed in this note.
Note: the below table presents the total other comprehensive income items for the aggregate of the shares of Solvay and the non-controlling interests.
2016 2015
In € millionBefore-tax
amount
Taxexpense(-)/benefit (+)
Net-of-taxamount
Before- taxamount
Tax expense(-)/benefit (+)
Net-of-taxamount
Gains and losses related tohyperinflation 0 0 0 42 (7) 35Hyperinflation 0 0 0 42 (7) 35Gains and losses on remeasuringavailable-for-sale financial assets 9 0 10 3 0 3Available-for-sale financial assets(see note F32) 9 0 10 3 0 3Effective portion of gains and losses onhedging instruments in a cash flowhedge 3 (13) (10) (42) 0 (42)Recycling to the income statement 33 33 134 134Basis adjustments 0 0 (77) (77)Cash flow hedges (see note F32) 36 (13) 23 15 0 15Currency translation differences -Subsidiaries and joint operations 272 272 208 0 208Currency translation differences arisingduring the year 199 199 207 207Recycling of currency translationsdifferences relating to foreign operationsdisposed of in the year 63 63 1 1Other movement of currency translationdifferences (NCI) relating to foreignoperations disposed of in the year 10 10Currency translation differences -Associates and joint ventures 57 57 (22) 0 (22)Currency translation differences arisingduring the year 51 51 (22) (22)Recycling of currency translationsdifferences relating to foreign operationsdisposed of in the year 6 6Currency translation differences 329 0 329 186 0 186Actuarial gains and losses on definedbenefit pension plans (see noteF31.A) (275) 68 (207) 279 (13) 266Other comprehensive income 100 56 155 525 (20) 505
Notes to the consolidated statement of comprehensive income
NOTE F11Consolidated statement of comprehensive income
Accounting policy
Presentation of the tax effect relating to each item of other comprehensive income
FINANCIAL STATEMENTS
158SOLVAY 2016 Annual Integrated Report

The Venezuelan economy being considered as ahyperinflationary economy, since 2013 the Group applies thehyperinflationary accounting requirements of IAS 29 FinancialReporting in Hyperinflationary Economies to its Venezuelanoperations. The financial statements are based on the historicalcost basis and have been restated to take into account theeffects of inflation.
During the first quarter of 2016, following evolutions in the locallegislation and the business environment, the Group decided tono longer use the Dipro rate (previously known as Cencoex rate)to translate the entity into Euros, and switched to the DICOMexchange rate, resulting in a devaluation above 10,000%.Consequently, contributions of the Venezuelan legal entity to theGroup’s financial statements are no longer material even afterapplying the accounting policy for hyperinflation. The conditionsof hyperinflation do not, in themselves, constitute an event of lossof control over the operations in Venezuela.
For the purpose of presenting consolidated financial statementsat the end of each reporting period, the assets and liabilitiesof the Group’s foreign operations are expressed in Euros usingclosing rates. Income and expense items are translated at theaverage exchange rates for the period, except when the impactof applying the average rate is materially different from applyingthe spot rate at the date of the respective transactions, in whichcase the latter is applied. Exchange differences arising, if any,are recognized in other comprehensive income as “currencytranslation differences”.
Currency translation differences are reclassified from equity toprofit or loss, on:
In the case of a partial disposal of a subsidiary (i.e. no loss ofcontrol) that includes a foreign operation, a proportionate shareof accumulated exchange differences is reattributed to non-controlling interests and is not recognized in profit or loss. Inthe event of a capital decrease of a subsidiary without loss ofcontrol, no accumulated exchange differences are reclassifiedfrom equity to profit or loss.
Goodwill and fair value adjustments arising on the acquisitionof a foreign operation are treated as assets and liabilities of theforeign operation and translated into the Group’s presentationcurrency at the closing rate.
The total currency translation gains amount to € 329 million in2016, and include:
The € 251 million currency translation gains are linked to:
In order to further enhance the understanding of cash flowperformance, additional lines in the IFRS consolidated cash flowstatement have been included in respect of the sale of real estatein the context of restructuring/dismantling/remediation and ofcash flow linked to acquisitions of subsidiaries and excluded fromFree Cash Flow.
Hyperinflation
Accounting policy
Currency translation differences
Accounting policy
a disposal of the Group’s entire interest in a foreign operation,or a partial disposal involving loss of control over a subsidiarythat includes a foreign operation. In this case, all of theaccumulated exchange differences in respect of thatoperation attributable to the Group are reclassified to profitor loss. Any exchange differences that have previously beenattributed to non-controlling interests are derecognized, butthey are not reclassified to profit or loss;
a partial disposal of an interest in a joint arrangement or anassociate that includes a foreign operation, when the retainedinterest is a financial asset.
€ 251 million currency translation gains in 2016, of which€ 245 million for the Group’s share;
the recycling of € 69 million currency translation loss relatedmainly to the sale of Solvay Indupa (€ 55 million); and
the derecognition of € 10 million currency translation loss fornon-controlling interests for Solvay Indupa.
the devaluation of the British pound (€ 68 million) and theChinese renminbi (€ (40) million) against the Euro;
the appreciation of the US dollar (€ 189 million), the Russianruble (€ 48 million), the Brazilian real (€ 38 million) against theEuro; and
the impact of the switch to the DICOM exchange rate for theVenezuelan legal entity (€ (60) million).
Notes to the consolidated statement of cashflows (continuing and discontinued operations)
FINANCIAL STATEMENTS
SOLVAY 2016 Annual Integrated Report159

In 2016 total depreciation, amortization, and impairment lossesamount to € 1,302 million, made up of:
In 2015 total depreciation, amortization, and impairment lossesamount to € 978 million, made up of:
The other non-operating and non-cash items for 2016(€ (16) million) comprise mainly the gain relating to the reversalof the Chemlogics holdback (€ (49) million), the impact fromreversals of tax litigations provisions (€ 24 million), and other non-cash losses (impairment and gains on disposals).
The other non-operating and non-cash items for 2015 (€128 million) comprise mainly the costs relating to the Cytecacquisition (€ 36 million) and the impact from reversals of taxlitigations provisions (€ 84 million).
Income tax income amounts to € 21 million, of which € 56 millionfor continuing operations.
Income tax paid amounts to € 212 million, of which € 180 millionfor continuing operations.
Income tax expense amounts to € 135 million, of which€ 69 million for continuing operations.
Income tax paid amounts to € 250 million, of which € 208 millionfor continuing operations.
In € million 2016 2015Inventories 17 (25)Trade receivables (157) 22Trade payables 88 (79)Other receivables/payables (47) (21)Changes in working capital (99) (103)Of which discontinued operations (12) (76)
NOTE F12Depreciation, amortization and impairments
straight-line depreciation and amortization of € 1,026 millionfor continuing operations including:
cost of goods sold (€ 614 million);–administrative and commercial costs (€ 103 million);–research and development costs (€ 54 million);–other (€ 256 million), including € 231 million for Rhodia andCytec PPA amortization (see note F3 Other operating gainsand losses);
–
net impairment loss of € 143 million for continuing operations;
impairment loss of Solvay Indupa of € 63 million; and
€ 70 million for discontinued operations, including € 11 millionfor Rhodia PPA amortization.
straight-line depreciation and amortization of € 772 million forcontinuing operations including:
cost of goods sold (€ 515 million);–administrative and commercial costs (€ 97 million);–research and development costs (€ 39 million);–other (€ 120 million), including € 98 million for Rhodia PPAamortization (see note F3 Other operating gains and losses);
–
net impairment loss of € 48 million for continuing operations;
impairment loss of Solvay Indupa of € 88 million at year end;and
€ 71 million for discontinued operations, including € 11 millionfor Rhodia PPA amortization.
NOTE F13Other non-operating and non-cash items
NOTE F14Income taxesIn 2016
In 2015
NOTE F15Changes in working capital
FINANCIAL STATEMENTS
160SOLVAY 2016 Annual Integrated Report

In 2016, the amount (€ (151) million) includes:
In 2015, the amount (€ (302) million) includes:
2016In € million Acquisitions Disposals Total
Subsidiaries (23) 144 120Other (2) 6 4
Total investments (26) 150 124Tangible/intangible assets (981) 76 (904)Total (1,006) 226 (780)
2015In € million Acquisitions Disposals Total
Subsidiaries (4,835) 70 (4,765)Associates and joint ventures (13) (13)Other (15) (232) (247)
Total investments (4,862) (162) (5,024)Tangible/intangible assets (1,037) 31 (1,006)Total (5,899) (131) (6,030)
The acquisition of subsidiaries (€ (23) million) relates mainly tothe acquisition of Primester (€ (33) million) in 2016. The balanceis related to prior year acquisitions: Cytec (€ (44) million), releaseof the Chemlogics holdback (€ 74 million), and Erca EmerySurfactant (€ (16) million).
The disposal of subsidiaries (€ 144 million) relates mainly to thedisposal of Inovyn (€ 335 million) and Indupa (€ (157) million).
The acquisition of tangible and intangible assets (€ (981) million)relates to various projects:
The acquisition of subsidiaries (€ (4,835) million) related mainly tothe acquisition of Cytec (€ (4,807) million).
The acquisition of associates and joint ventures (€ (13) million)related to the capital increase in RusVinyl.
The disposal cash-out (€ (232) million) related to the tax cash-outon Eco Services capital gain.
The other disposal (€ 70 million) related mainly to Inovyn netcash in (€ 58 million): up front net proceeds from Inovyn of€ 150 million adjusted for cash transfers and other financial flowswith the joint venture, as well as divestment costs, totaling€ (92) million.
NOTE F16Changes in provisions
the cash-out for € (414) million, of which € (16) million fordiscontinued operations, mainly Acetow; and
the additions (€ 405 million) and reversals (€ (141) million)presented in note F31 Provisions.
the cash-out for € (372) million of which € (43) million fordiscontinued operations, mainly Chlorovinyls; and
the additions (€ 282 million) and reversals (€ (212) million).
NOTE F17Cash flows from investing activities – acquisition/disposal of assets and investments
In 2016
Composite Materials: expansion of adhesive capacity inWrexham (United Kingdom);
Composite Materials: new resin infusion facility in Ostringen(Germany);
Peroxides: build-up of a megaplant H2O2 joint operation in theKingdom of Saudi Arabia with Sadara (JV Dow-Aramco);
Peroxides: construction of a 60Kt H2O2 plant at Zhengiang(China);
Peroxides: H2O2 capacity expansion in Longview (UnitedStates);
Silica: build-up of new highly dispersible silica (HDS) plant inGunsan (South Korea);
Special Chem: new eH2O2 plant in Rosignano (Italy);
Specialty Polymers: investment in Fluorelastomers and PVDF inChangshu (China); and
Specialty Polymers: investment in PEEK capacity (UnitedStates).
In 2015
FINANCIAL STATEMENTS
SOLVAY 2016 Annual Integrated Report161

The acquisition of tangible and intangible assets (€ (1,037) million)related to various projects:
Ordinary shares are classified as equity.
Incremental costs directly attributable to the issuance of newshare capital are directly recognized in equity as a deduction, netof tax, from the equity issuance proceeds.
The reserves include:
These represent the share of non-controlling interests in the netassets and comprehensive income of subsidiaries of the Group.This share represents the interests in subsidiaries that are notheld by the Company or its subsidiaries.
To strengthen its capital structure, Solvay issued undated deeplysubordinated perpetual bonds (“perpetual hybrid bonds”) ofrespectively € 1.2 billion in 2013 following the acquisition ofChemlogics and € 1.0 billion (net of issuance costs € 991 million)in December 2015 to finance the acquisition of Cytec.
Both perpetual hybrid bonds are classified as equity in theabsence of any unavoidable contractual obligation to repay theprincipal and interest of the perpetual hybrid bonds, specifically:
The coupons related to the perpetual hybrid bonds arerecognized as equity transactions and are presented asdividends upon declaration (see consolidated statement ofchanges in equity):
Aroma Performance: new vanillin production plant inZhenjiang (China), boosting its production capacities by 40%;
Novecare: expansion of ethoxylation capacity in Asia and theUnited States;
Novecare: expansion and rationalization of its productioncapacity in Brazil;
Peroxides: construction of a megaplant H2O2 joint operation inthe Kingdom of Saudi Arabia with Sadara (joint venture Dow-Aramco);
Peroxides: construction of a 60Kt H2O2 plant at Zhengiang(China);
Soda Ash and Derivatives: construction of a large sodiumbicarbonate plant (Thailand);
Specialty Polymers: investment in Changshu (China); and
Specialty Polymers: investment in PEEK capacity (UnitedStates).
NOTE F18Proceeds from bond issuance classified as equityand capital increase
Accounting policy
Share capital
Reserves
treasury shares;
perpetual hybrid bonds that qualify as equity absent anyunavoidable contractual obligation to repay the principal andinterest of the perpetual hybrid bonds (no maturity, interestis payable annually but can be deferred indefinitely at theissuer’s discretion);
retained earnings;
impact of hyperinflation accounting;
currency translation differences from the consolidationprocess relating to the translation of the financial statementsof foreign operations prepared in a functional currency otherthan the euro;
the impacts of the fair value remeasurement of available-for-sale financial assets;
the impacts of the fair value remeasurement of financialinstruments documented as hedging instruments in cash flowhedges; and
actuarial gains and losses related to defined benefit plans.
Non-controlling interests
General
no maturity, yet the issuer has a call option at every reset dateto redeem the instrument;
at the option of the issuer, interest payments can be deferredindefinitely.
amounting to € 57 million in 2016 (€ 57 million in 2015) forthe 2013 € 1.2 billion issuance (€ 700 million NC5.5 at 4.199%and € 500 million NC10 at 5.425%); and
amounting to € 27 million in 2016 for the December 2015€ 1.0 billion issuance. It corresponds to the first payment ofcoupon made in June 2016. Every payment in June thereafterwill amount to € 55 million until first call options (€ 500 millionNC5.5 at 5.118% and € 500 million NC8.5 at 5.869%).
FINANCIAL STATEMENTS
162SOLVAY 2016 Annual Integrated Report

If Solvay has deferred any interest under the terms of theperpetual hybrid bonds, such deferred interest shall become dueupon the declaration or payment of any dividend to the holdersof ordinary shares.
In December 2015, Solvay increased its capital by € 1.5 billion(net of equity issuance costs paid at December 31, 2015€ 1,477 million), issuing 21,175,283 new shares at € 70.83 pershare with preference rights. This rights issue was launched tocomplete the financing of the Cytec acquisition.
2016 2015Shares issued and fully paid at January 1 105,876 84,701Capital increase 21,175Shares issued and fully paid at December 31 105,876 105,876Treasury shares held at December 31 2,651 2,106
In 2016 the other cash flows from financing activities (€ 7 million)relate to the repayment of margin calls related to Solvay EnergyServices activities.
In 2015 the other cash flows from financing activities(€ (31) million) included the payments for the liquidity clauserelating to share-based payments signed as part of the Rhodiaacquisition (€ (39) million).
The 2016 cash flow from discontinued operations (€ 41 million)results from the total cash flow of Acetow (€ 72 million), EmergingBiochemicals (€ 22 million), and Solvay Indupa (€ (52) million).
The 2015 cash flow from discontinued operations (€ 40 million)results from the total cash flow of Solvay Indupa (€ (53) million),Chlorovinyls (€ 41 million), Pharma (€ (24) million), Acetow(€ 59 million), and Emerging Biochemicals (€ 18 million).
An intangible asset is an identifiable non-monetary asset withoutphysical substance. It is identifiable when it is separable, i.e. iscapable of being separated or divided from the Group, or whenit arises from contractual or other legal rights. An intangible assetshall be recognized if, and only if:
Intangible assets acquired or developed internally are initiallymeasured at cost. The cost of an acquired intangible assetcomprises its purchase price, including import duties and non-refundable purchase taxes, after deducting trade discounts andrebates, and any directly attributable cost of preparing the assetfor its intended use. Subsequent expenditure on intangibleassets is capitalized only if it is probable that it will increasethe future economic benefits associated with the specific asset.Other expenditure is recognized in profit or loss as incurred.
After initial recognition, intangible assets are measured at costless accumulated amortization and impairment losses, if any.
Intangible assets are amortized on a straight-line basis over theirestimated useful lives, which do not exceed the contractualperiod, if any. The estimated useful lives, residual values, andamortization methods are reviewed at each year end, and anychanges in estimates are accounted for prospectively.
Patents and trademarks 2-20 yearsSoftware 3-5 yearsDevelopment expenditures 2-5 yearsOther intangible assets – Customer relationships 5-29 yearsOther intangible assets – Technology 5-20 years
Number of shares (in thousands)
NOTE F19Other cash flows from financing activities
NOTE F20Cash flow from discontinued operations
Notes to the consolidated statement of financialpositionNOTE F21Intangible assets
Accounting policy
General
a. it is probable that the expected future economic benefitsthat are attributable to the asset will flow to the Group; and
b. the cost of the asset can be measured reliably.
FINANCIAL STATEMENTS
SOLVAY 2016 Annual Integrated Report163

Amortization expense is included in the consolidated incomestatement within cost of goods sold, commercial andadministrative costs, and research and development costs.
The asset is tested for impairment if there is a trigger forimpairment, and annually for projects under development (seenote F28 Impairment).
Intangible assets are derecognized from the consolidatedstatement of financial position on disposal or when no futureeconomic benefits are expected from their use or disposal. Thegain or loss arising from the derecognition of an intangible assetis recognized in profit or loss at the moment of derecognition.
Research costs are recognized in profit or loss in the period inwhich they are incurred.
Development costs are capitalized if, and only if, all the followingconditions are fulfilled:
Development costs comprise employee expenses, the cost ofmaterials and services directly attributable to the projects, andan appropriate share of directly attributable fixed costs including,and where applicable, borrowing costs. The intangible assetsare amortized as from the moment they are available for use,i.e. when they are in the location and condition necessary forthem to be capable of operating in the manner intended bymanagement. Development costs which do not satisfy the aboveconditions are recognized in profit or loss as incurred.
Other intangible assets consist mainly of customer lists and otherintangible commercial assets acquired separately or in abusiness combination.
Research and Development costs
the cost of the asset can be reliably measured;
the technical feasibility of the product has been demonstrated;
the product or process will be placed on the market or usedinternally;
the assets will generate future economic benefits (a potentialmarket exists for the product or, where it is to be usedinternally, its future utility has been demonstrated); and
the technical, financial, and other resources requiredto complete the project are available.
Other intangible assets
FINANCIAL STATEMENTS
164SOLVAY 2016 Annual Integrated Report

In € million Development costsPatents andtrademarks
Customerrelationships and
other intangible assets TotalGross carrying amountAt December 31, 2014 249 956 1,226 2,431
Additions 51 15 20 85Disposals and closures (5) (5) (1) (11)Increase through business combinations 0 731 1,728 2,460Currency translation differences 3 5 51 60Other 0 16 (12) 4Transfer to assets held for sale 0 0 0 0
At December 31, 2015 298 1,719 3,012 5,029Additions 68 8 22 98Disposals and closures (26) (14) (5) (45)Increase through business combinations 0 0 0 0Currency translation differences 4 33 64 101Other (35) 60 (21) 4Transfer to assets held for sale (17) (64) (111) (192)
At December 31, 2016 292 1,742 2,961 4,995Accumulated amortizationAt December 31, 2014 (83) (442) (362) (887)
Amortization (25) (72) (126) (223)Disposals and closures 5 5 1 11Currency translation differences 0 (3) (11) (14)Other (1) (7) 12 4Transfer to assets held for sale 0 0 0 0
At December 31, 2015 (105) (518) (487) (1,110)Amortization (28) (123) (221) (372)Impairment 0 2 (4) (2)Disposals and closures 26 12 2 39Currency translation differences (1) (11) (7) (19)Other 16 (17) 2 1Transfer to assets held for sale 8 26 34 67
At December 31, 2016 (84) (629) (683) (1,395)Net carrying amountAt December 31, 2014 165 514 864 1,543At December 31, 2015 193 1,201 2,525 3,919At December 31, 2016 208 1,113 2,278 3,600
Intangibles relate mainly to the intangibles acquired from Rhodia (€ 471 million) and Cytec (€ 2,341 million, including € 694 million forpatent and trademarks and € 1,647 million for acquired customer relationships). The average remaining useful life of Rhodia’s assets issix years, and that of Cytec’s assets is 16 years.
In 2015, the increase through business combinations relates mainly to Cytec for € 2,451 million.
FINANCIAL STATEMENTS
SOLVAY 2016 Annual Integrated Report165

Acquisitions of subsidiaries are accounted for using theacquisition method. The consideration for each acquisition ismeasured at the aggregate of the fair values (at the date ofacquisition) of assets transferred and liabilities incurred orassumed, and equity instruments issued by the Group inexchange for control of the acquiree. Acquisition-related costsare recognized in profit or loss as incurred.
Where applicable, the consideration for the acquisition includesany asset or liability resulting from a contingent considerationarrangement, measured at its acquisition-date fair value.Subsequent changes in such fair values are adjusted against thecost of acquisition where they qualify as measurement periodadjustments (see below). All other subsequent changes in the fairvalue of contingent consideration classified as an asset or liabilityare accounted for in accordance with relevant IFRSs, generallythrough profit or loss.
Where a business combination is achieved in stages, the Group’spreviously held interests in the acquired entity are remeasuredto fair value at the acquisition date (i.e. the date the Groupobtains control) and the resulting gain or loss, if any, isrecognized in profit or loss. Amounts arising from interests in theacquiree prior to the acquisition date that have previously beenrecognized in other comprehensive income are reclassified toprofit or loss, where such treatment would be appropriate if thatinterest were disposed of.
The acquiree’s identifiable assets, liabilities, and contingentliabilities that meet the conditions for recognition under IFRS 3Business Combinations are recognized and measured at theirfair value at the acquisition date, except that:
If the initial accounting for a business combination is incompleteby the end of the reporting period in which the combinationoccurs, the Group reports provisional amounts for the items forwhich the accounting is incomplete. Those provisional amountsare adjusted during the measurement period (see paragraphbelow), or additional assets or liabilities are recognized, to reflectnew information obtained about facts and circumstances thatexisted as of the acquisition date that, if known, would haveaffected the amounts recognized as of that date.
The measurement period is the period from the date ofacquisition to the date the Group obtains complete informationabout facts and circumstances that existed as of the acquisitiondate, and does not exceed twelve months.
Goodwill arising in a business combination is recognized as anasset at the date that control is obtained (the acquisition date).Goodwill is measured as the excess of the sum of:
over the share acquired by the Group in the fair value of theentity’s identifiable net assets at the acquisition date.
Goodwill is not amortized but is tested for impairment on anannual basis, and more frequently if any impairment triggers areidentified.
For the purpose of impairment testing, goodwill is allocated toeach of the Group’s cash-generating units (or groups of cash-generating units) in accordance with IAS 36 Impairment ofAssets.
A cash-generating unit (CGU) is the smallest identifiable group ofassets that generates cash inflows that are largely independentof the cash inflows from other group(s) of assets.
NOTE F22Goodwill and business combinations
Accounting policy
General
deferred tax assets or liabilities, and liabilities or assets relatedto employee benefit arrangements, are recognized andmeasured in accordance with IAS 12 Income Taxes, and IAS 19Employee Benefits, respectively;
liabilities or equity instruments relating to the replacementby the Group of an acquiree’s share-based payment awardsare measured in accordance with IFRS 2 Share-basedPayment; and
assets (or disposal groups) that are classified as held for sale inaccordance with IFRS 5 Non-current Assets Held for Sale andDiscontinued Operations are measured in accordance withthat standard.
Goodwill
a. the consideration transferred;
b. the amount of any non-controlling interests in the acquiree;and
c. in a business combination achieved in stages, the acquisitiondate fair value of the previously held equity interest in theacquiree,
FINANCIAL STATEMENTS
166SOLVAY 2016 Annual Integrated Report

These tests consist of comparing the carrying amount of theassets or (groups of) CGUs with their recoverable amount. Therecoverable amount of an asset, a CGU, or a group of CGUsis the higher of its fair value less costs to sell and its valuein use. If the recoverable amount of the CGU is less than itscarrying amount, the impairment loss is allocated first to reducethe carrying amount of any goodwill allocated to the unit andthen the other assets of the unit pro rata on the basis of thecarrying amount of each asset in the unit. An impairment lossrecognized on goodwill shall not be reversed in a subsequentperiod.
Assets held for sale include their related goodwill.
On disposal of an operation within a CGU to which goodwillhas been allocated, the goodwill associated with the operationdisposed of is included in the determination of the profit or losson disposal. It is measured on the basis of the relative values ofthe operation disposed of and the portion of the CGU retained,unless another method better reflects the goodwill associatedwith the operation disposed of.
In € million TotalNet carrying amountAt December 31, 2014 3,150
Additions 2,610Disposals and closures (4)Currency translation differences 62Other 23
At December 31, 2015 5,840Additions 31Disposals and closuresCurrency translation differences 116Other (23)Transfer to assets held for sale (286)
At December 31, 2016 5,679
In 2016, the change in goodwill is further explained by: In 2015, the goodwill increased by € 2,690 million due mainly tothe Cytec acquisition (€ 2,598 million).
Goodwill acquired in a business combination is allocated to theCGU or groups of CGUs (Operating Segments) that are expectedto benefit from that business combination.
Goodwill – overview
additions (€ 31 million) related to the Primester acquisition;
adjustments of Cytec provisional goodwill within themeasurement period (€ (23) million); and
the transfer to assets held for sale of goodwill relating mainly toAcetow (€ (224) million), Emerging Biochemicals (€ (22) million),Formulated Resins (€ (29) million), and Cross LinkableCompound (€ (11) million).
Goodwill by CGU
FINANCIAL STATEMENTS
SOLVAY 2016 Annual Integrated Report167

2015 2016
In € million
At theend of
theperiod Transfer
Adjust-ments
Acqui-sitions
anddivest-ments
Currencytrans-lationdiffer-ences
At theend of
theperiod Transfer
Adjust-ments
Transferto
assetsheld for
sale
Acqui-sitions
anddivest-ments
Currencytrans-lationdiffer-ences
At theend of
theperiod
Groups of CGUs(Operating Segments)
AdvancedFormulations 221 8 (2) 227 (35) 192Advanced Materials 485 8 493 493PerformanceChemicals 157 7 164 35 (75) 124Cytec 2,598 2,598 (2,575) (23) 0
Cash generatingunits
Compositesmaterials 0 1,399 48 1,447Novecare 1,085 11 61 1,157 145 33 1,335Technologysolutions 0 1,032 (29) 35 1,037Special Chem 231 (3) 228 (1) 227Polyamides 170 170 170Rare Earth Systems 161 (161) 0 0Specialty Polymers 188 2 4 194 (11) 1 184Acetow 120 120 (151) 31 0Soda Ash andDerivatives 162 162 162Coatis 82 82 82Silica 72 72 72Aroma Performance 49 49 49Energy Services 50 50 50Fluorochemicals 70 (70) 0 0Hydrogen PeroxidesEurope 20 20 20EmergingBiochemicals 20 20 (20) 0Hydrogen PeroxidesMercosul 14 14 14Hydrogen PeroxidesNafta 8 8 8Hydrogen PeroxidesAsia 10 10 10Precipitated CalciumCarbonate 4 (4) 0 0PVC Mercosur 2 0 1 1
Total goodwill 3,150 0 23 2,606 61 5,840 0 (23) (286) 31 116 5,679
FINANCIAL STATEMENTS
168SOLVAY 2016 Annual Integrated Report

In 2015, the CGUs Fluorochemicals and Rare Earth Systems weremerged into the new CGU Special Chem. The goodwill resultingfrom the acquisition of Cytec on December 9, 2015 was allocatedto a separate group of CGUs (Cytec) – shown in the table above –as of December 31, 2015.
In 2016, following the acquisition of Cytec, Solvay re-organizedits segment set-up to enhance strategic coherence and improvealignment. Cytec’s former Aerospace Materials and IndustrialMaterials activities are included in Advanced Materials and itsIn Process Separation and Additive Technologies activities areincluded in Advanced Formulations. Solvay’s GBU Coatis hasbeen transferred to Performance Chemicals.
Cytec Industries Inc.
On July 29, 2015, Solvay SA entered into a definitive mergeragreement with U.S.-based Cytec Industries Inc. to acquire 100%of its share capital and of the voting rights, for US$ 75.25 pershare in cash, subject to customary closing conditions, includingregulatory approvals and Cytec’s shareholders’ approval.Following those approvals, the closing of the acquisition tookplace on December 9, 2015.
The total consideration for the acquisition amounted to€ 5,047 million, and was based on the following:
The acquisition-related expenses amounting to € 130 millionwere presented as an M&A cost in 2015.
Cytec’s opening balance sheet has been fully consolidated withinthe Solvay Group as from December 31, 2015.
Accordingly, a provisional valuation of identifiable assets acquiredand liabilities assumed was made as at December 31, 2015.
The following table summarizes:
Business combinations
Purchase consideration and other impacts on cashflows
1.
i. the outstanding number of Cytec shares (other than thoseshares held by Cytec as treasury stock) as ofDecember 9, 2015, namely 71,568,528, multiplied by theshare price of US$ 75.25 that Solvay agreed to pay in cashpursuant to the Merger Agreement entered into betweenSolvay SA and Cytec Industries Inc. on July 28, 2015, equalingUS$ 5,385 million (€ 4,947 million);
ii. the fair value of Cytec’s outstanding share-based paymenttransactions, which were cancelled and converted into a rightto receive cash on the acquisition date. This was includedin the consideration in accordance with IFRS 3 BusinessCombinations for an amount of US$ 193 million(€ 177 million); and
iii. in addition, on July 29, 2015, Solvay entered into a foreignexchange forward contract to hedge US$ 1,880 million of theexpected purchase price, contingent upon the realization ofthe acquisition. The effect of this hedging contract was a€ 77 million decrease of the consideration, which has beendeducted from goodwill as a basis adjustment.
Purchase price allocation2.
the consideration for Cytec of € 5,047 million;
identifiable assets acquired less liabilities assumed afterremeasurement to fair value at acquisition date of€ 2,449 million; and
the goodwill of € 2,598 million corresponding to the differencebetween the consideration and the net assets acquired,measured at fair value.
FINANCIAL STATEMENTS
SOLVAY 2016 Annual Integrated Report169

In € million Total considerationProvisional fair
values 31.12.2015 Adjustments 2016Final fair values
31.12.2015Total consideration (A) 5,047Net assets acquired at fair value 2,449 23 2,472
Non-current assets 4,076 (209) 3,867Intangible assets 2,451 0 2,451Tangible assets 1,136 5 1,141Investments in associates and joint ventures 11 11Other investments 7 (6) 1Deferred tax assets(1) 447 (213) 234Loans and other assets 24 5 29Current assets 926 17 943Inventories 380 (3) 377Trade receivables 233 0 233Income tax receivables 57 0 57Other receivables(2) 58 20 78Cash and cash equivalents 198 198Total assets (B) 5,002 (192) 4,810Non-current liabilities 2,189 (222) 1,967Provisions for employee benefits(3) 215 9 224Other provisions 81 81Deferred tax liabilities(1) 1,182 (230) 952Financial debt 664 664Other liabilities 47 (2) 45Current liabilities 364 7 371Other provisions(3) 37 3 40Financial debt 65 65Trade payables 156 (2) 154Income tax payables 8 (2) 6Other liabilities 98 8 106Total liabilities (C) 2,553 (215) 2,338Goodwill (A-B+C) 2,598 (23) 2,575
The net assets provisional fair value disclosed at the end of 2015amounted to € 2,449 million and took into account:
Consequently, the resulting provisional goodwill amounted to€ 2,598 million (difference between total consideration of€ 5,047 million and net assets provisional fair value of€ 2,449 million).
During the 12-month measurement period, the fair values ofidentifiable assets acquired and liabilities assumed were furtherrefined (see column "Adjustments 2016" in the table above andthe related notes below).
These adjustments reduced the goodwill by € 23 million and areexplained below.
Provisional goodwill at the end of 2015
intangible assets of € 2,451 million, of which € 1,721 millionfor acquired customer relationships and € 730 million foracquired technologies;
tangible assets of € 1,136 million;
net deferred tax liabilities of € (735) million;
inventories of € 380 million;
trade receivables and trade liabilities of € 77 million;
provisions of € (333) million;
financial net debt of € (531) million; and
other of € 4 million.
1. The reduction in net deferred tax liabilities amounting to€ 16 million results from (a) the reversal of net deferred taxliabilities related to non-US unremitted earnings that will nolonger be repatriated to Cytec US (€ 25 million), and (b)deferred tax liabilities related to temporary differencesresulting from other adjustments (€ (9) million). The othermovements of deferred taxes correspond to reclassificationsbetween deferred tax assets and deferred tax liabilities.
2. The revaluation of a receivable based on conditions existingat acquisition date (€ 20 million).
3. The revision of IAS 19 benefits mainly in United Kingdom andUnited States (€ 9 million).
FINANCIAL STATEMENTS
170SOLVAY 2016 Annual Integrated Report

The goodwill is not expected to be deductible for income taxpurposes.
Had Cytec’s business been consolidated from January 1, 2015,the consolidated income statement of comprehensive incomewould have included revenue of € 1,800 million and net incomeof € 23 million. Detailed pro forma information for the full year2015 can be found in the Business Review section.
The final goodwill of € 2,575 million arises mainly from businessopportunities in advanced lightweighting materials for theaerospace and automotive industries and in specialty chemicalsfor mining, synergies (estimated at a minimum of € 100 millionin annual synergies within three years after the acquisition), andskilled work force. These benefits have not been recognizedseparately from goodwill because they do not meet the definitionof identifiable intangible assets. See above for the allocation ofthis goodwill.
On April 15, 2015 Solvay completed the acquisition of Erca EmerySurfactant B.V. alkoxylation asset, a facility jointly owned by EmeryOleochemicals and ERCA Group in the Moerdijk integratedindustrial park in the Netherlands, strengthening its strategy ofsecuring sustainable, large-scale surfactant assets worldwide, fora cash amount of € 23 million in 2015. The transaction generateda total amount of goodwill of € 1 million. The identifiable netassets acquired amount to € 42 million and consist mainly oftangible assets.
On November 5, 2015 Solvay acquired EPIC Polymers’ long-fiberthermoplastics (LFT) technology, to complement its offering ofhigh performance lightweighting materials and gain access tometal replacement of larger automotive semi-structural parts, fora total cash amount of € 7 million. The transaction generated atotal amount of goodwill of € 2 million. The identifiable net assetsacquired amount to € 5 million and consist mainly of intangibleassets.
Property, plant, and equipment are tangible items that:
The items of property, plant, and equipment owned by the Groupare recognized as tangible assets when the following conditionsare satisfied:
Items of property, plant, and equipment are initially measuredat cost. The cost of an item of property, plant, and equipmentcomprises its purchase price and any costs directly attributableto bringing the asset to the location and condition necessaryfor it to be capable of operating in the manner intended bymanagement. If applicable, the cost comprises borrowing costsduring the construction period.
After initial recognition, items of property, plant, and equipmentare measured at cost less accumulated depreciation andimpairment losses, if any.
Items of property, plant, and equipment are depreciated on astraight-line basis over their estimated useful lives. Thecomponents of an item of property, plant, and equipment withdifferent useful lives are depreciated separately. Land is notdepreciated. The estimated useful lives, residual values, anddepreciation methods are reviewed at each year end, and anychanges in estimates are accounted for prospectively.
Buildings 30-40 yearsIT equipment 3-5 yearsMachinery and equipment 10-20 yearsTransportation equipment 5-20 years
Depreciation expense is included in the consolidated incomestatement within cost of goods sold, commercial andadministrative costs, and R&D costs.
The asset is tested for impairment if there is trigger forimpairment (see note F 28 Impairment of tangible assets,intangible assets, and equity method investees).
Items of property, plant, and equipment are derecognized fromthe consolidated statement of financial position on disposal orwhen no future economic benefits are expected from their useor disposal. The gain or loss arising from the derecognition of anitem of property, plant, and equipment is recognized in profit orloss at the moment of derecognition.
Other business combinations
NOTE F23Tangible assets
Accounting policy
General
are held for use in the production or supply of goods orservices, for rental to others, or for administrative purposes;and
are expected to be used during more than one period.
it is probable that the future economic benefits associatedwith the asset will accrue to the Group; and
the cost of the asset can be measured reliably.
FINANCIAL STATEMENTS
SOLVAY 2016 Annual Integrated Report171

Subsequent expenditure related to items of property, plant, andequipment is capitalized only if it is probable that it will increasethe future economic benefits associated with the specific asset.Other expenditure is recognized in profit or loss as incurred.Subsequent expenditure incurred for the replacement of acomponent of an item of property, plant, and equipment isrecognized as an asset only if it satisfies the recognition criteriamentioned above. The carrying amount of replaced items isderecognized.
Repair and maintenance costs are recognized in theconsolidated income statement as incurred.
Regarding its industrial activity, Solvay incurs expenditure formajor repairs over several years for most of its sites. The purposeof this expenditure is to maintain certain installations in properworking order without altering their useful life. This expenditureis considered a specific component of the item of property, plant,and equipment and is depreciated over the period during whichthe economic benefits are expected to be obtained, i.e. theinterval between major repairs.
Dismantling and restoration costs are included in the cost ofan item of property, plant, and equipment if the Group has alegal or constructive obligation to dismantle or restore. Theyare depreciated over the useful life of the items to which theypertain.
Generally, Solvay’s obligation to dismantle and/or restore itsoperating sites is likely to arise only upon the discontinuation ofa site’s activities. A provision for dismantling discontinued sitesor installations is recognized if there is a legal obligation (due toa request or injunction from the relevant authorities), or if thereis no technical alternative to dismantling, so to ensure the safetycompliance of the discontinued sites or installations.
Borrowing costs directly attributable to the acquisition,construction, or production of qualifying assets, which are assetsthat necessarily take a substantial period of time to get readyfor their intended use or sale, are added to the cost of thoseassets until such time as the assets are substantially ready fortheir intended use or sale.
Investment income earned on the temporary investment ofspecific borrowings pending their expenditure on qualifyingassets is deducted from the borrowing costs eligible forcapitalization.
All other borrowing costs are recognized in profit or loss in theperiod in which they are incurred.
Subsequent expenditure
Dismantling costs
Borrowing costs
FINANCIAL STATEMENTS
172SOLVAY 2016 Annual Integrated Report

In € million Land and BuildingsFixtures and
EquipmentOther tangible
assetsTangible assets
under construction TotalGross carrying amountAt December 31, 2014 2,863 10,521 424 916 14,725
Additions 63 309 20 619 1,011Disposals and closures (44) (253) (16) (3) (315)Increase throughbusiness combinations 277 566 21 320 1,183Currency translationdifferences 21 14 2 27 64Other 151 560 29 (632) 110
At December 31, 2015 3,332 11,718 480 1,248 16,778Additions 22 170 11 621 823Disposals and closures (72) (302) (24) 0 (397)Increase throughbusiness combinations 0 0 0 0 0Currency translationdifferences (48) 35 2 2 (9)Other 260 687 41 (922) 66Transfer to assets heldfor sale (256) (1,378) (102) (33) (1,769)
At December 31, 2016 3,237 10,929 409 916 15,492AccumulateddepreciationAt December 31, 2014 (1,452) (7,540) (347) 0 (9,339)
Depreciation (85) (526) (32) (644)Impairment (1) (17) (2) (19)Disposals and closures 31 237 15 283Currency translationdifferences (16) 14 (2) (4)Other (6) (104) 2 (109)
At December 31, 2015 (1,530) (7,935) (367) 0 (9,832)Depreciation (111) (572) (42) (725)Impairment (57) (75) (132)Reversal of impairmentloss 3 3Disposals and closures 41 301 23 364Currency translationdifferences 39 51 0 89Other (7) (34) (8) (50)Transfer to assets heldfor sale 84 1,083 96 1,263
At December 31, 2016 (1,543) (7,181) (297) 0 (9,020)Net carrying amountAt December 31, 2014 1,411 2,981 77 916 5,386At December 31, 2015 1,802 3,783 113 1,248 6,946At December 31, 2016 1,695 3,748 112 916 6,472
Cash flows relating to major investments have been disclosed in note F17 Cash flows from investing activities – Acquisition/disposal ofassets and investments.
FINANCIAL STATEMENTS
SOLVAY 2016 Annual Integrated Report173

Leases are classified as finance leases whenever the terms of thelease transfer substantially all the risks and rewards incidental toownership. All other leases are classified as operating leases.
Agreements not in the legal form of a lease contract are analyzedin accordance with IFRIC 4 Determining whether an Arrangementcontains a Lease to determine whether or not they containa leasing contract to be accounted for in accordance with IAS 17Leases.
On commencement of the lease, assets held under financeleases are initially recognized as assets of the Group at their fairvalue, or, if lower, at the present value of the minimum leasepayments. The corresponding liability to the lessor is includedin the consolidated statement of financial position as a financelease obligation.
Assets held under finance leases are depreciated over theirexpected useful lives on the same basis as owned assets or,where shorter, the term of the lease.
Lease payments are apportioned between finance expenses andreduction of the lease obligation so as to produce a constantperiodic rate of interest on the remaining balance of the liability.Finance expenses are recognized immediately in profit or loss,unless they are directly attributable to qualifying assets, in whichcase they are capitalized in accordance with the Group’s generalpolicy on borrowing costs (see above). Contingent rentals arisingunder finance leases are recognized as expenses in the periodsin which they are incurred.
Operating lease payments are recognized as an expense on astraight-line basis over the lease term, except where anothersystematic basis is more representative of the time pattern inwhich economic benefits from the leased asset are consumed.Contingent rentals arising under operating leases are recognizedas an expense in the period in which they are incurred.
In the event that lease incentives are received to enter intooperating leases, such incentives are recognized as a liability. Theaggregate benefit of incentives is recognized as a reduction ofrental expense on a straight-line basis, except where anothersystematic basis is more representative of the time pattern inwhich economic benefits from the leased asset are consumed.
NOTE F24Leases
Accounting policy
General
Finance leases – lessee
Operating leases – lessee
FINANCIAL STATEMENTS
174SOLVAY 2016 Annual Integrated Report

In € million 2016 2015Net carrying amount of finance leases included in the table aboveLand and buildings 5 2Fixtures and equipment 47 51Total 53 53
Minimum lease paymentsIn € million 2016 2015Amounts payable under finance leases:
Within one year 11 10In years two to five inclusive 34 33Beyond five years 88 84
Less: future finance charges (81) (74)Present value of minimum lease payments of finance leases 52 53Amount due for settlement within 12 months 11 10Amount due for settlement after 12 months 122 117
In € million 2016 2015Total minimum lease payments under operating leases recognized in the income statement of the year 107 81
In € million 2016 2015Within one year 96 82In years two to five inclusive 281 250Beyond five years 113 113Total of future minimum lease payments under non-cancellable operating leases 490 444
Operating leases relate mainly to offices, warehouses,transportation and IT equipment.
Non-current assets and disposal groups are classified as heldfor sale if their carrying amount will be recovered principallythrough a sale transaction rather than through continuing use.This condition is regarded as met only when the sale is highlyprobable and the asset (or disposal group) is available forimmediate sale in its present condition. For a sale to be highlyprobable, management should be committed to a plan to sell theasset (or disposal group), an active program to locate a buyerand complete the plan should be initiated, the asset (or disposalgroup) should be actively marketed at a price which is reasonablein relation to its current fair value, the sale should be expected tobe completed within one year from the date of classification, and
actions required to complete the plan should indicate that it isunlikely that significant changes to the plan will be made or thatthe plan will be withdrawn.
When the Group is committed to a sale plan involving loss ofcontrol of a subsidiary, all of the assets and liabilities of thatsubsidiary are classified as held for sale when the criteriadescribed above are met, regardless of whether the Group willretain a non-controlling interest in its former subsidiary after thesale.
Non-current assets (and disposal groups) classified as held forsale are measured at the lower of their previous carrying amountand their fair value less costs to sell. Any excess of the carryingamount over the fair value less costs to sell is recognized asan impairment loss. Depreciation of such assets is discontinuedas from their classification as held for sale. Prior periodconsolidated statements of financial position are not restated toreflect the new classification of a non-current asset (or disposalgroups) as held for sale.
Finance leases
Finance lease obligations
Operating lease obligations
NOTE F25Assets held for sale
Accounting policy
FINANCIAL STATEMENTS
SOLVAY 2016 Annual Integrated Report175

2016 2015
In € million AcetowEmerging
BiochemicalsFormulated
Resin
CrossLinkable
Compound Total Solvay Indupa
Operating segmentPerformance
ChemicalsPerformance
ChemicalsAdvanced
FormulationsAdvancedMaterials
FunctionalPolymers
Tangible assets 282 205 5 14 506 55Goodwill 224 22 29 11 286 0Intangible assets 95 1 29 0 125 0Investments 2 11 0 0 13 8Inventories 73 30 3 8 115 44Trade and other receivables (includingdeferred tax assets) 119 76 2 0 196 62Cash and cash equivalent 0 85 0 0 85 7Assets held for sale 800 429 68 33 1,331 177Non-current liabilities 265 4 10 1 280 3Trade payables and other liabilities 60 62 1 0 123 271Liabilities associated with assetsheld for sale 325 66 10 1 403 275Net carrying amount of the disposalgroup 474 364 58 32 928 (98)Included in other comprehensive income
Currency translation differences (25) (1) (25) (56)Defined benefit plans (36) (1) (36) (3)Cash flow hedges (1) (1) (3)
Other comprehensive income (61) (1) 0 0 (63) (59)
In € million 2016 2015Carrying amount at January 1 41 30Acquisition/Disposal (1)Increase through business combination 11Profit (loss) for the year from associates 2 2Dividends received from associates (2) (3)Impairment (loss)/reversal (11)Currency translation differences (1) 1Transfer to assets held for sale (5)Other 2 0Carrying amount at December 31 24 41
(1) See note F39.
The impairment loss of € (11) million relates to the US torrefied biomass electricity generation project following the decision to exit theproject.
NOTE F26Investments in associates and joint ventures
Investments in associates(1)
FINANCIAL STATEMENTS
176SOLVAY 2016 Annual Integrated Report

In € million 2016 2015Carrying amount at January 1 357 350Acquisition/Disposal (2)Capital increase/decrease 3 13Profit (loss) for the year from joint ventures 83 1Dividends received from joint ventures (20) (11)Impairment (loss)/reversal of RusVinyl 19Transfer from other investments 1 9Currency translation differences 53 (20)Other (2) (3)Carrying amount at December 31 473 357
(1) See note F39.
In 2016, the profit (loss) for the year from joint ventures relatesmainly to RusVinyl (€ 49 million) and Peroxidos do Brazil(€ 19 million). The currency translation difference relates mainlyto the appreciation of the Russian ruble and the Brazilian realagainst the euro.
In 2015, the capital increase in joint ventures related mainly tothe investment in RusVinyl. The currency translation difference injoint ventures related mainly to the depreciation of the Russianruble and the Brazilian real against the euro.
In € million 2016 2015Carrying amount at January 1 92 121Additions 0 1Disposals (8) (13)Increase through business combination (5) 7Capital increase / decrease 4 33Changes of consolidation method (4) (9)Changes in consolidation scope (4) (14)Impairments (7) (32)Reversal of impairments 4Transfer to assets held for sale (11)Other (3) (6)Carrying amount at December 31 55 92
In accordance with the concept of materiality, certain companies whichare not of significant size have not been included in the consolidationscope. For more information, refer to Principles of consolidation.
At the end of each reporting period, the Group reviews whetherthere is any indication that those assets have suffered animpairment loss. If any such indication exists, the recoverableamount of the asset is estimated in order to determine theextent of the impairment loss (if any). Where it is not possibleto estimate the recoverable amount of an individual asset, theGroup estimates the recoverable amount of the CGU to whichthe asset belongs. Where a reasonable and consistent basis of
allocation can be identified, corporate assets are allocated toindividual CGUs, or otherwise they are allocated to the smallestgroup of CGUs for which a reasonable and consistent allocationbasis can be identified.
The recoverable amount is the higher of the fair value less coststo sell and the value in use. In assessing value in use, theestimated future cash flows are discounted to their present valueusing a pre-tax discount rate that reflects current marketassessments of the time value of money and the risks specific tothe asset for which the estimates of future cash flows have notbeen adjusted.
If the recoverable amount of an asset (or CGU) is estimated to beless than its carrying amount, the carrying amount of the asset(or CGU) is reduced to its recoverable amount. An impairmentloss is recognized immediately in profit or loss.
Investments in joint ventures(1)
NOTE F27Other investments
NOTE F28Impairment of tangible assets, intangible assets,and equity method investees
Accounting policy
General
FINANCIAL STATEMENTS
SOLVAY 2016 Annual Integrated Report177

Where an impairment loss subsequently reverses, the carryingamount of the asset (or CGU) is increased to the revised estimateof its recoverable amount, but so that the increased carryingamount does not exceed the carrying amount that would havebeen determined (net of amortization or depreciation) had noimpairment loss been recognized for the asset (or CGU) in prioryears. A reversal of an impairment loss is recognized immediatelyin profit or loss.
In accordance with IAS 36 Impairment of Assets, the recoverableamount of property, plant, and equipment, intangible assets,CGUs or groups of CGUs, including goodwill, and equity methodinvestees corresponds to the higher of their fair value less costsof disposal and their value in use. The latter equals the presentvalue of the future cash flows expected to be derived from eachasset, CGU or group of CGUs, and equity method investees andis determined using the following inputs:
The discount rate is estimated based on an extensivebenchmarking with peers, so as to reflect the return investorswould require if they were to choose an investment in theunderlying assets. The weighted average cost of capital used todiscount future cash flows was set at 7.2% in 2016 (7.7% in 2015).The decrease is driven by the lower interest rate environment.
In 2016, the long-term growth rate was set at 2%, except forAroma, for which a 1% rate was set. In 2015, the long-termgrowth rate was set between 1% and 3% depending on theCGU. The growth rates are consistent with the long-term averagemarket growth rates for the respective CGUs and the countriesin which they operate.
Other key assumptions are specific to each CGU (energy price,volumes, margin, etc.).
The impairment tests performed at CGU level atDecember 31, 2016 and December 31, 2015 did not lead to anyimpairment of assets, as the recoverable amounts of the (groupsof) CGUs were significantly higher than their carrying amounts.More specifically, the difference between the carrying amount ofthe CGUs or groups of CGUs and their value in use (excess value)represents in all cases more than 10% of their carrying amount.As such, for those CGUs or groups of CGUs, a reasonable changein a key assumption on which the recoverable amount of theCGUs or groups of CGUs is based would not result in animpairment loss for the related CGUs or groups of CGUs. Inthis respect, for the Cytec CGUs (Composite Materials andTechnology Solutions), the sensitivities below led to the remainingexcess value being below 10% of their carrying amount:
Assumptions:Discount rate = 7.2%Long term growth rate = 2% Recoverable amount (in € billion)
Remaining excess value(in € billion)
CompositeMaterials
TechnologySolutions
CompositeMaterials
TechnologySolutions
Sensitivity to long term growth rate (1)% (0.5) (0.3) 0.2 0.1Sensitivity to long term growth rate +1% 0.8 0.5 1.5 0.8
Sensitivity to discount rate (0.5)% 0.4 0.3 1.1 0.6Sensitivity to discount rate + 0.5% (0.4) (0.2) 0.3 0.1
For the Cytec CGUs, either an unfavorable change in growth or discount rate as disclosed above is not expected to result in animpairment.
Assets other than non-current assets held for sale
business plan approved by management based on growthand profitability assumptions, taking into account pastperformances, forecast changes in the economic environment,and expected market developments. Such business plangenerally covers five years, unless management is confidentthat projections over a longer period are reliable;
consideration of a terminal value determined from the cashflows obtained by extrapolating the cash flows of the last yearof the business plan referred to above, affected by a long-term growth rate deemed appropriate for the activity and thelocation of the assets;
discounting of expected cash flows at a rate determined usingthe weighted average cost of capital formula.
Discount rate
Long-term growth rates
General
FINANCIAL STATEMENTS
178SOLVAY 2016 Annual Integrated Report

RusVinyl is a Russian joint venture in chlorovinyls (OperatingSegment: Functional Polymers) in which Solvay holds a 50%equity interest, together with Sibur who holds the remaining 50%equity interest.
In 2015 a new business plan provided by RusVinyl to its lendersled to a positive adjustment of RusVinyl equity earningsamounting to € 19 million. The recoverable amount of theinvestment has been estimated based on a dividend discountmodel taking into account this new business plan. In 2016 noadditional impairment losses or reversals of those wererecognized.
The recoverable amount is highly sensitive to theRUB/€ exchange rate. This rate impacts the carrying amount ofthe investment, the foreign currency losses on the eurodenominated debt, and consequently the distributable earningspotential. Sensitivities on the exchange rate RUB/€ and inflationin Russia lead to a range of outcomes varying between€ 90 million above and below the recoverable amount.
Impairment charges were recognized in 2016 with respect mainlyto the following assets:
An impairment charge of € 26 million relating to non-performingSpecial Chem’s assets (Operating Segment: Advanced Materials)was recognized in 2015.
At the end of 2015, Solvay confirmed that its strategic directionto sell its participation in Solvay Indupa remained unaffected andthat it was examining all options to achieve this objective. Theremeasurement to fair value less costs to sell of Solvay Indupaled to an additional impairment loss of € 88 million in 2015. OnMay 2, 2016, Solvay entered into a Share Purchase Agreementwith Unipar Carbocloro for the sale of its equity interests heldin Solvay Indupa. During the third quarter of 2016, the fair valueless cost to sell has been updated, so as to reflect the impactof the worsening of the business environment on the deal. Animpairment loss in the amount of € 63 million was recognized in2016. Completion of the disposal transaction, at a total enterprisevalue of US$ 202.2 million, took place on December 27, 2016.
Cost of inventories includes the purchase, conversion, and othercosts incurred in bringing the inventories to their presentlocation and condition. The cost of inventories is determinedby using the weighted average cost or first-in, first-out (FIFO)method. Inventories having a similar nature and use aremeasured using the same cost formula.
Inventories are measured at the lower of the purchasing cost(raw materials and merchandise) or production cost (work inprogress and finished goods), and net realizable value. Netrealizable value represents the estimated selling price, less allestimated costs of completion and the estimated costsnecessary to make the sale.
In € million 2016 2015Finished goods 1,051 1,172Raw materials and supplies 649 702Work in progress 45 63Total 1,745 1,937Write-downs (73) (71)Net total 1,672 1,867
RusVinyl
Other
the Egyptian Soda Ash plant following the mothballing decision(€ 82 million - Operating Segment: Performance Chemicals);
Brazilian electricity cogeneration assets following adversemarket conditions (€ 28 million – Operating Segment:Corporate and Business Services);
the Coleopterre assets (€ 16 million – Operating Segment:Advanced Materials); and
the US torrefied biomass electricity generation projectfollowing the decision to exit the project (€ 10 million –Operating Segment: Corporate and Business Services).
Non-current assets held for saleSolvay Indupa
NOTE F29Inventories
Accounting policy
FINANCIAL STATEMENTS
SOLVAY 2016 Annual Integrated Report179

In € million 2016 2015VAT and other taxes 289 290Advances to suppliers 79 52Financial instruments - operational 188 90Insurance premiums 24 22Loan receivables 9 25Receivables on assets disposal 39 35Other 107 143Other current receivables 736 655
Financial instruments – operational include held for trading and cash flow hedge derivatives (see note F32.A. Overview of financialinstruments).
In € millionEmployee
benefits Restructuring Environment Litigation Other TotalAt December 31, 2015 3,133 97 723 214 106 4,273
Additions 97 102 53 36 101 389Reversals of unused amounts (24) (16) (13) (67) (6) (125)Uses (200) (71) (90) (23) (30) (414)Increase through discounting 87 0 36 3 0 126Remeasurements 275 0 0 0 0 275Currency translation differences (52) (1) 17 10 (2) (27)Acquisitions and changes inconsolidation scope 10 3 5 (3) (2) 12Disposals (9) 0 2 (1) (2) (10)Transfer from/to liabilities associatedwith assets held for sale (201) 0 0 0 (1) (202)Other 1 (16) 5 (1) (17) (28)
At December 31, 2016 3,118 99 737 167 148 4,269Of which current provisions 0 92 99 26 73 291
In total provisions are stable.
The main events of 2016 are:
Management expects provisions (other than employee benefits)to be used (cash outlays) as follows:
In € million Up to 5 yearsBetween
5 and 10 years Beyond 10 years TotalTotal provisions for environment 342 141 254 737Total provisions for litigation(1) 144 6 149Total provisions for restructuring and other 201 19 30 249At December 31, 2016 686 165 284 1,136
(1) Excluding provisions with cash deposit to guarantee the liabilities (€ 18 million)
NOTE F30Other receivables (current)
NOTE F31Provisions
a net change in provisions of € 151 million (net amount ofadditions, reversals, and uses);
a decrease of the discount rates, mainly in the Eurozone andin the United Kingdom, and changes of other financial anddemographic assumptions used for the computation of theemployee benefits obligations, which led to a negative impactin equity of € 275 million; and
the transfer of liabilities from continuing to liabilities associatedwith assets held for sale amounting to € 202 million, relatingmainly to employee benefits obligations at Acetow.
FINANCIAL STATEMENTS
180SOLVAY 2016 Annual Integrated Report

The Group’s employees are offered various post-employmentand other long-term employee benefits as a result of legislationapplicable in certain countries, and contractual agreementsentered into by the Group with its employees or constructiveobligations.
The post-employment benefits are classified as definedcontribution or defined benefit plans.
Defined contribution plans involve the payment of fixedcontributions to a separate entity and release the employer fromany subsequent obligation, as this separate entity is solelyresponsible for paying the amounts due to the employee. Theexpense is recognized when an employee has rendered serviceto the Group during the period.
Defined benefit plans concern all plans other than definedcontribution plans and include:
Taking projected final salaries into account on an individual basis,post-employment benefits are measured by applying a method(projected unit credit method) using assumptions involvingdiscount rate, life expectancy, turnover, wages, annuityrevaluation, and medical cost inflation. The assumptions specificto each plan take into account the local economic anddemographic contexts.
The discount rates are interest rates of high-quality corporatebonds that are denominated in the currency in which thebenefits will be paid, and that have terms to maturityapproximating the terms of the related pension obligation.
The amount recognized under post-employment obligationscorresponds to the difference between the present value offuture obligations and the fair value of the plan assets fundingthe plan. If this calculation gives rise to a deficit, an obligationis recognized in liabilities. Otherwise, a net asset limited to thelower of the surplus in the defined benefit plan and the presentvalue of any future plan refunds or any reduction in futurecontributions to the plan is recognized.
The defined benefit cost consists of service cost and net interest(based on discount rate) on the net liability or asset, bothrecognized in profit or loss, and remeasurements of the netliability or asset, recognized in other comprehensive income.
Service cost consists of current service cost, past service costresulting from plan amendments or curtailments, and settlementgains or losses.
The interest expenses arising from the reverse discounting ofthe benefit obligations, the financial income on plan assets(determined by multiplying the fair value of the plan assets by thediscount rate), and interest on the effect of the asset ceiling arerecognized on a net basis in the net financial charges.
Remeasurements of the net liability or asset consist of:
Other long-term benefits such as long service awards areaccounted for in the same way as post-employment benefits butremeasurements are fully recognized in the net financial chargesduring the period in which they occur.
The actuarial calculations of post-employment obligations andother long-term benefits are performed by independentactuaries.
F31.A. Provisions for employee benefits
Accounting policy
General
Defined contribution plans
Defined benefit plans
post-employment benefits: pension plans, terminationbenefits, other retirement obligations, and supplementalbenefits;
other long-term employee benefits: long-service benefitsgranted to employees according to their seniority in theGroup; and
other post-employment benefits: medical care.
actuarial gains and losses on the benefit obligations arisingfrom experience adjustments and/or changes in actuarialassumptions (including the effect of changes in the discountrate)
the return on plan assets (excluding amounts in net interest)and changes in the limitation of the net asset recognized.
FINANCIAL STATEMENTS
SOLVAY 2016 Annual Integrated Report181

In € million 2016 2015Post-employment benefits 2,949 2,964Other long-term benefits 120 115Termination benefits 48 53Total employee benefits 3,118 3,133
For defined contribution plans, Solvay pays contributions topublicly or privately administered pension funds or insurancecompanies. For 2016, the expense amounted to € 56 million asagainst € 31 million in 2015; this increase is due mainly to theacquisition of Cytec at the end of 2015, for which expenses havebeen consolidated as from January 1, 2016.
Defined benefit plans can either be funded via outside pensionfunds or insurance companies (“funded plans”) or financed withinthe Group (“unfunded plans”).
The net liability results from the net of the provisions and thecapitalized pensions assets.
In € million 2016 2015Provisions 2,949 2,964Asset plan surplus (13) (9)Net liability 2,936 2,955Operational expense 55 30Finance expense 80 66
Over recent years, the Group has reduced its exposure todefined benefit plan obligations stemming from future servicesby converting existing plans into pension plans with a lower riskprofile (hybrid plans, cash balance plans, and definedcontribution plans) or by closing them to new entrants.
Solvay continuously monitors its risk exposure, focusing on thefollowing risks:
Equity instruments, though expected to outperform corporatebonds in the long-term, create volatility and risk in the shortterm. To mitigate this risk, the allocation to equity instruments ismonitored using Assets and Liabilities Management techniques,to ensure it remains appropriate given the long-term objectivesof the Group and of the respective schemes.
A decrease in corporate bond yields will increase the carryingamount of the plan’s liabilities. For funded schemes this impactwill be offset partially by an increase in the fair value of the planassets.
The defined benefit obligations are linked to inflation, and higherinflation will lead to higher liabilities (although, in most cases,caps on the level of inflationary increases are in place to protect
against extreme inflation). A limited part of the assets is eitherunaffected by or only loosely correlated with inflation, meaningthat an increase in inflation will also increase the deficit.
The majority of the schemes’ obligations are to provide benefitsfor the life of the member. Increases in life expectancy willtherefore increase the plans’ liabilities.
This risk is limited, as major plans in foreign currency are fundedand most of their assets are denominated in the currency inwhich benefit payments will take place.
For partly or fully unfunded plans, the Group is exposed to therisk of external funding following regulatory constraints. Thisshould not impact the defined benefit obligation but couldexpose the Group to a potential significant cash outlay.
For more information about Solvay Group risk management,please refer to the Management of risks section of the presentdocument.
Overview
A. Defined contribution plans B. Defined benefit plans
B.1. Management of risks
Asset volatility
Changes in bond yields
Inflation risk
Life expectancy
Currency risk
Regulatory risk
FINANCIAL STATEMENTS
182SOLVAY 2016 Annual Integrated Report

The provisions have been set up primarily to cover post-employment benefits granted by most Group companies, in lineeither with local rules and customs or with established practiceswhich generate constructive obligations.
The largest post-employment plans in 2016 are in the UnitedKingdom, France, the United States, Germany, and Belgium.These five countries represent 94% of the total defined benefitobligation.
2016 2015United Kingdom 30% 30%France 20% 19%United States 27% 27%Germany 10% 12%Belgium 7% 6%Other countries 6% 6%
Solvay sponsors a few defined benefit plans in the UnitedKingdom; the largest one is the Rhodia Pension Fund. This is afinal salary funded pension plan, with entitlement to accrue apercentage of salary per year of service. It was closed to newentrants in 2003 and replaced by a defined contribution plan.
Broadly, about 8% of the liabilities are attributable to currentemployees, 26% to former employees, and 66% to currentpensioners.
The Fund functions and complies with UK legislation under alarge regulatory framework. The Pensions Regulator has a risk-based approach to regulation and a code of practice whichprovides practical guidance to trustees and employers of definedbenefit schemes on how to comply with the scheme fundingrequirements. In accordance with UK legislation, the Fund issubject to Scheme Specific Funding which requires that pensionplans are funded prudently.
The UK Rhodia Pension Fund is governed by a Board of Trustees.They manage the Fund with prudent and fair judgment. TheTrustees determine the liabilities used for Statutory FundingObjectives based on prudent actuarial and economicassumptions. Any shortfall or deficit once these liabilities havebeen deducted from the Fund’s assets must be reduced byadditional contributions and in a time frame that fits with theemployer’s ability to pay and the strength of covenant orcontingent security being offered.
The Rhodia Pension Fund is subject to a triennial valuation cyclefor funding purposes. This valuation is performed by the schemeactuary in line with UK regulations and is discussed between theTrustees and the sponsoring employer to agree the valuationassumptions and a funding plan. The last completed valuationwas as at January 1, 2015 which established a fixed contributionrate of pensionable pay for active members plus a deficitrecovery plan which aims to fund the scheme through technical
provisions over a period of time. Future contributions were keptat the same level as those agreed at the previous valuation, whichrequired the recovery plan to be extended for another year.
Solvay sponsors various defined benefit plans in France: theFrench compulsory retirement indemnity plan as well as twoclosed and one open top hat plans.
The main plan is for all former Rhodia current and retiredemployees who contributed to the plan prior to its closure inthe 1970s. It offers a full benefit guarantee based on the end-of-career salary. This plan is unfunded and approximately 95% ofthe liabilities are attributable to current pensioners.
Solvay does not expect to have any cash out impact in Francedue to the changes in legislation regarding minimum fundingrequirements.
As of year end 2016 Solvay sponsored six different definedbenefit pension plans in the United States (three qualified plansand three non-qualified plans). A qualified plan is an employer-sponsored retirement plan that qualifies for special tax treatmentunder Section 401(a) of the Internal Revenue Code. At thismoment all defined benefit plans are closed to new entrants;newly hired employees are eligible to participate in a definedcontribution plan. Note that all three of the qualified definedbenefit pension plans are funded while the three non-qualifieddefined benefit pension plans are unfunded. The qualified plansmake up the vast majority of the pension liabilities as ofDecember 31, 2016.
Solvay's plans are in compliance with local laws regarding auditedfinancial statements, governmental filings, and Pension BenefitGuaranty Corporation insurance premiums where applicable.The plans are reviewed and monitored locally by fiduciarycommittees for purposes of plan investments and administrativematters.
B.2 Description of obligations
United Kingdom
France
United States
FINANCIAL STATEMENTS
SOLVAY 2016 Annual Integrated Report183

For the US qualified plans, Solvay’s contributions take intoaccount minimum (tax-deductible) funding requirements andmaximum tax deductible contributions, both regulated by the taxauthorities.
Certain eligible participants may elect to receive their pension ina single lump sum payment instead of a monthly payment.
During 2016, Solvay took action to reduce the liabilities of itsqualified pension plans. In December 2016, Solvay offered avoluntary lump-sum pension settlement to participants in theseplans, and it also entered into an agreement with an insurancecarrier to purchase a group annuity contract to settle asubstantial portion of the plans’ liabilities for current pensioners.
Broadly, about 31% of the liabilities are attributable to currentemployees, 10% to former employees for whom benefitpayments have not yet commenced, and 59% to currentpensioners.
In connection with the lump-sum offering, approximately 900plan participants who had deferred vested benefits elected toreceive their pension benefits in the form of a one-time lump-sum payment with no future payments due. As a result, US$42 million in pension lump sums were distributed from the plansin December 2016.
In addition, as noted above, Solvay purchased a group annuitycontract under which an insurance carrier will pay and administerfuture benefit payments for approximately 3,100 pensioners.This transaction closed in December 2016 with the transfer ofUS$ 112 million in assets to the selected insurance carrier.
In 2016, in the United States Solvay contributed to threemultiemployer pension plans under collective bargainingagreements that cover certain of its union-representedemployees. Solvay withdrew from the National IntegratedGeneral Pension Plan on June 1, 2016, pursuant to collectivebargaining agreements. Following the Cytec acquisition Solvayis now contributing to the Western Conference of Teamsterspension fund on behalf of Orange, California, union employees.Each of the multiemployer plans is a defined benefit pensionplan. None of the multiemployer plans provides an allocationof its assets, liabilities, or costs among contributing employers.None of the multiemployer plans provides sufficient informationto permit Solvay, or other contributing employers, to account forthe multiemployer plan as a defined benefit plan. Accordingly,the company accounts for its participation in each of themultiemployer plans as if they were a defined contribution plan.The annual contributions paid to multiemployer plans during2016 and 2015 were less than € 1 million.
Solvay sponsors five different defined benefit plans in Germany,of which two are closed to new entrants and three are open. As iscommon in Germany, all these plans are unfunded. Under theseplans, employees are entitled to annual pensions on retirementbased on their service and final salary.
Broadly, about 64% of the liabilities are attributable to currentpensioners.
Solvay sponsors two defined benefit plans in Belgium. These arefunded pension plans. The plan for executives has been closedsince the end of 2006, and the plan for the white and bluecollars has been closed since 2004. The past service benefitsprovided under these plans continues to be adapted each yearconsidering annual salary increase and inflation (“Dynamicmanagement”). In accordance with market practice in Belgium,because of favorable retirement lump-sum taxation mostbenefits are paid as lump sum.
Furthermore, Solvay sponsors two open defined contributionplans. These are funded pension plans: the plan for executivesopened at the beginning of 2007 and the plan for white andblue collars opened at the beginning of 2005. There are fourdifferent investment funds – ranging from “Prudent” to “Dynamic”– in which participants may choose to invest their contributionsHowever, regardless of their choices, Belgian law stipulates thatthe employer must guarantee a return on employer contributionand on personal contribution, thereby creating a potential liabilityfor the Company. Since January 1, 2016 the return is set on anannual basis with a minimum of 1.75% and a maximum of 3.75%.For 2016 and 2017 the return is fixed at 1.75% for both typesof contributions. For these plans Solvay has € 110 million of planassets at December 31, 2016, and paid € 9 million ofcontributions during 2016. At the end of 2016 the net liabilityrecognized in the consolidated statement of financial positionconcerning these plans is not material.
Solvay’s plans are administered through two Solvay PensionFunds that operate in compliance with local laws regardingminimum funding, investments principles, audited financialstatements, governmental filings, and governance principles.Pension Funds are managed through a General Assembly anda Board of Directors delegating day-to-day activities to anoperational committee.
The majority of the obligations relate to pension plans. In somecountries (mainly the United States), there are also post-retirement medical plans, which represent 6% of the totaldefined benefit obligation.
Germany
Belgium
Other plans
FINANCIAL STATEMENTS
184SOLVAY 2016 Annual Integrated Report

In € million 2016 2015Net amount recognized at beginning of period 2,955 3,014Net expense recognized in P&L - Defined benefit plans 135 96Actual employer contributions/direct actual benefits paid (181) (168)Acquisitions/disposals 0 189Remeasurements before impact of asset ceiling 290 (291)Change in the effect of the asset ceiling limit on remeasurements (16) 12Reclassifications 1 30Currency translation differences (54) 61Transfer from/to (liabilities associated with) assets held for sale (195) 12Net amount recognized at end of period 2,936 2,955
The decrease of the net liability of € 19 million between 2015 and2016 is explained mainly by the net effect of:
In € million 2016 2015Service costs 39 18Current service costs 49 51Past service costs (including curtailments) (10) (32)Net interest 80 66Interest cost 194 149Interest income (114) (83)Administrative expenses paid 16 11Net expense recognized in P&L - Defined benefit plans 135 96Remeasurements recognized in other comprehensive income 275 (279)
The service costs and administrative expenses of these definedbenefit plans are recognized within cost of sales, commercial andadministrative costs, research & development costs, operatinggains and losses and results from legacy remediation. The netinterest is reported as a finance expense.
In 2016 the Group’s current service costs amounted to€ 49 million, of which € 32 million related to funded plans and€ 17 million related to unfunded plans. Cytec integration has notgenerated an increase of service cost because the majority of itsUS pensions plans are closed. Conversely, the administrative and
interest costs increased in 2016 further to the Cytec integration.Past service costs include favorable impacts reflecting theamendment of the medical plan in Brazil (€ 9 million).
In 2015 the Group current service costs amounted to€ 51 million, of which € 33 million related to funded plans and€ 18 million related to unfunded plans. Past service costs includefavorable impacts reflecting the evolution of the post retirementMedicare insurance policy in the United States (€ 30 million).
B.3 Financial impacts
Changes in net liability
remeasurements (€ 275 million) due primarily to the decreaseof discount rates for Eurozone, United Kingdom and UnitedStates, partially offset by favorable investment returns. Totalremeasurement amounts to € 290 million of which € 16 millionwere not recognized due to asset ceiling. Note thatremeasurements in 2015 amounted to € (279) million in thecontext of increase in discount rates;
the classification as held for sale of Acetow activities (€ (195)million);
the positive effect on foreign currency, mainly in UnitedKingdom (€ (54) million);
the net expense in the consolidated income statement(€ 135 million); and
the cash out (€ (181) million).
Net expense
FINANCIAL STATEMENTS
SOLVAY 2016 Annual Integrated Report185

In € million 2016 2015Defined benefit obligations - funded plans 3,650 3,648Fair value of plan assets at end of period (2,811) (2,940)Deficit for funded plans 839 708Defined benefit obligations - unfunded plans 2,089 2,223Deficit/Surplus (-) 2,928 2,931Amounts not recognized as asset due to asset ceiling (recognized in other comprehensive income) 8 24Net liability (asset) 2,936 2,955Provision recognized 2,949 2,964Asset recognized (13) (9)
In € million 2016 2015Defined benefit obligation at beginning of period 5,871 5,103Current service costs 49 51Interest cost 194 149Employee contributions 4 4Past service costs (including curtailments) (9) (32)Settlements (139) 1Acquisitions/disposals (-) 0 986Remeasurements in other comprehensive income 456 (324)
Actuarial gains and losses due to changes in demographic assumptions (22) (77)Actuarial gains and losses due to changes in financial assumptions 460 (242)Actuarial gains and losses due to experience 18 (5)
Actual benefits paid (318) (270)Currency translation differences (175) 158Reclassification and other movements 0 38Transfer from/to (liabilities associated with) assets held for sale (195) 9Defined benefit obligation at end of period 5,739 5,871
Defined benefit obligations - funded plans 3,650 3,648Defined benefit obligations - unfunded plans 2,089 2,223
In 2016 the classification as held for sale of Acetow activities led to a decrease of defined benefit obligations of € 190 million.
In 2015 the major variation on Solvay defined benefit obligation was the acquisition of Cytec activities which led to an increase of€ 992 million.
Net liability
Changes in defined benefit obligations
FINANCIAL STATEMENTS
186SOLVAY 2016 Annual Integrated Report

In € million 2016 2015Fair value of plan assets at beginning of period 2,940 2,102Interest income 114 83Remeasurements in other comprehensive income 166 (33)
Return on plan assets (excluding amounts in net interests) 166 (33)Employer contributions 181 168Employee contributions 4 4Acquisitions/disposals (-) 0 797Administrative expenses paid (16) (11)Settlements (138) 1Actual benefits paid (318) (270)Currency translation differences (121) 97Reclassification and other movements (1) 7Transfer from/to (liabilities associated with) assets held for sale 0 (4)Fair value of plan assets at end of period 2,811 2,940Actual return on plan assets 280 50
In 2016 the total return on plan assets amounted to € 280 million.
In 2015 the major variation on Solvay plan assets was the acquisition ofCytec activities which led to an increase of € 785 million.
The Group’s cash contributions (including direct benefitpayments) for 2016 amounted to € 181 million, of which€ 79 million were contributions to funds and € 102 million weredirect benefits payments.
The Group’s cash contributions (including direct benefitpayments) for 2015 amounted to € 168 million, of which€ 63 million were contributions to funds and € 105 million weredirect benefits payments.
Excluding significant changes in the regulatory environment (see“Regulatory risk” above), the Group’s cash contributions in 2017are expected to approximate € 209 million. This increase is dueto additional contributions in the United States.
2016 2015Quoted Non quoted Quoted Non quoted
Equity 38% 0% 51% 0%Bonds
Investment Grade 57% 0% 44% 0%Non Investment Grade 1% 0% 1% 0%
Properties 1% 0% 1% 0%Cash and cash equivalents 3% 0% 3% 0%Derivatives
Structured debt (LDI) 0% 0% 0% 0%Other derivatives 0% 0% 0% 0%
Others 0% 0% 0% 0%Total 100% 0% 100% 0%
Changes in the fair value of plan assets
Categories of plan assets
FINANCIAL STATEMENTS
SOLVAY 2016 Annual Integrated Report187

With respect to the invested assets, it should be noted that these assets do not contain any direct investment in Solvay Group shares orin property or other assets occupied or used by Solvay. This does not prevent Solvay shares from being included in mutual investmentfund type investments.
In € million 2016 2015Effect of the asset ceiling limit at beginning of year 24 12Change in the effect of the asset ceiling limit on remeasurements (16) 12Effect of the asset ceiling limit at end of year 8 24
The changes in asset ceiling recognized through OCI amount to € (16) million as against € 12 million in 2015. These impacts relate to theplans of Brazil, Portugal, and Switzerland.
These assumptions are not related to a specific segment.
Eurozone United Kingdom United StatesIn % 2016 2015 2016 2015 2016 2015Discount rates 1.50 2.25 2.75 3.75 4.00 4.25Expected rates of future salary increases 1.75 – 4.00 1.75 – 4.00 2.40 – 3.50 2.15 – 3.25 3.00 – 3.75 3.00 – 3.75Inflation 1.50 – 2.00 1.75 3.50 3.25 2.25 2.25Expected rates of pension growth 0.00 – 1.75 0.00 – 1.75 3.50 3.25 NA NAExpected rates of medical care costincreases 1.75 1.75 5.40 5.50 4.50 – 7.00 4.50 – 7.50
These assumptions are not related to a specific segment.
Eurozone United Kingdom United StatesIn % 2016 2015 2016 2015 2016 2015Discount rates 2.25 1.75 3.75 3.50 4.25 4.00Expected rates of future salary increases 1.75 – 4.00 1.75 – 4.00 2.15 – 3.25 1.90 – 3.00 3.00 – 3.75 3.00 – 3.75Inflation 1.75 1.75 3.25 3.00 2.25 2.25Expected rates of pension growth 0.00 – 1.75 0.00 – 1.75 3.25 3.00 NA NAExpected rates of medical care costincreases 1.75 1.75 5.40 5.50 4.50 – 7.00 4.50 – 7.50
Actuarial assumptions regarding future mortality are based on recent country-specific mortality tables. These assumptions translate atDecember 31, 2016 into an average remaining life expectancy in years for a pensioner retiring at age 65:
In years United Kingdom United States Belgium France GermanyRetiring at the end of the reporting period
Male 21 20 18 24 20Female 24 22 21 28 24
Retiring 20 years after the end of the reporting periodMale 23 21 18 27 22Female 25 23 21 31 26
Changes in assets ceiling
Actuarial assumptions
Actuarial assumptions used in determining the annual cost
FINANCIAL STATEMENTS
188SOLVAY 2016 Annual Integrated Report

In some countries such as United Kingdom and United States, the mortality assumptions reflect actual scheme experience and/or Solvay’sexpectations in terms of future mortality improvements.
The actuarial assumptions used in determining the benefit obligation at December 31 are based on the following employee benefitliability durations:
Eurozone United Kingdom United StatesDuration in years 12.3 16.1 10.6
Sensitivity to a change of percentage in the discount rates on the defined benefits obligation is as follows:
In € million 0.25% increase 0.25% decreaseEurozone (72) 75United Kingdom (67) 70United States (38) 39Others (6) 6Total (183) 190
Sensitivity to a change of percentage in the inflation rates on the defined benefits obligation is as follows:
In € million 0.25% increase 0.25% decreaseEurozone 66 (64)United Kingdom 53 (51)United States 0 0Others 4 (4)Total 123 (119)
Sensitivities
FINANCIAL STATEMENTS
SOLVAY 2016 Annual Integrated Report189

Sensitivity to a change of percentage in salary growth rate on the defined benefits obligation is as follows:
In € million 0.25% increase 0.25% decreaseEurozone 18 (17)United Kingdom 3 (3)United States 1 (1)Others 1 (1)Total 23 (22)
Sensitivity to a change of one year on mortality tables on the defined benefits obligation is as follows:
In € millionAge correction +1
yearAge correction (1)
yearEurozone (74) 76United Kingdom (54) 54United States (30) 31Others (7) 7Total (165) 168
Provisions are recognized when (a) the Group has a presentobligation (legal or constructive) as a result of a past event, (b) it isprobable that the Group will be required to settle the obligation,and (c) a reliable estimate can be made of the amount of theobligation.
The amount recognized as a provision is the best estimate ofthe consideration required to settle the present obligation atthe end of the reporting period, taking into account the risksand uncertainties surrounding the obligation. Where the effect ofthe time value of money is material, the amount is the presentvalue of expenditures required to settle the obligation. Impactsof changes in discount rates are generally recognized in thefinancial result.
When some or all of the economic benefits required to settlea provision are expected to be recovered from a third party,a receivable is recognized as an asset if it is virtually certainthat reimbursement will be received if the Group settles theobligation.
An onerous contract is a contract in which the unavoidable costsof meeting the obligations under the contract exceed theeconomic benefits expected to be received under it. Presentobligations arising from onerous contracts are recognized andmeasured as provisions.
A restructuring provision is recognized when the Group hasdeveloped a detailed formal plan for the restructuring and has,by starting to implement the plan or announcing its mainfeatures to those affected by it, raised a valid expectation inthose affected that it will carry out the restructuring. Themeasurement of a restructuring provision includes only thedirect expenditures arising from the restructuring, which arethose amounts that are both necessarily entailed by therestructuring and not associated with the ongoing activities ofthe entity.
Solvay analyzes twice a year all its environmental risks and thecorresponding provisions. Solvay measures these provisions tothe best of its knowledge of applicable regulations, the natureand extent of the pollution, clean-up techniques, and otheravailable information.
F31.B. Provisions other than for employee benefits
Accounting policy
General
Onerous contracts
Restructurings
Environmental liabilities
FINANCIAL STATEMENTS
190SOLVAY 2016 Annual Integrated Report

These provisions amount to € 99 million, as against € 97 million at the endof 2015.
The main provisions at the end of 2016 relate to:
These provisions amount to € 737 million at the end of 2016, as against€ 723 million at the end of 2015, and pertain to:
The estimated amounts are discounted based on the probable date ofsettlement, and are adjusted periodically to reflect the passage of time.
Provisions for litigation refer to tax and legal exposures. They amount to€ 167 million at the end of 2016 as against € 214 million at the end of2015.Thedecrease isexplainedmainlybythereversalof (a)ataxprovisionof € 25 million and (b) a legal provision for Pharma of € 20 million.
The balance at the end of 2016 relates to tax risks (€ 81 million) and legalclaims (€ 76 million).
Other provisions relate to the shutdown or disposal of activities andamount to € 148 million, as against € 106 million at the end of 2015.
Financial assets include available-for-sale securities, loans andreceivables, and derivative financial instruments. All financialassets are recognized and derecognized on trade date where thepurchase or sale of a financial asset is under a contract whoseterms require delivery of the financial asset within the time frameestablished by the market concerned, and are initially measuredat fair value plus transaction costs, except for financial assetsclassified as at fair value through profit or loss, which are initiallymeasured at fair value.
A financial asset is classified as current when the cash flowsexpected to flow from the instrument mature within one year.
At initial recognition, Solvay classifies financial assets into oneof the four categories provided in IAS 39 Financial Instruments:Recognition and Measurement. This classification determinesthe method for measuring financial assets at subsequentreporting dates: amortized cost or fair value.
Amortized cost is the amount at which the financial asset ismeasured at initial recognition minus principal repayments, plusor minus the cumulative amortization using the effective interestmethod of any difference between that initial amount and thematurity amount, minus any reduction for impairment oruncollectibility. The effective interest method is a method ofcalculating the amortized cost of a debt instrument and ofallocating interest income over the relevant period. The effectiveinterest rate is the rate that exactly discounts estimated futurecash receipts (including all fees on points paid or received thatform an integral part of the effective interest rate, transactioncosts, and other premiums or discounts) through the expectedlife of the debt instrument or, when appropriate, a shorterperiod, to the net carrying amount on initial recognition.
Income is recognized on an effective interest basis for debtinstruments other than those financial assets classified as at fairvalue through profit or loss.
Restructuring provisions
the reorganization of Corporate Functions following Group portfolioreview (€ 48 million); and
Cytec (€ 18 million).
Environmental provisions
mines and drilling operations to the extent that legislation and/oroperating permits in relation to quarries, mines, and drilling operationscontain requirements to pay compensation to third parties. Theseprovisions, based on local expert advice, can be expected to be usedover a 1-20 year horizon and amount to € 148 million;
the discontinuation of mercury electrolysis activities: forecastexpenditure is staggered over time as a result of the expectedreutilization of the sites, national regulations on the management ofcontaminated soils, and the state of contamination of soils andgroundwater. Most of these provisions can be expected to be usedover a 10-20 year time horizon;
dikes, dump sites and land: the provisions relate mainly to soda plantdikes, old lime dikes and land and dump sites linked to activities atcertain industrial sites. These provisions have a horizon of 1 to 20 years;and
various types of pollution (organic, inorganic) coming frommiscellaneous specialty chemical productions; these provisions mainlycover discontinued activities or closed plants. Most of these provisionshave a horizon of 1 to 20 years.
Provisions for litigation
Other provisions
NOTE F32Financial instruments and financial riskmanagement
Accounting policy
General
FINANCIAL STATEMENTS
SOLVAY 2016 Annual Integrated Report191

For instruments quoted in an active market, the fair valuecorresponds to a market price (level 1). For instruments that arenot quoted in an active market, the fair value is determinedusing valuation techniques including reference to recent arm’slength market transactions or transactions involving instrumentswhich are substantially the same (level 2), or discounted cashflow analysis including, to the greatest possible extent,assumptions consistent with observable market data (level 3).However, if the fair value of an equity instrument that does nothave a quoted price in an active market cannot be reliablyestimated, it is measured at cost.
Financial assets are measured at fair value with any resultinggains or losses recognized in profit or loss if they are held fortrading. A financial asset is classified in this category if acquiredprincipally for the purpose of selling in the short term. Derivativesare also classified as held for trading. In this case, resulting gainsand losses are recognized in profit or loss unless they aredesignated and effective as hedging instruments in a cash flowhedge.
Available-for-sale financial assets include equity investments inentities, which were not acquired principally for the purpose ofselling in the short term, and which are not subsidiaries, jointoperations, joint ventures, or associates. Assets classified in thiscategory are measured at fair value, with any resulting gainsor losses recognized in other comprehensive income. If thereis objective evidence that the asset is impaired, any cumulativeloss that had been recognized in other comprehensive income isreclassified from equity to profit or loss.
Loans and receivables are non-derivative financial assets withfixed or determinable payments which are not quoted in anactive market. The Group’s loans and receivables categorycomprises cash and cash equivalents, trade receivables, and
other non-current receivables except for pension fundsurpluses. Cash equivalents are short-term, highly liquidinvestments that are readily convertible to known amounts ofcash, have maturities of three months or less from the dateof acquisition, and are subject to insignificant risk of change invalue. Loans and receivables are measured at amortized costusing the effective interest method, less any impairment.
The impairment loss of a financial asset measured at amortizedcost equals the difference between the carrying amount and theestimated future cash flows, discounted at the initial effectiveinterest rate. The impairment of an available-for-sale financialasset is calculated with reference to its current fair value.
An impairment test is performed, on an individual basis, for eachmaterial financial asset. Other assets are tested as groups offinancial assets with similar credit risk characteristics.
Impairment losses are recognized in the consolidated incomestatement.
The impairment loss is reversed if the reversal can be objectivelyrelated to an event occurring after the impairment wasrecognized. For financial assets measured at amortized cost, thereversal is recognized in profit or loss. After reversal, the carryingamount of the financial asset measured at amortized cost shallnot exceed what the amortized cost would have been, had theimpairment not been recognized. Impairment losses withrespect to an equity instrument classified as available for saleare not reversed through profit or loss. Impairment losses withrespect to debt instruments classified as available for sale arereversed through profit or loss to the extent of the impairmentloss previously recognized in profit or loss. Impairment lossesrelating to assets measured at cost cannot be reversed.
Financial liabilities are classified as either “financial liabilities atfair value through profit or loss” or “financial liabilities measuredat amortized cost”.
Financial assets at fair value through profit or loss
Available-for-sale financial assets
Loans and receivables
Impairment of financial assets
FINANCIAL STATEMENTS
192SOLVAY 2016 Annual Integrated Report

Financial liabilities are measured at fair value with any resultinggains or losses recognized in profit or loss if they are held fortrading. A financial liability is classified in this category if acquiredprincipally for the purpose of selling in the short term. Derivativesare also classified as held for trading. In this case, resulting gainsand losses are recognized in profit or loss unless they aredesignated and effective as hedging instruments in a cash flowhedge.
Financial liabilities measured at amortized cost, includingborrowings, are initially measured at fair value, net of transactioncosts. They are subsequently measured at amortized cost usingthe effective interest method, with interest expense recognizedon an effective yield basis.
The effective interest method is a method of calculating theamortized cost of a financial liability and of allocating interestexpense over the relevant period. The effective interest rate isthe rate that exactly discounts estimated future cash paymentsthrough the expected life of the financial liability, or, whereappropriate, a shorter period, to the net carrying amount oninitial recognition.
The Group’s financial liabilities measured at amortized costcomprise long-term financial debt, other current and non-current liabilities, short-term financial debt, trade liabilities anddividends payable.
Derivative financial instruments are financial instruments with allthree of the following characteristics:
The Group enters into a variety of derivative financial instruments(forward, future, option, and swap contracts) to manage itsexposure to interest rate risk, foreign exchange rate risk, andcommodity risk (mainly energy and CO2 emission rights pricerisks).
Derivatives are initially recognized at fair value at the date aderivative contract is entered into and are subsequentlyremeasured to their fair value at the end of each reportingperiod. The resulting gain or loss is recognized in income orexpense, unless the derivative is designated and effective as ahedging instrument. The Group designates certain derivativesas hedging instruments of the exposure to variability in cashflows with respect to a recognized asset or liability or a highlyprobable forecast transaction (cash flow hedges).
A derivative with a positive fair value is recognized as a financialasset whereas a derivative with a negative fair value is recognizedas a financial liability. Derivative instruments (or portions of them)are presented as non-current assets or non-current liabilities ifthe remaining maturity of the underlying settlements is morethan twelve months after the reporting period. Other derivativeinstruments (or portions of them) are presented as currentassets or current liabilities.
The Group designates certain derivatives and embeddedderivatives, in respect of foreign currency risk, interest rate risk,energy price risk, and CO2 emission rights price risk, as hedginginstruments in a cash flow hedge relationship.
At the inception of the hedge relationship, the entity documentsthe relationship between the hedging instrument and thehedged item, along with its risk management objectives and itsstrategy for undertaking the hedge transaction. Furthermore, atthe inception of the hedge and on an ongoing basis, the Groupdocuments whether the hedging instrument is highly effective inoffsetting changes in cash flows of the hedged item.
The effective portion of changes in the fair value of hedginginstruments that are designated in a cash flow hedge isrecognized in other comprehensive income. The gain or lossrelating to the ineffective portion is recognized immediately inprofit or loss.
Amounts previously recognized in other comprehensive incomeare reclassified to profit or loss in the periods when the hedgeditem is recognized in profit or loss, in the same line of theconsolidated income statement as the recognized hedged item.When the hedged forecast transaction results in the recognitionof a non-financial asset or a non-financial liability, the gains andlosses previously recognized in other comprehensive income aretransferred from other comprehensive income and included inthe initial measurement of the cost of the non-financial asset ornon-financial liability.
Financial liabilities at fair value through profit or loss
Financial liabilities measured at amortized cost using theeffective interest method
Derivative financial instruments
their value changes in response to the change in a specifiedinterest rate, financial instrument price, commodity price,foreign exchange rate, index of prices or rates, credit rating orcredit index, etc.;
they require no initial net investment or an initial netinvestment that is smaller than would be required for othertypes of contracts that would be expected to have a similarresponse to changes in market factors; and
they are settled at a future date.
Hedge accounting
Cash flow hedges
FINANCIAL STATEMENTS
SOLVAY 2016 Annual Integrated Report193

Hedge accounting is discontinued when the Group revokes thehedging relationship, the hedging instrument expires or is sold,terminated, or exercised, or no longer qualifies for hedgeaccounting. Any gain or loss accumulated in othercomprehensive income at that time remains in othercomprehensive income and will affect profit or loss as describedin the paragraph above. When a forecast transaction is no longerexpected to occur, the gain or loss accumulated in other
comprehensive income is recognized immediately in profit orloss as a reclassification adjustment. If all or a portion of a lossrecognized in other comprehensive income will not be recoveredin one or more future periods, the amount that is not expectedto be recovered is immediately reclassified into profit or loss.
The following table presents the financial instruments bycategory, split into current and non-current assets and liabilities.
2016 2015
In € million ClassificationCarryingamount
Carryingamount
Non-current assets - Financial instruments 343 452Available for sale financial assets Available-for-sale 44 34Loans and other non-current assets (except pension fund surpluses) 299 418
INOVYN derivative financial instrument Held for trading 0 244Others Loans and Receivables 299 174
Current assets - Financial instruments 2,878 3,846Trade receivables Loans and Receivables 1,621 1,615Other financial instrument receivables 101 111
Other marketable securities > 3 months Loans and Receivables 32 21Currency swaps Held for trading 12 49Other current financial asset Loans and Receivables 57 40
Financial instruments - Operational 188 90Held for trading Held for trading 160 76Derivative financial instruments designated in a cash flow hedgerelationship Cash flow hedges 28 14
Cash and cash equivalents Loans and Receivables 969 2,030Total assets - Financial Instruments 3,221 4,298
Non-current liabilities - Financial instruments 4,301 5,911Financial debts 4,087 5,628
Subordinated loans and bondsFinancial liabilities measured at amortized
cost 3,837 5,337
Other non current debtsFinancial liabilities measured at amortized
cost 200 240
Long-term finance lease obligationsFinancial lease liabilities measured at
amortized cost 50 51
Other liabilitiesFinancial liabilities measured at amortized
cost 214 282Current liabilities - Financial instruments 3,221 2,729Financial debts 1,338 891
Short-term financial debt (excluding finance lease obligations)Financial liabilities measured at amortized
cost 1,277 885Currency swaps Held for trading 59 4
Short-term finance lease obligationsFinancial liabilities measured at amortized
cost 2 2Trade payables 1,547 1,559Financial instruments - Operational 195 135
Held for trading Held for trading 160 90Derivative financial instruments designated in a cash flow hedgerelationship Cash flow hedges 35 45
Dividends payable 139 144Total liabilities - Financial Instruments 7,522 8,640
FINANCIAL STATEMENTS
194SOLVAY 2016 Annual Integrated Report

The following table gives an overview of the carrying amount of all financial instruments by class and by category as defined by IAS 39Financial Instruments: Recognition and Measurement.
2016 2015
In € millionCarryingamount Carrying amount
Fair value through profit or lossHeld for trading 172 369Derivative financial instruments designated in a cash flow hedge relationship 28 14Loans and receivables (including cash and cash equivalents, trade receivables, loans and other current/non-current assets except pension fund surpluses) 2,977 3,881Available for sale financial assets 44 34Total financial assets 3,221 4,298
Fair value through profit or lossHeld for trading (220) (90)Derivative financial instruments designated in a cash flow hedge relationship (35) (45)Financial liabilities measured at amortized cost (including long-term financial debt, other non-currentliabilities, short-term financial debt and trade liabilities) (7,075) (8,308)Dividends payable (139) (144)Finance lease obligations measured at amortized cost (52) (53)Total financial liabilities (7,521) (8,640)
The category “Held for trading” contains only derivative financialinstruments that are used for management of foreign currencyrisk, interest rate risk, energy and CO2 emission rights price risks,and Solvay share price risk, but which are not documented ashedging instruments. In 2015, they also include the Inovynderivative financial instrument (see detail in section F32.B).Available-for-sale financial assets pertain to Solvay’s NewBusiness Development (NBD) activity: the Group has built a
Corporate Venturing portfolio which is made up of directinvestments in start-up companies and of investments in venturecapital funds. The available-for-sale financial assets are measuredat fair value according to the valuation guidelines published bythe European Private Equity and Venture Capital Association.
F32.A. Overview of financial instruments
FINANCIAL STATEMENTS
SOLVAY 2016 Annual Integrated Report195

Quoted market prices are available for financial assets andfinancial liabilities with standard terms and conditions that aretraded on active markets. The fair values of derivative financialinstruments are equal to their quoted prices, if available. If suchquoted prices are not available, the fair value of the financialinstruments is determined based on a discounted cash flowanalysis using the applicable yield curve derived from quotedinterest rates matching maturities of the contracts for non-optional derivatives. Optional derivatives are measured at fair
value based on option pricing models, taking into account thepresent value of probability-weighted expected future payoffs,using market reference formulas.
Solvay’s right to an additional, performance-based paymentfollowing its exit from Inovyn qualified as a derivative financialinstrument. Its fair value amounted to € 244 million atDecember 31, 2015 and was largely based on level 3 inputs,namely REBITDA multiples, comparing the expected exit pricewith the fair value of Solvay’s 50% equity share held in Inovyn.
The fair values of other financial assets and financial liabilities(other than those described above) are determined inaccordance with generally accepted pricing models based ondiscounted cash flow analysis.
2016 2015In € million Carrying amount Fair value Carrying amount Fair value Fair value levelNon-current assets -Financial instruments 299 299 174 174Loans and other non-current assets (exceptpension fund surpluses) 299 299 174 174 2Non-current liabilities -Financial instruments (4,301) (4,504) (5,911) (6,005)Subordinated loans andbonds (3,837) (4,040) (5,337) (5,431) 1Other non current debts (200) (200) (240) (240) 2Other liabilities (214) (214) (282) (282) 2Long-term finance leaseobligations (50) (50) (51) (51) 2
The carrying amounts of current financial assets and liabilities areestimated to reasonably approximate their fair values, such inlight of short terms to maturity.
The table “Financial instruments measured at fair value in theconsolidated statement of financial position” provides an analysisof financial instruments that, subsequent to their initialrecognition, are measured at fair value, grouped in Levels 1 to3 based on the degree to which the fair value is observable.Financial instruments classified as held for trading and ashedging instruments in cash flow hedges are generally groupedin Levels 1 and 2. They are measured at fair value based onforward pricing and swap models using present value
calculations. The models incorporate various inputs includingforeign exchange spot and interests rates of the respectivecurrencies, currency basis spreads between the respectivecurrencies, interest rate curves, and forward rate curves of theunderlying commodity. The available-for-sale financial assets fallwithin Level 3 and are measured based on a discounted cashflow approach.
In accordance with the Group internal rules, the responsibilityfor measuring the fair value level resides with (a) the Treasurydepartment for the non-energy derivative financial instruments,and the financial liabilities, (b) Energy Services business unit forthe energy derivative financial instruments and (c) the Financedepartment for non-derivative financial assets.
F32.B. Fair value of financial instrumentsValuation techniques and assumptions usedfor measuring fair value
Accounting policy
Fair value of financial instruments measured at amortized cost
Financial instruments measured at fair valuein the consolidated statement of financial position
FINANCIAL STATEMENTS
196SOLVAY 2016 Annual Integrated Report

2016In € million Level 1 Level 2 Level 3 TotalHeld for trading 59 112 2 172
Foreign currency risk 14 14Energy risk 51 94 2 147CO2 risk 8 1 9Solvay share price 2 2
Cash flow hedges 1 26 28Foreign currency risk 11 11Energy risk 9 9CO2 risk 1 1Solvay share price 6 6
Available for sale financial assets 44 44New Business Development 44 44
Total (assets) 61 138 46 244Held for trading (49) (169) (1) (220)
Foreign currency risk (61) (61)Energy risk (47) (100) (1) (148)CO2 risk (3) (7) 0 (10)Cash flow hedges (4) (31) (35)
Foreign currency risk (26) (26)Interest rate risk (1) (1)Energy risk (3) (3)CO2 risk (4) (4)Solvay share price (1) (1)
Total (liabilities) (54) (200) (1) (255)
2015In € million Level 1 Level 2 Level 3 TotalHeld for trading 2 123 244 369
Foreign currency risk 49 49Energy risk 55 55CO2 risk 2 19 0 22INOVYN derivative financial instrument 244 244
Cash flow hedges 6 8 14Foreign currency risk 8 8Energy risk 1 1CO2 risk 6 6
Available for sale financial assets 34 34New Business Development 34 34
Total (assets) 8 131 278 417Held for trading (90) 0 (90)
Foreign currency risk (12) (12)Energy risk (46) (46)CO2 risk (28) 0 (28)
Solvay share price (4) (4)Cash flow hedges 0 (45) (45)Foreign currency risk (23) (23)Interest rate risk (1) (1)Energy risk (16) (16)Solvay share price (5) (5)
Total (liabilities) 0 (135) 0 (135)
Financial instruments measured at fair value in the consolidated statement of financial position
FINANCIAL STATEMENTS
SOLVAY 2016 Annual Integrated Report197

2016At fair value through
profit or loss Available-for-saleIn € million Derivatives Shares TotalOpening balance at 1 January 244 34 277Total gains or losses
Recognized in the income statement 1 1Recognized in other comprehensive income 10 10
Acquisitions 6 6Disposals (244) (6) (250)Closing balance at 31 December 1 44 45
2015At fair value through
profit or loss Available-for-saleIn € million Derivatives Shares TotalOpening balance at 1 January (1) 43 43Total gains or losses
Recognized in the income statement 0 (9) (9)Recognized in other comprehensive income 3 3
Acquisitions 244 4 248Disposals (8) (8)Closing balance at 31 December 244 34 277
Movements during the period
Reconciliation of level 3 fair value measurements of financial assets and liabilities
FINANCIAL STATEMENTS
198SOLVAY 2016 Annual Integrated Report
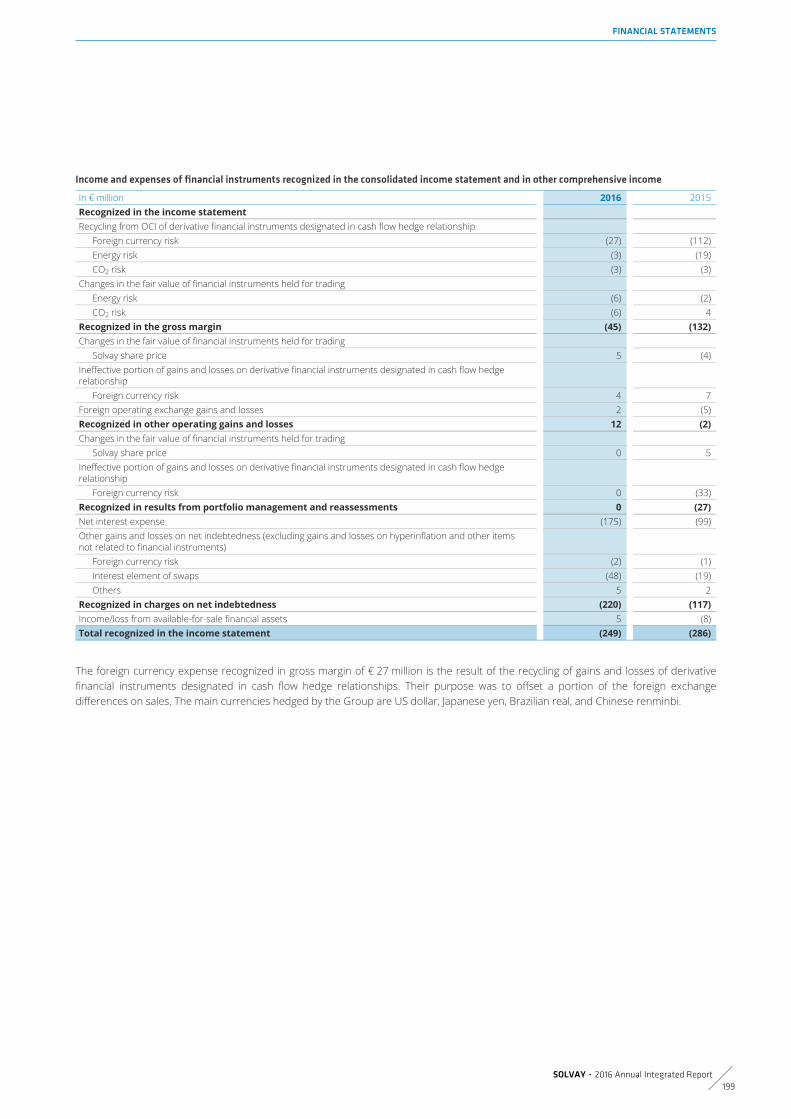
In € million 2016 2015Recognized in the income statementRecycling from OCI of derivative financial instruments designated in cash flow hedge relationship
Foreign currency risk (27) (112)Energy risk (3) (19)CO2 risk (3) (3)
Changes in the fair value of financial instruments held for tradingEnergy risk (6) (2)CO2 risk (6) 4
Recognized in the gross margin (45) (132)Changes in the fair value of financial instruments held for trading
Solvay share price 5 (4)Ineffective portion of gains and losses on derivative financial instruments designated in cash flow hedgerelationship
Foreign currency risk 4 7Foreign operating exchange gains and losses 2 (5)Recognized in other operating gains and losses 12 (2)Changes in the fair value of financial instruments held for trading
Solvay share price 0 5Ineffective portion of gains and losses on derivative financial instruments designated in cash flow hedgerelationship
Foreign currency risk 0 (33)Recognized in results from portfolio management and reassessments 0 (27)Net interest expense (175) (99)Other gains and losses on net indebtedness (excluding gains and losses on hyperinflation and other itemsnot related to financial instruments)
Foreign currency risk (2) (1)Interest element of swaps (48) (19)Others 5 2
Recognized in charges on net indebtedness (220) (117)Income/loss from available-for-sale financial assets 5 (8)Total recognized in the income statement (249) (286)
The foreign currency expense recognized in gross margin of € 27 million is the result of the recycling of gains and losses of derivativefinancial instruments designated in cash flow hedge relationships. Their purpose was to offset a portion of the foreign exchangedifferences on sales. The main currencies hedged by the Group are US dollar, Japanese yen, Brazilian real, and Chinese renminbi.
Income and expenses of financial instruments recognized in the consolidated income statement and in other comprehensive income
FINANCIAL STATEMENTS
SOLVAY 2016 Annual Integrated Report199

Income and expenses on financial instruments recognized in other comprehensive income include the following:
In € million 2016 2015Net change in the fair value of available-for-sale financial assets 9 2Total available-for-sale financial assets 9 2Recycling from OCI of derivative financial instruments designated in cash flow hedge relationship
Foreign currency risk 26 112Energy risk 3 19CO2 risk 3 3Interest rate risk 0 0
Basis adjustmentsForeign currency risk (77)
Effective portion of changes in fair value of cash flow hedgeForeign currency risk (15) (15)Energy risk 0 (19)CO2 risk 8 (3)Solvay share price 10 (5)
Total cash flow hedges 36 15Total 45 17
Conventionally, (+) indicates an increase and (-) a reduction in equity.
The recycling from OCI (foreign currency risk) of € 26 million isexplained above. In 2015, the amount of € (77) millionrepresented the designated portion of the derivative financialinstrument (intrinsic value) related to the acquisition of Cytec thathad been reclassified to goodwill at acquisition date as a basisadjustment.
See the policy in respect of capital in the Corporate governancestatement section of this report.
The Group is exposed to market risks from movements in foreignexchange rates, interest rates, and other market prices (energyprices, CO2 emission rights prices, and equity prices). Solvay usesderivative financial instruments to hedge clearly identified foreignexchange, interest rate, energy price, and CO2 emission rightsprice risks (hedging instruments). However, the required criteriato apply hedge accounting are not met in all cases.
Furthermore, the Group is exposed to liquidity risks and creditrisks.
The Group does not enter into or trade financial instruments(including derivative financial instruments) for speculativepurposes.
The Group’s foreign exchange risk hedging policy is basedessentially on the principles of financing its activities in localcurrency, systematically hedging transactional exchange risk (riskthat is certain) at the time of invoicing, as well as on monitoring
and hedging where appropriate exchange rate exposuresgenerated by the Group’s activities, based on expected cashflows. See Financial risk in the Management of risks section of thisreport for additional information on the foreign currency risksmanagement.
The Group undertakes transactions denominated in foreigncurrencies. Consequently, exposures to exchange ratefluctuations arise. Exchange rate exposures are managed withinapproved policy parameters utilizing forward foreign exchangecontracts or other derivatives like currency options.
In 2015, the currency risk of the Cytec acquisition was partiallyhedged.
The Group’s currency risk can be split into two categories:translation and transactional risk.
The translation exchange risk is the risk affecting the Group’sconsolidated financial statements relating to investees operatingin a currency other than the EUR (the Group’s presentationcurrency). The main other currencies are the US dollar, Chineserenminbi, Brazilian real and Japanese yen.
Exchange rate fluctuations, particularly of the US dollar, can affectearnings. In the course of 2016 the EUR/USD exchange ratemoved from 1.0887 at the start of January to 1.0538 at the endof December. In the course of 2015 the EUR/USD exchange ratemoved from 1.2141 at the start of January to 1.0887 at the endof December. During 2016 and 2015, the Solvay Group did nothedge the currency risk of foreign operations.
F32.C. Capital management
F32.D. Financial risk management
Foreign currency risks
Translation risk
FINANCIAL STATEMENTS
200SOLVAY 2016 Annual Integrated Report

The transactional risk is the exchange risk linked to a specifictransaction, such as a Group company buying or selling in acurrency other than its functional currency.
To the largest extent possible, the Group manages thetransactional risk on receivables and borrowings centrally; it ismanaged locally when centralization is not possible.
The choice of borrowing currency depends mainly on theopportunities offered by the various markets. This means thatthe selected currency is not necessarily that of the country inwhich the funds will be invested. Nonetheless, operating entitiesare financed essentially in their functional currencies, with thiscurrency being obtained, where appropriate, by currency swapsagainst the currency held by the financing company. The cost ofthese currency swaps is included in the cost of borrowings. Theyenable the Group to limit the exchange risk both in the financialcompany and in the company finally using the funds.
In emerging countries it is not always possible to borrow in localcurrency, either because funds are not available in local financialmarkets, or because the financial conditions are too onerous. Insuch a situation the Group has to borrow in a different currency.Nevertheless, the Group considers opportunities to refinance itsborrowings in emerging countries with local currency debt.
The Group uses derivatives to hedge identified foreign exchangerate risks. It documents those as hedging instruments unless ithedges a recognized financial asset or liability when generally nocash flow hedge relationship is documented.
At the end of 2016 for future exposure, the Group had mainlyhedged forecast sales (short position) in a nominal amount ofUS$ 680 million (€ 624 million) and JP¥ 15,545 million(€ 132 million), as well as the sale of its 58.77% stake in its Thaisubsidiary Vinythai PCL of CHF 297 million (€ 276 million). Most ofcash flow hedges that exist at the end of December 2016 will besettled within the next 12 months, and will mainly impact profit orloss during that period.
The transactional risk is managed on a day-to-day basis by eitherspot or forward contracts. Unless documented as hedginginstruments (see above), those forward contracts are classified asheld for trading.
In comparison with 2015, the trading position (mainly due tofinancing constraints) remains stable.
The following table details the forward exchange contractsoutstanding at the end of the period:
Notional amount(1) Fair value assets Fair value liabilitesIn € million 2016 2015 2016 2015 2016 2015Held for trading (1,179) (1,174) 14 49 (61) (12)Cash flow hedges (472) (683) 11 8 (26) (23)Total (1,651) (1,857) 25 57 (88) (34)
(1) Long/(short) positions.
Transactional risk Cash flow hedge
Held for trading
Notional amounts net(1)
FINANCIAL STATEMENTS
SOLVAY 2016 Annual Integrated Report201

The Group is not subject to material sensitivity to variations inexchange rates in profit or loss and equity.
Hedging aims to limit the fluctuation of the Group’s forecast grossmargin. Exchange rates variations could lead to changes in thevalue of financial instruments and adverse changes in future cashflows from planned transactions.
Group Treasury acts to mitigate the transactional risk at Grouplevel in order to avoid impact of foreign exchange ratesfluctuations on profit or loss.
See Financial risk in the Management of risks section of thisreport for additional information on the interest rate riskmanagement.
Interest rate risk is managed at Group level.
The Group is exposed to interest rate risk because entities inthe Group borrow funds at both fixed and floating interest rates.Interest rate risk is managed at Group level by maintaining anappropriate mix between fixed and floating rate borrowings.
Interest rate exposure by currency is summarized below:
In € million At December 31, 2016 At December 31, 2015Currency Fixed rate Floating rate Total Fixed rate Floating rate TotalFinancial debtEUR (1,857) (1,006) (2,863) (2,539) (1,461) (4,000)USD (2,227) (30) (2,257) (2,170) (74) (2,244)THB (34) (25) (59) (43) (61) (104)BRL (70) (4) (75) (20) (4) (24)CNY (104) (4) (109) (103) 0 (103)Other (14) (49) (63) (22) (23) (45)Total (4,307) (1,119) (5,426) (4,897) (1,623) (6,520)Cash and cash equivalentsEUR 180 180 1,083 1,083USD 476 476 455 455THB 14 14 99 99BRL 89 89 74 74CNY 39 39 40 40KRW 61 61 22 22JPY 35 35 21 21Other 75 75 236 236Total 969 969 2,030 2,030Other financial instrument receivablesEUR 55 55 29 29Other 45 45 83 83Total 101 101 111 111Total (4,307) (49) (4,356) (4,897) 518 (4,379)
At the end of 2016, around € 4.3 billion of the Group’s gross debtwas at a fixed rate, including mainly:
Interest rate risks
the EMTN bond issuance of € 500 million maturing in 2018(carrying amount € 496 million);
senior € notes for a total of € 1,250 million (carrying amount of€ 1,237 million);
senior US$ notes for a total of US$ 1,600 million (nominalamount of € 1,518 million, carrying amount of € 1,511 million);and
senior US$ notes assumed through the acquisition of Cytecof US$ 732 million (nominal amount of € 695 million, carryingamount € 675 million) with mainly three bonds maturing in2017, 2023 and 2025.
FINANCIAL STATEMENTS
202SOLVAY 2016 Annual Integrated Report

The floating rate debt (€ 1.1 billion) includes the € 1 billion seniornotes (carrying amount of € 998 million) maturing in 2017(Euribor plus 82 bps of margin).
The impact of interest rate volatility at the end of 2016 incomparison with 2015 is as follows:
Sensitivity to a +100 bp movement in EURmarket interest rates
Sensitivity to a (100) bp movement in EURmarket interest rates
In € million 2016 2015 2016 2015Profit or loss (10) (15) 10 15
The fair value of the interest rate swap of the MTP HP joint operation 50/50 between Dow and Solvay in Thailand, structured in 2012 forhedging purpose (notional amount € 42 million at the end of 2016 at 100%), is € (1) million (the same as in 2015), included in the netfinancial charges (only 50%, Solvay share).
Notional amount Fair value assets Fair value liabilitesIn € million 2016 2015 2016 2015 2016 2015Cash flow hedge 21 32 0 0 (1) (1)Total 21 32 0 0 (1) (1)
The Group purchases a large portion of its coal, gas, andelectricity needs in Europe and the United States, based onfluctuating liquid market indices. In order to reduce the costvolatility, the Group has developed a policy for exchangingvariable price for fixed price through derivative financialinstruments. Most of these hedging instruments can bedocumented as hedging instruments of the underlying purchasecontracts. Purchases of physical energy at fixed price contractsthat qualify as “own use” contracts (not derivatives) constitutea natural hedge, and are not included in this note. Similarly,the Group’s exposure to CO2 price is hedged partly by forwardpurchases of European Union Allowance (EUA), which either canbe documented as hedging instruments, or qualify as own usecontracts.
Finally some exposure to gas-electricity or coal-electricity spreadsmay arise from the production of electricity on Solvay sites(mostly from cogeneration units in Europe), which can be hedgedby forward purchases and forward sales or optional schemes. Inthis case, cash flow hedge accounting is applied.
Financial hedging of energy and CO2 emission rights price risksis managed centrally by Energy Services on behalf of the Groupentities.
Energy Services also carries out trading transactions with respectto energy and CO2, for which the residual price exposure ismaintained close to zero.
The following table details the notional principal amounts andfair values of energy and CO2 derivative financial instrumentsoutstanding at the end of the reporting period:
Notional amount Fair value assets Fair value liabilitesIn € million 2016 2015 2016 2015 2016 2015Held for trading 672 624 156 76 (158) (75)Cash flow hedge 110 73 11 6 (8) (16)Total 782 697 167 82 (166) (91)
Other market risks
Energy price risks
Energy Services
FINANCIAL STATEMENTS
SOLVAY 2016 Annual Integrated Report203

See Financial risk in the Management of risks section of thisreport for additional information on the credit risk management.
There is no significant concentration of credit risk at Group levelto the extent that the receivables risk is spread over a largenumber of customers and markets.
The ageing of trade receivables, financial instruments -operational, loans, and other non-current assets is as follows:
of which receivables without write-down
2016In € million Total
withwrite-down
Notpast due
less than30 days
past due
between30 & 60 days
past due
Between60 & 90 days
past due
more than90 days
past dueTrade receivables 1,621 61 1,454 82 11 4 9Financial instruments – operational 188 188Loans and other non-current assets 312 88 222 2Total 2,120 149 1,864 84 11 4 9
of which receivables without write-down
2015In € million Total
withwrite-down
Notpast due
less than30 days
past due
between30 & 60 days
past due
Between60 & 90 days
past due
more than90 days
past dueTrade receivables 1,615 102 1,389 95 13 2 14Financial instruments – operational 90 90Loans and other non-current assets 427 35 392 1Total 2,133 137 1,871 95 13 2 14
The table below presents the write-downs on trade receivables:
In € million 2016 2015Carrying amount at January 1 (75) (76)Additions (14) (14)Used 13 4Reversal of impairments 11 10Currency translation differences (4) 4Transfer to assets held for sale 12Other 5 (3)Carrying amount at December 31 (53) (75)
See Financial risk in the Management of risks section of thisreport for additional information on the liquidity riskmanagement.
Liquidity risk relates to Solvay’s ability to service and refinance itsdebt (including notes issued) and to fund its operations.
This depends on its ability to generate cash from operations andnot to over-pay for acquisitions.
The Finance Committee gives its opinion on the appropriateliquidity risk management for the Group’s short, medium andlong-term funding and liquidity management requirements.
Credit risk
Liquidity risk
FINANCIAL STATEMENTS
204SOLVAY 2016 Annual Integrated Report

The Group manages liquidity risk by maintaining adequatereserves, banking facilities, and reserve borrowing facilities, bycontinuously monitoring forecast and actual cash flows, and bymatching the maturity profiles of financial assets and liabilities.
The Group staggers the maturities of its financing sources overtime in order to limit the amounts to be refinanced each year.
The following tables detail the Group’s remaining contractualmaturity for its financial liabilities with contractual repaymentperiods.
The tables have been prepared using the discounted cash flowsof financial liabilities, based on the earliest date on which theGroup can be required to pay.
2016In € million Total within one year in year two in years three to five beyond five yearsOutflows of cash relatedto financial liabilities: 7,521
Other non-currentliabilities 214 214Current financial debt 1,338 1,338Trade liabilities 1,547 1,547Dividends payables 139 139Financial instruments –operational 195 195Non current financialdebt 4,087 521 976 2,590Total financial debt(current and noncurrent) 5,426 1,338 521 976 2,590
2015In € million Total within one year in year two in years three to five beyond five yearsOutflows of cash relatedto financial liabilities: 8,640
Other non-currentliabilities 282 282Current financial debt 891 891Trade liabilities 1,559 1,559Dividends payables 144 144Financial instruments –operational 135 135Non current financialdebt 5,628 1,101 1,334 3,193Total financial debt(current and noncurrent) 6,520 891 1,101 1,334 3,193
In addition to the above-mentioned financing sources, the Grouphas access to the following instruments:
a Belgian Treasury Bill program in an amount of € 1 billion,with no outstanding issues at the end of 2016 as against€ 324 million at the end of 2015, and alternatively a UScommercial paper program in an amount of US$ 500 million,unused at the end of 2016 and 2015. The two programs arecovered by back-up credit lines:
a € 1.5 billion and a € 550 million multilateral credit line,maturing respectively in 2021 and in 2018, as well as bilateralcredit lines (€ 350 million). They were all unused at the end of2016 and 2015.
FINANCIAL STATEMENTS
SOLVAY 2016 Annual Integrated Report205

The Group’s net indebtedness is the balance between its financial debts and other financial instruments receivables, and cash and cashequivalents.
In € million 2016 2015Financial debts 5,426 6,520
Other financial instrument receivables (101) (111)Cash and cash equivalents (969) (2,030)
Net indebtedness 4,356 4,379
Solvay’s ratings by two rating agencies are: BBB-/A3 (stable outlook) at Standard and Poors, and Baa2/P2 (negative outlook) at Moody’sfollowing the acquisition of Cytec.
In € million 2016 2015Non
Current Current TotalNon
Current Current TotalSubordinated loans 0 0 0 500 0 500Loans payables (incl Bonds) 3,837 1,087 4,924 4,837 308 5,145Finance lease obligations 50 2 52 51 2 53Currency swaps 0 59 59 0 4 4Other depts (including overdrafts) 200 190 390 240 578 818Total 4,088 1,338 5,426 5,629 891 6,520
Gross debt decreased from € 6,520 million at the end of 2015to € 5,426 million at the end of 2016 following the repaymentof the € 300 million loan to EIB, the € 500 million hybrid bond(first call repayment made on June 2, 2016) and no treasury notesoutstanding at the end of 2016 (as against € 324 million at theend of 2015).
The current portion of the loan payables includes mainly the€ 1 billion floating rate notes issued by Solvay SA in December2015 and the US$ 82 million senior notes issued by CytecIndustries, which will be repaid respectively in December and July2017.
2016 2015
In € million(except where indicated)
Nominalamount Coupon Maturity Secured
Amount atamortized
cost Fair value
Amount atamortized
cost Fair valueEuropean Investment Bank 300 3.90% 2016 No 0 0 300 312
Deeply subordinated € debt 500(1) 6.375%2016 (first
call) No 0 0 500 507
Floating rate € notes 1,000Euribor
3m+82 bps 2017 No 998 1,005 995 1,004Senior US$ note CytecIndustries Inc (US$ 82.2 m) 78 8.95% 2017 No 81 80 82 82EMTN € bond 500 4.625% 2018 No 496 535 493 551Senior US$ notes (144A;US$800 m) 759 3.40% 2020 No 756 774 731 730Senior € notes 750 1.625% 2022 No 742 786 741 751Senior US$ note CytecIndustries Inc (US$ 400 m) 380 3.5% 2023 No 362 369 347 347Senior US$ note CytecIndustries Inc (US$ 250 m) 237 3.95% 2025 No 233 232 224 224Senior US$ notes (144A;US$800 m) 759 4.45% 2025 No 755 785 730 730Senior € notes 500 2.75% 2027 No 495 559 494 505Total 4,916 5,126 5,637 5,743
(1) Solvay has exercised its option to redeem this bond, which was repaid at par on June 2, 2016.
NOTE F33Net indebtedness
Financial debt
Main borrowings and credit lines
FINANCIAL STATEMENTS
206SOLVAY 2016 Annual Integrated Report

There are no instances of default on the above-mentionedfinancial debts. There are no financial covenants, either onSolvay SA, or on any of the Group’s holding companies.
The total cash available, cumulating the “Other financialinstrument receivables” and “Cash and cash equivalents”,amounts to € 1,070 million at the end of 2016 as against€ 2,141 million at the end of 2015.
In 2015, the cash also includes the extra financing issued inDecember 2015 for the early refinancing of existing short-termand long-term financial debts maturing in 2016 (resulting in anincrease in cash and cash equivalents approximating to€ 900 million) as well as the cash of Cytec (€ 198 million).
As mentioned, Solvay used part of these available funds to repaythe € 300 million loan to EIB in January 2016 and the€ 500 million hybrid bond in June 2016, as well as the€ 324 million treasury notes outstanding at the end of 2015.
In € million 2016 2015Currency swaps 12 49Other marketable securities > 3 months 32 21Other current financial assets 57 41Other financial instrument receivables 101 111
The “Other financial instruments receivables” amount to € 101 million at the end of 2016 as against € 111 million at the end of 2015. Theyinclude currency swaps, other marketable securities > 3 months (Chinese bank drafts), and other current financial assets (mainly margincalls of Solvay Energy Services).
In € million 2016 2015Cash 773 1,214Term deposits 195 815Others 2 0Cash and cash equivalents 969 2,030
By their nature, the carrying amount of cash and cash equivalents is equal or very close to their fair values.
Other financial instrument receivables and cash and cashequivalents
Other financial instrument receivables
Cash and cash equivalents
FINANCIAL STATEMENTS
SOLVAY 2016 Annual Integrated Report207

In € million 2016 2015Wages and benefits debts 378 322VAT and other taxes 151 136Social security 67 87Financial instruments - operational 195 135M&A related liabilities 124 129Insurance premiums 12 11Advances from customers 29 23Other 130 179Other current liabilities 1,086 1,022
Solvay has set up compensation plans, including equity-settledand cash-settled share-based compensation plans.
In its equity-settled plans, the Group receives services asconsideration for its own equity instruments (namely through theissuance of share options). The fair value of services rendered byemployees in consideration of the granting of equity instrumentsrepresents an expense. This expense is recognized on a straight-line basis in the consolidated income statement over the vestingperiods relating to these equity instruments with the recognitionof a corresponding adjustment in equity. The fair value ofservices rendered is measured based on the fair value of theequity instruments on the grant date. It is not subsequentlyremeasured. At each reporting date, the Group re-estimates thenumber of share options likely to vest. The impact of the revisedestimates is recognized in profit or loss against a correspondingadjustment in equity.
In its cash-settled plans, the Group acquires services by incurringa liability to transfer to its employees rendering those servicesamounts that are based on the price (or value) of equityinstruments (including shares or share options) of the Group.The fair value of services rendered by employees inconsideration of the granting of share-based paymentsrepresents an expense. This expense is recognized on a straight-line basis in the consolidated income statement over the vestingperiods relating to these share-based payments with therecognition of a corresponding adjustment in liabilities. At eachreporting date, the Group re-estimates the number of options
likely to vest, with the impact of the revised estimates recognizedin profit or loss. The Group measures the services acquired andthe liability incurred at the fair value of the liability. Until theliability is settled, the Group remeasures the fair value of theliability at the end of each reporting period and at the date ofsettlement, with any changes in fair value recognized in profit orloss for the period.
In 2016, as in every year since 1999, the Board of Directorsrenewed the share option plan offered to executive staff (about70 persons) with a view to involving them more closely in thelong-term development of the Group. The plan is an equity-settled share-based plan. The majority of the managers involvedsubscribed the options offered them in 2016 at an adjustedexercise price of € 75.98, representing the average stock marketprice of the share in the 30 days prior to the offer. The three-year vesting period is followed by a five-year exercise period, atthe end of which any unexercised options expire. The settlementmethod is in equity.
In 2015, to compensate the dilution impact of the capitalincrease, an adjustment (based on the Euronext ratio of 0.93984)was made for each plan on the spot reference, on the exerciseprice, and on the number of options. Such is reflected in thetables below and did not impact the Group’s profit or loss.
At the end of December 2016, the Group held 2,650,810 treasuryshares, which have been deducted from consolidatedshareholders’ equity. At the end of 2015, the Group held2,105,905 treasury shares. Treasury shares are intended to coverthe share options offered to Group executives.
NOTE F34Other liabilities (current)
NOTE F35Share-based payments
Accounting policy
Stock Option Plan
FINANCIAL STATEMENTS
208SOLVAY 2016 Annual Integrated Report

Share options 2016 2015 2014 2013 2012 2011 2010 2009 2008 2007 2006 2005Number of shareoptions grantedand stilloutstanding atDecember 31, 2015 349,108 380,151 427,943 823,488 152,739 141,939 151,686 69,757 88,771 95,761 71,927Granted shareoptions 759,023Forfeitures of rightsand expiries (2,491) (11,192) (1,000) (1,500) (1,064) (2,660)Share optionsexercised (70,971) (12,254) (6,925) (16,290) (69,757) (3,405)Number of shareoptions atDecember 31, 2016 759,023 346,617 380,151 427,943 741,325 139,485 133,514 134,332 0 86,111 95,761 68,522Share optionsexercisable atDecember 31, 2016 0 0 0 0 741,325 139,485 133,514 134,332 0 86,111 95,761 68,522Exercise price (in €) 75.98 114.51 101.14 104.33 83.37 61.76 71.89 67.99 55.27 90.97 102.53 91.45Fair value ofoptions atmeasurement date(in €) 17.07 24.52 22.79 20.04 21.17 12.73 14.64 18.66 14.05 17.56 19.92 10.77
2016 2015Number of share
optionsWeighted average
exercise priceNumber of share
optionsWeighted average
exercise priceAt January 1 2,753,270 96.45 2,889,689 89.65Granted during the year 759,023 75.98 493,894 106.54Forfeitures of rights and expiries during theyear (19,907) 85.51 (66,273) 94.52Exercised during the year (179,602) 69.30 (564,040) 70.65At December 31 3,312,784 93.30 2,753,270 96.45Exercisable at December 31 1,399,050 772,580
The share options resulted in a charge in 2016 of € 10 millioncalculated by third parties according to the Black-Scholes modeland recognized in the consolidated income statement undercommercial and administrative costs.
The value of the option is based on:
the price of the underlying asset (Solvay share): € 80.75 atFebruary 24, 2016;
the time outstanding until the option maturity: exercisablefrom January 1, 2020 until February 24, 2024, taking intoaccount the fact that some of them will be exercised before theoption maturity;
the option exercise price: € 75.98;
the risk-free return: 0.27% (on average);
the volatility of the underlying yield, inferred from the optionprice: 30.90%; and
a dividend yield of 2.5%.
FINANCIAL STATEMENTS
SOLVAY 2016 Annual Integrated Report209

Weighted average remaining contractual life:
In years 2016 2015Share option plan 2005 2.0 3.0Share option plan 2006 3.0 4.0Share option plan 2007 4.0 5.0Share option plan 2008 0.0 1.0Share option plan 2009 0.9 1.9Share option plan 2010 2.0 3.0Share option plan 2011 3.0 4.0Share option plan 2012 3.1 4.1Share option plan 2013 4.2 5.2Share option plan 2014 5.2 6.2Share option plan 2015 6.2 7.2Share option plan 2016 7.2
Since 2013, the Board of Directors renewed a yearly PerformanceShare Unit Plan, offered to executive staff with the objective ofinvolving them more closely in the development of the Group,making this part of the long-term incentive policy. All themanagers involved subscribed the PSU offered them in 2016at an adjusted grant price of € 77.91. The Performance Share
Units Plan is a cash-settled share-based plan through whichbeneficiaries will obtain cash benefit based upon the Solvay shareprice, as well performance conditions.
Each plan has a three-year vesting period, after which a cashsettlement will take place, if vesting conditions are met.
Performance share units Plan 2016 Plan 2015Number of PSU 348,990 184,352Grant date 02/24/2016 03/25/2015Acquisition date 01/01/2019 01/01/2018Vesting period 03/31/2016 to 12/31/2018 03/31/2015 to 12/31/2017
50% of the initial granted PSU are subject to theUnderlying EBITDA YoY growth % over 3 years (2016,
2017, 2018)
50% of the initial granted PSU are subject to theUnderlying EBITDA YoY growth % over 3 years (2015,
2016, 2017)
Performance conditions50% of the initial granted PSU are subject to the YoY
CFROI % variation over 3 years (2016, 2017, 2018)50% of the initial granted PSU are subject to the YoY
CFROI % variation over 3 years (2015, 2016, 2017)Validation of performance conditions By the board of Directors By the board of Directors
In 2016 the impact of PSU on the consolidated income statement amounted to € 32 million, as against € 18 million in 2015.
In € million 2016 2015Commitments for the acquisition of tangible and intangible assets 70 104
Performance Share Units Plan (PSU)
Miscellaneous Notes
NOTE F36Commitments to acquire tangible and intangible assets
FINANCIAL STATEMENTS
210SOLVAY 2016 Annual Integrated Report

Contingent liabilities are not recognized in the consolidated financial statements, except if they arise from a business combination. Theyare disclosed unless the possibility of an outflow of economic benefits is remote.
In € million 2016 2015Liabilities and commitments of third parties guaranteed by the Company 792 881Environmental contingent liabilities 307 313Litigation and other major commitments 16 27
The liabilities and commitments of third parties guaranteed bythe Company relate mainly to guarantees given in the frameworkof:
Within the framework of the annual review of contingentliabilities, environmental contingent liabilitiestotaling € 307 million have been identified at December 31, 2016(€ 313 million at December 31, 2015).
The Board of Directors will propose to the General Shareholders’Meeting a gross dividend of € 3.45 per share.
Taking into account the dividend advance payment distributedin January 2017 of € 1.32 per share, the dividends proposed fordistribution, but not yet recognized as a distribution to equityholders, amount to € 226 million.
The associates and joint ventures not classified as held for sale/discontinued operations are consolidated by applying the equity methodof accounting.
2016 2015
In € million AssociatesJoint
ventures Total Associates Joint ventures TotalInvestments in associates and jointventures 24 473 497 41 357 398Earnings from associates and jointventures 2 83 85 2 19 21
The tables below present the summary of the statement of financial position and income statement of the material associates and jointventures as if they were proportionately consolidated.
NOTE F37Contingent liabilities
Accounting policy
RusVinyl, the joint venture with SIBUR for the construction andoperation of a PVC plant in Russia. A guarantee of € 152 millionat December 31, 2016 (€ 292 million at the end of 2015) hasbeen provided on a several basis by each sponsor, SolVin/Solvay and Sibur, for the benefit of the lenders and whichcorresponds for each to 50% of the amount in principal ofRusVinyl project finance plus interests and costs;
VAT payment (€ 295 million at December 31, 2016,€ 318 million at December 31, 2015).
NOTE F38Dividends proposed for distribution
NOTE F39Associates and joint ventures
FINANCIAL STATEMENTS
SOLVAY 2016 Annual Integrated Report211

In € million 2016 2015Statement of financial positionNon-current assets 25 67Current assets 37 35
Cash and cash equivalents 6 8Non-current liabilities 8 22
Non current financial debt 5 18Current liabilities 31 39
Current financial debt 6 16Investments in associates 24 41Income statementSales 93 90Depreciation and amortization (2) (4)Cost of borrowings 0 (1)Interest on lendings and short term deposits 0 0Income taxes (1) (1)Profit (loss) for the year from continuing operations 3 2Profit (loss) for the year from discontinued operations 0 0Profit (loss) for the year 3 2Other comprehensive income 0 (2)Total comprehensive income 3 0Dividend received 2 2
2016
In € millionRusVinyl
OOOPeroxidos do
Brasil Ltda
Solvay & CPCBarium
Strontium
ShandongHuatai
InteroxChemical Co.
Ltd
HindustanGum &
ChemicalsLtd Other
Ownership interest 50% 69.40% 75% 50% 50%
Operating SegmentFunctionalPolymers
PerformanceChemicals
AdvancedMaterials
PerformanceChemicals
AdvancedFormulations
Statement of financial positionNon-current assets 476 38 12 10 8 17Current assets 42 61 39 2 157 44
Cash and cash equivalents 11 36 5 0 147 8Non-current liabilities 252 7 12 – 1 11
Long-term financial debt 224 4 0 0 0 10Current liabilities 71 27 13 3 11 27
Short-term financial debt 47 8 0 0 0 15Investments in joint ventures 197 66 26 9 153 23Income statementSales 153 70 68 11 20 51Depreciation and amortization (22) (3) (1) (1) (1) (1)Reversal of impairment 19Cost of borrowings (23) 0 0 0 0 (1)Interest on lendings and short termdeposits 0 3 0 0 9 1Income taxes (12) (9) (2) 0 (3) (1)Profit (loss) for the year fromcontinuing operations 49 19 8 0 7 1Profit (loss) for the year fromdiscontinued operations 0 0 0 0 0 0Profit (loss) for the year 49 19 8 0 7 1Other comprehensive income 36 13 (2) 0 1 4Total comprehensive income 85 32 6 0 8 5Dividends received 0 11 6 1 1 1
Associates
Joint ventures
FINANCIAL STATEMENTS
212SOLVAY 2016 Annual Integrated Report

Other comprehensive income comprises mainly the currency translation differences.
2015
In € million RusVinyl OOOPeroxidos do
Brasil Ltda
Solvay & CPCBarium
Strontium
ShandongHuatai Interox
Chemical Co.Ltd
HindustanGum &
Chemicals Ltd OtherOwnership interest 50% 69.40% 75% 50% 50%
Operating SegmentFunctionalPolymers
PerformanceChemicals
AdvancedMaterials
PerformanceChemicals
AdvancedFormulations
Statement of financial positionNon-current assets 406 32 12 11 9 6Current assets 31 40 37 3 146 20
Cash and cash equivalents 7 21 6 1 135 3Non-current liabilities 275 6 10 1 1 1
Long-term financial debt 256 3 0 1 0 0Current liabilities 51 19 13 3 9 8
Short-term financial debt 35 5 1 0 0 1Investments in joint ventures 112 47 26 10 145 17Income statementSales 114 69 68 11 48 56Depreciation and amortization (24) (3) (1) (1) (1) (1)Reversal of impairment 19Cost of borrowings (28) (1) 0 0 0 0Interest on lendings and short termdeposits 0 2 0 0 7 0Income taxes 10 (7) (1) 0 (3) 0Profit (loss) for the year fromcontinuing operations (16) 16 7 3 8 1Profit (loss) for the year fromdiscontinued operations 0 0 0 0 0 0Profit (loss) for the year (16) 16 7 3 8 1Other comprehensive income (9) (9) (1) 0 7 (8)Total comprehensive income (25) 6 6 4 15 (7)Dividends received 0 7 3 0 2 0
Other comprehensive income comprises mainly the currency translation differences.
The list of joint operations is available in the note F44 List ofcompanies included in the consolidation scope.
NOTE F40Joint operations
Soda Ash & Derivatives operations/interests in Devnya(Bulgaria), 75% held by Solvay and comprising the followinglegal entities:
Deven AD;–Solvay Sodi AD; and–Solvay Sisecam Holding AG.–
Hydrogen Peroxide Propylene Oxide (HPPO) operations/interests in Zandvliet (Belgium), Map Ta Put (Thailand), and theHPPO plant that is being constructed in the Kingdom of SaudiArabia, all 50% held by Solvay and comprising the followinglegal entities:
BASF Interox H2O2 Production NV;–MTP HPJV C.V.;–MTP HPJV Management B.V.;–MTP HPJV (Thailand) Ltd.; and–Saudi Hydrogen Peroxide Co.–
Polyamides operations/interests in Butachimie (France), 50%held by Solvay.
Acetow operations/interests of 49.9% held by Solvay inWarmeverbundkraftwerk Freiburg (Germany), included inAcetow discontinued operations.
FINANCIAL STATEMENTS
SOLVAY 2016 Annual Integrated Report213

The following subsidiaries, other than those classified as held for sale have material non-controlling interests.
The amounts disclosed below are fully consolidated amounts and do not reflect the impacts from elimination of intragroup transactions.
2016In € million Zhejiang Lansol Solvay Special Chem Japan Solvay Soda AshNon controlling ownership interest 45% 33% 20%Statement of financial positionNon-current assets 22 20 349Current assets 15 29 83Non-current liabilities 0 1 13Current liabilities 9 11 25Income statementSales 35 74 357Profit (loss) for the year 4 9 174Other comprehensive income (1) 1 (5)Total comprehensive income 3 10 169Dividends paid to non controllinginterests 0 2 36Share of non controlling interest in theprofit (loss) for the year 2 3 35Accumulated non controlling interest 12 12 68
2015
In € million Zhejiang Lansol VinythaiSolvay Special Chem
JapanSolvay Biomas
Energy LLC Solvay Soda AshNon controlling ownershipinterest 45% 41% 33% 35% 20%Statement of financial positionNon-current assets 24 244 19 10 337Current assets 15 145 30 7 34Non-current liabilities 0 47 1 0 14Current liabilities 15 43 15 4 16Income statementSales 32 404 83 11 350Profit (loss) for the year 0 24 8 (12) 176Other comprehensiveincome 1 (18) 3 0 (15)Total comprehensiveincome 1 6 11 (12) 162Dividends paid to noncontrolling interests 0 1 3 0 34Share of non controllinginterest in the profit (loss)for the year 0 10 3 (4) 35Accumulated non controllinginterest 11 123 11 5 67
NOTE F41Non-controlling interests (continuing operations)
FINANCIAL STATEMENTS
214SOLVAY 2016 Annual Integrated Report

Balances and transactions between Solvay SA and its subsidiaries, related parties of Solvay SA, have been eliminated on consolidationand are not disclosed in this note. Details of transactions between the Group and other related parties are disclosed below.
Sale of goods Purchase of goodsIn € million 2016 2015 2016 2015Associates 7 16 4 8Joint ventures 71 164 46 78Other related parties 21 27 67 77Total 99 207 117 163
Amounts owed by related parties Amounts owed to related partiesIn € million 2016 2015 2016 2016Associates 2 0 3 0Joint ventures 3 36 2 21Other related parties 19 8 17 7Total 25 44 21 28
In € million 2016 2015Loans to associates 0 2Loans to joint ventures 0 2Loans to other related parties 5 1Total 5 4
Key management personnel comprise all members of the Boardof Directors and members of the Executive Committee.
Amounts due in respect of the year (compensation) andobligations existing at the end of the year:
In € million 2016 2015Wages, charges and short-term benefits 3 2Long-term benefits 11 10Cash-settled share-based payments liability 5 4Total 18 16
Expenses of the year:
In € million 2016 2015Wages, charges and short-term benefits 8 9Long-term benefits 1 1Share-based payments expenses 5 3Total 14 12
Excluding employer social charges and taxes
NOTE F42Related parties
Sale and purchase transactions
Loans to related parties
Compensation of key management personnel
FINANCIAL STATEMENTS
SOLVAY 2016 Annual Integrated Report215

Events after the reporting period which provide evidence ofconditions that existed at the end of the reporting period(adjusting events) are recognized in the consolidated financialstatements. Events indicative of conditions that arose after thereporting period are non-adjusting events and are disclosed inthe notes if material.
On February 22, 2017, Solvay completed the divestment of its58.77% stake in the Thai subsidiary Vinythai PCL to Japanesecompany AGC Asahi Glass, based on a total enterprise value of16.5 billion Thai Baht (€ 435 million).
The Group consists of Solvay SA and a total of 404 investees.
Of these 404 investees, 218 are fully consolidated, 10 areproportionately consolidated, and 20 are accounted for underthe equity method, whilst the other 201 do not meet the criteriaof significance.
Country Company CommentsBELGIUM Advanced Biochemical Europe, Bruxelles new company
EECO Holding SA, Bruxelles new companyEGYPT Solvay Alexandria Trading LLC., Alexandria meets the consolidation criteriaFRANCE Cogénération Belle Etoile SAS, Paris new company
Cogénération Tavaux SAS, Paris meets the consolidation criteriaITALY Cogeneration Spinetta S.p.a., Bollate new companyUNITED STATES CEM Defense Materials LLC, Tempe AZ new company
Country Company CommentsARGENTINA Solvay Indupa S.A.I.C., Bahia Blanca Sold to Unipar Carbocloro S.A.
Solalban Energia S.A., Bahia Blanca Sold to Unipar Carbocloro S.A.AUSTRALIA Solvay Chemicals Pty Ltd , Sydney Merged into Solvay Interox PtyBELGIUM Financière Solvay S.A., Bruxelles Merged into Solvay Participations Belgique S.A.BRAZIL Solvay Indupa do Brasil S.A., Sao Paulo Sold to Unipar Carbocloro S.A.
Rhodia Energy Brasil Ltda, Paulinia Sao Francisco Merged into Rhodia Poliamida e Especialidades Ltda
CHINASolvay High Performance Materials R&D (Shanghai) Co., Ltd. ,Shanghai Liquidated
FRANCE Rhodia Finance S.A.S. , Courbevoie Merged into Rhodia SAGERMANY Solvay Organics GmbH, Hannover Merged into Solvay GmbH
Girindus AG, Hannover Liquidated
EPIC Technologies GmbH, SchottenMerged into Solvay Specialty Polymers GermanyGmbH
ITALY Solvay Chimica Bussi S.p.A., Rosignano Sold to Caffaro Industries SpASolvay Bario e Derivati S.p.A., Massa Merged into Solvay Chimica Italia S.p.A.
IRELAND C.I.I. Luxembourg Sarl - Irish Branch, Dublin Merged into C.I.I. Luxembourg SarlRUSSIA Soligran ZAO, Moscow Aptekars Sold to Nickoplast
Poligran OAO, Tver Sold to NickoplastNAMIBIA Okorusu Holdings (Pty) Ltd, Windhoek Liquidated
Okorusu Fluorspar (Pty) Ltd, Otjiwarongo LiquidatedSINGAPORE Solvay Singapore Pte Ltd, Singapore LiquidatedSPAIN Solvay Ibérica S.L., Barcelona Merged into Solvay Quimica S.L.UNITED STATES Girindus America Inc., Cincinnati, OH Liquidated
D'Aircraft Products Inc., California Merged into Cytec Engineered Materials IncCytec Plastics LLC, New Jersey Merged into Cytec Industries IncCytec Acrylic Fibers Inc., New Jersey Merged into Cytec Industries IncBTH Quitman Hickory LLC, Quitman, Mississippi Sold to New Biomass Holding LLCAlcolac Inc., Cranbury Liquidated
NOTE F43Events after the reporting period
Accounting policy
NOTE F44List of companies included in the consolidationscope
List of companies entering or leaving the Group
Companies entering the Group
Companies leaving the Group
FINANCIAL STATEMENTS
216SOLVAY 2016 Annual Integrated Report

Indicating the percentage holding
The percentage of voting rights is very close to the percentage holding.
ARGENTINASolvay Argentina SA, Buenos Aires 100Solvay Quimica SA, Buenos Aires 100AUSTRALIACytec Asia Pacific Holdings Pty Ltd, Baulkham Hills 100Cytec Australia Holdings Pty Ltd, Baulkham Hills 100Solvay Interox Pty Ltd, Banksmeadow 100AUSTRIASolvay Österreich GmbH, Wien 100BELGIUMAdvanced Biochemical Europe, Bruxelles 58.8Carrières les Petons S.P.R.L., Walcourt 100Cytec Belgium bvba, Diegem 100Solvay Chemicals International S.A., Brussels 100Solvay Chimie S.A., Brussels 100Solvay Coordination Internationale des Crédits Commerciaux S.A., Brussels 100Solvay Energy S.A., Brussels 100Solvay Participations Belgique S.A., Brussels 100Solvay Pharmaceuticals S.A. - Management Services, Brussels 100Solvay Specialty Polymers Belgium SA / NV 100Solvay Stock Option Management S.P.R.L., Brussels 100BRAZILCogeracao de Energia Electricica Paraiso SA, Brotas 100Cytec Comercio de Materiais Compostos E Produtos Quimicos do Brasil Ltda, Sao Paulo 100Rhodia Brazil Ltda, Sao Paolo 100Rhodia Poliamida Brasil Ltda , Sao Paolo 100Rhodia Poliamida e Especialidades Ltda, Sao Paolo 100Rhopart-Participacoes Servidos e Comercio Ltda, Sao Paolo 100BULGARIASolvay Bulgaria EAD, Devnya 100CANADACytec Canada Inc, Niagara Falls Welland 100Solvay Canada Inc, Toronto 100CAYMAN ISLANDSBlair International Insurance (Cayman) Ltd, Georgetown 100CHINABaotou Solvay Rare Earths Company Ltd, Baotou 55Beijing Rhodia Eastern Chemical Co., Ltd , Beijing 60Cytec Industries Co. Ltd, Shanghai 100Cytec Engineered Materials Co. Ltd, Shanghai 100Liyang Solvay Rare Earth New Material Co., Ltd, Liyang City 96.3Rhodia Hong Kong Ltd , Hong Kong 100Solvay (Beijing) Energy Technology Co., Ltd , Beijing 100Solvay (Shanghai) Engineering Plastics Co., Ltd 100Solvay (Shanghai) International Trading Co., Ltd, Shanghai 100Solvay (Shanghai) Ltd, Shanghai 100Solvay (Zhangjiagang) Specialty Chemicals Co. Ltd, Suzhou 100Solvay (Zhenjiang) Chemicals Co., Ltd, Zhenjiang New area 100Solvay Biochemical (Taixing) Co. Ltd, Shanghai 58.7Solvay Chemicals (Shanghai) Co. Ltd, Shanghai 100Solvay China Co., Ltd , Shanghai 100Solvay Fine Chemical Additives (Qingdao) Co., Ltd, Qingdao 100Solvay Hengchang (Zhangjiagang) Specialty Chemical Co., Ltd, Zhangjiagang City 70Solvay Silica Qingdao Co., Ltd , Qingdao 100
List of subsidiaries
FINANCIAL STATEMENTS
SOLVAY 2016 Annual Integrated Report217

Solvay Speciality Polymers (Changshu) Co. Ltd, Changshu 100Suzhou Interox Sem Co. Ltd, Suzhou 100Zhejiang Lansol Fluorchem Co., Ltd, Zhejiang 55Zhuhai Solvay Specialty Chemicals Co Ltd, Zhuhai City 100CHILECytec Chile Ltda, Santiago 100EGYPTSolvay Alexandria Sodium Carbonate Co, Alexandria 100Solvay Alexandria Trading LLC., Alexandria 100FINLANDSolvay Chemicals Finland Oy, Voikkaa 100FRANCECogénération Chalampe S.A.S., Puteaux 100Cogénération Tavaux SAS, Paris 33.3Cytec Process Materials Sarl, Toulouse 100RHOD V S.N.C. , Courbevoie 100RHOD W S.N.C. , Courbevoie 100Rhodia Chimie S.A.S. , Aubervilliers 100Rhodia Energy GHG S.A.S. , Puteaux 100Rhodia Laboratoire du Futur S.A.S. , Pessac 100Rhodia Operations S.A.S. , Aubervilliers 100Rhodia Participations S.N.C. , Courbevoie 100Rhodia S.A. , Courbevoie 100Rhodianyl S.A.S. , Saint-Fons 100Solvay - Opérations - France S.A.S., Paris 100Solvay - Fluorés - France S.A.S., Paris 100Solvay Energie France S.A.S., Paris 100Solvay Energy Services S.A.S. , Puteaux 100Solvay Finance France S.A., Paris 100Solvay Finance S.A., Paris 100Solvay Participations France S.A., Paris 100Solvay Speciality Polymers France S.A.S., Paris 100Solvay Tavaux S.A.S. 100Solvin France S.A., Paris 100GERMANYCavity GmbH, Hannover 100Cytec Engineered Materials GmbH, Oestringen 100Horizon Immobilien AG, Hannover 100Salzgewinnungsgesellschaft Westfalen GmbH & Co KG, Hannover 65
German limited partnership, which makes use of the exemptions offered by Section 264(b) of the German Commercial Code, not to publishtheir annual financial statements.
Solvay Acetow GmbH , Freiburg 100Solvay Chemicals GmbH, Hannover 100Solvay Fluor GmbH, Hannover 100Solvay Flux GmbH, Hannover 100Solvay GmbH, Hannover 100Solvay Infra Bad Hoenningen GmbH, Hannover 100Solvay P&S GmbH, Freiburg 100Solvay Specialty Polymers Germany GmbH, Hannover 100Solvin GmbH & Co. KG - PVDC, Rheinberg 100Solvin Holding GmbH, Hannover 100INDIACytec India Specialty Chemicals & Materials Private Ltd, Nagpur 100Rhodia Polymers & Specialties India Private Limited, Mumbai 100Rhodia Specialty Chemicals India Limited, Mumbai 99Solvay Specialities India Private Limited, Mumbai 100Sunshield Chemicals Limited, Mumbai 62.4IRELANDSolvay Finance Ireland Unlimited , Dublin 100
FINANCIAL STATEMENTS
218SOLVAY 2016 Annual Integrated Report

INDONESIAPT. Cytec Indonesia, Jakarta 100ITALYCytec Process Materials S.r.l., Mondovi 100Solvay Chimica Italia S.p.A., Milano 100Solvay Energy Services Italia S.r.l., Bollate 100Solvay Solutions Italia S.p.A. , Milano 100Solvay Specialty Polymers Italy S.p.A., Milano 100JAPANCytec Industries Japan LLC, Tokyo 100Nippon Solvay KK, Tokyo 100Solvay Japan K.K., Tokyo 100Solvay Nicca Ltd, Tokyo 60Solvay Special Chem Japan Ltd, Anan City 67Solvay Specialty Polymers Japan KK, Minato Ku-Tokyo 100LATVIASolvay Business Services Latvia SIA, Riga 100LUXEMBOURGC.I.I. Luxembourg Sarl, Strassen 100Cytec Luxembourg International Holdings Sarl, Strassen 100Solvay Chlorovinyls Holding S.a.r.l., Luxembourg 100Solvay Finance (Luxembourg) SA, Luxembourg 100Solvay Hortensia S.A., Luxembourg 100Solvay Luxembourg S.a.r.l., Luxembourg 100MEXICOCytec de Mexico S.A. de C.V., Jalisco 100Solvay Fluor Mexico S.A. de C.V., Ciudad Juarez 100Solvay Mexicana S. de R.L. de C.V., Monterrey 100NETHERLANDSCytec Industries B.V., Vlaardingen 100Cytec Industries Europe C.V., Vlaardingen 100Cytec Netherlands Holdings B.V., Vlaardingen 100Onecarbon International B.V., Utrecht 100Rhodia International Holdings B.V., Den Haag 100Solvay Chemicals and Plastics Holding B.V., Linne-Herten 100Solvay Chemie B.V., Linne-Herten 100Solvay Solutions Nederland B.V., Klundert 100Solvin Holding Nederland B.V., Linne-Herten 100NEW ZEALANDSolvay New Zealand Ltd, Auckland 100PERUCytec Peru S.A.C., Lima 100POLANDSolvay Engineering Plastics Poland Sp z.o.o. , Gorzow Wielkopolski 100Solvay Advanced Silicas Poland Sp. z o.o. 100PORTUGALSolvay Business Services Portugal Unipessoal Lda, Carnaxide 100Solvay Portugal - Produtos Quimicos S.A., Povoa 100RUSSIASolvay Vostok OOO, Moscow 100Sertow OOO, Serpukhov Khimi 100SINGAPORECytec Industries PTE Ltd, Singapore 100Rhodia Amines Chemicals Pte Ltd , Singapore 100Solvay Fluor Holding (Asia-Pacific) Pte. Ltd., Singapore 100Solvay Specialty Chemicals Asia Pacific Pte. Ltd., Singapore 100Vinythai Holding Pte Ltd., Singapore 58.8SOUTH KOREACytec Korea Inc, Seoul 100Daehan Solvay Special Chemicals Co., Ltd, Seoul 100
FINANCIAL STATEMENTS
SOLVAY 2016 Annual Integrated Report219

Solvay Chemicals Korea Co. Ltd , Seoul 100Solvay Energy Services Korea Co. Ltd , Seoul 100Solvay Korea Co. Ltd, Seoul 100Solvay Silica Korea Co. Ltd , Incheon 100Solvay Specialty Polymers Korea Company Ltd, Seoul 100SPAINSolvay Energy Services Iberica, S.L., Madrid 100Solvay Quimica S.L., Barcelona 100Solvay Solutions Espana S.L. , Madrid 100SWITZERLANDSolvay (Schweiz) AG, Bad Zurzach 100Solvay Vinyls Holding AG, Bad Zurzach 100THAILANDAdvanced Biochemical (Thailand) Company Ltd, Bangkok 58.8Cytec Specialty Chem (Thailand) Ltd, Bangkok 100Solvay (Bangpoo) Specialty Chemicals Ltd, Bangkok 100Solvay Asia Pacific Company Ltd, Bangkok 100Solvay Peroxythai Ltd, Bangkok 100Vinythai Public Company Ltd, Bangkok 58.8UNITED KINGDOMAdvanced Composites Group Holdings Ltd, Heanor 100Advanced Composites Group Investments Ltd, Heanor 100Cytec Engineered Materials Ltd, Wrexham 100Cytec Industrial Materials (Derby) Ltd, Heanor 100Cytec Industrial Materials (Manchester) Ltd, Heanor 100Cytec Industries UK Holdings Ltd, Wrexham 100Cytec Industries UK Ltd, Wrexham 100Cytec Med-Lab Ltd, Heanor 100Cytec Process Materials (Keighley) Ltd, Keighley 100Holmes Chapel Trading Ltd , Watford 100McIntyre Group Ltd , Watford 100Med-Lab International Ltd, Heanor 100Rhodia Holdings Ltd , Watford 100Rhodia International Holdings Ltd , Oldbury 100Rhodia Limited , Watford 100Rhodia Organique Fine Ltd , Watford 100Rhodia Overseas Ltd , Watford 100Rhodia Pharma Solutions Holdings Ltd, Cramlington 100Rhodia Pharma Solutions Ltd, Cramlington 100Rhodia Reorganisation, Watford 100Solvay Chemicals Ltd, Warrington 100Solvay Interox Ltd, Warrington 100Solvay Solutions UK Ltd, Watford 100Solvay UK Holding Company Ltd, Warrington 100Umeco Composites Ltd, Heanor 100Umeco Ltd, Heanor 100UNITED STATESAusimont Industries, Inc., Wilmington, DE 100CEM Defense Materials LLC, Tempe AZ 100Cytec Aerospace Materials (ca) Inc., New Jersey 100Cytec Carbon Fibers LLC, New Jersey 100Cytec Engineered Materials Inc., Arizona 100Cytec Global Holdings Inc., New Jersey 100Cytec Industrial Materials (ok) Inc., New Jersey 100Cytec Industries Inc, New Jersey 100Cytec Korea Inc., New Jersey 100Cytec Olean Inc., New Jersey 100Cytec Overseas Corp., New Jersey 100Cytec Process Materials (ca) Inc., New Jersey 100Cytec Technology Corp., New Jersey 100
FINANCIAL STATEMENTS
220SOLVAY 2016 Annual Integrated Report
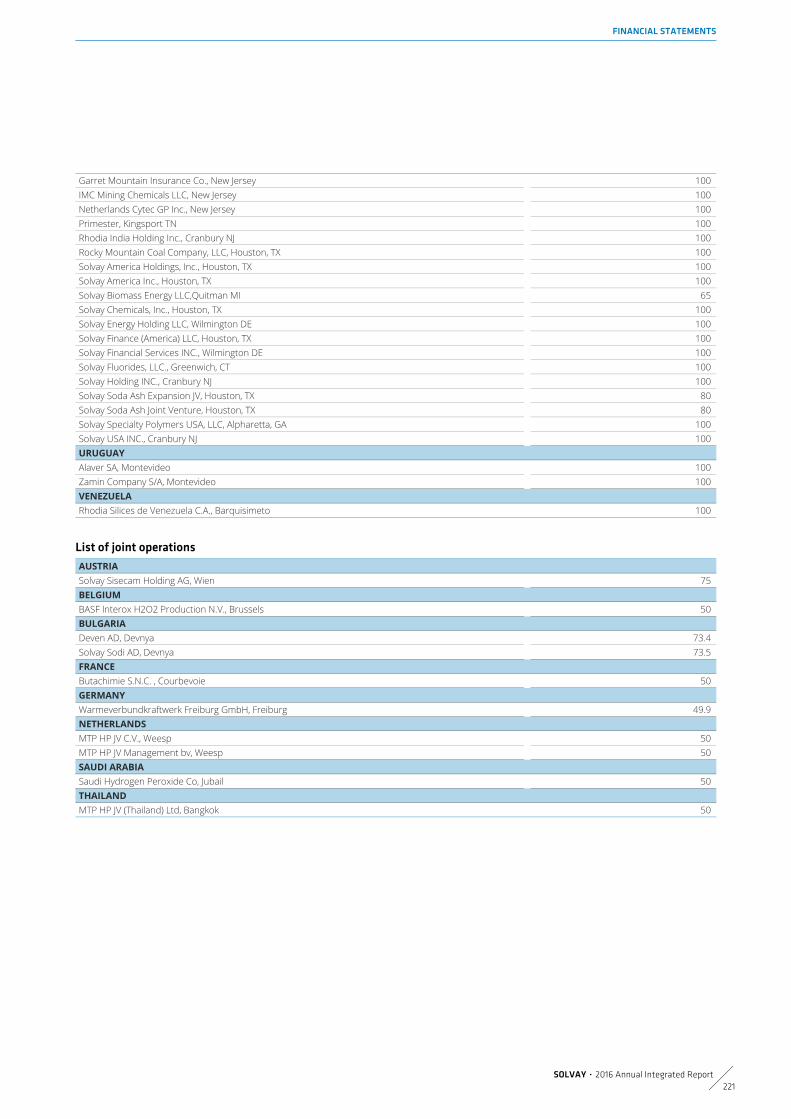
Garret Mountain Insurance Co., New Jersey 100IMC Mining Chemicals LLC, New Jersey 100Netherlands Cytec GP Inc., New Jersey 100Primester, Kingsport TN 100Rhodia India Holding Inc., Cranbury NJ 100Rocky Mountain Coal Company, LLC, Houston, TX 100Solvay America Holdings, Inc., Houston, TX 100Solvay America Inc., Houston, TX 100Solvay Biomass Energy LLC,Quitman MI 65Solvay Chemicals, Inc., Houston, TX 100Solvay Energy Holding LLC, Wilmington DE 100Solvay Finance (America) LLC, Houston, TX 100Solvay Financial Services INC., Wilmington DE 100Solvay Fluorides, LLC., Greenwich, CT 100Solvay Holding INC., Cranbury NJ 100Solvay Soda Ash Expansion JV, Houston, TX 80Solvay Soda Ash Joint Venture, Houston, TX 80Solvay Specialty Polymers USA, LLC, Alpharetta, GA 100Solvay USA INC., Cranbury NJ 100URUGUAYAlaver SA, Montevideo 100Zamin Company S/A, Montevideo 100VENEZUELARhodia Silices de Venezuela C.A., Barquisimeto 100
AUSTRIASolvay Sisecam Holding AG, Wien 75BELGIUMBASF Interox H2O2 Production N.V., Brussels 50BULGARIADeven AD, Devnya 73.4Solvay Sodi AD, Devnya 73.5FRANCEButachimie S.N.C. , Courbevoie 50GERMANYWarmeverbundkraftwerk Freiburg GmbH, Freiburg 49.9NETHERLANDSMTP HP JV C.V., Weesp 50MTP HP JV Management bv, Weesp 50SAUDI ARABIASaudi Hydrogen Peroxide Co, Jubail 50THAILANDMTP HP JV (Thailand) Ltd, Bangkok 50
List of joint operations
FINANCIAL STATEMENTS
SOLVAY 2016 Annual Integrated Report221

BELGIUMEECO Holding SA, Bruxelles 33.3BRAZILDacarto Benvic SA, Santo André 50Peroxidos do Brasil Ltda, Sao Paulo 69.4CHINAShandong Huatai Interox Chemical Co. Ltd, Dongying 50FRANCECogénération Belle Etoile SAS, Paris 33.3GERMANYSolvay & CPC Barium Strontium GmbH & Co KG, Hannover 75Solvay & CPC Barium Strontium International GmbH, Hannover 75INDIAHindustan Gum & Chemicals Ltd, New Delhi 50ITALYCogeneration Spinetta S.p.a. , Bollate 33.3MEXICOSolvay & CPC Barium Strontium Monterrey S. de R.L. de C.V., Monterrey 75Solvay & CPC Barium Strontium Reynosa S. de R.L. de C.V., Reynosa 75RUSSIARusvinyl OOO, Moscow 50VIETNAMRhodia Nuoc Trong Biogas LLC, Ho Chi Minh City 75
CHINAQingdao Hiwin Solvay Chemicals Co. Ltd , Qingdao 30FRANCEGIE Chime Salindres , Salindres 50Gie Osiris, Roussillon 34.8INDONESIASolvay Manyar P.T. , Gresik 50MEXICOSilicatos y Derivados S.A. DE C.V. 20POLANDZaklad Energoeloctryczny Energo-Stil Sp. z o.o., Gorzow Wielkopolski 25UNITED KINGDOMPenso Holdings Ltd, , Coventry 20
List of companies consolidated by applying the equity method of accountingJoint ventures
Associates
FINANCIAL STATEMENTS
222SOLVAY 2016 Annual Integrated Report

The annual financial statements of Solvay SA are presented insummary format below. In accordance with the BelgianCompanies Code, the annual financial statements of Solvay SA,the management report, and the statutory auditor’s report will befiled with the National Bank of Belgium.
These documents are also available free of charge on the internetor upon request from:
Solvay SArue de Ransbeek 310B – 1120 Brussels
The balance sheet of Solvay SA for the year 2016 presentedbelow is based on a dividend of € 3.45 per share.
Solvay SA is a société anonyme created under Belgian law, withits registered office at rue de Ransbeek 310 at 1120 Brussels.Solvay SA has two subsidiaries: Solvay SA France (25, rue deClichy, 75009 Paris, France) and Solvay SA Italie (Via Piave 6,57013 Rosignano, Italy).
The accounts of Solvay SA are prepared in accordance withBelgian generally accepted accounting principles, and include itsFrench and Italian subsidiaries.
The main activities of Solvay SA consist of holding and managinga number of participations in Group companies and of financingthe Group from the bank and bond markets. It also managesthe research center at Neder-Over-Heembeek (Belgium) and avery limited number of industrial and commercial activities notundertaken through subsidiaries.
The profit for the year before taxes amounted to € 400 millionin 2016, compared with € 1,775 million in the previous year.It includes the operating result amounting to € (119) million,compared with € 75 million in 2015, dividends received fromits various participations amounting to € 467 million, comparedwith € 96 million in 2015, and the differential between interestpaid and received on its financing activities amounting to € (153)million, compared with an amount of € (189) million in 2015.The balance of non-recurring results for 2016 is € 190 million,compared with € 1,754 million in 2015. The higher amount in2015 was due to an exceptional gain on sale of a participation.
The profit for the year of Solvay SA amounted in 2016 to € 404million, compared with € 1,774 million in 2015.
In the absence of transfers to untaxed reserves, carried forwardnet income of € 6,321 million is available for distribution.
SUMMARY OF FINANCIALSTATEMENTS OF SOLVAY SA
3.
FINANCIAL STATEMENTS
SOLVAY 2016 Annual Integrated Report223

In € million 2016 2015ASSETSFixed assets 18,255 15,974Start-up expenses and intangible assets 94 128Tangible assets 51 57Financial assets 18,110 15,789Current assets 1,234 3,742Inventories 4 3Trade receivables 181 219Other receivables 103 110Short-term investments and cash equivalents 924 3,396Accruals 22 15Total assets 19,489 19,716SHAREHOLDERS' EQUITY AND LIABILITIESShareholders' equity 10,726 10,688Capital 1,588 1,588Issue premiums 1,200 1,200Reserves 1,982 1,982Net income carried forward 5,955 5,917Provisions and deferred taxes 369 331Financial debt 7,662 8,040
due in more than one year 4,252 5,251due within one year 3,410 2,789
Trade liabilities 179 143Other liabilities 477 429Accruals and deferred income 76 86Total shareholders' equity and liabilities 19,489 19,716
In € million 2016 2015Operating income 794 1,045
Sales 11 126Other operating income 784 919
Operating expenses (913) (970)Operating profit/loss (119) 75Financial gains/losses 519 1,680Profit for the year before taxes 400 1,755Income taxes 4 19Profit for the year 404 1,774Transfer to (-) / from (+) untaxed reserves 0 0Profit available for distribution 404 1,774
In € million FY 2016 FY 2015Profit for the year available for distribution 404 1,774
Carried forward 5,917 4,524Total available to the General Shareholders’ Meeting 6,321 6,298Appropriation
Legal reserve – 32Gross dividend 366 349Carried forward 5,955 5,917
Total 6,321 6,298
Balance sheet of Solvay SA (summary)
Income statement of Solvay SA (summary)
Profit available for distribution
FINANCIAL STATEMENTS
224SOLVAY 2016 Annual Integrated Report

ASSURANCE REPORT OF THE STATUTORYAUDITOR ON A SELECTION OF SOCIAL,ENVIRONMENTAL AND OTHER SUSTAINABLEDEVELOPMENT INFORMATION FOR THE YEARENDED 31 DECEMBER 2016 226
STATUTORY AUDITOR'S REPORT TO THESHAREHOLDERS’ MEETING ON THECONSOLIDATED FINANCIAL STATEMENTS FORTHE YEAR ENDED 31 DECEMBER 2016 229
DECLARATION BY THE PERSONS RESPONSIBLE 231
Management Report
Corporate governance statement 33
Risk management 57
Business review 72
Extra-financial statements 96
Financial statements 130
DECLARATIONS: AUDITOR’SREPORTS & DECLARATION BY THEPERSONS RESPONSIBLE
SOLVAY 2016 Annual Integrated Report225
Pursuant to your request and in our capacity of Statutory Auditor of Solvay SA / NV, we hereby present you our assurance report ona selection of social, environmental and other sustainable development information disclosed in section “Extra-financial statements” ofSolvay Group Annual Integrated Report for the year ended 31 December 2016 (the “2016 Annual Integrated Report”), identified by thesymbol and .
This selection of information (the “Information”) extracted from the 2016 Annual Integrated Report has been prepared under theresponsibility of Solvay Group management, in accordance with internal measurement and reporting principles used by Solvay Group(the "Reporting Framework"). The Reporting Framework consists of specific definitions and assumptions that are summarized in section“Extra-financial statements” of the 2016 Annual Integrated Report.
It is our responsibility, based on the procedures performed by us, to express:
The complete list of Information in scope of our assurance engagement together with the type of assurance has been included inappendix A of this report.
We conducted our procedures in accordance with the international standard as defined in ISAE (International Standard on AssuranceEngagements) 3000 (Revised)(1). With respect to independence rules, these are defined by the respective legal and regulatory texts as wellas by the professional Code of Ethics, issued by the International Federation of Accountants (“IFAC”).
We have carried out the following procedures
ASSURANCE REPORT OF THE STATUTORY AUDITOR ON A SELECTION OF SOCIAL,ENVIRONMENTAL AND OTHER SUSTAINABLE DEVELOPMENT INFORMATION FOR THE YEARENDED 31 DECEMBER 2016
Responsibility of the Company
Responsibility of the Statutory Auditor
“Limited assurance” for the Information identified by the symbol as included in the 2016 Annual Integrated Report
“Reasonable assurance” for the Information identified by the symbol as included in the 2016 Annual Integrated Report
Nature and scope of procedures
General procedures:
We assessed the appropriateness of the Reporting Framework with respect to its relevance, completeness, neutrality, clarity andreliability, by taking into consideration, when relevant, the sector reporting practices.
–
We have verified the set-up within Solvay Group of the process to obtain, consolidate and check the selected Information with regardto its completeness and consistency. We have familiarized ourselves with the internal control and risk management proceduresrelating to the compilation of the information. We have conducted interviews with individuals responsible for social, environmentaland other sustainable development reporting.
–
At the sites that we have selected(2) based on their activity, their contribution to consolidated indicators, their location and a riskanalysis, we have:
Conducted interviews to verify the proper application of procedures and obtained information to perform our verifications;Conducted substantive tests, using sampling techniques, to verify the calculations performed and reconcile data with supportingevidence.
–
(1) ISAE 3000 (Revised) – Assurance engagements other than audits or reviews of historical information(2) Sites audited for indicators under limited assurance: Map Ta Phut (VNT), Dombasle, Bad Wimpfen, Chalampé Rhodia, Spinetta-Marengo, Marietta – Ohio,
Santo-Andre – Rhodia, Greenriver, Panoli (Solvay), Torrelavega.Additional sites audited for indicators under reasonable assurance only: Devnya (SODI & DEVEN), Santo-Andre – Indupa, Freiburg, Rheinberg, Neder-over-Heembeek, Shanghai, Bahia Blanca
DECLARATIONS: AUDITOR’S REPORTS & DECLARATION BY THE PERSONS RESPONSIBLE
226SOLVAY 2016 Annual Integrated Report

On the basis of the procedures performed by us, nothing came to our attention that causes us to believe that the Information identifiedby the symbol as included in the 2016 Annual Integrated Report, is not prepared, in all material respects, in accordance with theReporting Framework.
In our opinion, based on the procedures performed, the Information identified by the symbol as included in the 2016 AnnualIntegrated Report, has been prepared in all material respects in accordance with the Reporting Framework.
Zaventem, 30 March 2017
The statutory auditorDELOITTE Bedrijfsrevisoren / Reviseurs d’EntreprisesBV o.v.v.e. CVBA / SC s.f.d. SCRLRepresented by Michel Denayer
“Limited assurance” for the Information identified by the symbol as included in the 2016 Annual Integrated Report
For the entity in charge of their consolidation, as well as for the controlled entities, we have designed analytical procedures andverified, using sampling techniques, the calculations as well as the consolidation of this information in order to obtain limitedassurance that the selected information does not contain any material errors that would question its preparation, in all materialrespects, in accordance with the Reporting Framework. A higher level of assurance would have required more extensive procedures.
–
“Reasonable assurance” for the Information identified by the symbol as included in the 2016 Annual Integrated Report
We conducted work of the same nature as the work described in section above (limited assurance) but in further detail, in particularperforming an increased number of tests. When relevant, we have tested a representative sample of entities based on their activities,their contribution to the consolidated data, their location and a risk analysis. In these cases, the selected sample represents between41% and 61% of the published data, which is significantly more than what would be requested for a limited assurance review.
–
ConclusionFor the indicators in scope of “limited assurance” (identified by the symbol )
For the indicators in scope of “reasonable assurance” (identified by the symbol )
DECLARATIONS: AUDITOR’S REPORTS & DECLARATION BY THE PERSONS RESPONSIBLE
SOLVAY 2016 Annual Integrated Report227

Indicators in bold are selected for reasonable insurance.
Reporting scope Information Audit ProcedureProduct portfolio assessed (%) Reasonable AssuranceSustainable business
solutions Sustainable business solutions (% of net sales) Reasonable AssuranceGreenhouse gas emissions intensity Reasonable AssuranceDirect and indirect CO2 emissions (Scope 1 & 2) Limited AssuranceOther greenhouse gas emissions according to Kyoto Protocol(Scope 1) Limited Assurance
Total greenhouse gas emissions (Kyoto protocol) Limited Assurance
Greenhouse gasemissions
Other greenhouse gas emissions not according to Kyoto Protocol(Scope 1) Limited Assurance
Energy consumption Limited AssuranceEnergy management
Energy efficiency index Limited AssuranceNitrogen oxides – NOx Limited AssuranceNitrogen oxides intensity Limited AssuranceSulfur oxides – SOx Limited AssuranceSulfur oxides intensity Limited AssuranceNon-methane volatile organic compounds – NMVOC Limited Assurance
Air quality
Non-methane volatile organic compounds intensity Limited AssuranceFreshwater withdrawal Limited AssuranceFreshwater withdrawal intensity Limited AssuranceChemical oxygen demand Limited Assurance
Water management
Chemical oxygen demand intensity Limited AssuranceMedium severity incidents with environmental consequences Limited AssuranceEnvironmental
incidents andremediation Environmental provision Limited Assurance
Industrial hazardous waste not disposed of in a sustainable way Limited AssuranceIndustrial hazardous waste not disposed of in a sustainable wayintensity Limited Assurance
Substance of very high concern (SVHC) according to REACH criteriapresent in products put on the market Limited Assurance
All SVHC according to REACH criteria present in products put on themarket for which this presence is due to raw materials Limited Assurance
Hazardous materialsmanagement
SVHCs reviewed for potential substitution or safer alternatives Limited AssuranceMedical Treatment Accident Rate - Employee, contractors andtemporary workers (MTAR) Reasonable Assurance
Lost Time accident Rate - Employee, contractors andtemporary workers (LTAR) Reasonable Assurance
Fatal accidents Reasonable AssuranceIndustrial Hygiene program: sites where hygiene specialists havebeen trained to new Industrial Hygiene standards Limited Assurance
Employee health andsafety
Advanced Health Monitoring program: sites with advanced risk basedmedical surveillance Limited Assurance
Solvay engagement index Reasonable AssuranceEmployeeengagement and
wellness Coverage by collective agreement Limited Assurance
Number of "risk sheets level 1" at the end of the year Limited AssurancePercentage of level 1 risk situations resolved within one year Limited AssuranceRisk level 1 situation resolved Limited Assurance
Process safety,emergency
preparedness andresponse Process safety rate Limited Assurance
Appendix A
DECLARATIONS: AUDITOR’S REPORTS & DECLARATION BY THE PERSONS RESPONSIBLE
228SOLVAY 2016 Annual Integrated Report

As required by law, we report to you in the context of our appointment as the company’s statutory auditor. This report includes ourreport on the consolidated financial statements together with our report on other legal and regulatory requirements. These consolidatedfinancial statements comprise the consolidated statement of financial position as at 31 December 2016, the consolidated incomestatement, the consolidated statement of comprehensive income, the consolidated statement of changes in equity and the consolidatedstatement of cash flows for the year then ended, as well as the summary of significant accounting policies and other explanatory notes.
We have audited the consolidated financial statements of Solvay SA/NV (“the company”) and its subsidiaries (jointly “the group”), preparedin accordance with International Financial Reporting Standards as adopted by the European Union and with the legal and regulatoryrequirements applicable in Belgium. The consolidated statement of financial position shows total assets of 24,145 million EUR and theconsolidated income statement shows a consolidated profit (group share) for the year then ended of 621 million EUR.
The board of directors is responsible for the preparation and fair presentation of consolidated financial statements in accordance withInternational Financial Reporting Standards (IFRS) as adopted by the European Union and with the legal and regulatory requirementsapplicable in Belgium, and for such internal control as the board of directors determines is necessary to enable the preparation ofconsolidated financial statements that are free from material misstatement, whether due to fraud or error.
Our responsibility is to express an opinion on these consolidated financial statements based on our audit. We conducted our audit inaccordance with International Standards on Auditing (ISA) as adopted in Belgium. Those standards require that we comply with ethicalrequirements and plan and perform the audit to obtain reasonable assurance about whether the consolidated financial statements arefree from material misstatement.
An audit involves performing procedures to obtain audit evidence about the amounts and disclosures in the consolidated financialstatements. The procedures selected depend on the statutory auditor’s judgment, including the assessment of the risks of materialmisstatement of the consolidated financial statements, whether due to fraud or error. In making those risk assessments, the statutoryauditor considers internal control relevant to the group’s preparation and fair presentation of consolidated financial statements inorder to design audit procedures that are appropriate in the circumstances, but not for the purpose of expressing an opinion on theeffectiveness of the group’s internal control. An audit also includes evaluating the appropriateness of accounting policies used and thereasonableness of accounting estimates made by the board of directors, as well as evaluating the overall presentation of the consolidatedfinancial statements. We have obtained from the group’s officials and the board of directors the explanations and information necessaryfor performing our audit.
We believe that the audit evidence we have obtained is sufficient and appropriate to provide a basis for our opinion.
In our opinion, the consolidated financial statements of Solvay SA/NV give a true and fair view of the group’s net equity and financialposition as of 31 December 2016, and of its results and its cash flows for the year then ended, in accordance with International FinancialReporting Standards as adopted by the European Union and with the legal and regulatory requirements applicable in Belgium.
STATUTORY AUDITOR'S REPORT TO THE SHAREHOLDERS’ MEETING ON THE CONSOLIDATEDFINANCIAL STATEMENTS FOR THE YEAR ENDED 31 DECEMBER 2016
Report on the consolidated financial statements – Unqualified opinion
Board of directors’ responsibility for the preparation of the consolidated financial statements
Statutory auditor’s responsibility
Unqualified opinion
DECLARATIONS: AUDITOR’S REPORTS & DECLARATION BY THE PERSONS RESPONSIBLE
SOLVAY 2016 Annual Integrated Report229

The board of directors is responsible for the preparation and the content of the directors’ report on the consolidated financialstatements.
As part of our mandate and in accordance with the Belgian standard complementary to the International Standards on Auditingapplicable in Belgium, our responsibility is to verify, in all material respects, compliance with certain legal and regulatory requirements.On this basis, we make the following additional statement, which does not modify the scope of our opinion on the consolidated financialstatements:
Zaventem, 30 March 2017
The statutory auditorDELOITTE Bedrijfsrevisoren / Reviseurs d’EntreprisesBV o.v.v.e. CVBA / SC s.f.d. SCRLRepresented by Michel Denayer
Report on other legal and regulatory requirements
The directors’ report on the consolidated financial statements includes the information required by law, is consistent with theconsolidated financial statements and is free from material inconsistencies with the information that we became aware of during theperformance of our mandate.
DECLARATIONS: AUDITOR’S REPORTS & DECLARATION BY THE PERSONS RESPONSIBLE
230SOLVAY 2016 Annual Integrated Report

The Board of Directors hereby declares that, to the best of its knowledge:
For the Board of Directors,
Nicolas BoëlChairman of the Board of Directors
Jean-Pierre ClamadieuChairman of the Executive Committee and CEO
Director
DECLARATION BY THE PERSONS RESPONSIBLE
a. the financial statements, prepared in accordance with International Financial Reporting Standards (“IFRS”), give a true and fair view ofthe assets, liabilities, financial position, and earnings of the issuer and og the entities included in the consolidation
b. the management report includes an accurate review of the business developments, earnings, and financial position of the issuer andof the entities included in the consolidation, as well as a description of the main risks and uncertainties that these entities face.
DECLARATIONS: AUDITOR’S REPORTS & DECLARATION BY THE PERSONS RESPONSIBLE
SOLVAY 2016 Annual Integrated Report231

Adjustments made to IFRS results for elements distortingcomparability over time of the Group underlying performance.These adjustments consist of:
Net income (Solvay’s share) divided by the weighted averagenumber of shares, after deducting own shares purchased tocover stock option programs.
Cash paid for the acquisition of tangible and intangible assets
Carechem 24 is a multilingual telephone advice service providingaccess to a team of trained responders 24 hours a day, 365days a year. Carechem 24 provides companies all over the worldwith emergency product support during a hazardous materialsincident.
(Underlying EBITDA + Capex from continuing operations) /Underlying EBITDA
European Chemical Industry Council.
Chief Executive Officer.
Chief Financial Officer.
Cash Flow Return On Investment, calculated as the ratio betweenrecurring cash flow and invested capital, where
Cash-generating unit.
Solvay is committed to responsible behavior and integrity, takinginto account the sustainable growth of its business and its goodreputation in the communities in which it operates.
Executive Committee.
Corporate Social Responsibility.
Net income (Solvay’s share) divided by the weighted averagenumber of shares adjusted for the effects of dilution.
Component of the Group which the Group has disposed of orwhich is classified as held for sale, and:
Gross dividend divided by the closing share price on December31.
Net dividend divided by the closing share price on December 31.
Dow Jones Euro Stoxx is a pan-European stock index whichincludes the 326 most important shares of the general Dow Jonesindex, belonging to eleven countries of the Eurozone.
Dow Jones Stoxx is a European stock index composed of the 665most important European shares.
Earnings before interest and taxes.
GLOSSARY
Adjustment
Results from portfolio management and reassessments,
Results from legacy remediation and major litigations,
M&A related impacts, mainly including non-cash PurchasePrice Acquisition impacts (e.g. inventory step-up andamortization of intangibles) and retention bonuses relative toChemlogics and other acquisitions,
Net financial results related to changes in discount rates,hyperinflation, coupons of hybrid bonds considered asdividends under IFRS and debt management impacts (mainlyincluding gains/(losses) related to the early repayment of debt),
Adjustments of equity earnings for impairment gains or lossesand unrealized foreign exchange gains or losses on debt,
Results from available-for-sale financial assets,
Tax effects related to the items listed above and tax expenseor income of prior years.
All adjustments listed above apply to both continuing anddiscontinuing operations, and include the impacts on non-controlling interests.
Basic earnings per share
Capital expenditures (capex)
Carechem
Cash conversion
CEFIC
CEO
CFO
CFROI
Recurring cash flow = Underlying EBITDA + (Dividends fromassociates and joint ventures – Earnings from associates andjoint ventures) + Recurring capex + Recurring income taxes;
Invested capital = Replacement value of goodwill & fixed assets+ Net working capital + Carrying amount of associates and jointventures;
Recurring capex is normalized at 2% of the Replacement valueof fixed assets net of Goodwill values;
Recurring income taxes are normalized at 30% of (UnderlyingEBIT – Earnings from associates and joint ventures);
CGU
Code of Conduct
Comex
CSR
Diluted earnings per share
Discontinued operations
Represents a separate major line of business or geographicalarea of operations;
Is part of a single coordinated plan to dispose of a separatemajor line of business or geographical area of operations; or
Is a subsidiary acquired exclusively with a view to resale.
Dividend yield (gross)
Dividend yield (net)
DJ Euro Stoxx
DJ Stoxx
EBIT
GLOSSARY
232SOLVAY 2016 Annual Integrated Report

Earnings before interest and taxes, depreciation andamortization.
The U.S. Environmental Protection Agency (EPA or USEPA) is anagency of the United States federal government which wascreated for the purpose of protecting human health and theenvironment by writing and enforcing regulations based on lawspassed by Congress.
Equity (Solvay share) divided by the number of outstandingshares at year end (issued shares - treasury shares).
Global operator of financial markets and provider of tradingtechnologies.
Cash flow from operating activities (excluding cash flow relatedto acquisitions of subsidiaries) and Cash flow from investingactivities (excluding acquisitions and disposals of subsidiaries andother investments and excluding loans to associates and non-consolidated investments, as well as related tax elements).
The FTSEurofirst 300 Index tracks the equity performance acrossthe region of the 300 largest companies ranked by marketcapitalization in the FTSE Developed Europe Index.
Global Business Unit.
Greenhouse gas.
The Global Reporting Initiative (GRI) is a leading organization inthe sustainability field. GRI promotes the use of sustainabilityreporting as a way for organizations to become more sustainableand contribute to sustainable development.
High-barrier polymer.
Highly Dispersible Silica.
Polyamide High Performance.
International Financial Reporting Standards.
This is a process founded on integrated thinking, which resultsin a periodic integrated report by an organization about valuecreation over time and related communications regardingaspects of value creation.
The ISO 9001 standard defines a set of requirements for theestablishment of a system of quality management in anorganization, whatever its size and activity.
The ISO 14001 family addresses various aspects ofenvironmental management. It provides practical tools forcompanies and organizations looking to identify and control theirenvironmental impact and constantly improve theirenvironmental performance.
The ISO 14040 standard covers life cycle assessment (LCA)studies and life cycle inventory (LCI) studies.
The ISO 26000 is a global standard which provides guidelinesfor organizations that wish to operate in a socially responsiblemanner. The standard was published in 2010 after five years ofnegotiations among a large number of stakeholders worldwide.Representatives of governments, NGOs, industry, consumergroups, and the world of work were involved in its development.It therefore represents an international consensus.
Net debt / underlying EBITDA of last 12 months. Underlyingleverage ratio = underlying net debt / underlying EBITDA of last12 months.
Loss prevention aims at maintaining production flow andprofitability of the plants by providing risk mitigation. It alsocontributes to increasing the protection of people and theenvironment.
Lost Time Accident Rate.
Long Term Incentive.
Mergers and Acquisitions.
This mainly includes non-cash Purchase Price Allocation impacts(e.g. inventory step-up and amortization of intangibles other thanfor PPA Rhodia) and retention bonuses relative to Chemlogicsand other acquisitions.
Organizations are faced with a wide range of topics on which theycould report. The relevant topics are those that may reasonablybe considered important for reflecting the organization’seconomic, environmental, and social impacts, or influencing thedecisions of stakeholders, and therefore potentially meritinclusion in an annual report. Materiality is the threshold at whichaspects become sufficiently important that they should bereported.
EBITDA
Environmental Protection Agency
Equity per share
Euronext
Free Cash Flow
FTSEurofirst 300
GBU
GHG
GRI
HBP
HDS
HPPA
IFRS
Integrated reporting
ISO 9001
ISO 14001
ISO 14040
ISO 26000
Leverage ratio
Loss prevention process
LTAR
LTI
M&A
M&A related impacts
Materiality
GLOSSARY
SOLVAY 2016 Annual Integrated Report233

Medical Treatment Accident Rate.
Cost of borrowings netted with interest on lendings and short-term deposits, as well as other gains (losses) on net indebtedness
Non-current financial debt + current financial debt – cash & cashequivalents – other financial instrument receivables. Underlyingnet debt reclassifies as debt 100% of the hybrid perpetual bonds,considered as equity under IFRS.
The difference between the change in sales prices versus thechange in variable costs.
A natural currency hedge is an investment that reduces theundesired risk by matching cash in and outflows.
Net cost of borrowings, costs of discounting provisions (namely,related to post-employment benefits and HSE liabilities) andincome / loss from available-for-sale financial assets.
Sales of goods and value added services corresponding toSolvay’s know-how and core business. Net sales exclude otherrevenues primarily comprising commodity and utility tradingtransactions and other revenue deemed as incidental by theGroup.
Includes inventories, trade receivables and other currentreceivables, netted with trade payables and other currentliabilities.
Other Comprehensive Income.
Organisation for Economic Co-operation and Development.
OHSAS 18001 is an international occupational health and safetymanagement system specification.
Organic Light-Emitting Diode.
Innovation that is enriched with outside expertise, throughpartnerships with the academic world and by shareholdings instart-ups, either directly or via investment funds.
Polyetheretherketone.
Propylene oxide.
Unit of percentage points, used to express the evolution of ratios.
Purchase Price Allocation (PPA) accounting impacts related toacquisitions, primarily for Rhodia and Cytec.
The ability to create positive net pricing.
Polyphenylene sulfide.
Performance Share Unit.
Polyphenylsulfone.
A responsible approach in managing risks throughout the entirelife cycle of a product, from the design stage to the end of life.
Polyvinyl chloride.
Polyvinylidene fluoride.
Research & Innovation.
Research & innovation / net sales.
REACH is the European Community Regulation on chemicals andtheir safe use (EC 1907/2006). It deals with the registration,evaluation, authorization, and restriction of chemical substances.The law entered into force on June 1, 2007.
It includes gains/(losses) from activities presented asdiscontinued operations.
Revenues primarily comprising commodity and utility tradingtransactions and other revenue deemed as incidental by theGroup, considered to not correspond to Solvay’s know-how andcore business.
Responsible Care® is the global chemical industry’s uniqueinitiative to improve health, environmental performance,enhance security, and to communicate with stakeholders aboutproducts and processes.
Return on equity.
MTAR
Net cost of borrowings
Net debt
Net pricing
Natural Currency Hedge
Net Financial Charges
Net Sales
Net working capital
OCI
OECD
OHSAS 18001
OLED
Open Innovation
PEEK
PO
pp
PPA
Pricing power
PPS
PSU
PPSU
Product Stewardship
PVC
PVDF
R&I
R&I intensity
REACH
Results on disposals
Revenue from non-core activities
Responsible Care®
ROE
GLOSSARY
234SOLVAY 2016 Annual Integrated Report

Safety Data Sheets are the main tool for ensuring thatmanufacturers and importers communicate enough informationalong the supply chain to allow safe use of their substances andmixtures.
Sustainability Accounting Standards Board. SASB’s mission is todevelop and disseminate sustainability accounting standards thathelp public corporations disclose material, decision-usefulinformation to investors. That mission is accomplished througha rigorous process that includes evidence-based research andbroad, balanced stakeholder participation.
The Control of Major Accident Hazards Involving DangerousSubstances Regulations. These regulations (often referred to as“COMAH Regulations” or “Seveso Regulations”) give effect toEuropean Directive 96/82/EC. They apply only to locations wheresignificant quantities of dangerous substances are stored.
Launched in 2013 and aligned with ISO 26000, Solvay Way is thesustainability approach of the Group. It integrates social, societal,environmental, and economic aspects into the Company’smanagement and strategy, with the objective of creating valueshared by all of its stakeholders. Solvay Way is based on anambitious and pragmatic framework serving as a tool of bothmeasurement and progress. Solvay Way lists 49 practices –practices that reflect the Solvay Way’s 22 commitments and arestructured on a four-level scale (launch, deployment, maturity,performance).
Stock Option Plan.
The Sustainable Portfolio Management tool is integrated into theSolvay Way framework (linked to five practices). It serves as astrategic tool for developing information on our portfolio andanalyzing the impacts of sustainability megatrends on ourbusinesses.
Short Term Incentive.
Substance of Very High Concern (SVHC) is a chemical substance,the utilization of which within the European Union has beenproposed to become subject to legal authorization under theREACH regulation.
Income taxes / (Result before taxes – Earnings from associates& joint ventures – interests & realized foreign exchange resultson RusVinyl joint venture). The adjustment of the denominatorregarding associates and joint ventures is made as thesecontributions are already net of income taxes.
Underlying results are deemed to provide a more comparableindication of Solvay’s fundamental performance over thereference periods. They are defined as the IFRS figures adjustedfor the “Adjustments” as defined above.
Vinyl chloride.
Total number of shares traded during the year divided by thetotal number of listed shares, using the Euronext definition.
Velocity adjusted as a function of the percentage of the listedshares held by the public, using the Euronext definition.
World Business Council for Sustainable Development.
World Class Factory.
Safety Data Sheets
SASB
Seveso Regulations
Solvay Way
SOP
SPM
STI
SVHC
Tax rate
Underlying
VCM
Velocity
Velocity adjusted by free float
WBCSD
WCF
GLOSSARY
SOLVAY 2016 Annual Integrated Report235

Publication of the 1st quarter 2017 results
Annual Shareholders’ Meeting
Final dividend ex-coupon date
Final dividend record date
Final dividend payment
Publication of the 2nd quarter and 1st half year 2017 results
Publication of the 3rd quarter 2017 results
SHAREHOLDER’S DIARY
MAY 3, 2017
MAY 9, 2017
MAY 12, 2017
MAY 15, 2017
MAY 16, 2017
AUGUST 1, 2017
NOVEMBER 8, 2017
SHAREHOLDER’S DIARY
236SOLVAY 2016 Annual Integrated Report

Imprint
Ce rapport est aussi disponible en français.Dit jaarverslag is ook beschikbaar in het Nederlands.
Layout, concept and production (print & online)nexxar, Austriawww.nexxar.com
Content and computer graphic consulting, writing CAPITALCOM, Francewww.capitalcom.fr
Consulting, translation, printing and video servicesRRED Communications, Netherlandswww.rred.nl
Publication managementSolvay Communication
PhotosGetty Images / mihailomilovanovicGetty ImagesSolvay / Jean-Michel Byl, Renate SchwiedernochSolvay/Didier VandenboschSolvay/Xavier RenauldThinkStockFotolia/V. YakobchukGetty Images/iStockphoto; Shutterstock

www.twitter.com/solvaygroup
www.facebook.com/solvaygroup
www.youtube.com/solvaygroup
www.solvay.com
http://annualreports.solvay.com/2016/en
Solvay SARue de Ransbeek, 3101120 BrusselsBelgiumT: +32 2 264 2111F: +32 2 264 3061
Follow us on
This document has been generated from the online version, which provides additional, interactive features:


