25
研究論文 ARTICLE Specification of Key Sectors of Cambodian Economy: Application of Input-Output Analysis on Export Potentials CHHUOR Sryneath

研究論文ARTICLE
Specification of Key Sectors of Cambodian Economy: Application of Input-Output Analysis
on Export Potentials
CHHUOR Sryneath

Forum of International Development Studies. 47―7 (Sep. 2016)
1
Specification of Key Sectors of Cambodian Economy: Application of Input-Output Analysis
on Export Potentials
CHHUOR Sryneath*
Abstract
The slow progress of diversification and the low value added of the main manufacturing exports,
given the narrow based industrial structure, make Cambodia’s foreign market vulnerable to external
shocks and unable to contribute widely to the domestic economy. This paper, therefore, attempts to
identify additional key export sectors by applying the Input-Output model. Results show that Food-beverage-tobacco and Rubber-plastic are the only two sectors with strong linkages both backward
and forward, while Hotel-restaurant and Agriculture are backward-oriented and forward-oriented,
respectively. The former two plus Wood-paper are able to induce higher income. Agriculture has high
labor contents, yet the indirect employment of the sector is small, while the share of total net exports
of Textile is not as high as it appears in actual share. The finding suggests that while the high linkage-
oriented industries such as processed food and rubber have not been able to realize their full potential
in exports, the largest current export industry, textile, is unlikely to contribute enough profit due to
high import dependency and the lack of inter-industrial linkages. Limited interaction is found when net
exports are dominated by a few commodities, and most sectors with relatively high linkages are not the
net foreign exchange earners. This emphasizes that export potentials can be realized through not only
diversification but also linkage creation. As a result, the study suggests four potential export sectors:
Food-beverage-tobacco, Rubber-plastic, Hotel-restaurant, and Agriculture.
Keywords: Key Sectors, Input-Output Model, Backward-forward Linkages
1. Introduction
Cambodia’s trade increased from 48 percent of GDP in 1993 to 140 percent in 2013, with exports
accounting for 65 percent (US$7.28 bollion) and growing at 18 percent on average annually (WDI,
2015).1 The garment industry and tourism are the current leading export sectors. This growth has
been realized through a combination of targeted policy―tax incentives and quota increases for the
garment sector―and horizontal policy―the tariff cuts, and the accession to ASEAN in 1999 and to the
WTO in 2004 (World Bank, 2009). Nevertheless, export growth should be interpreted with caution as
domestic technological benefits are limited. The important question is how much the export boom has
* Doctoral Student, Graduate School of International Development, Nagoya University. The author would like to thank Professor
FUJIKAWA Kiyoshi and two anonymous referees for their helpful guidance and comments.

Forum of International Development Studies. 47―7 (Sep. 2016)
2
contributed to domestic industry and vice versa. Boosting the domestic industrial connection and the
value added content of export products may be a good option. For this reason, domestic development
depends greatly on which goods the country exports.
Export of primary commodities has decreased from almost 80 percent of total exports in 1995 to
less than 15 percent in 2012―one third of which is accounted for by food items including milled rice,
beverages and tobacco―replaced by labor-intensive manufacturing exports (UNCTAD, 2014). The
main products are garments (apparel and clothing accessories), footwear, and motor vehicles which are
66 percent, 8 percent, and 3 percent of total exports, respectively (Table A. 1).
Trade system of Cambodia depends significantly on how to expand; hence, identifying potential
exports and increasing supply and competitiveness are the key elements. Three policy headings
have been proposed: to ensure the vitality and competitiveness of existing exports, to develop export
potential and diversify products and markets, and to encourage investment and improve investment
facilitation for export (WTO Secretariat, 2011). Initial baskets of 19 potential products and services
were identified following the Diagnostic Trade Integration Strategy (DTIS) in 2007 (Table A. 2) (MoC,
2007). Garment and footwear are still the top products in the list, followed by agricultural items.
Improved market access due to favorable trade agreement with the EU, low labor costs together with
a relatively encouraging business environment are the main competitiveness of Cambodia’s export.
However, low labor productivity and high trade facilitation costs remain critical, whereas a number of
other constraints hinder exports progress, which will be discussed in the next sections. The paper
proceeds with a brief review of existing literature in section 3, while section 4 introduces study
objective, original contributions, and data. The methodology is described in section 5, followed by the
discussion of the results in section 6. Section 7 concludes the paper.
2. Challenges to the Performance of Export Sectors
2.1. Slow Progress of Diversification
Five main products account for more than 60 percent, with articles of apparel alone sharing more
than half, of total export in 2012, remaining unchanged from 2000, which indicates that diversification
towards new products in the recent years has made slow progress (UNCTAD, 2014). The low-end
garments and markets within the sector itself are mainly based on the advantages of quota assessment,
while other factors such as creation of production chains seem to be ignored (World Bank, 2009).
As a result, other sectors see little progress, the impacts of the main export on other factors such
as employment, value added and linkages are thus limited. In addition, diversification index see no
significant improvement. This index, ranging from 0 (more diversified) to 1 (less diversified), shows
to which extent the country depends on specific products comparing to world export. In comparison,
the export diversification index of Cambodia stood at 0.79 in 2012, similar to that of Laos (0.77), yet

Forum of International Development Studies. 47―7 (Sep. 2016)
3
higher than that of Thailand (0.40), Vietnam (0.52), and
other countries in ASEAN, except Brunei and Myanmar,
as shown in Table 1.2
2.2. Lack of Value Chains
The country is not able to retain value added in its
main manufacturing as little of the value chain operates
inside the country, where intermediate parts are
imported and assembled into finished products which
are then exported. Manufacture export capacity is one
of the indicators commonly used to measure industrial
performance as it shows the ability of countries to
produce in a highly competitive environment and
indicates the level of national manufacturing value added (MVA) (UNIDO, 2011). Hence, it is necessary
to complement the export analysis with MVA. Cambodia has impressive growth in manufacturing
exports, with an average annual rate of 15 percent from 2000 to 2009, which is relatively higher than
that of Malaysia, Thailand and Indonesia, whereas MVA per capita in Cambodia also rose considerably
due to the low based start of manufacturing export. However, the value remains among the lowest in
the region. As shown in Table 2, Cambodia’s per capita MVA in 2009 still lagged behind Vietnam’s in
2005 and Indonesia’s and the Philippines’s in 2000, which means that Cambodia’s MVA growth is not
as impressive as it appears at first glance.
Table 1 Export Diversification Index, ASEAN, 2000 and 2012
CountryIndex Value
2000 2012
Brunei 0.81 0.84
Cambodia 0.83 0.79
Indonesia 0.49 0.55
Laos 0.74 0.77
Malaysia 0.51 0.46
Myanmar 0.79 0.82
Philippines 0.62 0.57
Singapore 0.46 0.50
Thailand 0.40 0.40
Viet Nam 0.57 0.52
Source: UNCTAD, 2014
Table 2 Manufactured Exports and Value Added, Cambodia and Asia, 2000―2009
Manufactured exports (US$ million)Average annual
growth rate
Manuf value added per capita
(US$ constant 2000 prices)
2000 2005 2009 2000―09 2000 2005 2009
Malaysia 87,643 120,622 133,222 5% 1,265 1,412 1,390
Thailand 58,731 95,859 127,686 9% 680 895 1,004
China 228,407 722,628 1,155,517 20% 303 492 754
Indonesia 42,990 55,118 72,130 6% 216 258 295
Philippines 36,633 39,432 35,729 0% 221 247 258
Viet Nam 6,765 17,504 36,429 21% 73 118 171
Cambodia 1,090 2,093 3,276 15% 46 80 111
India 35,419 87,168 149,047 17% 63 80 99
Source: UNIDO, 2011
Forum of International Development Studies. 47―7 (Sep. 2016)
4
2.3. Underperformance in the Regional Market
In 2011, only 1.5 percent of Cambodia’s exports went to ASEAN countries other than Thailand
and Vietnam. Among all the members, Cambodia contributed only 0.26 percent of total exports to the
regional market in the same year, an increase from 0.14 percent in 2005, comparing to 0.34 percent in
1997 before the accession into ASEAN (UNCTAD, 2012). Meanwhile, Cambodia has underperformed
in relation to other partners in intra-regional markets―only 13 percent, against 49 percent on average
(World Bank, 2009). This may reflect the inability of the export sectors in realizing potential gains
from regional free trade agreement.
The comparison above shows that the competitiveness of Cambodia in the export market does not
correspond to the performance of its industries. Favorable status of market access plays important role
in promoting garment export; however, there are still open questions with regard to which sectors can
also take part in the world market while at the same time contribute to domestic economic linkages.
3. Literature Reviews on Specification of export sectors
Export as a Factor of Production
Exports have been examined as an input of production since the amount of exports positively affects
aggregate outputs (Ram, 1985; Tyler, 1981; Balassa, 1978). Tyler (1981) studied a cross-country
analysis from 1960 to 1977 by including export as a factor of production and found a strong association
between output growth and manufacturing exports in developing economies. However, by which
channels exports contribute to growth is not explicitly identified in the model.
Reveal Comparative Advantage
Reveal comparative advantage (RCA) is commonly used as an indicator measuring export strength.
Abidin (2000: 309) stated that: “the RCA measures the export share of commodity i from country j
in the world market relative to its production share”. For the case of Cambodia, traditional exports,
comprising of textile fabrics, natural rubber latex, wood and vegetable materials have maintained RCA
over 1990―2006, but their joint share fell and was replaced by garment cluster and non-traditional
exports including nuts, castor oil seeds and plywood products (World Bank, 2009).
The application of RCA basically examines main exporting commodities to specify competitiveness.
Notwithstanding, other sectors usually see little progress in output, productivity and efficiency when
the attention is given only to those strong exporting sectors. Taipei, China, has experienced this
problem (Tung, 2000). In addition, linkages across sectors are not taken into account in RCA model
which can limit export potential of different industries. For instance, minimal industrial linkages
are one of the crucial factors limiting export of Malaysia (Abidin, 2000). Therefore, it is of central
importance that linkages between sectors should also be taken into consideration when examining
exporting issues.

Forum of International Development Studies. 47―7 (Sep. 2016)
5
Sectotal Linkages
Sectoral linkage approach indicates the extent to which one industry is affected by the stimuli
of another through structural interconnection, which can be investigated by using Input-Output
framework (Hazari, 1970; Rasmussen, 1956). While such kind of models are wisely applied, the study
on Cambodia’s case have been few. Kobayashi et al. (2009) studied industrial structure of Cambodia
and the role of agriculture by measuring gross output and value added of each sector. They found that
garment industry played an important role in GDP and self-sufficiency, yet induced smaller domestic
outcome, while agriculture and food sectors had a tendency to induce high and wide distribution of
income. Nonetheless, different measures of the importance of exporting sectors were not specifically
emphasized in their study.
4. Research Objective and Data
The study attempts to identify key sectors promising for exports using the Input-Output model
through five approaches: backward and forward linkages, multiplier effects on income, labor intensity,
foreign exchange earnings, and hypothetical extraction. Sectors with potential for exports should
rank high in most, if not all, of the five indicators. To the best of the author’s knowledge, this is the
first study to combine the five approaches and, more importantly, to base on both the traditional
Rasmussen’s backward-forward linkages and the more current hypothetical extraction method. The
normalization approach3 for ranking given to each indicator at the end of the estimation is another
contribution in the methodology. In addition, previous study on this topic in the case of Cambodia are
mainly based on qualitative method (MoC, 2014; MoC, 2007; RGC, 2015; World Bank, 2009). The
quantitative approach, therefore, would contribute to widen the discussion of the topic.
The 2011 input-output table used in the study consists of 18 sectors.4 This table is derived from
the Social Accounting Matrix (SAM) of Cambodia constructed by Heng et al. (2014). The database
used in the estimation also contributes to the originality of the paper in the sense that the author has
generated data of employment by sector from the National Institute of Statistics (NIS)’ Cambodia
Socio-Economic Survey (CSES, 2009) for consistency with the I-O table.
Table A. 4 shows the descriptive statistic of the structural feature of Cambodian economy.
Textile (TEXTILE) accounts for 21 percent, the largest share, of domestic production, followed by
Agriculture (ARG) , Wholesale-retail trade and transportation (WTT) , respectively. These
three industries are also the top three contributing to highest value added. Top export belongs
to TEXTILE , while the next are in services, particularly Hotel-Restaurant (HR) and Trade-
Transportation (WTT). For the export and import intensity, defined as export and import share
in domestic production, almost all (96 percent) of TEXTILE is exported, which reveals that foreign
market plays a more vital role for this industry. Similarly, export intensity of HR is 71 percent

Forum of International Development Studies. 47―7 (Sep. 2016)
6
showing the importance of this exporting service in tourism. While AGR employs more than 60
percent of the labor force, it contributes to only 41 percent of income, representing that value added
per worker is lower in this sector than in the service sectors. This can be explained by the higher
share of low skilled-labors in the former and the high-skilled labors in the latter.
5. Methodology
Matrix Form
Intermediate goods plus final demand should be equivalent to total output. This can be written in
matrix form as x=Ax+f, where A is the input coefficient matrix representing the input per unit of
total output of each industry,5 x is the total output vector and f is final demand vector (Miller & Blair,
2009). The matrix form of the decomposition is derived as follows:
x=(I-M^)Ax+(I-M^)f+e (1)
x=[I-(I-M^)A]-1[(I-M^)f+e] (2)
where x=
x1
…
xn
; f=
f1
…
fn
; e=
e1
…
en
; I=
1 … 0
… … …
0 … 1
; A=
a11 … a1n
… … …
anl … ann
; aij=xij
xj
M ^=
m1 … o
… … …
o … mn
; mi=mj
xj+fj ; [I-(I-M^)A]-1=
b11 … b1n
… … …
bnl … bnn
5.1. Backward and Forward Linkages
Backward and forward linkages in the I-O framework can be measured based on the Leontief
inverse matrix, [I-(I-M^)A]-1. b ij denotes the elements of the Leontief inverse matrix. The
backward linkages are the column sums of all of the bij elements, following Hazari & Kingma (1976)
and Mujeri & Alauddin (1994),
∑n
i=1 bij=b. j (3)
which indicates the direct and indirect input requirements for all sectors for a unit increase in final
demand for the jth sector, while the forward linkages are the raw sums of the bij elements
∑n
j=1 bij=bi. (4)
which indicates the output increase in the ith sector required to meet a unit increase in final demand
for all sectors. The result of the two linkages provides information about which sectors produce
Forum of International Development Studies. 47―7 (Sep. 2016)
7
the highest direct and indirect effects, yet there is no information regarding whether there is a high
interdependence among all sectors. As a result, linkage indices have to be defined.
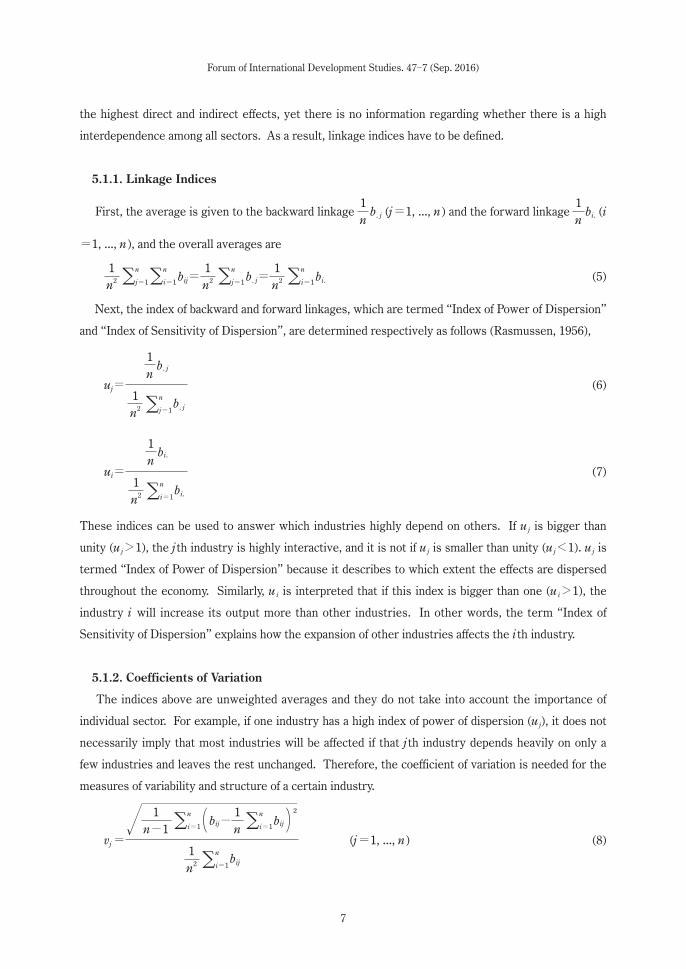
5.1.1. Linkage Indices
First, the average is given to the backward linkage 1n
b. j (j=1, ..., n) and the forward linkage 1n
bi. (i
=1, ..., n), and the overall averages are
1n2 ∑n
j=1 ∑n
i=1 bij=1n2 ∑n
j=1 b. j=1n2 ∑n
i=1 bi. (5)
Next, the index of backward and forward linkages, which are termed “Index of Power of Dispersion”
and “Index of Sensitivity of Dispersion”, are determined respectively as follows (Rasmussen, 1956),
uj=
1n
b. j
1n2
∑n
j=1b. j
(6)
ui=
1n
bi.
1n2
∑n
i=1bi.
(7)
These indices can be used to answer which industries highly depend on others. If uj is bigger than
unity (uj>1), the jth industry is highly interactive, and it is not if uj is smaller than unity (uj<1). uj is
termed “Index of Power of Dispersion” because it describes to which extent the effects are dispersed
throughout the economy. Similarly, ui is interpreted that if this index is bigger than one (ui>1), the
industry i will increase its output more than other industries. In other words, the term “Index of
Sensitivity of Dispersion” explains how the expansion of other industries affects the ith industry.
5.1.2. Coefficients of Variation
The indices above are unweighted averages and they do not take into account the importance of
individual sector. For example, if one industry has a high index of power of dispersion (uj), it does not
necessarily imply that most industries will be affected if that jth industry depends heavily on only a
few industries and leaves the rest unchanged. Therefore, the coefficient of variation is needed for the
measures of variability and structure of a certain industry.
vj=
1n-1
∑n
i=1( bij-1n ∑n
i=1 bij)2
1n2
∑n
i=1bij
(j=1, ..., n) (8)

Forum of International Development Studies. 47―7 (Sep. 2016)
8
vi=
1n-1
∑n
j=1( bij-1n ∑n
j=1 bij)2
1n2
∑n
j=1bij
(i=1, ..., n) (9)
In the case of a relatively high value of v j, the j th industry is dependent heavily on only a few
industries, and a relatively low value of vj indicates, the jth industry evenly draws on most of other
industries; similarly, in the case of a relatively high value of vi, the whole system draws one-sidedly on
the ith industry.
5.2. Multiplier Effects
Income multipliers are used to determine which sectors generate higher income effects if the same
amount of initial effect is given (Hara, 2008). ty j denotes total income generated by industry j, so
yj=tyj
xj (10)
is the income per unit of output. The direct and indirect income distributed by each sector is derived,
Y=(Y^)[I-(I-M^)A]-1 (11)
where (Y^) is the diagonal matrix of income coefficient, and [I-(I-M^)A]-1 is the Leontief inverse
matrix, hence Y is the matrix of direct and indirect income effects per unit of final demand. The
column sum of Y (∑n
i=1
yij, j=1, ..., n) denotes the total income effects for the jth industry. To get the
income multiplier, the total income effect is divided by the initial income,
ymj=∑n
i=1 yij
yj
(12)
Income multipliers ymj therefore can imply that the US$1 increase in final demand generates additional
income of some amount of US$ for workers in one industry, plus another amount for workers in
remaining industries.
The result provides guidance in policy decisions, for example, which sector should receive
investment funds given limited resources if the target is to raise household income. Increasing final
demand can be the initial attempts; nonetheless, domestic final demand may not be increased easily, at
least in the short term, given the small market size of Cambodia, so the increase in foreign sales can be
a potential target. Hence, the income multipliers are considered one of the main indicators to specify
key export sectors that are likely to raise workers’ income via export promotion.

Forum of International Development Studies. 47―7 (Sep. 2016)
9
5.3. Employment Intensity
tl j denotes the total labor employed by the jth sector, so the direct labor requirements per unit of
total output is
lj=tlj
xj (13)
This is pre-multiplied by total output requirements per unit of final demand and yields total (direct and
indirect) labor effects
L=(L^)[I-(I-M^)A]-1 (14)
where (L^) is the diagonal matrix of labor coefficient, and [I-(I-M^)A]-1 is the Leontief inverse
matrix, hence L is the matrix of total labor requirements per unit of final demand. The higher the
labor content, the more potential of the sector to possess comparative advantage which, on the one
hand, answers the question whether this particular sector produces labor-intensive products and
should be relied on for export promotion, and on the other hand, helps with policy making to undertake
investment to maximize employment generation in the highest labor requirement sectors.
5.4. Trade Balance
Exporting sectors do not necessarily realize net foreign exchange earnings because some sectors
have to spend more on total imports than what they can earn from exports. The analysis of net
earnings is possible within an I-O framework where the direct and indirect import requirements per
unit of final demand (denoted by TM) can be derived from the multiplication of the diagonal matrix of
total import coefficient, (M^), and the Leontief inverse matrix
TM=(M^)[I-(I-M^)A]-1 (15)
Net foreign exchange earnings of sector j are defined as the result of export (ej) taking out the total
import requirements
zj=ej-∑n
i=1
tmij fj (j=1, ..., n) (16)
If z j is positive, the jth sector is the net exporter or winner of foreign exchange. The net earners
should be considered as key exports as they will help secure foreign reserves and correct trade deficit,
which has persisted for two decades in Cambodia. The result adds a leading guide for the policy
making as to which sectors should be export-oriented.
5.5. Hypothetical Extraction
In addition to the linkage concept, the hypothetical extraction method (HEM) is a more recent
alternative approach used to measure key sectors and was studied by Paelinck et al., (1965); Strassert,

Forum of International Development Studies. 47―7 (Sep. 2016)
10
(1968); and Meller & Marfán (1981) (cited in Temurshoev, 2010). HEM refers to the “shut down” of
any sector in the I-O transaction and can be used to identify key industries through industries’ “factor
worth”. Temurshoev (2010: 875) terms “factor” as any indicator, which might refer to economic,
social, or environmental factor. To put it another way, HEM measures how the whole system (i. e.
output, employment) is to be affected directly and indirectly if one industry is extracted.
Another purpose of using HEM in this study is basically to confirm whether the result of this latter
method will correspond to that of the traditional method of the Rasmussen concept of linkages in the
case of Cambodian economy. The method will provide additional outlook as to what sectors should
be specified as key sectors, aimed at obtaining precise answers to achieve the study objective. To the
best of the author’s knowledge, no previous studies have combined these methods for comparison.
Using the same final demand vector (f), the model is originated from the matrix of equation (2)
x(-j)=[I-(I-M^)A(-j)]-1[(I-M^)f+e] (17)
The difference between the total outputs before and after the extraction is
Δx=x-x(-j) (18)
6. Result and Discussion
Table 3 presents the backward and forward linkages obtained from the technological coefficient,
equation (3) and (4). On average, the direct and indirect effect of the total linkages for Cambodia’s
economy is 1.27. For the backward linkages, FBT (Food Beverage Tobacco) stands at 1.62, which
is the highest rank among all of the sectors. This figure indicates that if final demand for this sector
increases by US$1 million, total outputs of all sectors will increase by US$1.62 million. The second
highest linkage is Hotel-Restaurant , followed by Rubber-Plastic with backward linkages of 1.54
and 1.49, respectively. Electricity -Gas-Water and Wood-Paper are among others with moderate
linkages, while MOTORT and TEXTILE have the fewest linkages, slightly higher than 1.00. The
increase in final demand for these two sectors will not have significant impacts on the economy.
AGR ranks modestly for backward linkages but appears to be first for forward ones. Agriculture,
covers paddy, livestock, crop and related activities―important in providing input for food production―
and forestry, such as silviculture, logging, gathering of non-wood forest products, and support services
to forestry. The figure shows that there is a high dependency of other industries on AGR.
Power of Dispersion and Sensitivity of Dispersion
The result of the index of power of dispersion (uj) and sensitivity of dispersion (ui), together with
the variation of coefficients (vj, vi) in parenthesis, is presented in Table 4. Six sectors have strong
backward linkages. Among them, FBT has the strongest linkages with uj as high as 1.27, and vj as

Forum of International Development Studies. 47―7 (Sep. 2016)
11
small as 2.94, followed by HR , and RP . On
the other hand, O T H M N U , T E X T I L E
and MOTORT have the weakest backward
linkages. Although FBT ranks first for uj,
its vj ranks second after HR , indicating that
the stimuli of FBT have the highest impacts,
but the distribution towards all sectors can
be less even than that of the stimuli by HR.
For the forward linkage indices, ui reaches
its highest level at 1.47 for AGR , followed
by a total of seven other sectors with strong
forward linkages. The lowest u i goes to
HR . It should be noticed that this sector
has relatively strong backward linkages
but weak forward linkages. The increase
in final demand for this sector would result
in relatively high impacts on other sectors,
but not vice versa. For instance, the higher
demand for hotel and restaurant services
would lead to an increased demand for
food (either raw agricultural or processed food), transportation and trade, specifically due to tourism
services, and other business services. However, the increased demand for those does not necessarily
lead to an increase of HR output.
Figure 1 is divided into four quadrants and locates different sectors according to the level of both uj
and ui. RP and FBT―located in the upper-right part (part 1)―have strong linkages both backward
and forward, while six sectors (Mining , Tex t i l e , Meta l , Motor, Cons truc t ion , and Other
services)―in the lower-left part (part 4)―are weak in both of the linkages, and the remaining sectors
are either backward-oriented (part 2) or forward-oriented (part 3).
For part 1, FBT is among the strongest linkages, as it covers the manufacturing, processing and
preserving of food items which require inputs from various sectors, especially from agriculture.
Cambodia is endowed with various types of aquatic life and rice fields for growing crops and raising
livestock, which explains the strong backward linkages of food sectors together with the strong
forward linkages of agriculture. Processed food exports remain low but the value has increased almost
four-fold from US$16 million in 2007 to US$60 million in 2011 (MoC, 2014). Main exports in this
category are unmanufactured tobacco/cigarettes, crude palm oil and cane sugar. Other processed food
produced locally includes dried fish and meat, frozen shrimp and fish, sugar, dried packaged fruits,
Table 3 Backward-Forward Linkages of Cambodian Economy by Sector, 2011
IndustryBackward
LinkagesRank
Forward
LinkagesRank
1 AGR 1.22 12 1.88 1
2 FISH 1.25 8 1.41 5
3 MINQ 1.16 15 1.12 13
4 FBT 1.62 1 1.28 8
5 TEXTILE 1.10 17 1.06 17
6 WP 1.31 5 1.15 12
7 RP 1.49 3 1.63 2
8 METAL 1.22 13 1.19 11
9 FMETAL 1.23 10 1.41 4
10 MOTORT 1.08 18 1.07 15
11 OTHMNU 1.12 16 1.39 6
12 EGW 1.38 4 1.20 10
13 CON 1.23 11 1.10 14
14 WTT 1.25 7 1.29 7
15 HR 1.54 2 1.04 18
16 PFR 1.24 9 1.46 3
17 AEH 1.30 6 1.06 16
18 OTHSER 1.19 14 1.20 9
Average 1.27 1.27
Source: Author’s calculation, based on the I-O table

Forum of International Development Studies. 47―7 (Sep. 2016)
12
Source: Author’s calculation
Figure 1 Linkage-Oriented Classification
Table 4 Index of Power and Sensitivity of Dispersion
SectorBackward Linkages
Index Uj (Vj)Sector
Forward Linkages
Index Ui (Vi)
4 FBT 1.27 (2.94) 1 AGR 1.47 (2.70)
15 HR 1.21 (2.73) 7 RP 1.28 (3.44)
7 RP 1.17 (3.80) 16 PFR 1.15 (3.09)
12 EGW 1.08 (3.33) 9 FMETAL 1.10 (3.28)
6 WP 1.03 (3.42) 2 FISH 1.10 (3.46)
17 AEH 1.02 (3.36) 11 OTHMNU 1.09 (3.12)
14 WTT 0.98 (3.47) 14 WTT 1.01 (3.35)
2 FISH 0.98 (3.90) 4 FBT 1.00 (3.68)
16 PFR 0.98 (3.67) 18 OTHSER 0.95 (3.65)
9 FMETAL 0.97 (3.77) 12 EGW 0.94 (3.85)
13 CON 0.97 (3.50) 8 METAL 0.94 (3.81)
1 AGR 0.96 (4.13) 6 WP 0.90 (3.93)
8 METAL 0.96 (3.72) 3 MINQ 0.88 (3.92)
18 OTHSER 0.93 (3.69) 13 CON 0.86 (3.95)
3 MINQ 0.91 (3.79) 10 MOTORT 0.84 (4.01)
11 OTHMNU 0.88 (3.93) 17 AEH 0.83 (4.14)
5 TEXTILE 0.86 (4.01) 5 TEXTILE 0.83 (4.16)
10 MOTORT 0.85 (3.96) 15 HR 0.82 (4.10)
Source: Author’s calculation

Forum of International Development Studies. 47―7 (Sep. 2016)
13
cookies, noodles, ready-made canned food, and cassava preparation, whereas beverages includes spirits
and non-alcoholic drinks, rice/palm wine, beer, soybean juice, and other canned fruit juice.
Rubber plantations have increased significantly from 2009 and covered 328,771ha in 2013, which
comprised of 17 percent of Rubber Estates (former state-owned enterprises), 41 percent of economic
land concessions and another 42 percent of household rubber plantations (MAFF, 2015). The sector
yielded 85,244 tons of dry rubber production with the export of 86,052 tons in 2013, both increased
more than 100% from 2009. Although production is small scale, it is a long term streamlining agro-
industrial sector, as it is basically non-heavy and low-tech manufacturing with inputs and workers that
can be supplied locally. For instance, starting from planting, to harvesting, tapping, and processing, the
work can be done at the sites. This explains one of the reasons for the high linkages of this sector.
For part 2, HR is highly backward oriented, which is explained by the necessary intermediate inputs
from agriculture and processed food. Moreover, this industry, as the main part of the tourism sector,
connects strongly to transportation services and trade. When there is an increase in tourist arrivals,
the demand for HR will increase, which will also lead to increase demand for other related services
including telecommunications and financial and insurance systems. These interactions also give the
reason for the strong forward-orientation of other sectors: AGR, FISH, WTT and PFR , in part 3. In
addition, PFR links forward to both public and private sectors, specifically in the recent-high growth
economy of Cambodia. The connection is clear: the more technological and financial services needed
for investment and business activities, the more outputs will be added by the PFR sector as it plays an
important role in mobilizing capital and, thus, boosting investment.
Multiplier Effects on Income
The estimation categorizes labor into three skill groups: low skill, medium skill and high skill. In
agriculture and industry, a significant proportion of the income is received by low-skilled labors, while
high-skilled labors take the lead in services. The multiplier of income is first calculated for each sector
by the three skill groups separately, and later by labor as a whole, shown in Figure 2. Corresponding
to the results of the linkage indices, Food-Beverage-Tobacco has the highest income multiplier for all
the skill groups. To be precise, a unity increase of final demand for this sector would generate 4.23, 3.41,
and 4.71 income multiplier to the low-skilled, medium-skilled and high-skilled, respectively, and a 3.96
income multiplier for the total group. In other words, labors will receive 3.96 times the income per
unit of output higher than the initial level. Meanwhile, when other industrial sectors, except Metal,
contribute to low-skilled multiplier at a level of less than two, service sectors contribute relatively
higher. Hotel-Restaurant contributes up to 3.39. In contrast, the high-skilled worker income
multipliers are on average higher in industry than that in service. This phenomenon happens because
the former employs a lower proportion of high-skilled labors, which means that the number of labors
and hence the income share is low for this group. Large changes will show up even when there is a
small increase; as a result, the multipliers will stand high compared to that for the low-skilled group.

Forum of International Development Studies. 47―7 (Sep. 2016)
14
Mathematically, when the denominator yj, of equation (12) is too small for high-skilled income, ymj for
this group would be large.
There are not many changes in the trend of the income multipliers of the whole group from that
of the low-skilled. Income multipliers of all the exporters rank from 3.96 to 1.14. FBT is the highest
contributor mainly because of two reasons: 1) the linkages between this sector and the rest are notably
high (highest index of power of dispersion), and 2) the initial income level in this sector is small,
while the indirect changes are relatively large, which mathematically results in the substantial level
of multiplier. A similar result was also suggested by Kobayashi et al. (2009) that food sector has the
highest value added multiplier among all industrial sectors. The direct effects on income of AGR are
rather high in comparison to industrial sectors, explained by agriculture’s large portion of income
share, yet the indirect effects from this sector are moderate. From the results, FBT, WP and RP of
merchandise, and HR service are able to induce higher domestic income than the other sectors. Their
growth is expected to distribute higher income to broad groups including low-skilled workers. Thus,
it is preferable to put forward these sectors as potential areas for stimulation in order to gain larger
profits for future domestic investment.
Employment Intensity
The data of employment by sector is not provided in the I-O table; this data, thus, is generated
separately from the household survey (CSES, 2009) as it records each person’s occupation classified
according to the International Standard Industrial Classification (ISIC Rev. 4). The data of employment
by occupation and age are aggregated to correspond to the sectors of the I-O table. Figure 3 presents
the employment intensity per unit of final demand, based on equation (14). Direct labor refers to the
number of labors directly employed in one industry to produce one unit of output, while total labor
refers to the number of labors directly and indirectly required in and out of the industry itself if there is
Figure 2 Multiplier Effects on Income by Sectors
Source: Author

Forum of International Development Studies. 47―7 (Sep. 2016)
15
an increase in final demand for that particular industry.
Agriculture has the top rank due to abundance of labor in this rural sector, yet there is only a
minor difference between the number of direct and total labor demand―1,233 and 1,474, respectively
―suggesting that only 19 percent of the labor demand occurs out of the sector. A similar case happens
in Wood-Paper industry. In contrast, the next two sectors―Food-Beverage-Tobacco and Hotel-
Restaurant―provide high indirect employment due to the flow-on effects. For instance, the increase
in one unit of output of FBT requires only 43 workers, while 873 percent of this amount is generated
throughout the remaining sectors. MINQ, FISH, TEXTILE and OTHMNU have moderate direct
labor intensity but are listed among the least in total units due to the low interconnection in labor
generation.
Countries targeting employment maximization should consider mobilizing more resources to
sectors where labor intensities are higher since the rapid growth of productivity and employment
requirement per unit of investment in those sectors is viable (Parikh 1979). Moreover, Cambodia, as
a labor-abundant country with a relatively low cost of labor, finds this characteristic an advantage for
international competition. Therefore, investment planning in exports should obviously be devoted to
the sectors with high labor intensities, where employment maximization and export promotion can
both be achieved.
Labor requirement is also related to the import structure of each sector as, in general, a sector
Source: Author
Figure 3 Labor Intensities (per M.US$ of Final Demand)

Forum of International Development Studies. 47―7 (Sep. 2016)
16
with relatively high imports will not generate high employment. As shown in the results, the sectors
with the least labor requirements, such as FMETAL, TEXTILE and OTHMNU , have the sectoral
import size of 12, 31, and 33 percent of total imports, respectively. In contrast, AGR imports less
than one percent of total values. In this case, certain industries may never be able to expand owing
to the lack of sufficiently large demand for domestic products. Both the market expansion and labor
productivity can be improved, nevertheless, through trade and domestic specialization. Perikh (1979)
pointed out that relative price and productivity increase are the two crucial elements when projecting
results from a policy point of view. First, competitiveness in relative price increases demand for the
products and makes the sector more attractive regardless of productivity level. Second, although the
productivity varies across sectors, the lower one has potential to grow over time due to technological
absorption. The two factors can be the reasons that high labor content sectors need to be promoted
with a close link to external economies.
Foreign Exchange Earnings
Only four sectors of merchandise―one from agriculture and three from manufacturing―and
four services are the net exporters (Table 5). Hotel-Restaurant , with strong backward linkages,
contributes to 67 percent of total net exports even though its share in actual exports is only 14
percent. It should be pointed out that although TEXTILE is the main exporter covering more than
60 percent of actual total exports, this sector, owing to the large import size, shares only six percent in
total net exports―a ten-fold drop comparing to its share in actual exports. This shows the inefficiency
of this sector not only in linkages, but also in foreign currency earnings. This is because the garment
industry needs to import large amounts of fabric material, causing currency leakage, which is also
consistent with previous study (Kobayashi et al., 2009). As a result, the current largest export sector
of Cambodia is unlikely to contribute enough profit to foster potential future sectors.
Table 5 Net Exporting and Net Importing Sectors
Net Exporting Sectors Net Importing Sectors
SectorNet Exports(US$ Million)
PercentageShare inActual
Exports
PercentageShare in Net
ExportsSector
Net Exports(US$ Million)
PercentageShare inActual
Imports
PercentageShare in Net
Imports
15 HR 886.55 13.75% 66.71% 4 FBT -357.95 6.25% 39.43%18 OTHSER 213.62 3.83% 16.07% 13 CON -202.40 0.91% 22.29%14 WTT 100.05 8.36% 7.53% 9 FMETAL -108.22 12.47% 11.92%
5 TEXTILE 84.03 67.04% 6.32% 17 AEH -107.44 0.46% 11.83%16 PFR 17.81 2.38% 1.34% 11 OTHMNU -41.30 33.01% 4.55%
6 WP 15.62 0.88% 1.18% 10 MOTORT -33.79 3.85% 3.72%8 METAL 7.80 0.35% 0.59% 2 FISH -24.63 0.01% 2.71%1 AGR 3.44 1.10% 0.26% 12 EGW -20.86 0.22% 2.30%
3 MINQ -10.49 0.64% 1.16%7 RP -0.75 1.70% 0.08%
Source: Author

Forum of International Development Studies. 47―7 (Sep. 2016)
17
The result reveals the lack of self-sufficiency of manufactured goods, as only a few can manage
to produce with low import contents. In addition, the high concentration on a few sectors reflects
Cambodia’s current trade pattern. It should also be recalled that Wood-Paper and Hotel-Restaurant
are the only sectors with positive net exports which have strong backward linkages, while other
sectors such as Food-Beverage-Tobacco and Rubber-Plastic are in the net importing category.
This highlights the high dependency on imports and the neglect of linkages. This may also happen
due to the great final demand and/or the very high import coefficients of those sectors (equations 15)
(Hazari & Kingma, 1976; Mujeri & Alauddin, 1994). This requires a policy of generating adequate
linkages; otherwise, the achievement of external economy needed to accelerate a sustainable pace of
development would be difficult.
Hypothetical Extraction
The abolishment of TEXTILE would result in the highest impacts as the total outputs would
decrease by 22 percent of the total outputs before extraction (Table 6). It should be noted that the
hypothetical extraction in the study attempts to estimate only the effects on aggregate outputs, while
impacts on other socio-economic factors are not examined. This may underestimate the real total
impacts; therefore, interpretation of the result should be done with caution. Second and third sectors
are Trade-Transportation and Agriculture, which are the sectors with relatively high forward
linkages and considerably high shares in total outputs. In addition, FBT ranks moderately high, while
METAL and MOTORT rank low in this exercise, which is quite consistent with the linkage indices;
as a result, the shutdown of the latter two sectors would be less consequential. MINQ ranks at the
bottom since this sector does not have any noticeable interconnection, as it has been neither an active
producer nor exporter. Manufacturing sectors, other than TEXTILE and FBT, have modest impacts,
at 2.5 percent on average. It can be concluded that Agricul ture , Texti le and Food-Beverage-
Table 6 Hypothetical Extraction Effect on Outputs
Sector
Change in Total
Output (Δx)
(US$ Million)
Percentage
Change in Total
Output
Sector
Change in Total
Output (Δx)
(US$ Million)
Percentage
Change in Total
Output
5 TEXTILE 5,354.12 22.03% 18 OTHSER 1,059.58 4.36%
14 WTT 4,517.62 18.59% 11 OTHMNU 502.59 2.07%
1 AGR 4,003.35 16.47% 9 FMETAL 434.15 1.79%
15 HR 2,154.82 8.87% 12 EGW 308.56 1.27%
4 FBT 2,050.35 8.44% 7 RP 291.38 1.20%
16 PFR 2,030.06 8.35% 6 WP 224.33 0.92%
13 CON 2,000.78 8.23% 10 MOTORT 168.94 0.70%
2 FISH 1,469.67 6.05% 8 METAL 111.51 0.46%
17 AEH 1,459.39 6.00% 3 MINQ 93.27 0.38%
Source: Author

Forum of International Development Studies. 47―7 (Sep. 2016)
18
Tobacco goods, and Trade-Transport and Hotel-Restaurant services have the highest impacts if
they are eliminated.
Normalization Values and Ranking
Since each sector has its rank for each indicator, key sectors should be picked carefully. To provide
the final ranking, the study applies the normalization scoring approach:
s=zi-min(z)
max(z)-min(z) (0<=si<=1, i=1, ..., 18)
where z represents each indicator and zi is the value of sector i for indicator z . The normalization
value (s) gives the score to each sector in each different indicator. Finally, the study estimates the
First Principle Component to rank the sectors as shown in Table 7, where FBT, HR, AGR, RP and
EGW are the top five sector.
7. Conclusion and Implications
This study analyzed potential export sectors by applying the I-O framework, utilizing five
indicators. The study finds that Agriculture generates high employment, and Food-Beverage-
Tobacco has strong linkages, generates the largest total income multiplier and requires relatively high
Table 7 Sectoral Normalization Scores and Ranks
Sector BL FLIncome
Multiplier
Labor
Content
Net Foreign
ExchangeHEM
Principle
ComponentRank
1 AGR 0.27 1.00 0.02 1.00 0.29 0.74 2.15 3
2 FISH 0.31 0.44 0.03 0.07 0.27 0.26 -0.42 10
3 MINQ 0.14 0.10 0.01 0.08 0.28 0.00 -1.33 17
4 FBT 1.00 0.28 1.00 0.28 0.00 0.37 3.52 1
5 TEXTILE 0.03 0.03 0.02 0.05 0.36 1.00 -0.89 14
6 WP 0.43 0.13 0.13 0.28 0.30 0.02 0.02 7
7 RP 0.75 0.71 0.14 0.02 0.29 0.04 0.81 4
8 METAL 0.27 0.18 0.00 0.04 0.29 0.00 -1.06 15
9 FMETAL 0.29 0.44 0.11 0.04 0.20 0.06 -0.52 11
10 MOTORT 0.00 0.03 0.08 0.00 0.26 0.01 -1.70 18
11 OTHMNU 0.07 0.42 0.02 0.07 0.25 0.08 -1.13 16
12 EGW 0.55 0.19 0.24 0.11 0.27 0.04 0.27 5
13 CON 0.28 0.07 0.04 0.10 0.12 0.36 -0.76 12
14 WTT 0.32 0.30 0.03 0.20 0.37 0.84 0.20 6
15 HR 0.86 0.00 0.48 0.24 1.00 0.39 2.22 2
16 PFR 0.30 0.51 0.05 0.10 0.30 0.37 -0.17 8
17 AEH 0.40 0.03 0.03 0.23 0.20 0.26 -0.34 9
18 OTHSER 0.20 0.20 0.00 0.10 0.46 0.18 -0.86 13
Source: Author
Forum of International Development Studies. 47―7 (Sep. 2016)
19
labor intensity. Textile would contribute to the highest impact on total outputs, yet possesses weak
linkages. Wood-Paper and Rubber-Plastic are moderately important in most indicators. Trade-
Transportation ranks high in the last two indicators, whereas Hotel-Restaurant is the top foreign
exchange earner and is important in a few other indicators.
The findings suggest that high import dependency with the absence of technical inter-industry
linkages is a cause of concern for the export-orientation process of Cambodia. While the strong
linkage-oriented industries, such as food and rubber, have not been able to realize their full potential
in exports, the largest current industry (textile) is unlikely to contribute enough profit to foster future
growth due to the lack of inter-industrial linkages. This limited interaction is evident when net exports
are dominated by a few commodities and when most sectors with relatively high linkages in both
income and labor intensity are neither the net earners of foreign exchange nor the main contributors to
outputs. This underscores that the potential of export can be realized through the requirements of not
only diversification, but also linkage creation between sectors. This finding is consistent with previous
study by Kobayashi et al (2009) who found that agriculture, food sector, and hotels-restaurants are able
to induce wide distribution to domestic income while garment cannot secure long term distribution.
After the discussion of the sectoral pattern, the study suggests that attention should be given to the
following four key sectors with export potential: Agriculture, Food-Beverage-Tobacco, Rubber-
Plastic, and Hotel-Restaurant, which, by and large, is in line with the trade development policy of
the government toward export diversification.
The government also recognizes the importance of the above sectors while more attention should
be needed. For one thing, agriculture products: fishery, livestock and crops are among the 19 potential
products in DTIS 2007. In addition, values of agro-food export has increased gradually, accounting for
5 percent of total export in 2011 (MoC, 2014). Main export items are tobacco, cane sugar and palm
oil. The Industrial Development Plan (RGC, 2015) also targets an increase of processed agricultural
exports from eight percent of total exports in 2015 to 12 percent in 2025. With agriculture-endowment
and significant changes underway global demand for ready-made food products in Asia, Cambodia has
an opportunity to expand its agro-food industry. However, the number of items exported has been
limited, while rice and beer are the only two products listed in the DTIS, Cambodia should be able to
enlarge further its exporting items of this sector. For instance, processed meat and fruit, frozen fish
and shrimp, wine, and non-alcoholic drink have been able to enter the world market but still at an initial
stage which require improvement. Despite its potential, the processed food industry―other than the
rice sector―has received little strategic attention, with the lack of domestic investment along the
value chain. Also, national business association specific to this industry has yet existed in Cambodia
(MoC, 2014). Moreover, the industry is characterized by SMEs with emerging larger firms both
heavily focus on domestic demand, while breaking into international market has just been starting,
whereas the lack of compliance with quality standard of Sanitary and Phyto-Sanitary (SPS) measures is

Forum of International Development Studies. 47―7 (Sep. 2016)
20
a key constraint. With the challenges, encouraging investment and value addition, and improving the
quality standards should be a priority.
Rubber plantation has increased during the recent years, with 86,052 tons of exports in 2013,
almost all of which are in the form of natural rubber (MAFF, 2105; MoC, 2014).6 87 percent of formal
natural rubber exports in 2007 went to Vietnam which has suitable facility to process and re-export.
Over the past five years, however, this figure has declined to 58 percent as exports to other markets
(China and Malaysia) has grown due to significant investment efforts and expansion of the production
capacity (MoC, 2014). However, the remaining challenges are the difficulties of meeting international
standards.
The increased investment and exports of hotel-restaurant services largely attribute to the strong
tourism sector. International tourist arrivals increased from 2 million in 2007 to 4.5 million in
2014 with 68 percent of hotel occupancy (MoT, 2015). As of 2009, 60 percent of hotel rooms and
guesthouses were located in Siem Reap, while they are more limited at the coastal area, and are harder
to access in other areas of the country (MoC, 2014). Despite the low-cost of the services, issues
around the quality of food hygiene and sanitation persist. In addition, inadequate transport and tourism
infrastructure also adversely affects hotel-restaurant outputs. Leakage of revenue due to imported
inputs including agro-food product―estimated to be around 25 percent―is also putting pressure to the
contribution of this sector.
Having identified the strategic export sectors, several implications can be proposed. First, the
country should encourage production and investment of the targeted sectors, especially the food and
rubber-processing industries. This can be done through special incentives to establish factories, and
provision of subsidized infrastructure, such as parts of export-processing zones or special economic
zones. Second, increasing the supply chains of domestic agro-industrial production is required
through the establishment of a contracting system between agriculture and manufacturing and the
formation of business associations. Investment in clearing and storage houses is vital to link potential
investors with local partners/farmers via contract farming (demand-supply contract). In addition,
the establishment of geographical clusters of local business around large/foreign firms should be
encouraged, and local content requirements should be strictly imposed to increase local processing
and value added of rubber exports. Third, agro-industrial SMEs should be encouraged to be involved
in export activities. Most domestic firms, such as food-processing, small holding rubber plantations,
and hotels-restaurants are SMEs which base their operation mainly on local intermediates. Involving
them in export activities, thus, will benefit localization. Some necessary supports, such as access to
subsidized credit and duty-free measures, should be provided. Last, to achieve the objectives of export
promotion, the country should seek for quality guarantee for the four proposed industries and provide
training and technical know-how to improve compliance with international quality standards.
Forum of International Development Studies. 47―7 (Sep. 2016)
21
Notes
1 Trade deficit has persisted over two decades. The figure has slightly decreased from 11 percent of GDP in 2000 to
8 percent in 2013.
2 Diversification index is calculated in UNCTADStat by measuring the absolute deviation of the trade structure of a
country from world structure. A value closer to 1 indicates greater divergence from the world pattern (UNCTAD,
2014).
3 Normalization approach is discussed at the last part of section 6, under the subsection “Normalization Values and
Ranking”.
4 The description of each sector is given in Appendix, Table A. 3.
5 The term “industry” and “sector” are used interchangeably from this section.
6 The figure may be underestimated due to significant quantities of natural rubber exported informally across
borders (MoC, 2014).
References
Abidin, M. Z. (2000). Case Study: Malaysia. In Asian Exports (pp. 295―329). Oxford University Press (China) Ltd.
Balassa, B. (1978). Exports and economic growth: further evidence. Journal of Development Economics , 5(2),
181―189.
Hara, T. (2008). Quantitative Tourism Industry Analysis. Routledge.
Hazari, B. R. (1970). Empirical Identification of Key Sectors in the Indian Economy. The Review of Economics and
Statistics, 52(3), 301―305. http://doi.org/10.2307/1926298
Hazari, B. R., & Kingma, O. T. (1976). Trade and Linkages in Economic Development: The Position of the Agricultural
Sector in Australia and New Zealand*. Economic Record, 52(3), 362―372.
Heng, D., Senh, S., Ngim, S., Ear, S., Em, K., & Chan, T. (2014). Impacts of Cambodia’s Trade Liberalization on
Households’s Welfare and Labor Market: A CGE Analysis. Partnership for Economic Policy-PEP.
Kobayashi, S., Tanji, H., Saito, K., Huang, W., & Tada, M. (2009). Industrial Structure of Cambodia and the Role of
Agriculture and Fishery in its Development. Japan Agricultural Research Quarterly: JARQ, 43(4), 309―316.
MAFF. (2015). Agricultural Sector Strategic Development Plan 2014―2018 (Strategic Development Plan).
Ministry of Agriculture, Forestry and Fisheries.
Meller, P., & Marfán, M. (1981). Small and Large Industry: Employment Generation, Linkages, and Key Sectors.
Economic Development and Cultural Change, 29(2), 263―274.
Miller, R. E., & Blair, P. D. (2009). Input-Output Analysis: Foundations and Extensions. Cambridge University
Press.
MoC. (2007, December). Trade Related Assistance for Development and Equity. Trade Related Assistance for
Development and Equity. Ministry of Commerce and United Nations Development Programme, Cambodia.
MoC. (2014). Cambodia Trade Integration Strategy 2014―2018 (Full Report). Phnom Penh.
MoT. (2015). Tourism Statistics Report . Ministry of Tourism. Retrieved from http://www.tourismcambodia.org/
mot/index.php?view=statistic_report
Mujeri, M. K., & Alauddin, M. (1994). Trade and Linkages Using Input-Output Approach: An Empirical Investigation
of Bangladesh. The Pakistan Development Review, 75―92.
Paelinck, J., Caevel, J. de, & Degueldre, J. (1965). Analyse quantitative de certains phénomènes du développement
régional polarisé: essai de simulation statique d’itinéraires de propagation’. Prob l èmes de Convers ion Economique: Analyses Théoriques et Etudes Appliquées, 341―387.
Parikh, A. (1979). An input-output approach to the estimation of employment requirements in Europe. Empirical Economics, 4(3), 149―165. http://doi.org/10.1007/BF01764422
Ram, R. (1985). Exports and economic growth: Some additional evidence. Economic Development and Cultural

Forum of International Development Studies. 47―7 (Sep. 2016)
22
Change, 33(2), 415―425.
Rasmussen, P. N. (1956). Studies in inter-sectoral relations (Vol. 15). E. Harck.
Royal Government of Cambodia. (2015). Cambodia Industrial Development Policy 2015―2025.
Strassert, G. (1968). Zur bestimmung strategischer sektoren mit hilfe von input-output-modellen. Jahrbücher Für Nationalökonomie Und Statistik, 211―215.
Temurshoev, U. (2010). Identifying Optimal Sector Groupings with the Hypothetical Extraction Method. Journal of
Regional Science, 50(4), 872―890.
Tung, A. C. (2000). Case Study: Taipei, China. In Asian Exports (pp. 249―290). Oxford University Press.
Tyler, W. G. (1981). Growth and export expansion in developing countries: Some empirical evidence. Journal of Development Economics, 9(1), 121―130.
UNCTAD. (2012). International Trade in Goods and Services . United Nations Conference on Trade and
Development, UnctadStat. Retrieved from May 2013.
UNCTAD. (2014). International Trade in Goods and Services . United Nations Conference on Trade and
Development, UnctadStat. Retrieved from July 2014.
UNIDO. (2011). Viet Nam Industrial Competitiveness Report (Policy Advice―Industrial Policy). UNIDO and
Ministry of Industry and Trade of Viet Nam.
WDI. (2015). World Development Indicator 2015. World Data Bank . World Bank. Retrieved from http://
databank.worldbank.org/data/views/variableselection/selectvariables.aspx?source=world-development-indicator
World Bank. (2009). Cambodia Sus ta ining Rapid Growth in a Chal l enging Environment : Country Economic Memorandum (No. No. 49158―KH). Poverty Reduction and Economic Management Sector Unit, East
Asia and Pacific Region, World Bank.
WTO Secretariat. (2011). Trade Policy Review: Cambodia (Policy Review No. No. WT/TPR/S/253). World Trade
Organization.

Forum of International Development Studies. 47―7 (Sep. 2016)
23
Appendix
Table A.1 Export and Import by Categories, Share in Total Value (1995―2012)
Export (share in total) Import (share in total)
1995 2005 2012 1995 2005 2012
Primary commodities1 74.71 4.95 9.79 18.41 13.21 22.28Food items 3.99 2.42 4.90 23.83 10.14 12.91
Milled rice 0.69 0.09 1.48Beverage Tobacco 0.07 0.49 0.50
Manufactured productsLow tech/Labor-intensive/ 19.62 84.39 79.35 24.57 48.51 37.72
Garment 16.72 79.22 66.32Footwear 0.56 3.70 8.16
Bicycle/Motor-vehicle2 0.27 0.07 3.41
Medium tech 0.38 0.41 1.53 14.82 13.38 15.36High tech 0.77 7.64 4.46 16.91 13.41 11.25
Note: 1 excludes food items, 2 includes exports of second hand vehiclesSource: Unctad, 2014
Table A.2 Positioning Levels of the 19 Products and Servicers
Export potential Human development
Estimatedexport in 2005
($ 1,000)
1. Exportperformance
2. Worldmarkets
3. Domesticsupply
condition
Export potentialassessment
(average 3 indices)
Estimatedemployment
4. Humandevelopmentassessment
List 1
Garments 2,610,766 H (5.0) H (3.5) H (3.8) High (4.1) 360,000 HighFootwear 156,513 H (4.1) M (3.1) H (3.5) High (3.6) 4,500 MediumCassava 13,000 L (1.2) H (5.0) H (3.5) High (3.5) 4,000 LowRubber 9,095 L (1.2) H (3.9) H (4.5) High (3.2) 40,000 MediumFishery 100,000 M (3.0) M (2.7) H (3.5) Medium (3.1) 260,000 Medium-HighRice 200,000 H (5.0) L (1.2) M (3.0) Medium (3.1) 2,940,000 Medium-HighSoybeans 34,000 L (1.7) H (3.4) M (3.0) Medium (2.7) 16,500 Low-MediumCashew nuts 50,000 L (2.0) M (2.7) M (3.0) Low (2.6) 12,000 MediumSilk 4,000 L (1.1) M (2.7) L (2.3) Low (2.0) 20,500 Medium-HighLivestock 19,000 L (1.4) M (3.1) L (1.3) Low (1.9) 400,000 MediumCorn 25,000 L (1.5) L (1.2) L (2.5) Low (1.7) 12,500 Low-MediumBeer 975 L (1.0) M (2.8) L (1.0) Low (1.6) 3,000 Low
List 2
Fruits and vegetables 269 L (1.0) H (3.2) Medium Medium .. Medium-HighWood products 5,547 L (1.1) M (2.9) Medium Medium .. MediumLight manufacturing 3,336 L (1.1) H (3.3) Medium Medium .. MediumTourism .. High High Medium High .. HighLabour services .. Medium High Medium Medium .. MediumWeb-based services .. Low High Low Low .. LowTransport services .. Low Medium Low Low .. Low
Note: List 1=Currently-Exported Products, List 2=Services and Non-Exported ProductsIndexes range from 1 (lowest ranking) to 5 (highest ranking). Product sectors rank “high” with an index of more than 3.1, medium with an index between 2.7 and 3.1, or low with an index of less than 2.7. “n.a”=not applicable. The composite indexes for livestock and beer do not take into account domestic supply conditions and socio-economic impact due to lack of comparable data.Source: MoC, 2007

Forum of International Development Studies. 47―7 (Sep. 2016)
24
Table A.3 18 Sectors in the I-O Table of Cambodia, 2011
Number Sector Description
1 AGR Agriculture, Hunting, Forestry, and Related Service Activities
Agriculture 2 FISH Fishing, Aquaculture, and Service Activities Incidental to Fishing
3 MINQ Mining and Quarrying
Industry
4 FBT Manufacture of Food Products, Beverages, and Tobacco
5 TEXTILE Manufacture of Textiles, Wearing Apparel, and Footwear
6 WP Manufacturing of Wood, Wood Products, Paper, and Paper Products
7 RP Manufacture of Rubber and Plastic Products
8 METAL Manufacture of Basic Metals
9 FMETAL Manufacture of Fabricated Metal Products; and Office and Computing
Machinery
10 MOTORT Manufacture of Motor Vehicles and Other Transport Equipment
11 OTHMNU Other Manufacturing
12 EGW Electricity, Gas, and Water Supply
13 CON Construction
14 WTT Wholesale, Retail Trade, and Transport Service
Service
15 HR Hotels and Restaurants
16 PFR Post and telecommunications, Financial intermediation and insurance, Real
estate, renting and business services
17 AEH Public administration and defense, Education, Health and social work
18 OTHSER Other Community Service Activities
Table A.4 Structural Feature of Cambodian Economy, 2011
Sector Production Valueadded
Export Import Exportintensity
Importintensity
Employment Laborincome
1 AGR 16.05 23.42 1.10 0.65 2.05 1.33 64.45 41.132 FISH 5.59 7.34 0.04 0.01 0.23 0.03 1.53 6.733 MINQ 0.34 0.45 0.00 0.62 0.15 59.88 0.13 0.234 FBT 5.81 3.66 0.41 6.10 2.09 34.68 0.82 1.905 TEXTILE 20.89 13.36 67.04 31.34 95.98 49.58 5.42 6.226 WP 0.75 0.65 0.88 1.90 35.12 83.68 0.72 0.567 RP 1.08 0.57 0.08 1.65 2.33 50.56 0.01 0.738 METAL 0.40 0.30 0.35 1.45 25.91 118.53 0.08 0.419 FMETAL 1.59 1.34 0.53 12.31 10.01 255.33 0.32 0.5310 MOTORT 0.65 1.02 0.15 3.76 7.09 190.97 0.02 0.0911 OTHMNU 1.92 2.15 1.03 33.27 16.08 571.88 0.61 0.8812 EGW 1.01 0.48 0.00 0.22 0.00 7.34 0.42 0.3013 CON 6.85 6.30 0.05 0.93 0.22 4.50 2.76 4.3414 WTT 15.36 15.62 8.36 3.27 16.28 7.04 11.82 18.0315 HR 5.77 4.18 13.75 0.03 71.26 0.19 2.32 2.8116 PFR 7.29 8.94 2.38 1.67 9.76 7.59 2.28 5.4817 AEH 4.82 5.14 0.00 0.47 0.00 3.24 4.68 5.0618 OTHSER 3.83 5.09 3.83 0.33 29.92 2.84 1.62 4.58
Total 100.00 100.00 100.00 100.00 100.00 100.00
Note: Full description of the sectors is given in Table A.3Source: 2011 SAM, Employment data is obtained from CSES, 2009


