EURASIP Journal on Applied Signal Processing 2004:1, 29–42 c 2004 Hindawi Publishing Corporation Spectrogram Analysis of Genomes David Sussillo Department of Electrical Engineering, Columbia University, NY 10027, USA Email: [email protected]Anshul Kundaje Department of Electrical Engineering, Columbia University, NY 10027, USA Email: [email protected]Dimitris Anastassiou Department of Electrical Engineering, Center for Computational Biology and Bioinformatics (C2B2) and Columbia Genome Center, Columbia University, NY 10027, USA Email: [email protected]Received 28 February 2003; Revised 22 July 2003 We perform frequency-domain analysis in the genomes of various organisms using tricolor spectrograms, identifying several types of distinct visual patterns characterizing specific DNA regions. We relate patterns and their frequency characteristics to the sequence characteristics of the DNA. At times, the spectrogram patterns can be related to the structure of the corresponding protein region by using various public databases such as GenBank. Some patterns are explained from the biological nature of the corresponding regions, which relate to chromosome structure and protein coding, and some patterns have yet unknown biological significance. We found biologically meaningful patterns, on the scale of millions of base pairs, to a few hundred base pairs. Chromosome-wide patterns include periodicities ranging from 2 to 300. The color of the spectrogram depends on the nucleotide content at specific frequencies, and therefore can be used as a local indicator of CG content and other measures of relative base content. Several smaller-scale patterns are found to represent different types of domains made up of various tandem repeats. Keywords and phrases: DNA spectrograms, frequency-domain analysis, genome analysis. 1. INTRODUCTION Color spectrograms of biomolecular sequences were intro- duced in [1, 2] as visualization tools providing information about the local nature of DNA stretches. These spectrograms give a simultaneous view of the local frequency throughout the nucleotide sequence, as well as the local nucleotide con- tent indicated by the color of the spectrogram. They are help- ful not only for the identification of genes and other regions of known biological significance, but also for the discovery of yet unknown regions of potential significance, character- ized by distinct visual patterns in the spectrogram that are not easily detectable by character string analysis. Further, they have been found to give global information about whole chromosomes as well. In this paper, we discuss the features and patterns that such spectrograms reveal. We applied a slightly modified version (described below) of the spectrogram development tool introduced in [1, 2] that provides a more direct man- ifestation of the local relative nucleotide content in the color of the spectrogram, and explored the patterns char- acteristic in the genomes of various organisms. We created color spectrograms of various frequency bandwidths and se- quence lengths. Although the genomes of these organisms vary greatly in size, chromosome number, and complexity, we found many interesting features, some of which are com- mon to all organisms and some are unique to a particular or- ganism. Some of the uncovered patterns relate to the overall chromosome structure or to protein coding. On some occa- sions, the specific function of a protein could be understood by visual comparison to other proteins. We analyzed some parts of the genomes from E. coli, M. tuberculosis, S. cerevisiae, P. falciparum, C. elegans, D. melanogaster, and H. sapiens, viewing chromosomes and chromosome subsequences using the tricolor spectrogram with as much or as little frequency and sequence resolution as necessary. We allowed zooming in and out in both the fre- quency and sequence dimensions, thus facilitating easy navi- gation of DNA that is normally intimidating in its complex- ity. A set of colors was initially chosen for the four different bases to maximize the discriminatory power of the spectro- gram. Depending on the pattern, we adjusted the frequency
David SussilloDepartment of Electrical Engineering, Columbia University, NY 10027, USAEmail: [email protected]
Anshul KundajeDepartment of Electrical Engineering, Columbia University, NY 10027, USAEmail: [email protected]
Dimitris AnastassiouDepartment of Electrical Engineering, Center for Computational Biology and Bioinformatics (C2B2) and Columbia Genome Center,Columbia University, NY 10027, USAEmail: [email protected]
Received 28 February 2003; Revised 22 July 2003
We perform frequency-domain analysis in the genomes of various organisms using tricolor spectrograms, identifying severaltypes of distinct visual patterns characterizing specific DNA regions. We relate patterns and their frequency characteristics to thesequence characteristics of the DNA. At times, the spectrogram patterns can be related to the structure of the correspondingprotein region by using various public databases such as GenBank. Some patterns are explained from the biological nature ofthe corresponding regions, which relate to chromosome structure and protein coding, and some patterns have yet unknownbiological significance. We found biologically meaningful patterns, on the scale of millions of base pairs, to a few hundred basepairs. Chromosome-wide patterns include periodicities ranging from 2 to 300. The color of the spectrogram depends on thenucleotide content at specific frequencies, and therefore can be used as a local indicator of CG content and other measures ofrelative base content. Several smaller-scale patterns are found to represent different types of domains made up of various tandemrepeats.
Keywords and phrases: DNA spectrograms, frequency-domain analysis, genome analysis.
1. INTRODUCTION
Color spectrograms of biomolecular sequences were intro-duced in [1, 2] as visualization tools providing informationabout the local nature of DNA stretches. These spectrogramsgive a simultaneous view of the local frequency throughoutthe nucleotide sequence, as well as the local nucleotide con-tent indicated by the color of the spectrogram. They are help-ful not only for the identification of genes and other regionsof known biological significance, but also for the discoveryof yet unknown regions of potential significance, character-ized by distinct visual patterns in the spectrogram that arenot easily detectable by character string analysis. Further,they have been found to give global information about wholechromosomes as well.
In this paper, we discuss the features and patterns thatsuch spectrograms reveal. We applied a slightly modifiedversion (described below) of the spectrogram developmenttool introduced in [1, 2] that provides a more direct man-ifestation of the local relative nucleotide content in thecolor of the spectrogram, and explored the patterns char-
acteristic in the genomes of various organisms. We createdcolor spectrograms of various frequency bandwidths and se-quence lengths. Although the genomes of these organismsvary greatly in size, chromosome number, and complexity,we found many interesting features, some of which are com-mon to all organisms and some are unique to a particular or-ganism. Some of the uncovered patterns relate to the overallchromosome structure or to protein coding. On some occa-sions, the specific function of a protein could be understoodby visual comparison to other proteins.
We analyzed some parts of the genomes from E. coli,M. tuberculosis, S. cerevisiae, P. falciparum, C. elegans, D.melanogaster, and H. sapiens, viewing chromosomes andchromosome subsequences using the tricolor spectrogramwith as much or as little frequency and sequence resolutionas necessary. We allowed zooming in and out in both the fre-quency and sequence dimensions, thus facilitating easy navi-gation of DNA that is normally intimidating in its complex-ity. A set of colors was initially chosen for the four differentbases to maximize the discriminatory power of the spectro-gram. Depending on the pattern, we adjusted the frequency
and sequence resolutions so that the prominent frequencieswere accurately highlighted and thus we were able to viewdifferent features of the chromosome with great precision.When possible, we referenced the subsequence from whichthe pattern was created with various public databases to fur-ther ascertain the function of the region. We then annotatedthe patterns with the type of pattern, prominent periodici-ties, position in the chromosomal DNA sequence, and cor-responding position in the protein sequence if the DNA wascoding. Thus, we related pattern shape and color to signifi-cant structural and functional elements in the genome. Mostof our searches were exhaustive, and the patterns shown inthis paper are exemplary of myriad patterns in the variousgenomes.
The spectrograms were developed using the short-timeFourier transform, that is, by applying the N-point discreteFourier transform (DFT) over a sliding window of size N .The difficulty in creating DNA spectrograms results fromthe fact that DNA sequences are defined by character stringsrather than numerical sequences. This problem can be solvedby considering the binary indicator sequences uA[n], uT[n],uC[n], and uG[n], taking the value of either one or zero de-pending on whether or not the corresponding character ex-ists at location n. These four sequences form a redundant setbecause they add to 1 for all n. Therefore, any three of thesesequences are sufficient to determine the character string. In[1, 2], color spectrograms are defined by creating RGB super-position, using the colors red, green, and blue, of the spectro-grams for the numerical sequences
in which, to enhance the discriminating power of the visual-ization, the coefficients in the above equations are chosen byassigning each of the four letters to a vertex of a regular tetra-hedron in the three-dimensional space. In the present im-plementation, we further improve the discriminating powerby ensuring that all points in the tetrahedron have differentabsolute values with respect to any axis using the followingchoice of coefficients:
To illustrate, we first consider three examples that demon-strate both the use of color and periodicity in the spectro-gram. The horizontal axis indicates the location in the DNAsequence measured in base pairs (bp) from the origin andthe vertical axis indicates the discrete frequency of the DFTmeasured in cycles per STFT window size. The correspond-ing period is equal to N/k, where k is the discrete frequencyand N is the STFT window size.
Unlike the traditional spectrograms that employ pseudo-color to achieve greater contrast, the spectrograms that areused to visualize DNA sequences contain useful information
Random 1 60000 60 K 10000 500 1 500
50
100
150
200
250
300
350
400
450
5000 1 2 3 4 5 6
×104
Figure 1: Spectrogram of a random DNA sequence of length60 kbp. No obvious patterns are discernable. Spectrogram titles areannotated with a helpful name or accession tag, sequence-start in-dex, sequence-end index, approximate sequence length, DFT win-dow size, window overlap, lowest frequency shown in image, andhighest frequency shown in image.
Random with bases 1 60000 60 K 1000 500 60 12260
70
80
90
100
110
120
0 1 2 3 4 5 6×10⁴
Figure 2: Spectrogram of random DNA of length 60 kbp with basesA, T , C, and G with periods 15, 13, 11, and 9, respectively. The nu-cleotide A is represented by the color blue, T by red, C by green, andG by yellow. Arrows mark the different periodicities.
encoded in color. The colors for the nucleotides A, T , C,and G are blue, red, green, and yellow, respectively. Thesecolors were chosen to optimize the discrimination betweendifferent nucleotides. As a rule of thumb, the interaction be-tween the various nucleotides is visualized as the superpo-sition of colors representing those nucleotides. Thus, a se-quence composed of ATATAT . . . would have a purple barat the frequency corresponding to period 2. The first spec-trogram (Figure 1) shows a spectrogram created from a se-quence of 60000 “totally random” nucleotides. The sequencewas created from an independent identically and uniformlydistributed random sequence model so that every positionhas equal chance of being an A, T , C, or G. No obviouspatterns are noticeable. The second spectrogram (Figure 2)shows the same sequence as the first but with a modification
Spectrogram Analysis of Genomes 31
NC 000913 1 4639221 5 M 10000 0 1 5000
500
1000
1500
2000
2500
3000
3500
4000
4500
50000 0.5 1 1.5 2 2.5 3 3.5 4 4.5
×106
Figure 3: Spectrogram of the entire E. coli K12 chromosome (about 4.6 Mbp). The line marking the 3-base periodicity of protein-codingregions extends without a visible break across the entire chromosome. There is a change in color going from higher frequencies (greenish)to lower frequencies (purplish).
so that every 15 nucleotides, there is an A; every 13 nu-cleotides, there is a T ; every 11 nucleotides, there is a C; andevery 9 nucleotides, there is a G. This figure demonstratesthat even in complicated sequences, A is mapped by the colorblue, T by red, C by green, and G by yellow.
2. CHROMOSOME-WIDE PATTERNS
Distinguishing patterns by their size makes a simple cate-gorization. Those patterns composed of millions of bp areconsidered large; those that are composed of up to sev-eral hundred thousand nucleotides are medium; and thosepatterns consisting of up to several thousand bp are small.Typically, larger patterns represent structural elements andsmaller patterns are useful in visualizing something about aprotein-coding region. Here, we focus first on large patterns.In doing so, we focus on the general characteristics of thechromosome-wide spectrogram.
2.1. E. coli
Figure 3 shows the spectrogram of the entire chromosomefor the bacteria E. coli using STFT window size N = 10 000.The count among all nucleotides in E. coli is roughly equal(A=1142136,T=1140877,C=1179433,G=1176775) and thetotal number of nucleotides is over 4.6 Mbp. The most salientfeature is the strong intensity with periodicity 3 (frequency3333) that corresponds to protein-coding regions. The factthat protein-coding regions in DNA typically have a peakat the frequency of 3 periodicity in their Fourier spectra is
well known [3, 4, 5, 6]. The whiteness of this line showsthat most of the bases are being used in protein coding, andthis is clearly reflected by the continuity and intensity of theline with periodicity 3. Second, at regular intervals along theDNA sequence, there appear thin veins of purple, imply-ing AT rich areas intermittently placed along chromosome.Finally, there is a general shift in hue as the frequency de-creases. The larger frequencies are more greenish in hue andthe lower frequencies are more purplish. The purplish hueextends over from about the 6.5-base periodicity and up-wards and shows that even while apparently coding for genesalmost everywhere on the chromosome, the chromosome isalso preserving higher periodicities involving the nucleotidesA and T . This is particularly interesting considering that thetotal number of each of the four bases in the genome is nearlyequal. The purplish hue in the lower frequencies may be re-lated to the twisting of the DNA molecule that leads to helicalrepeats.
2.2. C. elegans chromosome III
We now turn our attention to the multicellular organismC. elegans. Figure 4 shows the DNA spectrogram of chro-mosome III. The general hue of the spectrogram is darkerthan that of E. coli. This relates directly to the relative num-ber of bases in chromosome III (A=4444502, T=4423430,C=2449072, G=2466240). The horizontal line of intensitymarking the 3-base periodicity is much less pronouncedthan E. coli in that there are more gaps along the sequence.This is consistent with the general rule that eucaryotic DNA
32 EURASIP Journal on Applied Signal Processing
C. elegans III 1 13783268 14 M 10000 0 1 5000
500
1000
1500
2000
2500
3000
3500
4000
4500
50000 2 4 6 8 10 12 ×106
Figure 4: Spectrogram of the chromosome III of C. elegans (13.8 Mbp). The 3-base periodicity relating to protein coding is noted. A mini-satellite is noticeable at 7.4 Mbp (see Figure 16). Various periodicities are noticeable, in particular, the purple 10+-base periodicity in bothchromosome arms and coincident 8, 9-base and green 3.8-base periodicities in the right chromosome arms.
contains more noncoding DNA such as intergenic DNA andintrons. In the middle of the spectrogram, there is a verticalbar that identifies a “minisatellite,” roughly 50 kbp in length.The details of minisatellites are explained in Section 3.1. Onsome regions, there are strong horizontal bands of intensitybetween the frequencies representing the 8-base periodicityand 9-base periodicity (at 8.7) and also just above 10 (at10.2, which we call the “10+ periodicity”) throughout the en-tire chromosome. In the right part of the spectrogram, (closeto 12 Mbp) there are strong periodicities involving the colorgreen and thus the bases GC at 3.9.
The 10+ periodicity appears to be of special importance.Figure 5 shows the magnitude plot of the DFT for the fournucleotides in the subsequence 1456174−1596391. Each sep-arate base is plotted with a different color. The frequencyrange shown corresponds to periods 8 through 12. The pe-riodicities at 10+ are the strongest in the bases A & T (areaindicated by arrow). This periodicity may relate to DNA he-lical structure, which has a periodicity of 10.4 bp on average[7, 8, 9, 10]. The 10+ periodicity may also be related to fold-ing around nucleosomes, as the nucleotides A and T are pre-ferred in the minor grove when binding to the nucleosomecore. The DNA double helix kinks when wrapped aroundthe nucleosome core, thus reducing its helical periodicity to10.39±0.02 bp [9]. We found that the maximal intensity ofthis band has a 10.2-base periodicity.
We further searched chromosome III of C. elegans atmuch lower frequencies and found a 1.5 Mbp long (0.8 Mbp–
C elegans III 1456174 1596391 140 K1000
900
800
700
600
500
400
300
200
100
01.1 1.2 1.3 1.4 1.5 1.6 1.7 1.8
×104
Figure 5: DFT magnitude plot of 140 Kbp section of C. eleganschromosome III showing higher values at period 10+ in all bases,but particularly A and T . An arrow marks the peak in the periodic-ity range of 9.9–10.5.
2.6 Mbp subsequence) bubble centered on period 300. Thiswas accomplished using a DFT window size of 40000.Figure 6 shows this spectrogram with the two bubbles cen-tered at period 300 marked by arrows. This was the only ex-ample of a periodicity found around 300 and it is unclearwhat biological significance the bubble may have. Figure 7
Spectrogram Analysis of Genomes 33
C elegans III 787206 2600147 2 M 40000 32500 15 301
50
100
150
200
250
3000.8 1 1.2 1.4 1.6 1.8 2 2.2 2.4 2.6
×106
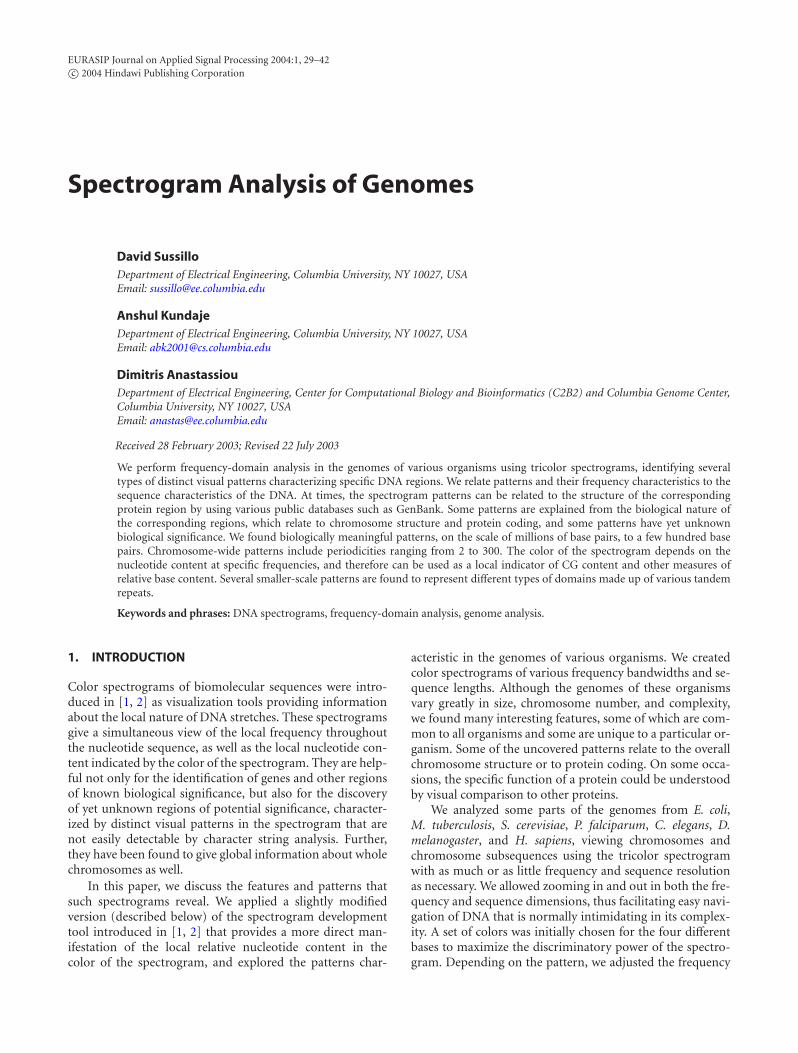
Figure 6: Spectrogram showing an intensity increase around a pe-riodicity of 300 in C. elegans chromosome III. The sequence isroughly 2 Mbp in length. Arrows mark two such areas.
C elegans III 1283546 1711644 428 K 510 0 1 257
50
100
150
200
2501.3 1.35 1.4 1.45 1.5 1.55 1.6 1.65 1.7
×106
Figure 7: Spectrogram showing a strong coincident 10+-base peri-odicity in the same DNA sequence shown in Figure 6 (coincidentwith 300-base periodicity). This spectrogram corresponds to therightmost arrow in Figure 6 and is 428 Kbp in length.
shows the same area of the chromosome (1.4 Mbp–1.6 Mbp)at higher frequency resolution, thus showing smaller period-icities. There appears to be coincident intensity at 10+ periodin exactly the same area of intensity in the 300-period bubble.
In general, it appears that there are both “antago-nism” and “cooperation” between various periodicities inall the chromosomes that we analyzed. For example, thearms of C. elegans chromosome III show obvious cooper-ation among many periodicities appearing simultaneously(Figure 7). Some cooperative periodicities are harmonics ofa fundamental periodicity, indicating a repeat region (seeSection 3.1). On the other hand, Figure 8, a subsection ofchromosome V of C. elegans, shows an example of antago-nism between the 3-base periodicity and the 10+-base pe-
C elegans V 17794452 18103141 309 K 600 300 38 20940
60
80
100
120
140
160
180
200
1.78 1.785 1.79 1.795 1.8 1.805 1.81×10⁷
Figure 8: Spectrogram showing antagonism between 10+-base and3-base periodicities in C. elegans chromosome III (300 Kbp). The10+-base periodicity is at the top of the figure while the 3-base pe-riodicity is shown at the very bottom.
C elegans III 11862447 12051402 189 K 990 790 56 36618
12
8.5
6.8
5.6
4.8
4.2
3.7
3.3
3
2.81.188 1.192 1.196 1.2 1.204
×107
Figure 9: Spectrogram of 189 Kbp section of the right arm of C. ele-gans chromosome III. Note that the periodicity is shown on the ver-tical scale. The arrows point to sections of the spectrogram, show-ing a single instance of the highly dispersed repeat family. Varia-tions of the pattern can be seen throughout the spectrogram. Apurple 8.75-base periodicity, as well as a green 3.9-base periodic-ity, identifies this family of strings. The harmonics between 3.9 and8.75 (the beads of color between 3.9 and 8.75) change color fromone repeat to another, indicating that they are different but relatedstrings. These tandem repeats are non-protein-coding regions. The10+-base periodicity is antagonistic with the repeat family. This pat-tern is found over 3 Mbp of the right arm of the chromosome.
riodicity. The brightest spots on the 3-base periodicity arethe dimmest spots on 10+-base periodicity and vice versa.An explanation may be that in non-protein-coding regions,the periodicities due to structural constraints are more pro-nounced.
We identified a unique family of repeats in chromosomeIII via cooperation among periodicities. In the right arm of
34 EURASIP Journal on Applied Signal Processing
Human XXII 1 33821705 34 M 10000 0 1 5000
500
1000
1500
2000
2500
3000
3500
4000
4500
50000 0.5 1 1.5 2 2.5 3 ×10⁷
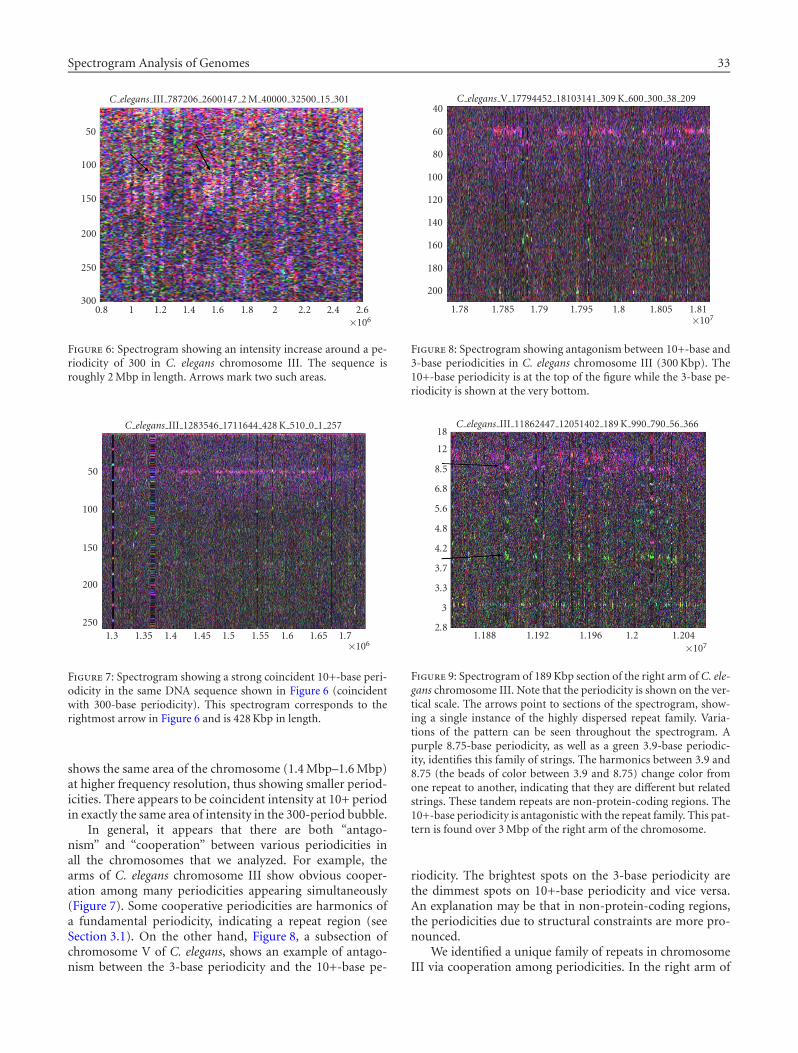
Figure 10: Spectrogram of human chromosome 22. Noticeably absent is the line representing the 3-base periodicity relating to proteincoding. The 800 or so genes located on chromosome 22 simply do not cover enough of the chromosome to make a visible line at theresolution of 34 Mbp. Many periodicities are visible across the entire length of the chromosome.
chromosome III (10–13 Mbp), it appears that the AT rich8.75-base periodicity almost always coincides with the GC-rich 3.9-base periodicity (Figure 4). In fact, the pattern foundin the right arm of chromosome III, which shows cooperativeperiodicities at the chromosome level, is composed of a fam-ily of strings that are repeated in a very haphazard fashion.These strings are both heavily mutated and heavily dispersedthroughout the chromosome. Yet throughout the many vari-ations within the family, the 8.75-base and 3.9-base period-icities are always conserved. One instance of a repeat unitis “tttccggcaaattggcaagctgtcggaatttaaaa.” Figure 9 shows howthe family of strings manifests within the DNA. An instanceof the family repeats for a hundred to a couple thousand bp,and these regions are interspersed among other DNA every10 Kbp or so. Repeats of this family of mutated strings, un-believably, are responsible for the macroscopic character ofthe right arm (3 Mbp region) of chromosome III (Figure 4).It is unclear whether or not the conserved periodicities implya conserved biological function for the string, or whether itis simply a mathematical or biological property of this fam-ily of strings that certain of its periodicities are more easilypreserved against mutation.
2.3. Human chromosome 22
The last full chromosome we analyzed was human chromo-some 22. The actual sequence used was the correct reorder-ing of contigs found in hs chr22.fa from NCBI. This orderingis: NT 011516.5, NT 028395.1, NT 011519.9, NT 011520.8,
NT 011521.1, NT 011522.3, NT 011523.8, NT 030872.1,NT 011525.4, NT 019197.3, and NT 011526.4. Figure 10shows the 33 million-plus nucleotides of human chromo-some 22. A strong bar of intensity representing the 3-baseperiodicity is strikingly absent. Closer inspection shows thatthere are many genes along chromosome 22 but they are farenough apart so that there is no noticeable band. There arearound 30 easily noticeable, different periodicities that spanthe entire length of the chromosome. The biological func-tion of these periodicities is unclear. Some periodicities mayreflect higher periodicities in the form of harmonics.
The higher structures in DNA folding are unknown, sowe were interested in determining whether or not spectro-gram analysis would yield any insights into the DNA fold-ing and superstructure. It is known that DNA has many or-ders of structure [11]. The simplest of such a superstruc-ture is that of the nucleosome. Nucleosomes are an essen-tial structural element in DNA: 146 bp wrap twice arounda single nucleosome core particle, and between two nucleo-somes, there is “linker” DNA that ranges in size but on thewhole, nucleosomes repeat at intervals of about 200 bp. Nu-cleosome core particles will bind randomly along a sequenceof DNA. However, AT rich sequences in the minor grooveof DNA bind preferentially to the nucleosome core parti-cle. Since euchromatic DNA is arranged in nucleosomes thatrequire structural bending of the DNA, it is plausible thatthere might be some evidence of this structure in the formof a strong band with intensity of 200-base periodicity. We
Spectrogram Analysis of Genomes 35
NT 011520 8 1 23083944 23 M 40000 0 1 20000
150
200
250
300
350
400
4500.2 0.4 0.6 0.8 1 1.2 1.4 1.6 1.8 2 2.2
×107
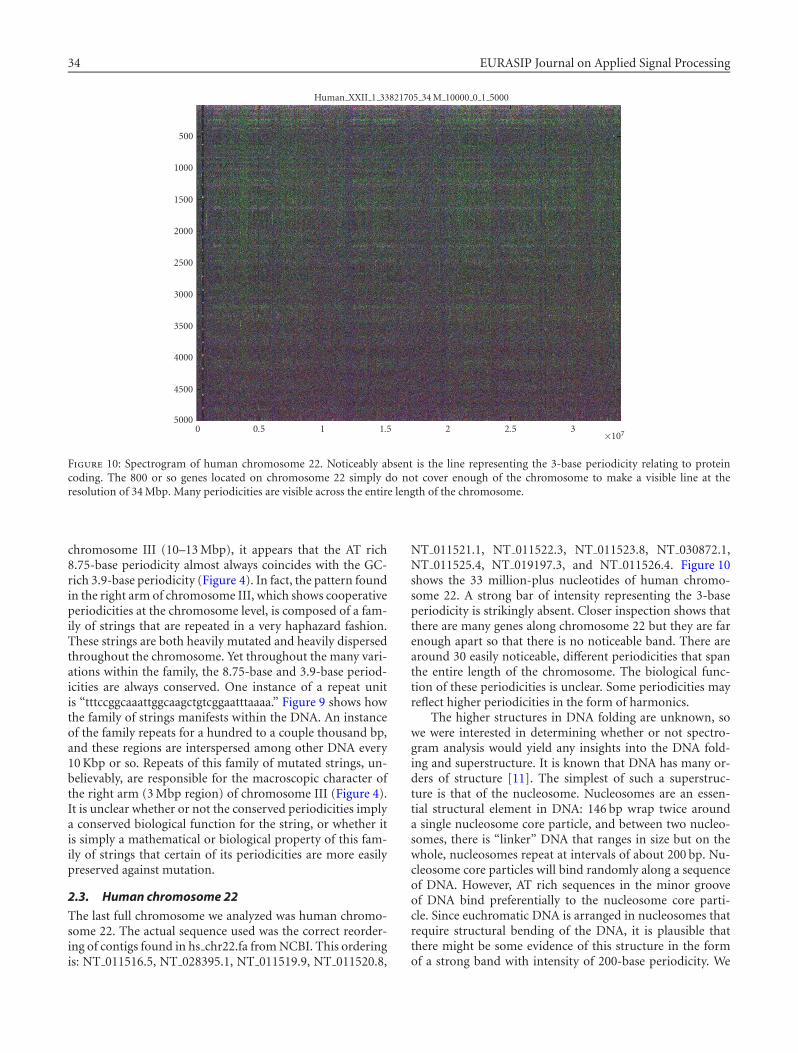
Figure 11: NT 011520.8 (23 Mbp in length) of human chromo-some 22. The two artificial black lines mark the 150-base and 200-base periodicities. This band of intensity may relate to the foldingof DNA into nucleosomes.
Human XXII 1 33821705 34 M 10000 0 1 5000
500
1000
1500
2000
2500
3000
3500
4000
4500
50000 0.5 1 1.5 2 2.5 3
×107
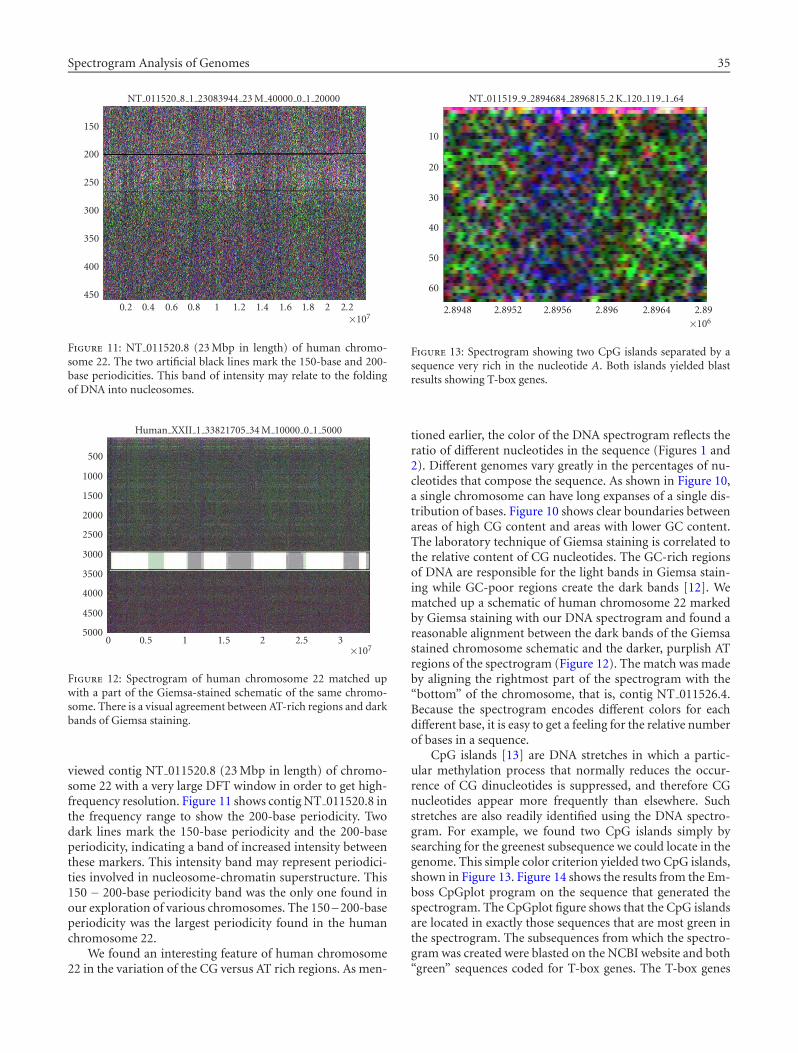
Figure 12: Spectrogram of human chromosome 22 matched upwith a part of the Giemsa-stained schematic of the same chromo-some. There is a visual agreement between AT-rich regions and darkbands of Giemsa staining.
viewed contig NT 011520.8 (23 Mbp in length) of chromo-some 22 with a very large DFT window in order to get high-frequency resolution. Figure 11 shows contig NT 011520.8 inthe frequency range to show the 200-base periodicity. Twodark lines mark the 150-base periodicity and the 200-baseperiodicity, indicating a band of increased intensity betweenthese markers. This intensity band may represent periodici-ties involved in nucleosome-chromatin superstructure. This150 − 200-base periodicity band was the only one found inour exploration of various chromosomes. The 150−200-baseperiodicity was the largest periodicity found in the humanchromosome 22.
We found an interesting feature of human chromosome22 in the variation of the CG versus AT rich regions. As men-
NT 011519 9 2894684 2896815 2 K 120 119 1 64
10
20
30
40
50
60
2.8948 2.8952 2.8956 2.896 2.8964 2.89×10⁶
Figure 13: Spectrogram showing two CpG islands separated by asequence very rich in the nucleotide A. Both islands yielded blastresults showing T-box genes.
tioned earlier, the color of the DNA spectrogram reflects theratio of different nucleotides in the sequence (Figures 1 and2). Different genomes vary greatly in the percentages of nu-cleotides that compose the sequence. As shown in Figure 10,a single chromosome can have long expanses of a single dis-tribution of bases. Figure 10 shows clear boundaries betweenareas of high CG content and areas with lower GC content.The laboratory technique of Giemsa staining is correlated tothe relative content of CG nucleotides. The GC-rich regionsof DNA are responsible for the light bands in Giemsa stain-ing while GC-poor regions create the dark bands [12]. Wematched up a schematic of human chromosome 22 markedby Giemsa staining with our DNA spectrogram and found areasonable alignment between the dark bands of the Giemsastained chromosome schematic and the darker, purplish ATregions of the spectrogram (Figure 12). The match was madeby aligning the rightmost part of the spectrogram with the“bottom” of the chromosome, that is, contig NT 011526.4.Because the spectrogram encodes different colors for eachdifferent base, it is easy to get a feeling for the relative numberof bases in a sequence.
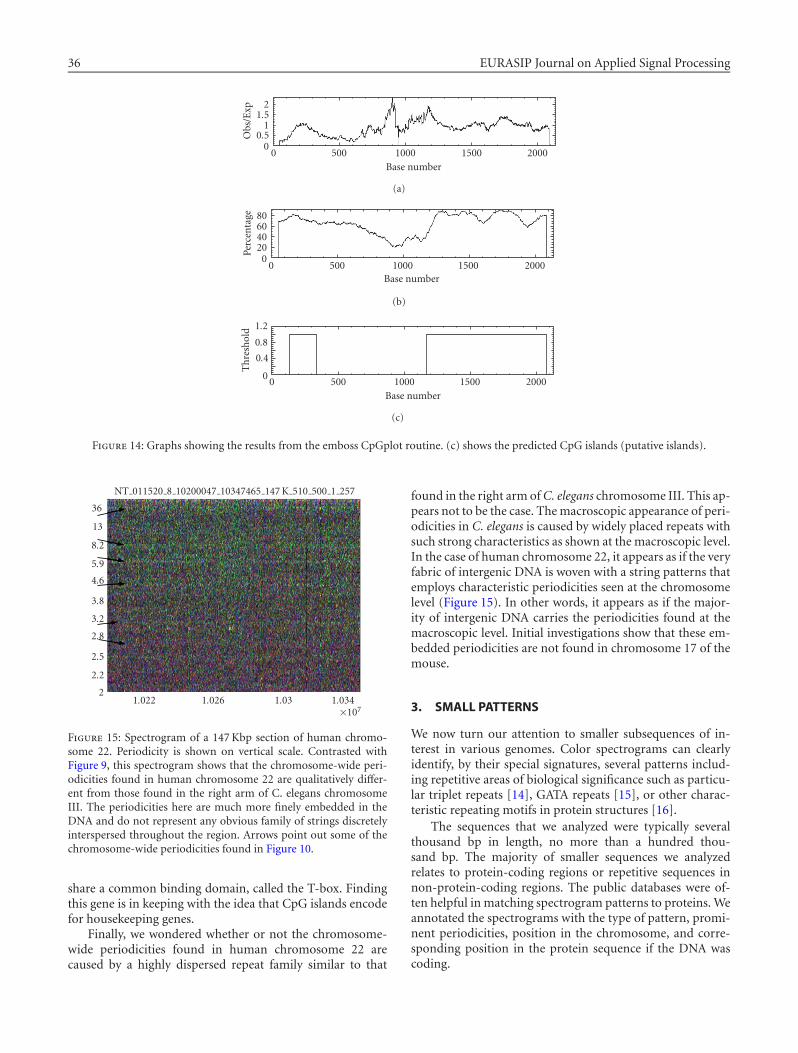
CpG islands [13] are DNA stretches in which a partic-ular methylation process that normally reduces the occur-rence of CG dinucleotides is suppressed, and therefore CGnucleotides appear more frequently than elsewhere. Suchstretches are also readily identified using the DNA spectro-gram. For example, we found two CpG islands simply bysearching for the greenest subsequence we could locate in thegenome. This simple color criterion yielded two CpG islands,shown in Figure 13. Figure 14 shows the results from the Em-boss CpGplot program on the sequence that generated thespectrogram. The CpGplot figure shows that the CpG islandsare located in exactly those sequences that are most green inthe spectrogram. The subsequences from which the spectro-gram was created were blasted on the NCBI website and both“green” sequences coded for T-box genes. The T-box genes
36 EURASIP Journal on Applied Signal Processing
00.5
11.5
2
Obs
/Exp
0 500 1000 1500 2000Base number
(a)
020406080
Perc
enta
ge
0 500 1000 1500 2000Base number
(b)
1.2
0.8
0.4
0
Th
resh
old
Base number0 500 1000 1500 2000
(c)
Figure 14: Graphs showing the results from the emboss CpGplot routine. (c) shows the predicted CpG islands (putative islands).
NT 011520 8 10200047 10347465 147 K 510 500 1 257
36
13
8.2
5.9
4.6
3.8
3.2
2.8
2.5
2.2
21.022 1.026 1.03 1.034
×107
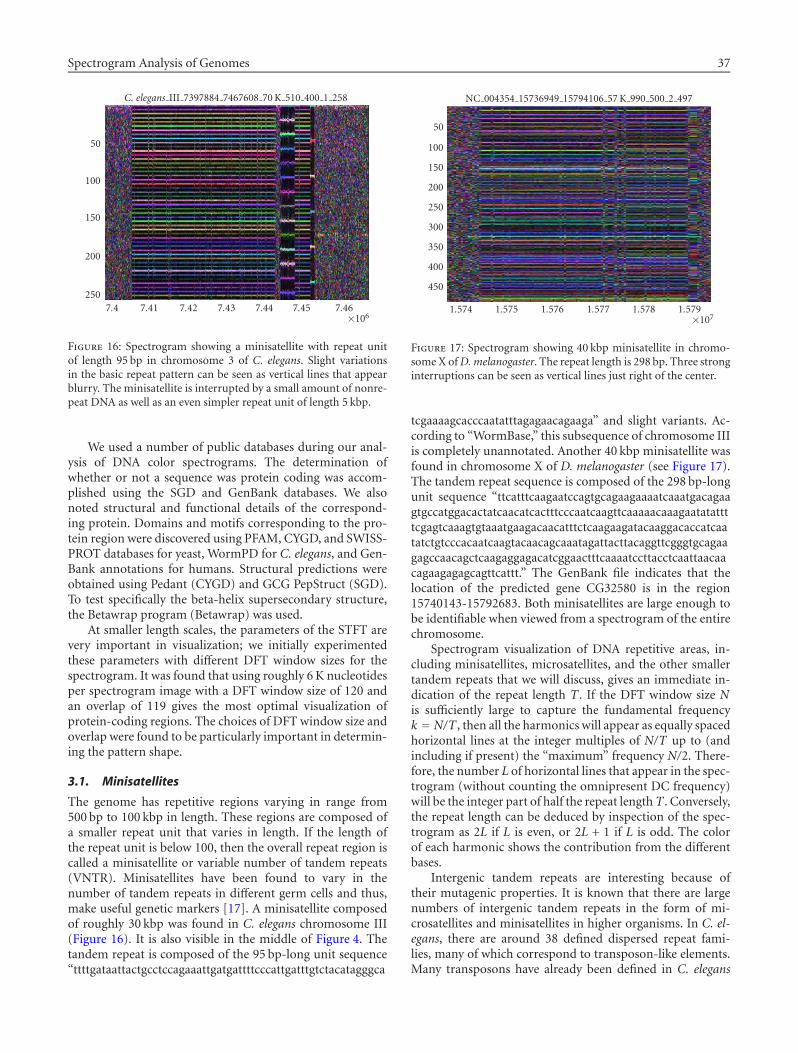
Figure 15: Spectrogram of a 147 Kbp section of human chromo-some 22. Periodicity is shown on vertical scale. Contrasted withFigure 9, this spectrogram shows that the chromosome-wide peri-odicities found in human chromosome 22 are qualitatively differ-ent from those found in the right arm of C. elegans chromosomeIII. The periodicities here are much more finely embedded in theDNA and do not represent any obvious family of strings discretelyinterspersed throughout the region. Arrows point out some of thechromosome-wide periodicities found in Figure 10.
share a common binding domain, called the T-box. Findingthis gene is in keeping with the idea that CpG islands encodefor housekeeping genes.
Finally, we wondered whether or not the chromosome-wide periodicities found in human chromosome 22 arecaused by a highly dispersed repeat family similar to that
found in the right arm of C. elegans chromosome III. This ap-pears not to be the case. The macroscopic appearance of peri-odicities in C. elegans is caused by widely placed repeats withsuch strong characteristics as shown at the macroscopic level.In the case of human chromosome 22, it appears as if the veryfabric of intergenic DNA is woven with a string patterns thatemploys characteristic periodicities seen at the chromosomelevel (Figure 15). In other words, it appears as if the major-ity of intergenic DNA carries the periodicities found at themacroscopic level. Initial investigations show that these em-bedded periodicities are not found in chromosome 17 of themouse.
3. SMALL PATTERNS
We now turn our attention to smaller subsequences of in-terest in various genomes. Color spectrograms can clearlyidentify, by their special signatures, several patterns includ-ing repetitive areas of biological significance such as particu-lar triplet repeats [14], GATA repeats [15], or other charac-teristic repeating motifs in protein structures [16].
The sequences that we analyzed were typically severalthousand bp in length, no more than a hundred thou-sand bp. The majority of smaller sequences we analyzedrelates to protein-coding regions or repetitive sequences innon-protein-coding regions. The public databases were of-ten helpful in matching spectrogram patterns to proteins. Weannotated the spectrograms with the type of pattern, promi-nent periodicities, position in the chromosome, and corre-sponding position in the protein sequence if the DNA wascoding.
Spectrogram Analysis of Genomes 37
C. elegans III 7397884 7467608 70 K 510 400 1 258
50
100
150
200
2507.4 7.41 7.42 7.43 7.44 7.45 7.46
×106
Figure 16: Spectrogram showing a minisatellite with repeat unitof length 95 bp in chromosome 3 of C. elegans. Slight variationsin the basic repeat pattern can be seen as vertical lines that appearblurry. The minisatellite is interrupted by a small amount of nonre-peat DNA as well as an even simpler repeat unit of length 5 kbp.
We used a number of public databases during our anal-ysis of DNA color spectrograms. The determination ofwhether or not a sequence was protein coding was accom-plished using the SGD and GenBank databases. We alsonoted structural and functional details of the correspond-ing protein. Domains and motifs corresponding to the pro-tein region were discovered using PFAM, CYGD, and SWISS-PROT databases for yeast, WormPD for C. elegans, and Gen-Bank annotations for humans. Structural predictions wereobtained using Pedant (CYGD) and GCG PepStruct (SGD).To test specifically the beta-helix supersecondary structure,the Betawrap program (Betawrap) was used.
At smaller length scales, the parameters of the STFT arevery important in visualization; we initially experimentedthese parameters with different DFT window sizes for thespectrogram. It was found that using roughly 6 K nucleotidesper spectrogram image with a DFT window size of 120 andan overlap of 119 gives the most optimal visualization ofprotein-coding regions. The choices of DFT window size andoverlap were found to be particularly important in determin-ing the pattern shape.
3.1. Minisatellites
The genome has repetitive regions varying in range from500 bp to 100 kbp in length. These regions are composed ofa smaller repeat unit that varies in length. If the length ofthe repeat unit is below 100, then the overall repeat region iscalled a minisatellite or variable number of tandem repeats(VNTR). Minisatellites have been found to vary in thenumber of tandem repeats in different germ cells and thus,make useful genetic markers [17]. A minisatellite composedof roughly 30 kbp was found in C. elegans chromosome III(Figure 16). It is also visible in the middle of Figure 4. Thetandem repeat is composed of the 95 bp-long unit sequence“ttttgataattactgcctccagaaattgatgattttcccattgatttgtctacatagggca
NC 004354 15736949 15794106 57 K 990 500 2 497
50
100
150
200
250
300
350
400
450
1.574 1.575 1.576 1.577 1.578 1.579×10⁷
Figure 17: Spectrogram showing 40 kbp minisatellite in chromo-some X of D. melanogaster. The repeat length is 298 bp. Three stronginterruptions can be seen as vertical lines just right of the center.
tcgaaaagcacccaatatttagagaacagaaga” and slight variants. Ac-cording to “WormBase,” this subsequence of chromosome IIIis completely unannotated. Another 40 kbp minisatellite wasfound in chromosome X of D. melanogaster (see Figure 17).The tandem repeat sequence is composed of the 298 bp-longunit sequence “ttcatttcaagaatccagtgcagaagaaaatcaaatgacagaagtgccatggacactatcaacatcactttcccaatcaagttcaaaaacaaagaatatattttcgagtcaaagtgtaaatgaagacaacatttctcaagaagatacaaggacaccatcaatatctgtcccacaatcaagtacaacagcaaatagattacttacaggttcgggtgcagaagagccaacagctcaagaggagacatcggaactttcaaaatccttacctcaattaacaacagaagagagcagttcattt.” The GenBank file indicates that thelocation of the predicted gene CG32580 is in the region15740143-15792683. Both minisatellites are large enough tobe identifiable when viewed from a spectrogram of the entirechromosome.
Spectrogram visualization of DNA repetitive areas, in-cluding minisatellites, microsatellites, and the other smallertandem repeats that we will discuss, gives an immediate in-dication of the repeat length T . If the DFT window size Nis sufficiently large to capture the fundamental frequencyk = N/T , then all the harmonics will appear as equally spacedhorizontal lines at the integer multiples of N/T up to (andincluding if present) the “maximum” frequency N/2. There-fore, the number L of horizontal lines that appear in the spec-trogram (without counting the omnipresent DC frequency)will be the integer part of half the repeat lengthT . Conversely,the repeat length can be deduced by inspection of the spec-trogram as 2L if L is even, or 2L + 1 if L is odd. The colorof each harmonic shows the contribution from the differentbases.
Intergenic tandem repeats are interesting because oftheir mutagenic properties. It is known that there are largenumbers of intergenic tandem repeats in the form of mi-crosatellites and minisatellites in higher organisms. In C. el-egans, there are around 38 defined dispersed repeat fami-lies, many of which correspond to transposon-like elements.Many transposons have already been defined in C. elegans
38 EURASIP Journal on Applied Signal Processing
NC 001133 202523 208652 6 K 120 119 1 61
10
20
30
40
50
602.03 2.04 2.05 2.06 2.07 2.08
×105
Figure 18: Spectrogram showing the quilt in protein FLO1 corre-sponding to the flocculin domain.
as mutagenic elements. Many of the dispersed repeat fami-lies have been found to be relics of transposon families nolonger active. Autosome arms tend to have high recombina-tion rates as compared to the central regions. We found thatspectrogram analysis confirms that there are relatively largenumbers of repeat patterns in the autosome arms. Some ofthese repeat clusters were also found in closely related genes.This suggests that these regions may be sites of random mu-tations and may be rapidly evolving to give rise to new genesand gene families.
3.2. Smaller tandem repeats—quilts, shafts, and bars
After detailed analysis of all the 16 nuclear chromosomesof S. cerevisiae (GenBank accession numbers NC 001133-NC 001148) as well as sections of the C. elegans, D.melanogaster, and human genomes, we identified three ba-sic types of patterns, to which we refer as “quilts,” “shafts,”and “bars,” based on their appearance. All three patternsrepresent tandem repeats, but the repeat-unit length differsbetween them. These were not found to be exhaustive butmerely illustrative of patterns in the various genomes. Manygenes were found to be composites of these patterns. We dis-covered that quilts, shafts, and bars could be used to predictthe homology, structure, and function of proteins. In yeast,most of these patterns were part of the protein-coding re-gions. However, in the higher organisms, the patterns werealso found in the intergenic and intronic regions.
Quilts (Figure 18) are relatively rare patterns in the yeastgenome. They appear as beating, repetitive patterns at al-most all frequencies over relatively long stretches of DNA. Ifpresent in the coding regions of genes, quilts represent pro-tein domains consisting of large tandem repeats. We foundquilts representing repeats of up to 45 amino acids (135 bp).
Bars (Figures 20 and 21) and shafts (Figure 22) showstrong periodicities uniformly over a stretch of coding DNA.Shafts differ from bars in that they are thin and have fewdominant periodicities, causing black areas along most ofthe other frequencies in the spectrograms. In other words,
FLO1
(a)
FLO5
(b)
FLO9
(c)
FLO10
(d)
Figure 19: Four spectrograms of FLO genes 1, 5, 9, and 10. Quiltscan be seen in all four genes. Close inspection of (a) and (b) showsthat (b) is a subsection of (a). FLO9 (c) shows the same colorationas the other three upon reverse complementation.
the basic repeat sequence is smaller in shafts than bars. Barsand quilts with similar appearances, having similar frequencypatterns and colors, were found to be homologous as con-firmed by BLAST alignment scores, database annotations,and literature.
It should be noted that a quilt appears as a quilt and notas a bar because the DFT window size (typically 120 for view-ing proteins) used to create these spectrograms is smallerthan the base repeat unit length (135 bp in this case). Al-though the distinction between quilts and bars is artificial,we found the distinction to be useful since we could differen-tiate high complexity repeats from lower complexity repeatswhile still maintaining an appropriate sequence resolutionfor viewing protein-coding regions.
3.2.1. Quilts—yeast flocculation genes
The quilt observed in Figure 18 is an example of a yeast “floc-culation” gene [18]. Yeast flocculation is an asexual, calcium-dependent, and reversible aggregation of cells into flocs. Thisphenomenon is thought to involve cell surface components.Yeast flocculation is under genetic control, and two domi-nant flocculation genes have been defined by classical genet-ics, FLO1 and FLO5. The other relevant FLO genes includeFLO9 and FLO10. The functional active domain in these cellsurface proteins is made of large tandem repeats up to 45amino acids known as flocculin repeats. The flocculin regioncorresponds to the quilted region of the spectrogram. Thequilted region was observed in all the FLO genes (Figure 19).The flocculin domain is serine-threonine rich and highly O-glycosylated, adopting a stiff and extended conformation.The efficiency of interaction of the FLO proteins is directly
Spectrogram Analysis of Genomes 39
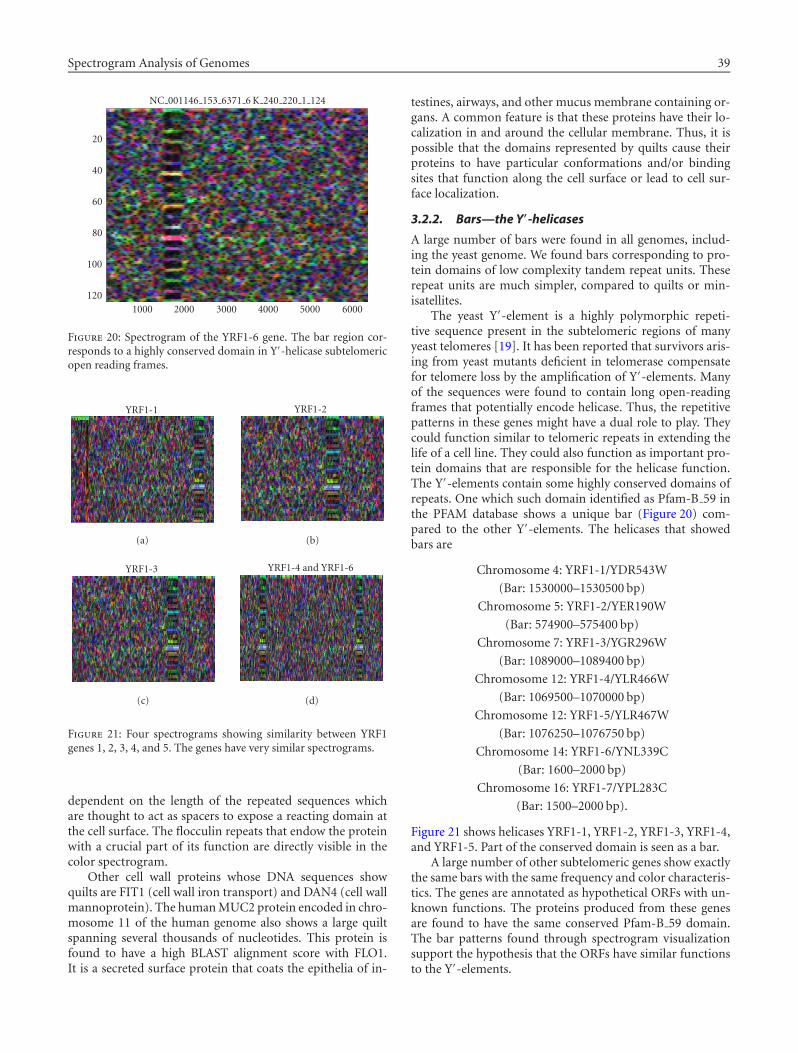
NC 001146 153 6371 6 K 240 220 1 124
20
40
60
80
100
1201000 2000 3000 4000 5000 6000
Figure 20: Spectrogram of the YRF1-6 gene. The bar region cor-responds to a highly conserved domain in Y′-helicase subtelomericopen reading frames.
YRF1-1
(a)
YRF1-2
(b)
YRF1-3
(c)
YRF1-4 and YRF1-6
(d)
Figure 21: Four spectrograms showing similarity between YRF1genes 1, 2, 3, 4, and 5. The genes have very similar spectrograms.
dependent on the length of the repeated sequences whichare thought to act as spacers to expose a reacting domain atthe cell surface. The flocculin repeats that endow the proteinwith a crucial part of its function are directly visible in thecolor spectrogram.
Other cell wall proteins whose DNA sequences showquilts are FIT1 (cell wall iron transport) and DAN4 (cell wallmannoprotein). The human MUC2 protein encoded in chro-mosome 11 of the human genome also shows a large quiltspanning several thousands of nucleotides. This protein isfound to have a high BLAST alignment score with FLO1.It is a secreted surface protein that coats the epithelia of in-
testines, airways, and other mucus membrane containing or-gans. A common feature is that these proteins have their lo-calization in and around the cellular membrane. Thus, it ispossible that the domains represented by quilts cause theirproteins to have particular conformations and/or bindingsites that function along the cell surface or lead to cell sur-face localization.
3.2.2. Bars—the Y′-helicases
A large number of bars were found in all genomes, includ-ing the yeast genome. We found bars corresponding to pro-tein domains of low complexity tandem repeat units. Theserepeat units are much simpler, compared to quilts or min-isatellites.
The yeast Y′-element is a highly polymorphic repeti-tive sequence present in the subtelomeric regions of manyyeast telomeres [19]. It has been reported that survivors aris-ing from yeast mutants deficient in telomerase compensatefor telomere loss by the amplification of Y′-elements. Manyof the sequences were found to contain long open-readingframes that potentially encode helicase. Thus, the repetitivepatterns in these genes might have a dual role to play. Theycould function similar to telomeric repeats in extending thelife of a cell line. They could also function as important pro-tein domains that are responsible for the helicase function.The Y′-elements contain some highly conserved domains ofrepeats. One which such domain identified as Pfam-B 59 inthe PFAM database shows a unique bar (Figure 20) com-pared to the other Y′-elements. The helicases that showedbars are
Chromosome 4: YRF1-1/YDR543W
(Bar: 1530000–1530500 bp)
Chromosome 5: YRF1-2/YER190W
(Bar: 574900–575400 bp)
Chromosome 7: YRF1-3/YGR296W
(Bar: 1089000–1089400 bp)
Chromosome 12: YRF1-4/YLR466W
(Bar: 1069500–1070000 bp)
Chromosome 12: YRF1-5/YLR467W
(Bar: 1076250–1076750 bp)
Chromosome 14: YRF1-6/YNL339C
(Bar: 1600–2000 bp)
Chromosome 16: YRF1-7/YPL283C
(Bar: 1500–2000 bp).
Figure 21 shows helicases YRF1-1, YRF1-2, YRF1-3, YRF1-4,and YRF1-5. Part of the conserved domain is seen as a bar.
A large number of other subtelomeric genes show exactlythe same bars with the same frequency and color characteris-tics. The genes are annotated as hypothetical ORFs with un-known functions. The proteins produced from these genesare found to have the same conserved Pfam-B 59 domain.The bar patterns found through spectrogram visualizationsupport the hypothesis that the ORFs have similar functionsto the Y′-elements.
40 EURASIP Journal on Applied Signal Processing
NC 001136 1502813 1505060 2 K 180 170 1 93
10
20
30
40
50
60
70
80
90
1.503 1.5034 1.5038 1.5042 1.5046 1.505×10⁶
Figure 22: Spectrogram showing shaft in FIT1 gene. The arrowhighlights period 18, showing an intensity corresponding to a re-peat of 6 amino acids.
A number of yeast cell wall glycoproteins such as PIR1,PIR3, HSP150, and TIR1 are characterized by the presence oftandem repeats of a region of 18 to 19 residues. The core re-gion is highly conserved and has a consensus pattern of “SQ[IV] [STGNH] DSQ [LIV] Q [AIV] [STA].” The genomicDNA sequences of these proteins show prominent and char-acteristic bars whose frequency pattern represents the dom-inant periodicities. These bars are visually distinct in colorand frequency pattern from the Y′-elements.
Some bars show the structural significance of protein inthe cell. In yeast, the protein HKR1 coded on chromosome4 is a cell surface protein that may regulate cell wall beta-glucan synthesis. A region of the gene shows strong bars ata number of relevant frequencies reflecting correspondingperiodicities in the protein as well as the DNA sequences.The domain in the protein sequence is made up of 12 re-peats of a 28 amino acid sequence, namely, “S [AV] [P]VAVSSTYTSSPSAPAAISSTYTSSP.” It was predicted to have abeta-helix supersecondary structure with a high score by theBetawrap algorithm. The gene YIL169C in S. cerevisiae showsstrong bars that correspond to a serine-rich domain in theprotein. This domain extends through amino acids 92–154and is identified as a potential T-SNARE coiled-coil domain.
3.2.3. Shafts and their structural significance
The shaft shown in Figure 22 is part of the FIT1 gene. It cor-responds to a domain of repeats of 6 amino acids, namely,“SSAVET.” The shaft shows a bright band at frequency 11,marked by an arrow. The remaining bars are all harmon-ics of this fundamental periodicity. As the DFT window sizewas 180 for this spectrogram, a frequency of 11 correspondsto a periodicity of 18 in the DNA sequence and a period-icity of 6 in the protein sequence. This protein domain ispredicted with high probability as a large alpha helix byGCG-Pepstruct. Spectrogram analysis of genes CYC8 andGAL11 also show shafts with a prominent periodicity of 6nucleotides. This translates to a periodicity of 2 amino acids
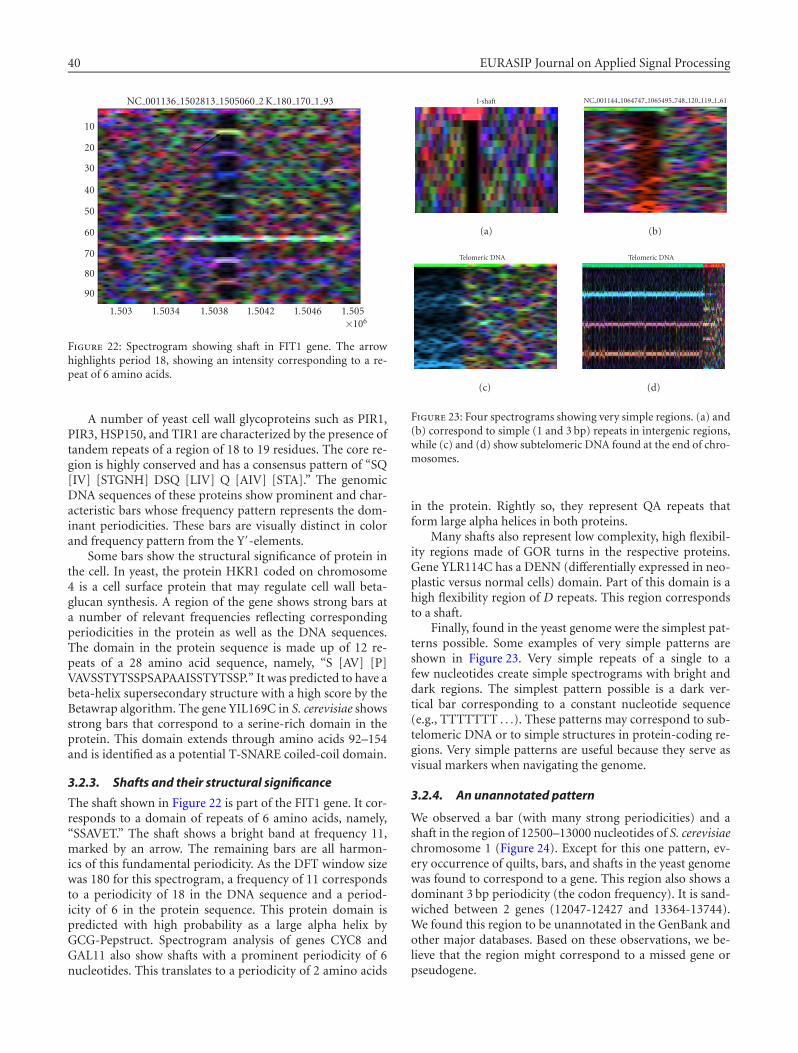
I-shaft
(a)
NC 001144 1064747 1065495 748 120 119 1 61
(b)
Telomeric DNA
(c)
Telomeric DNA
(d)
Figure 23: Four spectrograms showing very simple regions. (a) and(b) correspond to simple (1 and 3 bp) repeats in intergenic regions,while (c) and (d) show subtelomeric DNA found at the end of chro-mosomes.
in the protein. Rightly so, they represent QA repeats thatform large alpha helices in both proteins.
Many shafts also represent low complexity, high flexibil-ity regions made of GOR turns in the respective proteins.Gene YLR114C has a DENN (differentially expressed in neo-plastic versus normal cells) domain. Part of this domain is ahigh flexibility region of D repeats. This region correspondsto a shaft.
Finally, found in the yeast genome were the simplest pat-terns possible. Some examples of very simple patterns areshown in Figure 23. Very simple repeats of a single to afew nucleotides create simple spectrograms with bright anddark regions. The simplest pattern possible is a dark ver-tical bar corresponding to a constant nucleotide sequence(e.g., TTTTTTT . . .). These patterns may correspond to sub-telomeric DNA or to simple structures in protein-coding re-gions. Very simple patterns are useful because they serve asvisual markers when navigating the genome.
3.2.4. An unannotated pattern
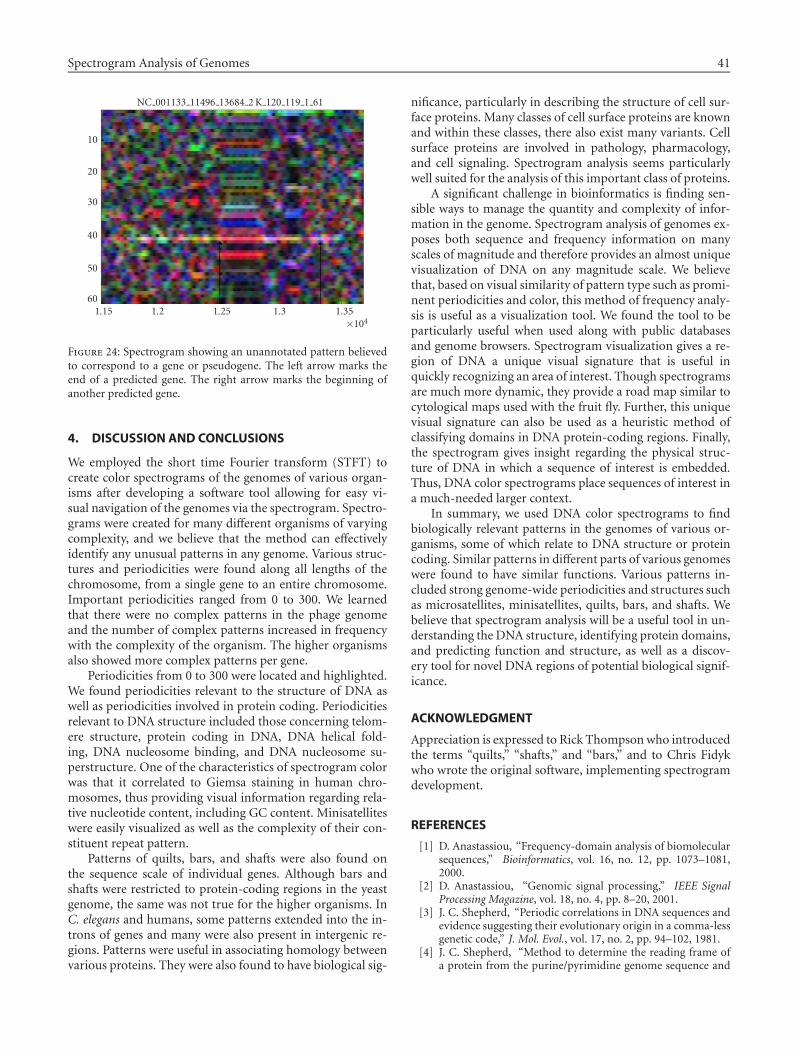
We observed a bar (with many strong periodicities) and ashaft in the region of 12500–13000 nucleotides of S. cerevisiaechromosome 1 (Figure 24). Except for this one pattern, ev-ery occurrence of quilts, bars, and shafts in the yeast genomewas found to correspond to a gene. This region also shows adominant 3 bp periodicity (the codon frequency). It is sand-wiched between 2 genes (12047-12427 and 13364-13744).We found this region to be unannotated in the GenBank andother major databases. Based on these observations, we be-lieve that the region might correspond to a missed gene orpseudogene.
Spectrogram Analysis of Genomes 41
NC 001133 11496 13684 2 K 120 119 1 61
10
20
30
40
50
601.15 1.2 1.25 1.3 1.35
×104
Figure 24: Spectrogram showing an unannotated pattern believedto correspond to a gene or pseudogene. The left arrow marks theend of a predicted gene. The right arrow marks the beginning ofanother predicted gene.
4. DISCUSSION AND CONCLUSIONS
We employed the short time Fourier transform (STFT) tocreate color spectrograms of the genomes of various organ-isms after developing a software tool allowing for easy vi-sual navigation of the genomes via the spectrogram. Spectro-grams were created for many different organisms of varyingcomplexity, and we believe that the method can effectivelyidentify any unusual patterns in any genome. Various struc-tures and periodicities were found along all lengths of thechromosome, from a single gene to an entire chromosome.Important periodicities ranged from 0 to 300. We learnedthat there were no complex patterns in the phage genomeand the number of complex patterns increased in frequencywith the complexity of the organism. The higher organismsalso showed more complex patterns per gene.
Periodicities from 0 to 300 were located and highlighted.We found periodicities relevant to the structure of DNA aswell as periodicities involved in protein coding. Periodicitiesrelevant to DNA structure included those concerning telom-ere structure, protein coding in DNA, DNA helical fold-ing, DNA nucleosome binding, and DNA nucleosome su-perstructure. One of the characteristics of spectrogram colorwas that it correlated to Giemsa staining in human chro-mosomes, thus providing visual information regarding rela-tive nucleotide content, including GC content. Minisatelliteswere easily visualized as well as the complexity of their con-stituent repeat pattern.
Patterns of quilts, bars, and shafts were also found onthe sequence scale of individual genes. Although bars andshafts were restricted to protein-coding regions in the yeastgenome, the same was not true for the higher organisms. InC. elegans and humans, some patterns extended into the in-trons of genes and many were also present in intergenic re-gions. Patterns were useful in associating homology betweenvarious proteins. They were also found to have biological sig-
nificance, particularly in describing the structure of cell sur-face proteins. Many classes of cell surface proteins are knownand within these classes, there also exist many variants. Cellsurface proteins are involved in pathology, pharmacology,and cell signaling. Spectrogram analysis seems particularlywell suited for the analysis of this important class of proteins.
A significant challenge in bioinformatics is finding sen-sible ways to manage the quantity and complexity of infor-mation in the genome. Spectrogram analysis of genomes ex-poses both sequence and frequency information on manyscales of magnitude and therefore provides an almost uniquevisualization of DNA on any magnitude scale. We believethat, based on visual similarity of pattern type such as promi-nent periodicities and color, this method of frequency analy-sis is useful as a visualization tool. We found the tool to beparticularly useful when used along with public databasesand genome browsers. Spectrogram visualization gives a re-gion of DNA a unique visual signature that is useful inquickly recognizing an area of interest. Though spectrogramsare much more dynamic, they provide a road map similar tocytological maps used with the fruit fly. Further, this uniquevisual signature can also be used as a heuristic method ofclassifying domains in DNA protein-coding regions. Finally,the spectrogram gives insight regarding the physical struc-ture of DNA in which a sequence of interest is embedded.Thus, DNA color spectrograms place sequences of interest ina much-needed larger context.
In summary, we used DNA color spectrograms to findbiologically relevant patterns in the genomes of various or-ganisms, some of which relate to DNA structure or proteincoding. Similar patterns in different parts of various genomeswere found to have similar functions. Various patterns in-cluded strong genome-wide periodicities and structures suchas microsatellites, minisatellites, quilts, bars, and shafts. Webelieve that spectrogram analysis will be a useful tool in un-derstanding the DNA structure, identifying protein domains,and predicting function and structure, as well as a discov-ery tool for novel DNA regions of potential biological signif-icance.
ACKNOWLEDGMENT
Appreciation is expressed to Rick Thompson who introducedthe terms “quilts,” “shafts,” and “bars,” and to Chris Fidykwho wrote the original software, implementing spectrogramdevelopment.
REFERENCES
[1] D. Anastassiou, “Frequency-domain analysis of biomolecularsequences,” Bioinformatics, vol. 16, no. 12, pp. 1073–1081,2000.
[2] D. Anastassiou, “Genomic signal processing,” IEEE SignalProcessing Magazine, vol. 18, no. 4, pp. 8–20, 2001.
[3] J. C. Shepherd, “Periodic correlations in DNA sequences andevidence suggesting their evolutionary origin in a comma-lessgenetic code,” J. Mol. Evol., vol. 17, no. 2, pp. 94–102, 1981.
[4] J. C. Shepherd, “Method to determine the reading frame ofa protein from the purine/pyrimidine genome sequence and
42 EURASIP Journal on Applied Signal Processing
its possible evolutionary justification,” Proc. Natl. Acad. Sci.USA, vol. 78, no. 3, pp. 1596–1600, 1981.
[5] J. C. Shepherd, “From primeval message to present-day gene,”Cold Spring Harb. Symp. Quant. Biol., vol. 47, Pt 2, pp. 1099–1108, 1983.
[6] J. W. Fickett, “Recognition of protein coding regions in DNAsequences,” Nucl. Acids. Res., vol. 10, pp. 5303–5318, 1982.
[7] D. Rhodes and A. Klug, “Helical periodicity of DNA deter-mined by enzyme digestion,” Nature (London), vol. 286, pp.573–578, August 1980.
[8] G. P. Lomonossoff, P. J. Butler, and A. Klug, “Sequence-dependent variation in the conformation of DNA,” J. Mol.Biol., vol. 149, pp. 745–760, July 1981.
[9] A. Klug, L. C. Lutter, and D. Rhodes, “Helical periodicity ofDNA on and off the nucleosome as probed by nucleases,” ColdSpring Harb. Symp. Quant. Biol., vol. 47, pp. 285–292, 1983.
[10] L. J. Peck and J. C. Wang, “Sequence dependence of the helicalrepeat of DNA in solution,” Nature, vol. 292, pp. 375–378, July1981.
[11] B. Alberts, A. Johnson, J. Lewis, M. Raff, K. Roberts, andP. Walter, Molecular Biology of the Cell, Garland Publishing,New York, USA, 4th edition, Chapter 4, 2002.
[12] Y. Niimura and T. Gogobori, “In silico chromosome stain-ing: Reconstruction of Giemsa bands from the whole humangenome sequence,” Proc. Natl. Acad. Sci. USA, vol. 99, no. 2,pp. 797–802, 2002.
[13] A. Bird, “CpG islands as gene markers in the vertebrate nu-cleus,” Trends in Genetics, vol. 3, pp. 342–347, 1987.
[14] S. Subramanian, V. M. Madgula, R. George, et al., “Tripletrepeats in human genome: distribution and their associationwith genes and other genomic regions,” Bioinformatics, vol.19, no. 5, pp. 549–552, 2003.
[15] S. Subramanian, R. K. Mishra, and L. Singh, “Genome-wideanalysis of Bkm sequences (GATA repeats): predominant as-sociation with sex chromosomes and potential role in chro-matin organization and function,” Bioinformatics, vol. 19, no.6, pp. 681–685, 2003.
[16] K. B. Murray, D. Gorse, and J. Thornton, “Wavelet transformsfor the characterization and detection of repeating motifs,” J.Mol. Biol., vol. 316, no. 2, pp. 341–363, 2002.
[17] Y. Nakamura, M. Leppert, P. O’Connell, et al., “Variable num-ber of tandem repeat (VNTR) markers for human gene map-ping science,” Science, vol. 235, no. 4796, pp. 1616–1622, 1987.
[18] M. Bony, D. Thines-Sempoux, P. Barre, and B. Blondin, “Lo-calization and cell surface anchoring of the Saccharomycescerevisiae flocculation protein Flo1p,” Journal of Bacteriology,vol. 179, no. 15, pp. 4929–4936, 1997.
[19] M. Yamada, N. Hayatsu, A. Matsuura, and F. Ishikawa, “Y′-Help1, a DNA helicase encoded by the yeast subtelomeric Y′
element, is induced in survivors defective for telomerase,” J.Biol. Chem., vol. 273, no. 50, pp. 33360–33366, 1998.
David Sussillo received his B.S. degree incomputer science from Carnegie MellonUniversity in 1999 and his M.S. degree inelectrical engineering from Columbia Uni-versity in 2003. He is currently pursuing hisPh.D. degree in the Doctoral Program forNeurobiology and Behavior at ColumbiaUniversity. His current research interests in-clude signal processing of genomic signals,vision processing in the primary visual cor-tex, and computer applications in biomedical research.
Anshul Kundaje received his B.S. degreefrom Veermata Jijabai Technological Insti-tute (VJTI), the University of Mumbai in2001 and M.S. degree from Columbia Uni-versity in 2002, both in electrical engineer-ing. Presently, he is pursuing a Ph.D. degreein computer science at Columbia Univer-sity. His research focus is computational bi-ology, specifically applying machine learn-ing and signal processing techniques tosolving hard biological problems. His prime interest is in reverseengineering of genetic and protein networks using multiple sourcesof biological data such as mRNA expression, time-series, sequence,and protein data.
Dimitris Anastassiou is a Professor and Di-rector of Columbia’s Genomic InformationSystems Laboratory at Columbia University.He received the Ph.D. degree in electricalengineering from the University of Califor-nia, Berkeley, in 1979. From 1979 to 1983,he was a research staff member at the IBMThomas J. Watson Research Center, York-town Heights, NY. Since 1983, he has beenwith the Department of Electrical Engineer-ing, Columbia University. He is an IEEE Fellow, the recipient of anIBM Outstanding Innovation Award, a National Science Founda-tion Presidential Young Investigator Award, and a Columbia Uni-versity Great Teacher Award. His previous research interests havebeen in the area of digital signal processing and information the-ory with emphasis on the digital representation of multimedia sig-nals, with contributions to the international digital television cod-ing standard, MPEG-2. He is the founder and previous Director ofColumbia University’s Image and Advanced Television Laboratory.His research is now exclusively focused on applying his expertise inengineering to the emerging field of computational biology.
EURASIP JOURNAL ON EMBEDDED SYSTEMS
Special Issue on
C-Based Design of Heterogeneous Embedded Systems
Call for Papers
Embedded systems are becoming more distributed and alsomore heterogeneous. Examples for heterogeneous embed-ded systems are sensor networks or MEMS in healthcare,automation, or automotive applications. Besides embeddedhardware and software, such systems include an increasingshare of “other” things such as (micro-)mechanical parts,sensors, actuators, analog, and RF components. The combi-nation and tight interaction of such components with com-plex software systems make the design of such systems a chal-lenge.
A paradigmatic approach is to use the methods andlanguages for software specification (C++, Java, Haskell,etc.) also for specification, programming, modelling, perfor-mance analysis, or even HW synthesis of the hardware com-ponents. Examples for C-based tools or languages are Sys-temC, SpecC, OMNET+, Handle C, and frameworks suchas Ptolemy or Metropolis that integrate different design lan-guages, simulators, and tools. To support the design of het-erogeneous systems, different modelling techniques are sup-ported. For example, signal processing methods are usuallyspecified using synchronous dataflow, or control loops byblock diagrams with continuous-time transfer functions andstatic nonlinear functions. Other modelling techniques areautomata-based, or the reactive/synchronous model of com-putation.
This special issue is intended to present innovative mod-elling approaches, design methodologies, tools, or evenframeworks applicable for the design of heterogeneous em-bedded systems. The case studies showing the application ofnew techniques on demanding applications such as MEMSor sensor networks are highly welcomed. Also, within thescope of this issue are formalisms and conceptual frame-works that contribute to the theoretical foundations formodelling and design of heterogeneous embedded systems.
Authors are invited to submit their papers addressing thedesign of heterogeneous embedded systems to this special is-sue of the EURASIP Journal of Embedded Systems. Acceptedpapers will need to meet normal journal requirements ofcompleteness, originality, and quality of presentation. Thesubmissions must be based on previously unpublished work.
If the work has been published in conference proceedings,there should be at least 30% extra innovation or results de-scribed in the journal version.
Authors should follow the EURASIP Journal on Em-bedded Systems manuscript format described at the jour-nal site http://www.hindawi.com/journals/es/. Prospectiveauthors should submit an electronic copy of their com-plete manuscript through the EURASIP Journal on Em-bedded Systems Manuscript Tracking System at http://mts.hindawi.com/, according to the following timetable:
Manuscript Due October 1, 2007
First Round of Reviews January 1, 2008
Publication Date April 1, 2008
Guest Editors:
Christoph Grimm, Institute of Computer Technology, Fac-ulty of Electrical Engineering and Information Technology,TU Vienna, 1040 Vienna, Austria; [email protected]
Axel Jantsch, Department of Microelectronics and Infor-mation Technology, School of Information and Communica-tion Technology,Royal Institute of Technology, 164 40 Kista,Sweden; [email protected]
Eugenio Villar, Department of Electronics Technology,Systems and Automation Engineering, Universidade deCantabria, 39005 Santander, Spain; [email protected]
Sandeep K. Shukla, Department of Electrical and Com-puter Engineering, College of Engineering, Virginia Tech,Blacksburg, VA 24061-0111, USA; [email protected]
EURASIP Book Series on SP&C, Volume 1, ISBN 977-5945-24-0Please visit http://www.hindawi.com/spc.1.html for more information about the book. To place an order while taking advantage of our current promotional offer, please contact [email protected]
This invaluable monograph addresses the specific needs of audio-engineering students and
researchers who are either learning about the topic or using it as a reference book on multichannel audio compression. This book covers a wide range of knowledge on perceptual audio coding, from basic digital signal processing and data compression techniques to advanced audio coding standards and innovate coding tools. It is the only book available on the market that solely focuses on the principles of high-quality audio codec design for multichannel sound sources.
This book includes three parts. The first part covers the basic topics on audio compression, such as quantization, entropy coding, psychoacoustic model, and sound quality assessment. The second part of the book highlights the current most prevalent low-bit-rate high-performance audio coding standards—MPEG-4 audio. More space is given to the audio standards that are capable of supporting multichannel signals, that is, MPEG advance audio coding (AAC), including the original MPEG-2 AAC technology, additional MPEG-4 toolsets, and the most recent AACPlus standard. The third part of this book introduces several innovate multichannel audio coding tools, which have been demonstrated to further improve the coding performance and expand the available functionalities of MPEG AAC, and is more suitable for graduate students and researchers in the advanced level.
Dai Tracy Yang is currently a Postdoctoral Research Fellow, Chris Kyriakakis is an Associated Professor, and C.-C. Jay Kuo is a Professor, all affiliated with the Integrated Media Systems Center (IMSC) at the University of Southern California.
High-Fidelity Multichannel Audio CodingEdited by: Dai Tracy Yang, Chris Kyriakakis, and C.-C. Jay Kuo
EURASIP Book Series on Signal Processing and Communications
Limited-Time Promotional Offer. Buy this title NOW at 20% discount plus Free Shipping.