Spring Turkey Harvest Survey Report 2021 Neelam C. Poudyal and Clara Shattuck Department of Forestry, Wildlife and Fisheries University of Tennessee TWRA Wildlife Technical Report 21-12, Nov. 2021
Transcript
Spring Turkey Harvest Survey Report 2021
Neelam C. Poudyal and Clara Shattuck Department of Forestry, Wildlife and Fisheries
University of Tennessee
TWRA Wildlife Technical Report 21-12, Nov. 2021
Equal opportunity to participate in and benefit from programs of the Tennessee Wildlife Resources Agency is available to all persons without regard to their race, color, national origin, sex, age, disability, or military service. TWRA is also an equal opportunity/equal access employer. Questions should be directed to TWRA, Human Resources Office, 5107 Edmondson Pike, Nashville, TN 37211, (615) 781-6594 (TDD 781-6691), or to the U.S. Fish and Wildlife Service, Office for Human Resources, 4401 N. Fairfax Dr., Arlington, VA 22203.
2021 Spring Turkey Harvest Survey Report
Submitted to: Roger Shields
Turkey Program Coordinator Tennessee Wildlife Resources Agency
5107 Edmondson Pike Nashville, TN
Submitted by: Neelam C. Poudyal and Clara Shattuck
Department of Forestry, Wildlife and Fisheries University of Tennessee
Knoxville, TN 37996
November 3, 2021
THIS PROJECT WAS SUPPORTED by Wildlife Restoration Grants administered by the U.S. Fish and Wildlife Service, Wildlife and Sport Fish Restoration Program: Partnering to fund conservation and connect people with nature.
1
Abstract
Following the 2021 spring turkey hunting season, a stratified random sample of
statewide big game hunting license holders (both resident and non-resident) was contacted by
a combination of email and mail surveys to estimate the turkey hunting participation, hunting
effort, and harvest in Tennessee. Of 17,000 total license-holders contacted, 5,198 responses
were received. During the spring 2021 turkey season, an estimated 91,247 hunters (67,091
adult and 24,156 youth) statewide participated in turkey hunting and spent 682,302 days afield.
Adult and youth hunters statewide harvested an estimated 53,669 turkeys (47,895 adult
gobblers, 5,153 jakes, and 621 bearded hens). An estimated 7,214 birds were shot but not killed
or recovered during the 2021 spring turkey season. Overall, 59% of the statewide respondents
were somewhat or very satisfied with their turkey hunting experience in the 2021 spring turkey
season. Sixty percent of the respondents perceived the turkey population in areas they hunt to
have decreased over the years. The three most frequently mentioned reasons behind a
perceived decline in turkey populations included predation on nests and poults, nesting success
and poult survival, and predation on adults.
2
Table of Contents Abstract ......................................................................................................................................................... 1
List of Tables .................................................................................................................................................. 3
List of Figures................................................................................................................................................. 4
List of Tables Table 1: Estimated number of hunters, average hunting hours, and total days spent hunting during the
2021 spring turkey hunting season in Tennessee ......................................................................................... 9 Table 2: Estimated number of turkeys harvested by adult and youth hunters during the 2021 spring
turkey hunting season in Tennessee ........................................................................................................... 10 Table 3: Estimated number of hunters, days afield and turkeys harvested by land type during the 2021
spring turkey hunting season in Tennessee ................................................................................................ 12 Table 4: Estimated average number of days afield and hunting hours per day for adult and youth hunters
during the 2021 spring turkey hunting season in Tennessee ...................................................................... 12 Table 5: Estimated harvest rates for adult and youth hunters by land types during the 2021 spring turkey
hunting season in Tennessee ....................................................................................................................... 13 Table 6: Estimated number of adult hunters, average days afield by land types, and birds harvested by
TWRA administrative region during the 2021 spring turkey hunting season in Tennessee ....................... 14 Table 7: Estimated number of youth hunters, average days afield by land types, and birds harvested by
TWRA administrative region during the 2021 spring turkey hunting season in Tennessee ....................... 15 Table 8: Estimated average number of hunting hours per day by TWRA administrative region for adult
and youth hunters during the 2021 spring turkey hunting season in Tennessee ....................................... 15 Table 9: Estimated harvest rates for adult and youth hunters by TWRA administrative region during the
2021 spring turkey hunting season in Tennessee ....................................................................................... 16
4
List of Figures Figure 1: Map of TWRA administrative regions (Source: Tennessee Wildlife Resources Agency) ............... 5 Figure 2: Survey respondents' reported satisfaction with the 2021 spring turkey hunting experience by
type of land hunted (From top: n1 = 348, n2 = 309, n3 = 1,828, n4 = 2,517) ............................................. 17 Figure 3: Survey respondents' reported satisfaction with the 2021 spring turkey hunting experience by
TWRA region (From top: n1 = 459, n2 = 525, n3 = 994, n4 = 612, n5 = 2,517) ........................................... 17 Figure 4: Survey respondents' perception of how turkey populations in the areas they hunt have
changed over the years (From top: n1 = 395, n2 = 431, n3 = 832, n4 = 539, n5 = 2,126)........................... 18 Figure 5: Percentage of survey respondents who perceived a decline in turkey populations indicating the
reasons behind perceived declines in turkey populations in the areas they hunt (n = 1,273) ................... 19
5
Introduction
The Tennessee Wildlife Resources Agency (TWRA) is a state agency in Tennessee
responsible for the management of game species including turkey, deer, etc. For better
monitoring of the turkey population and harvest trends over time, the agency benefits from
understanding annual hunting participation, hunting effort, and harvest estimates for all game
species including wild turkey. Estimating participation, effort, and harvest by types of land (e.g.,
private and public) and by TWRA administrative regions (R1, R2, R3, R4) as shown in Figure 1
allows for comparing effort and success and devising programs to enhance the hunting
experience. In addition to participation and harvest, it is also important to continue monitoring
hunters’ satisfaction and perception of population trends. Estimating harvest often involves
designing a systematic survey of randomly selected hunters to collect data on seasonal hunting
participation and harvests.
In order to meet the above-mentioned needs, the primary objective of this turkey
hunters survey was to estimate hunter numbers, hunting effort, and harvest at the statewide
level as well as by TWRA administrative region. The other objective was to assess satisfaction
and perception of population in the areas hunted and perceived reasons for changes in
population.
Figure 1: Map of TWRA administrative regions (Source: Tennessee Wildlife Resources Agency)
Methods
This study utilized a mixed-mode survey of resident and non-resident hunters in
Tennessee for the 2021 spring turkey hunting season. The sampling frame used for this survey
was the population of individuals aged 18 years and older who had a valid license to hunt
turkeys, or who reported harvesting a turkey, in Tennessee during the 2021 spring turkey
6
season. Because of the wide variety of license types that include turkey hunting privileges in
Tennessee, a stratified random sampling approach was adopted to ensure representation of all
license categories in the survey sample. Based on expected differences in response rate and a
general similarity in license types, license holders and hunters who reported to have harvested
a turkey during the 2021 spring season were assigned to one of six sampling strata (Annual,
Youth Hunters Private only Estimate 17,697 51,797 5,049 1,236 75 95% CL 2,752 9,577 1,646 731 106 Public only Estimate 1,460 4,898 115 30 - 95% CL 721 2,781 180 57 - Both Estimate 2,774 15,751 830 134 30 95% CL 898 6,321 447 133 57 Notes: Number of hunters do not add up to the state total because some respondents did not disclose the type of land their harvest was from
Compared to those who hunted turkeys on public land only, average days of hunting
was higher for those who hunted on private land only (Table 4), but average days of hunting
was highest among those who hunted both land types. In terms of hunting hours by land type,
the average hours spent per day by adult hunter was slightly higher for those who hunted on
public lands, compared to those who hunted private land only, or both. A similar difference was
observed with the average days and hours spent by youth hunters.
Table 4: Estimated average number of days afield and hunting hours per day for adult and youth hunters during the 2021 spring turkey hunting season in Tennessee
Adult Hunters Youth Hunters
Days Hours Days Hours Estimate 95%
CL Estimate 95%
CL Estimate 95%
CL Estimate 95%
CL
Private only 8.39 0.49 4.26 0.09 3.88 0.49 3.95 0.21
Public only 7.74 1.05 5.68 0.29 4.95 2.03 4.77 0.74
Both 15.54 1.37 4.94 0.21 8.91 2.48 4.21 0.33
13
Compared to those who hunted on public lands only, the harvest rate was much higher
among hunters who hunted on private lands only. For example, adult hunters who hunted on
only private lands harvested 0.16 birds per day of hunting, whereas those hunting on only
public land bagged 0.05 birds.
Table 5: Estimated harvest rates for adult and youth hunters by land types during the 2021 spring turkey hunting season in Tennessee
Adult Hunters Youth Hunters
Estimate 95% CL Estimate 95% CL
Private only 0.16 0.01 0.22 0.07 Public only 0.05 0.01 0.04 0.03 Both 0.08 0.01 0.15 0.05
Regional estimates of hunting effort and harvest
The estimated number of adult hunters, hunting effort, and harvest at the TWRA
administrative region level was determined based on survey respondents’ indication they
participated in at least one day of hunting in a given region during the 2021 spring turkey
season (Table 6). The estimated number of adult hunters was largest in Region 2 (22,821) and
smallest in Region 4 (13,738). Except in Region 4, average days afield per hunter was higher on
private land compared to public land in all regions.
In terms of harvest, the highest number of bids harvested by adult hunters was in
Region 2. Compared to Regions 1 and 2, Regions 3 and 4 had comparatively higher percentage
of jakes in the harvest (Table 6). Jakes accounted for 5.35% of the total gobblers harvested by
adult hunters who hunted in Region 1. This metric was highest (12.70%) among those who
hunted in Region 4.
14
Table 6: Estimated number of adult hunters, average days afield by land types, and birds harvested by TWRA administrative region during the 2021 spring turkey hunting season in Tennessee
Total Adult
Hunters
Average Days
(Private)
Average Days
(Public)
Average Days
(Both)
Total Birds Harvested
Percent Jakes
Region 1 Estimate 16,287 9.52 6.86 17.85 10,684 5.35% 95% CL 1,923 1.08 2.04 2.21 1,397 Region 2 Estimate 22,821 7.59 6.57 15.01 15,217 7.06% 95% CL 2,091 0.69 1.06 2.23 1,880 Region 3 Estimate 15,566 9.03 7.89 15.32 9,724 8.37% 95% CL 1,835 1.28 2.00 2.59 1,252 Region 4 Estimate 13,738 8.46 9.70 16.70 10,070 12.70% 95% CL 1,686 0.84 2.25 2.86 1,178 Note: Number of hunters do not add up to the state total because some respondents report hunting in multiple regions or did not disclose their hunting location.
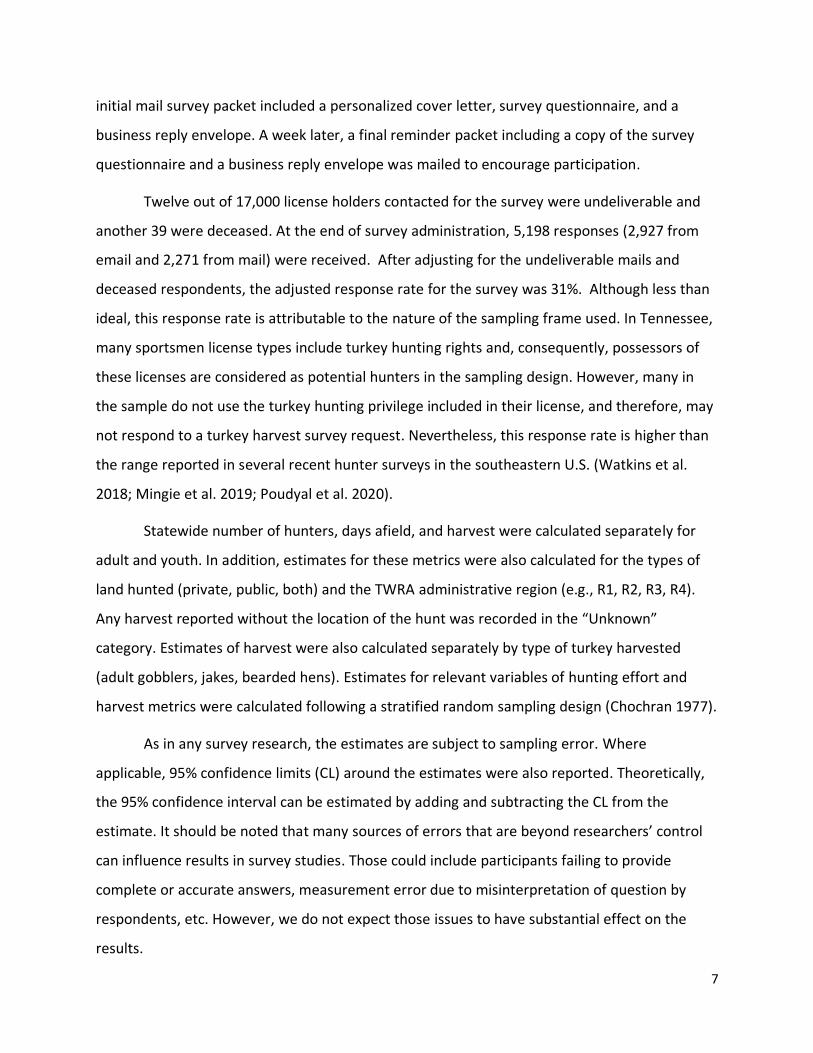
Estimated number of hunters, average days, and birds harvested were also calculated
for youth hunters (Table 7). It should be noted that since the survey did not collect data on
location of youth hunting, regional breakdown of these metrics relied on the assumption the
youth hunted in the same region where their supervising adult hunted. However, interpretation
of these estimates is cautioned since not all adult hunters guide their youth hunters in the same
region in which they themselves hunt. Moreover, many adult respondents who provided data
for their youth in the survey did not hunt themselves, and therefore no location information
was available to place them in a region. Nevertheless, the regional breakdown of youth hunting
participation and harvest metrics shown in Table 7 is similar to that of adult hunters (Table 6).
Region 2 had the highest number of youth hunters and birds harvested. Region 1, 2 and 3 had
higher average days per hunter on private land than on public land whereas the opposite was
true in Region 4. Of note, the average days on public lands in Region 4 was based on very small
sample size (< 20) and should be interpreted with caution for comparison purpose. Jakes
accounted for 38.00% of the total gobblers harvested by youth hunters who hunted in Region 3.
This metric was smallest (9.90%) in Region 4.
15
Table 7: Estimated number of youth hunters, average days afield by land types, and birds harvested by TWRA administrative region during the 2021 spring turkey hunting season in Tennessee
Youth Hunters
Average Days
(Private)
Average Days
(Public)
Average Days
(Both)
Total Birds Harvested
Percent Jakes
Region 1 Estimate 5,684 4.27 4.07 9.98 1,532 14.84% 95% CL 1,737 0.98 1.47 4.12 800 Region 2 Estimate 8,036 3.31 2.69 10.14 2,458 12.30% 95% CL 1,925 0.53 1.20 5.47 911 Region 3 Estimate 4,203 4.38 2.36 7.46 1,637 38.00% 95% CL 1,143 0.79 1.02 2.78 847 Region 4 Estimate 4,540 3.67 11.12 7.81 2,166 9.90% 95% CL 1,668 0.86 4.94 3.35 1,380 Note: Number of hunters do not add up to the state total because some respondents report hunting in multiple regions or did not disclose their hunting location.
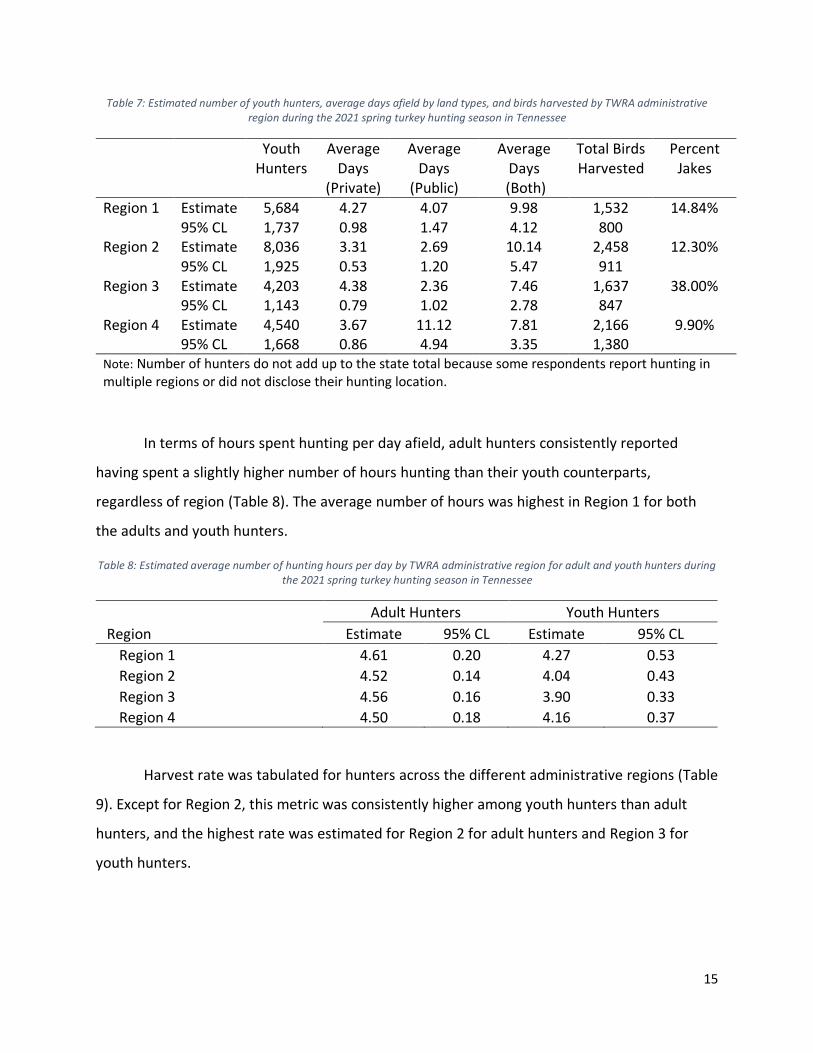
In terms of hours spent hunting per day afield, adult hunters consistently reported
having spent a slightly higher number of hours hunting than their youth counterparts,
regardless of region (Table 8). The average number of hours was highest in Region 1 for both
the adults and youth hunters.
Table 8: Estimated average number of hunting hours per day by TWRA administrative region for adult and youth hunters during the 2021 spring turkey hunting season in Tennessee
Adult Hunters Youth Hunters
Region Estimate 95% CL Estimate 95% CL
Region 1 4.61 0.20 4.27 0.53
Region 2 4.52 0.14 4.04 0.43
Region 3 4.56 0.16 3.90 0.33
Region 4 4.50 0.18 4.16 0.37
Harvest rate was tabulated for hunters across the different administrative regions (Table
9). Except for Region 2, this metric was consistently higher among youth hunters than adult
hunters, and the highest rate was estimated for Region 2 for adult hunters and Region 3 for
youth hunters.
16
Table 9: Estimated harvest rates for adult and youth hunters by TWRA administrative region during the 2021 spring turkey hunting season in Tennessee
Region 1 0.11 0.01 0.15 0.04 Region 2 0.15 0.02 0.15 0.04 Region 3 0.12 0.02 0.27 0.20 Region 4 0.14 0.02 0.21 0.06
Turkeys shot but not killed or recovered by hunters Respondents were also asked to report the number of turkeys that were shot but not
killed or recovered. Based on the data provided, an estimated 7,214 (+ 1,662) turkeys were shot
but not killed or recovered by hunters during the 2021 spring turkey hunting season. About 9%
of those who answered this question reported to have shot at least one bird they did not
recover.
Satisfaction with turkey hunting experience When asked how they would rate their turkey hunting experience in the 2021 spring
turkey season, 59% of respondents from the statewide sample indicated they were somewhat
or very satisfied, and another 13% indicated being neither dissatisfied nor satisfied (Figure 2).
When compared across land types, the highest percentage (62%) of respondents who indicated
being somewhat or very satisfied were those who hunted on private lands only, and the lowest
percentage (49%) were those hunting on public lands only. Compared to other lands, the
highest percentage of respondents (17%) who indicated neutrality on this satisfaction question
hunted only on public land.
17
Figure 2: Survey respondents' reported satisfaction with the 2021 spring turkey hunting experience by type of land hunted (From top: n1 = 348, n2 = 309, n3 = 1,828, n4 = 2,517)
A comparison of satisfaction with the 2021 spring turkey hunting experience among the
respondents across the different administrative regions showed notable similarity (Figure 3).
Compared to Regions 1 and 4, a slightly higher proportion in Regions 2 and 3 indicated being
very satisfied.
Figure 3: Survey respondents' reported satisfaction with the 2021 spring turkey hunting experience by TWRA region (From top: n1 = 459, n2 = 525, n3 = 994, n4 = 612, n5 = 2,517)
12%
11%
15%
16%
16%
15%
20%
19%
13%
12%
17%
14%
28%
27%
32%
30%
31%
35%
17%
21%
0% 10% 20% 30% 40% 50% 60% 70% 80% 90% 100%
Overall
Private Land Only
Public Land Only
Private and Public
Very dissatisfied Somewhat dissatisfied Neither dissatisfied nor satisfied Somewhat satisfied Very satisfied
12%
14%
12%
12%
13%
16%
19%
14%
16%
18%
13%
12%
12%
15%
14%
28%
31%
27%
26%
28%
31%
25%
35%
31%
27%
0% 10% 20% 30% 40% 50% 60% 70% 80% 90% 100%
Statewide
Region 1
Region 2
Region 3
Region 4
Very dissatisfied Somewhat dissatisfied Neither dissatisfied nor satisfied Somewhat satisfied Very satisfied
18
Perceived change in turkey populations Respondents were asked to indicate (based on their experience over the years) how
they perceive the change in turkey populations in areas they hunted. Over half (60%) of the
respondents statewide indicated to have perceived a decline in turkey populations, whereas
another 16% indicated seeing an increase (Figure 4). A relatively higher proportion of those
hunting in Regions 1 and 4 indicated witnessing declining populations of turkey in the areas
they hunt.
Figure 4: Survey respondents' perception of how turkey populations in the areas they hunt have changed over the years (From top: n1 = 395, n2 = 431, n3 = 832, n4 = 539, n5 = 2,126)
When asked about the perceived reasons behind the decline in the areas they hunt, the
two most commonly reported reasons were predation on nests and poults (reported by 70% of
respondents) and nesting success and poults survival (reported by 52% of respondents; Figure
5). The next three most frequently mentioned reasons were predation on adults (37%), habitat
conditions (24%), and hunting pressure (32%).
16%
13%
15%
18%
15%
24%
22%
26%
26%
22%
60%
65%
59%
57%
63%
0% 10% 20% 30% 40% 50% 60% 70% 80% 90% 100%
Statewide
Region 1
Region 2
Region 3
Region 4
Increased Stayed the same Decreased
19
Figure 5: Percentage of survey respondents who perceived a decline in turkey populations indicating the reasons behind perceived declines in turkey populations in the areas they hunt (n = 1,273)
References Cochran, W. G. 1977. Sampling techniques. John Wiley & Sons, Inc. Canada.
Dillman, D. A., J. D. Smyth, and L. M. Cristian. 2009. Internet, mail, and mixed-mode surveys: The
tailored design method (3rd edi.). John Wiley & Sons Inc.
Mingie, J. C., N.C. Poudyal, J. M. Bowker, M. T. Mengak, and J. P. Siry. 2019. Comparing the net
benefit of forestland access for big-game hunting across landownership types in
Georgia, USA. Forest Science 65(2): 189-200.
Poudyal, N. C., C. Watkins, and O. Joshi. 2020. Economic contribution of wildlife management
areas to local and state economies. Human Dimensions of Wildlife 25(3): 291-295.
Watkins, C., N. C. Poudyal, C. Caplenor, D. Buehler, and R. D. Applegate. 2018. Motivations and
support for regulations: A typology of eastern wild turkey hunters. Human Dimensions
of Wildlife 23(5): 433-445.
4%
7%
12%
14%
17%
21%
32%
24%
37%
52%
70%
0% 10% 20% 30% 40% 50% 60% 70% 80%
Prescribed fire/burning practices
Disease prevalence
Flooding frequency/intensity
Amount of poaching
Don’t know
Weather conditions during nesting
Hunting pressure
Habitat conditions
Predation on adults
Nesting success and poult survival
Predation on nests and poults
20
Appendix A: Survey questionnaire
21
2021 Tennessee Spring Turkey Harvest Survey
You are one of a few randomly selected sportsmen and sportswomen in Tennessee to be
invited to participate in this survey. Your response will help the Tennessee Wildlife Resources
Agency (TWRA) and other stakeholders understand hunters’ effort and success in turkey hunting,
and your opinion and attitude regarding various aspects of turkey hunting will help them make
informed decisions. Even if you did not hunt in the 2021 spring turkey season, please complete
the first few questions and return the survey.
This is a University of Tennessee study with the support of the Tennessee Wildlife Resources
Agency
1. Did you yourself hunt or did you take a youth (under 18 years of age) hunting in Tennessee
during the 2021 spring turkey season (which includes the 2-day Young Sportsman hunt)?
No, please answer Q2 and return this survey
Yes, I hunted, go to Q3
I did not personally hunt but I took a youth hunting, go to Q10
2. If you did not turkey hunt in Tennessee during any of the 2021 spring season, which best
describes your reason for not hunting?
I typically hunt turkeys during the spring season but 2021 was an exception
I typically do not hunt turkeys during the spring
I am not a hunter I hunted in another state in 2021
I stopped hunting to allow the population to rebuild/restore
Other (please specify):__________________
22
3. In the table below, please report only your own (do not include information for others in
your party or those you may have guided) turkey hunting activities for the 2021 spring
turkey season. Report harvest and days hunted in different counties on separate rows, even
if you did not harvest any turkeys in that county. For each turkey harvested, indicate the
type of turkey (bearded hen, jake, or adult gobbler).
County Hunted
Number of days hunted on
private land
Number of days hunted on public land
Number of turkeys harvested
Bearded Hens
Jakes Adult Gobblers
Example: Knox 16 5 0 1 2
4. How many turkeys did you shoot but not kill or recover during the 2021 spring turkey
season? ________
5. On days you hunted, how many hours did you typically hunt? ___________
6. Overall, how would you rate your 2021 spring turkey hunting experience?
Very dissatisfied
Somewhat dissatisfied
Neither dissatisfied nor satisfied
Somewhat satisfied
Very satisfied
7. Based on your experience over the years, how have turkey populations changed in areas
you hunt?
Decreased Stayed the same, go to Q9. Increased Don’t know, go to Q9.
8. I believe the population in the area I hunt has decreased/increased because of changes
in…… (Mark all that apply) __ Hunting pressure __ Habitat conditions __ Amount of poaching __ Disease prevalence __ Nesting success and poult survival __ Flooding frequency/intensity __ Predation on adults __ Weather conditions during nesting
__ Predation on nests and poults __ Don’t know __ Prescribed fire/burning practices __ Others:_______________________
9. Did you take a youth (under 18 years of age) hunting during the 2021 spring turkey hunting season?
Yes, go to Q10 No, stop here and return the survey
10. Please report only turkey hunting activities for youth you mentored during the 2021 spring
turkey season. Report days and hours hunted, even if they did not harvest any turkeys.
Number of youth mentored
Number of days hunted on private land
Number of days hunted on public land
Average number of hours hunted in a day with youth
23
11. How many turkeys were harvested by youth hunters that you mentored in the 2021