71
1

1

My office is located in 1015 Joyner
Library, room number: 1006
Tel: 252-238-5428
Email: [email protected]
You can download sample data files
from:
http://core.ecu.edu/ofe/StatisticsResear
ch/
2

Goals of this workshop
› Learn how to use basic SPSS functions
› Prepare your data for data analysis
3

We use data of 2011 Youth Risk Behavior Surveillance System (YRBSS, CDC) as an example. › YRBSS monitors six types of health-risk behaviors
that contribute to the leading causes of death and disability among youth and adults,
Unintentional injuries and violence
Sexual behaviors
Alcohol and other drug use
Tobacco use
Unhealthy dietary behaviors
Inadequate physical activity
4

Every time when you run SPSS, you will
get the output window at the same time.
› Syntax
5

Data view
› The place to enter data
› Columns: variables
› Rows: records
Variable view
› The place to enter variables
› List of all variables
› Characteristics of all variables
6

Data view (enter data here) › Each variable is a single column (Q1, Q2, etc.)
› Each case is a single row
7

Variable view (enter variables here)
8
Q1, Q2, Q3, etc. are variables.
Type: numeric or string or something else.
Values: how do you code your numeric variables
Measure: scale or ordinal or nominal.
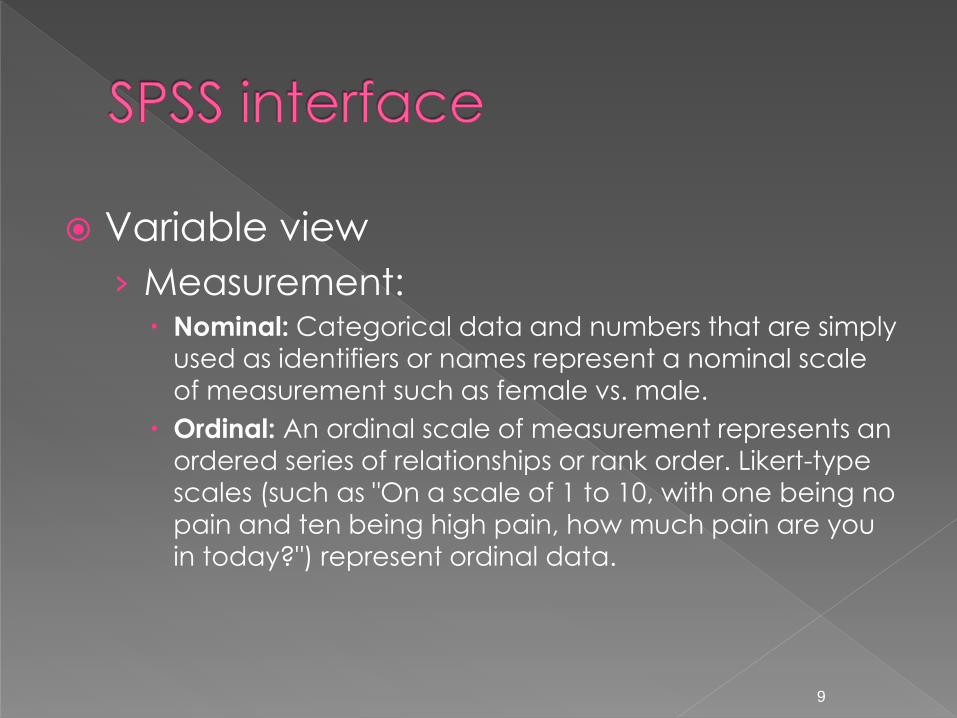
Variable view
› Measurement: Nominal: Categorical data and numbers that are simply
used as identifiers or names represent a nominal scale
of measurement such as female vs. male.
Ordinal: An ordinal scale of measurement represents an ordered series of relationships or rank order. Likert-type
scales (such as "On a scale of 1 to 10, with one being no
pain and ten being high pain, how much pain are you
in today?") represent ordinal data.
9

Interval: A scale that represents quantity and has equal units but for which zero represents simply an additional point of measurement is an interval scale. The Fahrenheit scale is a clear example of the interval scale of measurement. Thus, 60 degree Fahrenheit or -10 degrees Fahrenheit represent interval data.
Ratio: The ratio scale of measurement is similar to the interval scale in that it also represents quantity and has equality of units. However, this scale also has an absolute zero (no numbers exist below zero). For example, height and weight.
10

Variable view: measurement
11
Measure: SPSS uses different symbols to represent scale of
measurement.
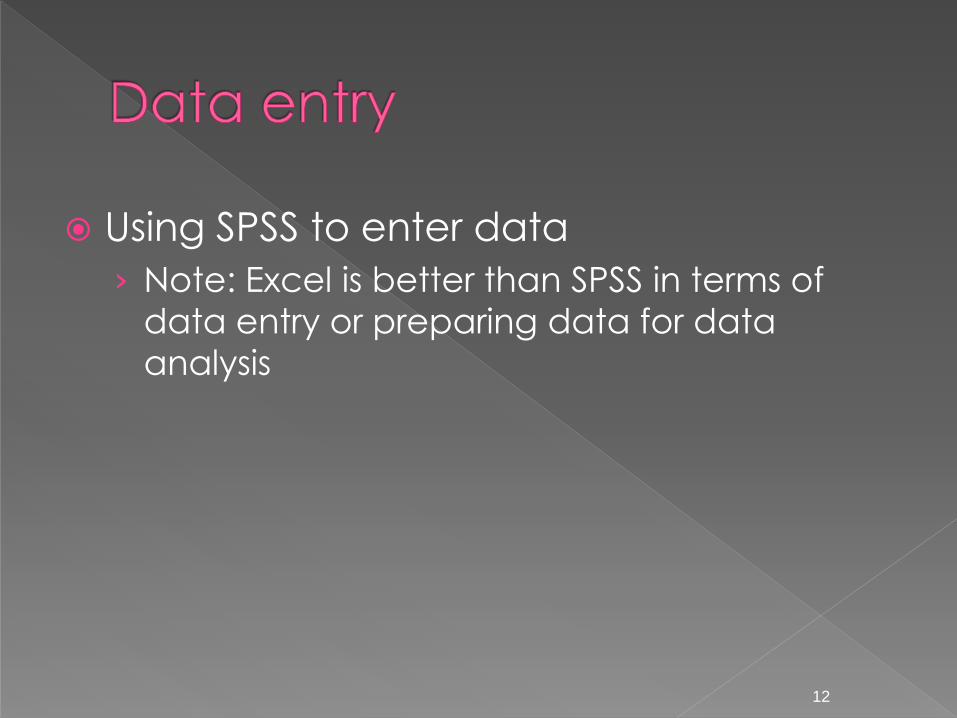
Using SPSS to enter data
› Note: Excel is better than SPSS in terms of
data entry or preparing data for data
analysis
12

Before doing data entry
› You need a code book/scoring guide
› You give ID number for each case (NOT real
identification numbers of your subjects) if you
use paper survey.
› If you use online survey, you need something
to identify your cases.
13
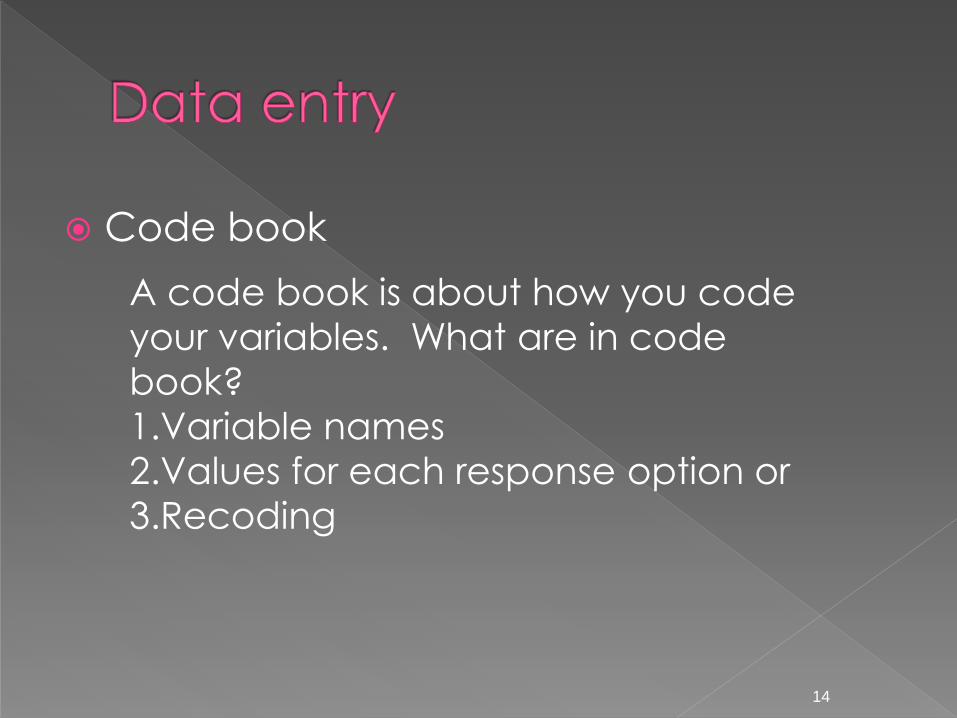
Code book
14
A code book is about how you code
your variables. What are in code
book?
1.Variable names
2.Values for each response option or
3.Recoding

15
Example of a code book
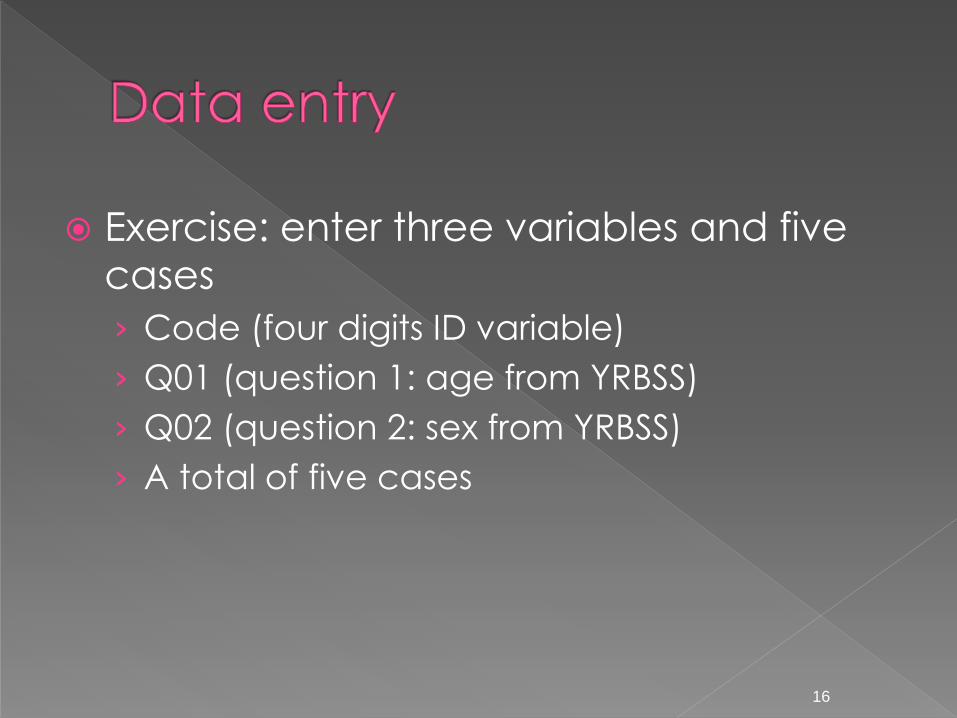
Exercise: enter three variables and five
cases
› Code (four digits ID variable)
› Q01 (question 1: age from YRBSS)
› Q02 (question 2: sex from YRBSS)
› A total of five cases
16

17
First, enter variables under Variable View › Type variable name under Name column (e.g.
Q01).
› Variable name can be 64 bytes long, and
the first character must be a letter or one of
the characters @, #, or $.
› Type: Numeric, string, etc.
› Label: description of variables.
› Values: variable coding

Exercise: enter variables
› Three variables are all numeric variables
18

19
Enter values
› Click the right corner of Values for Q01
variable
› We will see a tiny button and click it
› A window will pop up

Enter variables: enter values
20
1. Value means how you
code each response
option, such as 1 = 12
years old or younger, 2=
13 years old… 7 = 18
years old or older.
2. Label means how you
label that response
option.
3. Click Add button to add
value and label at the
same time.
4. After finish inputting all
response options, click
OK.
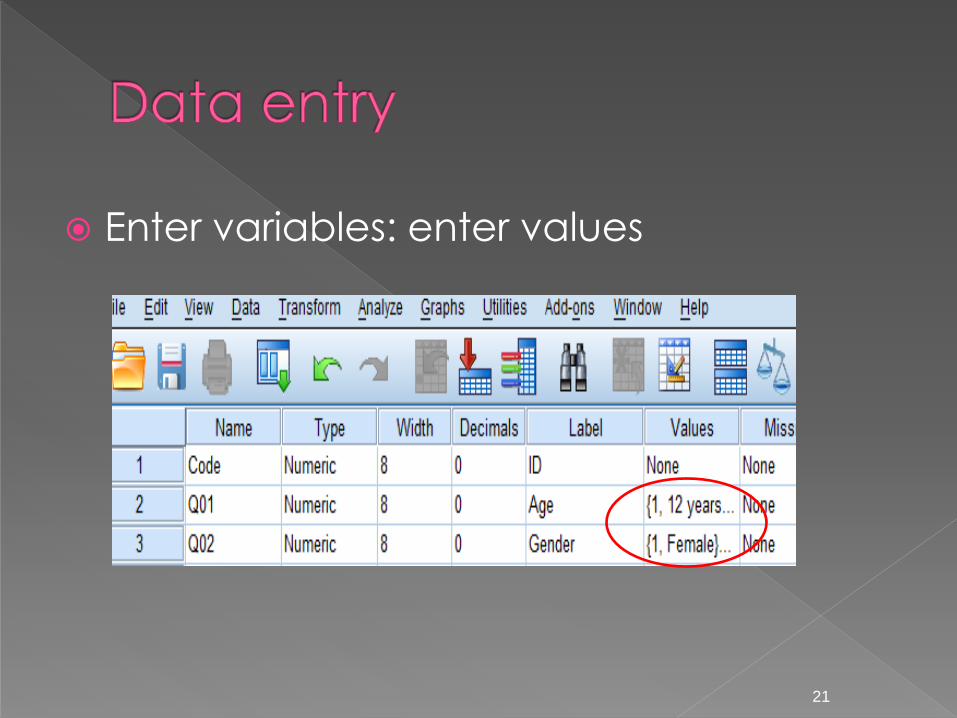
Enter variables: enter values
21

22
Enter data under Data View
› Enter five cases: type values for each
variable

Always treat your data with
honesty, integrity, and ethics!
23

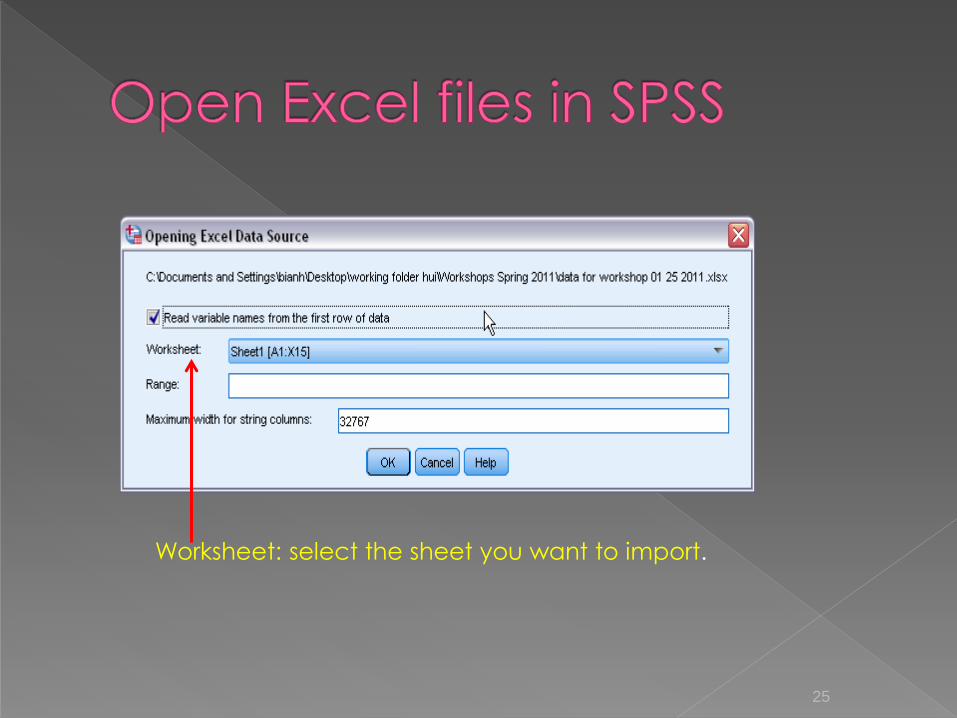
Select File > Open >Data
Choose Excel as file type
Select the file you want to import
Then click Open
24
25
Worksheet: select the sheet you want to import.

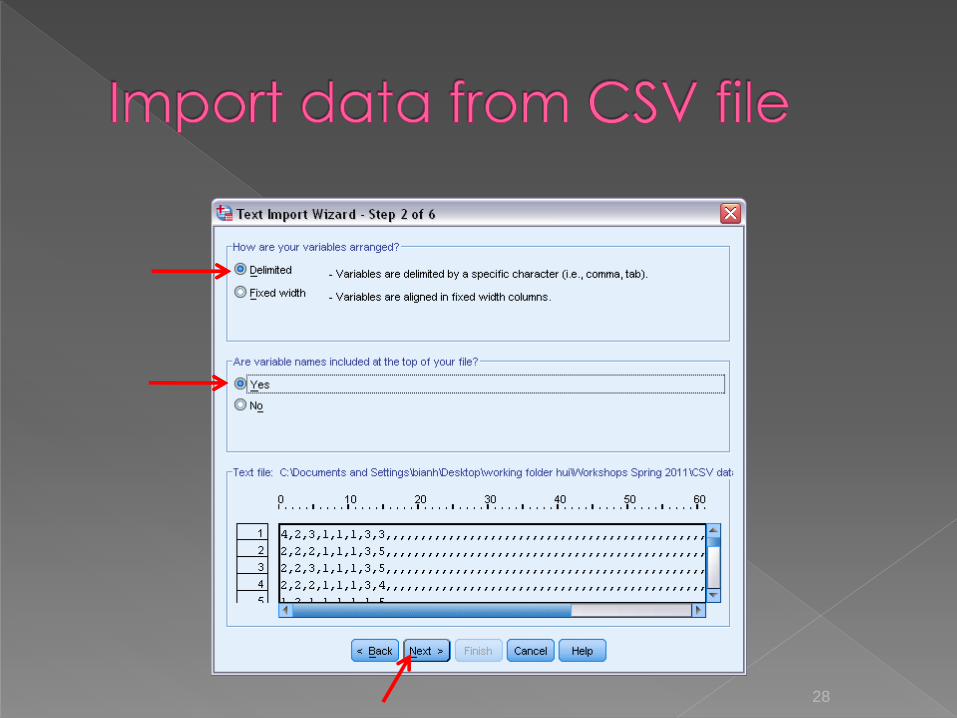
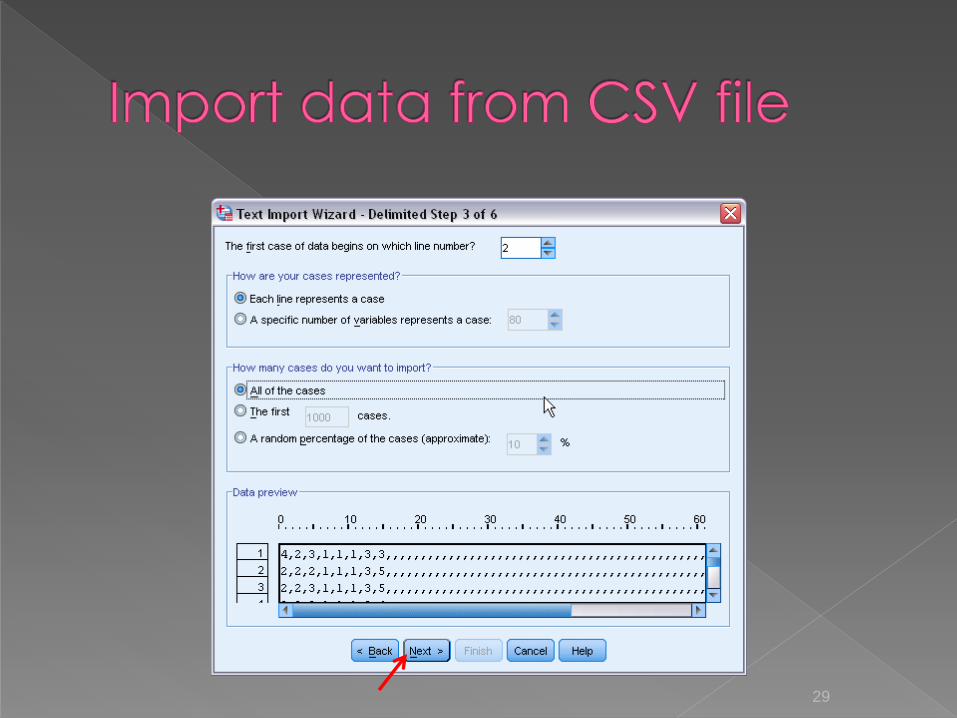
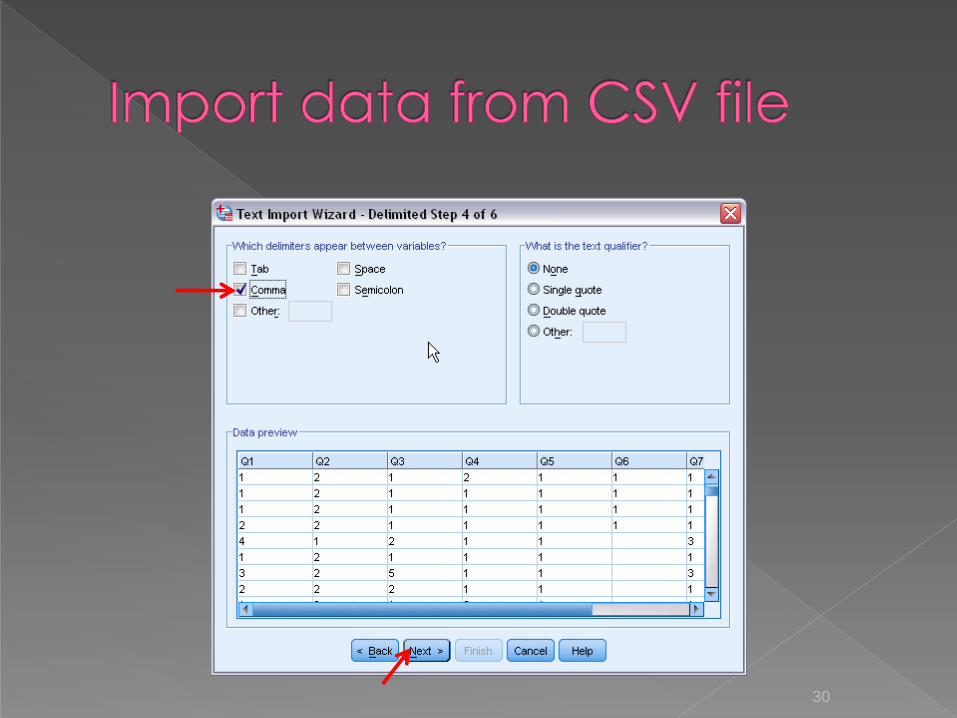
CSV is a comma-separated values file.
If you use online survey (e.g. Qualtrics) to
collect data, you can get a CSV data
file.
Select File > Open >Data
Choose Text as file type
Select the file you want to import
Then click Open
26

27
28
29
30

31

32

33
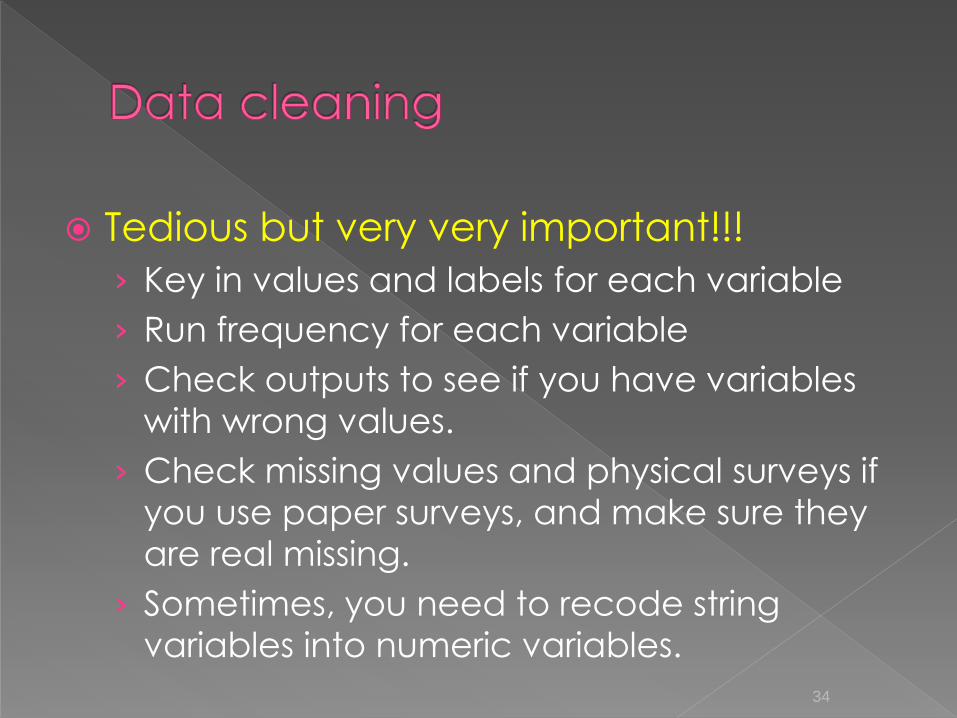
Tedious but very very important!!!
› Key in values and labels for each variable
› Run frequency for each variable
› Check outputs to see if you have variables
with wrong values.
› Check missing values and physical surveys if
you use paper surveys, and make sure they
are real missing.
› Sometimes, you need to recode string
variables into numeric variables.
34

Exercise: run frequency of Q1 from YRBSS
2011 data
› Go to Analyze > Descriptive Statistics >
Frequencies
35

Output of Frequency analysis of Q1
36
Wrong
entries
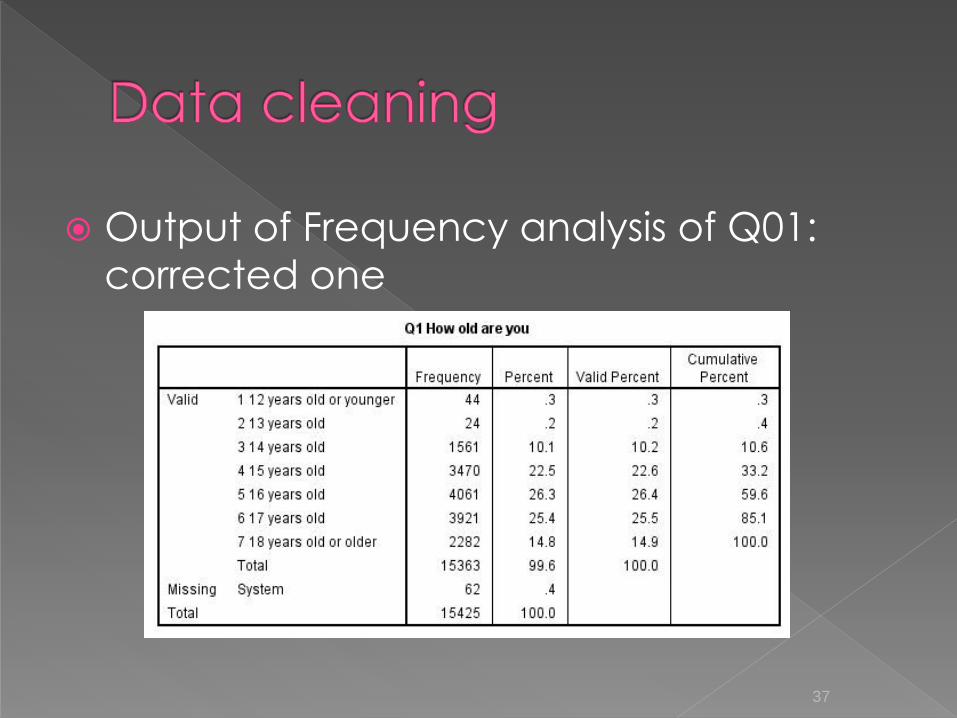
Output of Frequency analysis of Q01:
corrected one
37
Convert Multivariate to Univariate Format
› Multivariate structure: That is all values for
each subject appear in one row under
column’s names defined as the same for
all subjects.
38
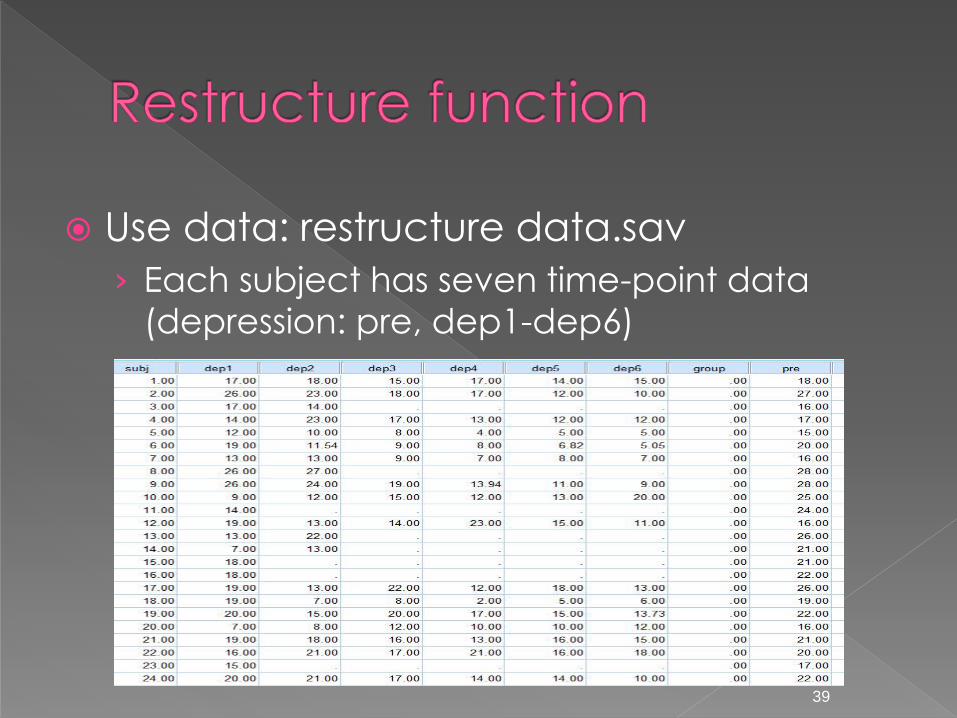
Use data: restructure data.sav
› Each subject has seven time-point data
(depression: pre, dep1-dep6)
39

40
Go to Data > Restructure

We only have one variable (depression
variable) that needs to be transposed.
41

42

43

44

45

46
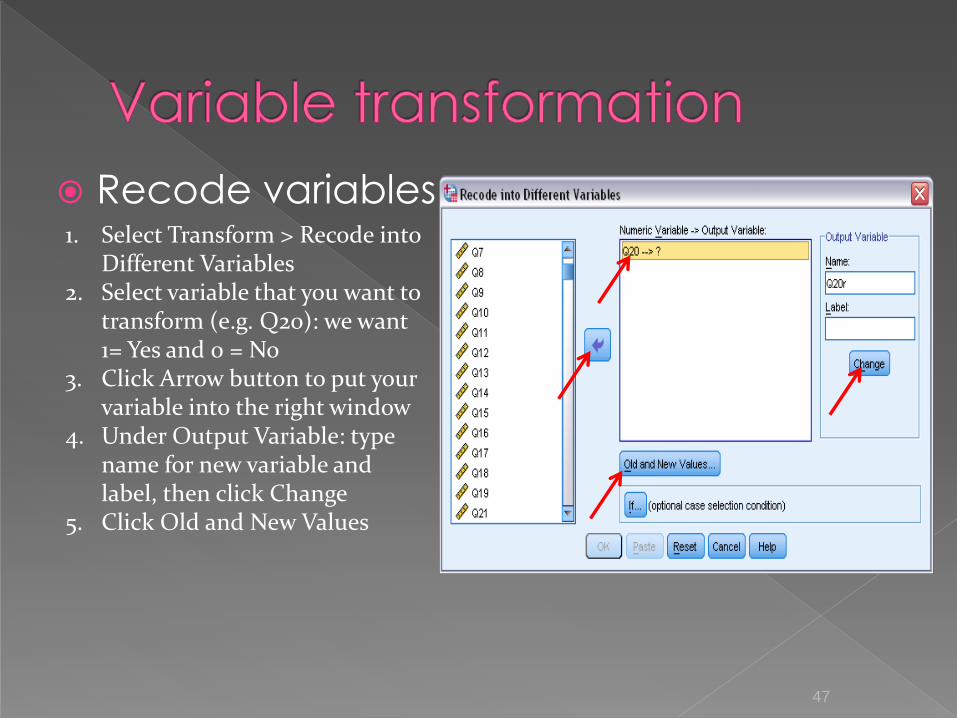
Recode variables
47
1. Select Transform > Recode into Different Variables
2. Select variable that you want to transform (e.g. Q20): we want
1= Yes and 0 = No 3. Click Arrow button to put your
variable into the right window 4. Under Output Variable: type
name for new variable and label, then click Change
5. Click Old and New Values

6. Type 1 under Old Value
and 1 under New Value,
click Add. Then type 2
under Old Value, and 0
under New Value, click
Add.
7. Click Continue after
finish all the changes.
8. Click Ok
48

Exercise: recode variable Q31, Q42, Q48,
and Q51
› Recode 1 = 0 days/times into 0 = non-use
› Recode >= 2 (other categories) into 1 = use
49

Compute variable (use YRBSS 2009 data)
Example 1. Create a new variable: drug_use (During
the past 30 days, any use of cigarettes, alcohol, and
marijuana is defined as use, else as non-use). There are
two categories for the new variable (use vs. non-use).
Coding for new variable: 1= Use and 0 = Non-use
1. Use Q31, Q42, and Q48 from 2009 YRBSS survey
2. Non-users means those who answered 0 days/times to
all three questions.
3. Go to Transform > Compute Variable
50
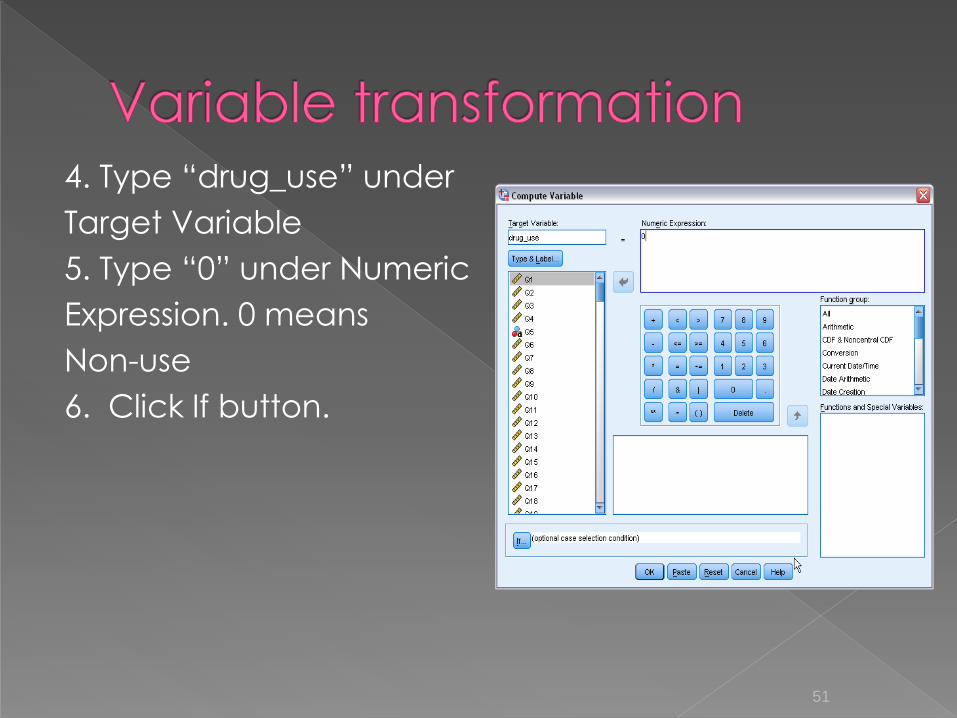
4. Type “drug_use” under
Target Variable
5. Type “0” under Numeric
Expression. 0 means
Non-use
6. Click If button.
51

7. With help of that
Arrow button, type
Q31= 1 & Q42 = 1 & Q48= 1
then click Continue
8. Do the same thing for
Use, but the numeric
expression is different:
Q31> 1 | Q42 > 1 | Q48>1
52

9. Click OK
10. After click OK,
a small window asks
if you want to
change existing
variable because
drug_use was already
created when you
first define non-use.
11. Click ok.
53

Compute variables Example 2. Create a new variable drug_N
that assesses total number of drugs that adolescents used during the last 30 days.
1.Use Q31 (cigarettes), 42 (alcohol), 48 (marijuana), and 51 (cocaine). The number of drugs used should be between 0 and 4.
2.First, recode all four variables into two categories: 0 = non-use (0 days), 1 = use (at least 1 day/time)
3.Four variables have 6 or 7 categories
54

4. Recode four variables: 1 (old) = 0 (new), 2-6/7 (old)
= 1 (New).
5. Then select Transform > Compute Variable
55

6. Type drug_N under Target Variable
7. Numeric Expression: SUM (Q31r,Q42r,Q48r,Q51r)
8. Click OK
56

Compute variables
› Example 3: Convert string variable into
numeric variable
› Q2 (Gender From CSV data file) is a string
variable. Convert this variable into a numeric
variable. Female = 1 and Male = 2.
› Go to Transform > Computer Variable
57
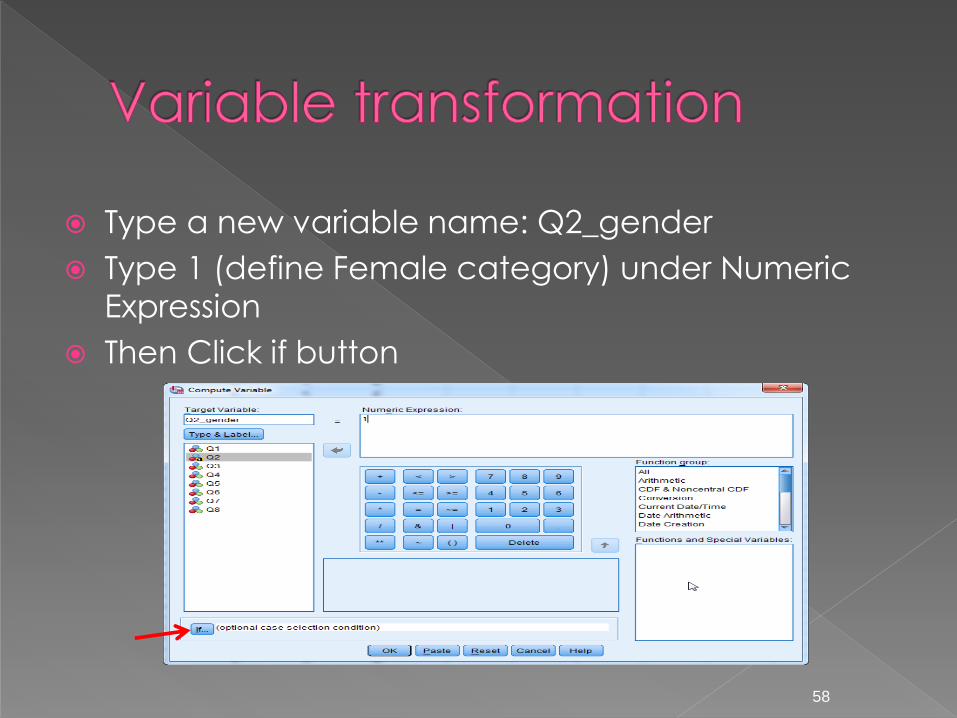
Type a new variable name: Q2_gender
Type 1 (define Female category) under Numeric
Expression
Then Click if button
58
59
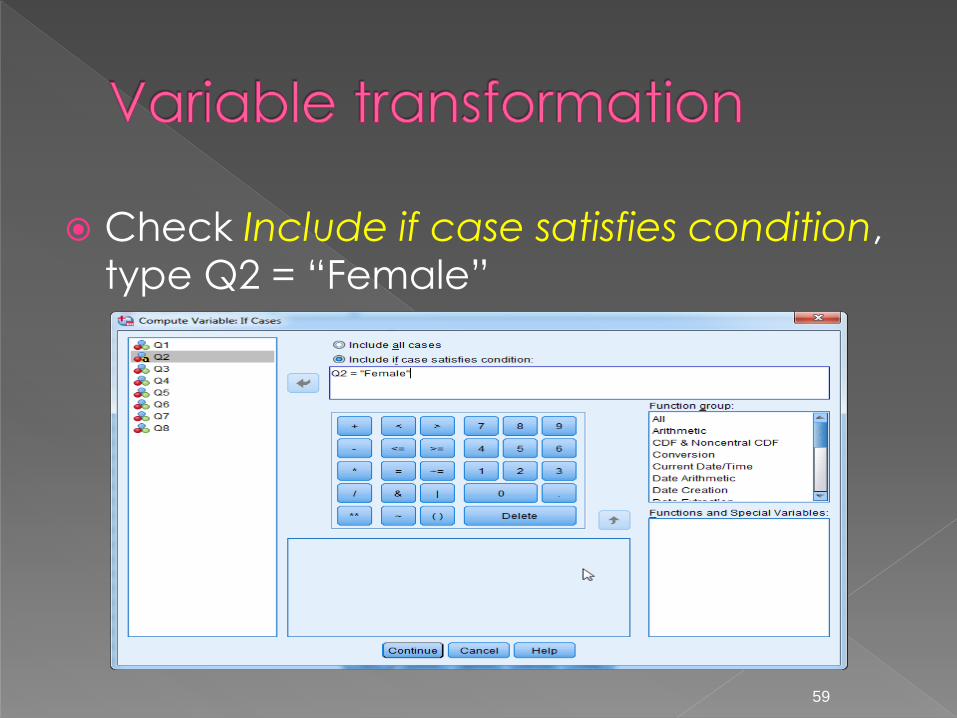
Check Include if case satisfies condition,
type Q2 = “Female”

The same procedure for convert Male
into 2.
60

Sort cases by variables: Data > Sort Cases
You can use Sort Cases to find missing.
61
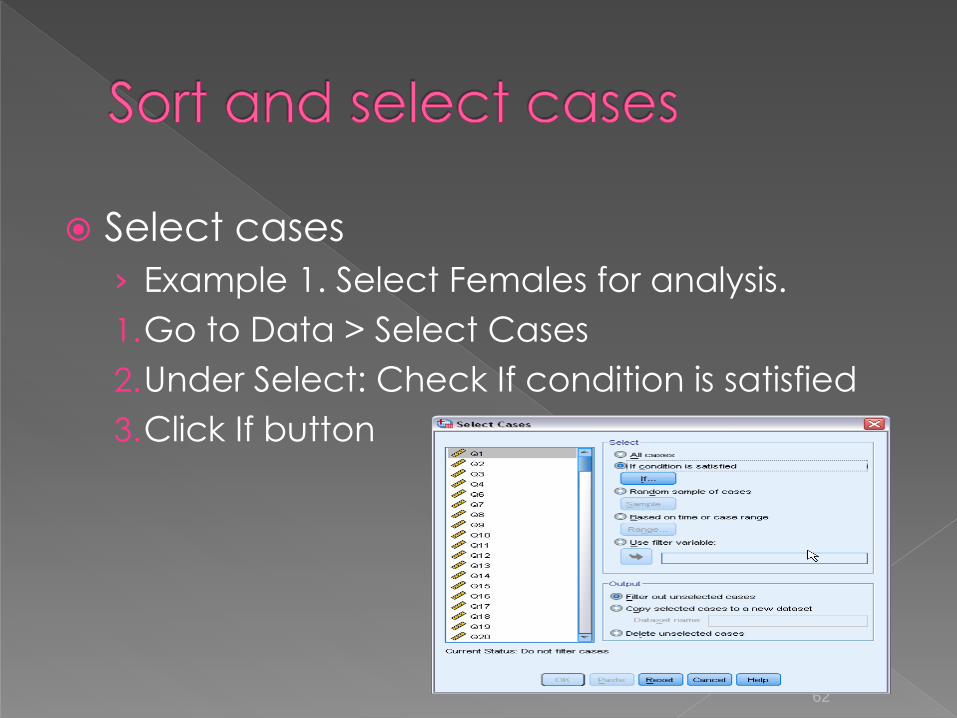
Select cases
› Example 1. Select Females for analysis.
1.Go to Data > Select Cases
2.Under Select: Check If condition is satisfied
3.Click If button
62
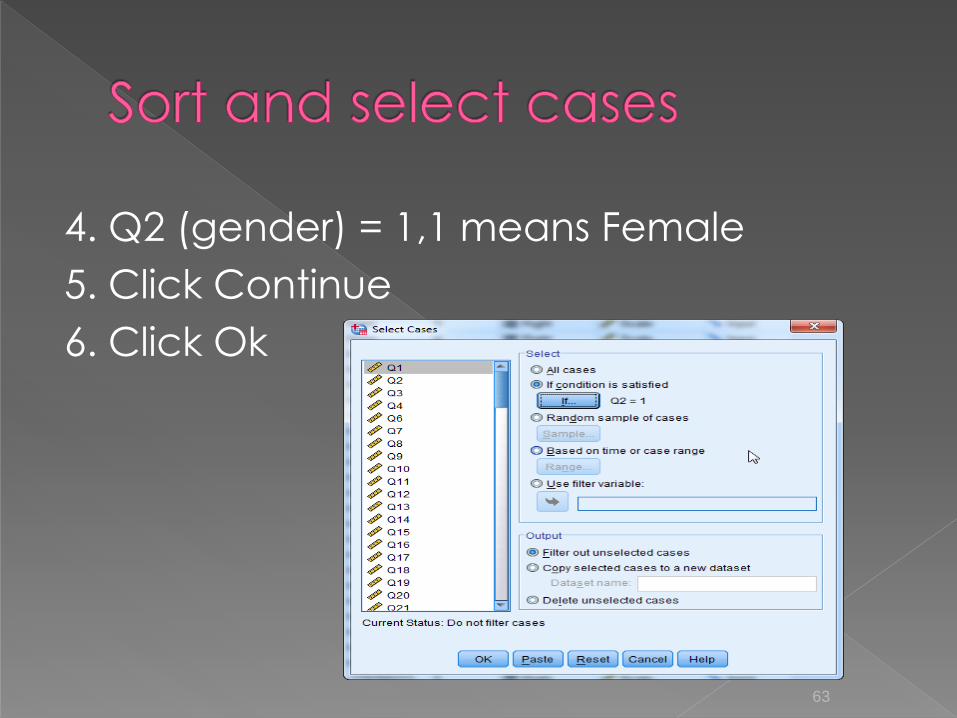
4. Q2 (gender) = 1,1 means Female
5. Click Continue
6. Click Ok
63
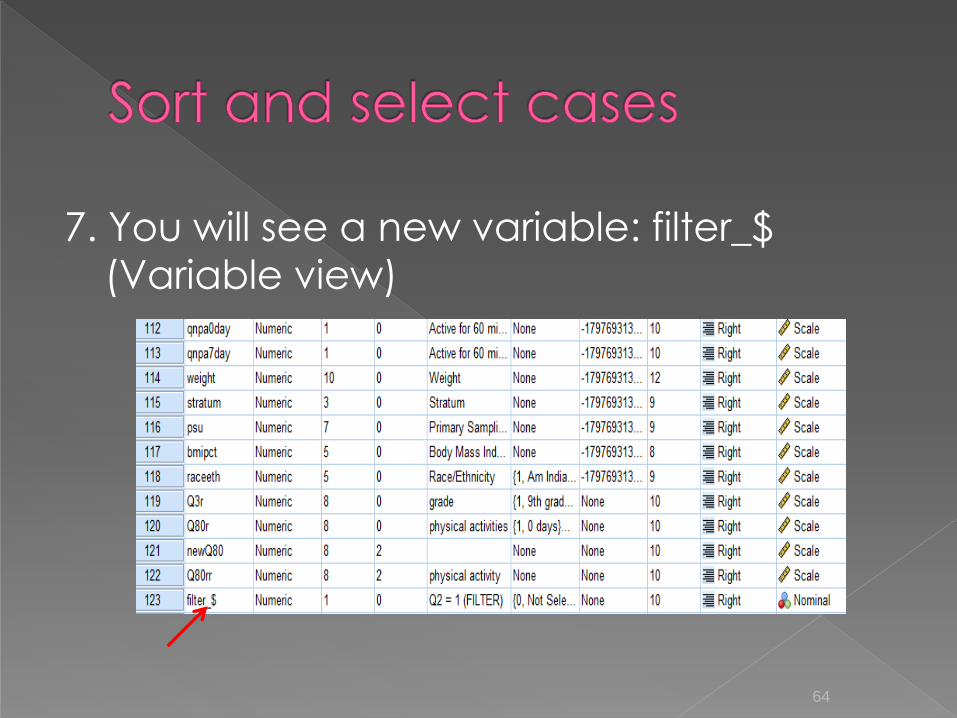
7. You will see a new variable: filter_$
(Variable view)
64

65
Slash means Unselected
cases. They are
excluded from the data
analysis.

Select cases
› Example 2. Select cases who used any of cigarettes, alcohol,
and marijuana during the last 30 days.
1. Data > Select Cases
2. Click If button
3. Type Q31 > 1 | Q42 > 1 | Q48 > 1, click Continue
66
For example, we have both baseline
and posttest data files and want to
merge them into one file.
Before merge files, we need to sort
cases by matching variable first. In this
example, code is the matching
variable.
67

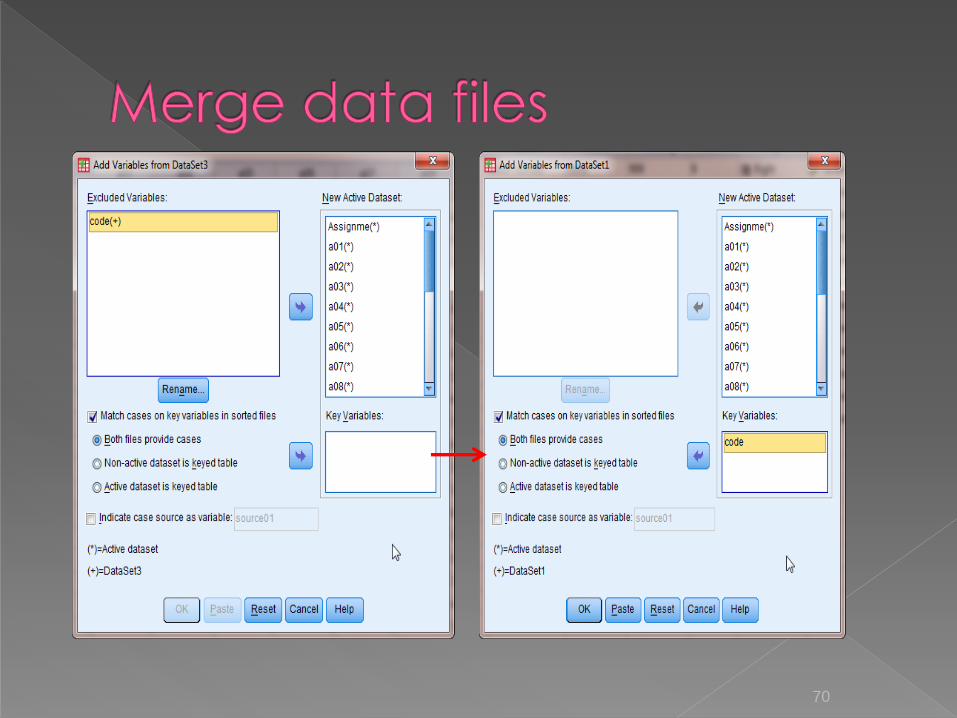
› Use baseline data file as active dataset
› Open both baseline and posttest data files
(or just open baseline data file)
› Go to Data > Merge Files: two choices: Add
cases and Add variables
› For this example, we choose Add variables
(we want to add posttest variables into the
file)
68

69
70

71


