38
SSH BOND PRESENTATION 4 June 2015 1
SSH BOND
PRESENTATION4 June 20151
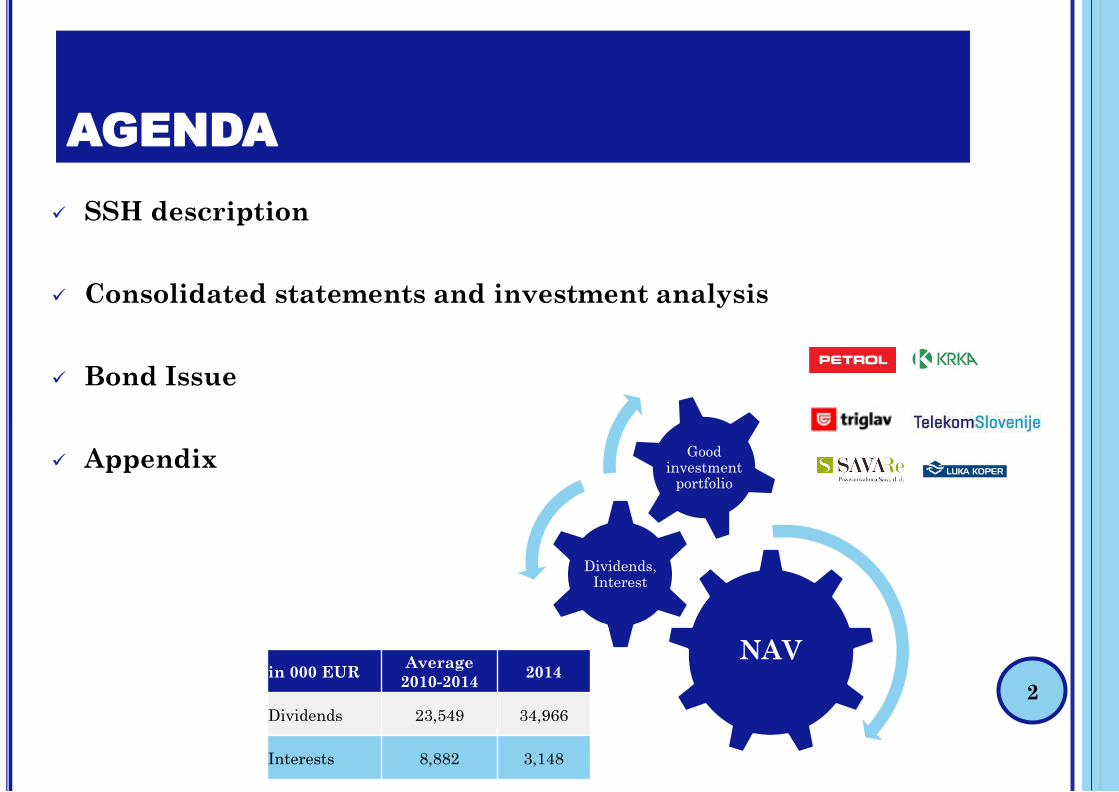
AGENDA
2
SSH description
Consolidated statements and investment analysis
Bond Issue
Appendix
in 000 EURAverage
2010-20142014
Dividends 23,549 34,966
Interests 8,882 3,148
NAV
Dividends, Interest
Good investment
portfolio
SSH DESCRIPTION3

SSH DESCRIPTION
4
SSH is organised as a public limited company whose sole founder and shareholder is the Republic of Slovenia(RS). The Company's bodies and their responsibilities are determined by ZSDH-1 and the Articles of Associationof SSH. SSH has four bodies: the General Meeting, the Management Board, the Supervisory Board and theExpert Committee for Economic and Social Issues. The powers and duties held by the SSH General Meeting arecarried out by the Government of the RS. SSH has a two-tier management system, comprising the Managementand Supervisory Boards.
Main Areas of Operation of SSH:
Asset Management: The management of capital assets in direct or indirect ownership of the RS includes theacquisition and disposition of capital assets and the exercise of rights of a shareholder.
Denationalisation: SSH participates in denationalisation proceedings and in procedures for thedetermination of compensation for liable entities in which property has been restored to denationalisationbeneficiaries in kind.
Settlement of liabilities arising from compensation: On behalf of and for the account of RS, SSH performsduties stipulated by special laws also regulating the method of the financing of these duties.
Type of capital asset
Situation as of 31.12.2014
Capital assets of SSH
Capital assets held in direct
ownership by the RS and managed
by SSH
Active capital assets 30 66
Inactive assets (companies in
bankruptcy, liquidation)12 12
Total 42 78
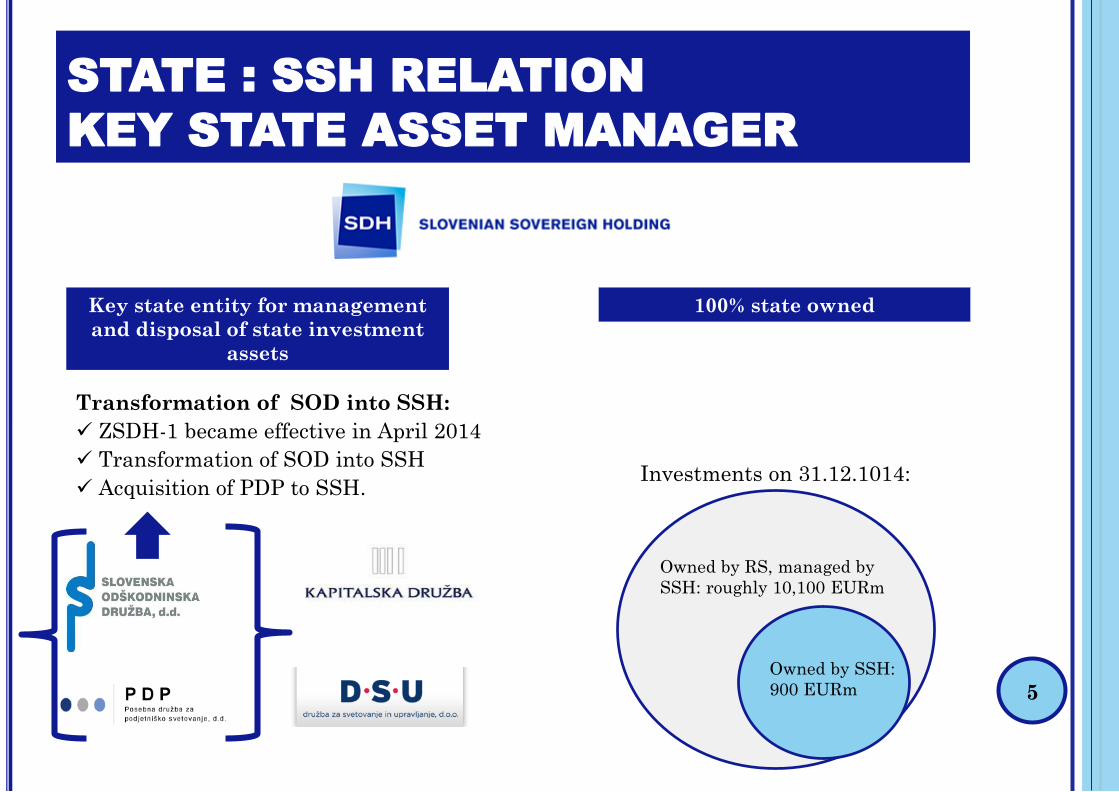
STATE : SSH RELATION
KEY STATE ASSET MANAGER
5
100% state ownedKey state entity for management
and disposal of state investment
assets
Transformation of SOD into SSH:
ZSDH-1 became effective in April 2014
Transformation of SOD into SSH
Acquisition of PDP to SSH.
Owned by RS, managed by
SSH: roughly 10,100 EURm
Owned by SSH:
900 EURm
Investments on 31.12.1014:
STATE : SSH RELATION
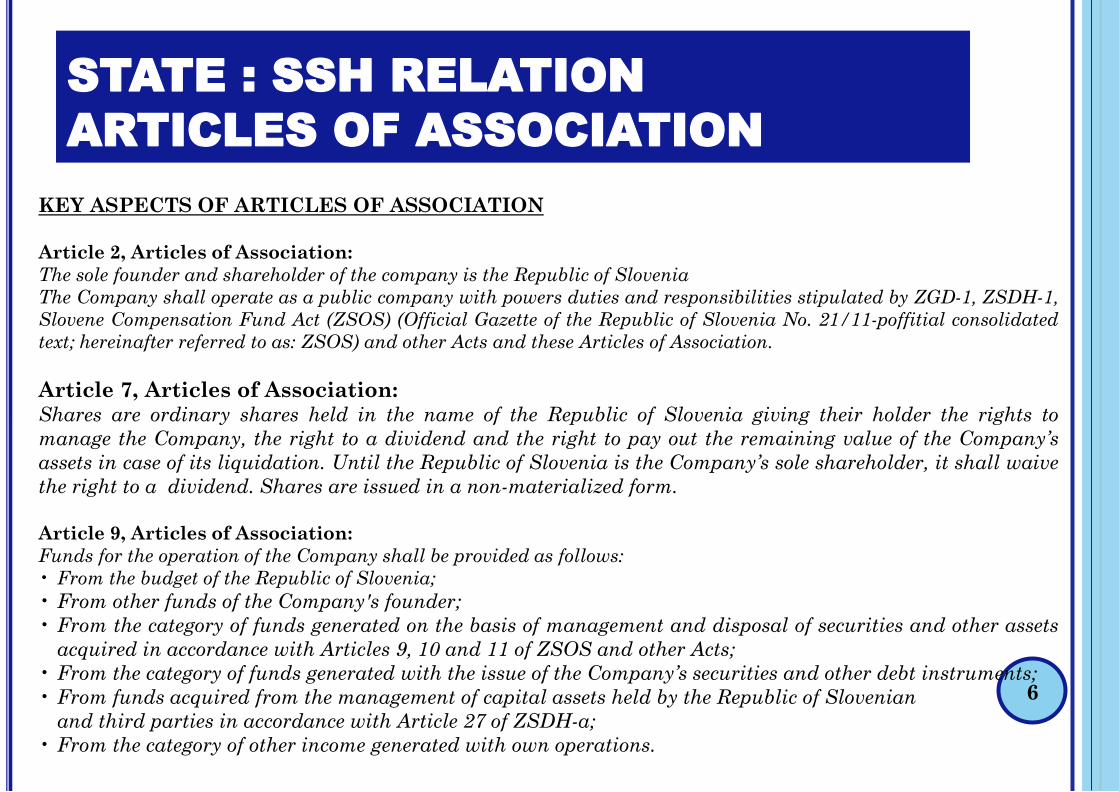
ARTICLES OF ASSOCIATION
6
KEY ASPECTS OF ARTICLES OF ASSOCIATION
Article 2, Articles of Association:
The sole founder and shareholder of the company is the Republic of Slovenia
The Company shall operate as a public company with powers duties and responsibilities stipulated by ZGD-1, ZSDH-1,
Slovene Compensation Fund Act (ZSOS) (Official Gazette of the Republic of Slovenia No. 21/11-poffitial consolidated
text; hereinafter referred to as: ZSOS) and other Acts and these Articles of Association.
Article 7, Articles of Association:Shares are ordinary shares held in the name of the Republic of Slovenia giving their holder the rights to
manage the Company, the right to a dividend and the right to pay out the remaining value of the Company’s
assets in case of its liquidation. Until the Republic of Slovenia is the Company’s sole shareholder, it shall waive
the right to a dividend. Shares are issued in a non-materialized form.
Article 9, Articles of Association:
Funds for the operation of the Company shall be provided as follows:
• From the budget of the Republic of Slovenia;
• From other funds of the Company's founder;
• From the category of funds generated on the basis of management and disposal of securities and other assets
acquired in accordance with Articles 9, 10 and 11 of ZSOS and other Acts;
• From the category of funds generated with the issue of the Company’s securities and other debt instruments;
• From funds acquired from the management of capital assets held by the Republic of Slovenian
and third parties in accordance with Article 27 of ZSDH-a;
• From the category of other income generated with own operations.
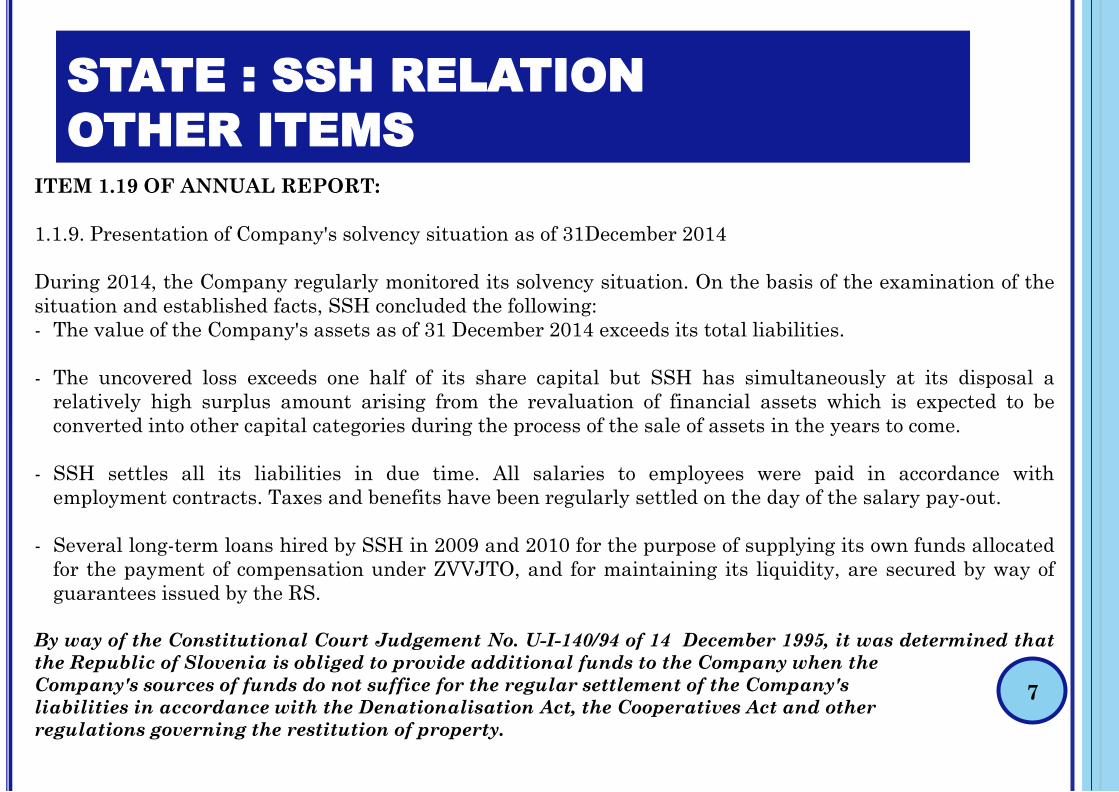
STATE : SSH RELATION
OTHER ITEMS
7
ITEM 1.19 OF ANNUAL REPORT:
1.1.9. Presentation of Company's solvency situation as of 31December 2014
During 2014, the Company regularly monitored its solvency situation. On the basis of the examination of the
situation and established facts, SSH concluded the following:
- The value of the Company's assets as of 31 December 2014 exceeds its total liabilities.
- The uncovered loss exceeds one half of its share capital but SSH has simultaneously at its disposal a
relatively high surplus amount arising from the revaluation of financial assets which is expected to be
converted into other capital categories during the process of the sale of assets in the years to come.
- SSH settles all its liabilities in due time. All salaries to employees were paid in accordance with
employment contracts. Taxes and benefits have been regularly settled on the day of the salary pay-out.
- Several long-term loans hired by SSH in 2009 and 2010 for the purpose of supplying its own funds allocated
for the payment of compensation under ZVVJTO, and for maintaining its liquidity, are secured by way of
guarantees issued by the RS.
By way of the Constitutional Court Judgement No. U-I-140/94 of 14 December 1995, it was determined that
the Republic of Slovenia is obliged to provide additional funds to the Company when the
Company's sources of funds do not suffice for the regular settlement of the Company's
liabilities in accordance with the Denationalisation Act, the Cooperatives Act and other
regulations governing the restitution of property.
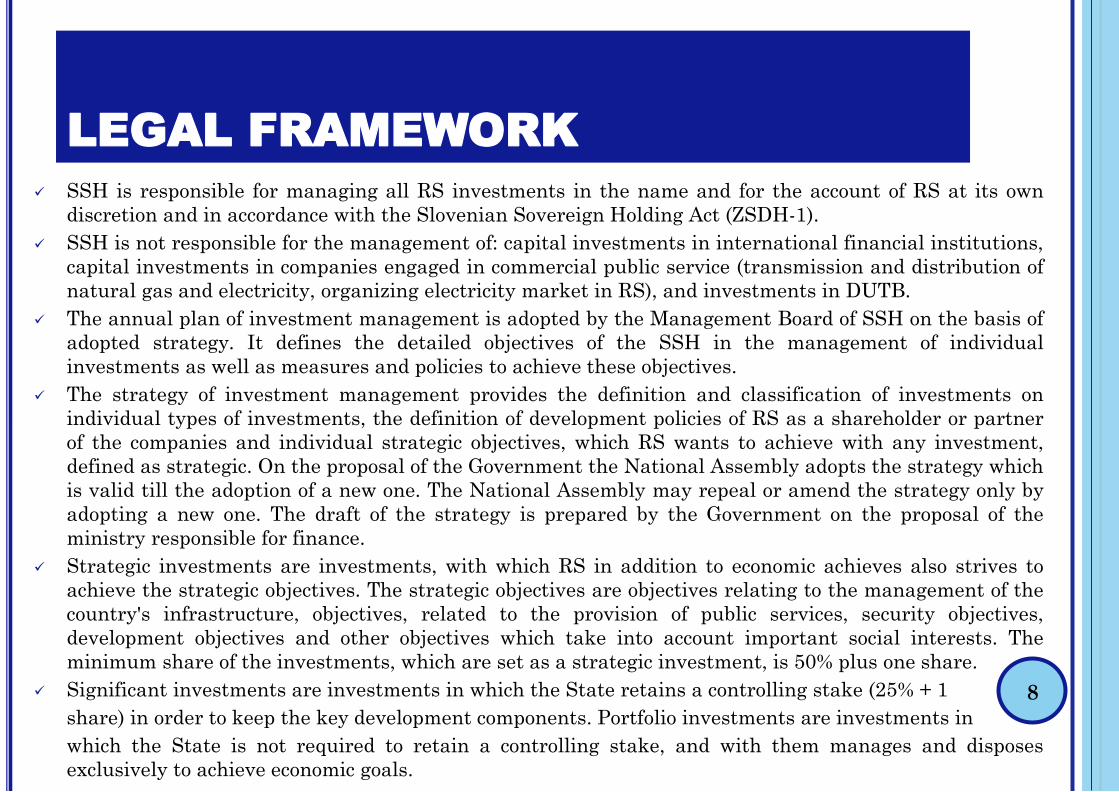
LEGAL FRAMEWORK
8
SSH is responsible for managing all RS investments in the name and for the account of RS at its own
discretion and in accordance with the Slovenian Sovereign Holding Act (ZSDH-1).
SSH is not responsible for the management of: capital investments in international financial institutions,
capital investments in companies engaged in commercial public service (transmission and distribution of
natural gas and electricity, organizing electricity market in RS), and investments in DUTB.
The annual plan of investment management is adopted by the Management Board of SSH on the basis of
adopted strategy. It defines the detailed objectives of the SSH in the management of individual
investments as well as measures and policies to achieve these objectives.
The strategy of investment management provides the definition and classification of investments on
individual types of investments, the definition of development policies of RS as a shareholder or partner
of the companies and individual strategic objectives, which RS wants to achieve with any investment,
defined as strategic. On the proposal of the Government the National Assembly adopts the strategy which
is valid till the adoption of a new one. The National Assembly may repeal or amend the strategy only by
adopting a new one. The draft of the strategy is prepared by the Government on the proposal of the
ministry responsible for finance.
Strategic investments are investments, with which RS in addition to economic achieves also strives to
achieve the strategic objectives. The strategic objectives are objectives relating to the management of the
country's infrastructure, objectives, related to the provision of public services, security objectives,
development objectives and other objectives which take into account important social interests. The
minimum share of the investments, which are set as a strategic investment, is 50% plus one share.
Significant investments are investments in which the State retains a controlling stake (25% + 1
share) in order to keep the key development components. Portfolio investments are investments in
which the State is not required to retain a controlling stake, and with them manages and disposes
exclusively to achieve economic goals.
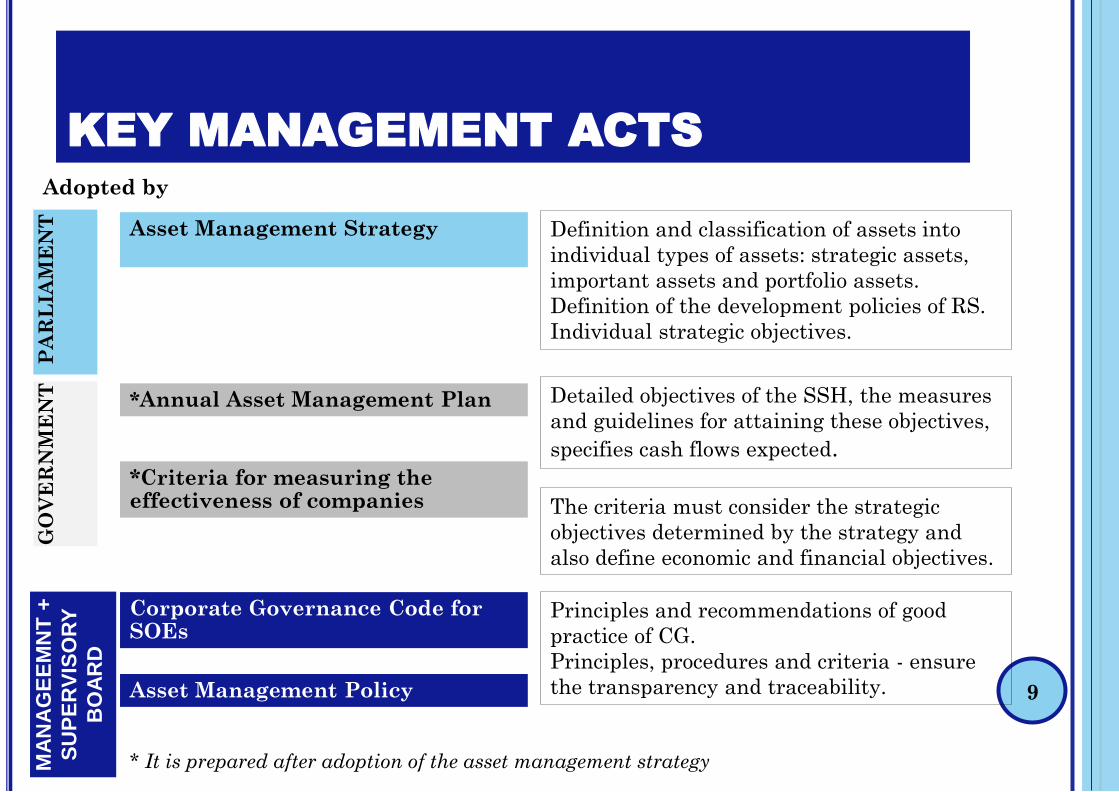
KEY MANAGEMENT ACTS
9
Asset Management Strategy
*Annual Asset Management Plan
Asset Management Policy
Corporate Governance Code for SOEs
PA
RL
IAM
EN
TG
OV
ER
NM
EN
TM
AN
AG
EE
MN
T +
SU
PE
RV
ISO
RY
BO
AR
D
Definition and classification of assets into
individual types of assets: strategic assets,
important assets and portfolio assets.
Definition of the development policies of RS.
Individual strategic objectives.
Detailed objectives of the SSH, the measures
and guidelines for attaining these objectives,
specifies cash flows expected.
Principles and recommendations of good
practice of CG.
Principles, procedures and criteria - ensure
the transparency and traceability.
*Criteria for measuring the effectiveness of companies
Adopted by
The criteria must consider the strategic
objectives determined by the strategy and
also define economic and financial objectives.
* It is prepared after adoption of the asset management strategy
IMPROVEMENT IN CORPORATE
GOVERNANCE
10
Adoption of the Code of corporate governance of companies with State capital investment (dec 2014)
Adoption of Management policy (dec 2014)
Preparation of the Manual for the work of Supervisory Board Members (nov 2014)
Adoption or update of Recommendations and expectations of SSH and encouraging the companies to
strictly enforce them (dec 2014)
Acceptance of the Criteria for recruitment of supervisors (dec 2014)
Implementation of monthly training sessions for supervisors of state companies
Promoting the introduction of the European model of excellence in the company (EFQM)
Changes in the statutes and acts on the establishing of some companies
Many adopted internal rules: Rules of Procedure of KK, Rules of Procedure of ESSO, Rules on Risk
Management, Introduction to vote at general meetings of companies, more instructions from proxy for
compliance and business integrity ...
ASSET MANAGEMENT STRATEGY
11
The objectives pursued by the RS in the management of state capital investments are:
the increase in value of investments,
ensuring the highest possible return for the shareholders and
exercise of other potential strategic objectives in the investments, which are defined as strategic.
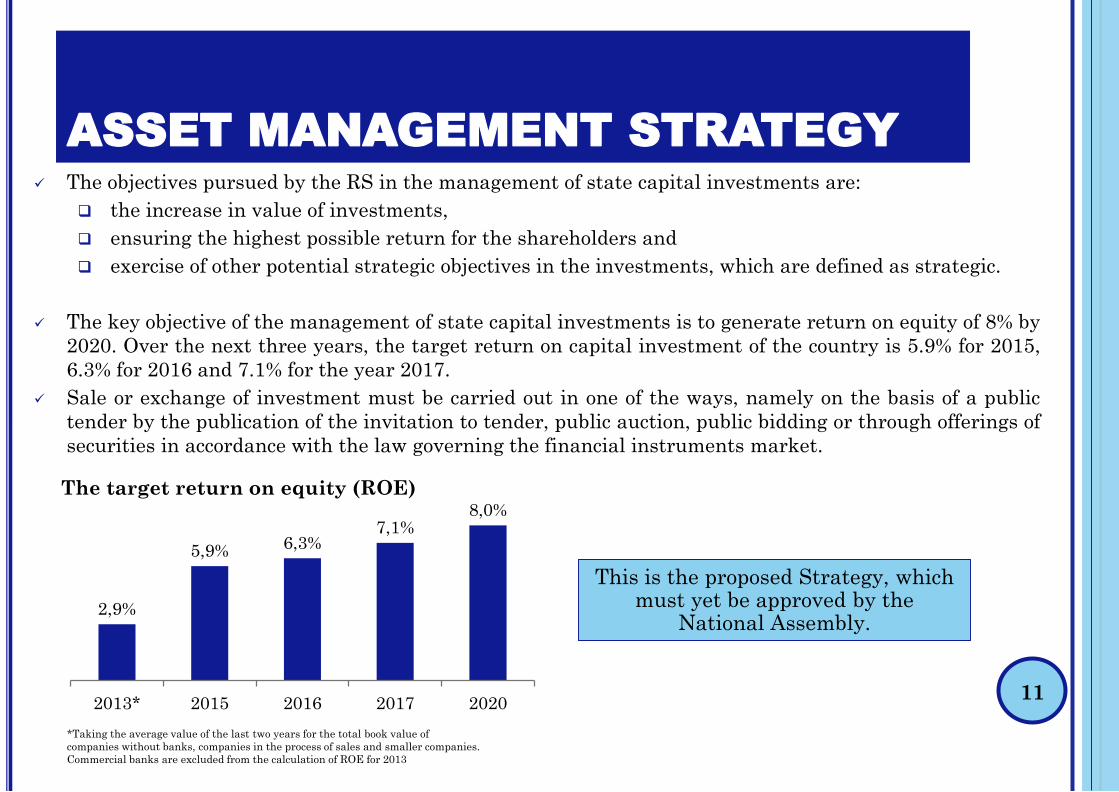
The key objective of the management of state capital investments is to generate return on equity of 8% by
2020. Over the next three years, the target return on capital investment of the country is 5.9% for 2015,
6.3% for 2016 and 7.1% for the year 2017.
Sale or exchange of investment must be carried out in one of the ways, namely on the basis of a public
tender by the publication of the invitation to tender, public auction, public bidding or through offerings of
securities in accordance with the law governing the financial instruments market.
This is the proposed Strategy, which must yet be approved by the
National Assembly.2,9%
5,9% 6,3%7,1%
8,0%
2013* 2015 2016 2017 2020
The target return on equity (ROE)
*Taking the average value of the last two years for the total book value of
companies without banks, companies in the process of sales and smaller companies.
Commercial banks are excluded from the calculation of ROE for 2013
PRIVATIZATION PROCESS
12
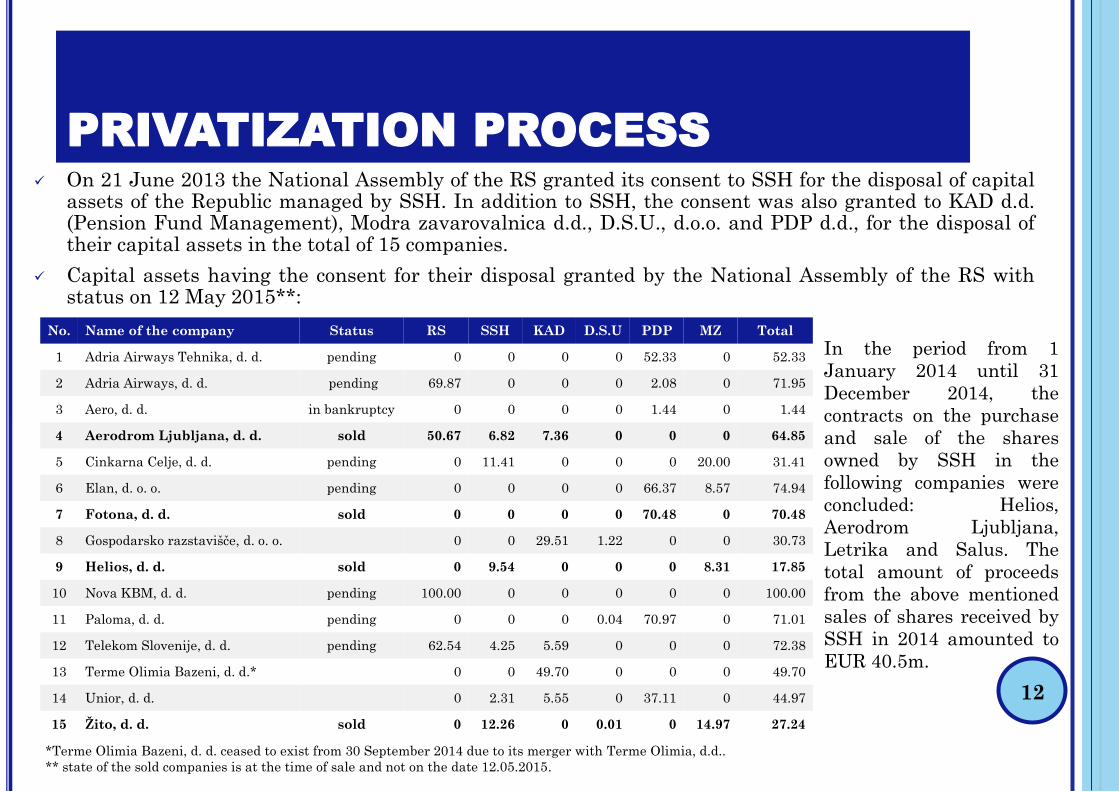
On 21 June 2013 the National Assembly of the RS granted its consent to SSH for the disposal of capitalassets of the Republic managed by SSH. In addition to SSH, the consent was also granted to KAD d.d.(Pension Fund Management), Modra zavarovalnica d.d., D.S.U., d.o.o. and PDP d.d., for the disposal oftheir capital assets in the total of 15 companies.
Capital assets having the consent for their disposal granted by the National Assembly of the RS withstatus on 12 May 2015**:
In the period from 1
January 2014 until 31
December 2014, the
contracts on the purchase
and sale of the shares
owned by SSH in the
following companies were
concluded: Helios,
Aerodrom Ljubljana,
Letrika and Salus. The
total amount of proceeds
from the above mentioned
sales of shares received by
SSH in 2014 amounted to
EUR 40.5m.
*Terme Olimia Bazeni, d. d. ceased to exist from 30 September 2014 due to its merger with Terme Olimia, d.d..
** state of the sold companies is at the time of sale and not on the date 12.05.2015.
No. Name of the company Status RS SSH KAD D.S.U PDP MZ Total
1 Adria Airways Tehnika, d. d. pending 0 0 0 0 52.33 0 52.33
2 Adria Airways, d. d. pending 69.87 0 0 0 2.08 0 71.95
3 Aero, d. d. in bankruptcy 0 0 0 0 1.44 0 1.44
4 Aerodrom Ljubljana, d. d. sold 50.67 6.82 7.36 0 0 0 64.85
5 Cinkarna Celje, d. d. pending 0 11.41 0 0 0 20.00 31.41
6 Elan, d. o. o. pending 0 0 0 0 66.37 8.57 74.94
7 Fotona, d. d. sold 0 0 0 0 70.48 0 70.48
8 Gospodarsko razstavišče, d. o. o. 0 0 29.51 1.22 0 0 30.73
9 Helios, d. d. sold 0 9.54 0 0 0 8.31 17.85
10 Nova KBM, d. d. pending 100.00 0 0 0 0 0 100.00
11 Paloma, d. d. pending 0 0 0 0.04 70.97 0 71.01
12 Telekom Slovenije, d. d. pending 62.54 4.25 5.59 0 0 0 72.38
13 Terme Olimia Bazeni, d. d.* 0 0 49.70 0 0 0 49.70
14 Unior, d. d. 0 2.31 5.55 0 37.11 0 44.97
15 Žito, d. d. sold 0 12.26 0 0.01 0 14.97 27.24
CONSOLIDATED
STATEMENTS AND
INVESTMENT ANALYSIS13
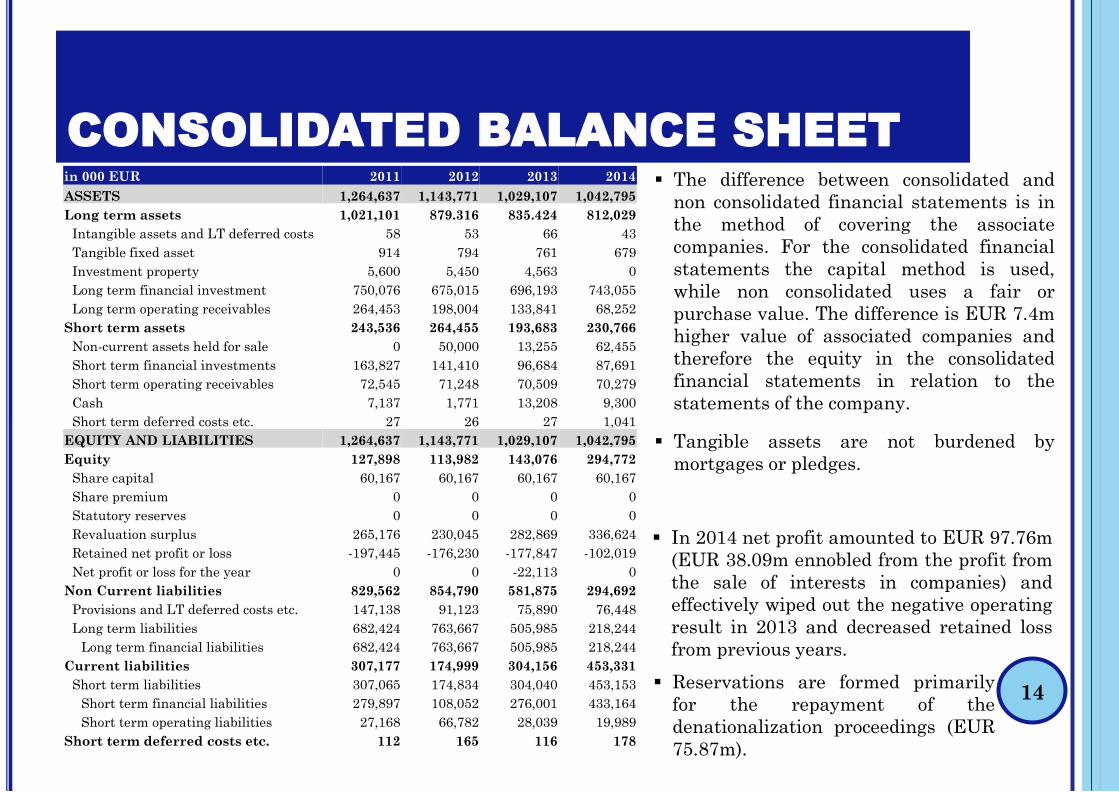
CONSOLIDATED BALANCE SHEET
14
In 2014 net profit amounted to EUR 97.76m
(EUR 38.09m ennobled from the profit from
the sale of interests in companies) and
effectively wiped out the negative operating
result in 2013 and decreased retained loss
from previous years.
Reservations are formed primarily
for the repayment of the
denationalization proceedings (EUR
75.87m).
The difference between consolidated and
non consolidated financial statements is in
the method of covering the associate
companies. For the consolidated financial
statements the capital method is used,
while non consolidated uses a fair or
purchase value. The difference is EUR 7.4m
higher value of associated companies and
therefore the equity in the consolidated
financial statements in relation to the
statements of the company.
Tangible assets are not burdened by
mortgages or pledges.
in 000 EUR 2011 2012 2013 2014
ASSETS 1,264,637 1,143,771 1,029,107 1,042,795
Long term assets 1,021,101 879.316 835.424 812,029
Intangible assets and LT deferred costs 58 53 66 43
Tangible fixed asset 914 794 761 679
Investment property 5,600 5,450 4,563 0
Long term financial investment 750,076 675,015 696,193 743,055
Long term operating receivables 264,453 198,004 133,841 68,252
Short term assets 243,536 264,455 193,683 230,766
Non-current assets held for sale 0 50,000 13,255 62,455
Short term financial investments 163,827 141,410 96,684 87,691
Short term operating receivables 72,545 71,248 70,509 70,279
Cash 7,137 1,771 13,208 9,300
Short term deferred costs etc. 27 26 27 1,041
EQUITY AND LIABILITIES 1,264,637 1,143,771 1,029,107 1,042,795
Equity 127,898 113,982 143,076 294,772
Share capital 60,167 60,167 60,167 60,167
Share premium 0 0 0 0
Statutory reserves 0 0 0 0
Revaluation surplus 265,176 230,045 282,869 336,624
Retained net profit or loss -197,445 -176,230 -177,847 -102,019
Net profit or loss for the year 0 0 -22,113 0
Non Current liabilities 829,562 854,790 581,875 294,692
Provisions and LT deferred costs etc. 147,138 91,123 75,890 76,448
Long term liabilities 682,424 763,667 505,985 218,244
Long term financial liabilities 682,424 763,667 505,985 218,244
Current liabilities 307,177 174,999 304,156 453,331
Short term liabilities 307,065 174,834 304,040 453,153
Short term financial liabilities 279,897 108,052 276,001 433,164
Short term operating liabilities 27,168 66,782 28,039 19,989
Short term deferred costs etc. 112 165 116 178
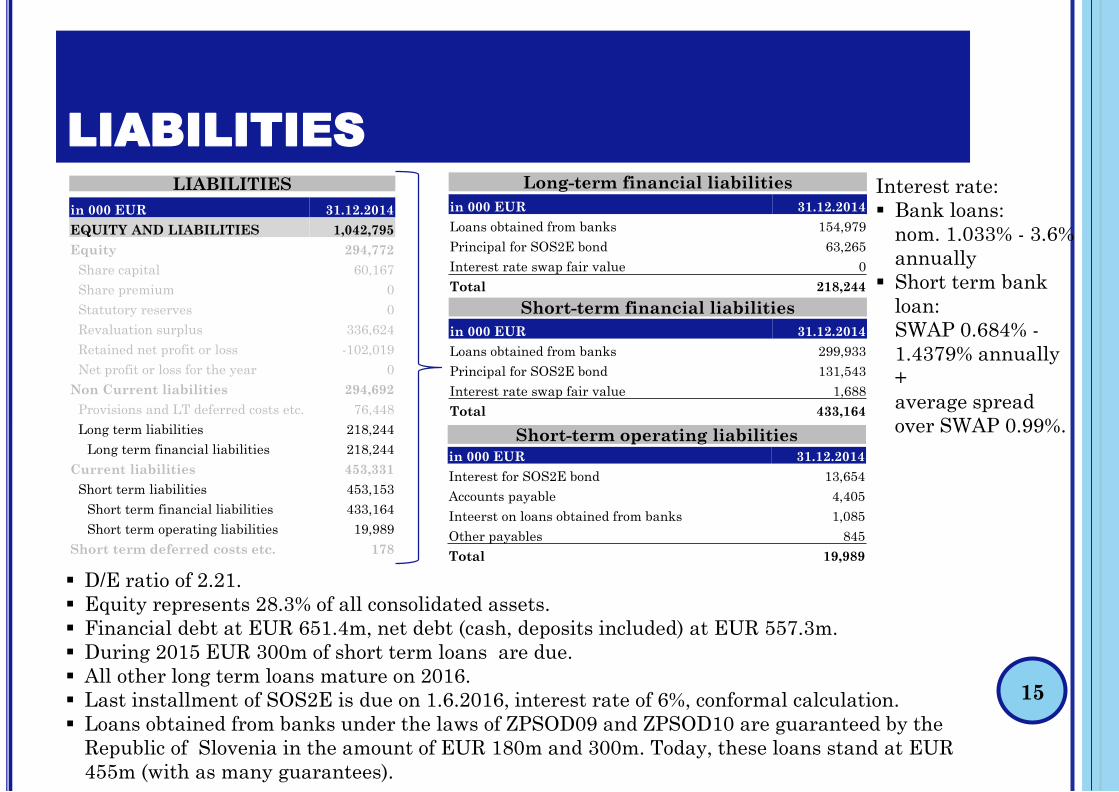
LIABILITIES
15
in 000 EUR 31.12.2014
EQUITY AND LIABILITIES 1,042,795
Equity 294,772
Share capital 60,167
Share premium 0
Statutory reserves 0
Revaluation surplus 336,624
Retained net profit or loss -102,019
Net profit or loss for the year 0
Non Current liabilities 294,692
Provisions and LT deferred costs etc. 76,448
Long term liabilities 218,244
Long term financial liabilities 218,244
Current liabilities 453,331
Short term liabilities 453,153
Short term financial liabilities 433,164
Short term operating liabilities 19,989
Short term deferred costs etc. 178
in 000 EUR 31.12.2014
Loans obtained from banks 299,933
Principal for SOS2E bond 131,543
Interest rate swap fair value 1,688
Total 433,164
in 000 EUR 31.12.2014
Loans obtained from banks 154,979
Principal for SOS2E bond 63,265
Interest rate swap fair value 0
Total 218,244
Short-term financial liabilities
Long-term financial liabilities
D/E ratio of 2.21.
Equity represents 28.3% of all consolidated assets.
Financial debt at EUR 651.4m, net debt (cash, deposits included) at EUR 557.3m.
During 2015 EUR 300m of short term loans are due.
All other long term loans mature on 2016.
Last installment of SOS2E is due on 1.6.2016, interest rate of 6%, conformal calculation.
Loans obtained from banks under the laws of ZPSOD09 and ZPSOD10 are guaranteed by the
Republic of Slovenia in the amount of EUR 180m and 300m. Today, these loans stand at EUR
455m (with as many guarantees).
LIABILITIES
in 000 EUR 31.12.2014
Interest for SOS2E bond 13,654
Accounts payable 4,405
Inteerst on loans obtained from banks 1,085
Other payables 845
Total 19,989
Short-term operating liabilities
Interest rate:
Bank loans:
nom. 1.033% - 3.6%
annually
Short term bank
loan:
SWAP 0.684% -
1.4379% annually
+
average spread
over SWAP 0.99%.
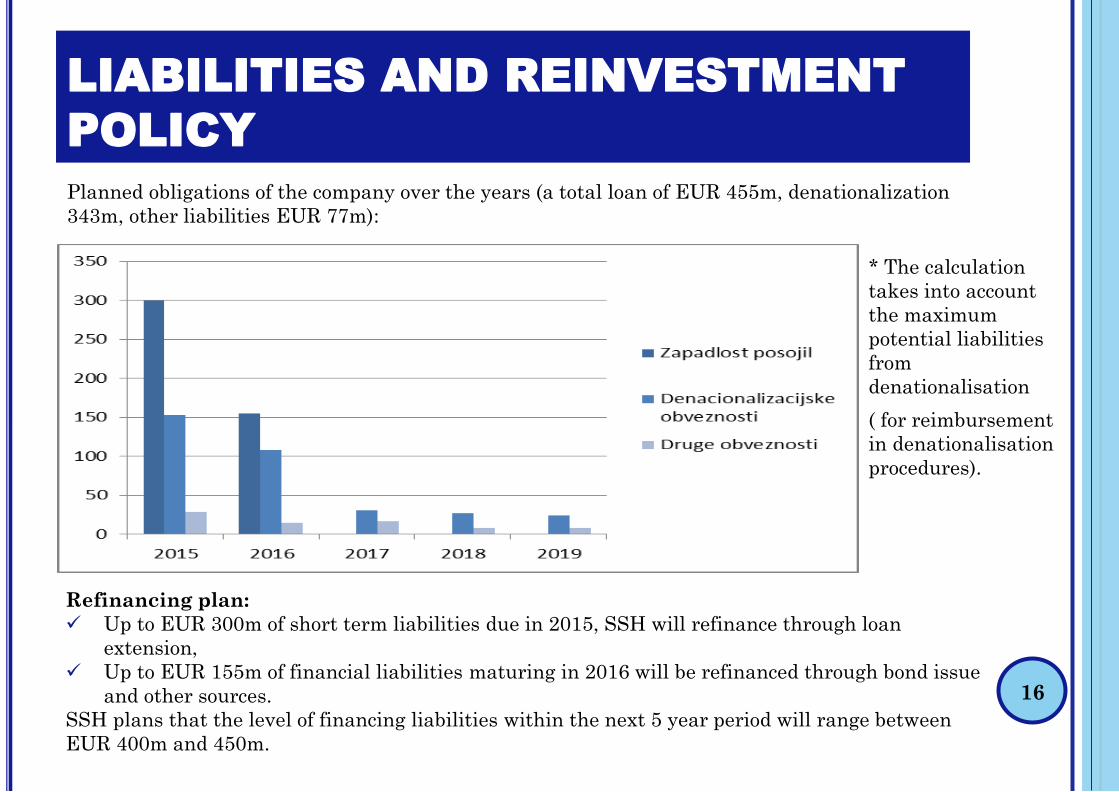
LIABILITIES AND REINVESTMENT
POLICY
16
Planned obligations of the company over the years (a total loan of EUR 455m, denationalization
343m, other liabilities EUR 77m):
* The calculation
takes into account
the maximum
potential liabilities
from
denationalisation
( for reimbursement
in denationalisation
procedures).
Refinancing plan:
Up to EUR 300m of short term liabilities due in 2015, SSH will refinance through loan
extension,
Up to EUR 155m of financial liabilities maturing in 2016 will be refinanced through bond issue
and other sources.
SSH plans that the level of financing liabilities within the next 5 year period will range between
EUR 400m and 450m.
LIQUIDITY MANAGEMENT
17
In 2014 Slovenian Sovereign Holding settled all its liabilities in due time.
Resources to cover SSH obligation in 2014:
dividends of companies owned by SSH,
deposits
revenue from the sale of capital assets,
revenue from the sale of UCITS units of mutual funds,
inflow from receivables due from the Republic of Slovenia (pursuant to ZVVJTO, ZSPOZ,
ZIOOZP).
Cash outflows for the settlement of SSH statutory obligations were higher by 10% than outflows
in 2013. More than 92% of all statutorily stipulated cash flows represent outflows in accordance
with the Denationalisation Act.
As of 31 December 2014, the total SSH debt arising from long-term loans amounted to EUR
455m; of this amount, EUR 300m is due in 2015 and EUR 155m in 2016.
For loan refinancing during 2015, current environment of lower sovereign yields is beneficial.
As of 31 December 2014, the value of investment portfolio for liquidity purposes (in
addition to key capital investments) is at EUR 131.5m. This is spearheaded by deposits (70%)
and mutual fund assets (18%). Return of investment portfolio amounted to 4.4% (versus
3.5% in 2013). This is used as liquidity reserve, which together with other capital investment
forms the majority of SSH assets.
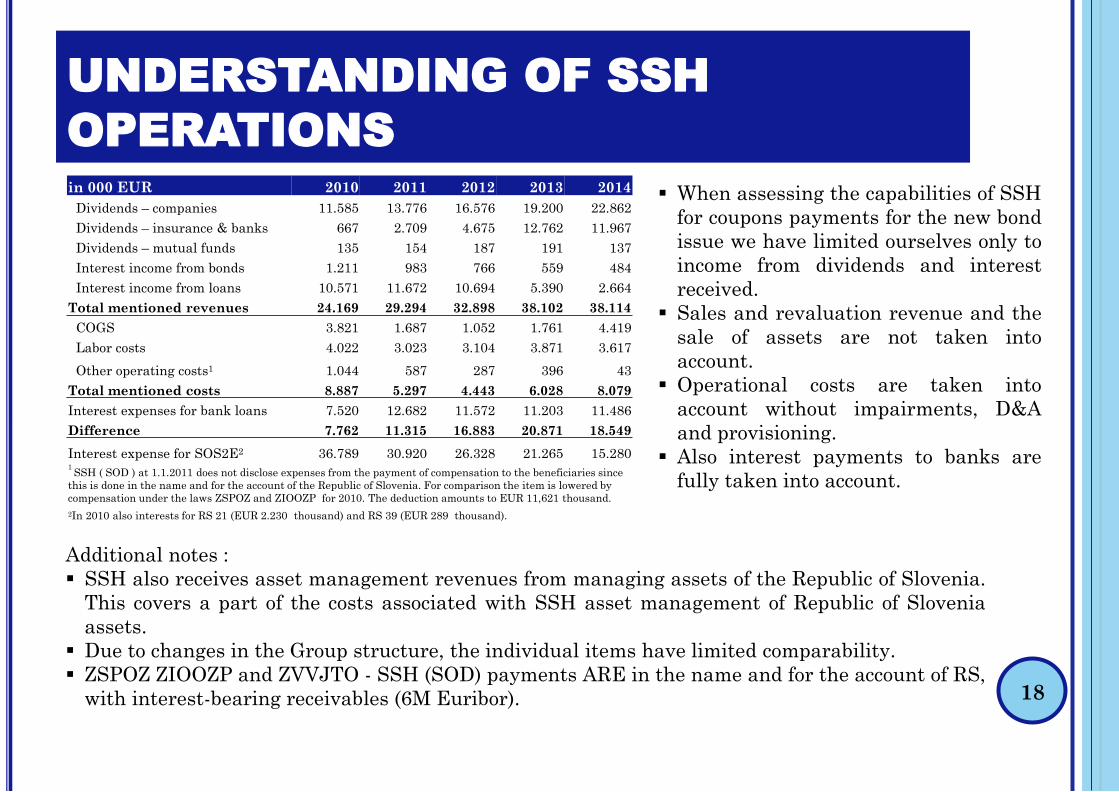
UNDERSTANDING OF SSH
OPERATIONS
18
in 000 EUR 2010 2011 2012 2013 2014
Dividends – companies 11.585 13.776 16.576 19.200 22.862
Dividends – insurance & banks 667 2.709 4.675 12.762 11.967
Dividends – mutual funds 135 154 187 191 137
Interest income from bonds 1.211 983 766 559 484
Interest income from loans 10.571 11.672 10.694 5.390 2.664
Total mentioned revenues 24.169 29.294 32.898 38.102 38.114
COGS 3.821 1.687 1.052 1.761 4.419
Labor costs 4.022 3.023 3.104 3.871 3.617
Other operating costs1 1.044 587 287 396 43
Total mentioned costs 8.887 5.297 4.443 6.028 8.079
Interest expenses for bank loans 7.520 12.682 11.572 11.203 11.486
Difference 7.762 11.315 16.883 20.871 18.549
Interest expense for SOS2E2 36.789 30.920 26.328 21.265 15.2801 SSH ( SOD ) at 1.1.2011 does not disclose expenses from the payment of compensation to the beneficiaries since
this is done in the name and for the account of the Republic of Slovenia. For comparison the item is lowered by
compensation under the laws ZSPOZ and ZIOOZP for 2010. The deduction amounts to EUR 11,621 thousand.
2In 2010 also interests for RS 21 (EUR 2.230 thousand) and RS 39 (EUR 289 thousand).
When assessing the capabilities of SSH
for coupons payments for the new bond
issue we have limited ourselves only to
income from dividends and interest
received.
Sales and revaluation revenue and the
sale of assets are not taken into
account.
Operational costs are taken into
account without impairments, D&A
and provisioning.
Also interest payments to banks are
fully taken into account.
Additional notes :
SSH also receives asset management revenues from managing assets of the Republic of Slovenia.
This covers a part of the costs associated with SSH asset management of Republic of Slovenia
assets.
Due to changes in the Group structure, the individual items have limited comparability.
ZSPOZ ZIOOZP and ZVVJTO - SSH (SOD) payments ARE in the name and for the account of RS,
with interest-bearing receivables (6M Euribor).
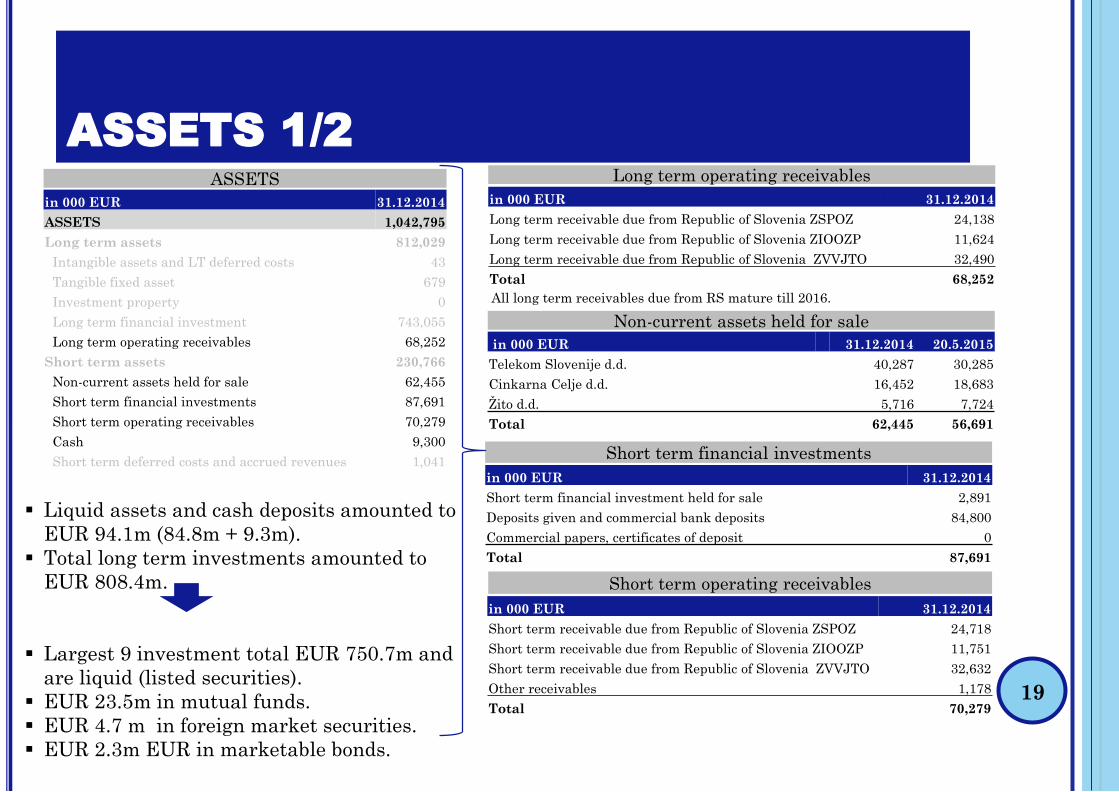
ASSETS 1/2
in 000 EUR 31.12.2014
ASSETS 1,042,795
Long term assets 812,029
Intangible assets and LT deferred costs 43
Tangible fixed asset 679
Investment property 0
Long term financial investment 743,055
Long term operating receivables 68,252
Short term assets 230,766
Non-current assets held for sale 62,455
Short term financial investments 87,691
Short term operating receivables 70,279
Cash 9,300
Short term deferred costs and accrued revenues 1,041
ASSETS
in 000 EUR 31.12.2014 20.5.2015
Telekom Slovenije d.d. 40,287 30,285
Cinkarna Celje d.d. 16,452 18,683
Žito d.d. 5,716 7,724
Total 62,445 56,691
Non-current assets held for sale
Short term financial investments
in 000 EUR 31.12.2014
Short term financial investment held for sale 2,891
Deposits given and commercial bank deposits 84,800
Commercial papers, certificates of deposit 0
Total 87,691
in 000 EUR 31.12.2014
Long term receivable due from Republic of Slovenia ZSPOZ 24,138
Long term receivable due from Republic of Slovenia ZIOOZP 11,624
Long term receivable due from Republic of Slovenia ZVVJTO 32,490
Total 68,252
Long term operating receivables
All long term receivables due from RS mature till 2016.
in 000 EUR 31.12.2014
Short term receivable due from Republic of Slovenia ZSPOZ 24,718
Short term receivable due from Republic of Slovenia ZIOOZP 11,751
Short term receivable due from Republic of Slovenia ZVVJTO 32,632
Other receivables 1,178
Total 70,279
Short term operating receivables
19
Liquid assets and cash deposits amounted to
EUR 94.1m (84.8m + 9.3m).
Total long term investments amounted to
EUR 808.4m.
Largest 9 investment total EUR 750.7m and
are liquid (listed securities).
EUR 23.5m in mutual funds.
EUR 4.7 m in foreign market securities.
EUR 2.3m EUR in marketable bonds.
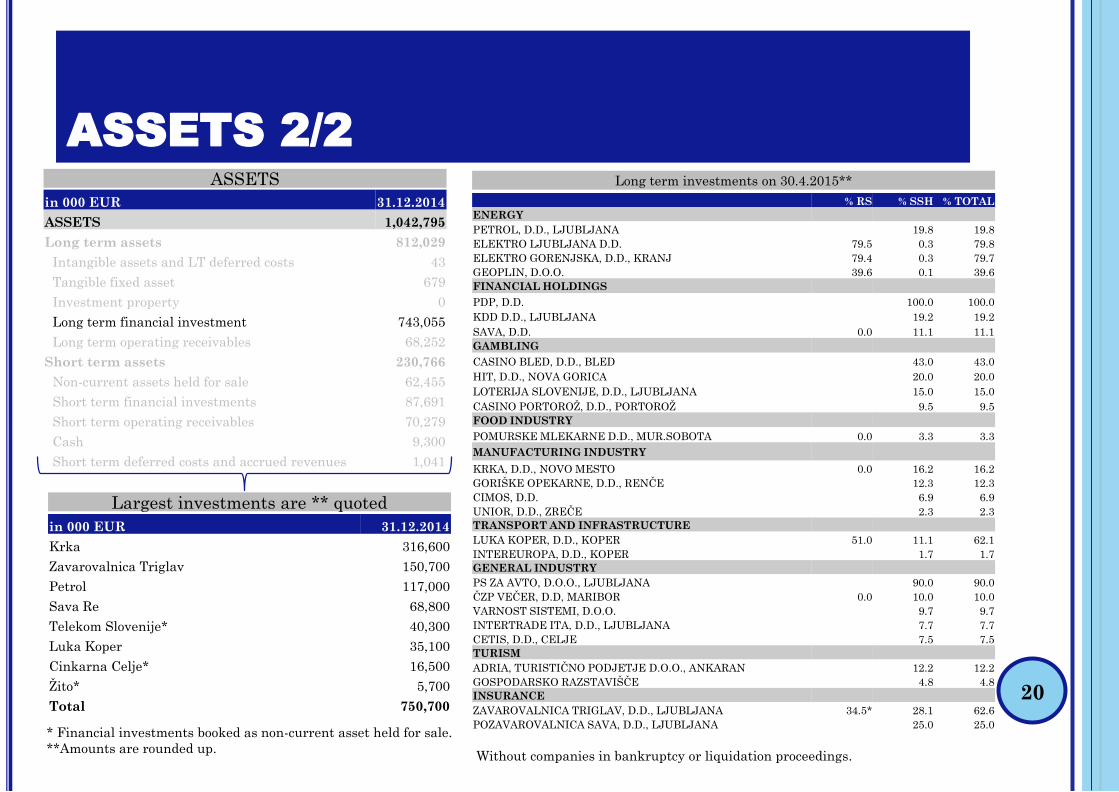
ASSETS 2/2
20
% RS % SSH % TOTAL
ENERGY
PETROL, D.D., LJUBLJANA 19.8 19.8
ELEKTRO LJUBLJANA D.D. 79.5 0.3 79.8
ELEKTRO GORENJSKA, D.D., KRANJ 79.4 0.3 79.7
GEOPLIN, D.O.O. 39.6 0.1 39.6
FINANCIAL HOLDINGS
PDP, D.D. 100.0 100.0
KDD D.D., LJUBLJANA 19.2 19.2
SAVA, D.D. 0.0 11.1 11.1
GAMBLING
CASINO BLED, D.D., BLED 43.0 43.0
HIT, D.D., NOVA GORICA 20.0 20.0
LOTERIJA SLOVENIJE, D.D., LJUBLJANA 15.0 15.0
CASINO PORTOROŽ, D.D., PORTOROŽ 9.5 9.5
FOOD INDUSTRY
POMURSKE MLEKARNE D.D., MUR.SOBOTA 0.0 3.3 3.3
MANUFACTURING INDUSTRY
KRKA, D.D., NOVO MESTO 0.0 16.2 16.2
GORIŠKE OPEKARNE, D.D., RENČE 12.3 12.3
CIMOS, D.D. 6.9 6.9
UNIOR, D.D., ZREČE 2.3 2.3
TRANSPORT AND INFRASTRUCTURE
LUKA KOPER, D.D., KOPER 51.0 11.1 62.1
INTEREUROPA, D.D., KOPER 1.7 1.7
GENERAL INDUSTRY
PS ZA AVTO, D.O.O., LJUBLJANA 90.0 90.0
ČZP VEČER, D.D, MARIBOR 0.0 10.0 10.0
VARNOST SISTEMI, D.O.O. 9.7 9.7
INTERTRADE ITA, D.D., LJUBLJANA 7.7 7.7
CETIS, D.D., CELJE 7.5 7.5
TURISM
ADRIA, TURISTIČNO PODJETJE D.O.O., ANKARAN 12.2 12.2
GOSPODARSKO RAZSTAVIŠČE 4.8 4.8
INSURANCE
ZAVAROVALNICA TRIGLAV, D.D., LJUBLJANA 34.5* 28.1 62.6
POZAVAROVALNICA SAVA, D.D., LJUBLJANA 25.0 25.0
Long term investments on 30.4.2015**
in 000 EUR 31.12.2014
ASSETS 1,042,795
Long term assets 812,029
Intangible assets and LT deferred costs 43
Tangible fixed asset 679
Investment property 0
Long term financial investment 743,055
Long term operating receivables 68,252
Short term assets 230,766
Non-current assets held for sale 62,455
Short term financial investments 87,691
Short term operating receivables 70,279
Cash 9,300
Short term deferred costs and accrued revenues 1,041
in 000 EUR 31.12.2014
Krka 316,600
Zavarovalnica Triglav 150,700
Petrol 117,000
Sava Re 68,800
Telekom Slovenije* 40,300
Luka Koper 35,100
Cinkarna Celje* 16,500
Žito* 5,700
Total 750,700
Largest investments are ** quoted
* Financial investments booked as non-current asset held for sale.
**Amounts are rounded up.
ASSETS
Without companies in bankruptcy or liquidation proceedings.
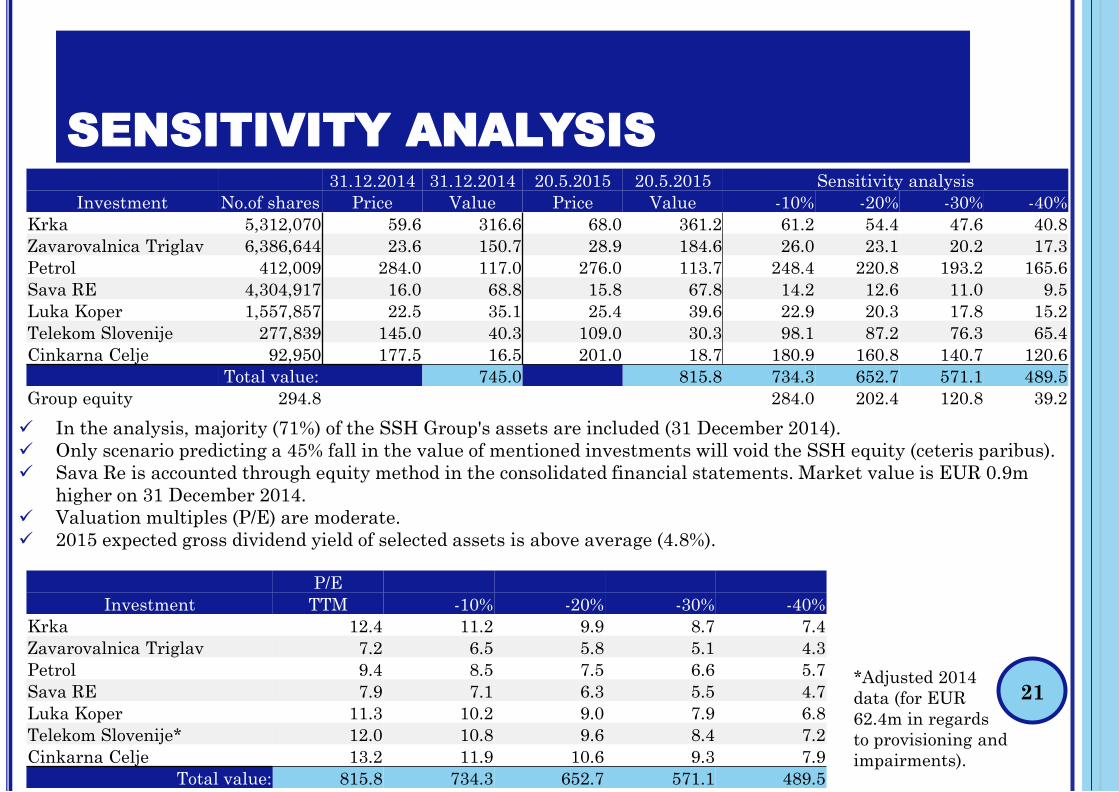
SENSITIVITY ANALYSIS
21
In the analysis, majority (71%) of the SSH Group's assets are included (31 December 2014).
Only scenario predicting a 45% fall in the value of mentioned investments will void the SSH equity (ceteris paribus).
Sava Re is accounted through equity method in the consolidated financial statements. Market value is EUR 0.9m
higher on 31 December 2014.
Valuation multiples (P/E) are moderate.
2015 expected gross dividend yield of selected assets is above average (4.8%).
31.12.2014 31.12.2014 20.5.2015 20.5.2015 Sensitivity analysis
Investment No.of shares Price Value Price Value -10% -20% -30% -40%
Krka 5,312,070 59.6 316.6 68.0 361.2 61.2 54.4 47.6 40.8
Zavarovalnica Triglav 6,386,644 23.6 150.7 28.9 184.6 26.0 23.1 20.2 17.3
Petrol 412,009 284.0 117.0 276.0 113.7 248.4 220.8 193.2 165.6
Sava RE 4,304,917 16.0 68.8 15.8 67.8 14.2 12.6 11.0 9.5
Luka Koper 1,557,857 22.5 35.1 25.4 39.6 22.9 20.3 17.8 15.2
Telekom Slovenije 277,839 145.0 40.3 109.0 30.3 98.1 87.2 76.3 65.4
Cinkarna Celje 92,950 177.5 16.5 201.0 18.7 180.9 160.8 140.7 120.6
Total value: 745.0 815.8 734.3 652.7 571.1 489.5
Group equity 294.8 284.0 202.4 120.8 39.2
P/E
Investment TTM -10% -20% -30% -40%
Krka 12.4 11.2 9.9 8.7 7.4
Zavarovalnica Triglav 7.2 6.5 5.8 5.1 4.3
Petrol 9.4 8.5 7.5 6.6 5.7
Sava RE 7.9 7.1 6.3 5.5 4.7
Luka Koper 11.3 10.2 9.0 7.9 6.8
Telekom Slovenije* 12.0 10.8 9.6 8.4 7.2
Cinkarna Celje 13.2 11.9 10.6 9.3 7.9
Total value: 815.8 734.3 652.7 571.1 489.5
*Adjusted 2014
data (for EUR
62.4m in regards
to provisioning and
impairments).
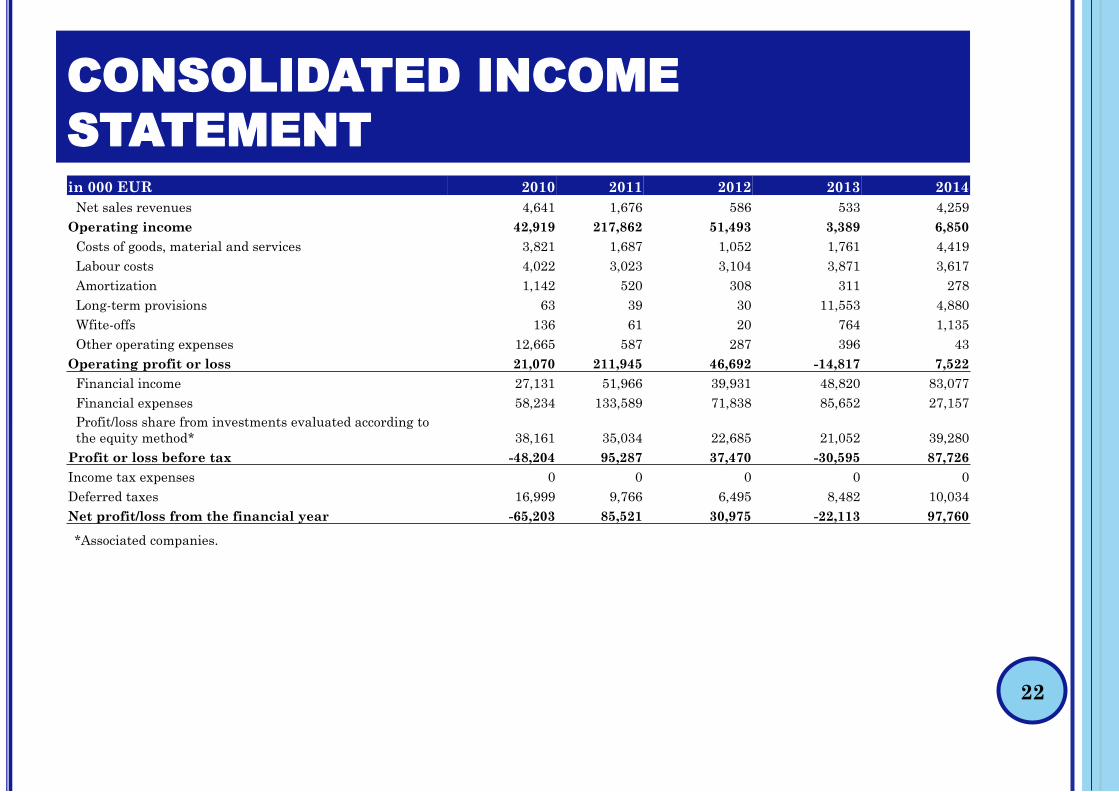
CONSOLIDATED INCOME
STATEMENT
22
*Associated companies.
in 000 EUR 2010 2011 2012 2013 2014
Net sales revenues 4,641 1,676 586 533 4,259
Operating income 42,919 217,862 51,493 3,389 6,850
Costs of goods, material and services 3,821 1,687 1,052 1,761 4,419
Labour costs 4,022 3,023 3,104 3,871 3,617
Amortization 1,142 520 308 311 278
Long-term provisions 63 39 30 11,553 4,880
Wfite-offs 136 61 20 764 1,135
Other operating expenses 12,665 587 287 396 43
Operating profit or loss 21,070 211,945 46,692 -14,817 7,522
Financial income 27,131 51,966 39,931 48,820 83,077
Financial expenses 58,234 133,589 71,838 85,652 27,157
Profit/loss share from investments evaluated according to
the equity method* 38,161 35,034 22,685 21,052 39,280
Profit or loss before tax -48,204 95,287 37,470 -30,595 87,726
Income tax expenses 0 0 0 0 0
Deferred taxes 16,999 9,766 6,495 8,482 10,034
Net profit/loss from the financial year -65,203 85,521 30,975 -22,113 97,760
BOND ISSUE23
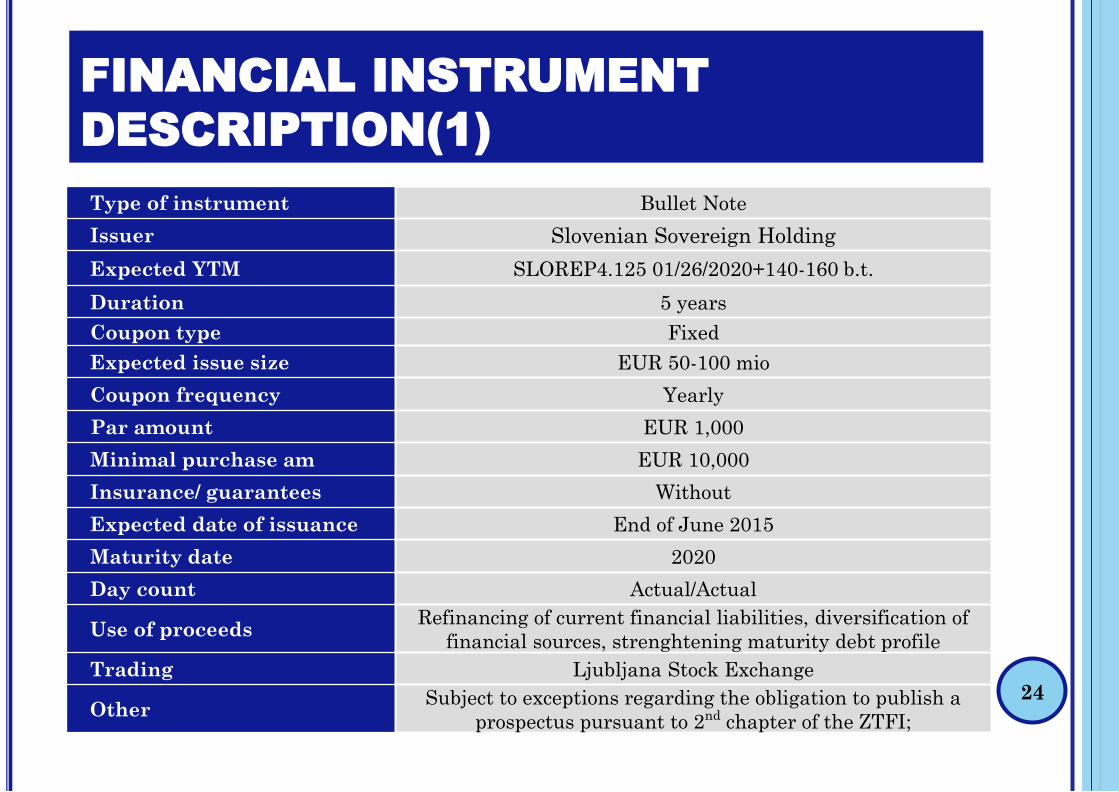
FINANCIAL INSTRUMENT
DESCRIPTION(1)
24
Type of instrument Bullet Note
Issuer Slovenian Sovereign Holding
Expected YTM SLOREP4.125 01/26/2020+140-160 b.t.
Duration 5 years
Coupon type Fixed
Expected issue size EUR 50-100 mio
Coupon frequency Yearly
Par amount EUR 1,000
Minimal purchase am EUR 10,000
Insurance/ guarantees Without
Expected date of issuance End of June 2015
Maturity date 2020
Day count Actual/Actual
Use of proceedsRefinancing of current financial liabilities, diversification of
financial sources, strenghtening maturity debt profile
Trading Ljubljana Stock Exchange
OtherSubject to exceptions regarding the obligation to publish a
prospectus pursuant to 2nd chapter of the ZTFI;
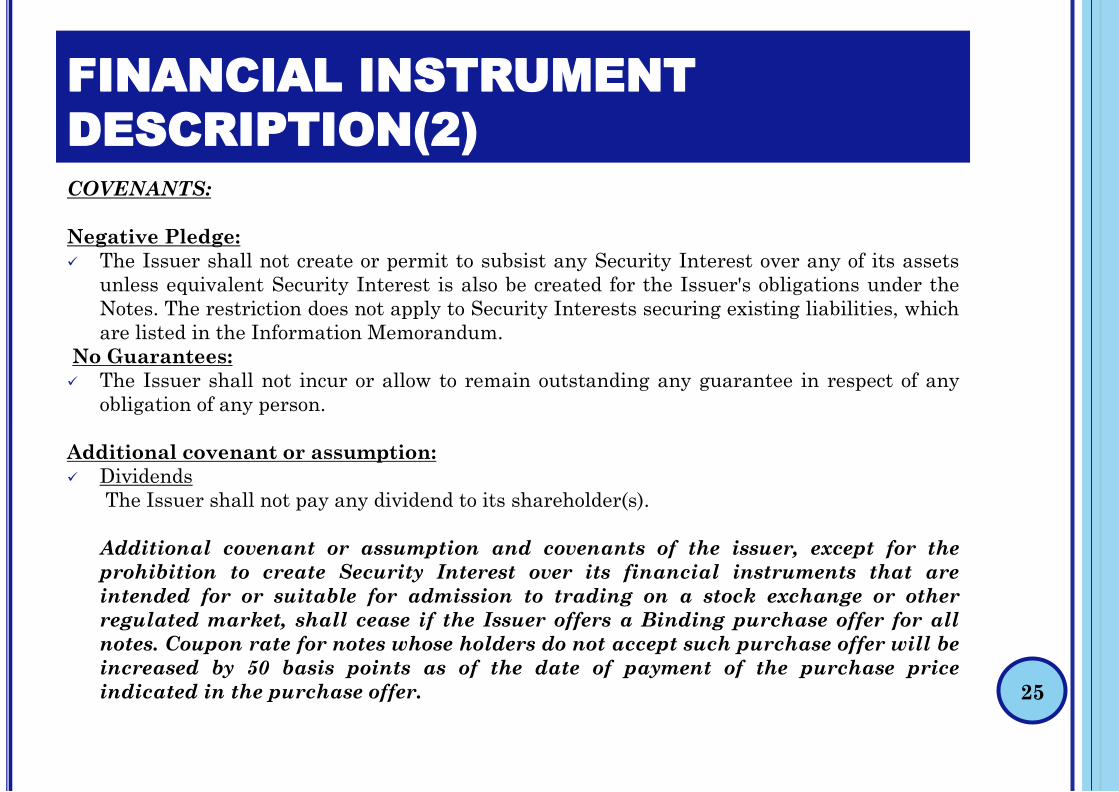
FINANCIAL INSTRUMENT
DESCRIPTION(2)
25
COVENANTS:
Negative Pledge:
The Issuer shall not create or permit to subsist any Security Interest over any of its assets
unless equivalent Security Interest is also be created for the Issuer's obligations under the
Notes. The restriction does not apply to Security Interests securing existing liabilities, which
are listed in the Information Memorandum.
No Guarantees:
The Issuer shall not incur or allow to remain outstanding any guarantee in respect of any
obligation of any person.
Additional covenant or assumption:
Dividends
The Issuer shall not pay any dividend to its shareholder(s).
Additional covenant or assumption and covenants of the issuer, except for the
prohibition to create Security Interest over its financial instruments that are
intended for or suitable for admission to trading on a stock exchange or other
regulated market, shall cease if the Issuer offers a Binding purchase offer for all
notes. Coupon rate for notes whose holders do not accept such purchase offer will be
increased by 50 basis points as of the date of payment of the purchase price
indicated in the purchase offer.
FINANCIAL INSTRUMENT
DESCRIPTION(3)
26
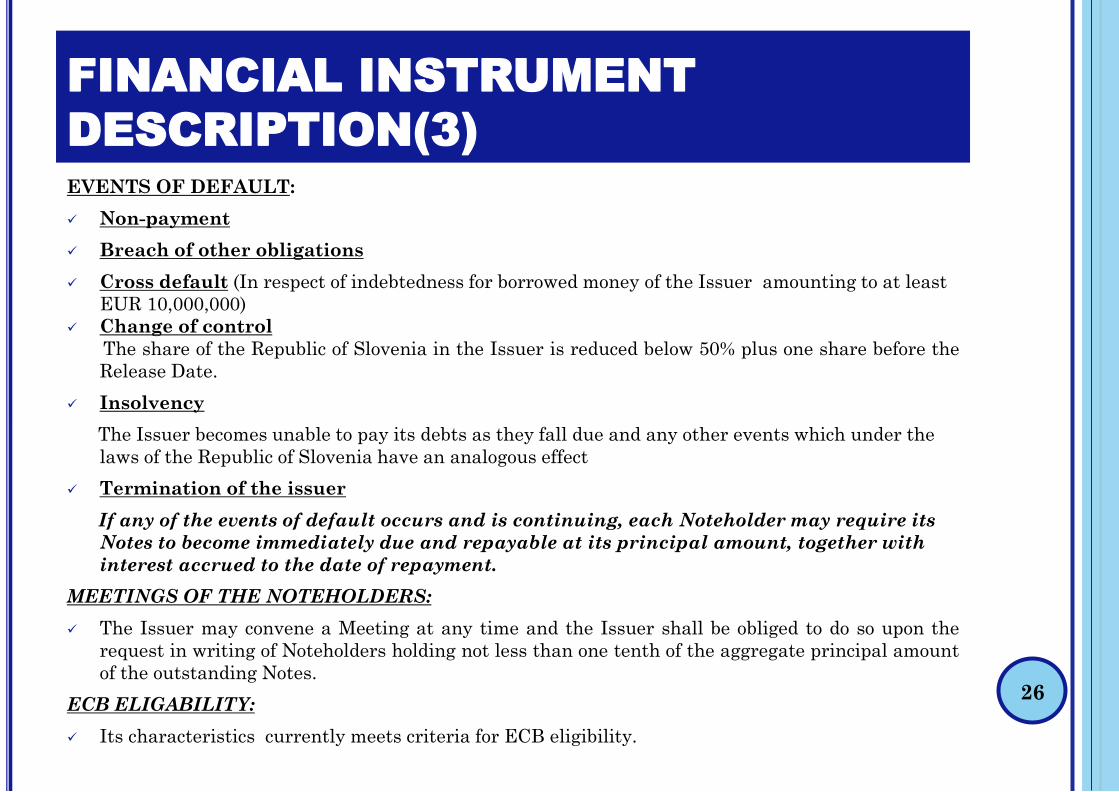
EVENTS OF DEFAULT:
Non-payment
Breach of other obligations
Cross default (In respect of indebtedness for borrowed money of the Issuer amounting to at least
EUR 10,000,000)
Change of control
The share of the Republic of Slovenia in the Issuer is reduced below 50% plus one share before the
Release Date.
Insolvency
The Issuer becomes unable to pay its debts as they fall due and any other events which under the
laws of the Republic of Slovenia have an analogous effect
Termination of the issuer
If any of the events of default occurs and is continuing, each Noteholder may require its
Notes to become immediately due and repayable at its principal amount, together with
interest accrued to the date of repayment.
MEETINGS OF THE NOTEHOLDERS:
The Issuer may convene a Meeting at any time and the Issuer shall be obliged to do so upon the
request in writing of Noteholders holding not less than one tenth of the aggregate principal amount
of the outstanding Notes.
ECB ELIGABILITY:
Its characteristics currently meets criteria for ECB eligibility.
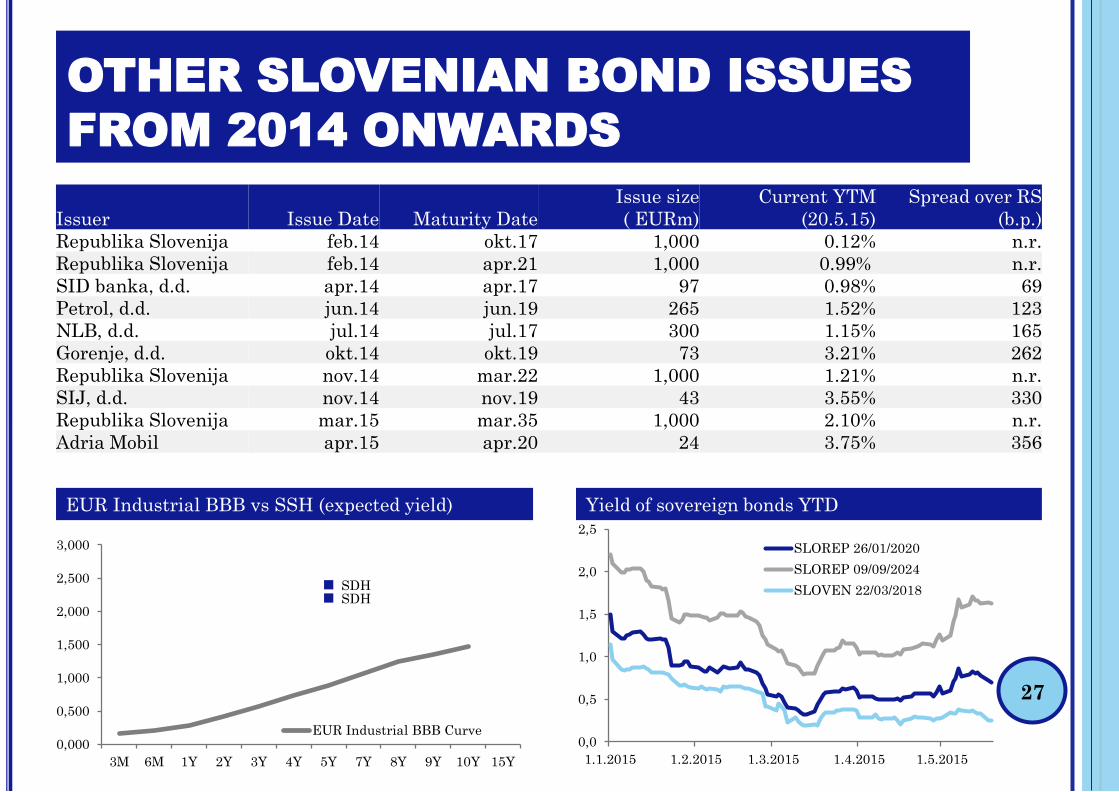
OTHER SLOVENIAN BOND ISSUES
FROM 2014 ONWARDS
27
0,0
0,5
1,0
1,5
2,0
2,5
1.1.2015 1.2.2015 1.3.2015 1.4.2015 1.5.2015
SLOREP 26/01/2020
SLOREP 09/09/2024
SLOVEN 22/03/2018
EUR Industrial BBB vs SSH (expected yield) Yield of sovereign bonds YTD
Issuer Issue Date Maturity Date
Issue size
( EURm)
Current YTM
(20.5.15)
Spread over RS
(b.p.)
Republika Slovenija feb.14 okt.17 1,000 0.12% n.r.
Republika Slovenija feb.14 apr.21 1,000 0.99% n.r.
SID banka, d.d. apr.14 apr.17 97 0.98% 69
Petrol, d.d. jun.14 jun.19 265 1.52% 123
NLB, d.d. jul.14 jul.17 300 1.15% 165
Gorenje, d.d. okt.14 okt.19 73 3.21% 262
Republika Slovenija nov.14 mar.22 1,000 1.21% n.r.
SIJ, d.d. nov.14 nov.19 43 3.55% 330
Republika Slovenija mar.15 mar.35 1,000 2.10% n.r.
Adria Mobil apr.15 apr.20 24 3.75% 356
SDHSDH
0,000
0,500
1,000
1,500
2,000
2,500
3,000
3M 6M 1Y 2Y 3Y 4Y 5Y 7Y 8Y 9Y 10Y 15Y
EUR Industrial BBB Curve
28
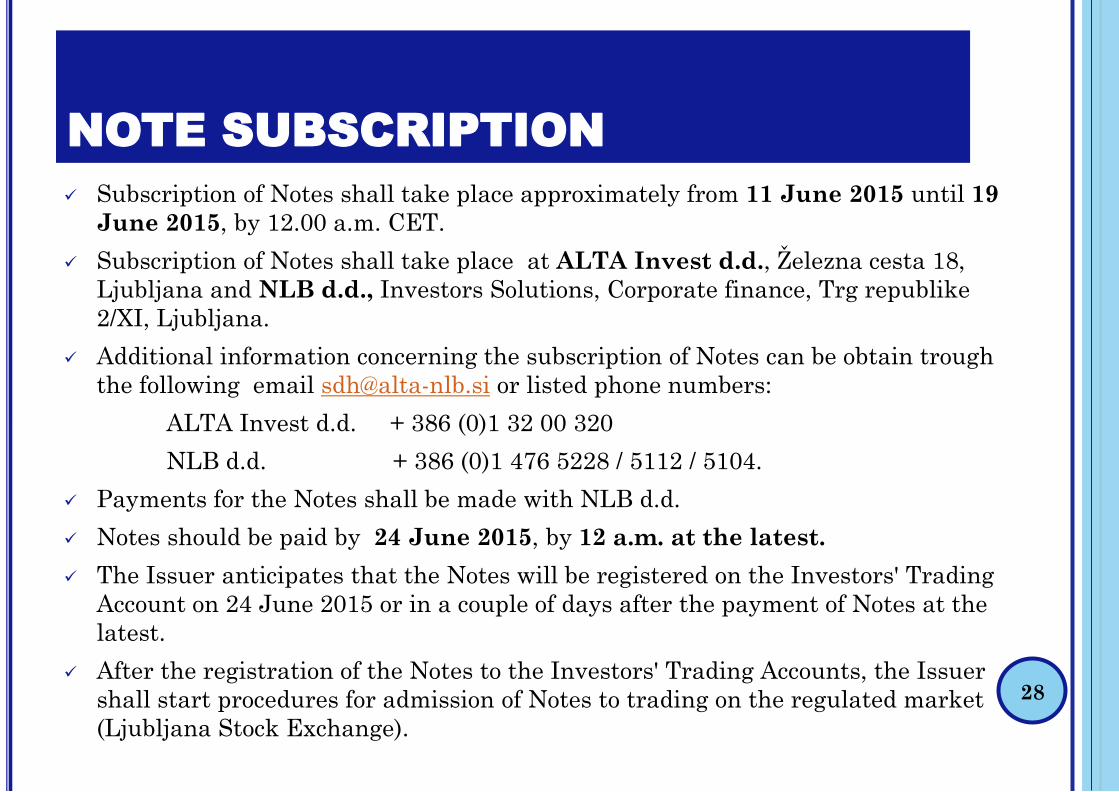
Subscription of Notes shall take place approximately from 11 June 2015 until 19
June 2015, by 12.00 a.m. CET.
Subscription of Notes shall take place at ALTA Invest d.d., Železna cesta 18,
Ljubljana and NLB d.d., Investors Solutions, Corporate finance, Trg republike
2/XI, Ljubljana.
Additional information concerning the subscription of Notes can be obtain trough
the following email [email protected] or listed phone numbers:
ALTA Invest d.d. + 386 (0)1 32 00 320
NLB d.d. + 386 (0)1 476 5228 / 5112 / 5104.
Payments for the Notes shall be made with NLB d.d.
Notes should be paid by 24 June 2015, by 12 a.m. at the latest.
The Issuer anticipates that the Notes will be registered on the Investors' Trading
Account on 24 June 2015 or in a couple of days after the payment of Notes at the
latest.
After the registration of the Notes to the Investors' Trading Accounts, the Issuer
shall start procedures for admission of Notes to trading on the regulated market
(Ljubljana Stock Exchange).
NOTE SUBSCRIPTION
DISCLOSURE
29
The document is, according to the Article 378 of The Securities Market Act (Uradni list RS, št. 108/10 – ZTFI-UPB3, 78/11, 55/12, 105/12 – ZBan-1J in
63/13 - ZS-K; »ZTFI«) , not treated as investment research nor as an investment recommendation because it does not contain recommendations or
proposed investment strategies with respect to one or more financial instruments, one or more issuers, nor opinions about current or future value or price of
those financial instruments..
Information in this document is based on data obtained from sources for which the authors believe to be reliable, however no guarantees are made with regard to
the accuracy or completeness of the data. Information do not represent Material Information according to The Securities Market Act.
SSH, ALTA and NLB d.d. shall not be liable for any kind of damages or losses resulting from the use of information contained in this document, in particular the
decisions and actions based on this information. As a recipient of this document, you are solely responsible for the use of information and results arising from the
use of such information. The duty to verify information obtained from this document is on your site. SSH, ALTA and NLB d.d. are not obliged to update, correct
or change this document.
This document was, according to the laws of the Republic of Slovenia, prepared in cooperation with SSH by ALTA Skupina, upravljanje družb, d.d. (eng. ALTA
Group), Železna cesta 18, 1000 Ljubljana, registration number 3618846000 ("ALTA Group"), ALTA Invest, investicijske storitve, d.d. (eng. ALTA Invest Inc),
Železna cesta 18, 1000 Ljubljana, registration number 3710432000 ("ALTA Invest d.d.") (ALTA Invest d.d. and the ALTA Group "ALTA") and Nova Ljubljanska
banka dd, Ljubljana, Trg republike 2, 1520 Ljubljana, registration number 5860571000 ("NLB") which are financial advisors of SSH, related to the intended bond
issue of the company and have financial interest regarding this issue. ALTA nor NLB do not have the authority to give guarantees or warranties on behalf of the
company.
Legal person responsible for preparation and distribution of the document are SSH, ALTA and NLB d.d. ALTA Invest d.d. is supervised by the Slovenian
Securities Market Agency (Agencija za trg vrednostnih papirjev), Poljanski Nasip 6, 1000 Ljubljana, Slovenia; NLB d.d., in addition to the Slovenian Securities
Market Agency, is also supervised by the Bank of Slovenia, Slovenska 35, 1505 Ljubljana.
Presented document can not be reproduced, distributed or published (nor partial nor total) by any person, for any reason and in any manner without the prior
written consent of ALTA and NLB d.d. Violation of those restrictions can lead to violators of civil or criminal liability to companies ALTA and NLB d.d.
THIS DOCUMENT IS NOT FOR DISTRIBUTION, REPRODUCTION, PUBLICATION, DIRECTLY OR INDIRECTLY, ESPECIALLY NOT IN THE UNITED
KINGDOM, UNITED STATES OF AMERICA, AUSTRALIA, CANADA, AND JAPAN, OR IN ANY OTHER COUNTRY IN WHICH THE PUBLISHING WOULD
BE CONTRARY TO THE LAW. The distribution and/or the content of this document in other jurisdictions may be restricted or differently regulated by the law,
and the reader should inform himself regarding any such restrictions. By reading/accepting this document, the reader consents to be bound by the foregoing
instructions.
ALTA and NLB d.d. as well as persons associated with them may be holders of financial instruments of the company or persons related to it.
Description of services, terms and conditions and price list of ALTA Invest dd are available on the website
www.alta.si; http://www.alta.si/Commisions_Terms;
http://www.alta.si/Osnove_trgovanja/Razlaga_financnih_instrumentov.
Description of services, terms and conditions and price list of ALTA Invest dd are available on the website:
http://www.nlb.si/podjetniske-finance
CONTACTS
30
Name Position Telephone E-mail
Milena Brodnjak Project Manager +386 1 32 00 320 [email protected]
Aleš Škerlak Executive Director Alta Group +386 1 32 00 202 [email protected]
Name Position Telephone Email
Brane Gregorec Head od Corporate Finance +386 1 476 5104 [email protected]
Snežna Zadel Corporate Finance Advisor +386 1 476 5112 [email protected]
APPENDIX31
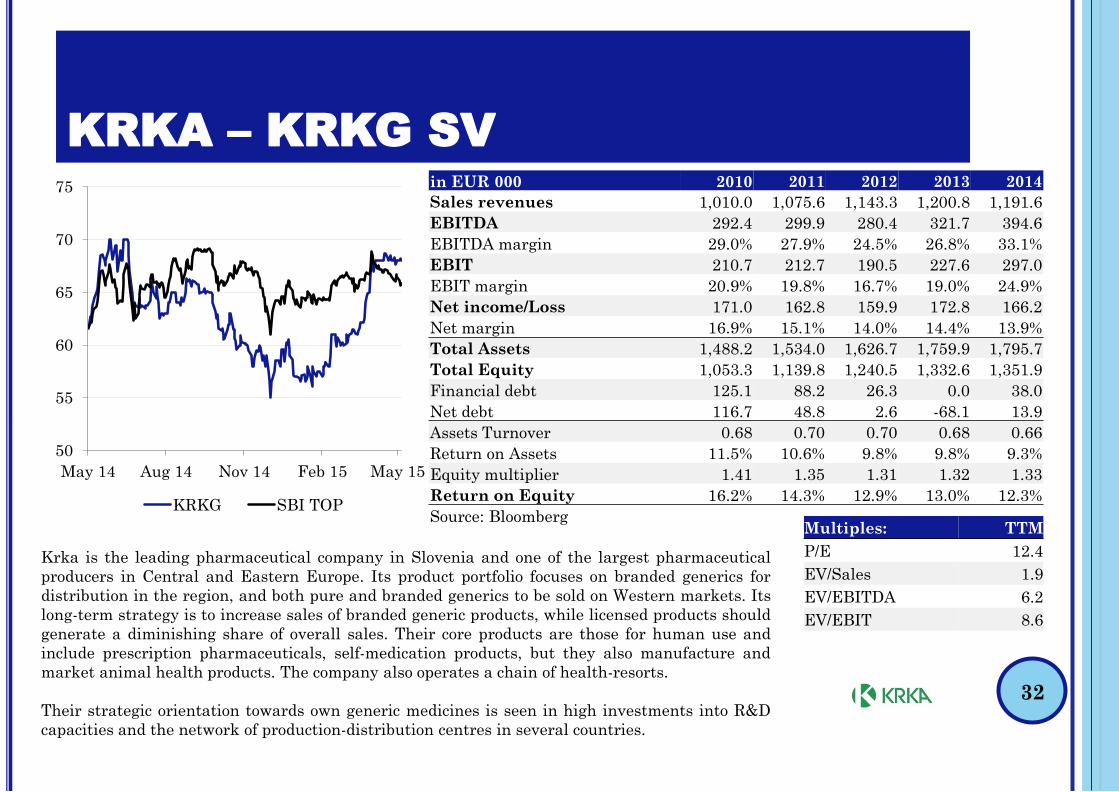
KRKA – KRKG SV
50
55
60
65
70
75
May 14 Aug 14 Nov 14 Feb 15 May 15
KRKG SBI TOP
in EUR 000 2010 2011 2012 2013 2014
Sales revenues 1,010.0 1,075.6 1,143.3 1,200.8 1,191.6
EBITDA 292.4 299.9 280.4 321.7 394.6
EBITDA margin 29.0% 27.9% 24.5% 26.8% 33.1%
EBIT 210.7 212.7 190.5 227.6 297.0
EBIT margin 20.9% 19.8% 16.7% 19.0% 24.9%
Net income/Loss 171.0 162.8 159.9 172.8 166.2
Net margin 16.9% 15.1% 14.0% 14.4% 13.9%
Total Assets 1,488.2 1,534.0 1,626.7 1,759.9 1,795.7
Total Equity 1,053.3 1,139.8 1,240.5 1,332.6 1,351.9
Financial debt 125.1 88.2 26.3 0.0 38.0
Net debt 116.7 48.8 2.6 -68.1 13.9
Assets Turnover 0.68 0.70 0.70 0.68 0.66
Return on Assets 11.5% 10.6% 9.8% 9.8% 9.3%
Equity multiplier 1.41 1.35 1.31 1.32 1.33
Return on Equity 16.2% 14.3% 12.9% 13.0% 12.3%
Source: BloombergMultiples: TTM
P/E 12.4
EV/Sales 1.9
EV/EBITDA 6.2
EV/EBIT 8.6
Krka is the leading pharmaceutical company in Slovenia and one of the largest pharmaceutical
producers in Central and Eastern Europe. Its product portfolio focuses on branded generics for
distribution in the region, and both pure and branded generics to be sold on Western markets. Its
long-term strategy is to increase sales of branded generic products, while licensed products should
generate a diminishing share of overall sales. Their core products are those for human use and
include prescription pharmaceuticals, self-medication products, but they also manufacture and
market animal health products. The company also operates a chain of health-resorts.
Their strategic orientation towards own generic medicines is seen in high investments into R&D
capacities and the network of production-distribution centres in several countries.
32
18
20
22
24
26
28
30
32
May 14 Aug 14 Nov 14 Feb 15 May 15
ZVTG SBI TOP
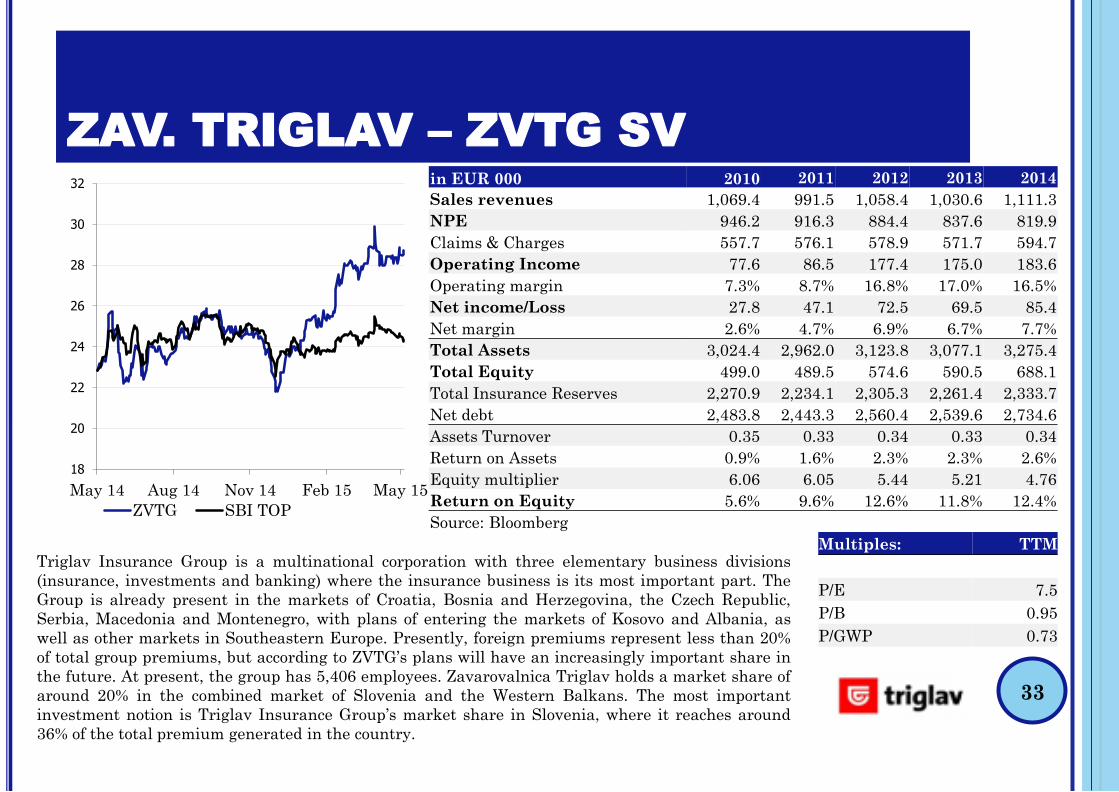
ZAV. TRIGLAV – ZVTG SV
in EUR 000 2010 2011 2012 2013 2014
Sales revenues 1,069.4 991.5 1,058.4 1,030.6 1,111.3
NPE 946.2 916.3 884.4 837.6 819.9
Claims & Charges 557.7 576.1 578.9 571.7 594.7
Operating Income 77.6 86.5 177.4 175.0 183.6
Operating margin 7.3% 8.7% 16.8% 17.0% 16.5%
Net income/Loss 27.8 47.1 72.5 69.5 85.4
Net margin 2.6% 4.7% 6.9% 6.7% 7.7%
Total Assets 3,024.4 2,962.0 3,123.8 3,077.1 3,275.4
Total Equity 499.0 489.5 574.6 590.5 688.1
Total Insurance Reserves 2,270.9 2,234.1 2,305.3 2,261.4 2,333.7
Net debt 2,483.8 2,443.3 2,560.4 2,539.6 2,734.6
Assets Turnover 0.35 0.33 0.34 0.33 0.34
Return on Assets 0.9% 1.6% 2.3% 2.3% 2.6%
Equity multiplier 6.06 6.05 5.44 5.21 4.76
Return on Equity 5.6% 9.6% 12.6% 11.8% 12.4%
Source: Bloomberg
Multiples: TTM
P/E 7.5
P/B 0.95
P/GWP 0.73
Triglav Insurance Group is a multinational corporation with three elementary business divisions
(insurance, investments and banking) where the insurance business is its most important part. The
Group is already present in the markets of Croatia, Bosnia and Herzegovina, the Czech Republic,
Serbia, Macedonia and Montenegro, with plans of entering the markets of Kosovo and Albania, as
well as other markets in Southeastern Europe. Presently, foreign premiums represent less than 20%
of total group premiums, but according to ZVTG’s plans will have an increasingly important share in
the future. At present, the group has 5,406 employees. Zavarovalnica Triglav holds a market share of
around 20% in the combined market of Slovenia and the Western Balkans. The most important
investment notion is Triglav Insurance Group’s market share in Slovenia, where it reaches around
36% of the total premium generated in the country.
33
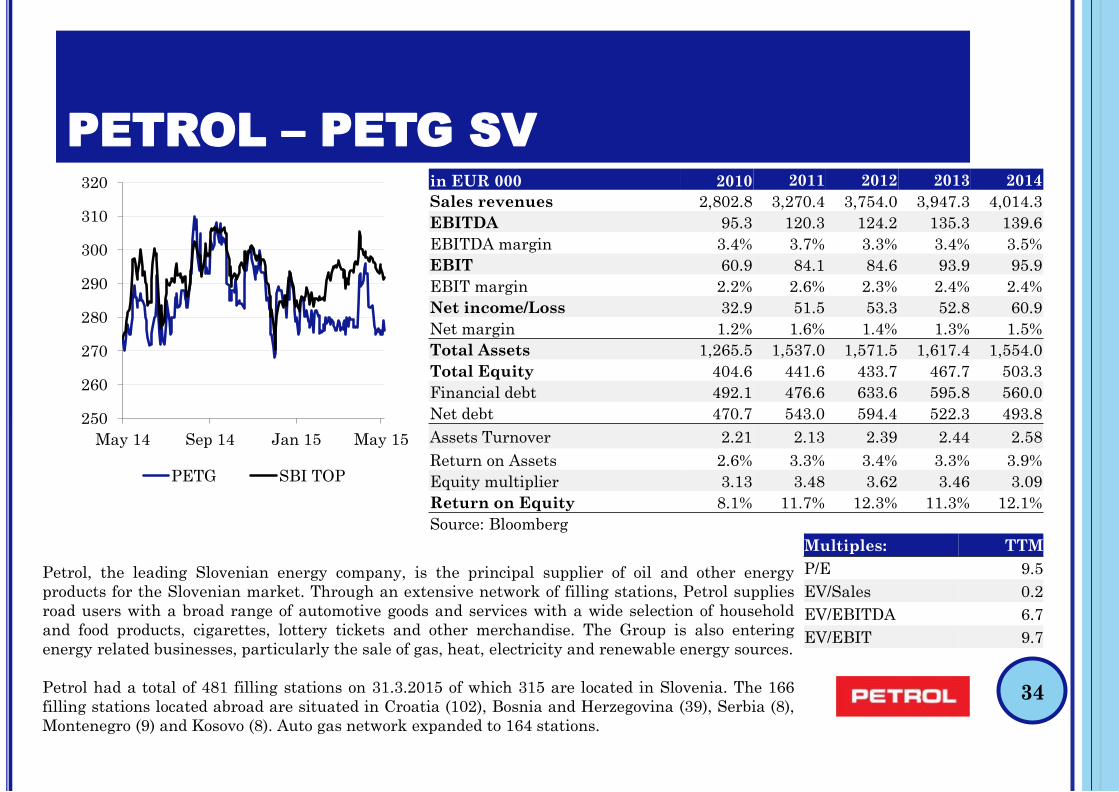
PETROL – PETG SV
250
260
270
280
290
300
310
320
May 14 Sep 14 Jan 15 May 15
PETG SBI TOP
in EUR 000 2010 2011 2012 2013 2014
Sales revenues 2,802.8 3,270.4 3,754.0 3,947.3 4,014.3
EBITDA 95.3 120.3 124.2 135.3 139.6
EBITDA margin 3.4% 3.7% 3.3% 3.4% 3.5%
EBIT 60.9 84.1 84.6 93.9 95.9
EBIT margin 2.2% 2.6% 2.3% 2.4% 2.4%
Net income/Loss 32.9 51.5 53.3 52.8 60.9
Net margin 1.2% 1.6% 1.4% 1.3% 1.5%
Total Assets 1,265.5 1,537.0 1,571.5 1,617.4 1,554.0
Total Equity 404.6 441.6 433.7 467.7 503.3
Financial debt 492.1 476.6 633.6 595.8 560.0
Net debt 470.7 543.0 594.4 522.3 493.8
Assets Turnover 2.21 2.13 2.39 2.44 2.58
Return on Assets 2.6% 3.3% 3.4% 3.3% 3.9%
Equity multiplier 3.13 3.48 3.62 3.46 3.09
Return on Equity 8.1% 11.7% 12.3% 11.3% 12.1%
Source: Bloomberg
Multiples: TTM
P/E 9.5
EV/Sales 0.2
EV/EBITDA 6.7
EV/EBIT 9.7
Petrol, the leading Slovenian energy company, is the principal supplier of oil and other energy
products for the Slovenian market. Through an extensive network of filling stations, Petrol supplies
road users with a broad range of automotive goods and services with a wide selection of household
and food products, cigarettes, lottery tickets and other merchandise. The Group is also entering
energy related businesses, particularly the sale of gas, heat, electricity and renewable energy sources.
Petrol had a total of 481 filling stations on 31.3.2015 of which 315 are located in Slovenia. The 166
filling stations located abroad are situated in Croatia (102), Bosnia and Herzegovina (39), Serbia (8),
Montenegro (9) and Kosovo (8). Auto gas network expanded to 164 stations.
34
8
9
10
11
12
13
14
15
16
17
18
May 14 Aug 14 Nov 14 Feb 15 May 15
POSR SBI TOP
SAVA RE – POSR SV
in EUR 000 2010 2011 2012 2013 2014
Sales revenues 255.4 257.0 270.7 415.5 501.3
NPE 231.9 235.1 246.2 379.1 437.6
Claims & Charges 147.4 136.5 155.0 235.3 286.1
Operating Income 10.5 13.2 13.2 24.4 41.9
Operating margin 4.1% 5.1% 4.9% 5.9% 8.4%
Net income/Loss 7.5 6.0 12.1 15.7 30.6
Net margin 2.9% 2.3% 4.5% 3.8% 6.1%
Total Assets 578.4 582.0 640.6 1,378.3 1,454.4
Total Equity 154.7 148.1 171.4 240.1 271.5
Total Insurance Reserves 326.9 344.5 387.2 1,017.0 1,065.7
Net debt 371.5 380.3 410.6 939.6 982.8
Assets Turnover 0.44 0.44 0.42 0.30 0.34
Return on Assets 1.3% 1.0% 1.9% 1.1% 2.1%
Equity multiplier 3.74 3.93 3.74 5.74 5.36
Return on Equity 4.8% 4.0% 7.1% 6.5% 11.3%
Source: BloombergMultiples: TTM
P/E 8.5
P/B 0.96
P/GWP 0.55
Sava Reinsurance Company is the leading Slovenian reinsurer with a 31% domestic market share
and is the largest locally-based non-captive reinsurer in the CEE region. Through consolidation of
Zavarovalnica Maribor it now has a 17% market share on the domestic Slovenian insurance
market. It also transacts primary insurance business (life and non-life) in Slovenia and the
Western Balkans (Croatia, Kosovo, Macedonia, Montenegro, and Serbia). The company has a 38-
year history. In 1992 it was only in reinsurance business, but then started to penetrate the
insurance market in Slovenia and the Western Balkans. It has 2,415 employees. 35
10
12
14
16
18
20
22
24
26
28
30
May 14 Aug 14 Nov 14 Feb 15 May 15
LKPG SBI TOP
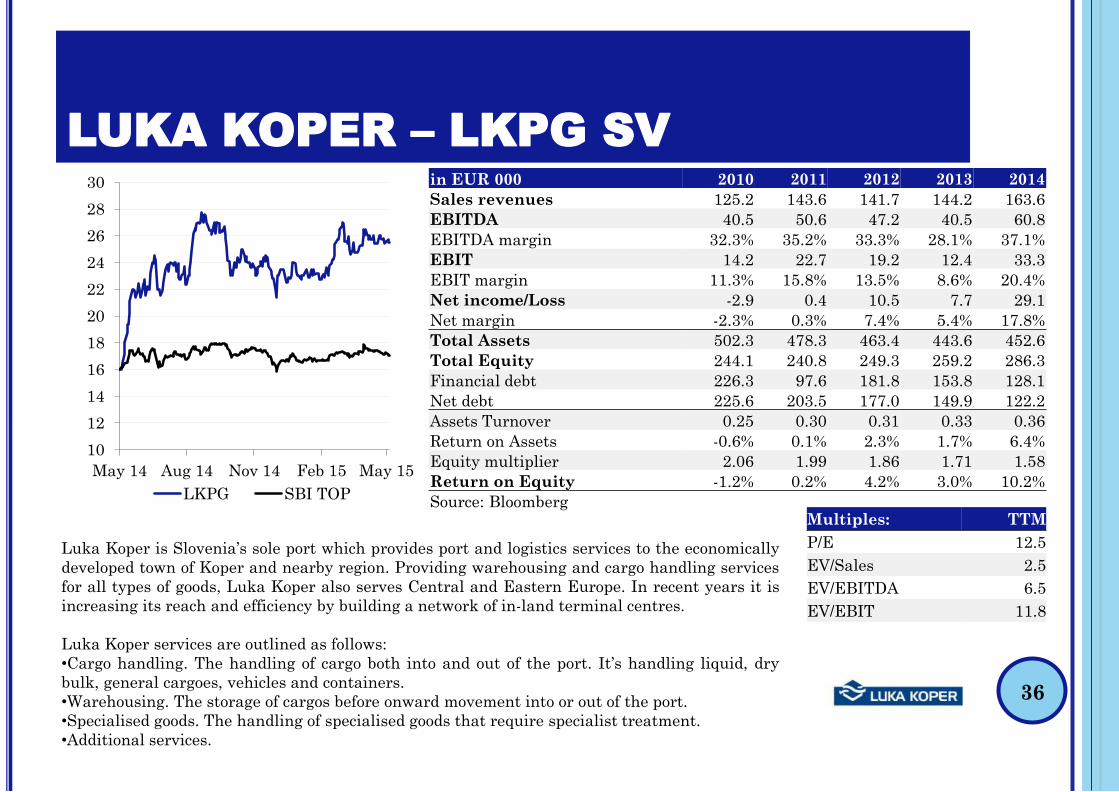
LUKA KOPER – LKPG SV
in EUR 000 2010 2011 2012 2013 2014
Sales revenues 125.2 143.6 141.7 144.2 163.6
EBITDA 40.5 50.6 47.2 40.5 60.8
EBITDA margin 32.3% 35.2% 33.3% 28.1% 37.1%
EBIT 14.2 22.7 19.2 12.4 33.3
EBIT margin 11.3% 15.8% 13.5% 8.6% 20.4%
Net income/Loss -2.9 0.4 10.5 7.7 29.1
Net margin -2.3% 0.3% 7.4% 5.4% 17.8%
Total Assets 502.3 478.3 463.4 443.6 452.6
Total Equity 244.1 240.8 249.3 259.2 286.3
Financial debt 226.3 97.6 181.8 153.8 128.1
Net debt 225.6 203.5 177.0 149.9 122.2
Assets Turnover 0.25 0.30 0.31 0.33 0.36
Return on Assets -0.6% 0.1% 2.3% 1.7% 6.4%
Equity multiplier 2.06 1.99 1.86 1.71 1.58
Return on Equity -1.2% 0.2% 4.2% 3.0% 10.2%
Source: BloombergMultiples: TTM
P/E 12.5
EV/Sales 2.5
EV/EBITDA 6.5
EV/EBIT 11.8
Luka Koper is Slovenia’s sole port which provides port and logistics services to the economically
developed town of Koper and nearby region. Providing warehousing and cargo handling services
for all types of goods, Luka Koper also serves Central and Eastern Europe. In recent years it is
increasing its reach and efficiency by building a network of in-land terminal centres.
Luka Koper services are outlined as follows:
•Cargo handling. The handling of cargo both into and out of the port. It’s handling liquid, dry
bulk, general cargoes, vehicles and containers.
•Warehousing. The storage of cargos before onward movement into or out of the port.
•Specialised goods. The handling of specialised goods that require specialist treatment.
•Additional services.
36
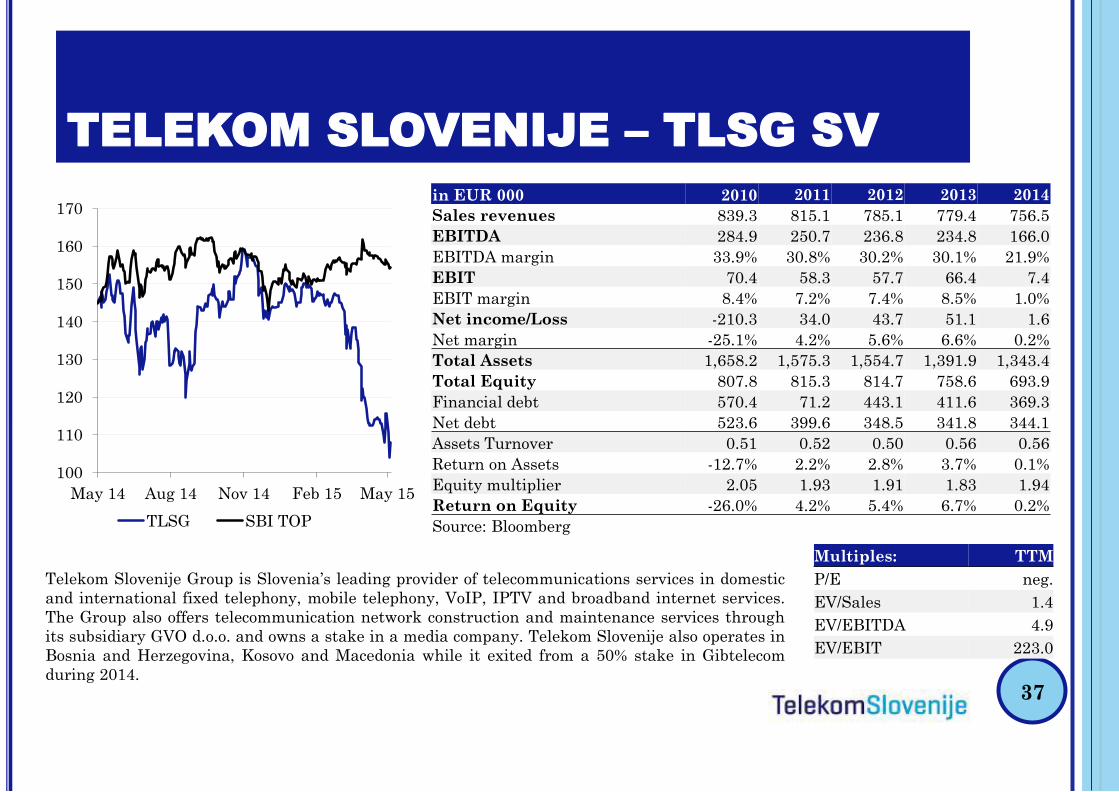
TELEKOM SLOVENIJE – TLSG SV
in EUR 000 2010 2011 2012 2013 2014
Sales revenues 839.3 815.1 785.1 779.4 756.5
EBITDA 284.9 250.7 236.8 234.8 166.0
EBITDA margin 33.9% 30.8% 30.2% 30.1% 21.9%
EBIT 70.4 58.3 57.7 66.4 7.4
EBIT margin 8.4% 7.2% 7.4% 8.5% 1.0%
Net income/Loss -210.3 34.0 43.7 51.1 1.6
Net margin -25.1% 4.2% 5.6% 6.6% 0.2%
Total Assets 1,658.2 1,575.3 1,554.7 1,391.9 1,343.4
Total Equity 807.8 815.3 814.7 758.6 693.9
Financial debt 570.4 71.2 443.1 411.6 369.3
Net debt 523.6 399.6 348.5 341.8 344.1
Assets Turnover 0.51 0.52 0.50 0.56 0.56
Return on Assets -12.7% 2.2% 2.8% 3.7% 0.1%
Equity multiplier 2.05 1.93 1.91 1.83 1.94
Return on Equity -26.0% 4.2% 5.4% 6.7% 0.2%
Source: Bloomberg
100
110
120
130
140
150
160
170
May 14 Aug 14 Nov 14 Feb 15 May 15
TLSG SBI TOP
Multiples: TTM
P/E neg.
EV/Sales 1.4
EV/EBITDA 4.9
EV/EBIT 223.0
Telekom Slovenije Group is Slovenia’s leading provider of telecommunications services in domestic
and international fixed telephony, mobile telephony, VoIP, IPTV and broadband internet services.
The Group also offers telecommunication network construction and maintenance services through
its subsidiary GVO d.o.o. and owns a stake in a media company. Telekom Slovenije also operates in
Bosnia and Herzegovina, Kosovo and Macedonia while it exited from a 50% stake in Gibtelecom
during 2014.
37
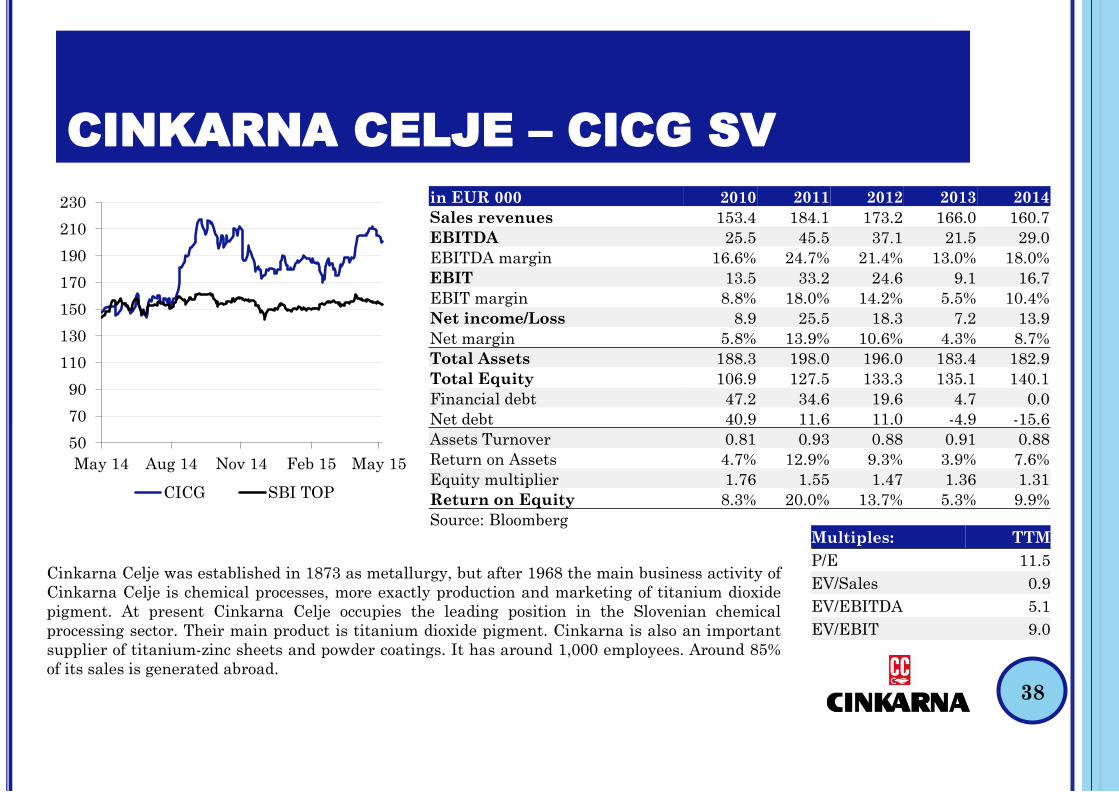
CINKARNA CELJE – CICG SV
50
70
90
110
130
150
170
190
210
230
May 14 Aug 14 Nov 14 Feb 15 May 15
CICG SBI TOP
in EUR 000 2010 2011 2012 2013 2014
Sales revenues 153.4 184.1 173.2 166.0 160.7
EBITDA 25.5 45.5 37.1 21.5 29.0
EBITDA margin 16.6% 24.7% 21.4% 13.0% 18.0%
EBIT 13.5 33.2 24.6 9.1 16.7
EBIT margin 8.8% 18.0% 14.2% 5.5% 10.4%
Net income/Loss 8.9 25.5 18.3 7.2 13.9
Net margin 5.8% 13.9% 10.6% 4.3% 8.7%
Total Assets 188.3 198.0 196.0 183.4 182.9
Total Equity 106.9 127.5 133.3 135.1 140.1
Financial debt 47.2 34.6 19.6 4.7 0.0
Net debt 40.9 11.6 11.0 -4.9 -15.6
Assets Turnover 0.81 0.93 0.88 0.91 0.88
Return on Assets 4.7% 12.9% 9.3% 3.9% 7.6%
Equity multiplier 1.76 1.55 1.47 1.36 1.31
Return on Equity 8.3% 20.0% 13.7% 5.3% 9.9%
Source: BloombergMultiples: TTM
P/E 11.5
EV/Sales 0.9
EV/EBITDA 5.1
EV/EBIT 9.0
Cinkarna Celje was established in 1873 as metallurgy, but after 1968 the main business activity of
Cinkarna Celje is chemical processes, more exactly production and marketing of titanium dioxide
pigment. At present Cinkarna Celje occupies the leading position in the Slovenian chemical
processing sector. Their main product is titanium dioxide pigment. Cinkarna is also an important
supplier of titanium-zinc sheets and powder coatings. It has around 1,000 employees. Around 85%
of its sales is generated abroad.
38


![SSH - Erlangerlang.org/documentation/doc-5.6.4/pdf/ssh-1.0.pdfSSH Reference Manual Short Summaries Erlang Module ssh [page 5] – Main API of the SSH application Erlang Module ssh](https://static.documents.pub/doc/80x56/5ca80b6888c99314128b99ee/ssh-reference-manual-short-summaries-erlang-module-ssh-page-5-main-api-of.jpg)


![SSH Router CISCO-Servidor GNU/Linux. file8/7/2018 · SSH SERVER (config) ssh authentication—retries 3 SSH SERVER (config) ssh version 2 . Debianl [Corriendo] - Oracle VM Virtua180x](https://static.documents.pub/doc/80x56/5cfc14fe88c993da268cd020/ssh-router-cisco-servidor-gnulinux-ssh-server-config-ssh-authenticationretries.jpg)