74
Federal Energy Regulatory Commission • August 2016 (Revised August 2017)

Federal Energy Regulatory Commission • August 2016 (Revised August 2017)

- 2 -
2016
Common Metrics Report: Performance Metrics for Regional Transmission Organizations, Independent System Operators, and
Individual Utilities for the 2010-2014 Reporting Period
Staff Report
Federal Energy Regulatory Commission August 2016 (Revised August 2017)
This report is a product of the staff of the Federal Energy Regulatory Commission. The
opinions and views expressed in this paper represent the preliminary analysis of the Commission staff. This report does not necessarily reflect the views of the Commission.

- 3 -
Acknowledgements
Federal Energy Regulatory Commission Staff Team
Eric Krall, Team Lead
Ellen Brown Nicholas Crowley
Judy Eastwood Sorita Ghosh
Joshua Kirstein Eddy Lim
Valerie Martin Anthony May Monil Patel
Pete Rolashevich Roshini Thayaparan
Alexandra Ward Heidi Werntz Pete Whitman

- 4 -
Table of Contents Preface and Caveats ........................................................................................................ - 8 - Executive Summary ...................................................................................................... - 10 - I. Introduction and Overview ................................................................................... - 13 - II. Background ........................................................................................................... - 14 - III. Common Metrics Review ................................................................................. - 15 -
A. Reliability Metrics ............................................................................................ - 15 - 1. NERC Reliability Standards Compliance .................................................... - 15 - 2. Dispatch Reliability ...................................................................................... - 20 - 3. Load and Wind Forecast Accuracy .............................................................. - 23 - 4. Unscheduled Flows ...................................................................................... - 25 - 5. Transmission Outage Coordination .............................................................. - 27 - 6. Long-Term Reliability Planning – Transmission ......................................... - 29 - 7. Long-Term Reliability Planning – Resources .............................................. - 32 - 8. Interconnection and Transmission Processes ............................................... - 35 - 9. Special Protection Systems ........................................................................... - 40 -
B. System Operations Performance Metrics ......................................................... - 41 - 1. Resource Availability ................................................................................... - 41 - 2. Fuel Diversity ............................................................................................... - 42 - 3. System Lambda ............................................................................................ - 48 -
IV. Selected Other Metrics Specific to RTO and ISO Performance ...................... - 50 - A. Metrics Related to Coordinated Wholesale Power Markets ............................ - 50 -
1. Proportionate Market Transaction Charges in 2014 ..................................... - 50 - 2. Wholesale Power Cost Breakdown .............................................................. - 53 - 3. Fuel-Adjusted Wholesale Price .................................................................... - 55 - 4. Price-Cost Mark-up ...................................................................................... - 56 - 5. Percent of Unit-Hours Mitigated .................................................................. - 57 - 6. Energy Market Price Convergence ............................................................... - 58 - 7. New Entrant Net Revenue ............................................................................ - 59 - 8. Reliability Must-Run Units .......................................................................... - 61 - 9. Demand Response ........................................................................................ - 63 - 10. Congestion Management .......................................................................... - 64 -
B. Metrics Related to Organizational Effectiveness ............................................. - 66 - 1. Administrative Costs .................................................................................... - 66 - 2. Billing Control Audits and Billing Accuracy ............................................... - 69 - 3. Customer Satisfaction ................................................................................... - 69 -
Appendix A: List of Common Metrics ........................................................................ - 71 - Appendix B: Recent RTO and ISO Expansion Activity ............................................. - 72 -

- 5 -
List of Tables
Table 1: Respondents submitting performance metrics reports for 2010-2014. ......... - 13 - Table 2: Selected NERC functional model registrations identified by RTO and ISO
respondents. .......................................................................................................... - 16 - Table 3: Selected NERC functional model registrations identified by non-RTO and ISO
respondents. .......................................................................................................... - 17 - Table 4: Summary of unscheduled flows in 2010 and 2014. ...................................... - 27 - Table 5: Interconnection and transmission service requests: number of study requests,
number of completed studies, and ratio of completed to requested studies, 2010-2014. ..................................................................................................................... - 35 -
Table 6: Average annual feasibility study costs. ......................................................... - 38 - Table 7: Average annual system impact study costs, 2010-2014. ............................... - 39 - Table 8: Average annual facility impact study costs, 2010-2014. .............................. - 39 - Table 9: Total number of Special Protection Systems reported. ................................. - 41 - Table 10: Summary of dollars billed by charge type, 2014. ....................................... - 51 - Table 11: New entrant natural gas-fired combustion turbine net generation revenues.
(dollars per installed MW-year) ........................................................................... - 60 - Table 12: New entrant natural gas-fired combined cycle net generation revenues, 2010-
2014. (dollars per installed MW-year) ................................................................. - 60 - Table 13. Common metrics included in information collection FERC-922. ............... - 71 -

- 6 -
List of Figures Figure 1: Share of total generation by fuel type, 2010-2014. ...................................... - 10 - Figure 2: RTOs and ISOs planned and actual reserve margins, 2010-2014. ............... - 11 - Figure 3: Number of transmission projects approved for construction for reliability
purposes, 2010-2014. ............................................................................................ - 11 - Figure 4: Annual per-megawatt-hour administrative costs, 2010-2014. ..................... - 12 - Figure 5: Number of violations made public by FERC/NERC as submitted by
respondents, 2010-2014. ....................................................................................... - 19 - Figure 6: CPS1, 2010-2014. ........................................................................................ - 21 - Figure 7: CPS2, 2010-2014. ........................................................................................ - 22 - Figure 8: Energy Management System availability (average and range), 2010-2014. - 23 - Figure 9: Average and range of load forecast accuracy and wind forecast accuracy, 2010-
2014. ..................................................................................................................... - 25 - Figure 10: Percentage of planned transmission outages with at least one month
notification, 2010-2014. ....................................................................................... - 28 - Figure 11: Average percentage of previously-approved transmission outages canceled by
the transmission provider, 2010-2014. ................................................................. - 29 - Figure 12: Number of transmission projects approved for construction for reliability
purposes, 2010-2014. ............................................................................................ - 30 - Figure 13: Percentage of approved transmission projects completed, 2010-2014. ..... - 31 - Figure 14: Percentage of transmission projects on schedule, 2010-2014. .................. - 32 - Figure 15: Annual average generator interconnection processing time, 2010-2014. .. - 33 - Figure 16: Planned and actual reserve margins, 2010-2014. ...................................... - 34 - Figure 17: Average age of incomplete studies, 2010-2014. ........................................ - 37 - Figure 18: Generating capacity mix by fuel type, 2010 and 2014. ............................. - 43 - Figure 19: Share of total generation by fuel type . ...................................................... - 46 - Figure 20: Gain/loss in non-hydro renewables share of total energy relative to 2010.- 47 - Figure 21: Average cost of natural gas and coal delivered to U.S. electric power plants,
2010-2014. ............................................................................................................ - 48 - Figure 22: System lambda by respondent, 2010-2014. ............................................... - 50 - Figure 23: Wholesale power cost breakdown, 2010-2014. ......................................... - 54 - Figure 24: Load-weighted, fuel-adjusted locational marginal prices, 2010-2014. ..... - 55 - Figure 25: Price-cost mark-up, 2010-2014. ................................................................. - 57 - Figure 26: Percentage of unit-hours mitigated, 2010-2014. ........................................ - 58 - Figure 27: Percentage day-ahead to real-time energy market price convergence, 2010–
2014. ..................................................................................................................... - 59 - Figure 28: Percentage change in nominal net revenues for new entrant natural gas-fired
combustion turbine and combined cycle generators, 2010-2014. ........................ - 61 - Figure 29: Number of units under RMR contracts, 2010 and 2014. ........................... - 62 - Figure 30: Change in capacity under RMR or similar agreements between 2010 and
2014. ..................................................................................................................... - 63 - Figure 31: Demand response as a percentage of total installed capacity. ................... - 64 - Figure 32: Demand response as a percentage of operating reserves, 2010-2014. ...... - 64 -

- 7 -
Figure 33: Annual congestion costs per megawatt-hour of load served and percentage of annual congestion costs hedged. ........................................................................... - 66 -
Figure 34: NYISO capital costs as a percentage of budgeted costs, 2010-2014. ........ - 67 - Figure 35: Five year average capital costs as a percentage of budgeted costs. ........... - 67 - Figure 36: Non-capital costs as a percentage of budgeted costs, 2010-2014 average. - 68 - Figure 37: Per-megawatt-hour administrative costs, 2010-2014 average. .................. - 68 -

- 8 -
Preface and Caveats This report is the latest activity in an initiative originally designed to examine the performance and benefits of Regional Transmission Organizations (RTO) and Independent System Operators (ISO). The initiative arose in response to a 2008 Government Accountability Office (GAO) report recommending that the Federal Energy Regulatory Commission (FERC) do more to track the performance and benefits of RTO and ISO markets.1 The previous report in this initiative, issued in August 2014, established a set of common performance metrics for evaluating the performance of RTOs and ISOs and individual utilities in regions outside of RTOs and ISOs (referred to hereinafter as “non-RTOs and ISOs,” “non-RTO and ISO respondents,” or “non RTO and ISO utilities”) in areas where these entities perform identical functions. These performance metrics cover both reliability and system operations activities.
The source of data for this report is primarily information collected from RTOs and ISOs and non-RTOs and ISOs under Information Collection FERC-922, “Performance Metrics for ISOs, RTOs and Regions Outside ISOs and RTOs” (Office of Management and Budget Control No. 1902-0262). Other market-specific data were voluntarily submitted by the six Commission-jurisdictional RTOs and ISOs. Consistent with past practice in this initiative, respondents submitted information on a voluntary basis. Six RTOs and ISOs responded,2 along with seven non-RTO and ISO utilities. Commission staff greatly appreciates the efforts of those who contributed information to this initiative.
The report contains analyses, presentations, and conclusions that, unless otherwise noted, are based on or derived from the data provided by respondents, but do not necessarily reflect the positions or conclusions of the respondents themselves. Furthermore, the opinions and views expressed in this report do not necessarily represent those of the Commission, its Chairman, or individual Commissioners, and are not binding on the Commission. Any errors are those of Commission staff.
1 U.S. Gov’t Accountability Off., GAO #08-987, Gov’t Accountability Off. Report
to the Committee on Homeland Security and Government Affairs, U.S. Senate; Electricity Restructuring: FERC Could Take Additional Steps to Analyze Regional Transmission Organizations’ Benefits and Performance (2008) (2008 GAO Report).
2 The six Commission-jurisdictional RTOs and ISOs responded. These are as follows: California Independent System Operator Corporation (CAISO); ISO New England Inc. (ISO-NE); Midcontinent Independent System Operator, Inc. (MISO); New York Independent System Operator, Inc. (NYISO); PJM Interconnection, L.L.C. (PJM); and Southwest Power Pool, Inc (SPP).

- 9 -
The metrics used in this report pertain to both RTOs and ISOs and non-RTOs and ISOs. However, several limitations preclude all but the most basic observations about the metrics submitted by RTOs and ISOs relative to those submitted by non-RTOs and ISOs. While the intent behind these metrics is to compare areas in which RTOs and ISOs and non-RTOs and ISOs perform identical functions, Commission staff notes that there are significant differences in the scale of operations performed by the largest RTOs and ISOs as compared to non-RTO and ISO respondents with relatively smaller service territories (e.g., PJM’s footprint covers territory in 13 states and the District of Columbia,3 whereas Arizona Public Service Company’s territory covers 11 counties in Arizona).4 These data limitations and differences must be carefully considered when comparing metrics-related information submitted by RTOs and ISOs and non-RTOs and ISOs. As such, Commission staff has largely avoided drawing these types of comparisons.
In addition, these metrics do not capture some of the potential benefits that are difficult to isolate and measure, e.g., benefits created by providing opportunities for input by a broad range of stakeholders.
3 California Independent System Operator Corporation; ISO New England Inc.;
Midcontinent Independent System Operator, Inc.; New York Independent System Operator; PJM Interconnection, L.L.C.; and Southwest Power Pool, Inc. October 30, 2015 Filing, at 279 (October 2015 RTO and ISO Metrics Report).
4 Arizona Public Service Company November 5, 2015 Filing, at 1 (November 2015 APS Metrics Report).

- 10 -
Executive Summary This report contains a review of performance metrics for RTOs and ISOs as well as non-RTO and ISO utilities for the period from 2010-2014.
Key Insights Regarding RTOs and ISOs RTOs and ISOs managed the dispatch of energy from a diverse set of generating fuel-types from 2010-2014. RTOs and ISOs manage the scheduling and deployment of different resource types through day-ahead and real-time energy markets, which operate as market clearing auctions that establish commitment and dispatch schedules subject to system constraints. RTOs and ISOs report managing the dispatch of energy from varying fuel sources from 2010-2014; as seen in Figure 1, most RTOs and ISOs report managing an increasing share of energy from renewable generation and fluctuations in the relative amounts of energy provided by natural gas-fired generation and coal-fired generation.
Figure 1: Share of total generation by fuel type, 2010-2014.
Source: Commission staff based on information collection FERC-922.

- 11 -
RTO and ISO regions maintained adequate power supplies, in accordance with planned reserve margins from 2010-2014. Planning reserves ensure that there is a low probability of loss-of-load due to inadequate supply. As shown in Figure 2, RTOs and ISOs report capacity in excess of planned reserve levels in each year from 2010-2014. Figure 2: RTOs and ISOs planned and actual reserve margins, 2010-2014.
Source: Commission staff based on information collection FERC-922.
RTOs and ISOs report the approval of a large number of transmission projects for reliability purposes from 2010-2014. Adequate transmission is an essential element of a reliable power system. RTOs and ISOs evaluate transmission projects for reliability purposes in their planning processes. As shown in Figure 3, all RTOs and ISOs report the construction of transmission projects for reliability purposes between 2010 and 2014, helping to ensure a reliable grid.
Figure 3: Number of transmission projects approved for construction for reliability purposes, 2010-2014.
Source: Commission staff based on information collection FERC-922.
CAISO ISO-NE MISO NYISO PJM SPP
05
10152025303540
2010
2011
2012
2013
2014
2010
2011
2012
2013
2014
2010
2011
2012
2013
2014
2010
2011
2012
2013
2014
2010
2011
2012
2013
2014
2010
2011
2012
2013
2014
percent
Key:ActualPlanned
CAISO ISO-NE MISO NYISO PJM SPP
0100200300400500600700
2010
2011
2012
2013
2014
2010
2011
2012
2013
2014
2010
2011
2012
2013
2014
2010
2011
2012
2013
2014
2010
2011
2012
2013
2014
2010
2011
2012
2013
2014
projects

- 12 -
Administrative costs per megawatt-hour varied across RTOs and ISOs from 2010-2014. Administrative charges (including both capital and non-capital costs) measured as per megawatt-hour of load allows for comparison across markets of different sizes. As shown in Figure 4, RTOs and ISOs report a range of administrative charges per megawatt-hour of load. In some cases, these charges were relatively flat between 2010 and 2014, while in other cases the charges increased, in nominal terms. PJM and MISO, two of the largest RTOs, report relatively low administrative charges per megawatt-hour. Administrative costs typically represent a small percentage of the total cost of wholesale power.5
Figure 4: Annual per-megawatt-hour administrative costs, 2010-2014.
Source: Commission staff based on 2015 RTO and ISO Metrics Report. Note: Values are expressed in nominal dollars per megawatt-hour.
5 See infra pp. 51-52.
CAISO ISO-NE MISO NYISO PJM SPP
0
0.2
0.4
0.6
0.8
1
1.2
0.00.20.40.60.81.01.21.4
2010
2011
2012
2013
2014
2010
2011
2012
2013
2014
2010
2011
2012
2013
2014
2010
2011
2012
2013
2014
2010
2011
2012
2013
2014
2010
2011
2012
2013
2014
$/MWh

- 13 -
I. Introduction and Overview
This report presents Commission staff’s review of data relating to performance metrics that measure activities in which RTOs and ISOs and non-RTO and ISO utilities performed identical functions during the 2010-2014 reporting period. Additionally, the report presents Commission staff’s review of certain metrics data submitted by RTOs and ISOs that are specific to RTO and ISO market and administrative functions.
During 2015, six RTOs and ISOs submitted performance metrics data in a joint report in Docket No. AD14-15-000. Additionally, seven utilities in non-RTO and ISO regions submitted performance metrics data on a voluntary basis.
Commission staff collected the 30 common metrics from RTOs and ISOs and non-RTO and ISO utilities under information collection FERC-922, “Performance Metrics for ISOs, RTOs and Regions Outside ISOs and RTOs” (OMB Control No. 1902-0262). Information Collection FERC-922 includes 30 common metrics used to measure the performance of certain reliability and system operations in areas where RTOs and ISOs and non-RTO and ISO respondents perform identical functions. The reliability performance metrics measure both day-to-day operations and long-term reliability. The system operations metrics measure certain aspects of operational efficiency. Table 13 in Appendix A lists the 30 common metrics.
Table 1 lists the entities who submitted the metrics data reflected in this report and the acronyms used to refer to these entities in the remainder of this report.
Table 1: Respondents submitting performance metrics reports for 2010-2014. RTOs and ISOs non-RTOs and ISOs
California Independent System Operator Corporation (CAISO)
Arizona Public Service Company (APS)
ISO New England Inc. (ISO-NE) Duke Energy Carolinas, LLC (DEC)
Midcontinent Independent System Operator, Inc. (MISO)
Duke Energy Progress, LLC (DEP)
New York Independent System Operator, Inc. (NYISO) Duke Energy Florida, LLC (DEF)
PJM Interconnection, L.L.C. (PJM) Louisville Gas and Electric Company and Kentucky Utilities Corporation (LG&E/KU)
Southwest Power Pool, Inc. (SPP) PacifiCorp (PAC) (note that some metrics are reported separately for PacifiCorp – East (PACE) and PacifiCorp – West (PACW))
Southern Company (SOU)

- 14 -
This report contains the following sections:
• Background, which briefly summarizes the history of the common metrics initiative;
• Common Metrics Review, which reviews the metrics data submitted by RTOs and ISOs and non-RTO and ISO respondents;
• Other Metrics, which reviews data responsive to metrics specific to RTO and ISO markets;
• Appendix A, which contains detailed descriptions of the 30 common metrics; and
• Appendix B, which summarizes recent studies that have quantified certain RTO and ISO benefits that the metrics do not cover.
II. Background
In May 2007, Senators Joseph I. Lieberman and Susan M. Collins of the U.S. Senate Committee on Homeland Security and Governmental Affairs requested that the GAO investigate RTO and ISO costs, structure, processes, and operations.6 In a September 2008 Report to the U.S. Senate Committee on Homeland Security and Governmental Affairs, the GAO recommended that FERC work with RTOs, ISOs, stakeholders and other interested parties to develop standardized measures to track the performance of RTO and ISO operations and markets; report on those measures; and interpret how the measures communicate evidence of RTO and ISO benefits or performance concerns.7
Commission staff developed the common metrics initiative in response to the 2008 GAO Report. The evolution of the initiative included Commission staff taking steps to meet five objectives. These objectives, as described in FERC’s Fiscal Year 2009-2014 Strategic Plan, include: (1) developing appropriate operational and financial metrics for RTOs and ISOs; (2) exploring and developing appropriate operational and financial metrics for non-RTO and ISO utilities; (3) establishing appropriate common metrics
6 The Senators made this request in a May 21, 2007 letter to the GAO. The letter
expressed the Senators’ concern that RTOs and ISOs may not be living up to their full potential with respect to improving efficiencies and reducing costs, and that RTOs and ISOs might not have adequate incentives to minimize costs.
7 See 2008 GAO Report at 56, 59-61.

- 15 -
between RTOs and ISOs and non RTO and ISO utilities; (4) monitoring implementation and performance; and (5) evaluating performance and seeking changes, as necessary.8
In April 2011, after establishing metrics for RTOs and ISOs under the first objective, the then-Chairman’s Office submitted a Report to Congress summarizing RTO and ISO performance for the years 2005-2009.9 To meet the second objective, Commission staff issued a report on performance in regions outside RTOs and ISOs in October 2012.10 An August 2014 Commission Staff report11 satisfied the third, fourth, and fifth objectives by establishing, implementing, and evaluating a set of common metrics. This report represents a continuation of the fifth objective.
III. Common Metrics Review
A. Reliability Metrics
1. NERC Reliability Standards Compliance
a. References to Applicable NERC Standards
This metric provides an overview of the North American Electric Reliability Corporation (NERC) standards that are applicable to each respondent. Each respondent submitted a table identifying applicable NERC functional model registrations.12 As shown in Tables 2 and 3, there are several areas in which the respondents perform similar functions. For example, most respondents are registered balancing authorities and transmission operators. In other areas, the RTO and ISO respondents are dissimilar from the non-RTO
8 FERC, The Strategic Plan: FY 2009-2014 (Revised 2013), at 13,
http://www.ferc.gov/about/strat-docs/FY-09-14-strat-plan-print.pdf.
9 FERC, Performance Metrics For Independent System Operators and Regional Transmission Organizations, Docket No. AD10-5-000, at 5 (2011); see also FERC, 2010 ISO/RTO Performance Metrics Commission Report, Docket No. AD10-5-000 (2010).
10 FERC, Performance Metrics In Regions Outside ISOs and RTOs Commission Staff Report, Docket No. AD12-8-000 (2012).
11 FERC, Common Metrics Commission Staff Report, Docket No. AD14-15-000 (2014), http://www.ferc.gov/legal/staff-reports/2014/ad14-15-performance-metrics.pdf.
12 The timing of snapshots of each respondent’s functional model registrations did not coincide, e.g., ISO-NE’s submittal represents registrations as of the end of 2013; NYISO’s submittal represents registrations as of the end of 2014, and APS’ submittal represents registrations as of August 2015.

- 16 -
and ISO respondents. For instance, most of the RTOs and ISOs perform reliability coordinator functions while most of the non-RTO and ISO respondents do not.
Table 2: Selected NERC functional model registrations identified by RTO and ISO respondents.
Ba
lanc
ing
Auth
ority
Inte
rcha
nge
Auth
ority
Plan
ning
Aut
horit
y
Relia
bilit
y Co
ordi
nato
r
Reso
urce
Pla
nner
Tran
smis
sion
Ope
rato
r
Tran
smis
sion
Pla
nner
Tran
smis
sion
Ser
vice
Pr
ovid
er
CAISO ● ● ● ●
ISO-NE ● ● ● ● ● ● ● ●
MISO ● ● ● ● ● ● ●
NYISO ● ● ● ● ● ● ● ●
PJM ● ● ● ● ● ● ● ●
SPP ● ● ● ● ●
Source: Commission staff based on information collection FERC-922. Note: Cells marked with “●” denote that the respondent identified the functional model registration in its data submittal.

- 17 -
Table 3: Selected NERC functional model registrations identified by non-RTO and ISO respondents.
Ba
lanc
ing
Auth
ority
Inte
rcha
nge
Auth
ority
Plan
ning
Aut
horit
y
Relia
bilit
y Co
ordi
nato
r
Reso
urce
Pla
nner
Tran
smis
sion
Ope
rato
r
Tran
smis
sion
Pla
nner
Tran
smis
sion
Ser
vice
Pr
ovid
er
APS ● ● ● ● ● ●
DEC ● ● ● ● ● ● ●
DEF ● ● ● ● ● ● ●
DEP ● ● ● ● ● ● ●
LG&E/KU ● ● ● ● ● ● ●
PAC ● ● ● ● ● ●
SOU ● ● ● ● ● ● ● ●
Source: Commission staff based on information collection FERC-922. Notes: (1) Cells marked with “●” denote that the respondent identified the functional model registration in its data submittal. (2) PACE and PACW are each an individual balancing authority.
b. Violations Made Public by FERC or NERC13
These metrics measure the number of violations of NERC reliability standards, provide information on how these violations were reported (e.g., self-reported or reported in audits), and indicate the severity of violations, when such information is provided. These metrics also detail compliance with operating reserve standards and unserved energy (or load shedding) caused by violations.
13 In addition to the violations data discussed in this section, certain respondents
provided information regarding (1) the severity level of violations and (2) compliance with operating reserves standards. Reporting formats for the severity level of violations were not uniform, as some respondents reported that severity levels did not apply or that severity classifications changed during the reporting period. See, e.g., October 2015 RTO and ISO Metrics Report at 32 (CAISO stating that “[the Western Electricity Coordinating Council] has stopped identifying severity levels of violations, and they are not included for violations identified as a result of a NERC/FERC investigation.”) Additionally, all respondents who discussed operating reserve standards indicated compliance for each year in the reporting period.
- 18 -
i. Number of violations
The number of violations metric measures both the number of violations and how these violations were reported (e.g., self-reported or reported in audits). Mandatory reliability standards only apply based on the NERC functional model categories for which each entity is registered. As a result of the variety of categories, different reliability standards apply to different RTOs and ISOs and to different non-RTO and ISO respondents.
As shown in Figure 5,14 PJM reports the highest total number of violations for the 2010-2014 reporting period. Most of PJM’s violations were self-reported, as is generally the case across both RTO and ISO and non-RTO and ISO respondents. Because PJM is the registered Transmission Operator for the PJM region, PJM executive management has the ultimate decision-making authority to determine whether a potential violation has occurred and whether PJM must submit a self-report to NERC the relevant Regional Entity.15
When comparing across entities, it is important to note that it is difficult to draw conclusions based on the relative magnitude of self-reported violations. Differences in self-reported violations may or may not correspond to underlying differences in performance.
14 Figure 5 shows total violations reported by each respondent for the 2010-2014
period. Responses are not shown by year, as the year in which a violation is made public may not correspond to the year in which a respondent self-reported a violation or was subject to an audit or spot-check.
15 Id.

- 19 -
Figure 5: Number of violations made public by FERC/NERC as submitted by respondents, 2010-2014.
Source: Commission staff based on information collection FERC-922. Notes: (1) “Other violations” shown in the figure reflects the difference between the reported total number of violations and the sum of (a) the reported number of self-reported violations and (b) the reported number of violations made public by audits. (2) SPP does not report any violations associated with this metric. (3) The violation totals shown for CAISO derive from values in Tables A, B, and C on pp 30-31 of the October 2015 RTO and ISO Metrics Report. (4) ISO-NE and NYISO totals reflect a supplemental response received by email on January 5, 2016.
ii. Unserved energy (load shedding) caused by violations
Among RTOs and ISOs, CAISO and PJM report instances of load shedding caused by violations during the 2010-2014 reporting period.16 CAISO reports that in April 2010, an operator believed that load shedding was necessary to maintain an import limit; CAISO also indicates a load shedding event from September 2011, associated with the Pacific Southwest outage.17 PJM reports that it shed a total of 154.1 MW of load on two days in 2013 in order to protect system reliability.18 No other RTOs or ISOs report load shedding during the 2010-2014 reporting period.
16 Additionally, CAISO discusses a load shedding event from November 2008,
which is outside of the reporting period. See October 2015 RTO and ISO Metrics Report at 33.
17 Id.
18 Id. at 282.
0
10
20
30
40
50
60
PJM MISO CAISO ISO-NE NYISO
violations
0
10
20
30
40
50
60
LG&E/KU PAC DEP APS DEF DEC SOU
violations
Violations made public by audits
Self-reported violations
Other violations

- 20 -
Among non-RTO and ISO respondents, APS reports load shedding associated with the September 2011 Pacific Southwest outage.19 No other non-RTO and ISO respondents report load shedding during the 2010-2014 reporting period.
2. Dispatch Reliability
Dispatch reliability metrics measure the performance of dispatch operations in maintaining steady-state frequency within defined limits by balancing power demand and supply in real time, as well as the availability of systems that perform real-time monitoring and security analysis functions.
a. Control Performance Standard 1 (CPS1)
CPS1 is a statistical measure of Area Control Error20 variability. This standard measures Area Control Error in combination with the interconnection’s frequency error.21 Balancing authorities must achieve a minimum CPS1 compliance of 100 percent over a 12 month period.22 As shown in Figure 6, each RTO and ISO respondent achieved CPS1 compliance for calendar years 2010-2014.
Among the non-RTO and ISO respondents, only LG&E/KU and PAC submitted annual CPS1 values, demonstrating compliance with CPS1 requirements for calendar years
19 November 2015 APS Metrics Report at 6.
20 NERC defines Area Control Error as the instantaneous difference between a balancing authority’s net actual and scheduled interchange, taking account of frequency bias and meter error. See NERC, Glossary of Terms Used in NERC Reliability Standards 7 (Apr. 2016).
21 NERC defines frequency error as the difference between actual and scheduled frequency. See NERC, Glossary of Terms Used in NERC Reliability Standards 44 (Feb. 2016), http://www.nerc.com/files/glossary_of_terms.pdf.
22 When a balancing authority’s frequency is exactly on schedule or Area Control Error is zero, CPS1 equals 200 percent. The CPS1 calculation is structured such that, if a balancing authority’s Area Control Error is proportionally as “noisy” as a benchmark frequency noise, that balancing authority’s CPS1 would equal 100 percent. See NERC, Balancing and Frequency Control 33-34 (Jan. 2011), http://www.nerc.com/docs/oc/rs/NERC%20Balancing%20and%20Frequency%20Control%20040520111.pdf.

- 21 -
2010-2014. APS;23 the Duke Energy respondents (DEC, DEF, and DEP);24 and SOU25 report compliance with CPS1 for the 2010-2014 period, although they do not report annual values.
Figure 6: CPS1, 2010-2014.
Source: Commission staff based on information collection FERC-922. Note: PACE and PACW are separate balancing authority areas.
b. Control Performance Standard 2 (CPS2)
CPS2 is a statistical measure of Area Control Error magnitude. The intent of the standard is to limit a control area’s unscheduled power flows. APS and two Duke Energy respondents (DEF and DEP) report compliance with CPS2 over the reporting period, but do not provide annual values.26 CAISO, MISO, PJM, SOU, DEC, and PAC do not report
23 November 2015 APS Metrics Report at 6.
24 Duke Energy Corporation October 27, 2015 Filing at 5 (October 2015 Duke Metrics Report).
25 Southern Company October 30, 2015 Filing at 16 (October 2015 SOU Metrics Report).
26 See November 2015 APS Metrics Report at 6, October 2015 Duke Metrics Report at 5.
0
0.2
0.4
0.6
0.8
1
1.2
60
80
100
120
140
160
180
200
CAISO ISO-NE MISO NYISO PJM SPP LG&E/KU PACE PACW
percent
Requirement
2010
2011
2012
2013
2014
Key:

- 22 -
CPS2 data, explaining that during 2010-2014 they participated in a proof-of-concept field trial that included a waiver from CPS2 requirements.27
Figure 7 displays the CPS2 metrics from ISO-NE, NYISO, SPP, and LG&E/KU. Figure 7: CPS2, 2010-2014.
Source: Commission staff based on information collection FERC-922.
c. Energy Management System availability
The Energy Management System availability metric measures the availability of the systems used for real-time monitoring and security analysis functions, reported as a percentage of minutes of operational availability each year. Figure 8 shows the five-year average and range of annual Energy Management System availability for respondents providing data. Lower values indicate that a respondent’s Energy Management System was unavailable more often relative to those of respondents reporting higher values. Among RTOs and ISOs, only PJM reports a five-year average availability of less than 99.90 percent, with annual values ranging from 99.54 percent in 2010 to 99.99 percent in 2011 and 2013.28 All other RTOs and ISOs report annual Energy Management System availability above 99.90 percent in every year from 2010-2014.
27 See October 2015 RTO and ISO Metrics Report at 34, 159, 284; October 2015
SOU Metrics Report at 16; October 2015 Duke Metrics Report at 5; PacifiCorp February 10, 2016 Filing at 11 (February 2016 PAC Metrics Report).
28 PJM reports that in November 2011 it implemented a second control center with dual independent data communication links to the Energy Management Systems at each
0
10
20
30
40
50
60
70
80
90
100
86
88
90
92
94
96
98
100
ISO-NE NYISO SPP LG&E/KU
percent
Requirement
2010
2011
2012
2013
2014
Key:

- 23 -
Among non-RTO/ISO respondents that report Energy Management System availability, only DEC reports a five-year average availability of less than 99.90 percent, with annual values ranging from 99.86 percent in 2012 to 99.48 percent in 2013.
Figure 8: Energy Management System availability (average and range), 2010-2014.
Source: Commission staff based on information collection FERC-922. Notes: (1) SOU reports that it transitioned to a new Energy Management System during the 2010-2014 time period and therefore it does not provide specific annual availability values. (2) SOU reports that it had zero “Loss of [Energy Management System] capability” events pursuant to Reliability Standard EOP-004-2 during 2010-2014.29 (3) PAC does not report this metric in percentage terms, but instead reported annual outage minutes for its Ranger EMS system,30 and in the above chart, PAC’s Energy Management System availability reflects annual outage minutes reported divided by 525,600 minutes per year.
3. Load and Wind Forecast Accuracy
The load forecast accuracy metric measures the accuracy of the day-ahead load forecast, based on the absolute percentage deviation between actual peak load and forecasted peak load.31 As load forecasting affects resource commitment, load forecast accuracy impacts control center, and that these enhancements helped to increase availability. See October 2015 RTO and ISO Report at 283.
29 See October 2015 SOU Metrics Report at 16.
30 See February 2016 PAC Metrics Report at 11-12.
31 RTOs and ISOs generally calculate this metric based on the mean absolute percentage error of the forecast at a reference point on the prior day. The reference point varies across RTOs and ISOs, from 5:00 a.m. on the prior day in NYISO to 3:30 p.m. on
CAISOISO-NEMISONYISOPJMSPP
APSDECDEFDEPLG&E/KUPAC
0 2 4 6 8 10 12 14
99.4 99.5 99.6 99.7 99.8 99.9 100.0percent
5-yr min
5-yr avg
5-yr max
Key:

- 24 -
the incurrence of commitment costs. The more accurate a respondent is in forecasting load, the greater the likelihood that it can commit sufficient resources in a cost-effective manner that avoids over-commitment of resources, inefficient commitment of short lead time resources, and under-utilization of available resources.
The wind forecast accuracy metric measures the percentage accuracy of actual wind availability compared to day-ahead forecasted wind availability. Accurate wind forecasting facilitates the timely commitment and dispatch of sufficient supplemental, non-wind resources.
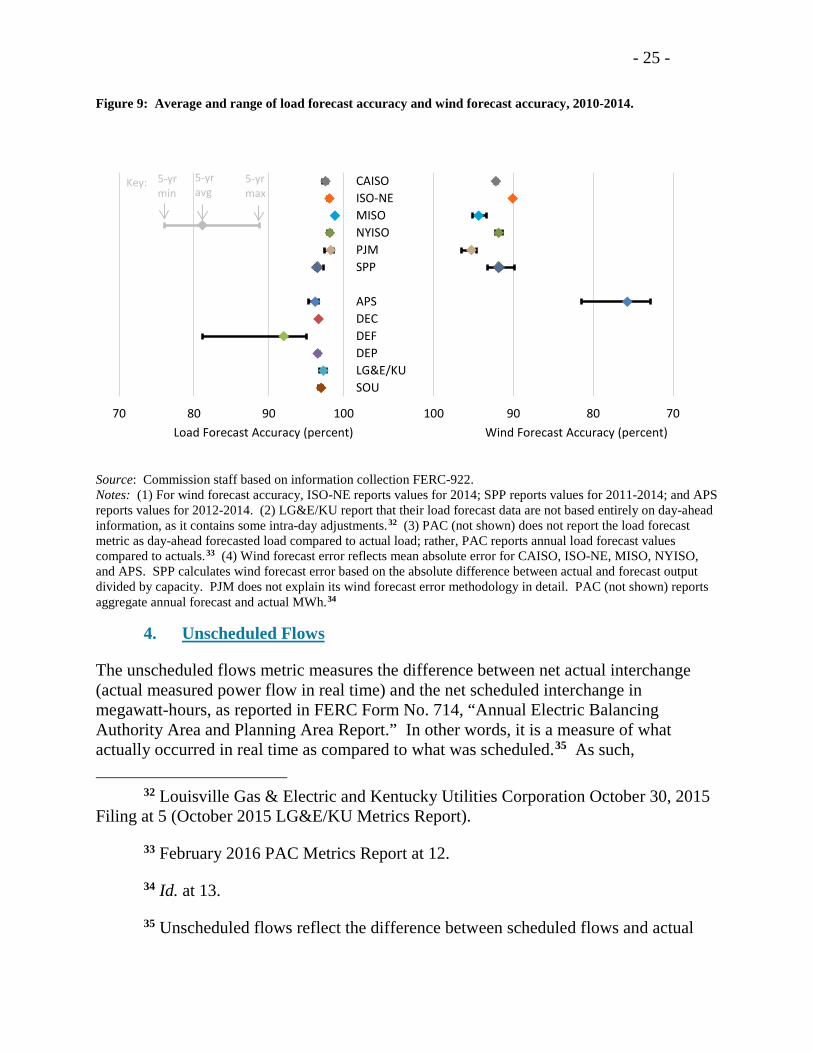
Figure 9 summarizes the load forecast accuracy and wind forecast accuracy metrics data submitted by each respondent. The wind forecast metric is not applicable for certain utilities that do not perform wind forecasting functions because they have little to no wind generation interconnected with their systems.
the prior day in MISO. For additional details, see October 2015 RTO and ISO Metrics Report at 36, 81, 161, 218, 284, 346.
- 25 -
Figure 9: Average and range of load forecast accuracy and wind forecast accuracy, 2010-2014.
Source: Commission staff based on information collection FERC-922. Notes: (1) For wind forecast accuracy, ISO-NE reports values for 2014; SPP reports values for 2011-2014; and APS reports values for 2012-2014. (2) LG&E/KU report that their load forecast data are not based entirely on day-ahead information, as it contains some intra-day adjustments.32 (3) PAC (not shown) does not report the load forecast metric as day-ahead forecasted load compared to actual load; rather, PAC reports annual load forecast values compared to actuals.33 (4) Wind forecast error reflects mean absolute error for CAISO, ISO-NE, MISO, NYISO, and APS. SPP calculates wind forecast error based on the absolute difference between actual and forecast output divided by capacity. PJM does not explain its wind forecast error methodology in detail. PAC (not shown) reports aggregate annual forecast and actual MWh.34
4. Unscheduled Flows
The unscheduled flows metric measures the difference between net actual interchange (actual measured power flow in real time) and the net scheduled interchange in megawatt-hours, as reported in FERC Form No. 714, “Annual Electric Balancing Authority Area and Planning Area Report.” In other words, it is a measure of what actually occurred in real time as compared to what was scheduled.35 As such,
32 Louisville Gas & Electric and Kentucky Utilities Corporation October 30, 2015 Filing at 5 (October 2015 LG&E/KU Metrics Report).
33 February 2016 PAC Metrics Report at 12.
34 Id. at 13.
35 Unscheduled flows reflect the difference between scheduled flows and actual
CAISOISO-NE
MISONYISO
PJMSPP
APS
-10 -5 0 5 10
708090100Wind Forecast Accuracy (percent)
CAISOISO-NEMISONYISOPJMSPP
APSDECDEFDEPLG&E/KUSOU
-10 -5 0 5 10
70 80 90 100Load Forecast Accuracy (percent)
5-yr min
5-yr avg
5-yr max
Key:

- 26 -
unscheduled flows provide information relevant to operational planning that is part of a comprehensive reliability assessment for an RTO and ISO or utility.36 When unscheduled flows exceed system operating limits, curtailments could occur, hindering efficient scheduling of the grid.
Unscheduled flows vary among the reporting entities. Table 4 reviews the unscheduled flows data submitted by each respondent. The data are not normalized across respondents and therefore do not take account of differences in the size of each system.
flows on a particular interconnection between two balancing authorities. Unscheduled flows may also reflect the difference between scheduled and actual flows on a contract path, either between or within balancing authorities.
36 The two components of unscheduled flows are (1) inadvertent energy, defined as the difference between actual and scheduled interchange for all interties; and (2) parallel flow (or loop flow), defined as the difference between scheduled and actual flows on a contract path. Parallel flows are a function of grid conditions and the physical characteristics of the transmission system.

- 27 -
Table 4: Summary of unscheduled flows in 2010 and 2014. Respondent 2010 unscheduled flows
(million megawatt-hours) 2014 unscheduled flows
(million megawatt-hours) percent change from
2010-2014 RTOs and ISOs
CAISO 22.5 5.8 -74.1 MISO 31.0 43.0 38.7 NYISO 8.0 1.7 -78.8 PJM 29.3 28.4 -3.1
non-RTOs and ISOs APS 0.0 0.7 5,344.9 DEC 10.2 10.7 5.0 DEF 14.3 17.1 19.2 DEP 13.7 11.7 -15.1
LG&E/KU 0.0 0.0 -67.6 SOU 46.7 28.3 -39.3
Source: Commission staff based on information collection FERC-922. Notes: (1) ISO-NE, SPP, and PAC do not report data for this metric.37 (2) PAC reports total hours of transmission curtailment in WECC, along with total hours of coordinated operation of phase shifters in WECC.38
5. Transmission Outage Coordination
The transmission outage coordination metrics include (1) a measure of advance notice of planned outages and (2) a measure of cancellations of outages due to factors such as conflicting planned outages or forced outages that could cause reliability issues and additional congestion costs.
a. Early Notification Metric
This metric measures the percentage of planned transmission outages of five days or longer submitted at least one month in advance of the outage commencement date. The metric only applies to transmission facilities at voltages of 200 kilovolts and above. Figure 10 displays this metric for RTOs and ISOs and non-RTO and ISO respondents from 2010-2014. A higher percentage could reflect more effective outage coordination.
Among RTOs and ISOs, ISO-NE and NYISO report the highest levels of early notification, while SPP reported the lowest five-year average. In SPP, the early notification of planned outages ranged from a low of 19.3 percent in 2011 to a high of 24.9 percent in 2014. SPP reports that its tariff does not outline specific timeframes and guidelines for transmission outage coordination, but contains a general requirement that, “consistent with the SPP Membership Agreement, Transmission Owners are required
37 October 2015 RTO and ISO Metrics Report at 85, 347; February 2016 PAC Metrics Report at 14-15.
38 Id. at 14-15.

- 28 -
to coordinate with the Transmission Provider for all planned maintenance of Tariff Facilities.”39 By contrast, ISO-NE reports steps it has taken to improve the lead time for outage request submissions, including efforts to focus on the issue collaboratively with transmission owners and local control centers.40
This metric does not measure advance notification that occurs less than 30 days before an outage. For instance, in 2012, CAISO modified its tariff to require entities to submit outages seven calendar days prior to the outage;41 however, the metric does not reflect the percentage of seven-day notifications. With regard to non-RTO and ISO respondents, LG&E/KU coordinates outage notifications with the Tennessee Valley Authority, which uses a seven-day notice requirement for planned outage requests.42
Figure 10: Percentage of planned transmission outages with at least one month notification, 2010-2014.
Source: Commission staff based on information collection FERC-922. Note: APS, DEC, DEF, DEP, and SOU do not provide data for this metric. Commission staff notes that APS, DEC, DEF, DEP, and SOU report that they post planned outages on their respective Open Access Same Time Information Systems (OASIS).43
b. Cancelation Metric
This metric reflects cancelations of outages due to conflicting planned outages as well as forced outages. The metric measures the percentage of previously-approved transmission
39 October 2015 RTO and ISO Metrics Report at 348.
40 Id. at 86-87.
41 Id. at 41.
42 October 2015 LG&E/KU Metrics Report at 7.
43 November 2015 APS Metrics Report at 9; October 2015 Duke Metrics Report at 13; and October 2015 SOU Metrics Report at 20.
CAISO ISO-NE MISO NYISO PJM SPP LG&E/KU PAC
0102030405060708090
100
2010
2011
2012
2013
2014
2010
2011
2012
2013
2014
2010
2011
2012
2013
2014
2010
2011
2012
2013
2014
2010
2011
2012
2013
2014
2010
2011
2012
2013
2014
2010
2011
2012
2013
2014
2010
2011
2012
2013
2014
percent

- 29 -
outages that are later canceled for transmission facilities with voltages of 200 kilovolts and above. Lower values represent fewer canceled outages and may indicate better outage coordination. Figure 11 shows the percentage of canceled outages from 2010-2014 for RTOs and ISOs and non-RTOs and ISOs submitting data. The RTOs and ISOs submitting data for this metric generally report significantly lower cancelation percentages than the non-RTO and ISO respondents, with the exception of DEC. Figure 11: Average percentage of previously-approved transmission outages canceled by the transmission provider, 2010-2014.
Source: Commission staff based on information collection FERC-922. Notes: (1) APS, DEF, and SOU did not provide data for this metric. (2) SPP (not shown) provided only two years of data. SPP’s reports cancelation percentages of 0.5 percent in 2013 and 0.3 percent in 2014.
6. Long-Term Reliability Planning – Transmission
a. Transmission Projects Approved for Construction
This metric measures the number of transmission facilities approved for construction for reliability purposes. Each of the respondents has a role in approving transmission projects through their respective local and regional reliability planning processes. In reviewing this metric, it is important to consider that the size of the transmission system varies across respondents.
As shown in Figure 12, MISO reports more approved transmission projects than any other respondent. Over the reporting period, MISO approved 2,153 transmission projects for reliability purposes.44 As part of the local transmission planning process, transmission owners in MISO are responsible for submitting their transmission construction plans to MISO for evaluation and possible inclusion in the MISO Transmission Expansion Plan. After evaluation, projects identified as the best solution
44 October 2015 RTO and ISO Metrics Report at 170.
CAISO ISO-NE MISO NYISO PJM DEC DEP LG&E/KU PAC
05
101520253035404550
2010
2011
2012
2013
2014
2010
2011
2012
2013
2014
2010
2011
2012
2013
2014
2010
2011
2012
2013
2014
2010
2011
2012
2013
2014
2010
2011
2012
2013
2014
2010
2011
2012
2013
2014
2010
2011
2012
2013
2014
2010
2011
2012
2013
2014
percent

- 30 -
for a particular issue or opportunity are included in the report and recommended for approval by the MISO Board of Directors.45
Among the non-RTOs and ISOs, only APS and LG&E/KU provide data on the approval of transmission projects. LG&E/KU reports approval of 85 transmission projects from 2010-2014.46
Figure 12: Number of transmission projects approved for construction for reliability purposes, 2010-2014.
Source: Commission staff based on information collection FERC-922. Notes: (1) PAC (not shown) provides data summarizing the total number of projects for all five years, but does not provide separate data describing project approvals. PAC reports projects initiated, ongoing, or completed during the 2010-2014 time frame, based on transmission reliability capital investment. PAC either initiated or completed 85 projects, 51 of which were completed during the 2010-2014 time frame.47 (2) DEC, DEF, and DEP provide data summarizing projects completed in each year, but these non-RTO and ISO utilities do not provide separate data describing project approvals.
b. Transmission Projects Completed
This metric is a measure of transmission planning performance and represents the percentage of approved construction projects completed and on schedule.
RTOs and ISOs report the percentage of projects approved in each year that were completed by the end of the reporting period. Figure 13 shows the percent of approved projects completed for RTOs and ISOs from 2010-2014. Across RTOs and ISOs, ISO-
45 Id. at 170.
46 Id. at 8.
47 February 2016 PAC Metrics Report at 17-18.
CAISO ISO-NE MISO NYISO PJM SPP APS LG&E/KU
0
100
200
300
400
500
600
700
2010
2011
2012
2013
2014
2010
2011
2012
2013
2014
2010
2011
2012
2013
2014
2010
2011
2012
2013
2014
2010
2011
2012
2013
2014
2010
2011
2012
2013
2014
2010
2011
2012
2013
2014
2010
2011
2012
2013
2014
projects

- 31 -
NE reports the highest annual average percentage of approved projects completed over this time period.
Figure 13: Percentage of approved transmission projects completed, 2010-2014.
Source: Commission staff based on information collection FERC-922. Notes: (1) CAISO does not specify whether projects were complete before December 31, 2014. (2) CAISO reports the percentage of approved construction projects completed and projects on-schedule per the original in-service date.48 (3) ISO-NE reports the ratio of under-construction and in-service projects to completed projects.49 (4) MISO reports the percentage of completed reliability projects only.50 (5) NYISO reports “N/A” for 2010 and 2011.
Non-RTO and ISO respondents report the percentage of projects that were on schedule each year. Using this measure, the Duke Energy respondents (DEC, DEF, and DEP), and SOU report 100 percent of transmission projects on schedule, as shown in Figure 14.51 APS reports 100 percent of projects on schedule with the exception of years 2012 and 2013.52
48 Id.
49 Id. at 89-90.
50 Id. at 171.
51 October 2015 Duke Metrics Report at 14-15; and October 2015 SOU Metrics Report at 21.
52 November 2015 APS Metrics Report at 9.
CAISO ISO-NE MISO NYISO PJM SPP
0102030405060708090
100
2010
2011
2012
2013
2014
2010
2011
2012
2013
2014
2010
2011
2012
2013
2014
2010
2011
2012
2013
2014
2010
2011
2012
2013
2014
2010
2011
2012
2013
2014
percent

- 32 -
Figure 14: Percentage of transmission projects on schedule, 2010-2014.
Source: Commission staff based on information collection FERC-922. Note: PAC (not shown) does not report a percentage, but reports 51 completed projects out of 85 initiated projects during the 2010-2014 period, and notes that one of those projects was behind schedule.53
7. Long-Term Reliability Planning – Resources
a. Generator Interconnection Processing Time
The time it takes to process generation interconnection requests is one measure of the effectiveness of processes in achieving timely interconnection of new resources. Each respondent interconnects generators under different operating conditions. Some entities, such as ISO-NE, report challenges in initiating and performing wind interconnection studies because of complex control interactions that increase the potential for more detailed modeling.54
As shown in Figure 15, among RTOs and ISOs, NYISO, MISO, and ISO-NE report the longest interconnection processing times.55 NYISO reports that its average process time was high in 2013 for two reasons: (1) a previously-rejected project was re-studied and retained its queue position; and (2) a project presented the unique circumstance of proposing to interconnect to a 345 kilovolt tie-line between NYISO and a neighboring ISO. As a result of these projects, the necessary analysis required significant additional
53 February 2016 PAC Metrics Report at 18.
54 October 2015 RTO and ISO Metrics Report at 107.
55 Id. at 94-95, 174, 231.
APS DEC DEF DEP LG&E/KU SOU
0102030405060708090
10020
1020
1120
1220
1320
14
2010
2011
2012
2013
2014
2010
2011
2012
2013
2014
2010
2011
2012
2013
2014
2010
2011
2012
2013
2014
2010
2011
2012
2013
2014
percent

- 33 -
time.56 NYISO’s average generation interconnection request processing time ranged from a low of 750 days in 2012 to a high of 2,318 days in 2013.
MISO reports that projects that completed the interconnection process prior to 2012, and then subsequently withdrew, caused several restudies that affected interconnection queue times.57
Among the non-RTO and ISO respondents, LG&E/KU reports the longest average generator interconnection processing time. However, LG&E/KU does not report values for 2010-2012, and their average processing time reflects a two-year average.58 Others, such as APS, SOU, and the Duke Energy respondents (DEC, DEF, and DEP) report, on average, less than 400 days to process their respective generator interconnection requests.59
Figure 15: Annual average generator interconnection processing time, 2010-2014.
Source: Commission staff based on information collection FERC-922. Note: (1) APS reports values for 2011-2014. (2) DEP reports values for 2010-2012 and 2014. (3) LG&E/KU reports values for 2013-2014.
56 Id. at 231-233.
57 Id. at 174.
58 October 2015 LG&E/KU Metrics Report at 9.
59 October 2015 SOU Metrics Report at 24; October 2015 Duke Metrics Report at 17; November 2015 APS Metrics Report at 10.
CAISO ISO-NE MISO NYISO PJM SPP APS DEC DEF DEP LG&E/KU
PAC SOU
0
500
1000
1500
2000
2500
days
2010-2014

- 34 -
b. Actual and Planned Reserve Margins
The comparison of the actual reserve margin to the planned reserve margin measures the extent to which generation resource planning processes are ensuring long-term resource adequacy and reliability. Actual reserve margins in excess of planned levels represent a low probability of loss-of-load due to inadequate supply.
As shown in Figure 16, RTOs and ISOs report actual reserve margins in excess of planned levels between 2010 and 2014. SPP reports the largest difference between actual and planned reserve margins from 2010-2014, with an average planned reserve margin of approximately 13 percent and an average actual reserve margin of approximately 28 percent.60 Among non-RTO and ISO respondents, APS and SOU report actual reserve margins that were substantially higher than the planned levels. Some entities report actual reserve margins below planned levels. For example, in 2014 DEP reports that its planned reserve margin was 14.5 percent in 2014 and its actual reserve margin was 1.9 percent.61
Figure 16: Planned and actual reserve margins, 2010-2014.
Source: Commission staff based on information collection FERC-922.
60 October 2015 RTO and ISO Metrics Report at 355.
61 See October 2015 Duke Metrics Report at 18. DEC, DEF, and DEP report actual reserve margin based on balancing authority reserves at the time of the actual balancing authority hourly integrated peak demand in each year. DEP reports that its peak load occurred during the winter in 2014.
CAISO ISO-NE MISO NYISO PJM SPP APS DEC DEF DEP LG&E/KU
PAC SOU
0
5
10
15
20
25
30
35
40
percentKey:
ActualPlanned
2010-2014

- 35 -
8. Interconnection and Transmission Processes
a. Interconnection and Transmission Service Request Process
The number of study requests and completed studies illustrates the progress that respondents have made in completing their reliability reviews (feasibility, system impact and facility studies) of interconnection and transmission service requests in a timely and efficient manner.
With respect to the number of study requests and completed studies, PJM reports the most study requests and completions while DEP reports the fewest.62 As shown in Table 5, MISO reports nearly four times as many studies completed as requested. MISO reports that each interconnection request may have several studies performed.63
Table 5: Interconnection and transmission service requests: number of study requests, number of completed studies, and ratio of completed to requested studies, 2010-2014.
Respondent 2010-2014 Total
Requested Completed Ratio
RTOs and ISOs
CAISO 529 635 1.2
ISO-NE 174 94 0.5
MISO 354 1366 3.9
NYISO 121 123 1.0
PJM 1689 2185 1.3
SPP 289 446 1.5
RTO and ISO average 526 808 1.5
non-RTOs and ISOs
APS 160 70 0.4
DEC 34 48 1.4
DEF 61 61 1.0
DEP 27 23 0.9
LG&E/KU 120 97 0.8
PAC 825 222 0.3
SOU 354 267 0.8
62 Id. at 19-21; October 2015 RTO and ISO Metrics Report at 300-302.
63 Id. at 180.

- 36 -
Table 5: Interconnection and transmission service requests: number of study requests, number of completed studies, and ratio of completed to requested studies, 2010-2014.
Respondent 2010-2014 Total
Requested Completed Ratio
Non-RTO and ISO average
226 113 0.8
Source: Commission staff based on information collection FERC-922. Note: The studies completed in any particular year may correspond to requests from a prior year and an interconnection request may have several studies performed; the number of completed studies can be higher than the number of requested studies.
b. Average Age of Incomplete Studies
The average age of incomplete studies metric assesses the progress that RTOs and ISOs and non-RTO and ISO utilities have made in completing their reliability reviews (feasibility, system impact and facility studies) of interconnection and transmission service requests in a timely and efficient manner.
As shown in Figure 17, relative to other RTOs and ISOs, SPP reports a consistently low average age of incomplete studies over the five-year reporting period, while MISO reports the largest decline in average age of studies between 2010 and 2014. ISO-NE reports a relatively high average age of incomplete studies from 2010-2014. ISO-NE conducts studies in the order in which projects enter the interconnection queue.64 MISO points to its 2012 queue reform as leading to a reduction in the volume of interconnection requests in the active queue, and states that these tariff revisions and ongoing process improvements led to the downward trend in study completion time. MISO also reports that the lower average time to complete studies resulted in lower average study costs.65
64 October 2015 RTO and ISO Metrics Report at 104-105.
65 Id. at 180.

- 37 -
Figure 17: Average age of incomplete studies, 2010-2014.
Source: Commission staff based on information collection FERC-922. Notes: (1) DEC, DEF, DEP, and LG&E/KU report zero days. (2) SOU does not report annual values for 2010-2014; instead, SOU reports that as of January 1, 2015, the average age of incomplete generator interconnection studies was 48 days and the average age of incomplete transmission service studies was 28 days. (3) The CAISO value shown in the figure reflects a four-year average.
c. Average Cost of Studies
The average cost of studies metric measures the cost of completing reliability reviews (feasibility, system impact, and facility impact studies)66 of interconnection and transmission service requests. Tables 6, 7, and 8 compare the average cost for each of these studies over the 2010-2014 period.
Among RTOs and ISOs, ISO-NE reports the highest feasibility study costs, with an average of $98,626 per study from 2010-2014.67 In ISO-NE, some issues that affect the average feasibility study costs include the following: (1) costs incurred by the respective
66 As explained by PJM in its report: “Feasibility studies assess the practicality
and cost of transmission system additions or upgrades required to accommodate the interconnection of the generating unit or increased generating capacity with the transmission system. System impact studies provide refined and comprehensive estimates of cost responsibility and construction lead times for new transmission facilities and system upgrades that would be required to allow the new or increased generating capacity to be connected to the transmission system . . . . Facility studies develop the transmission facilities designs for any required transmission system additions or upgrades due to the interconnection of the generating unit or increased generating capacity.” Id. at 301-302.
67 Id. at 106.
CAISO ISO-NE MISO NYISO PJM SPP APS
050
100150200250300350400450500
2010
2011
2012
2013
2014
2010
2011
2012
2013
2014
2010
2011
2012
2013
2014
2010
2011
2012
2013
2014
2010
2011
2012
2013
2014
2010
2011
2012
2013
2014
2010
2011
2012
2013
2014
days

- 38 -
transmission owners performing the requested and necessary studies; and (2) the fact that the interconnection feasibility study may be conducted as part of the interconnection system impact study or as a separate study.68 Additionally, ISO-NE reports that wind interconnection studies are becoming more involved and detailed in New England, especially where the largest interest in development is occurring.69
Across all respondents, NYISO reports the highest facility impact study costs (approximately $319,000 per study for 2013 and 2014). NYISO reports that the higher average cost of facility impact studies in 2013 and 2014 was largely due to the unique circumstances of one proposed project to interconnect to a 345 kilovolt tie-line between NYISO and ISO-NE, resulting in complications and increased study costs.70
As MISO does not separate feasibility, system impact, and facility impact studies, MISO is not included in the tables below. MISO reports annual average values for total study costs from 2010-2014, with a high of $216,597 in 2011 and a low of $78,450 in 2013.71 The details of MISO’s response to this metric are accessible in Docket No. AD14-15-000.72
Table 6: Average annual feasibility study costs.
Respondent 2010 2011 2012 2013 2014
RTOs and ISOs
CAISO 15,383 6,819 6,789 7,001 0
ISO-NE 94,960 88,237 98,582 148,307 63,044
NYISO 31,820 50,280 58,600 43,540 33,800
PJM 3,700 5,000 6,700 7,600 5,000
SPP 2,976 6,667 11,039 7,563 6,456
non-RTOs and ISOs
APS 16,428 103,552 0 0 0
68 Id. 105-108.
69 Id. at 107.
70 Id. at 239-240.
71 Id. at 182.
72 Id.

- 39 -
Table 6: Average annual feasibility study costs.
Respondent 2010 2011 2012 2013 2014
DEC 5,464 2,292 8,020 3,068
DEP 753
PAC
SOU 17,906 14,769 10,068 12,964 Source: Commission staff based on information collection FERC-922. Notes: (1) The values in the table are expressed in nominal dollars. (2) DEF does not submit data for this metric and LG&E/KU do not submit data for this metric; (3) MISO submits average costs across all study types and does not separate feasibility study costs. (4) PAC reports only the five-year average. (5) The table reflects responses of $0 as reported.
Table 7: Average annual system impact study costs, 2010-2014.
Respondent 2010 2011 2012 2013 2014
RTOs and ISOs
CAISO 33,199 15,516 14,992 16,268 0
ISO-NE 121,363 102,468 131,287 135,500 175,409
NYISO 43,650 53,410 66,513 45,940 118,430
PJM 10,800 7,100 13,100 16,600 11,300
SPP 15,655 20,623 18,428 25,232 20,009
non-RTOs and ISOs
APS 37,127 27,646 152,195 384,097 411,226
DEC 27,414 109,783 25,701 62,276 5,010
DEP 297
PAC
SOU 11,490 20,830 12,550 18,229 Source: Commission staff based on information collection FERC-922. Notes: (1) The values in the table are expressed in nominal dollars. (2) DEF does not submit data for this metric and LG&E/KU does not submit comparable data for this metric. (3) MISO submits average costs across all study types and does not separate system impact study costs. (4) PAC reports only the five-year average. (5) The table reflects responses of $0 as reported.
Table 8: Average annual facility impact study costs, 2010-2014.
Respondent 2010 2011 2012 2013 2014
RTOs and ISOs
CAISO 48,537 21,571 21,142 53,749 26,758
ISO-NE 131,692 0 20,404 0 18,973
NYISO 200,000 52,630 318,805 319,530
PJM 44,800 36,200 30,300 22,900 22,800
SPP 14,998 4,255 1,953 2,853 2,596
non-RTOs and ISOs
(cont’d.)

- 40 -
Table 8: Average annual facility impact study costs, 2010-2014.
Respondent 2010 2011 2012 2013 2014
APS 29,890 0 32,840 44,080 25,237
DEC 7,422 14,710 17,825 3,940 34,250
PAC
SOU 37,766 15,014 6,414 12,870 Source: Commission staff based on information collection FERC-922. Notes: (1) The values in the table are expressed in nominal dollars. (2) DEF and DEP do not submit data for this metric and LG&E/KU does not submit comparable data for this metric. (3) MISO submits average costs across all study types and does not separate facility impact study costs. (4) PAC reports only the five-year average. (5) The table reflects responses of $0 as reported.
9. Special Protection Systems
This metric measures both the frequency with which the region relies on Special Protection Systems73 and their effectiveness, as measured by successful activations and the number of unintended activations. Special Protection Systems are designed to detect abnormal or predetermined system conditions and take corrective actions, such as changing demand, generation, or system configurations in order to maintain system stability, acceptable voltage levels, or power flows.
Table 9 lists the number of Special Protection Systems reported by respondents.
73 Other terms used to describe Special Protection Systems include Special
Protection Schemes, Remedial Action Schemes, and System Integrity Protection Schemes.
(cont’d.)

- 41 -
Table 9: Total number of Special Protection Systems reported. Respondent Special Protection Systems
RTOs and ISOs
CAISO 5
ISO-NE 27
NYISO 14
MISO 35
PJM 44
SPP 4
non-RTOs and ISOs
APS 5
DEF 1
DEC 1
PAC 13
SOU < 5 Source: Commission staff based on information collection FERC-922. Notes: (1) Totals are for 2014 only. (2) DEP had no such devices. DEF had two such devices in 2010 – 2014; one of which was retired in 2011. DEC had one such device in 2010-2014. (3) SOU reports that it had less than five special protection systems as of 2014.
Respondents also provide information on Special Protection System activations. PJM reports a total of nine intentional Special Protection System activations, eight of which were on the Warren-Falconer 115 kilovolt tie line with NYISO. ISO-NE reports the successful activation of one Special Protection System in 2014, separating the Bangor Hydro and the Maritimes from the interconnected system in a controlled manner.74 MISO and NYISO report no activations of Special Protection Systems from 2010-2014.75 No RTOs or ISOs report unintended activations of Special Protection Systems.
B. System Operations Performance Metrics
1. Resource Availability
Resource availability is a measure of efficiency and cost management. Higher generator availability can result in the commitment of fewer higher cost peak generators (or fewer high-cost imports), thereby resulting in reduced costs.
74 October 2015 RTO and ISO Metrics Report at 108-110.
75 Id. at 183, 241; October 2015 SOU Metrics Report at 26.

- 42 -
The intended calculation methodology for this common metric is one minus the system forced outage rate over 12 months.76 However, respondents’ submissions reveal the use of a variety of calculation methodologies, including effective forced outage rate-demand (EFORd), forced outage rate, and dividing megawatts of unavailable capacity by maximum capacity, among others. Due to concerns about the comparability of the responses received, Commission staff does not include a graphical comparison of the availability metric. Individual responses for this metric are accessible in the submittals from respondents in Docket No. AD14-15-000.
2. Fuel Diversity
a. Generating Capacity by Fuel Type
This metric measures the fuel-type mix of installed generating capacity. This metric provides insight into the different types of generating capacity installed in different regions. Generating capacity mix of certain regions reflects increasing percentages of renewable and natural gas-fired capacity and flat or declining percentages of coal-fired capacity.77 Figure 18 illustrates the percentage capacity shares by fuel type in RTOs and ISOs and non-RTOs and ISOs, respectively. For purposes of comparison across respondents, Figure 18 aggregates hydroelectric and renewable capacity into a single category, and similarly groups natural gas and oil-fired capacity into a single category.78 When evaluating these figures, it is important to consider that individual non-RTO and ISO respondents tend to have fewer resources in their footprints compared with the largest RTOs and ISOs.
76 See Comment Request, Docket No. AD14-15-000 at 17 (May 20, 2015).
77 The specific trends differ across regions.
78 Some respondents aggregated multiple fuel types into single categories, while others provided more disaggregated data.

- 43 -
Figure 18: Generating capacity mix by fuel type, 2010 and 2014.
Source: Commission staff based on information collection FERC-922. Notes: (1) ISO-NE 2014 nuclear capacity values do not reflect the retirement of Vermont Yankee. (2) Per email correspondence on January 5, 2015, SPP revised its 2010 capacity percentage for nuclear to 3.9 percent. (3) Per email correspondence on January 11, 2016, LG&E/KU corrected its 2014 capacity percentages for coal and natural gas-fired capacity to 72.6 percent and 26.4 percent, respectively. (4) APS reports APS-owned capacity. (5) PAC includes contracted capacity. (6) DEP includes jointly-owned capacity.
i. Renewables and hydroelectric generating capacity
Among RTOs and ISOs, CAISO and NYISO report the largest shares of renewables and hydroelectric generating capacity. As of 2014, renewable and hydroelectric generators represented 36.5 percent of capacity in CAISO and 20.2 percent of capacity in NYISO. The largest relative increase occurred in SPP, where the share of renewable and hydroelectric capacity increased from 6.9 percent in 2010 to 12.6 percent in 2014.
CAISO ISO-NE MISO NYISO PJM SPP
0
0.2
0.4
0.6
0.8
1
1.2
0102030405060708090
10020
10
2014
2010
2014
2010
2014
2010
2014
2010
2014
2010
2014
percent
HYDRO/RENEWABLES NUCLEAR COAL NATURAL GAS/OIL OTHER
APS DEC DEF DEP LG&E/KU PAC SOU
0
0.2
0.4
0.6
0.8
1
1.2
0
20
40
60
80
100
2010
2014
2010
2014
2010
2014
2010
2014
2010
2014
2010
2014
2010
2014
percent
HYDRO/RENEWABLES NUCLEAR COAL NATURAL GAS/OIL OTHER PURCHASED POWER

- 44 -
Among non-RTO and ISO respondents, PAC reports the highest total percentage of renewable and hydroelectric generating capacity. Commission staff also notes that a number of non-RTO and ISO respondents report significant shares of capacity associated with purchased power, which could include renewables and other unidentified sources of generation. For PAC, the purchased power category represents non-renewable net purchases, but PAC’s “other” category includes capacity related to certain renewable fuel types.
ii. Natural gas/oil-fired generating capacity
Among RTOs and ISOs, CAISO, ISO-NE, and SPP each report more natural gas-fired capacity than other fuel types from 2010-2014. MISO reports natural gas-fired capacity in combination with oil-fired capacity. The share of natural gas and oil-fired capacity in MISO increased significantly, from 31.3 percent in 2010 to 41.7 percent in 2014, as a number of utilities in the Gulf Coast region joined MISO in December, 2013. In the process, MISO transitioned from a majority coal-fired capacity mix in 2010 to a majority natural gas and oil-fired capacity mix in 2014. NYISO also reports that the New York Control Area has become increasingly dependent on natural gas and dual-fuel generating units,79 although the share of natural gas and oil-fired generation increased modestly in NYISO, from 60.7 percent in 2010 to 61.2 percent in 2014.
Among non-RTO and ISO respondents, DEF reports the largest share of natural gas/oil-fired capacity during the reporting period. DEP, SOU, and PAC all report significant increases in the percentage of natural gas/oil-fired capacity.80
iii. Coal-fired generating capacity
PJM, MISO, and SPP report the highest shares of coal-fired generating capacity among RTOs and ISOs. Coal-fired generators accounted for the largest share of installed capacity in PJM from 2010-2014, ranging from a high of 42 percent in 2011 to a low of 39.7 percent in 2014. MISO reports that coal-fired generating capacity represented the largest share of generating capacity from 2010-2012, prior to the integration of MISO-South.
Across all RTO and ISO and non-RTO and ISO respondents, LG&E/KU report the largest share of coal-fired generating capacity (coal-fired generating capacity represented
79 October 2015 RTO and ISO Metrics Report at 260.
80 For SOU and PAC, this category represents natural gas-fired generating capacity.

- 45 -
more than 70 percent of the total capacity mix in LG&E/KU in each year from 2010-2014).
iv. Nuclear generating capacity
Across all respondents, CAISO reports the largest change in the share of nuclear generating capacity, declining from 7.8 percent in 2010 to 3.5 percent in 2014, which is attributable to the retirement of the San Onofre Nuclear Generating Station (SONGS).
b. Generation by Fuel Type
This metric measures the percentage mix of fuel types used to generate electricity (generation fuel diversity). The metric provides an indication of the level of integration of fuels with different characteristics, such as fuels with lower costs or lower environmental impacts. The mix of fuels used to generate electricity in a given time period follows from, among other factors, the types of generating capacity in service and conditions in fuel markets. Figure 19 shows the share of generation by fuel type from 2010-2014 as reported by respondents.

- 46 -
Figure 19: Share of total generation by fuel type .
Source: Commission staff based on information collection FERC-922. Notes: (1) SPP provided minor corrections to rounding errors in its original submittal via email correspondence on January 5, 2016. These include revising the 2014 share of natural gas-fired generation from 19.03 percent to 19.04 percent, and revising the 2010 share of hydro and renewables generation from 5.5 percent to 5.4 percent. The figure reflects the revised values. (2) Several non-RTO/ISO utilities report generation from purchased power, which may include a variety of fuel types. (3) PAC’s “Other” category reflects waste heat and other sources which include biomass, biogas, geothermal, and solar.81 PAC’s “Purchased Power” category represents non-renewable net purchases.
81 February 2016 PAC Metrics Report at 31.

- 47 -
i. Renewables generation
Most RTOs and ISOs generally report increases in the proportion of energy generated from renewable and hydroelectric sources between 2010 and 2014. In addition, the RTOs and ISOs separately report renewable generation as a percentage of total energy, separate from hydroelectric generation as a percentage of total energy. Figure 20 shows the increase in the share of total energy from non-hydro renewable sources relative to 2010 for five RTOs and ISOs. From 2010-2014, CAISO and SPP reported the largest gains in the share of energy provided from non-hydro renewable sources among RTOs and ISOs.
Figure 20: Gain/loss in non-hydro renewables share of total energy relative to 2010.
Source: Commission staff based on information submitted in the October 2015 RTO and ISO Metrics Report. Note: PJM is not included in this figure. PJM reports renewables as a percentage of total energy increasing from 4.1 percent to 4.3 percent between 2010 and 2014. However, in comparing these totals to other values reported by PJM, it is not clear whether PJM included or excluded hydroelectric generation from the total.
ii. Coal, natural gas, and oil-fired generation
Among RTOs and ISOs, MISO, PJM, and SPP relied most heavily upon coal-fired generation to meet energy requirements from 2010-2014. However, in some RTOs and ISOs, the share of coal-fired generation declined as generation from natural gas-fired and renewable resources increased. PJM reports that generation produced from coal declined from 48.7 percent in 2010 to 43.5 percent in 2014.82 In MISO, which integrated the
82 October 2015 RTO and ISO Metrics Report at 324-325.
-2
0
2
4
6
8
10
2010 2011 2012 2013 2014
percent
NYISO
CAISO
SPP
ISO-NEMISO

- 48 -
MISO South region in late 2013, the share of generation from coal-fired generators declined from 74.6 percent in 2010 to 54.2 percent in 2014.83
Trends in the total amount of generation provided by natural gas and coal-fired generation followed underlying fuel market trends. Several RTO and ISO regions report that the share of natural gas-fired generation increased between 2010 and 2012, as average natural gas prices declined, and then receded as natural gas prices increased between 2012 and 2014.
Among utilities in non-RTO and ISO regions, coal-fired generation provided nearly all the energy generated for LG&E/KU load. SOU and DEP report substantial declines in the proportion of energy produced by coal-fired generation from 2010- 2014.
iii. Nuclear Generation
Across respondents, the most notable change in the proportion of energy provided by nuclear generation between 2010 and 2014 occurred in CAISO following the retirement of SONGS.
3. System Lambda
System lambda measures the incremental cost of energy derived from the economic dispatch function performed by a balancing authority area’s control center. System lambda represents the incremental cost of energy of the marginal generating unit, assuming no system constraints, and generally tracks trends in marginal fuel costs for a given balancing authority area. The basis for the system lambda metric is information submitted in FERC Form No. 714.
System lambda correlates with fuel prices and demand, among other factors, and reflects regional differences in the mix of generating resources. For instance, in areas where natural gas is the primary fuel used by generators on the margin, system lambda correlates with the price of natural gas. In areas with very large amounts of coal-fired generation, coal may be more likely to be the marginal fuel in a given hour. Figure 21 shows the average cost of natural gas and coal
83 Id. at 203.
Figure 21: Average cost of natural gas and coal delivered to U.S. electric power plants, 2010-2014.
Source: U.S. Energy Information Administration. Note: Values are expressed in nominal dollars per MMBtu.
0123456
2010
2011
2012
2013
2014
$ per MMBtu
natural gas
coal

- 49 -
delivered to U.S. electric power plants from 2010-2014, expressed in nominal dollars per million British thermal units (MMBtu).84 The average price of natural gas declined on an annual basis from 2010-2012, then increased from 2012-2014. As shown in Figure 22, the system lambda for most respondents also followed the trend of decreasing prices from 2010-2012, and increasing prices from 2012-2014. The responses from DEC and LG&E/KU do not follow this trend. As seen previously (Figure 19), the shares of natural-gas fired generation were lowest in DEC and LG&E/KU among respondents; thus, the incremental cost of energy in these regions is more likely to reflect the cost of other resource types (such as coal-fired generators).
Regional variation in system lambda levels could reflect local fuel market conditions, electricity demand, and changing resource mixes, among other conditions. For example, ISO-NE reported the highest system lambda values among respondents, explaining that its system marginal cost values reflect movements in underlying fuel prices, especially during 2013 and 2014.85 In 2013 and 2014, the northeast United States experienced extreme cold weather, operational challenges due to pipeline constraints, and fuel availability and delivery issues for both gas and oil-fired resources.86
84 U.S. Energy Information Administration, Short-Term Energy Outlook, (Jan.
2016) http://www.eia.gov/forecasts/steo/query/.
85 October 2015 RTO and ISO Metrics Report at 123.
86 Id. at 121-124.

- 50 -
Figure 22: System lambda by respondent, 2010-2014.
Source: Commission staff based on information collection FERC-922 and FERC Form No. 714. Notes: (1) Values expressed in nominal dollars. (2) RTOs and ISOs report the marginal energy component of LMP; SOU does not provide system lambda values in this docket; values shown are based on Southern’s submittals in FERC Form No. 714 (values shown for each year represent unweighted hourly averages). (3) PAC reports that it does not calculate system lambda because the PACW Balancing Authority Area carries a significant amount of hydroelectric generation on the regulating margin, and such resources do not have a fuel price component; PAC reports that the same hydroelectric resources are used as incremental regulating resources by the PACE Balancing Authority Area, through dynamic transfers.87
IV. Selected Other Metrics Specific to RTO and ISO Performance
A. Metrics Related to Coordinated Wholesale Power Markets
RTO and ISO respondents report a number of additional metrics that are not part of Information Collection FERC-922, because they are not common metrics that are applicable to the entire industry. For example, the RTOs and ISOs provide data that measure the performance of RTO and ISO day-ahead and real-time markets. The following sections contain an evaluation of selected RTO and ISO-specific metrics.
1. Proportionate Market Transaction Charges in 2014
RTOs and ISOs offer largely the same services. The cost of these services are charged to customers according to specified charge types. This metric should be considered in the context of differences in the scale and scope of market operations across RTOs and ISOs. The relative size of any category of cost to total cost is a function of many variables including whether there were major market design changes.
87 February 2016 PAC Metrics Report at 30.
CAISO ISO-NE MISO NYISO PJM SPP APS DEC DEF DEPLG&E/
KU SOU
0
10
20
30
40
50
60
0102030405060708090
$ perMWh
Key:
2010
2011
2012
2013
2014

- 51 -
Table 10 summarizes the dollars billed across charge categories for RTOs and ISOs in 2014. For 2014, MISO reports billing the highest percentage of dollars for energy market transactions, at 82.7 percent.88 Among RTOs and ISOs with capacity markets, NYISO reports the highest percentage capacity market charges relative to total dollars billed, at 30.0 percent.
It should be noted that SPP’s Energy Imbalance Market was in operation through February 28, 2014, and was replaced with the Integrated Marketplace on March 1, 2014. The percentage of dollars billed in SPP reflects this transition.89 It should also be noted that CAISO does not report the percentage of dollars billed.
Table 10: Summary of dollars billed by charge type, 2014. RTO or ISO Category Dollars Billed (billions)
Percentage of Total Dollars Billed
ISO-NE Energy Markets 9.079 72.3 Capacity 1.056 8.4 Transmission Tariff 1.819 14.5 Financial Transmission Rights Auction Revenues 0.032 0.3 Reserve Markets 0.207 1.7 Regulation Market 0.029 0.2 ISO-NE Administrative Expenses 0.171 1.3
Net Commitment-Period Compensation (NCPC) 0.167 1.3 Total 12.560 100.0
MISO Energy Markets 31.958 82.7 Resource Adequacy 0.145 0.4 Transmission Service 2.004 5.2 Financial Transmission Rights 4.115 10.6 Contingency Reserves 0.093 0.2 Regulation Market 0.087 0.2 Administrative Costs 0.247 0.6 Other 0.033 0.1 Total 38.680 100.0
NYISO Energy Markets 5.023 46.7
88 October 2015 RTO and ISO Metrics Report at 184.
89 Id. at 360.
(cont’d.)

- 52 -
Table 10: Summary of dollars billed by charge type, 2014. RTO or ISO Category Dollars Billed (billions)
Percentage of Total Dollars Billed
Installed Capacity 3.222 30.0 Transmission Service 0.105 1.0 Transmission Congestion 1.198 11.1 Transmission Losses 0.478 4.4 Transmission Congestion Contracts - Billed Fiscal
Year 0.391 3.6 Ancillary Services 0.171 1.6 Administrative Costs 0.161 1.5 Market-wide charges -0.004 0.0 Other 0.004 0.0 Total 10.749 100.0
PJM Energy Markets 30.573 61.1 Capacity 7.735 15.5 Transmission Service 3.241 6.5 Transmission Congestion 2.572 5.1 Transmission Losses 1.677 3.4 Transmission Enhancement 0.961 1.9 Financial Transmission Rights Auction Revenues 0.960 1.9 Operating Reserves 0.918 1.8 Reactive Supply 0.280 0.6 Regulation Market 0.258 0.5 PJM Administrative Expenses 0.274 0.5 Other 0.581 1.2 Total 50.030 100.0
SPP Energy Imbalance Market 0.295 2.8 Integrated Marketplace 7.458 70.5 Transmission 1.506 14.2 Transmission Congestion Rights 1.165 11.0 SPP Administrative Fee 0.149 1.4 Total 10.573 100.0
Source: Commission staff based on October 2015 RTO and ISO Metrics Report. Notes: (1) Billing amounts are expressed in nominal dollars. (2) In ISO-NE, NCPC represents make-whole payment (uplift) costs, and may relate to energy or reserves markets. (3) SPP transitioned from the Energy Imbalance Market to the Integrated Marketplace in March 2014.

- 53 -
2. Wholesale Power Cost Breakdown
The wholesale power cost breakdown metric disaggregates costs paid by load, thereby providing a comprehensive assessment of all RTO and ISO market costs.90 This metric should be considered within the context of different fuel mixes and market designs in each RTO and ISO region. As shown in Figure 23, ISO-NE and NYISO report the highest total wholesale power costs, with energy costs representing the largest component. The three eastern RTOs and ISOs (ISO-NE, NYISO, and PJM) each operate centralized capacity markets and report varying levels for the capacity-related component of wholesale power costs (with NYISO reporting the highest capacity-related costs). MISO also operates a voluntary capacity market to help ensure resource adequacy in its region. MISO reports a relatively low capacity-related component of wholesale prices as of 2014. It should be noted that SPP reports that data for this metric is only available beginning with the implementation of the Integrated Marketplace on March 1, 2014.91
90 The cost breakdown includes the following cost categories: RTO or ISO costs
and regulatory fees, operating reserve costs, ancillary services costs, transmission costs, capacity costs and energy costs.
91 October 2015 RTO and ISO Metrics Report at 367.

- 54 -
Figure 23: Wholesale power cost breakdown, 2010-2014.
ISO-NE MISO NYISO
PJM SPP
Source: Commission staff based on October 2015 RTO and ISO Metrics Report. Notes: (1) Values expressed in nominal dollars. (2) CAISO (not shown) does not report the numeric values corresponding to its wholesale power cost breakdown for 2014 and uses unique category names that are specific to CAISO. CAISO’s response can be found on p. 59 of the October 2015 RTO and ISO Metrics Report.
0
20
40
60
80
100
2010
2012
2014
$/MWh RTO Cost &RegulatoryFeesNCPC
AncillaryServices
Transmission
Capacity
Energy 0
20
40
60
80
100
2010
2012
2014
$/MWh RTO Cost &RegulatoryFees
OperatingReserves
AncillaryServices
Transmission
Capacity
Energy 0
20
40
60
80
100
2010
2012
2014
$/MWh RTO Cost &RegulatoryFeesOperatingReserves
AncillaryServices
Transmission
Capacity
Energy
0
20
40
60
80
100
2010
2012
2014
$/MWh RTO Cost &RegulatoryFeesOperatingReserves
AncillaryServices
Transmission
Capacity
Energy 0
20
40
60
80
100
2014
$/MWhRTO Cost &Regulatory Fees
Operating Reserves
Transmission
Energy

- 55 -
3. Fuel-Adjusted Wholesale Price
The load-weighted, fuel-adjusted locational marginal price is derived by holding fuel costs constant over a defined time period. This metric reflects the impact of load growth, new capacity, and the retirement of facilities, among other factors. As shown in Figure 24, CAISO reports the highest fuel-adjusted costs with an average of $73.20 per megawatt-hour and PJM the lowest with an average cost of $22.48 per megawatt-hour from 2010-2014.92 PJM reports that its load-weighted fuel-adjusted wholesale spot energy prices increased 24 percent from 2013 to 2014, primarily driven by high demand and generator forced outages in PJM during periods of severe weather in 2014.93
Each RTO and ISO uses a different base year for its fuel adjustments. For instance, PJM uses a fuel cost reference year of 1999 because this is the first year that PJM administered both spot and day-ahead energy prices, whereas CAISO uses a base fuel cost reference year of 2008 gas prices and NYISO uses a base day for fuel-cost references year of 2000.
It should be noted that ISO-NE did not report a load-weighted, fuel adjusted locational marginal price.94
Figure 24: Load-weighted, fuel-adjusted locational marginal prices, 2010-2014.
Source: Commission staff based on October 2015 RTO and ISO Metrics Report. Note: Values are expressed in nominal dollars per megawatt-hour.
92 Id. at 59 and 314.
93 Id. at 314.
94 Id. at 120.
CAISO MISO NYISO PJM SPP
0102030405060708090
2010
2011
2012
2013
2014
2010
2011
2012
2013
2014
2010
2011
2012
2013
2014
2010
2011
2012
2013
2014
2010
2011
2012
2013
2014
$ perMWh

- 56 -
4. Price-Cost Mark-up
The price-cost mark-up metric is based on a comparison between the price-based offer and cost-based offer of marginal units.95 Low mark-ups suggest competitive market performance. This metric reflects the percentage mark-up for each year. Figure 25 shows the price-cost markup from 2010-2014 as reported by RTOs and ISOs.
CAISO’s wholesale markets had a negative price-cost mark-up in all years. In 2012, the mark-up was very close to zero percent. In 2014, the price-cost mark-up was negative 4.8 percent. CAISO states that negative mark-ups can occur because default energy bids include a 10 percent mark-up, and that many resources choose to bid below their default levels by small amounts in order to remain competitive in the market, especially as more renewable generation has come online over the past several years.
95 See id. at 19 (RTOs and ISOs stating that price-cost mark-ups represent “the
load weighted average markup component of dispatched generation divided by the load-weighted average price of dispatched generation.”).

- 57 -
Figure 25: Price-cost mark-up, 2010-2014.
Source: Commission staff based on October 2015 RTO and ISO Metrics Report. Notes: (1) CAISO compares total estimated wholesale energy costs to costs that would result under competitive baseline prices by re-simulating the market after replacing market bids for gas-fired generation with bids reflective of the unit’s actual marginal costs.96 (2) ISO-NE provides Lerner Index values as LI = (P-MC)/P, and states that beginning in 2012 it revised its methodology to calculate this index based on the day-ahead market, whereas before 2012 it was calculated based on the real-time market.97 (3) MISO computes price-cost mark-up by comparing system marginal price based on actual offers to a simulated system marginal price based on assuming suppliers had all submitted offers at their estimated marginal costs.98 (4) NYISO’s 2010 data do not appear on this figure because NYISO’s Cost Price Mark-Up that year was zero percent. (5) PJM reports that the mark-up component of price is the difference between the system price, when the system price is determined by the active offers of the marginal units, whether price or cost-based, and the system price, based on the cost-based offers of those marginal units.99 (6) SPP only reports data for 2014.
5. Percent of Unit-Hours Mitigated
This metric provides an indication of the magnitude of mitigation occurring in RTO and ISO markets, as measured by the percentage of unit hours that prices were set at the mitigated price on an annual basis. As shown in Figure 26, RTOs and ISOs report low percentages of mitigated hours from 2010-2014. Across RTOs and ISOs, CAISO reports the highest percentage of unit-hours mitigated from 2011-2014, with a downward trend
96 Id. at 54.
97 Id. at 113-114.
98 Id. at 186.
99 Id. at 307.
CAISO ISO-NE MISO NYISO PJM SPP
-10
-5
0
5
10
1520
1020
1120
1220
1320
14
2010
2011
2012
2013
2014
2010
2011
2012
2013
2014
2010
2011
2012
2013
2014
2010
2011
2012
2013
2014
2010
2011
2012
2013
2014
percent

- 58 -
over those four years.100 MISO reports the lowest percentage of unit-hours mitigated among the RTOs and ISOs.
Figure 26: Percentage of unit-hours mitigated, 2010-2014.
Source: Commission staff based on October 2015 RTO and ISO Metrics Report. Notes: (1) CAISO reports Real-Time Energy Market Percentage of Unit Hour Bids Mitigated due to Mitigation. (2) ISO-NE reports data only from April 18, 2012 onward. ISO-NE reports ISO-NE Percentage of Mitigated Hours in the Real-time Market Imposed under Market Rule 1, Appendix A, Section 5. (3) MISO reports Real-Time Energy Market Percentage of Unit Hours Offer Capped due to Mitigation. (4) NYISO reports Real-Time Energy Market Percentage of Unit Hours Offer Capped due to Mitigation. (5) PJM reports Real-Time Energy Market Percentage of Unit Hours Offer Capped due to Mitigation. (6) SPP reports Percentage of Unit Hours Offer Capped due to Mitigation.
6. Energy Market Price Convergence
Convergence of day-ahead and real-time energy prices provides an indication of the efficiency of RTO and ISO markets. Since the majority of energy settlements and generator commitments occur in the day-ahead market, day-ahead price convergence with the real-time market ensures efficient day-ahead commitments that reflect real-time operating needs.
Figure 27 shows the trend in convergence of day-ahead and real-time energy prices over 2010–2014 for each RTO or ISO calculated as the percentage of the annual difference between real-time energy market prices and day-ahead market prices. PJM reports less than two percent divergence between day-ahead and real-time prices in each year during the reporting period. Among all RTOs and ISOs and across all years, CAISO reports the least day-ahead to real-time price convergence, at 91.2 percent in 2010. However,
100 In 2012, CAISO adopted a new approach that uses actual market conditions to
produce a more accurate assessment of transmission competitiveness. See id. at 57.
CAISO ISO-NE MISO NYISO PJM SPP
0
0.5
1
1.5
2
2.5
3
2010
2011
2012
2013
2014
2010
2011
2012
2013
2014
2010
2011
2012
2013
2014
2010
2011
2012
2013
2014
2010
2011
2012
2013
2014
2010
2011
2012
2013
2014
percent

- 59 -
CAISO also reports substantially greater price convergence in each year from 2011-2014.101
Figure 27: Percentage day-ahead to real-time energy market price convergence, 2010–2014.
Source: Commission staff based on October 2015 RTO and ISO Metrics Report. Notes: (1) NYISO explains that this metric is the annual index based on the deviation of the annual average load weighted Real-Time Dispatch (RTD) price from the annual average of the absolute divergence of the RTD prices from the day-ahead prices, over annual average load weighted RTD price.102 (2) SPP only reports price convergence information for 2014 because the day-ahead market in SPP began with the implementation of the Integrated Marketplace on March 1, 2014. SPP reports 97.0 percent day-ahead to real-time price convergence for 2014.
7. New Entrant Net Revenue
Generator net revenue measures the difference between a new103 generator’s variable production costs and the energy price received. This metric can be an indicator of whether generator net revenues are sufficient to ensure new investment, if needed, and are consistent with competitive markets. This metric reflects analysis conducted by each entity’s market monitor.
Table 11 illustrates the new entrant net revenues for combustion turbines. ISO-NE, MISO, and SPP had little to relatively small growth over the five-year period, while
101 CAISO has taken steps to improve price convergence such as improving load
forecast accuracy and implementing flexible ramping constraints. See id. at 61.
102 Id. at 254.
103 ISO-NE reports net revenues for proxy resources, while CAISO, ISO-NE, MISO, NYISO, PJM, and SPP specify that the net revenues are for new entrants.
CAISO ISO-NE MISO NYISO PJM
0102030405060708090
100
2010
2011
2012
2013
2014
2010
2011
2012
2013
2014
2010
2011
2012
2013
2014
2010
2011
2012
2013
2014
2010
2011
2012
2013
2014
percent
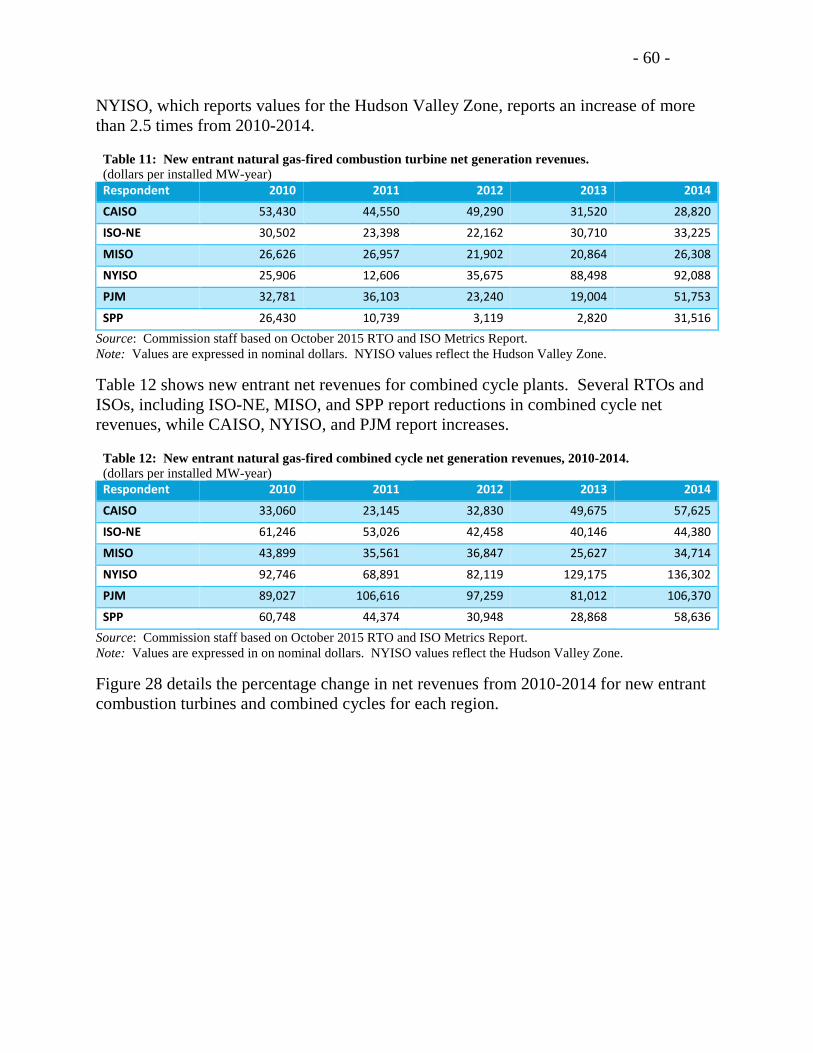
- 60 -
NYISO, which reports values for the Hudson Valley Zone, reports an increase of more than 2.5 times from 2010-2014.
Table 11: New entrant natural gas-fired combustion turbine net generation revenues. (dollars per installed MW-year) Respondent 2010 2011 2012 2013 2014
CAISO 53,430 44,550 49,290 31,520 28,820
ISO-NE 30,502 23,398 22,162 30,710 33,225
MISO 26,626 26,957 21,902 20,864 26,308
NYISO 25,906 12,606 35,675 88,498 92,088
PJM 32,781 36,103 23,240 19,004 51,753
SPP 26,430 10,739 3,119 2,820 31,516 Source: Commission staff based on October 2015 RTO and ISO Metrics Report. Note: Values are expressed in nominal dollars. NYISO values reflect the Hudson Valley Zone.
Table 12 shows new entrant net revenues for combined cycle plants. Several RTOs and ISOs, including ISO-NE, MISO, and SPP report reductions in combined cycle net revenues, while CAISO, NYISO, and PJM report increases.
Table 12: New entrant natural gas-fired combined cycle net generation revenues, 2010-2014. (dollars per installed MW-year) Respondent 2010 2011 2012 2013 2014
CAISO 33,060 23,145 32,830 49,675 57,625
ISO-NE 61,246 53,026 42,458 40,146 44,380
MISO 43,899 35,561 36,847 25,627 34,714
NYISO 92,746 68,891 82,119 129,175 136,302
PJM 89,027 106,616 97,259 81,012 106,370
SPP 60,748 44,374 30,948 28,868 58,636 Source: Commission staff based on October 2015 RTO and ISO Metrics Report. Note: Values are expressed in on nominal dollars. NYISO values reflect the Hudson Valley Zone.
Figure 28 details the percentage change in net revenues from 2010-2014 for new entrant combustion turbines and combined cycles for each region.

- 61 -
Figure 28: Percentage change in nominal net revenues for new entrant natural gas-fired combustion turbine and combined cycle generators, 2010-2014.
Source: Commission staff based on October 2015 RTO and ISO Metrics Report.
8. Reliability Must-Run Units
The reliability must-run (RMR) metric provides a measure of the degree to which an RTO or ISO must depend on critical facilities to maintain reliability and the flexibility of an RTO or ISO system to respond to emergencies and other contingencies. A RMR unit is typically a unit that continues to operate under a temporary contract after a planned retirement decision in order to resolve a reliability need.104 As shown in Figure 29, CAISO and ISO-NE reported significant drops in RMR units from 2010-2014. MISO reported an increase from zero to 16 units under RMR-type arrangements.
104 RTOs and ISOs use various terms to refer to such arrangements, e.g., “System
Support Resources” in MISO. For the purposes of this report, such arrangements are collectively referred to as RMR.
-100
-50
0
50
100
150
200
250
300
CAISO ISO-NE MISO NYISO PJM SPP
percent
combustion turbine
combined cycle

- 62 -
Figure 29: Number of units under RMR contracts, 2010 and 2014.
Source: Commission staff based on October 2015 RTO and ISO Metrics Report. Notes: (1) NYISO reports that it did not have any RMR contracts under its tariff between 2010 and 2014; however, NYISO states that in 2013 and 2014 it had three units totaling 406 MW operating under Reliability Support Service Agreements established under state procedures. Reliability Support Service Agreements are contracts to keep resources operating while local transmission is under construction to resolve the associated reliability need.105 (2) Beginning June 1, 2010, existing generating resources submit delist bids in ISO-NE’s Forward Capacity Market indicating a price at which the resource wishes to opt out of capacity market obligations. If ISO-NE denies a delist bid for reliability reasons, the resource may be compensated at the denied delist bid price or through a cost-of-service agreement.106 At the end of 2014, ISO-NE had zero units receiving such delist bid reliability payments.107
Figure 30 illustrates the change in capacity under RMR agreements or similar arrangements in RTOs and ISOs from 2010-2014. In MISO, capacity under such agreements increased from zero to 1,024 MW from 2010-2014. By contrast, CAISO108 and ISO-NE reported sharp declines in the amount of capacity under RMR agreements or similar arrangements over the same period.
105 October 2015 RTO and ISO Metrics Report at 235.
106 Id. at 101.
107 Id.
108 CAISO explains that much of the capacity needed for local reliability is provided through the capacity procured under resource adequacy. CAISO also notes that the amount of RMR capacity declines as existing RMR units retire. See id. at 48.
CAISO ISO-NE MISO NYISO PJM
02468
1012141618
2010
2014
2010
2014
2010
2014
2010
2014
2010
2014
units

- 63 -
Figure 30: Change in capacity under RMR or similar agreements between 2010 and 2014.
Source: Commission staff based on October 2015 RTO and ISO Metrics Report. Note: SPP does not report any RMR capacity between 2010 and 2014.
9. Demand Response
The demand response metrics provide an indication of the role played by demand response resources in maintaining short-term and long-term reliability in RTOs and ISOs. Demand response can lead to deferred investment in generation capacity by reducing load during peak periods.
In Order No. 745, the Commission established rules for compensating demand response in organized wholesale electricity markets,109 which were upheld by the Supreme Court in January 2016.110
Figure 31 shows demand response as a percent of total installed capacity in six RTOs and ISOs from 2010-2014. Every RTO and ISO reports a decline in demand response’s share of total installed capacity in 2014 relative to 2010.
109 Demand Response Compensation in Organized Wholesale Energy Markets,
Order No. 745, FERC Stats. & Regs. ¶ 31,322 (2011), order on reh’g, Order No. 745-A, 137 FERC ¶ 61,215 (2011), reh’g denied, Order No. 745-B, 138 FERC ¶ 61,148 (2012), rev’d and remanded sub nom. Elec. Power Supply Ass’n v. FERC, 753 F.3d 216 (D.C. Cir. 2014), rev’d and remanded, 136 S. Ct. 760 (2016).
110 See FERC v. Elec. Power Supply Ass’n, 136 S. Ct. 760, 774 (2016).
-3000 -2500 -2000 -1500 -1000 -500 0 500 1000 1500
megawatts
ISO-NE
NYISO
PJM
MISO
CAISO

- 64 -
Figure 32 shows demand response as a percentage of reserves in four RTOs and ISOs from 2010-2014. During this period, CAISO reports a decrease in demand response as a percentage of reserves, while NYISO reports an increase from 2013 to 2014.
Figure 31: Demand response as a percentage of total installed capacity.
Source: Commission staff based on October 2015 RTO and ISO Metrics Report.
Figure 32: Demand response as a percentage of operating reserves, 2010-2014.
Source: Commission staff based on October 2015 RTO and ISO Metrics Report. Notes: (1) SPP does not provide data in response to this metric. ISO-NE reported only a Demand Response Reserves Pilot program ending after the first six months of 2010, with no additional activity; (2) CAISO and PJM data indicate the shares of demand response in their respective synchronized reserve markets.
10. Congestion Management
Congestion represents the cost to customers of paying for more expensive energy because physical transmission line limits do not allow full delivery of least-cost energy. This metric can be measured in two ways. First, annual congestion costs divided by the
CAISO MISO NYISO PJM
0
5
10
15
20
25
2010
2011
2012
2013
2014
2010
2011
2012
2013
2014
2010
2011
2012
2013
2014
2010
2011
2012
2013
2014
percent

- 65 -
megawatt-hours of load served, tracks congestion cost trends relative to load growth, providing an indication of the efficiency of the overall RTO and ISO system, as well as the effectiveness of RTO and ISO efforts to manage congestion costs through transmission expansion planning and other efficiency measures. This measurement is not entirely within the control of the RTO and ISO because other factors, such as load trends, also influence this metric. Second, congestion can be expressed in terms of congestion revenues as a percent of congestion costs. In general, RTOs and ISOs use day-ahead congestion revenues to fund the financial entitlements of congestion rights holders. Figure 33 shows these metrics and provides details on RTO and ISO-specific calculation methods.
RTOs and ISOs report varying methods for calculating the percentage of congestion dollars hedged under this metric. CAISO divides the amount of net revenue the market receives by total congestion costs.111 ISO-NE reports the extent to which day-ahead and real-time congestion revenue and negative target allocations were sufficient to fund the transmission-hedge instruments each year.112 MISO reports the relationship between congestion revenues and congestion payments to financial transmission rights holders.113 NYISO reports the “total annual revenue collected from the hedging contracts purchased through the Transmission Congestion Contracts auctions divided by the total annual congestion cost.”114 PJM reports that financial transmission rights revenue adequacy declined from 2010-2014 due to reasons such as increased transmission outages, flows from external RTOs onto the PJM system, market-to-market constraints, and uncontrollable circumstances, such as forced outages, voltage and thermal constraints, real-time switching, and reliability-related de-rates.115
111 October 2015 RTO and ISO Metrics Report at 63.
112 See id. at 127-128. ISO-NE explains that negative target allocations are associated with counter-flow congestion in which a contract holder is required to contribute to the congestion revenue fund.
113 Id. at 197.
114 Id. at 257. NYISO also reports that there is an active market in over-the-counter contracts for differences which provide an additional hedging instrument.
115 Id. at 322.

- 66 -
Figure 33: Annual congestion costs per megawatt-hour of load served and percentage of annual congestion costs hedged.
Source: Commission staff based on October 2015 RTO and ISO metrics report. Notes: (1) Congestion costs are expressed in nominal dollars per MWh. (2) SPP (not shown) reports data for 2014 only. For 2014, SPP reports $2.11 of congestion costs per megawatt-hour of load served, and 85.9 percent of congestion costs hedged through congestion management markets.
B. Metrics Related to Organizational Effectiveness
1. Administrative Costs
Administrative cost metrics measure the ability of RTOs and ISOs to manage the growth rate of administrative costs commensurate with the growth rate of system load (administrative charges per megawatt-hour of load served metric) and to keep costs within budgeted levels (actual versus budgeted administrative charges metric). The components of RTO and ISO administrative costs are capital costs – capital charges, debt service, interest expense and depreciation expense – and operating and maintenance costs net of miscellaneous income. By managing administrative costs, RTOs and ISOs can reduce customer costs.
For this metric, values below 100 percent reflect actual costs below budgeted costs.
CAISO ISO-NE MISO NYISO PJM
0102030405060708090100
0
1
2
3
4
5
6
7
8
2010
2011
2012
2013
2014
2010
2011
2012
2013
2014
2010
2011
2012
2013
2014
2010
2011
2012
2013
2014
2010
2011
2012
2013
2014
$ perMWh
congestion costs perMWh (left axis)
reported percentage of congestion dollars hedged (right axis)
percent
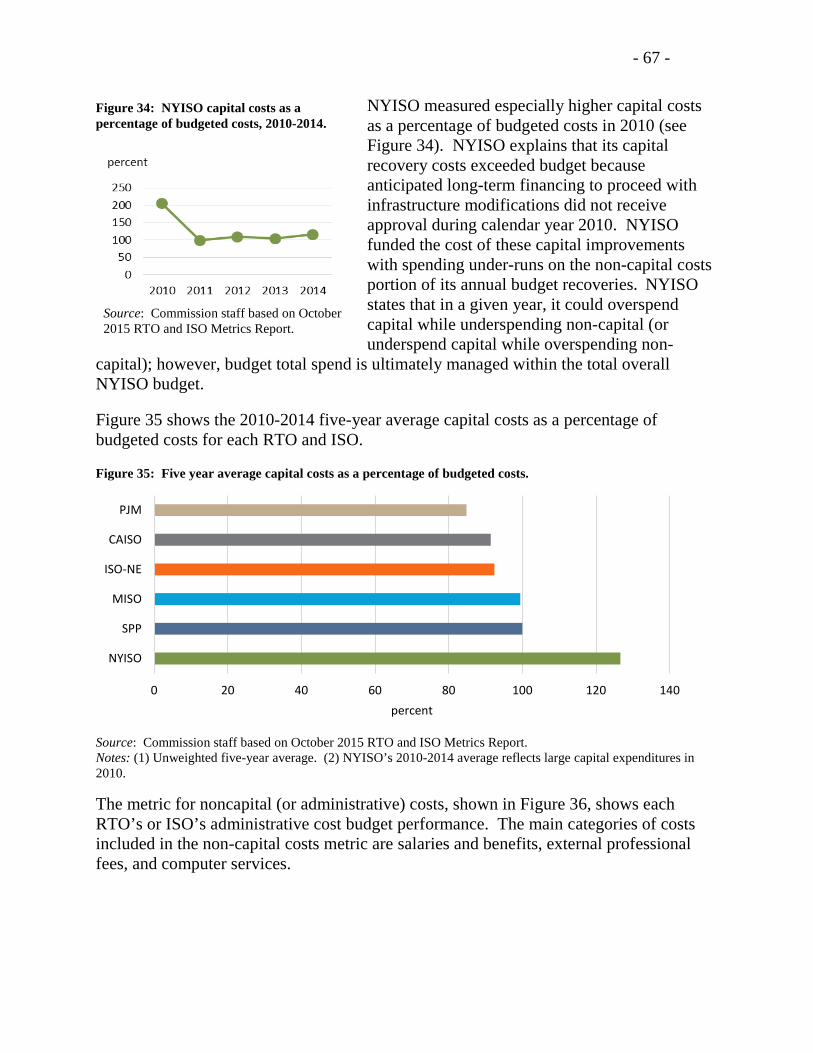
- 67 -
NYISO measured especially higher capital costs as a percentage of budgeted costs in 2010 (see Figure 34). NYISO explains that its capital recovery costs exceeded budget because anticipated long-term financing to proceed with infrastructure modifications did not receive approval during calendar year 2010. NYISO funded the cost of these capital improvements with spending under-runs on the non-capital costs portion of its annual budget recoveries. NYISO states that in a given year, it could overspend capital while underspending non-capital (or underspend capital while overspending non-
capital); however, budget total spend is ultimately managed within the total overall NYISO budget.
Figure 35 shows the 2010-2014 five-year average capital costs as a percentage of budgeted costs for each RTO and ISO.
Figure 35: Five year average capital costs as a percentage of budgeted costs.
Source: Commission staff based on October 2015 RTO and ISO Metrics Report. Notes: (1) Unweighted five-year average. (2) NYISO’s 2010-2014 average reflects large capital expenditures in 2010.
The metric for noncapital (or administrative) costs, shown in Figure 36, shows each RTO’s or ISO’s administrative cost budget performance. The main categories of costs included in the non-capital costs metric are salaries and benefits, external professional fees, and computer services.
0 20 40 60 80 100 120 140
PJM
CAISO
ISO-NE
MISO
SPP
NYISO
percent
Figure 34: NYISO capital costs as a percentage of budgeted costs, 2010-2014.
Source: Commission staff based on October 2015 RTO and ISO Metrics Report.
Figure 34: NYISO capital costs as a percentage of budgeted costs, 2010-2014.

- 68 -
Figure 36: Non-capital costs as a percentage of budgeted costs, 2010-2014 average.
Source: Commission staff based on October 2015 RTO and ISO Metrics Report. Note: Unweighted five-year average.
Figure 37 shows the 2010-2014 five-year average administrative cost per megawatt-hour in each RTO and ISO. Administrative costs vary widely across the RTOs and ISOs, with the five-year average administrative costs ranging from $0.27 per megawatt-hour for SPP to $1.10 per megawatt-hour for ISO-NE. While SPP has the lowest administrative costs on average over the reporting period, its annual rate of increase was the fastest rate among RTOs and ISOs (approximately 18 percent per year), and SPP reports higher per-megawatt-hour administrative costs ($0.38/MWh) than either PJM ($0.32/MWh) or MISO ($0.33/MWh) for calendar year 2014. The rate of increase seen in administrative costs in SPP may be attributable to the fact that SPP was in the process of launching its Integrated Marketplace during the reporting period.
Figure 37: Per-megawatt-hour administrative costs, 2010-2014 average.
Source: Commission staff based on 2015 RTO and ISO Metrics Report. Notes: (1) Unweighted five-year average. (2) Average calculated using nominal dollars per megawatt-hour.
0 20 40 60 80 100 120
PJM
NYISO
CAISO
ISO-NE
SPP
MISO
percent
0.0
0.2
0.4
0.6
0.8
1.0
1.2
1.4
ISO-NE NYISO CAISO MISO PJM SPP
$/MWh

- 69 -
2. Billing Control Audits and Billing Accuracy
This metric indicates the accuracy and integrity of the RTO and ISO billing processes, based on audits conducted according to the Statement on Auditing Standards No. 70 (SAS 70) guidelines set by the American Institute of Certified Public Accountants. There are two types of SAS 70 audits: Type 1 audits, which assess the adequacy of the control design, and Type 2 audits, which review both the adequacy of the control design and whether the controls are being followed. An unqualified opinion indicates that the independent auditor found the control objects for each of the areas covered by the audit to be adequately designed and operated for the audit period. A qualified opinion means the independent auditor found the design and/or the operation of one or more of the control objectives inadequate. Each RTO and ISO reports unqualified audit opinions, with the exception of MISO in 2014. MISO reports that in 2014 one control objective was deemed qualified in the area of configuring and monitoring information systems.116
PJM, MISO and NYISO report a billing accuracy of over 95 percent.117 MISO reports a billing accuracy of 95.4 percent and both NYISO and PJM report a billing accuracy of 99.9 percent. It should be noted that CAISO, ISO-NE and SPP did not report on billing accuracy.118
3. Customer Satisfaction
The customer satisfaction metric provides an indication of the extent to which RTOs and ISOs provide value to their customers. This metric is based on independent assessments of customer satisfaction surveys undertaken by independent, third-party entities. These surveys analyze customer perspectives on a wide range of RTO and ISO activities. RTOs and ISOs achieved relatively high levels of customer satisfaction between 2010 and 2014. The average customer satisfaction rating for CAISO, ISO-NE, PJM, and SPP was 90 percent.119 Beginning in 2011, PJM began taking customer surveys bi-annually, and CAISO did not conduct a survey in 2013.120 ISO-NE used qualitative measures of overall performance (extremely satisfied to extremely dissatisfied) and report card data
116 Id. at 209.
117 Id. at 209, 269-270 and 334.
118 Id. at 72, 148 and 380.
119 See id. at 72, 145-148, 333, 379.
120 See id. at 72, 333.

- 70 -
(on a scale of zero to 100) to measure its customer satisfaction metric.121 MISO and NYISO report average customer satisfaction ratings of 78 percent and 76 percent, respectively.122
121 Id. at 145-148.
122 See id. at 208, 268-269, 333, 379.

- 71 -
Appendix A: List of Common Metrics
Table 13. Common metrics included in information collection FERC-922. Reliability Metrics Metric No.
Category Description
1 NERC Reliability Standards Compliance
References to applicable NERC standards 2 Number of violations self-reported and made public by NERC/FERC 3 Number of violations identified and made public as NERC audit findings 4 Total number of violations made public by NERC/FERC 5 Severity level of each violation made public by NERC/FERC 6 Compliance with operating reserve standards 7 Unserved energy (or load shedding) caused by violations 8 Dispatch Reliability Balancing Authority ACE Limit (BAAL) or Control Performance Standards 1
and 2 (CPS1 and CPS2) 9 Energy Management System (EMS) Availability 10 Load Forecast
Accuracy Actual peak load as a percentage variance from forecasted peak load
11 Wind Forecast Accuracy
Actual wind availability compared to forecasted wind availability
12 Unscheduled Flows Difference between net actual interchange and the net scheduled interchange (in megawatt-hours)
13 Transmission Outage Coordination
Percentage of planned outages (200 kilovolt and above) of at least 5 days for which the RTO and ISO or utility notified customers at least one month prior to the outage date
14 Percentage of outages (200 kilovolt and above) canceled by RTO and ISO or utility after being approved previously
15 Long-Term Reliability Planning – Transmission
Number of facilities approved to be constructed for reliability purposes 16 Percentage of approved construction projects on schedule and completed 17 Performance of planning process related to completion of (1) reliability
studies and (2) economic studies 18 Long-Term Reliability
Planning – Resources Processing time for generation interconnection requests
19 Actual reserve margins compared with planned reserve margins 20 Interconnection and
Transmission Process Metrics
Number of study requests 21 Number of studies completed 22 Average age of incomplete studies 23 Average time for completed studies 24 Total cost and types of studies completed 25 Special Protection
Systems Number of special protection systems
26 Percentage of special protection systems that responded as designed when activated
27 Number of unintended activations 28 System Lambda System Lambda (on marginal unit), based on FERC Form No. 714
information 29 Availability (1 – system forced outage rate) as measured over 12 months 30 Fuel Diversity Fuel diversity in terms of energy produced and installed capacity
Source: Commission staff based on May 20, 2015 Comment Request in Docket No. AD14-15-000. Note: For purposes of this report, Commission staff considers metrics 1-27 to be reliability metrics; Commission staff considers metrics 28-30 to be system operations metrics.

- 72 -
Appendix B: Recent RTO and ISO Expansion Activity
Since the release of the GAO Report in 2008, SPP, CAISO, MISO and PJM have expanded their footprints. The utilities that voluntarily joined RTOs and ISOs and/or imbalance markets attribute their decision to the more efficient commitment and dispatch of generation plants and enhanced reliability, coordination, competition and economies of scale provided by RTOs and ISOs. In some cases, the expanding RTO or ISO or the joining member estimated the monetized benefits from RTO and ISO expansion (usually in the form of estimated production cost savings); the accompanying sidebar discusses notable highlights from these analyses.123
In 2014, CAISO expanded the use of the imbalance energy portion of its real-time market to other balancing authority areas in the Western Interconnection.124 Several utilities outside of RTOs and ISOs in the West are participating in CAISO’s Energy Imbalance Market (EIM) to share reserves and integrate renewable resources across a larger geographic region reliably and efficiently.
123 See SPP, Results 2014 Annual Report,8
http://www.spp.org/documents/28682/ar-2014%2004302015.pdf; CAISO, 2015 Q4 Report: Quantifying EIM Benefits (Feb. 2016) https://www.caiso.com/Documents/ISO_EIMBenefitsReportQ4_2015.pdf: MISO, MISO 2014-2015 Winter Assessment Report Information Delivery and Market Analysis 29 (May 2015), https://www.misoenergy.org/Library/Repository/Report/Seasonal%20Market%20Assessments/2015%20Winter%20Assessment%20Report.pdf; and Compete, Public Power Utilities Flock to PJM, MISO for Benefits of Wholesale Power Market Competition (June 2013), http://competecoalition.com/blog/tag/competitive-electricity-market.
124 Cal. Indep. Sys. Operator Corp., 149 FERC ¶ 61,058 (2014).
SPP SPP estimates that the net Integrated Marketplace savings were $131 million in its first 12 months of performance as of the third quarter of 2015.
CAISO A report for the fourth quarter of 2015 estimated the gross benefit of CAISO’s energy imbalance market that began in November 2014 to be $45.7 million.
MISO MISO estimates that the integration of the MISO South Region yielded net benefits between $730 and $954 million.
PJM East Kentucky Power Cooperative estimates that its 16 member-owned cooperatives will realize $131.9 million in net benefits over its first decade of PJM membership.

- 73 -
In 2011, American Transmission Systems, Inc. and Cleveland Public Power joined PJM;125 in 2013, East Kentucky Power Cooperative, Inc. joined PJM.126 In December 2013, Entergy’s utility operating companies ‒ Entergy Arkansas, Inc., Entergy Mississippi, Inc., Entergy Texas, Inc., Entergy Louisiana, LLC, Entergy Gulf States Louisiana, L.L.C., and Entergy New Orleans, Inc. ‒ completed the integration of their transmission systems into MISO.127 The Entergy utility operating companies, among other industry participants, comprise the MISO South Region.
On November 1, 2014, CAISO and PAC participated in the launch of the EIM.128 In April 2015, PAC and CAISO signed a Memorandum of Understanding (MOU) to examine the potential benefits of creating a regional ISO.129 The parties have extended the MOU to further explore costs and requirements needed to achieve the benefits of integration outlined in a study conducted by Energy Environmental Economics,130 as well as to develop a transition agreement to outline the terms and conditions for the potential integration of PAC into a regional market.
Additionally, Puget Sound Energy and APS are scheduled to begin financially binding participation in CAISO’s EIM in October 2016. NV Energy, Inc. began participating in
125 PJM, PJM History, (Feb. 2015), http://www.pjm.com/about-pjm/who-we-
are/pjm-history.aspx?p=1.
126 On May 22, 2013 in Docket Nos. ER13-1177-000, ER13-1178-000, and ER13-1179-000, the Commission accepted tariff revisions filed in connection with East Kentucky Power Cooperative, Inc.’s integration into PJM under delegated authority. See also East Kentucky Power Cooperative, Inc., 147 FERC ¶ 61,028 (2013) and East Kentucky Power Cooperative, Inc. 147 FERC ¶ 61,097 (2014).
127 Midwest Indep. Trans. Sys. Op., Inc., 139 FERC ¶ 61,056, on reh’g, 141 FERC ¶ 61,128 (2012).
128 Cal. Indep. Sys. Op. Corp., 147 FERC ¶ 61,231 (2014).
129 CAISO, News Release: Western grid integration could produce significant cost savings, environmental benefits, (Oct. 2015), http://www.caiso.com/Documents/WesternGridIntegrationCouldProduceSignificantCostSavings-EnvironmentalBenefits.pdf.
130 Utility Dive, Study: Integrating PacifiCorp and CAISO grids could create up to $9.1B in savings, (Oct. 2015), http://www.utilitydive.com/news/study-integrating-pacificorp-and-caiso-grids-could-create-up-to-91b-in-s/407203/.

- 74 -
CAISO’s EIM on December 1, 2015.131 Portland General Electric Company filed an agreement with FERC to participate in CAISO’s EIM starting in 2017.132 Idaho Power signed an agreement with CAISO to participate in CAISO’s EIM starting in 2018.133 As a result, CAISO’s EIM will encompass seven western states – California, Oregon, Washington, Nevada, Utah, Idaho, and Wyoming.
On October 1, 2015, the Integrated System and its three primary entities became full members of SPP. The Integrated System is comprised of Western Area Power Administration-Upper Great Plains, Basin Electric Power Cooperative, and Heartland Consumers Power District.134 This expands SPP’s footprint to 14 states, adding the Dakotas and parts of Iowa, Minnesota, Montana, and Wyoming. Western Area Power Administration-Upper Great Plains is the first federal power marketing administration to join an RTO or ISO.
131 CAISO, News Release: NV Energy enters the western Energy Imbalance
Market, (Dec. 2015), https://www.caiso.com/Documents/NVEnergyEntersTheWesternEnergyImbalanceMarket.pdf
132 CAISO, News Release: Portland General Electric formalizes agreement to join EIM, (Nov. 2015), http://www.caiso.com/Documents/PortlandGeneralElectricFormalizesAgreementToJoinEIM.pdf, see also CAISO, Implementation Agreement Filing, Docket No. ER16-366-000.
133 Idaho Power Company, News Release: Company Agrees to Join Western EIM,
(Apr. 2016), https://www.idahopower.com/NewsCommunity/News/NewsReleases/showPR.cfm?prID=3796.
134 Southwest Power Pool, Inc., 149 FERC ¶ 61,113 (2014) reh’g Southwest Power Pool, Inc., 153 FERC ¶ 61,051 (2015).


