Stand Dynamics of Northern Hardwoods to Partial Harvesting in the Acadian Forest Region Ontario Hardwood Management Tour Forest Ecology Centre 19-21 October 2010 D. Edwin Swift, Chhun-Huor Ung, and Isabelle Duchesne
Transcript
Stand Dynamics of Northern Hardwoods to Partial Harvesting in
the Acadian Forest Region
Ontario Hardwood Management TourForest Ecology Centre
19-21 October 2010
D. Edwin Swift, Chhun-Huor Ung, and Isabelle Duchesne
Contact Information
Mr. Edwin Swift, M.Sc.F., RPF, CF
Natural Resources Canada, Canadian Wood Fibre Centre, P.O. Box 4000, Fredericton, NB E3B 5P7 Canada e-mail: [email protected]: 506-452-3175
Presentation Outline
• Introduction• Problem Statement• Study Description• Stand Dynamics• Ingrowth Dynamics• Stem Quality Issues• Connections to Other Regions• Questions
- Northern hardwoods are a major forest type in eastern Canada. These stands represent ecologically and economically important tree species and associations in the region.
- The hardwood lumber industry in eastern Canada is currently in a vulnerable position due to reduced demand on the American market as well as the transfer of manufacturing facilities for furniture and other secondary products.
Introduction
- In New Brunswick, the allowable annual cut (AAC) forhardwood has been reduced by 39%.
Problem Statement: Short Version of Objectives
Project 17: Assess the impact of partial harvesting on stand dynamics, tree grade projections, accuracy of tree grade projections, wood fibre attributes, and product recovery for northern hardwoods of the Acadian Forest Region.
T1C2T2 C1
Paired Plots- Control and thinned PSPs of 1,600 m2; which consisted of four 400 m2
sub-plots or quadrats.
- History of stand and tree attributes.
- Included additional inventory and fibre attribute measurements in 2009.
- Buffer areas provided sample trees.
20 m
40 m
Study Description
Location of the “Paired”Hardwood Plot Study Sites
1 = Grand John # 2
2 = McLean’s Brook
3 = Grand John #1
4 = Dunbar #1
5 = Dunbar #2
6 = Wiggin’s Corner
Study Description
Treatments for Paired Plots:First entry removal of a 20 year harvest cycle for selection or uneven-aged management in northern hardwoods.
Harvest operation system was manual felling with chainsaws and cable skidder.
Tree removal priority was:
1) mature to over-mature spruce and balsam fir, 2) imminent mortality, 3) low quality American beech, 4) all trees over 40 cm at dbh, and 5) all trees of low quality less than 40 cm at dbh; to
acheive 16-18 m2 /ha of basal area.
1993 Species Composition
Sugar Maple
Yellow Birch
Red Maple
American Beech
Other Species
White Ash, Striped Maple, Iron wood,
Trembling Aspen, Eastern Hemlock,
Balsam Fir, and Red Spruce.
0 1 2 3 4 5 6 7Study Site
0
20
40
60
80
100
Per
cent
ThinnedControl
TREATMENT
61
72
49 44
19
454951
6360
Sugar Maple
1993 Species Composition
1 = Grand John 2
2 = McLeans Brook
3 = Grand John 1
4 = Dunbar 1
5 = Dunbar 2
6 = Wiggin’s Corner
Treatments
1993 Species Composition
1 = Grand John 2
2 = McLeans Brook
3 = Grand John 1
4 = Dunbar 1
5 = Dunbar 2
6 = Wiggin’s Corner
0 1 2 3 4 5 6 7Study Site
0
20
40
60
80
100
Per
cent
ThinnedControl
TREATMENT
Yellow Birch
31
1
17
79
49
24
107
17
Treatments
1993 Species Composition
1 = Grand John 2
2 = McLeans Brook
3 = Grand John 1
4 = Dunbar 1
5 = Dunbar 2
6 = Wiggin’s Corner
0 1 2 3 4 5 6 7Study Site
0
20
40
60
80
100
Per
cent
ThinnedControl
TREATMENT
Red Maple
1
11
27
14
24
13
38
Treatments
1993 Species Composition
1 = Grand John 2
2 = McLeans Brook
3 = Grand John 1
4 = Dunbar 1
5 = Dunbar 2
6 = Wiggin’s Corner
0 1 2 3 4 5 6 7Study Site
0
20
40
60
80
100
Per
cent
ThinnedControl
TREATMENT
American Beech
1 1
34
49
25
34
4 715
2723
Treatments
1993 Species Composition
1 = Grand John 2
2 = McLeans Brook
3 = Grand John 1
4 = Dunbar 1
5 = Dunbar 2
6 = Wiggin’s Corner
0 1 2 3 4 5 6 7Study Site
0
20
40
60
80
100
Per
cent
ThinnedControl
TREATMENT13
28
15
2 45 7
20
Other Species
Treatments
Stand Dynamics
Analysis Challenges
-1993, no control established for Dunbar 1, as the one at Dunbar 2 was used instead.
- 1998, no measurements for Wiggin’s Corner.
- Pre-2008, thinned plot at Dunbar 1 partially disturbed.
- 2008, thinned plot harvested at McLean’s Brook.
0 1 2 3 4 5 6 7Study Site Number
0
10
20
30
40
Bas
al A
rea
(m2
/ha)
ControlThinned
TREATMENT$
Basal Area (m2/ha) in 1993 Before Harvest
22.9 to 35.2 m2 /ha
1 = Grand John 2
2 = McLeans Brook
3 = Grand John 1
4 = Dunbar 1
5 = Dunbar 2
6 = Wiggin’s Corner
Treatments
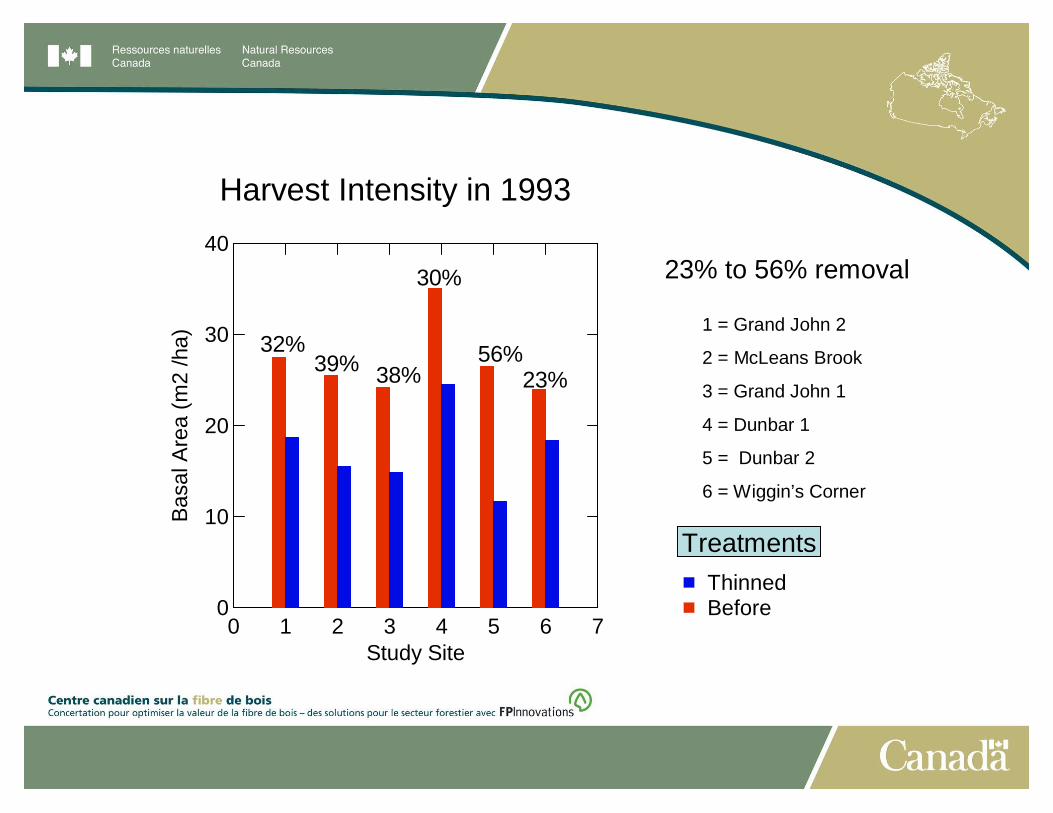
Harvest Intensity in 1993
23% to 56% removal
0 1 2 3 4 5 6 7Study Site
0
10
20
30
40
Basa
l Are
a (m
2 /h
a)
BeforeThinned
TREAT$
39%23%
30%
32%38%
56%1 = Grand John 2
2 = McLeans Brook
3 = Grand John 1
4 = Dunbar 1
5 = Dunbar 2
6 = Wiggin’s Corner
Treatments
Basal Area (m2 /ha) Response
0 1 2 3 4 5 6 7Study Site Number
0
10
20
30
40
Bas
al A
rea
(m2
/ha)
Thinned
*
* ****
0 1 2 3 4 5 6 7Study Site Number
0
10
20
30
40
Bas
al A
rea
(m2
/ha)
0515
YEAR
Control
1 = Grand John 2
2 = McLeans Brook
3 = Grand John 1
4 = Dunbar 1
5 = Dunbar 2
6 = Wiggin’s Corner
?
Average Diameter (cm):Excluding Ingrowth
0 4 8 12 16Year Since Treatment
0
10
20
30
Ave
rage
DBH
(cm
)
controlthinned
TREATMENT$
Grand John 1
32%
38%
56%
24%
0 4 8 12 16Years Since Treatment
0
10
20
30
DB
H (c
m)
ThinnedControl
TREATMENT
Dunbar 2
0 4 8 12 16Years Since Treatment
0
10
20
30
DB
H (c
m)
ThinnedControl
TREATMENT
Wiggin's Corner
0 4 8 12 16Years Since Treatment
0
10
20
30
DB
H (c
m)
ThinnedControl
TREATMENT
Grand John 2
Removal
Removal
Removal
Removal
Lessons Learned
1) Variable stand conditions.
2) Variable growth responses.
3) Thinned stands have not reached the original basal area values, but is this important ?
4) The greater the removal, the greater the diameter response, but not necessarily the greater the stand growth response.
The 2.4 m3 / Ha /Year Question
Did we achieve the predicted average volume growth of 2.4 m3 /ha /year ?
Annual Volume Increment (m3 /ha) for Last 15 Years
Average
control: 2.3 m3 /ha /year
thinned: 2.8 m3 /ha /year
0 1 2 3 4 5 6 7Study Site
-2
-1
0
1
2
3
4
5
Ann
ual V
olum
e In
crem
ent (
m3
/ha)
controlthinned
TREATMENT$1 = Grand John 2
2 = McLeans Brook
3 = Grand John 1
4 = Dunbar 1
5 = Dunbar 2
6 = Wiggin’s Corner
Treatments
Annual Volume Increment (m3 /ha) for First 5 Years
Average
control: 0.2 m3 /ha /year
thinned: 0.4 m3 /ha /year
0 1 2 3 4 5 6 7Study Site
-2
-1
0
1
2
3
4
5
Ann
ual V
olum
e In
crem
ent (
m3
/ha)
controlthinned
TREATMENT$1 = Grand John 2
2 = McLeans Brook
3 = Grand John 1
4 = Dunbar 1
5 = Dunbar 2
6 = Wiggin’s Corner
Treatments
Annual Volume Increment (m3 /ha) for Last 10 Years
Average
control: 1.3 m3 /ha /year
thinned: 4.0 m3 /ha /year
0 1 2 3 4 5 6 7Study Site
-2
-1
0
1
2
3
4
5
Ann
ual V
olum
e In
crem
ent (
m3
/ha)
controlthinned
TREATMENT$1 = Grand John 2
2 = McLeans Brook
3 = Grand John 1
4 = Dunbar 1
5 = Dunbar 2
6 = Wiggin’s Corner
Treatments
Why the Negative Volume Increment Growth and Variable Growth Among the Study Sites ?
1) Observed tree height decreases in the data between measurement periods.
2) Observe losses of large trees between measurement periods.
- Change in measurement instruments ?
- Dieback ?
Forest Tent Caterpillar
Photo Source: Thérėse Arcaud,Natural Resources Canada, Canadian Forest Service
Photo Source: Claude MonniciNatural Resources Canada, Canadian Forest Service
Climate Change and Associated Declines
Continuing Decline and Mortality of American Beech
And the interactions between these factors and other unknown factors.
1) Like softwoods, hardwood stands may require some form of “protection” from pests such as the forest tent caterpillar if the desired growth and growth rates are to be achieved.
2) Hardwood stand dynamics are complex and a better understanding is required for the impacts on growth and development.
3) The impact of climate change is the “wild card” for the expected changes on stand dynamic relationships.
Stem Quality: ABCD Tree Grade
A B C DProducts
0
20
40
60
80
100Pe
rcen
t
controlthinned
TREATMENT$
Site 6: Wiggin's Corner
1944
469
56
650
A B C DProducts
0
20
40
60
80
100
Per
cent
controlthinned
TREATMENT$
Site 4: Dunbar 2
5613
313
38 44
188
44
A B C DProducts
0
20
40
60
80
100
Per
cent
controlthinned
TREATMENT$
Site 3: Grand John 1
638
100
256356
188
13
A B C DProducts
0
20
40
60
80
100
Per
cent
controlthinned
TREATMENT$
13 38 25
125
438
113
600
Study Site 1: Grand John 2
A = veneer B = sawlogsC = pulp D = biomass
Treatments
Treatments
Treatments
Treatments
Product
Lessons Learned
Stand restoration and stem quality improvement is a slow process that may not be achieved in the first harvest entry.
0 1 2 3 4 5 6Study Site
0
100
200
300
400
Den
sity
(ste
ms
/ha)
ControlThinned
TREAT$
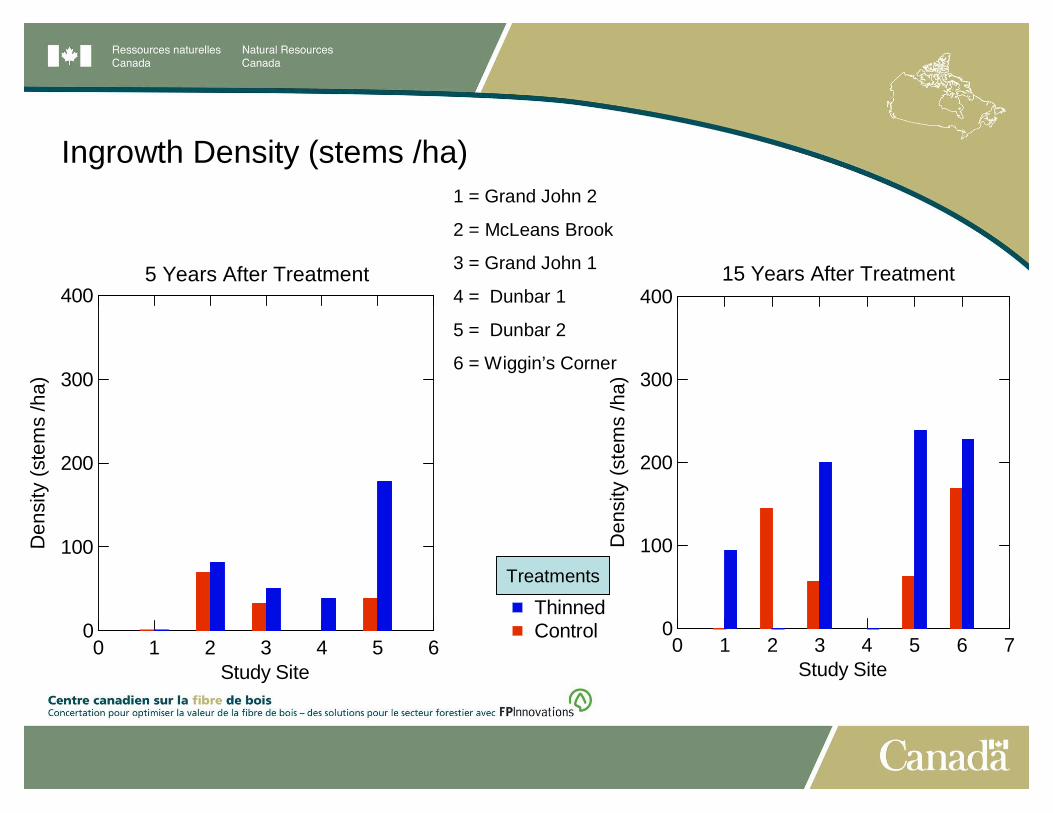
5 Years After Treatment
Ingrowth Density (stems /ha)
0 1 2 3 4 5 6 7Study Site
0
100
200
300
400
Den
sity
(ste
ms
/ha)
15 Years After Treatment
1 = Grand John 2
2 = McLeans Brook
3 = Grand John 1
4 = Dunbar 1
5 = Dunbar 2
6 = Wiggin’s Corner
Treatments
Ingrowth Diversity in 2009: 16th Year
0 1 2 3 4 5 6 7Study Site
0
20
40
60
80
100
Freq
uenc
y (%
)
BebFiWrMrSsMyB
SPECIES$
Control
0 1 2 3 4 5 6 7Study Site
0
20
40
60
80
100
Freq
uenc
y (%
)
Thinned
1 = Grand John 2
2 = McLeans Brook
3 = Grand John 1
4 = Dunbar 1
5 = Dunbar 2
6 = Wiggin’s Corner
Species
Lessons Learned
We have a “Wile E. Coyote” amongst the sheep, as Wiggin’s Corner shows a great diversity for ingrowthdensity and tree species diversity.
Softwoods
Mixedwoods
HardwoodsWiggin’s Corner
Second Canopy Layer of Dense Beech
Second Canopy Beech Layer Buster
How are results of this study on stand dynamics connected to northern shade tolerant hardwood forests of eastern North America ?
Drs. Ralph Nyland, Diane Kiernan, and Eddie Beviliacqua of SUNNY have developed three growth and yield models for sugar maple from this data set and compared the results of the first model to the one that they have developed for New York.
They have observed that the New York Model gave betterresults for trees less than 20 cm, but see little differencebetween the two models for trees 20 cm or greater in diameter.
More to come at a later date.
Acknowledgements to Our Collaborators
Provinces: New Brunswick (NB DNR), Nova Scotia (NS DNR), and Québec (MRNF).
Industry: AV Nackawic Ltd., J.D. Irving Ltd., Group Savoie Inc.,and Acadian Timber Inc.
Universities: University of New Brunswick, SUNNY-ESF, University of Sherbrooke, Laval University,and University of Québec at Montreal.