2.1. SCOPE OF THE STATE OF THE ART ............................................................................................. 6
3. ROAD MARKING RESEARCH ................................................................................................................ 7
3.1. RESULTS OF COST 331 .............................................................................................................. 7
3.2. RESEARCH TRENDS TO DATE ................................................................................................... 7
4. EVOLUTIONS IN THE EUROPEAN NORM 1436 ....................................................................................... 16
4.1. EN 1436 REVISION 2007 AND AMENDMENT 1 IN 2008 ............................................................. 16
4.2. OUTLOOK .............................................................................................................................. 17
5. EVOLUTION FOR TESTING METHODOLOGIES FOR ROAD MARKINGS ...................................................... 18
5.1. DYNAMIC MEASUREMENT METHODS IN WET CONDITIONS ...................................................... 19
5.2. CALCULATION OF ROAD MARKINGS WET VISIBILITY BASED ON DYNAMIC MEASUREMENT IN DRY CONDITIONS ....................................................................................................................... 22
5.3. DYNAMIC MEASUREMENT METHODS IN RAIN CONDITIONS ...................................................... 24 5.3.1. STATIC SIMULATION AND MEASUREMENT OF RAIN CONDITIONS IN LABORATORY .............................. 24 5.3.2. STATIC SIMULATION AND MEASUREMENT OF RAIN CONDITIONS IN SITU ........................................... 28 5.3.3. DYNAMIC SIMULATION AND MEASUREMENT OF RAIN CONDITIONS IN SITU ........................................ 31
5.4. CONCLUSION FOR MEASUREMENT METHODS IN WET/RAIN CONDITIONS ................................. 34
6. DEVELOPMENT OF NEW TECHNOLOGIES AND TRENDS ........................................................................ 35
The present document is the State of the Art Plan for the RAINVISION project. The purpose of the document is to provide an overview of the development in the field of road markings. The document contains the following sections:
This chapter and chapter 2 that include the overall scope of the state of the art and identify the various elements to be included within.
Chapter 3 will provide the state of the art for road marking research.
Chapter 4 will describe the evolutions of the European Norm 1436, including test methodologies.
Chapter 5 will focus the evolution of testing methodologies for road markings.
Chapter 6 will describe an overview of the development of new technologies and trends with a specific focus on wet-night visibility.
1.2. ACRONYMS
1.2.1. ACRONYMS
Acronyms used in this document and needing a definition are included in the following table:
Acronym Definition
AASHTO American Association of State Highway and Transportation Officials
COST European Cooperation in the field of Scientific and Technical Research
EN European Norm
NCHRP National Cooperative Highway Research Programme
RSMA Road Safety Markings Association
USA United States of America
PDO Property Damage Only (police term for property damage traffic accident)
Table 1-1 – Acronyms
RAINVISION State of the Art
6
2. SCOPE
2.1. SCOPE OF THE STATE OF THE ART
The State of the Art for the RAINVISION project will take as a point of departure COST 331, which was the last major European initiative in the field of road marking research and which finished in 1999. Thus, in terms of time frame, the State of the Art will cover the period 1999 to 2011.
In terms of scope, the State of the Art will focus on three main pillars:
Research: It will provide an in-depth analysis of the major road markings research performed in Europe and beyond. This will enable the project to identify the various trends in road markings research and to see to what extent these correspond to the priorities set at policy level
EN 1436: The European Norm 1436 ‘Road Marking Materials - Performance for Road Users’ is an end performance specification which concentrates on the needs of the drivers. The standard specifies the performance for the road user of white and yellow road markings based on luminance (colour), day-time visibility, night-time visibility and skid resistance. The State of the Art will track the development in the EN 1436 from the end of COST 331 to date
Evolution of Testing Methodologies for Road Markings: this chapter will focus on the new testing methodologies developed by the industry since 1999 and to what extent the road authorities seem inclined to make use of these new technologies on Europe’s roads
New Technologies and Trends: this chapter will briefly outlines the challenge posed by the advent of Advanced Driver Assistance Technologies
RAINVISION State of the Art
7
3. ROAD MARKING RESEARCH
3.1. RESULTS OF COST 331
COST 331 Requirement for Horizontal Road Markings was a large scale study conducted between July 1995 and April 1999. Participating members in the study were the COST members at the time, i.e. Belgium, Denmark, Finland, France, Germany, Greece, Iceland, Italy, Portugal, Slovakia, Slovenia, Spain, Sweden, Switzerland and the United Kingdom. Its final purpose was to establish an up-to-date scientific method with which, on the basis of drivers’ visual needs, to determine the optimum pavement marking design in order to ensure that markings are visible, by day and by night, in all weather conditions.
To assess the impact of road markings on driver behaviour, COST 331 conducted a field experiment in three different European countries using a specially designed vehicle by VTT, the Technical Research Centre of Finland. The table below provides an overview of the design of the field test.
Country Area Total Length (km) General Description
Finland Orimattila 61 Long curvy and straight stretches
Portugal Troia 36 Mainly straight stretches, narrow
The overall conclusion of the study is that increased visibility of road markings led to more safety, especially during night time. This was deduced from that fact that, while some increase in the average speed of the drivers was noted, this was not significant enough as to absorb the benefits of higher reactivity time. In other words, ‘although drivers consumed some of the benefit (of more visible road markings) by driving faster, the greatest part of that benefit was used to increase preview time. This meant that drivers had a bigger margin for error than before’2.
One of the main recommendations COST 331 was to develop research into the role of wet-night visible marking.
3.2. RESEARCH TRENDS TO DATE Naturally, there is a series of literature that has been developed in Europe and beyond since the end of COST 331. This section will aim to list in a concise manner an important part of the activities that have been undertaken and to elucidate the trends that have developed per area/country. A special focus will devoted to literature that puts emphasis on the ageing population and wet-night visible markings.
Research and recommendations in the USA
In the United States, the issue of the ageing population and appropriate infrastructure adaptation seems to have gained prominence from the early 2000’s.
In 2004, NCHRP published a report entitled ‘A Guide for Reducing Collisions Involving Older Drivers’ that was aimed as guidance for implementation of the AASHTO Strategic Highway Safety Plan.3
2 COST, (1999), COST 331 Requirements for Horizontal Markings, Luxembourg, Office for Official Publications of the European Communities, ftp://ftp.cordis.europa.eu/pub/cost-transport/docs/331-en.pdf 3 Potts I., Stutts J, Pfefer R., Neuman T.R., Slacj K.L and Hardy K. K., (2004) NCHRP Report 500 Volume 9: A Guide for Reducing Collisions Involving Older Drivers, Washington D.C , Transportation Research Board
RAINVISION State of the Art
8
Given that the number of older drivers in the United States is expected to double between 2000 and 2030, the report sought to analyse the needs of older drivers above and see what measures can be taken to accommodate their needs.
The report identified older drivers as a subset of the driving population that deserves special attention. More specifically, it found that as they age, drivers experience a deterioration in physical, perceptual and cognitive skills. Amongst others it found that:
- The reduction in strength flexibility and range of motion caused by arthritis or other conditions can negatively impact driving
- Many visual functions – including static and dynamic visual acuity, contrast sensitivity and glare sensitivity – deteriorate with age
- Normative ageing most often affects cognitive changes, such as working memory, selective attention and processing speed
The report focussed on low-cost short-term treatments that can be quickly implemented in order to achieve a greater level of comfort for older drivers. Enhanced pavement markings and delineation were amongst the measure that was considered to fit this profile. While confident that this would increase safety levels, the authors pointed out that this still needs to be quantified.
In 2003, the University of Iowa published a report commissioned by Iowa Department of Transportation entitled ‘Enhancing Pavement Marking Visibility for Older Drivers’4. The report focussed on the role of enhanced wet-night visible markings as view of increasing safety during night time in view of an ageing population.
According to the report, night time fatalities make up 46,2% of all fatal crashes and those, unlit rural roads comprise the majority, i.e. 65,3% or 30,3% of all crashes. In this sense, road markings can play an important role by providing the driver with increased guidance. Under dry night conditions, the report stated that most new pavement markings have an adequate retro-reflectivity. However, under wet and rainy conditions, almost all retro-reflectivity of conventional markings is lost given that the light is directed away from the source and thus is of no use to the driver. The difference is illustrated in Figure 1 and 2.
Figure 1. Retro-reflectivity of standard marking under dry conditions
4 Schnell T, Aktan F., Ohme P. and Hogsett J., (2003), Enhancing Pavement Marking Visibility for Older Drivers, Iowa, University
of Iowa
RAINVISION State of the Art
9
Figure 2. Retroreflectivity of standard markings under wet and rainy conditions
Two different trials were carried out both involving the same experimental vehicle, a Ford Taurus LX Sedan
- The first trial was carried out in 1999 and involved 14 drivers, 8 of which between the ages of 20-24 and 6 between the ages of 65-71. It consisted of installing new pavement markings with supplemental retro-reflectors.
- The second trial was conducted in 2000 and involved the same number of drivers, 7 of which between the ages of 19-26 (average age 22,9) and 7 of which between the ages of 65-81 (average age 71,3). It involved using the same stretch of road without renewing the pavement markings.
One of the objectives of the first trial was to assess the extent to which an increase in retroreflectivity can translate into more reaction time under dry and wet conditions. In a former study, Zwahlen and Schnell in 5 assumed that the end detection distance6 is a representative measure of the maximum visibility distance of pavement markings. This assumption was considered as conservative by excluding the driver’s reaction time and its associated distance travelled by the vehicle. Successive tests were performed at a speed of 8 to 16 km/h in 1999 and 25 km/h in 2003 respectively. The experience and literature of eye-scanning having brought no evidence that driving speeds influence the longitudinal preview distance, the driving speed factor is omitted from the research and the low speeds involved in the experiment are considered as adequate for determining meaningful values for the end detection distances.
The hypothesis between retroreflectivity and preview was indeed confirmed for all the marking materials tested (please consult Figure 3 and Figure 4 below for guidance). Under an average retro-reflectivity of 400 mcd/m²/lx applied in the sections with standard products, the average detection distance was 136m and 89m for young and old drivers respectively. When confronted with pavement markings of an average retroreflectivity of 942 mcd/m²/lx in the high performances road markings section of the trial, the average detection distance was 225m and 183m for young and old drivers respectively, in other words an increase of 65% and 105% over the standard products section. And when confronted with pavement markings with an average retro-reflectivity of 870 mcd/m²/lux in the high performances preformed road markings section, this translated into a 28% and 42% more reaction time for drivers compared to standard road markings sections, in others, an average detection distance of 175m and 127 m for young and old drivers.
5 ZWAHLEN Helmut T. and SCHNELL Thomas (1999), Visibility of Road Markings as a Function of Age, Retroreflectivity Under
Low-Beam and High-Beam Illumination at Night,TRANSPORTATION RESEARCH RECORD 1692, Paper No. 98-0285, pp 152-163
6 The end detection distance is the average detection distance to the end of the pavement marking treatments [distance from the point at which the subject reported seeing the end of the pavement marking line or lines with a high degree of certainty (near 100 percent) to the end of the pavement marking line or lines].
RAINVISION State of the Art
10
Based on these findings, it was safely concluded more retro-reflectivity does translate into more reaction for drivers and especially older ones. Yet, the study noted that a fairly large increase in retro-reflectivity is required in order to bring about a significant result.
Figure 3. New Pavement Markings Materials with Supplemental Retro-reflectors, 1999 Experiment
Figure 4. Average Detection Distance
The second trial in 2000 consisted of using the same stretch of road and without renewing the pavement marking. The baseline scenario was a type I pavement marking e.g. retroreflective road marking which does not has necessarily special properties intended to enhance the retroreflectivity in wet or rainy
RAINVISION State of the Art
11
conditions, such as those used in most rural highway applications. This type I pavement marking was compared to high performances type II road markings having special properties intended to enhance the retroreflectivity in wet or rainy conditions applied in the 1999 trials. The emphasis of 2nd trial was on wet driving conditions, and contrary to experiment 1 which relied on natural rain, in this field text a water truck consistently applied on the markings.
As indicated in Figure 6 (below), the detection distance for younger and older drivers increased spectacularly when faced with the wet weather tape compared to the baseline scenario. More specifically, the reaction time increased from 14 m to 61,6 m for your drivers and from 20,7m to 65,7 m respectively, in other words, an increase 328,7% and 217,4% respectively.
Figure 5. Worn Pavement Markings without Supplemental retro-reflectors, 2000 Experiment
Figure 6. Mean Detection (metres) for Pavement Marking Treatment, 2000 Experiment Worn
Pavement Markings
RAINVISION State of the Art
12
In 2009, a research paper was presented at the 88th TRB Annual Meeting entitled ‘The Benefits of Pavement Markings: A renewed perspective based on recent and on-going research’. The paper looked at several methods to assess the benefits of pavement markings, amongst other safety studies; subjective evaluations, vehicle operational studies and which are summarised below.
With respect to safety studies, the Federal Highways Administration (FHWA) launched in 2006 a study to look at the safety of wider pavement markings. A nationwide survey was conducted to assess states that have wider pavement markings on all of some of their highways. Three states were found to have the required information set out by the FHWA, i.e. Michigan, Illinois and Kansas.
In Illinois, a total of 3973 segments (1817 miles) were analysed consisting of 3224 segments (1511 miles) with 4-inch edge lines and 749 segments (306 miles) with 5-inch edge lines. An analysis carried out over 5 years (2001-2006) found that the presence of wider edge lines had a positive effect on driver safety by reducing the number of crashes.
In Michigan, before after-evaluations were conducted with 3 years (2001-2003) of before and 2 years (2005-2006) of after data obtained from 386 rural two-lane segments corresponding to 1223 miles of rural two-lane roads. The subsequent analysis resulted in the following crash reduction estimates: total (5.8%), fatal and injury (24,6%), PDO (3,9%), daytime (10,9%), night time (39,5%), wet (30,9%), wet-night (33,2%), single vehicle (1%), single vehicle wet (27,6%), single vehicle night (0,9%) and opposite direction (39,3%). All of these crash reduction estimates but night time, single-vehicle and single vehicle night crashes were statistically significant to the 95th percentile.
Concerning subjective evaluations, a public opinion survey conducted by the South Dakota Department of Transportation in 1999 found that 81% of the 734 respondents felt that poor pavement markings would ‘somehow interfere” or ‘very likely interfere” with safe travel. Similarly, the American Association of retired persons (AARP) had 18 of their instructors drive a test course in both daylight and darkness. The drivers were subsequently interviewed and 94% of the respondents said that 8-inch edge lines affected the way they drive, especially as a way of staying on the road and in their lane.
With regards to the effect of pavement markings on vehicle operations, the paper noted that several studies conducted in the US into the topic found that the presence of edge-lines on roads did not have a significant influence on the speed of the vehicle largely confirming the finding of COST 331.
United Kingdom
In 2007, the Road Safety Markings Association (RSMA) published the report ‘White Lanes Save Lives’, which, amongst others, provided a cost-effectiveness analysis of the performance of new road markings in selected counties.
Cheshire Country County decided to apply a wet-night visible material on a section of the A556 highway which, during the last three years, had recorded 16 personal injury accidents at an estimated cost of £1, 4 m to the UK economy.
After the application of the enhanced wet-night performance product, the number of total accident fell from significantly as indicated in the table below:
RAINVISION State of the Art
13
Figure 7. Accidents before and after application of wet-night visible product
In similar fashion, Durham City Council undertook during the period 2003-2006 extensive improvement work to junction layout improvements involving improved and enhanced road markings. An analysis of the effectiveness of these measures includes:
- A 50% reduction in accidents associated with improved markings layout
- A reduction of speed in 85th percentile
- Reductions in vehicles breaking the speed limit
- An average first year return of 1,868%
In 2010, the Road Safety Foundation in the United Kingdom published a report entitled ‘Savings Lives for Less’ identified road markings as one of the most cost-effective measure for improving safety on Europe’s roads. More specifically, the report identified sections in Britain’s most improved roads, which as a result of simple infrastructure interventions, had seen decreases in fatal and serious collision by up to 74%. The introduction of renewal of road markings was one of the measures listed as having contributed to this decrease.
France
In 2007, the CETE Normandie Centre performed a research study entitled “Night Rain Visible Road Markings, Case of the Rural Road RD20 in Seine Maritime” to investigate the contribution of night visible road markings in rain condition to the safety of road users. Different public French research projects (SARI Ircad, Divas) have already demonstrated the role of rain and night in the frequency of road crashes.
This study tested the presumed effect of type 2 road markings on the speed of drivers, insofar it was often argued that enhanced road delineation created by more visible road markings could encourage people to speed up in rain condition. A rural road was then instrumented to record the speed and traffic during a several months period, in different conditions (day/night, dry/wet). The road was a typical rural road in France (one carriageway, bidirectional, straight and flat section, 6 to 7m wide).
The section includes a unpaved shoulder which eases the installation of a traffic measurement unit (speed and number of vehicles) and a pavement optical sensor (condition of pavement: dry or wet), and the safe parking of a car for site inspections (see figure below).
RAINVISION State of the Art
14
Figure 8. Rural road RD 20 in Seine Maritime (FR)
Four different situations were recorded (day-dry, day-wet, night-dry, night-rain) before and after the use of rain night visible road markings. Free flow vehicles only were considered (Inter Vehicle Time>5 sec), in normal conditions of traffic (days of the week, excluding holidays and particular events such as strikes).
The initial situation was audited, with traditional road markings. The average speed of vehicles (97 km/h) slightly exceeded the speed limit (90 km/h) in free flow, dry conditions. The speed was higher by night than by day (+ 5 km/h on average, +9 km/h for the 85th percentile). The free flow speed remained unchanged in rain condition compared to dry condition. The stability of speed depending on the weather condition was observed twice by day and by night, demonstrating that drivers poorly adapt to adverse conditions. On the contrary to a former national research project (APTP - Crashes in Rain Condition), the road users do no longer decrease their speed in rain condition, especially by night. This research indicated that the road users tried more particularly to minimize the risk of being enforced for speeding based on the speed limit for dry condition.
The after situation was evaluated with type 2 road markings. No significant change in speed was recorded after the installation of type 2 road markings, even in rain night conditions. The improvement of road perception did not lead to a significant change of speed (see figures below).
Figure 9. Cumulated classes of speed before/after on RD 20 in Seine Maritime (FR)
RAINVISION State of the Art
15
Dry Wet
Before After Before After
Day
85th percentile (km/h)
103 104 105 103
Average (km/h) 93 92 93 93
Night
85th percentile (km/h)
114 112 112 114
Average (km/h) 98 96 97 98
Figure 10. Cumulated classes of speed before/after on RD 20 in Seine Maritime (FR)
The enhanced road markings probably led to a better trajectory, but this issue was not measured by the study.
Australia
In 2004, the Australian Institute of Traffic Planning and Management (AITPM) released a report in May 2004 entitled ‘Linemarking standards – searching for our best practice’. The report confirmed that the line markings can reduce car accidents by as much as 60% and furthermore, argued that with correct levels of contrast and brightness, the reflective lines can prevent crashes on bends, at night on rural roads.
Germany
In December 2011, the German Automobile Club ADAC published a report about road safety and road markings on rural roads7. Approximately, 1/3 of all accidents happen due to run off accidents caused by distraction or a lack of attention from the driver. The report found that good road marking could help to reduce the number of chrashes, especially, when combined with automatic lane departure warning systems. It pointed out, however, that the latter only works when well maintained and visible edge markings are installed. Due to budgets cuts, fewer and fewer rural roads have edge markings despite this being a legal requirement for roads wider than five metres. Actually, a report by the Landesrechnungshof (the Land audit court) found that 85% of road markings are worn out, non reflective or invisible in rain8. .
7 Eicher , C. C, ‘Gefährlicher Geiz’, ADAC Motowelt, December 2011 8 Bemerkungen 2011 des Landesrechnungshofs Schleswig-Holstein mit Bericht zur Landeshaushaltsrechnung 2009, April 2011
RAINVISION State of the Art
16
4. EVOLUTIONS IN THE EUROPEAN NORM 1436
One of the objectives of the Directorate General ‘Enterprise and Industry’ of the European Commission is to remove barriers to trade and allow the smooth functioning of the EU internal market for goods. One of the legislative actions was the publication of the ‘Construction Products Directive’ in 1989. As a result, a mandate has been given to CEN, in order to develop harmonized European norms for the construction sector.
The product segment of road equipment has been addressed by the CEN Technical Committee 226 that has currently established 11 Working Groups (WG) to deal with the various product segments. More generally, the purpose of the CEN Technical Committee is to address the needs of the road community by creating reference document that answer technical and commercial problems.
The WG 2 of TC 226 developed a family of standards for road markings. Probably the most important standard in the field of road marking is EN 1436‚ Road Marking Materials – Road Marking Performance for Road Users’ that was first published in 1997. It gives general test methods and performance criteria for the assessment of road markings. In particular the characteristics retroreflectivity in dry, wet and rain condition, skid resistance and daytime color and brightness are described.
The idea of EN 1436 is to give performance levels that will be maintained during the functional life of the road marking. Due to the nature of road markings, there is significant wear and tear during the normal use, which in most cases gradually reduces the performance. In some regions, the functional life of a road marking will be less than 1 year, due to winter maintenance and the use of studded tires. In other regions, especially with low traffic volume, the functional life will be much longer. It is important to give public buyers and road authorities the right measures, in order to monitor the performance over time. This will allow timely renewal of road markings and ensures sufficient performance levels for the road user. Development of mobile measuring equipment for the performance tests is therefore one objective of the WG2 described below in the outlook.
EN 1436 was cited in the COST 331 Action on ‘Requirements for Horizontal Road Marking’, with the final report being published in 1999. EN 1436 has been further developed since its first publication. The current version was published in 2007 and again amended in 2008. In the following, the relevant changes in EN 1436 will be highlighted, in order to understand the ‘state of the art’ in standardization of road marking performance in Europe.
4.1. EN 1436 REVISION 2007 AND AMENDMENT 1 IN 2008
In 2007, a general revision of EN 1436 was published with a subsequent short amendment in 2008. The main idea behind the first revision has been to better define the test methods and introduce higher performance levels. Regarding the selection of suitable performance classes, a reference is given to the Cost Action 331.
Significant attention was given to improve the test methods for the visibility characteristics and skid resistance. The working group undertook 2 extensive round robin tests in 2004 and 2006 in order to gather data regarding the measuring uncertainty as well as to find reason for systematic errors that could be overcome by improving the test method. As outlined in the CEN rules, the test methods have been amended with information regarding the repeatability and reproducibility.
It is a common aim of road managers and material producers to improve the performance of road markings. During the last 10 years, various new products have been commercialized that show improved visibility characteristics. Some of these products are improved in terms of wet and rain reflectivity by
RAINVISION State of the Art
17
offering a profiled or structured pattern that allows better water drain. These products need special attention when measured for both skid and visibility characteristics. Some of the work for the revision of EN 1436 focuses specifically around these profiled road markings, elaborating about special precaution and attention during measurement.
Newly developed products also allowed offering higher performance classes, especially for the wet and raining reflectivity. While the 1997 version specified wet and rain reflectivity up to a level of 75 mcd/m²/lx, the current standard offers up to 150 mcd/m²/lx. Also higher performance classes for Qd (brightness of road marking under diffuse illumination, like daytime or street lighting) have been amended during the revision.
In order to improve the practicality of the test methods and to allow for on road tests, special advice for the use of portable equipment is given in the revised test methods. Some guidance is given for the special case of mobile measuring equipment that can be used for the performance assessment in open traffic, without the need for closing the road or limiting the number of open lanes.
4.2. OUTLOOK Current work in WG2 focuses on the integration of mobile measurement equipment into the standard.
The opportunity to measure road marking performance with mobile equipment is important for various reasons. With today’s traffic volume, any traffic disruption must be avoided. Besides ensuring road safety, most road authorities target to improve traffic flow and have strict regulations when it comes to disruptions by lane or road closures. In practice, this limits the opportunity to perform good measurements of road markings. In many cases, the only option for regular performance assessment is the use of mobile equipment. Several mobile equipments are commercially available that measure dry reflectivity, while mobile measurements of other characteristics are still under development.
Some concepts have been presented during the last years to calculate retroreflectivity in wet conditions based on measurements in dry conditions (see chapter 5), but correlation to existing static tests as well as measuring accuracy is still to be proven.
The use of mobile measuring equipment can contribute to improved road marking performance and road safety. Today, some road authorities are reluctant to specify certain performance characteristics, such as wet and rain reflectivity, because it is difficult to measure in practice and almost impossible to perform continuous monitoring in the road network.
With shrinking maintenance budgets, the availability of mobile equipment with good correlation to current test methods would allow for better financial planning and resource allocation. Rather than replacing road marking in fixed time intervals, it would be desirable to replace only at the end of the functional life. This could allow for a more targeted use of resources to the necessary road sections. Making extensive measurement of the performances of the road markings is the basis of any road marking management system.
A first round robin test of WG2 with mobile equipment for the assessment of dry reflectivity was done in 2011. Future work will focus on “night time visibility in rain or conditions of wetness” as well as for measuring “skid resistance” from a moving vehicle, without the need to close the road. The first task can be started right now as it will become a project financed by the road administrations of Denmark, Norway and Sweden (the road administration of Finland may also join the work).
RAINVISION State of the Art
18
5. EVOLUTION FOR TESTING METHODOLOGIES FOR ROAD MARKINGS
The EN1436+A1:2009 standard (annex B) describes the measurement method for measuring the night visibility – so called coefficients of retroreflected luminance of road markings (RL), including markings visible at night under rain conditions.
The annex B mentions that “the equipment for the measurement of the coefficient of retroreflected luminance RL of a field of a road marking includes an illumination system, a photometer and means to define a horizontal reference plane with a reference centre. Laboratory measurements are used to establish RL values for samples that are to be used to test or calibrate in situ equipment. The reference plane and the reference centre is defined by means of a sample holder and an alignment procedure”.
[…] The photometer measures a field of the reference plane, which is located about the reference centre. The illumination system illuminates a field of the reference plane, also located about the reference centre.
[…] The standard measuring condition is intended to simulate a visual distance of 30 m for the driver of a passenger car with an eye height of 1,2 m and a headlamp mounting height of 0,65 m above the road.
The measurement geometry is the same for type 2 markings as that used for conventional markings (type 1 or 0). Standard measuring conditions for conventional markings are performed in dry condition only. Type 2 road markings need to comply at least with wet conditions, and sometimes with rain conditions.
[For rain visibility measurement] test conditions shall be created using clean water giving artificial rainfall, without mist or fog, at an average intensity of (20 ± 2) mm/h over an area that is at least twice the width of the measured area, minimum 0,3 m, and at least 25% longer than the measured area. The variation in rainfall between the lowest and the greatest intensity shall be no greater than the ratio 1 to 1,7.
Measurements of the coefficient of retroreflected luminance RL in condition of rain shall be made after 5 min of continuous rain, or when stability of measurement is achieved, and while rain is falling.
To date, this measurement generally takes place statically, either using a luminance meter, or more usually with portable instruments. In all cases, these interventions imply several constraints. They require installing a fixed Workzone signalization, a traffic deviation and in the case of using a luminance meter, they occur at night. The measurement of type 2 road markings is thus difficult to operate for practical reasons: the safety of operators and road users is engaged, yield of the measurement is very low (only a few markings can be controlled per day) and road occupation creates undesirable effects (traffic congestion, acceptability).
The most important performance characteristic of road markings is their visibility at night, defined as retroreflectivity. Markings should always provide required adequate visibility, even in wet conditions.
Measurement of the retroreflectivity of centre and edge lines using portable (hand-held) measuring instruments has proved to be almost impossible on a large scale, given that the measured area of a single measurement is equivalent to a palm’s size. This means that the area measured is only a tiny fraction of total surface area of the road markings. Additionally, the portable reflectometers, touching the marking to be measured, are not always designed to be used on wet surfaces or on structured road markings.
RAINVISION State of the Art
19
5.1. DYNAMIC MEASUREMENT METHODS IN WET CONDITIONS Quality control of retroreflectivity on the site of a normally sized road marking contract should be done, also for safety reasons, from a vehicle capable of taking measurements while travelling at the normal speed of the traffic flow.
Compared to the existing static method, the implementation of a dynamic measurement method of type 2 road markings in wet conditions should enable to reduce significantly the impacts of these measurements on the traffic flow while boosting their yield, opening new knowledge on the performances in use of road markings, and new perspectives on the road marking products and their related technologies (including their optical system).
The Nordic experience
The visibility of road markings in wet conditions is a matter of concern for a lot of European countries. The Nordic countries investigated this issue as far back as the mid 90’s with in Sweden and Finland. One implemented a method based on the joint use of a dynamic retroreflectometer and of a vehicle mounted rainfall simulator to estimate the visibility of type 2 road markings in wet conditions. The two vehicles were operated at the same speed (60 km/h).
The road marking line is wet with a water spray from a lorry one minute before measurement (see figure). The water film thickness equals 1 mm, enabling the simulation of wet conditions on a 10km distance with a 3m3 tank. As the measurement shall be performed one minute after the road watering, the distance between the lorry and the retroreflectometer depends on their speed. At a speed of 60 km/h, the distance between the two vehicles should be exactly 1 km.
Figure 11. Finnish equipment for wet retroreflectivity dynamic measurement
The measurements revealed significant differences in the visibility of road markings from dry to wet conditions, depending on their technology. This means that a road marking product demonstrating high performances in dry conditions does not necessary perform as well in wet conditions. Further investigation should be undertaken in order to have a better measuring and understanding of the performances of road markings in wet conditions.
RAINVISION State of the Art
20
The German experience
The visibility of road markings in wet conditions is a matter of concern for many European countries. Some additional simulations of and measurements in wet conditions have been recently performed in Germany. In the Years 2009/2010 a study on retro reflection of road markings in wet condition was done in Germany. The contracting authority was the “Bundesamt für Strassenwesen” (BASt) of Germany (report to be published). The study was conducted by the “Deutsche Studiengesellschaft für Strassenwesen” (DSGS), Germany and Company Zehntner Testing Instruments, Switzerland. The goal of the research was to develop a mobile measuring method of measuring RL that correlates with the condition of wetness known from EN 1436:2007+A1 part B6 (bucket method). The measuring speed should at least be 60 km/h and the measuring system should be valid for all types of road markings. The system developed consists of a van to wet the road marking and a separate measuring car. At a driving speed of 60 km/h, the distance between the watering van and the measuring car is about 80 to 100m.
Figure 12. Equipment for wet retroreflectivity dynamic measurement
The van and watering system
The van is equipped with a tank of 1m3 of water and a motor pump. On one side of the van, a spraying system is mounted. The spraying system has 6 nozzles that spray the water onto the road marking with a pressure of about 2.5 bars. In order to regulate the amount of water sprayed out, some of the nozzles can be shut down by valves.
Figure 1. Spraying system with nozzles
RAINVISION State of the Art
21
The spraying system makes sure, that also under high speed conditions the same amount of water reaches the road marking and that the wet section has always the same width. The wetting width can be adjusted very easily by changing the height of the nozzles above ground.
Because the water dries off faster at the edges and because of some steering tolerance needed for the driver (especially in curves), a width of 55 cm was considered to be the best choice.
Measurements on the test field
On the test field in Torfhaus, Germany, a big variety of road marking systems is available for test measurements. This makes the test field a very interesting site for development of such a system.
One of the main goals was to find a correlation between the dynamic wet measuring system and the condition of wetness of EN 1436 part B6 (bucket method). This resulted in many test runs where the road markings on the test field were wet with the watering van at a speed of 60 km/h. Shortly after wetting, the values of the marking were measured with handheld devices. These handheld values were then compared to the values taken by the bucket method.
Water pressure, water amount and time between wetting and measuring the road marking do influence the measured value. These parameters have been adjusted so that the best correlation between the manual bucket method and the mobile system was found.
Figure 2. Precise wetting of the road marking at 60 km/h
Figure 3. Test field with a variety of road markings
Figure 4. After wetting, the values are measured
RAINVISION State of the Art
22
Common parameters are:
‐ Driving speed: 60 km/h
‐ Wetting width: 55 cm
‐ Water distribution: 231 milliliters / meter (420 ml / m2)
‐ Water flow rate: 3.85 liters / second
‐ Measuring time after wetting: 5 to 8 seconds.
Distance between watering van an measuring vehicle
The timeframe between watering van and measuring vehicle was set to between 5 and 8 seconds, which results in a distance of about 100 meters between the two vehicles. Because of the spraying system, the marking is wet in a different way than with the bucket method. This allows for much shorter timeframe between watering and measuring.
When the timeframe between wetting and measuring is set too long, the influence of the sun drying off a road marking can be unexpectedly high. However, when the timeframe is set too short, the distance between the watering van and the measuring car is too short and the measuring head would risk getting a wet protection glass.
The BASt report having yet to be published, no additional data is available concerning the comparison of wet night values measurement between the standardized static method and this innovative dynamic method.
5.2. CALCULATION OF ROAD MARKINGS WET VISIBILITY BASED ON DYNAMIC MEASUREMENT IN DRY CONDITIONS
The former simulation and measurement of visibility of road markings in wet conditions were difficult to perform in real world, due to technical constraints (e.g. water consumption) and drawbacks (e.g. water drops on measuring instrument lenses).
Based on that experience, the Nordic countries launched in 2004 a research program, with the scope to develop, first of all a method for measuring or calculating the retroreflectivity also in wet conditions. The second goal of the project was to study the possibility to also include the friction and the daytime visibility (Qd or contrast) in the survey system. The Swedish Public Roads Agency and the VTI (Public Swedish Roads Research Institute) closely cooperated with the industry (especially Ramböll) during the development period, including the validation of calculation models.
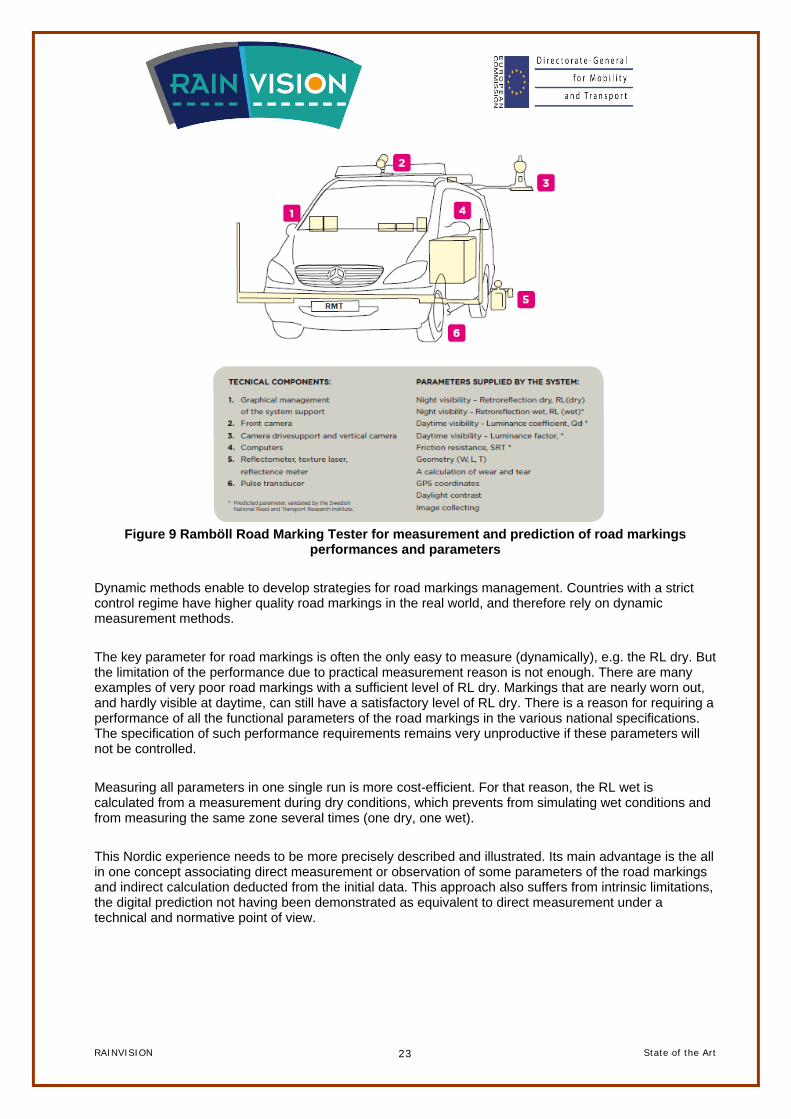
The last version of the acquisition system used by Ramböll is called Road Marking Tester (see figure 9 below).
It records the following parameters for road markings in use:
- retroreflectivity in dry conditions (RL)
- full photo documentation by front camera, image every 10m
- advanced GPS positioning.
The systems estimates additional predicted parameters
- retroreflectivity Rw (night visibility) in wet conditions
- luminance coefficient under diffuse illumination Qd (daytime visibility) in dry conditions
- friction (skid resistance) of road markings
- wear calculation of the surface by automatic image analysis.
RAINVISION State of the Art
23
Figure 9 Ramböll Road Marking Tester for measurement and prediction of road markings
performances and parameters
Dynamic methods enable to develop strategies for road markings management. Countries with a strict control regime have higher quality road markings in the real world, and therefore rely on dynamic measurement methods.
The key parameter for road markings is often the only easy to measure (dynamically), e.g. the RL dry. But the limitation of the performance due to practical measurement reason is not enough. There are many examples of very poor road markings with a sufficient level of RL dry. Markings that are nearly worn out, and hardly visible at daytime, can still have a satisfactory level of RL dry. There is a reason for requiring a performance of all the functional parameters of the road markings in the various national specifications. The specification of such performance requirements remains very unproductive if these parameters will not be controlled.
Measuring all parameters in one single run is more cost-efficient. For that reason, the RL wet is calculated from a measurement during dry conditions, which prevents from simulating wet conditions and from measuring the same zone several times (one dry, one wet).
This Nordic experience needs to be more precisely described and illustrated. Its main advantage is the all in one concept associating direct measurement or observation of some parameters of the road markings and indirect calculation deducted from the initial data. This approach also suffers from intrinsic limitations, the digital prediction not having been demonstrated as equivalent to direct measurement under a technical and normative point of view.
RAINVISION State of the Art
24
5.3. DYNAMIC MEASUREMENT METHODS IN RAIN CONDITIONS
Compared to the existing static method, the implementation of a dynamic measurement method of type 2 road markings in rain conditions would enable to reduce significantly the impacts of these measurements on the traffic flow while boosting their yield, opening new knowledge on the performances in use of road markings, and new perspectives on the road marking products and their related technologies (including their optical system).
For that reasons, the industry and the notified body9 asked in 2006 the Regional Laboratory of Civil Engineering of Strasbourg to investigate the possibilities of using Ecodyn (the first vehicle mounted instrument for dry night visibility) to perform measurements by rain condition.
The research action has three stages.
The first stage explores the feasibility to implement - in addition with a standard rainfall simulator - a static use (mounted on a tripod) of the Ecodyn instrument by day, with the aim of replacing the luminance method (luminance meter + illumination system) by night. The gains deal with both the use of an instrument gathering both an illumination system and a photometer and with the measurement conditions (day vs. night and 6 meters between instrument and road marking vs. 30 meters).
The second stage explores the feasibility to implement a dynamic measurement method in rain conditions. Its goal is to check whether some technical specifications can enable to fulfil the requirements for dynamic rainfall simulation. These changes in the rainfall method should give the same measurement values as the static standardized method according to laboratory tests. Similarly, some dynamic measurement tests have been performed in order to verify if they could provide results comparable with those obtained in static.
The third stage explores the feasibility to implement a dynamic measurement method in rain conditions, based on suited equipment for rainfall simulation and rain visibility measurement.
5.3.1. STATIC SIMULATION AND MEASUREMENT OF RAIN CONDITIONS IN LABORATORY
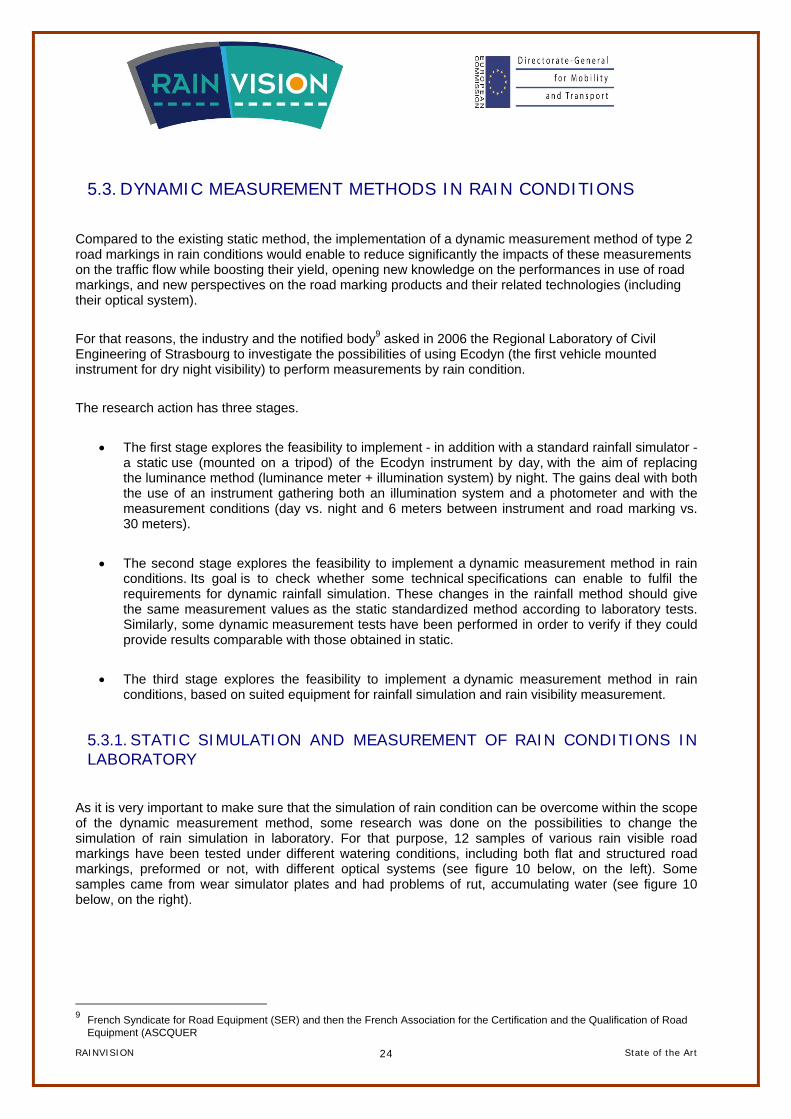
As it is very important to make sure that the simulation of rain condition can be overcome within the scope of the dynamic measurement method, some research was done on the possibilities to change the simulation of rain simulation in laboratory. For that purpose, 12 samples of various rain visible road markings have been tested under different watering conditions, including both flat and structured road markings, preformed or not, with different optical systems (see figure 10 below, on the left). Some samples came from wear simulator plates and had problems of rut, accumulating water (see figure 10 below, on the right).
9 French Syndicate for Road Equipment (SER) and then the French Association for the Certification and the Qualification of Road
Equipment (ASCQUER
RAINVISION State of the Art
25
Figure 13. Road marking samples in the French experiment
Two static rainfall simulation systems have been performed. The first one (below, on the left) is the conventional simulator and produces an artificial rain from 20 mm/h (required in the standard) up to 100 mm/h. The second one (see figure 11 below, on the right) uses a spray nozzle and produces an artificial rain from 240 mm/h to 300 mm/h.
Figure 14. Rain simulators in the French experiment
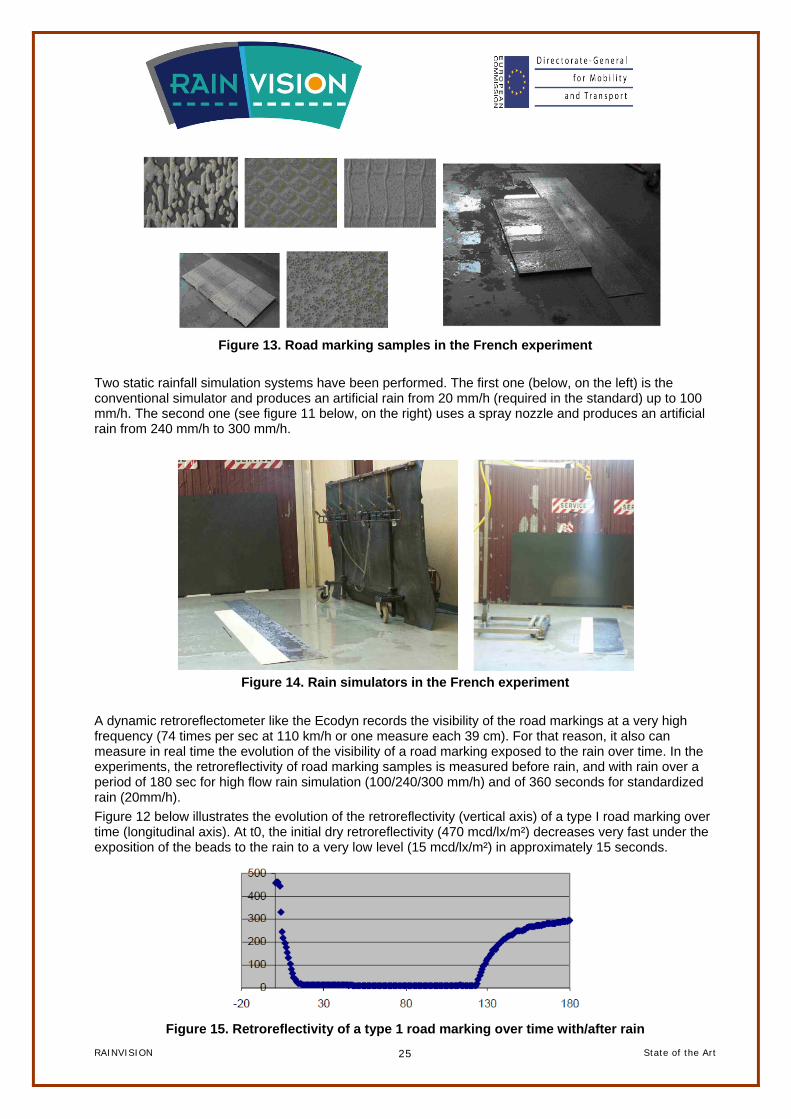
A dynamic retroreflectometer like the Ecodyn records the visibility of the road markings at a very high frequency (74 times per sec at 110 km/h or one measure each 39 cm). For that reason, it also can measure in real time the evolution of the visibility of a road marking exposed to the rain over time. In the experiments, the retroreflectivity of road marking samples is measured before rain, and with rain over a period of 180 sec for high flow rain simulation (100/240/300 mm/h) and of 360 seconds for standardized rain (20mm/h).
Figure 12 below illustrates the evolution of the retroreflectivity (vertical axis) of a type I road marking over time (longitudinal axis). At t0, the initial dry retroreflectivity (470 mcd/lx/m²) decreases very fast under the exposition of the beads to the rain to a very low level (15 mcd/lx/m²) in approximately 15 seconds.
Figure 15. Retroreflectivity of a type 1 road marking over time with/after rain
RAINVISION State of the Art
26
The retroreflectivity finally increases after the stop of rainfall simulation, as the water film gradually disappears. Despite some correlation, it has not been possible to determine a significant value in the very beginning of the rain to measure the rain retroreflectivity on the different road marking samples. The first seconds of rain form indeed an unstable zone, making it difficult to compare between products and rain simulation methods.
The measurement of the different road marking sample over time reveals that the retroreflectivity varies at a different speed depending on the rain simulation method. The more water is put on the road marking in a given period, the fastest the retroreflectivity comes down to its minimum (figures 13). With the standard 20 mm/h method, at last 200 seconds are necessary to obtain the minimum value for all samples. A 100 mm/h rain simulation requires only 20 seconds, and the 240 mm/h less than 5 seconds
Figures 16. Retroreflectivity of type 2 road markings over time with rain of 20, 100 and 240 mm/h
It also reveals the massive drop in the retroreflectivity at the beginning of rain simulation, and confirms the instability of this time zone in terms of values across the different samples. Rather than looking at a correlation between standard RR value and alternative rain simulation values within the decreasing zone in the performances of road markings, it has been more constructive to focus on the increasing zone. The decreasing zone is located in the period of time when the performances of the road marking fall because off the accumulation of water under the rain simulation. On the contrary, the increasing zone is located in the period of time when the performances of the road marking rise because off the evacuation of water after the rain simulation.
RAINVISION State of the Art
27
While considering a moment of measurement (see red vertical axis, figures 14) ten second after the rain, a good correlation is observed between the rain retroreflectivity obtained with the standard method (20mm/h) and the values obtained with alternative rain simulation method (figure 15).
Figures 17. Retroreflectivity of type 2 road markings over time with rain 240 mm/h and hose
garden
Figure 18. Correlation of 20 mm/h rain retroreflectivity of type 2 road markings 10 seconds after
stopping rain with hose garden rain simulation (purple)
The values of rain retroreflectivity measured ten second after the end of the rain are very similar across the different rain simulation methods for most of the road markings samples, whatever their intrinsic retroreflectivity (figure 16).
Figure 19. Comparison of Rain Retroreflectivity of type 2 road markings 10 seconds after stopping
rain with different methods: 20 mm/h (blue), 240 mm/h (yellow) and hose garden (purple)
RAINVISION State of the Art
28
The laboratory experiments confirmed that the dynamic measurement of rain retroreflectivity was technically possible, based on the flooding of the road marking and on a 10 second split measure. The key issue for the uncertainty of measurement would probably concern the control of the inter vehicle time; and the correction of its deviation from the 10 seconds.
5.3.2. STATIC SIMULATION AND MEASUREMENT OF RAIN CONDITIONS IN SITU
A second stage consists in a static measurement of the rain retroreflectivity of road markings in situ, on test track or on open roads. For that purpose, the Laboratoire des Ponts et Chaussées of Strasbourg performed a wide range of measurements on the French road trials site used to certify product, near Saint Quentin en Picardie (in the Aisne county, 200 km North East of Paris ). This measurement session enabled to compare the standardised method and the static Ecodyn measurement:
The standardised method for rain visibility (rain retroreflectivity RR) means a measurement by night using a luminance meter and a headlamp illuminating a road marking located 30m away, and exposed to a rainfall simulator; its advantages are realistic conditions for measurement and accuracy; its drawbacks are the complexity of the process (number of equipments to be installed, adjustment of the geometry for illumination and measurement devices, adjustment of rain simulator) and its constraints (time for operating the measurement, visual pollution caused by traffic, safety)
The static Ecodyn measurement also requires the rainfall simulator, but both illuminator and photometer are integrated in the retroreflectometer, which is placed on an adjustable tripod to operate statically (figure 17). The measurement is performed at a distance of 6 meters from the road marking, whit the same geometry (angles of illumination and measurement) as the standard method. The measurement area is elliptic (0,5m wide, 1,0m long).
Figure 20. Ecodyn equipment for static RR measurement
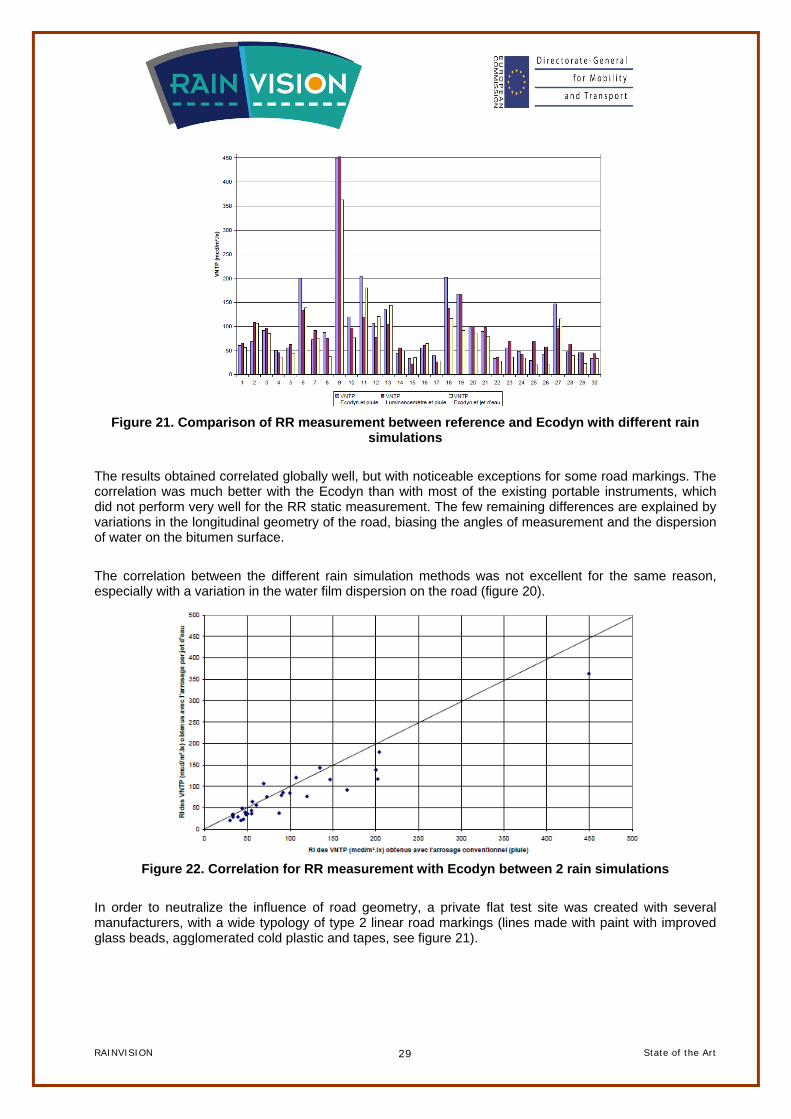
Measurements are performed by day, this equipment being much easier to operate compared to the standardised equipment. Comparisons are recorded between the standard measurement method by night with the luminance meter and the Ecodyn method performed on the one hand after 5 minutes of standard simulated rain and on the other hand with the accelerated rain method with a water jet. The results are shown below (figure 18).
RAINVISION State of the Art
29
Figure 21. Comparison of RR measurement between reference and Ecodyn with different rain
simulations
The results obtained correlated globally well, but with noticeable exceptions for some road markings. The correlation was much better with the Ecodyn than with most of the existing portable instruments, which did not perform very well for the RR static measurement. The few remaining differences are explained by variations in the longitudinal geometry of the road, biasing the angles of measurement and the dispersion of water on the bitumen surface.
The correlation between the different rain simulation methods was not excellent for the same reason, especially with a variation in the water film dispersion on the road (figure 20).
Figure 22. Correlation for RR measurement with Ecodyn between 2 rain simulations
In order to neutralize the influence of road geometry, a private flat test site was created with several manufacturers, with a wide typology of type 2 linear road markings (lines made with paint with improved glass beads, agglomerated cold plastic and tapes, see figure 21).
RAINVISION State of the Art
30
Figure 21. Private site for RR dynamic in situ measurement with Ecodyn
The other interesting aspect of a private site is the possibility to operate safely measurements and to test in realistic conditions dynamic measurements. For that purpose, a small van equipped with a trailer spreads water on the road markings in order to simulate rain conditions. The dynamic retroreflectometer measures ten seconds after the rain simulator (figure 21).
Figure 23. Private site for RR dynamic in situ measurement with Ecodyn
At this stage, the main conclusions were:
- the flow of water should be mechanically controlled to have the same thickness of water film on the road
- as the road markings generally have lower levels of performance in rain conditions, it is necessary to improve the line keeping information in the vehicle equipped with a mounted retroreflectometer
- as the rain simulation spreads water from the rear of the vehicle on the road markings, it is necessary to implement a line keeping information in this vehicle
- as the inter vehicular time is not automatically controlled between the rain simulator and the measuring vehicle, it is important to implement a device in the measuring vehicle displaying this IVT
- as the IVT determines the validity of the measurement, and as it can change from the reference value, it is important to record the IVT in order to check the robustness of the measures, and to be able to correct eventually values under or over the 10 second after the measurement session.
RAINVISION State of the Art
31
5.3.3. DYNAMIC SIMULATION AND MEASUREMENT OF RAIN CONDITIONS IN SITU
The final stage consists in a dynamic measurement of the rain retroreflectivity of road markings.
On open roads, one compared the measurement between static and dynamic to be sure that the results were strong enough. Compared to a private site static measurement, some adjustments were done: the Ecodyn holder was equipped with wheels; the rain simulation was equipped with a windbreak to face the influence of the surrounding traffic (figure 22).
Figure 24. Equipment for RR static measurement on open road with Ecodyn
The equipment for dynamic measurement was significantly improved (figure 23):
- both vehicles are equipped with a camera to follow the lines and with a odometer and are linked by a radio liaison the measure the inter vehicular time;
- the rain simulation vehicle is equipped with an inboard tank of water, with an electrical pump to have a constant, controlled flow, the water sprayer is protected by a deflector to prevent undesirable aerodynamic effects on the dispersion of water due to speed ;
- the measurement vehicle uses a specific software displaying and recording all the data, including inter vehicle time.
Figure 25. Equipment for RR dynamic measurement on road with Ecodyn
Several extensive measurement sessions were performed on open roads in the East of France on motorways equipped with different samples of road markings. The two vehicles were operated at 20 km/h, with a flow of water of 0,9 litter/second, making a 0,54mm water film on the road. With a 1000l tank, it is possible to measure 6170 m of continuous road markings.
Standard static rainfall simulator
Ecodyn static device
RAINVISION State of the Art
32
Dynamic measurements were repeated to check the repeatability of the method. Static measurements with Ecodyn were also performed to check on a sampling approach the correlation with the dynamic measurement. The results are shown below figure 23.
RAINVISION State of the Art
33
Figure 26. Comparison between static and dynamic RR measurements on road with Ecodyn
The French experience clearly demonstrates the feasibility of the dynamic measurement of the retroreflectivity of road markings in simulated rain conditions. The repeatability of the dynamic measurement is relatively good, except in some cases (accumulation of water during the repetition of tests on specific zones given the geometry of the road).
The main advantages of the dynamic method are: a major improvement in the yield of measurement with a multiplication by 2000 of the road markings measured10, the possibility to expand the length of measured roads by sampling measures, a very good safety with no operator standing or walking on the road.
This method also suffers from several drawbacks:
- the method is water consuming for the simulation of rain conditions,
- it requires two vehicles and multiple operators,
- it is necessary to operate multiple measurement of the road section, at least one session in dry and one session in rain conditions,
- measurements in rain conditions are operated at a low speed (20 km/h) with a serious impact on the traffic flow and on safety.
Despite these interesting results, it has not been possible to deliver a full stable, operational add-on system for the corresponding mobile reflectometer, for practical reasons (electronic parts, software update).
10 Increase from 10 linear meters to 20 000 linear meters a day
RAINVISION State of the Art
34
5.4. CONCLUSION FOR MEASUREMENT METHODS IN WET/RAIN CONDITIONS
As we lack information concerning the performances of improved road markings in wet and rain conditions, it remains necessary to develop appropriate dynamic measurement methods for this purpose.
Several paths should be investigated in the future.
The rain simulation and measurement approach should be continued and improved in order to build scientific knowledge on the performances of road markings in adverse conditions and their durability.
The comparison should be established between on the one hand the static & dynamic measuring approaches and on the other hand the hybrid approach (measuring some parameters and calculating others) in order to determine precisely their respective conditions of use and limitations.
Other innovative approaches could also provide useful findings.
Natural conditions to operate measurements
It could be interesting to perform direct measurement in naturalistic environment by operating mobile retroreflectometers under real rain (or wet) conditions; this approach need to overcome some technical considerations (e.g. the protection of the lenses of the equipment) and to add some captors (e.g. to measure either the thickness of the film of water or the granulometry of the raindrops).
Human perception concepts
Some experimental research investigated the visibility of road marking in a human factors perspective. The human factors are the visual factors which influence the capacity of a person to operate a complex machine. These factors should be constant (not situational, such as e.g. fatigue) and stable (not personal, such as e.g. aggression). They encompass several items: road user’s reaction time, directional orientation in optical unframed curves, reading time for symbols / texts, upper limits for perception at n objects, optical illusions and responses to sensations in the field of view.
This means to consider the visibility of road markings globally, and not only on their intrinsic photometric performances, not on their intrinsic visibility, but on their contribution to the visual sensation produced by the scene of the road as a whole, including its environment.
In such a perspective, the geometry, the modulation and the design/conditions of use road markings may also contribute to influence the driver’s behaviour, in addition to their physical properties.
RAINVISION State of the Art
35
6. DEVELOPMENT OF NEW TECHNOLOGIES AND TRENDS
Lundkvist and Fors, in ‘Lane Departure Warning System LDW. Relationship between the performance of the LDW and the road markings’11, investigated the interaction between a car Lane Departure Warning System (LDW) and the road markings on a 88 km long road itinerary, with start and stop in Linköping.
The results show that the LDW has very good performance in most light and weather conditions. On primary roads, in both daylight and darkness, generally the accessibility was about 99%. However, the combination of rain and darkness, as well as low opposing sun affected the function, which meant that the accessibility deteriorated. In extreme opposing sun, the accessibility was as low as 50%, while it was 92% on primary roads in darkness combined with rain. On secondary roads, the accessibility was somewhat lower due to poor visibility of the road markings.
The physical measurements showed that, for the LDW to work in head-light illumination, the retroreflectivity of the road markings must be at least 70 or 20 mcd/m2/lx in dry and wet condition, respectively. In daylight, the luminance coefficient must have at least 5 mcd/m2/lx higher value than the road surface.
Such a research points out the necessity to have minimum performances requirements for road markings in adverse conditions to help Advanced Driver Assistance Systems (ADAS) to function efficiently. As road markings contribute directly to the road delineation, they are useful for both intelligent vehicles and drivers.
We certainly need roads that cars can read. As some vehicles only (cars, buses and trucks) include assistance only devices (and not autonomous) systems, we also need roads that drivers can read. Road markings should then comply with the visual needs of drivers and with technical needs of ADAS.
11
Sven-Olof Lundkvist and Carina Fors, (2009), Lane Departure Warning System – LDW. Relationship between the performance of the LDW and the road markings, VTI (Swedish National Road and Transport Research Institute), SE-581 95 Linköping Sweden
RAINVISION State of the Art
36
REFERENCES
1. Bemerkungen 2011 des Landesrechnungshofs Schleswig-Holstein mit Bericht zur Landeshaushaltsrechnung 2009, April 2011
2. Brown, D, (2004), Line-marking standards: searching for best practice
3. Carlson P. J., Park, E. S., Andersen C.K (2008), The Benefits of Pavement Markings: A renewed perspective based on recent and ongoing research’, TRB 88th Annual Meeting,
4. COST, (1999), COST 331 Requirements for Horizontal Markings, Luxembourg, Office for Official Publications of the European Communities, ftp://ftp.cordis.europa.eu/pub/cost-transport/docs/331-en.pdf
5. Eicher , C. C, ‘Gefährlicher Geiz’, ADAC Motowelt, December 2011
6. Potts I., Stutts J, Pfefer R., Neuman T.R., Slacj K.L and Hardy K. K., (2004) NCHRP Report 500 Volume 9: A Guide for Reducing Collisions Involving Older Drivers, Washington D.C , Transportation Research Board
7. Road Markings Safety Association (2007), ‘Road Markings, Road Safety and Efficient Road Utilisation in 21st Century’
8. Road Safety Foundation (2010), ‘Saving Lives for Less’
9. Schnell T, Aktan F., Ohme P. and Hogsett J., (2003), Enhancing Pavement Marking Visibility for Older Drivers, Iowa, University of Iowa
10. Sven-Olof Lundkvist and Carina Fors, (2009), Lane Departure Warning System – LDW. Relationship between the performance of the LDW and the road markings, VTI (Swedish National Road and Transport Research Institute), SE-581 95 Linköping Sweden
11. Zwahlen H.T. and Schnell T. (1999), Visibility of Road Markings as a Function of Age, Retroreflectivity Under Low-Beam and High-Beam Illumination at Night,TRANSPORTATION RESEARCH RECORD 1692, Paper No. 98-0285, pp 152-163
12. Moisand O. and Violette E. - CCETE Normandie Centre (2007), Rain Night Visible Road Markings, Case of the rural road RD20 in Seine Maritime, France, December, 37p, unpublished (in French)