1 1 Steam Enhanced Remediation In Fractured Rock (and a little about the other sites) Gorm Heron, Scientist/Engineer Hank Sowers, CEO/Chief Operator Dacre Bush, Geologist/Program Manager Gregg Crisp, Site manager SteamTech Environmental Services Bakersfield, CA
Transcript
1
1
Steam Enhanced Remediation
In Fractured Rock
(and a little about the other sites)
Gorm Heron, Scientist/Engineer
Hank Sowers, CEO/Chief Operator
Dacre Bush, Geologist/Program Manager
Gregg Crisp, Site manager
SteamTech Environmental Services
Bakersfield, CA
2
2
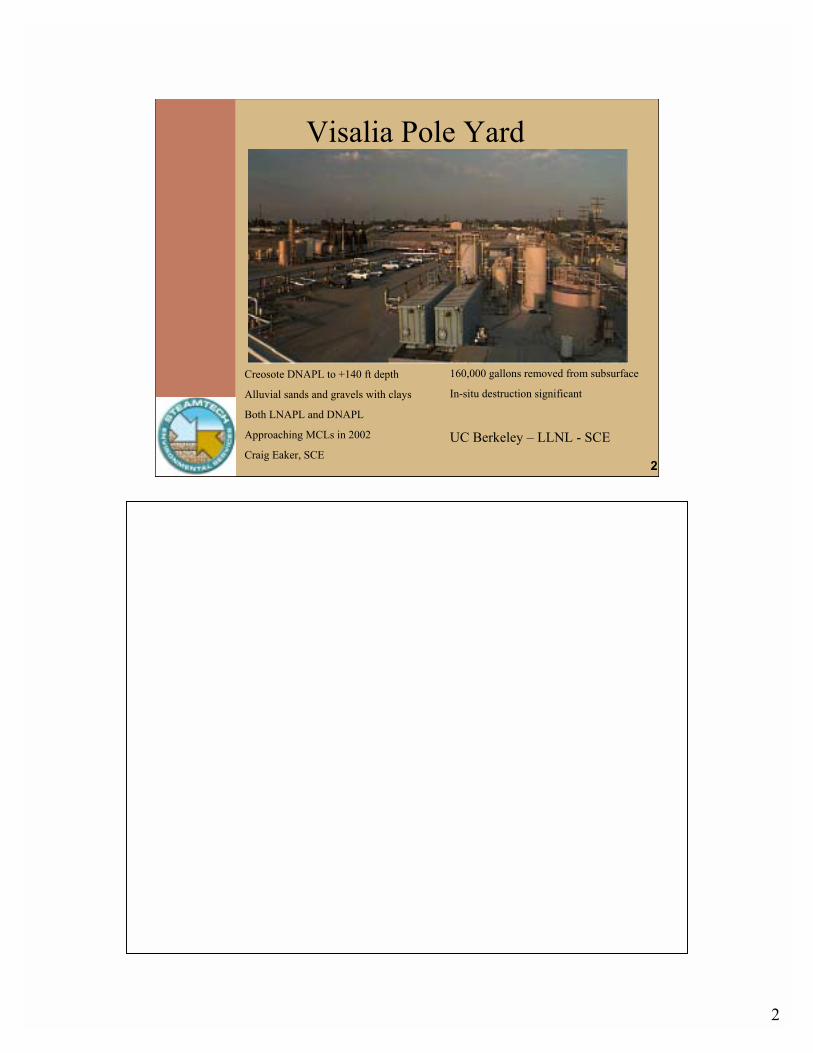
Creosote DNAPL to +140 ft depth
Alluvial sands and gravels with clays
Both LNAPL and DNAPL
Approaching MCLs in 2002
Craig Eaker, SCE
160,000 gallons removed from subsurface
In-situ destruction significant
UC Berkeley � LLNL - SCE
Visalia Pole Yard
3
3
Alameda Point
Alameda Point (Berkeley Environmental Restoration Center)
4
4
Edwards AFB Site 61
5
5
Beale AFB
5
6
6
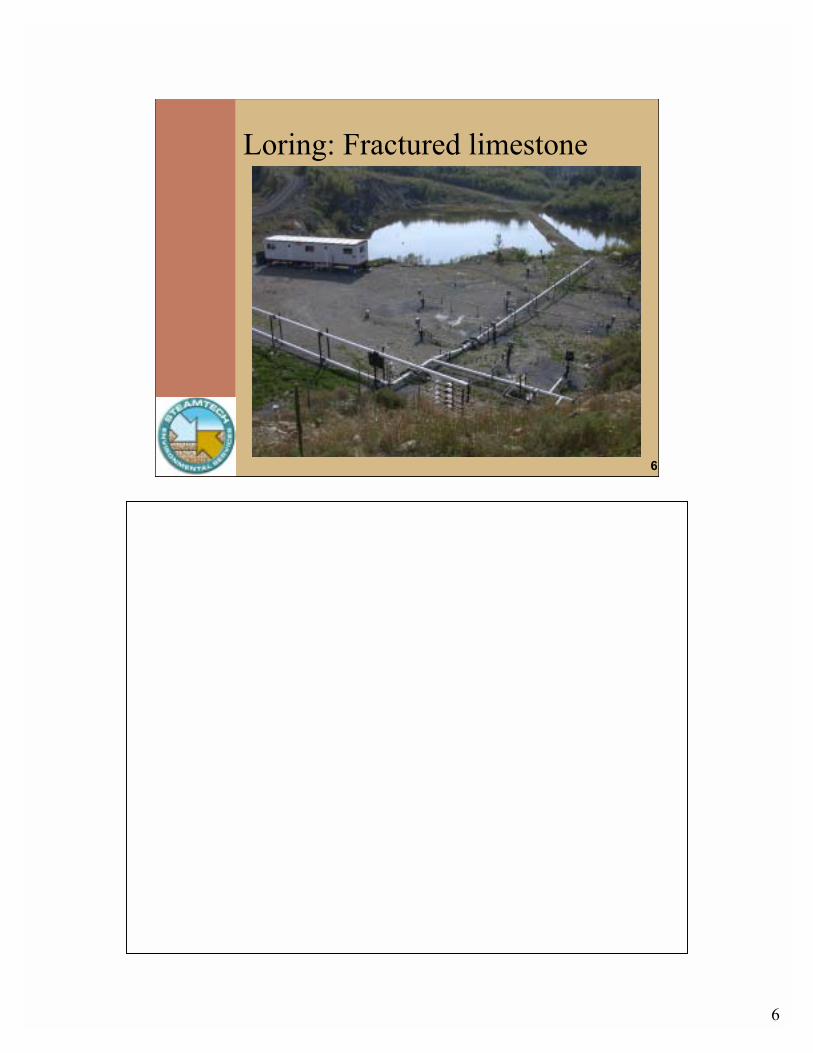
Loring: Fractured limestone
7
7
Florida site! Full-scale clean-up with performance guarantee
! Steam enhanced remediation and electrical heating
! Tight pneumatic and hydraulic control
! Stimulated oxidation reactions for reduction of TPH concentrations in oily areas
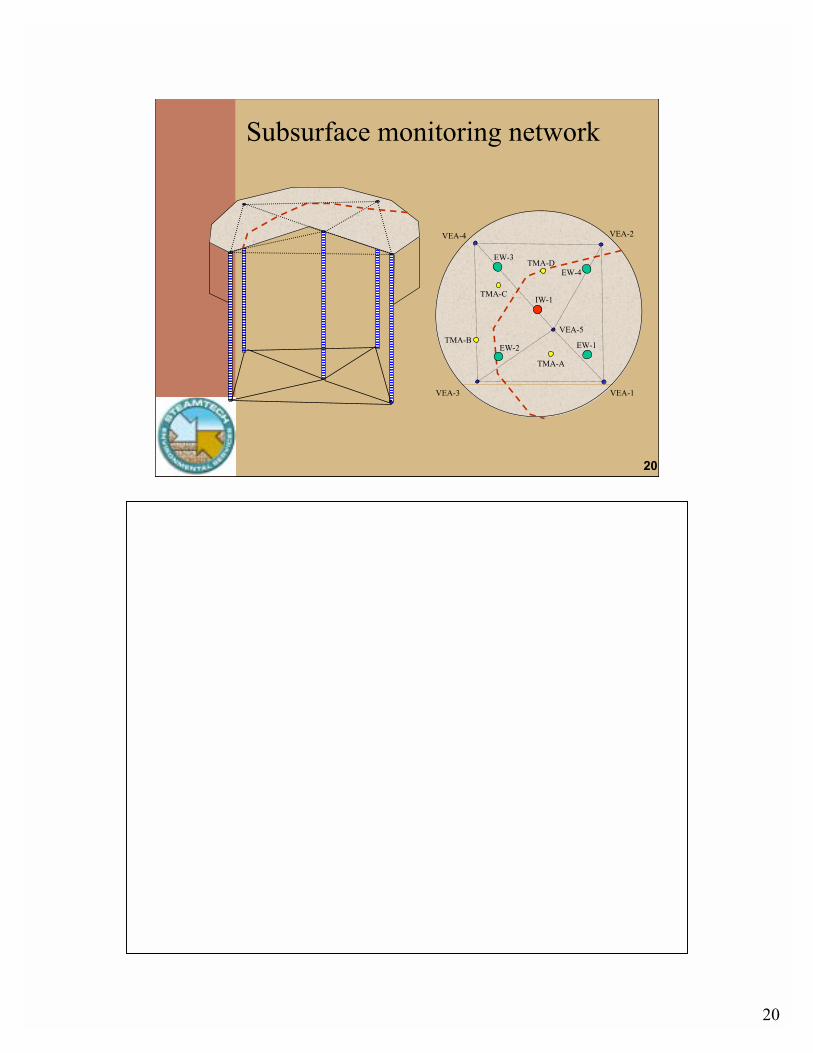
! Detailed subsurface monitoring (temperature and electrical resistance tomography)
8
8
Extraction well with Hawthorn electrode
(EE)
Clay
Sand
Area A steam injection well with Hawthorn electrode (SE)
Perimeter steam injection wells (SI) Steam
Electrode
Electrode
Deep electrode
(DE)
Well types
9
9
Preliminary results, Edwards AFB
Acknowledgments to:
� Stephen Watts, Edwards AFB project manager
� Dave Leeson, AFCEE
� Scott Palmer, Earth Tech project manager
� Gregg Crisp, site manager and operator
� Layi Oyelowo, Edwards AFB
Results are preliminary, conclusions have not been published or confirmed by the above persons
10
10
Fractured granite(quartz monzonite)
11
11
Objectives/questions�Will SER be effective for removal of VOCs from fractured rock atEdwards AFB?
�How is the DNAPL mobilized and extracted?
�What are the ultimate VOC cleanup levels that can be expected atEdwards AFB using SER?
�How rapidly will the steam heat Site 61 at Edwards AFB?
�How should steam injection and extraction well-fields be designed for optimum performance at Edwards AFB?
�What is the optimal steam injection and extraction strategy for DNAPL in fractured rock at Edwards AFB?
�How long will the site stay hot after completion of the steaming?
12
12
Weathered zone
Fractured granite
30 ft
Hydrogeology
13
13
???
TCE distribution
14
14
Vertical distribution of contaminants before operations: PID readings on cores
0
200
400
600
800
1,000
1,200
1,400
1,600
1,800
2,000
0 5 10 15 20 25 30 35Depth below grade (ft)
PID
read
ing
(ppm
)B13 B14
15
15
Extraction and steam injection wells
16
16
Injection well
design
0
10
20
60
50
40
30
High-temperature grout (9 ft)
High-temperature grout (5 ft)
High-temperature grout (5 ft)
Coarse sand/gravel (9 ft)
Fine sand (3 ft)
#1/20 Fine sand (3 ft)
Fine sand (2 ft)
Fine sand (2 ft)
Coarse sand/gravel (13 ft)
Coarse sand/gravel (11 ft)
Wea
ther
ed z
one
(app
roxi
mat
ely
35 ft
)Fr
esh
bedr
ock
43
34
23
12
9
52
45
65
26
31
50
#1/20 Fine sand (3 ft)
Deep injection screen (58 to 60 ft)
Middle injection screen (38 to 40 ft)
Top injection screen (18 to 20 ft)
Dep
th b
elow
gra
de (f
t)
Note: Thermocouples were attached at 5 ft intervals from 5 ft below grade to 45 ft below grade, and at 49 ft, 52 ft, 55 ft and 60 ft.
17
1717
18
1818
19
19
Strategy
Vacuum test: Vapor capture radius ~ 80 ft
Initially steam injection deep only, extraction shallow