Predation and Production by Salmonine Fishes in Lake Michigan, 197848' Donald J. Stewart and Myriam lbarra Research Center, King Hall, SUNY College at Bswego, Oswego, NY 132 16, USA and 256 lldick Hall, SUNY College of Environmental Science and Forestry, Syracuse, MY 132 10, USA Stewart, D. I., and Me I barra. 1 991 . Predation and production by salmonine fishes in hake Michigan, 1 978-88. Can. 8. Fish. Aquat. Sci. 48: 909-922. A marked decline sf alewife (Alosa pseerhharengers) in Lake Michigan during 1981-83 led to diet shifts by coho (Oncorhynchus kisutch) and chinook salmon ( 0 . tshawytscha) from feeding primarily on large alewife to eating proportionately more immature alewives and other prey. Diets of lake trout (Salvelinersnamaycush)did not change greatly during that period. Population biomass conversion efficiency averaged 24.5% for coho and 16.6% for lake trout. Chinook salmon suffered an apparent 20% decline in gross conversion efficiency of biomass (25.1 to 20.8%) and a 25% decline in average weight of sport-caught fish. We infer that chinook salmon growth was inhibited by insufficient forage available to them. A simulation of chinook salmon feeding on bloater (Coregonus hoyi) at $"C suggested that such behavior could lead to further declines in growth rates. Extension of modeling results to include approximations for brown trout (Salmo trutta) and rainbow trout ( 0 . mykiss) revealed peaks in total annual salmonine predation of 71 000 t in 1983 and 76 000 t in 1987. The alewife was 70% of all prey eaten by salmonilnes in 1987-88. hakewide gross production by salmonines was 1.5 300 t (or 0.27 in 1987. Ratios of annual gross production to average monthly population biomass were 1.6 for chinook, 1.1 5 for coho, and only 0.6 for lake trout. llne chute importante de la population de gaspareau (Alosa pseudoharengus) dans Be lac Michigan de 1981 3 1983 a fait en sorte que les saumons coho (Oncorhynchus kisutch) et quinnat (0. tshawytscha) y ont rnodifi6 leur r6gime alimentaire : se nourrissant principalement de gaspareau de grande taille, ils sont passes $ une plus forte proportion de gaspareaux immatures et d'autres proies. Le regime des touladis (Salvelinus namaycush) n'a pas beaucoup change durant cette p6riode. Les rendements moyens de la bioconversion chez les populations de coho et de touladi etaient de 24,s et 16,6 %, respectivernent. Le renderarent brut de bioconversion du quinnat a connu une chute apparente de 20 % (de 25,1 2 20,8 %), et le poids des quinnats pecks6s par les Pcheurs sportifs etaient en moyenne de 25 % inf6rieur. Nous en csncluons que la croissance des quinnats a kt6 inhibee en raison de ressources alimentaires insuffisantes. Un mod$le simuiant la croissance du saumon quinnat soumis 2 un rkgime de saumon de fumage (Coregonus hoyi) 2 uwe temperature de 8°C a montr6 que dans de telles conditions, la croissance du quinnat pourrait &re davantage ralentie. Avec des approximations derivees des resultats de ce mod68e pour la truite brune (Salmo trutta) et la truite arc-en-ciel (0. mykiss), on obtient des valeurs maximales de predation annuelle totale par les salmonides de 71 080 t en 1983 et de 76 000 t en 1987. ke gaspareau reprksentait 70 % de toutes les proies consomm6es par les salmonides pour la periode 1987-1 988. Pour Ifensemble du lac, la production brute des salmonid6s etait de 15 300 t (ou 0,27 g-m-') en 1987. kes rapports entre la production brute annuelle et la biomasse moyenne mensuelle des populations etaient de 1,6 pour Be quinnat, 1 ,I 5 pour le coho et seulement 0,6 pour le touladi. Received lanuary 30, 7 990 Accepted November 6, 1990 (JA744) T he highly valued, artificially maintained Pacific salmon populations of Lake Michigan appear to be undergoing striking changes. Large chinook salmon (Qncorhynchus a&zcrwytscha)experienced spring die-offs in southern Lake Michigan during 1988 and 1989 (D. Brazo, Indiana Depart- ment of Natural Resources, Michigan City, IN, pers. comm.). Sport angler harvests and returns of adult Pacific salmon to weirs in Michigan also declined recently, suggesting an increase in mortality rates (R. Hay, Michigan Department of Natural Resources, Cadillac, MI, pers. cornran.). Average weight of chi- "is paper is one of a series originating from a special session of the 32nd Conference on Great Lakes Research (Madison, WI, May 30 - June 2, 1989) entitled "Population dynamics of large lake eco- systems: patterns, processes, and interlake comparisons. " R e p le 30 janvier 1990 Accept6 %e 6 novembre 1990 nook salmon in the Wisconsin sport catch has declined since the early 1980's (see below). These changes have led to reduced economic returns to sport fishery support services, discontent among sport anglers (Huggler 1989), and pressure to compen- sate by increasing salmonine stocking rates and reducing com- mercial harvest of prey fish stocks (Keller et al. 1989). The prey fish assemblage in Lake Michigan has changed dra- matically over the past decade, shifting from one strongly dom- inated by alewife (Alosa pseudoharengus) to one dominated by bloater (Caregonus hoyi) (Jude and Tesar 1985; WeHHs 1985; Kitchell and Crowder 1986; Eck and Wells 1987). In spite of those changes, alewife remain the primary prey of the Pacific salmon (Stewart et al. 1981 ; Hager 1984; Eck and Brown 1985; Jude et al- 1987). A s h q decline in alewife in 1981-83 and their subsequent failure to recover to biomass levels of the mid- CQ~. d. Fish. Aqlacpt. Sci., VQ&. 48, 8991 909
Transcript
Predation and Production by Salmonine Fishes in Lake Michigan, 197848'
Donald J. Stewart and Myriam lbarra Research Center, King Hall, SUNY College at Bswego, Oswego, NY 132 16, USA
and 256 lldick Hall, SUNY College of Environmental Science and Forestry, Syracuse, MY 132 10, USA
Stewart, D. I., and Me I barra. 1 991 . Predation and production by salmonine fishes in hake Michigan, 1 978-88. Can. 8 . Fish. Aquat. Sci. 48: 909-922.
A marked decline sf alewife (Alosa pseerhharengers) in Lake Michigan during 1981-83 led to diet shifts by coho (Oncorhynchus kisutch) and chinook salmon (0 . tshawytscha) from feeding primarily on large alewife to eating proportionately more immature alewives and other prey. Diets of lake trout (Salveliners namaycush) did not change greatly during that period. Population biomass conversion efficiency averaged 24.5% for coho and 16.6% for lake trout. Chinook salmon suffered an apparent 20% decline in gross conversion efficiency of biomass (25.1 to 20.8%) and a 25% decline in average weight of sport-caught fish. We infer that chinook salmon growth was inhibited by insufficient forage available to them. A simulation of chinook salmon feeding on bloater (Coregonus hoyi) at $"C suggested that such behavior could lead to further declines in growth rates. Extension of modeling results to include approximations for brown trout (Salmo trutta) and rainbow trout (0 . mykiss) revealed peaks in total annual salmonine predation of 71 000 t in 1983 and 76 000 t in 1987. The alewife was 70% of all prey eaten by salmonilnes in 1987-88. hakewide gross production by salmonines was 1.5 300 t (or 0.27 in 1987. Ratios of annual gross production to average monthly population biomass were 1.6 for chinook, 1.1 5 for coho, and only 0.6 for lake trout.
l lne chute importante de la population de gaspareau (Alosa pseudoharengus) dans Be lac Michigan de 1981 3 1983 a fait en sorte que les saumons coho (Oncorhynchus kisutch) et quinnat (0 . tshawytscha) y ont rnodifi6 leur r6gime alimentaire : se nourrissant principalement de gaspareau de grande taille, ils sont passes $ une plus forte proportion de gaspareaux immatures et d'autres proies. Le regime des touladis (Salvelinus namaycush) n'a pas beaucoup change durant cette p6riode. Les rendements moyens de la bioconversion chez les populations de coho et de touladi etaient de 24,s et 16,6 %, respectivernent. Le renderarent brut de bioconversion du quinnat a connu une chute apparente de 20 % (de 25,1 2 20,8 %), et le poids des quinnats pecks6s par les Pcheurs sportifs etaient en moyenne de 25 % inf6rieur. Nous en csncluons que la croissance des quinnats a kt6 inhibee en raison de ressources alimentaires insuffisantes. Un mod$le simuiant la croissance du saumon quinnat soumis 2 un rkgime de saumon de fumage (Coregonus hoyi) 2 uwe temperature de 8°C a montr6 que dans de telles conditions, la croissance du quinnat pourrait &re davantage ralentie. Avec des approximations derivees des resultats de ce mod68e pour la truite brune (Salmo trutta) et la truite arc-en-ciel (0. mykiss), on obtient des valeurs maximales de predation annuelle totale par les salmonides de 71 080 t en 1983 et de 76 000 t en 1987. ke gaspareau reprksentait 70 % de toutes les proies consomm6es par les salmonides pour la periode 1987-1 988. Pour Ifensemble du lac, la production brute des salmonid6s etait de 15 300 t (ou 0,27 g-m-') en 1987. kes rapports entre la production brute annuelle et la biomasse moyenne mensuelle des populations etaient de 1,6 pour Be quinnat, 1 ,I 5 pour le coho et seulement 0,6 pour le touladi.
Received lanuary 30, 7 990 Accepted November 6, 1990 (JA744)
T he highly valued, artificially maintained Pacific salmon populations of Lake Michigan appear to be undergoing striking changes. Large chinook salmon (Qncorhynchus
a&zcrwytscha) experienced spring die-offs in southern Lake Michigan during 1988 and 1989 (D. Brazo, Indiana Depart- ment of Natural Resources, Michigan City, IN, pers. comm.). Sport angler harvests and returns of adult Pacific salmon to weirs in Michigan also declined recently, suggesting an increase in mortality rates (R. Hay, Michigan Department of Natural Resources, Cadillac, MI, pers. cornran.). Average weight of chi-
"is paper is one of a series originating from a special session of the 32nd Conference on Great Lakes Research (Madison, WI, May 30 - June 2, 1989) entitled "Population dynamics of large lake eco- systems: patterns, processes, and interlake comparisons. "
R e p le 30 janvier 1990 Accept6 %e 6 novembre 1990
nook salmon in the Wisconsin sport catch has declined since the early 1980's (see below). These changes have led to reduced economic returns to sport fishery support services, discontent among sport anglers (Huggler 1989), and pressure to compen- sate by increasing salmonine stocking rates and reducing com- mercial harvest of prey fish stocks (Keller et al. 1989).
The prey fish assemblage in Lake Michigan has changed dra- matically over the past decade, shifting from one strongly dom- inated by alewife (Alosa pseudoharengus) to one dominated by bloater (Caregonus hoyi) (Jude and Tesar 1985; WeHHs 1985; Kitchell and Crowder 1986; Eck and Wells 1987). In spite o f those changes, alewife remain the primary prey of the Pacific salmon (Stewart et al. 198 1 ; Hager 1984; Eck and Brown 1985; Jude et al- 1987). A s h q decline in alewife in 1981-83 and their subsequent failure to recover to biomass levels of the mid-
C Q ~ . d. Fish. Aqlacpt. Sci., VQ&. 48, 8991 909
1970's may explain, in part, present difficulties of the salmon. Uncertainties remain, however, because of incomplete quan- tification of system-wide prey production compared with sal- monine predation. What is the carrying capacity of Lake Mich- igm for salm~nine fishes? How has that changed in relation to recent prey fish population dynamics? Most likely the inter- actions we complex and nonlineara Recent synthesis papers emphasize the importance of managing Great M e s fishes with an ecosystem perspective (Spmgler et al. 198'7; Steedman and Regier 1987) and limitations of the infomation available to accomplish that task (Lewis et d. 198'7; Leach et d. 1987). This paper provides a whole-system perspective on salrnonine predation and production as a contribution towads the infor- mation base needed to understand the dynamics of Great Lakes ecosystems.
Objectives of this study are to estimate ((I total sdmonine predation pressure on Lake Michigan prey populations for 1978-88 through a modeling synthesis of available data, (2) the effects of recent diet changes upon population conversion effi- ciencies for coho salmon (Oncor&lg)nchus kisutch), chinook salmon, and lake trout (Salvelinus namaycush), and (3) total sdmonine produc~on and production to mean biomass ratios in Lake Michigan. Our intent is to update md extend the anal- yses of Stewart et al. (198 I), Eck and Brown (1985), md Kitch- ell and Crowder (1986) though 1988 to provide a solid foun- dation of best-available predation and production estimates.
al. 1988) and evaluation of biomass size spectrum theory (Spmles et al. 199%).
Methods
We modeled the bioenergetics of lake tmut using the energy balance equations md parameters of Stewart et al. (1983). Models for coho salmon and chinook salmon differed from that for lake trout but resembled a model for sockeye salmon (Bncorhynchus nerka) (Beauchamp et al. 1989) in that we mod- eled temperature dependence of maximum consumption using the function of Thornton md Lessern (1978). Models for all three species were implemented using the microcomputer program sf Hewett and Johnson (1987). A similar model for sockeye salmon was csmsborated by independent estimates of feeding rates in three different systems (Beauchamp et al. 1989). Physiological parameters used for coho and chinook salmon (Table I) are the same as those used by Stewat et a%. (1981) and Kitchell and Hewett (1987). Parameters for tem- perature dependence of maximum consumption were estimated by hand-fitting the functions of Thornton and Lessem (1978) to laboratory observations on coho salmon (Fig. 1). In the fol- lowing sections, we provide additional documentation of data sources md assumptions for them81 distribution, energy dew- sity , swimming speed, population numbers, survival and growth rates, and diet composition.
These contribute to a comparison of salmonine predation m d alewife production (Brandt et al. 1991), thereby providing a Distributions
basis for making informed management decisions (e.8. Mmeger Juvenile coho and c8minmk salmon both preferred tempem- and Dehring 1986; Ney 1998). Our results can dso facilitate tures of 12-14OC when exposed to a vertical gradient in the system-level modeling of food web dynamics (e.g. Scavia et laboratory (Brett 1952). Jude et al. (1 987) found that juvenile
TABLE 1 . SymbIs and estimated physiological parameter values used to implement energetics models for coho and chinook salmon. Parameters we for equations in Stewart et d. (1983) and Thornton and k s s e m 1978; 8,, and BY,,).
Parameter Symbol Pxmeter description value References
Consumption, C,,
Intercept: C,, at (8, + 6,112
Coefficient: Cn3, vs. weight Temperature for K1 Temperature for K2 Temperature for K3 Temperature for K4 Proportion C,, at 6, Proportion C,, at 8,,8, & o ~ ~ % ~ o H I cm, at e4
Metabolism, R
Intercept: R Coefficient: R vs. weight Coefficient: R vs. temperature Coefficient: R vs. swimming s p e d
Swimming speed, U
Intercept: U Coefficient: U %IS. weight
Coefficient: U vs. tempratanre
Beauchamp et al. 1989; from Brett 197 1 Beauchamp et d. 1989; from Davis and Wmen 1968;
EdsaHI et A. 1974 Stewart 1980; from Edsall et al. 1974 Stewart 1980; from &isall et al. 1974 Stewart 1980; from Edsall et al. 1974 Stewart 1980; from Edsdl et al. 19'74 Stewart 1980; from EdsaHH et al. I974 Stewat 1988; from Edsall et al. 1974 Stewart 1980; from Edsall et al. 1974
Stewart 1980; from Rao 1968, 1971 Stews% 1980; from Rao 1968, 1971 Stewart 1980; from Wao 1968, 1971 Stewat 1980; from Rao 1968, 1971
Stewart 1980; from Wiehs 1973 Beauchamp et al. 1989 Beauchamp et d. 1989; from Griffiths and Alderdice
6972; Glow and McInemey 1977
910 Can. 9. Fish. Aqua?. Scd., Vok. 48, 1991
COHO SALMON
4 THORNTON & LESSEM (1978) MODEL
TEMPERATURE
PIG. 1. Temperature dependence of maximum consumption for coho salmon, comparing predicted values h m Thornton and Eessem's (1978) model with observed values from EdsdH et d. (1974).
salmonines other than lake trout occupy the nearshore zone of Lake Michigan where they feed on surface insects at temper- atures often exceeding 20°C. Based on radiotagged adult fishes tracked in Lake Ontario during spring and summer, coho salmon occupied temperatures of 9.3 & 2.1"C (n = 16) and chinook salmon occupied 1 1.1 & 1.9"C (n = 7) (Haynes and Keleher 1986). Those differences were not significant. Haynes md Keleher (1986) did note, however, that coho salmon tended to occupy nearshore and surface waters more than chinook. Dur- ing the period of midsummer stratification in Lake Ontario, chinook salmon were found in or just above the thermocline (average 14.4"C, Olson et al. 1988). We modeled both species using midlake epilimnion water temperatures from Lake Mich- igan (Ayers 1962) and the assumption that the salmon would occupy the w m e s t waters available up to but not exceeding their preferred temperature (see Stewart et aS. 1983, fig. 4, for example). Based on the foregoing information, we assumed a preference of 12°C for coho, 11°C for age 1 + and older chi- nook, and 18°C for age 0 + chinook.
Energy Density
Seasonally varying energy density of alewife in the salmon- ine diets was modeled based on Stewart and Binkowski (1986, fig. 3), and that for other prey types follows Stewart et al. (1983). The following relationships based on simple linear regressions were used to approximate weight dependence of energy density in Lake Michigan coho salmon (Stewart 1980). From data for coho salmon (Reinert and Bergman 1974.), we estimated
where E is percentage fat content of the entire fresh fish and W is wet weight (grams). From data on sockeye salmon (Brett et al. 1969). we estimated
where Q is energy density (joules per gram). Combining equa- tions 1 and 2, we get
Equation 3 also was applied to chinook salmon up to 4 kg. We assumed that chinook salmon larger than 4 kg would increase their fat and energy content per unit weight at a slower rate, resembling the pattern observed for lake trout (Stewart et al. 1983). Large chinook salmon can have 7-16% fat in their mus- cles (Green 19 13; Stansby 1976), which would typically be less thm in the fish as a whole. At 4 kg, whole-fish fat content of a Lake Michigan coho salmon approaches 14% (Reinert and Bergman 1974). To allow for additional, modest increases of fat in very large chinook salmon, we assumed a value of 20% fat for a 10-kg chinook. Under that assumption, energy density at 10 kg might approach 12 866 Jag - ' , and the linear increase between 4. and 10 kg would be
Boisclair and Leggett (1989) suggested that consumption estimates based on bioenergetics models of actively foraging fishes may be in error if in situ measures of activity have not been made. They conceded, however, that an approach like that used here may be best for piscivorous fishes that consume large prey which require long digestion times. The submodel for swimming speed (Stewart et al. 1983; Beauchamp et al. 1989) and associated parameters (Table 1) were based on a synthesis of theoretical and empirical estimates of weight and tempera- ture dependence of swimming speed for various salmonines (Stewart 1980). Pacific salmon in particular are amenable to such a model because they have evolved to swim long distances in effectively bottomless habitat searching for active, pelagic Prey
Field observations on radio-tagged salmonines in Lake Ontario indicated swimming speeds (centimetres per second) of 17 for 1.4- to 5.0-kg coho salmon, 13 for 1.8- to 9.0-kg chinook salmon, and 14 for 1.4- to 5.5-kg rainbow trout (Oncorhynchus mykiss) (Haynes and Keleher 1986; Haynes et al. 1986). These field estimates, based on relocations of fishes made at 24- to 72-h intervals, should represent minimum vaP- ues. Predictions of our model for fishes at comparable weights and temperatures (9.3-1 l.l°C) range from 36 to 49 cm-s - ' and correspond to active metabolic rates of 2.3-3.1 times standard metabolism.
Salmonine Populations
Salmonine stocking data (Table 2) were compiled from reports and personal communications from M. Hansen (Wis- consin Department of Natural Resources, Madison, WI), B. McClay (Michigan Department of Natural Resources, Lansing, MI), R. Hess (Illinois Department of Conservation, Chicago, IL), D. Brazo (Indiana Department of Natural Resources, Michigan City, IN), and R. Eshenroder (Great Lakes Fishery Commission, Ann Arbor, MI). We corrected the numbers of lake trout stocked for overwinter mortalities of fall fingerlings and for those stocked at depths where alewife are uncommon (Table 2). The survival rate assumed for all age classes of lake trout was 52% ((Eck and Brown 1985), in contrast with Stewart et al. (1981, 1983) who assumed survival of 63% for the f is t four years, and 45.3% for the older age classes (following Rybicki and Keller 1978). Survival rates for Pacific salmon (Fig. 2) follow Stewart et al. (198 1).
Can. J . Fish. Aqmt. Sci., Vob. 48, 1991
TABLE 2. Numbers stocked md estimated populations of salmonine fishes in Lake Michigan. Simulations for lake &out, coho salmon, and chinook salmon were based on ppuHations estimated from numbers stocked and mortality assumptions given in the text. Lake %rout yearlings include 4 1.7% of previous yea's fall fingerlings (e . g . Ydg . equiv . , below), a correction to account for overwinter mortality of the fa18 fingerlings (Elrod et al. 1988). We excluded ""Beep reef" lake trout that were stocked on the Milwaukee Reef complex where diets and growth rates we noticeably different from those of shdlow-dwelling fishes (M. Miller, Wisconsin Department of Natural Resources, Madison, WI, p r s . co rn . ) . Wainbow and brown trout yewling numbers also include yeding equivalents approximated as 41.7% of previous year's fall fingerlings.
Numbers stocked (thousands)
Lake trout Rainbow trout
Brown trout Population
Yrlg. Deep Coho Chinook Yrlg. Yrlg. Coho Chinook Lake Year Yearlings equiv. reef salmon salmon Y e x h g s equiv. Yealings eqniv. salmon salmon &out
12 24 38 MONTHS AFTER STOCKING
FK. 2. Compwison of estimated survivorship curves for coho and chinook salm~n in, Lake Michigan. Proportion surviving various. hta- vals are from Stewart et aB. (1981, taMe 3).
We extended our modeling estimates of predation and pro- duction to get approximatismas for the whole-lake sdmonine assemblage by assuming that atontributions by m individual rainbow trout OH brown trout (Sakmo sum) were approximately equal tts the average of t h s e for the three modeled salrnowines (Stewat et al. 1981). We used stocked numbers of yearling rainbow and brown trout, including 41.7% of previous yea's fall fingerlings (Table 2). Using the lake trout correction factor for fail fingerlings is arbitrary, but perhaps is an impmvement over use of the saw numbers stock We made no attempt to evaluate predation by naturally spawned sdmowines because data were too incomplete.
Growth Rates
on 1 July for typical 1 e trout simulated by 3, based on Rybicki and Keller 1
a g d somewhat greater than weights reported by Eck (1985) for fish on 15 May. We f o ~ d the g to fit Eck and Brown's (1985) weights for 1% ratio0 (as a p~~port ion of maximum ration) md then used the lowered rations in the model to predict weights oa 1 July for each age class. That prwedure revealed that weights repfled by Eck a d Brown (1985) averaged 79% of those used by Stew- art et ai. (1 983). For our analyses, we lowered weights 21 % to approximate the slower growth rates observed by Eck and
Cm. J . Fish. A q ~ a t . Sci., VQL 48, 1991
MONTHS AFTER STOCKBHG
FIG. 3. Compafison of predicted weight-at-age for different @owth foms of coho and chinook salmon in Lake Michigan during 1978- 81. Weights at the end of various intervals are from Stewart et al. (198 1 , table 3).
Brown (1985). Analyses of mean weight of lake trout in the Wisconsin sport catch by Hmsen (1986) and of our own weight data suggest an increase in recent years. For example, average weight was about 3.17 kg in 1983 (n = 296), 3.87 in 1985 (n = 177), and 3.60 in 1987 (n = 79). That apparent trend is likely due to more older fish in the population or retention by anglers of fewer small fish. Keller et al. (1989) noted that lake trout growth has declined in southern Lake Michigan but remained reasonably stable in central and northern parts of the lake. If that pattern applies lakewide, hen our predation esti- mates for lake trout would be less than actual values.
For simulations of coho and chinook salmon in 1978-82 (Fig. 3), we used weights-at-age from Stewart et al. (1981). To evaluate trends in body weight following the 1981-83 ale- wife decline, we calculated mean weight of sport-caught fishes in western Lake Michigan for each yea from 1982 through 1988. That analysis revealed that weights of coho salmon in 1983,1985, and 1987 were not different from 1982, but weights in 1984,1986, a d 1988 averaged about 82% of those in during the other four years (n = 1774 over the 7-yr period). We thus lowered coho weights-at-age from Stewart et al. (1981) by 18% for the thee slow-growth years. We did a similar mdysis for chinook salmon (n = 1098 over the 7-yr period) but used only June and July data to remove apparent biases due to seasonal differences in size structure of the catch in different years. That analysis revealed that 1983 was similar to 1982 (average weight for those two yeas, 5.9 kg), weights in 1987 were 86% of 1982, and weights in 1984-86 and 1988 were all about 7 1 % of 1982. We lowered weights-at-age for chinook salmon in the 1984-88 simulations by the appropriate percentage reductions of nomind values in Stewart et al. (198 1).
Diets
197841 Information on proportional diet composition for Lake Mich-
igan salmonines (Tables 3-6) can be divided into the periods
TABLE 3. PropTtional diet eornpsition (P, by wet weight; subscripts are IW for invertebrates, 0TI-l for fish other &an alewife, SMA for alewife under 8 g, and EGA for alewife greater than or equal to 8 g) for juvenile salmonines in M e Michigan during various times of the year. Estimates are based on Stewart et al0 (1981,1983), with chinook and coho diets adjusted to reflect results of Jude et al. (1987) and lake trout diets for age 2 4- adjusted for winter data of Eck md Wells (1986; i.e. simulation days 168 and 274). Simulation day 1 is 1 May for chinook salmon, 1 April for coho salmon, and 1 July for lake trout.
Simulation days Food type
Chinook age 8 4- 1
62 124 124 124 124 124 124 124 124
Coho sdmow, age 1 + 1
154
M e trout, age 1 + 1
124 154 336
Lake trout, age 2 + 1
124 154 169 2'75 2'75 275 275 275 275 275 2'75
"Values for each day in this simulation internal were estimated by linear interpolation between the tabled values for this interval and those of the preceding interval. For chinook salmon age 0 4- and lake trout age 2 + , data for intervals ending om day 365 of years 1982-88 me from day 1 of the next older age group (Tables 4 and 6).
1978-8 1 afld 1982-88. Diet data for 1978-8 1 are fmm Stewart et al. (198 1 , 1983) with modifications to reflect more recently published data. For age 0 + chinook and age 1 + coho salmon, diets (Table 3) were adgusted to include higher proportions of invertebrates (PrNv) and fish other than alewife (Po,,), with corresponding reductions in proportions of small (P,,,, <8 .O g) afld large (P,,,, 3 8 .O g) alewife, reflecting the results of Jude et al. (1987). For lake trout, diets for age 1 9 (Table 3) were unchanged from Stewart et al. (1983), but those for ages 2 + to 9 + were adjusted to include data on winter diets from Eck and Wells (1986). Thus, we used a single diet table for each salmonine species for the years 1978-8 1 ; between-year differences in predation rates for those years only reflect changes in population structure.
Can. 4. Fish. Aquat. Sci., Vol. 48, 1991
1982438 igm (e.g. Mager 1984). We grouped data on diet composition SimuBations for each year from 1982 to 19 8 were based on of individual predator fishes by salmonine weights correspond-
extensive new data fmm angler-caught sahonines taken ing to age classes from Stewart et al. (1981, 1983) and then ay md early September dong western Lake Mich- calculated m average diet composition for each month of each
TABLE 4. Proprtiond diet composition (P, by wet weight; subscripts are as given in Table 3) for Lake Michigan chinook salmon at various times sf the year. Simulation day 1 is 1 May, and age 3 + of a simulation ends on day 214 when the salmon spawn and die. Estimates with
nding sample sizes (n) are from angler-caught fishes along western
Food type
Simulation days Age 1 9 Age 2 + Age 3 9
"Data from 1984. 'Talues for each day in this simulation internal were estimated by h e a r interpolation between the tabled vdues for this internal md those
of the preceding internal. "Data from day 1 of age 2 4- . "1lData from day H of "Data from day 123 of age 3 4- applied though find day 214. Qata from 1985. gData from 1986.
Can. J . Fish. Aquat. Sei., Vo&. 48, 1991
TABLE 5. Proprtiond diet composition ( P , by wet weight; subscripts are as given in Table 3 ) for Lake Michigan coho salmon at vahious times of the year. Simulation day 1 is 1 April, md each simulation ends on day 244 when the salmon spawn and die. Estimates with cor- responding sample sizes (m) are from angler-caught age 2 + fish h m western Lake Michigan.
Simulation Food Food days type Q'F
"Data f r ~ m day 62 of 1982. %ata from 1986. "Data from 1985.
age gmup (Tables 4-6). In some cases (see below), it was nec- essary to pool data to minimize the number of small smples. The resulting diet tables represent our best effort to obtain a detailed assessment of tempord patterns without undue reliance on small samples. The sport harvest included few juvenile sd- monines, so the diet data in Table 3 were used for 1982-88.
Chinook salmon diets were based on 2107 nonempty stom- achs, with annual smples ranging from 103 to 628 fish (Table 4). A preliminary review of the data indicated that diets in 1983, 1985, and 1987 tended to be similar in having rela- tively lower proportions of large alewife. We therefore chose to fill in for missing or small smples by extrapolation between alternate yeas. For example, data from spring 1985 were used in place of small smples from spring 1987, and data from 1986 replaced some small smples from I988 (Table 4). Winter diets were approximated by linear interpolation between the end of August (day 123) and 1 May of the next older age group. In most years, diets in August were more diverse thm those for May-July (i .e. proportionately more fish other than alewife), perhaps due to seasonal offshore movements and recruitment of young for various species to the chinook salmon habitat. During winter, a diverse prey assemblage should become avail- able as the lake cools and mixes.
Coho salmon diets were based on 1560 nowempty stomachs, with annual samples ranging from 105 to 433 (Table 5). We
extrapolated data for May back to 1 Apd and data for August to the end of the spawning season (simulation day 244,30 Sep- tember). Missing data for May 1382 were extrapolated from June of that year. Missing or small samples from August 1984 and 1987 were filled in with data from 1986 and 1985, respec- tively, because of apparent similarities between patterns of other diet data for those alternate years.
Lake trout diets were based on 1135 nonempty stomachs, with annual samples ranging from 40 to 293 (Table 6). Because of the smaller samples and greater number of age classes, we had to pool data into only three weight groups (corresponding to ages 3 4 , ages 5 4 , and a1 larger fish). We further pooled data for May-July within each size group, but maintained the August data separate because they were typically the most dis- tinctive. Altemate-year patterns of diet similarity were not evi- dent for lake trout, so extrapolations were made as necessary from adjacent years or, in 1987, from a lager size class.
Relative Predation
To compare relative predatory impact of coho and chinook salmon and lake trout under various conditions, we ran simu- lations for each species starting with 1 million fish in each case as in Stewart et al. (1981). Results for each species represent the annual predation by the population that would result from many years of stocking exactly 1 million fingerlings each year. Results also represent the effect of stocking 1 million fish md summing their consumption until they have all died. For each of the three species, we ran one simulation representing typical conditions for the years 1978-8 1. To represent conditions after the 1981-83 alewife decline, we averaged diet and predator weight data across years. For coho salmon, we ran one simu- lation with diet and weights typical of 1984, 1986, and 1988 and another simulation for conditions typical of 1983, 1985, and 1987. For chinook salmon, we averaged diet and predator weights for 1984-88, and for lake trout, we averaged diets only for 1983-88.
Moreover, two possible future scenarios were simulated. In the first one, we assumed that chinook salmon would feed exclusively on bloater, now the most abundant species in Lake Michigan. Bloater live in relatively deep water, so the maxi- mum s u m e r temperature for chinook would be about 8°C (Brandt et al. 1991) versus 11°C in our nominal simulations. For this simulation, we used the same ration (P, proportion of maximum possible) as for our 1987 nominal simulation, but the lower temperature reduced consumption and growth potential. In the second hypothetical scenario, we assumed that survival of lake trout increased from 52 to 60% after age 4, in accord- ance with existing management gods (Rybicki 1983).
Modeling Results and Discsussion
Diet Composition
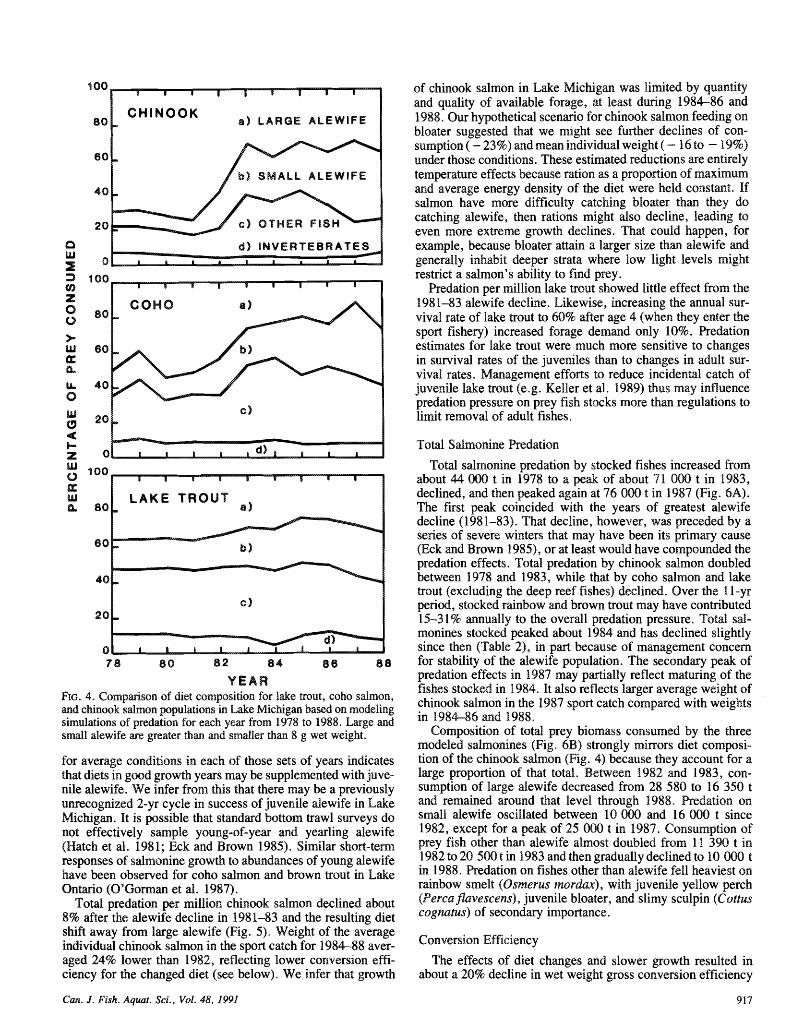
Integration of the available diet information through modeling simulations for each year reveals some striking patterns (Fig. 4). Diets of coho and chinook salmon shifted from heavy reliance on large alewife in the late 1970's to more equal utilization of large alewife, small alewife, and other fishes in the mid-1980's. From 1984 to 1986, fish other than alewife increased in the diet, but in 1987 and 1988, the Pacific salmon substituted juvenile alewife for other fish in their diet. In 1987- 88, total alewife in their diets was similar to the 19%0's, but relative percentage of large alewife in the diet has remained at
Can. J . F t h . Aquwb. Sci., Vol. 48, 1991
TABLE 6. Proportional diet composition ( P , by wet weight; subscripts are as given in Table 3) for Lake Michigan lake trout at various times of the yea. Simulation day 1 is 1 July. Estimates with corresponding sample sizes (n) a e from mgler-caught fishes from western Lake Michigan. Winter data for days 168 and 274 (Eck and WeBBs 1986) were applied to all yeas from 1978 to 1988 because they were the only winter data available to us. In each year from 1982 to 1988, data for days 1-31 (July) were the same as those for days 305-365 (May and June) because estimates are of poled data for those three months. See values for 1982 for an example.
Hood type
Simulation days Ages 3 + m d 4 + Ages 5 + md 6 + Ages 7 + to 9 +
Start End n
"Data from 1983. bValues for each day in this simulation interval were estimated by linear in8eqoBation between the tabled values for this interval md those
of the preceding interval. 'Data for age 3 -+ from Eck and Wells (1986). 'Data for age 5 + from Eck and Wells (1986). "Data for age 4 + from Eek and Wells (1986). fData for age 6 + from Eck and Wells (1986). Qata same as days 1-3 1 for these ages. "ata from ages 5 + and 6 + for 1987. 'Data from 1987 for these ages.
about 3W0% since 1983. Our results for 198'3-88 suggest individuals under various conditions (Fig. 5). C o m p ~ n g results possible strong year classes of alewife in 1986 and 1987. Diets of our simulations for 1978-8 1 with those of Stewart et d. sf lake tmuf have remained relatively stable throughout this (1981) reveals only minor differences for coho and chinook period (Fig. 4). Prior to 1983, lake trout generally had a more salmon, but a 47% decline in relative predation by the lake bout diverse diet with less reliance on large alewife than the Pacific population (Fig. 5) . Decline in the modeled lake trout predation salmon (Stewart et al. 198 1, 1983: Eck and Brown 1985; Jude was due largely to changes in growth and mortality assumptions et al. 1987). based on Eck and Brown (1985). If growth did not decline in
the central and northern parts of the lake (Keller et al. 1989),
Relative Predation Rates then our estimates for lake trout predation would be low. Lake Michigan coho salmon showed an interesting oscilla-
The temporal trends illustrated in Fig. 4 were influenced, in tion in average weight in the sport catch, being a<out 18% part, by year-to-yea changes in population age structure. To smaller in 1984, 1986, and 1988 compared with 1983, 1985, control that variable and to allow re more equitable comparison and 1987. Similar variation may also have been occurring in among species, we ran simulations for a standard 1 million the 1970's (Hansen 1986). Comparing results of simulatims
916 Can. J . Fish. Aquae. Sci., V01. 48, 1991
80 CHINOOK
a ) LARGE ALEWIFE
I / b) SMALL ALEWIFE I
2 0 clB OTHER FIS
W 80
L A K E TROUT a )
7 8 8 0 8 2 84 86 88
Y E A R FIG. 4. C s m p ~ s o n of diet consapssition for lake trout, coho sdmsn, and chinook salmon pupulations in Lake Michigan based on modeling simulatloms of predation for each y e a from 1978 to 1988. Large and small alewife are greater than and smaller than $ g wet weight.
for average conditions in each of hose sets of years indicates that diets in good growth years may be supplemented with juve- nile alewife* We infer from this that there may be a previously unrecognized 2-yr cycle in success of juvenile alewife in Lake Michigan. It is possible that standard bottom trawl surveys do not effectively sample young-of-yea and yearling alewife (Hatch et al. 1981; Eck and Brown 1985). Similar short-term responses of salmonine growth to abundances of young alewife have been observed for coho sdmon and brown trout in Lake O n t h o QO'Goman et d. 1987).
Total predation per million chinook salmon declined about 8% after the alewife decline in 1981-83 and the resulting diet shift away from large alewife (Fig. 5). Weight of the average individual chinook salmon in the sport catch for % 98688 aver- aged 24% lower than 1982, reflecting lower conversion effi- ciency for the changed diet (see below). We infer that growth
of chinook salmon in Lake Michigan was limited by quantity and quality of available forage, at least during 198486 and 1988. Our hypothetical scenario for chinook salmon feeding on bloater suggested that we might see further declines sf con- sumption ( - 23%) and mean individual weight ( - 16 to - 19%) under those conditions. These estimated reductions are entirely temperature effects because ration as a proportion of maximum and average energy density of the diet were held constamat. If salmon have more difficulty catching bloater than they do catching alewife, then rations might also decline, leading to even more extreme growth declines. That could happen, for example, because bloater attain a larger size than alewife and generally inhabit deeper strata where low light levels might restrict a salmon's ability to find prey.
Predation per million lake trout showed little effect f s m the 1981-83 alewife decline. Likewise, increasing the annual sur- vival rate of lake trout to 60% after age 4 (when they enter the sport fishery) increased forage demand only 10%. Predation estimates for lake trout were much more sensitive to chmges in survival rates of the juveniles than to chmges in adult sur- vival rates. Management efforts to reduce incidental catch of juvenile lake trout (e.g . Keller et al. 1989) thus may influence predation pressure on prey fish stocks more than regulations to limit removal of adult fishes.
Total Sdmonine Predation
Total salmnine predation by stocked fishes increased from about 4-4 000 t in 1978 to a peak of about 71 000 t in 1983, declined, and then peaked again at 76 000 t in I987 (Fig. 6A). The first peak coincided with the yeas of greatest alewife decline (198 1-83). That decline, however, was preceded by a series of severe winters that may have been its primary cause (Eck and Brown 19851, or at least would have compounded the predation effects. Total predation by chinook salmon doubled between 1978 and 1983, while that by coho salmon amd lake trout (excluding the deep reef fishes) declined. Over the 1 1-yr period, stocked rainbow md brown trout may have contkbuted 15-3 1 % annually to the overall predation pressure. Totd sd- monines stocked peaked about 1984 and has declined slightly since then (Table 21, in put because of management concern for stability of the alewife population. The secondary peak of predation effects in I987 may partially reflect maturing of the fishes stocked in 1984. It also reflects larger average weight of chinook salmon in the 1987 sport catch compared with weights in 1984-86 and 1988.
Composition of total prey biomass consumed by the three modeled salmonines (Fig. 6B) strongly minors diet composi- tion of the chinook sdmon (Fig. 4) because they account for a large proportion of that total. Between 1982 and 1983, con- sumption of large dewife decreased from 28 580 to 16 350 t and remained around that level though 1988. Predation on small alewife oscillated between 10 000 and 16 800 t since 1982, except for a peak of 25 800 t in 1987. Consumption of prey fish other than alewife almost doubled from 1 I 390 t in 1982 to 20 500 t in 1983 and then gradually declined to I0 008 t in 1988. Predation on fishes other than alewife fell heaviest on rainbow smelt (Osmerus ~nordaa:), with juvenile yellow perch (Perca flavescens) juvenile bloater, and slimy sculpin (Cott~as cognatus) of secondary importance.
Conversion Efficiency
The effects of diet changes and slower growth resulted in about a 20% decline in wet weight gross conversion efficiency
Can. 9. FLh. Aquat. Sci., Vol. 48, 1991
PWE- 78- 84 83 78 81 86 85
88 87
CHINOOK
PRE- 79- 83- 60% 78 81 88 SURV.
FIG. 5. C o m p ~ s o n of total consumption and bre&dswn by prey type for a standard 1 million stocked fish for each of coho salmon, chinook sdmon, md lake &out in Lake Michigan. Results from Stewart et d. (1981) are presented as Bre-78, and those simulations were adjusted for 1978-81 by including results from Jude et d. (1987; cohort 1 diets for coho md chinook sdrnon), Eck md Brown (1985; lake trout growth md survival rates), and Eck and Wells (1986; lake trout winter diets). Results for the period after the main alewife decline (1983-88) are based on average growth md diets for the years indicated above each bar ((see text). We dso present results of two hypothetical scenarios involving chinook salmon eating bloater at 8°C. md lake trout with 60% mnud survival after age 4.
for chinook salmon since the late 1970's (Fig. 7). Much of that decline stems from eating less of the energy-rich large alewife and more prey of lower energy content. Lower efficiency means that the chinook have to increase their daily ration to accam- plish the same growth rates that they previously attained. If they are not able to increase their rations, then growth would slow down. The decline in mean weight of chinook salmon in the sport catch since 1982 may be indicative of such a problem. The alternating fast- and slow-growth years of coho salmon and associated diet changes are also reflected in a slight intermnual
modeled salmonines (Fig. 8). That ratio was clearly highest far chinook salmon (1.6), intermediate for coho salmon (1.15), and lowest for lake trout (0.6). Those striking differences between species further explain why chinook salmon are so popular with fishery managers in the Great Lakes. Values for coho and chinook salmon are typical of those for salmonhe populations from relatively cold streams, but the production to mean biomass ratio for lake trout is noticeably lower than for most populations of stream sdmonines (Chapman 1978).
oscillation in conversion efficiency. ~fficiency was lower in ~ i ~ ~ ~ ~ ~ i ~ ~ 1985 and especially in 1987 when small alewife became more important id the dikt at the expense of larger alewife. Conver- sion by lake trout was relatively stable over the study period. Predator-Prey Dynamics
Total Salmonine Production
Total gross production for the three modeled salmonines has remained relatively stable near 10 000 to B 1 000 t since 1980 (Fig. 8). That is because early-summer total population for those three species combined was reasonably stable between 17 md 19 million fishes from 1979 to 1987 (Table 2). As with pre- dation, chinook sdmon have accounted for over half the sal- rnonine production since the early 1980's. Total lakewide gross production by d l stocked salmonines was estimated to be about 15 300 t in 1987, or 0.27 g ~ r n - ~ of lake surface. That amount of production is similar to historic levels of commercial yields of dl fishes in Lake Michigan (Leach et al. 1987, table 3, 0.22 g * ~ a - ~ ) .
Ratios of gross annual production to mean monthly popu- %ation biomass in 1987 were calculated for each sf the thee
The foregoing results indicate a strong preference for large alewife by Lake Michigan salmonines. If large alewife become scarce, salmonines switch progressively to immature alewife and finally to rainbow smelt md other prey fishes. Implications are that growth of Pacific salmon (as reflected in average size of sport-caught fishes) is very responsive to short-term changes in abundance of alewife. Our predation estimates based on average size in the sport catch may be lower than actual for chinook salmon because we assumed that most lived no longer than 4 yr. There is now evidence that some chinook may be living to 5 or 6 yr (M. Toneys, Wisconsin Department of Natural Resources, Sturgeon Bay, WI, and R. Hay, Michigan Department of Natural Resources, Cadillac, MI, pers. cornm.) , but we no not know if that applies to the entire population or only those m s that have been studied. If they are now taking more yeas to attain weights similar to those modeled here, then
918 Can. J . Fish. Aquat. Sci., Val. 48, 1991
A. PREDATOR CONSUMPTION 8of=
CHINOOK
w COHO
X h
1 B. PREY CONSUMED 2 60
20
OTHER F i S H
YEAR FIG. 6 . Total sdmonine predation in Lake Michigan during 1978-88 based on modeling simulations of lake trout, coho salmon, and chi- nook salmon. (A) Broken down by predator species and extrapolated to include rainbow and brown trout by assuming that whole population predation per yearling stocked (including yearling equivalents of pre- vious yea's fall fingerlings) was comparable as the ayerage of that for the three species simulated; (B) broken down by prey type for the three species simulated.
consumption estimates would be higher and conversion efficiency lower than our estimates. If salmon continue their strong preference for large alewife as that population declines, we may see a progressive deterioration of the alewife reproductive stock. Such a process could partially explain failure of the alewife population to recover after the decline in 1981-83.
Prior to 1982, the alewife population showed wide fluctuations from year to year and the population would recover quickly after a sharp decline (Eck and Wells 1987). That pattern is still evident for the Lake Ontario alewife population (O'Gorman et al. 19871, but the Lake Michigan population appears to have lost that capacity to rebound quickly. Before
17 LAKE TROUT
7 8 88 8 2 84 88 Y E A R
FIG. 7. Gross conversion efficiency of wet weight biomass (Lee cumu- lative gross production divided by total consumption) for lake trout, coho salmon, md chinook salmon populations in Lake Michigan based on modeling simulations for 1978-88.
8 CHlNOOK
AVERAGE BIOMASS
4
9 8 88 8 2 84 88 88
Y E A R FIG. 8. Cumulative gross production in Lake Michigan during 1978- $$ based on modeling simulations of lake trout, coho salmon, and chinook salmon. We extrapolated to rainbow and brown trout assum- ing that whole population production per yearling stocked (including yearling equivalents of previous-year's fall fingerlings) was compa- rable with the average per individual stocked for the three species simulated. Vertical b a s for 1987 indicate the average population bio- mass on the last day of each calendar month for the thee species simulated, providing a comparison of production to biomass ratios.
1982, alewife population dynamics may have been dominated by intraspecific and physical (weather) processes. Subsequently, the interspecific interactions such as heavy predation by salmonines may have become the dominant forces regulating the alewife population.
Can. 9. Fish. Aqscart. Sci., Vol. 48, 1991
Less extreme yew-to-yea variations of alewife population abundmce and reasonable growth of salmonines (by Pacific Ocean standards) suggested that managers of the system might be able to "have their cake and eat it too," that is, a reduced alewife population that allows rehabilitation of native fishes, but enough alewife to feed the salmonines. We should not be lulled into a false sense of security by 6 yr of apparently stable alewife populations, however, because stability of the present prey-fish assemblage remains to be tested by a harsh winter. Severely cold winters in 1976-77 and 1983-84 reduced alewife populations in both Lakes Michigan and Ontario (Eck md Wells 1987; O'Goman et al. 1987). There has not been such a severe winter in the past 6 yr. When (not if) the next one occurs, it will provide a critical test for alewife in both lakes. Conceivably, Lake Michigan alewife may be in good condition by virtue of their smaller population and presumably lowered intraspecific competition. If that is the case, then they may be more resistant to drastic mortality from an extreme winter (O'Goman et al. 1987). If mortality from cold stress (Colby 1973) can occur relatively independent of condition, or if food limitations prevent enhamced condition of the alewife, then the next severe winter could mean further decline in their population. There is no historical precedent from which to predict the outcome. Dramatic surprises are possible.
Further declines in alewife could yield still smaller Pacific salmon in the sport catch. Lowered scope for growth at the low temperatures required to forage on bloater and rainbow smelt, md perhaps also at higher temperatures required to feed effectively on yellow perch, could limit size of salmon in the fishery. If prey alternatives to alewife are not sufficiently abundant when md where the salmon need them, slower growth could translate into stress, disease, and mortality. Lower survival of salmon may be the ultimate stabilizing force in Great Lakes ecosystems ha t will prevent complete elimination of alewife.
Returns of spawning chinook salmon to certain streams in Michigan began to decline a b u t 1985, and by 1988 may have been 4&50% lower than in the early 1980's (8. Hay, Michigan Department of Natural Resources, Cadillac, MI, pers . comm.) . Die-offs of large chinook sdmon in southern Lake Michigan have occurred in the springs of 1988-90, with the ultimate cause of death apparently being bacterial kidney disease (D. Brazo, Indiana Department of Natural Resources, Michigan City, IN, pers. comm.). Totd sport hmes t of chinook salmon from Lake Michigan has also declined in the past 2 yr (Keller et al. 1989), but that change is confounded by reduced fishing effort by anglers who heard repofis of lower catch rates. Lower catch rates might, in turn, reilect a change of foraging behavior by the salmon as they seek alternative prey. In short, chinook salmon survival rate may have recently declined by up to 56496, but we did not model that change because of the foregoing uncertainties about the actual lakewide values. If available evidence is indicative of lakewide conditions, then our predation md production estimates for chinook salmon in 1987 and 1988 may need to be lowered appropriately. This possible bias towards a high predation estimate for chinook may be balanced, however, by possible low biases from our assumptions about lake trout growth, md by not including natwdly spawned salmonines in this mdysis.
Implications for Management and Future Research
Comp&son of our predation estimates, commercial land- ings, and available production of alewife in Lake Michigan
indicates that about 60% of that production is now being '&ha- vested" annually (Brmdf et d. 1991)- The system probably cannot support a marked increase in alewife harvests. Keller et d. (1989) have suggested that further increases in stocking of salmonines may be possible because of the large biomass of bloater in the lake. That may be a fair assessment for lake trout that historically fed on bloater (Van Oosten and Deason 1938; Eck and Brown 1985), but our results suggest that increases in Pacific salmon densities will affect alewife first and foremost. Even lake trout stocked in shallow water appear to prefer ale- wife when they we available. We believe that a goal of insreas- ing stocking densities for Pacific salmon to take advantage of available bloater production (Keller et al. 1989) is in direct conflict with one of maintaining alewife as an important prey in the system.
While we suggest possible incompatibilities among certain management gods of Keller et al. (1989), we agree entirely with their perceived research needs. Uncertainties in the present analysis derive in part from incomplete information on age- specific growth and survival rates, especially for the juvenile sdmonines. Those are clearly research topics that beg addi- tional expenditure of field efforts. The cost of research to under- stand early life history processes in juvenile salmonines would certainly be much less than one year's loss of economic returns to communities of the Lake Michigan basin that have suffered from the recent decline of salmonine catch rates. We have also omitted consideration of naturally spawned sdmonines because lakewide data are inadequate.
Natural processes may have perturbed the Lake Michigan system by reducing sdmonine predation to a much lower level than managers could possibly have done in today's sociopo- litical climate. If so, we should take full advantage of that nat- ural experiment to further our understanding of predator-prey dynamics in the Lake Michigan system. We should also be prepared to make appropriate observations on alewife when the next harsh winter arrives because that will be the acid test of stability for their population. Finally, we believe that important insights can be gained from between-lake comparisons (e.g. Leach et al. 1987), but so far, estimates of whole-lake salrno- nine predation and prey-fish production are lacking for the four Great Lakes along the U.%.--Cmadim border.
Acknowledgments
We t h a d J. Kitchell for advice and support at all stages of this project. Diet infomation from Wisconsin was gathered though the cooperation of hundreds of Lake Michigan sportfishing enthusiasts md the had work of J. Hager m d M. Miller, both of the Center for kim- nology, University of Wisconsin, Madison, WI. 'This study was funded in part by the University s f Wisconsin Sea Grmt Institute under a grant from the Nationd Sea Grant College Pmgrm, Natisnd Oceanic and Atmospheric Administration, U.S. Department of Commerce, and from the State of Wisconsin (federd grant NA84AA-D-W065, project WLR-29) and by the Federal Aid in Sport Fish Restoration Act under project F-95-P md the Wisconsin Department of Natural Resources. Supplemental diet data fmm Illinois and Indiana were provided by J. Jmssean, Loyola University, Chicago, and funded by the Illinois Sea Grmt Institute (federal g m t NA82AA-D-BB8810, projects 83-1 16 m d 85- 109). Figures 1-3 were drawn by C. Richardson-Simpson. The computer p r s g m used for modeling simulations (written in Pascal for Apple IB, IBM-PC, and compatible Hanicrscomputers) m d user's guide (Hewett m d Johnson 1987) are available from the Communi- cations Office, University of Wisconsin Sea Grant Institute, BSOdB Uni- versity Avenue, Madison, W 53706, USA.
Can. J . Fish. Aquat. Sci., VoI. 48, 1991
References
AYERS, J. C. 1962. Great M e s waters, their circulation, and physicd and chemical chmcteristics. In Great Lakes Basin. Am. Assoc. Adv. Sci. h b l . 71: 71.
B W U C H ~ P , D. A., D. I. STEWART, AND G. L. THOMAS. 1989. Corroboration of a bioenergetics model for sockeye salmon. Trans. Am. Fish. Soc. 118: 594-7.
BOISCLAR, B., AND W. C. EECXETT. 1989. The importmce of activity in bio- emergetics models applied to actively foraging fishes. Can. J. Fish. Aquat. Sci. 46: 1859-1847.
B w m , S. B., D. M. MASON, E. V. PATRICK, R. L. ARGYLE, L. WELLS, P. A. UWGW, AND D. B. S ~ W A W T . 1991. Acoustic measures of the abun- &ace and size of pelagic plankdvores in Lake Michigan. Can. J. Fish. Aquat. Sci. 48: 894-9638.
B m , J, R. 1952. Temperature tolerance in young Pacific salmon, genus Onco~hynchus. J. Fish. Res. B w d Can. 9: 265-323.
197 1. Satiation time, appetite, and maximum food intake of sockeye salmon (6lec~rhynchus neaka). J .Fish. Res, Board Can. 28: 4 W 15.
BRETT, I. R., J. E. S m o c a ~ , AND C. T. $HOOP. 1969. Growth rate and body csmposition of fingerling sockeye sdmon, Oncsahynchnts nerbcar, in rela- tion to temperature and ration size. %.Fish. Res. Board Can. 26: 2363- 2394.
CHAPMAN, B. W. 1978. Chapter 1: Production in fish populations, p. 5-25. ln PO. D. Gerking [ed.] Ecology of freshwater fish production. John Wiley and Sons, New Ymk, NY.
Corny, P. J. 1973. Response of alewives, Akosca pseudokaaengus, to environ- mental change, g. 163-198. %n W. Chavin [ed.] Responses of fish to envkonmentd changes. Charles C. Thomas, Springfield, BL.
DAVIS, 6. E., AND C. E. W m . 1968. Estimation of food consumption rates, p. 204-225. In W. E. Wicker [d.] BBP Handbook No. 3. Methods for assessment of fish pmiuction in fresh waters. Blackwell Scientific Pub- Ihcatisaas, Oxford.
WK, 6. W., AND E. H. BROWN, JR. 1985. Laice Michigan's capacity to support lake trout (Sdveiinus mmycush) and other dmonines: an estimate based on the status d prey populations in the 1978s. Cam. J. Fish. Aquat. Sci. 42: 4149454.
ECK, G. W., AND L. WELLS. 1984. Depth distribution, diet, and overwinter growth of Bake &out (Salvekinus namycush) in southeastern Lake Mich- igan sampled in h e m h 1981 and M m h 1982. J . Great Lakes Res. 12: 263-269.
1987. Recent changes in Lake Michigan's fish community and their p b a b l e causes, with emphasis on the role of the alewife (Alosa pseu- dohaengus). Cm. 9 . Fish. Aquat. Sci. U(Supp1. 2): 53-60.
~ S A L L , 9. A., E. M. BROWN Jw., T. 6. Yc~@uM, AND R. S. C. WOLCCYlT, JR. 1974. Utilization of alewives by coho salmon in Lake Michiganaan. Great Lakes Rsh. Lab. Admin. Rep. 14 p.
EWD, J. H., D. E. B s ~ m e u m , AND C. P. SCHNBIDER. 1988. Comparison of hatchery-reared lake trout stocked as fall fingerlings and as spring year- lings in Lake Ontario. N. Am. J. Fish. Manage. 8: 455462.
GWVA , G . J . , AND J . E. MCINERNEY. 8 977. Critical swimming s p d s of coho salmon (Oncoahynchus kisspfch) fry to smolt stages in relation to salinity and tempatwe. J . Fish. Res. Board Cm. 34: 151-154.
GREEN, C.W. 1913. 'Fhe storage offat in the muscular $issue of the king salmon and its resorption during the fast of the spawning migration. Bull. U.S. Bur. Fish. 33: 73-138.
G m s , J. S., AND D. P. ALDERDICE. 1972. Effects of acclimation and acute temperature experience on the swimming speed of juvenile coho salmon. J. Fish. Res. Board Can. 29: 251-264
HAG=, J. M. 1984. Diets of Lake Michigan salmonids: an assessment of the dynamics of predator-prey interactions. M.S. thesis, University of Wis- wmina-Madson, Madison, WI. 97 p.
HANSEN, MVI. J. 2986. Size and condition of trout and salmon from the Wis- consin waters of Lake Michigam, 1969-84. Fish Management Report 126. Bureau of Fish Management, Wisconsin Department of Natural Resources, Madison, W.
HATCH, R. W., P. M. HMCK, AND E. H. BROWPI, Jw. 1981. Estimation of alewife biomass in Lake Michigan, 8967-1978. Trans. Am. Fish. Soc. 110: 575-584.
&ms, J. M., AND C. J. KEWHER. 1980. X;n-.--- plts of Pacific d m o n in W e Ontario in spring and summer: evidence of wide dispersal. J. Fresh- water Ewl. 3: 289-297.
HAMS, J. M., B. C. NETTLES, K. M. PAWELL, M. P. VOLEAND, W. A. OLSON, AND 6. D. W m . 1986. Movements of r 4 n h w steelhead trout (SaEmo gairdmri) in Lake Ontario and a hypothesis for the influence sf spring thermal structure. I. Great Lalkes Res. 12: 304-313.
HEWETT, S . W., AND B . I. JOHNSON. 1987. A generalized bioenergetics model of fish growth for microcomputers. Univ. Wisc. Sea Grant Tech. Rep. WHS-SG-87-245: 47 p.
HUWLER, T. 1989. Is Lake Michigan dying again? Outdoor Life 2989 (May): 81, 116, 12G121.
JUDE, I3. J., AND F. J. TESAR. 1985. Recent changes in the inshore forage fish of Lake Michigan. Can. I. Fish. Aquat. Sci. 42: 1154-1 157.
JUDE, D. J., F. J. TESAR, S. P. DEBOE, AND T. J. MILLER. 1987. Diet and selection of major prey species by Lake Michigan salmonines, 1973-1982. Trans. Am. Fish. Soc. 116: 677491.
KELLER, M., K. B. SMITH, AND R. W. RYBICKI [ED.] 1989. S u m q of salmon and trout management in Lake Michigan. Mich. Dep. Nat. Resour. Fish. Tech. Rep. 89-1: 27 p.
KITCHELL, J. F., AND E. B. CROWBER. 1986. Predator-prey interactions in Lake Michigan: model predictions and recent dynamics. Environ. Biol. Fishes 14: 205-211.
KIXHELL, J. F., AND S. W. HEWETT. 1987. Forecasting forage demand and yield of sterile chinook salmon (Oncsrhynchus rshawytscha) in Lake Michigan. Gara. I. Fish. Aquat. Sci. 44(SuppT. 2): 384-389.
KRUEGER, C. C., AND T. W. D E ~ I I N G . 1986. A procedure to allocate the annual stocking of salmonids in the Wisconsin waters of Lake Michigan. Fish Management Report 127. Bureau of Fish Mamagement, Wisconsin, Department of Natural Resources, Madison, WH.
LEACH, J. H., L. M. DICKIE, B. J. S H ~ E R , U. BOROMANN, J. HYMAN, AND
W. LYSACK. 1987. A review of methods for prediction of potential fish production with application to the Great Lakes and L l e Winnipeg. Can. J. Fish. Aquat. Scii. 44(SuppI. 2): 471485.
LEWIS, C. A., D. H. SCHUPP, W. W. TAYLOR, 5. J. COLLINS, AVD a. w . HATCH. 1987. Predicting Great Lakes fish yields: tools and constraints. Can. 5 . Fish. Aquat. Sci. U(Supp1. 2): 411416.
NEY, J. J. 1990. Trophic economics in fisheries: assessment of demand-supply relationships between predators and prey. Rev. Aquat. Sci. 2: 55-8 1.
O'GORMAN, W., R. A. BERGSTEDT, AND T. H. ECERT. 1987. Prey fish dynm- ics md salmonine predator growth in Lake Ontario, 1978-84. Can. J. Fish. Aquat. Sci. 44(Suppl. 2): 390-403.
OLSON, W. A., J. D. WINTER, D. C. NETTLES, AND J . M, H A Y ~ S . 1988. Resource partitioning in summer by salmonids in south-central Lake Ontario. Trans. Am. Fish. Soc. 117: 552-559.
RAO. G. M. M. 1968. Oxygen consumption of rainbow trout (Salmo gaiadneri) in relation to activity and salinity. Cam. J . Zool. 46: 781-786.
2971. Influence of activity and salinity on the weight-dependent oxy- gen consumption of the rainbow trout Salmo gaiadneai. Mar. Biol. 8: 285- 212.
REINERT, W. E., AND H. L. BERGMAN. 2974. Residues of DBT in lake trout (Salvelinets mmc8ycush) and coho sdmon (Oncorkynchus kisufch) from the Great Lakes. J. Fish. Res. Board Can. 32: 191-199.
Rmnc~r, R. W. 1983. Lake trout populations in Michigan waters of Lake Mich- igan, 1976-1982. Mich. Dep. Nat. Wesour. Fish. Res. Rep. 1914: 37 p.
WYBICKI, R. W., AND M. KELLER. 1978. The lake trout resource in Michigan waters of Lake Michigan, 197G1976. Mich. Dep. Nat. Resour. Fish. Rep. 1863: 71 p.
%CAWA, D., G. A. LANG, AND J. F. ~ T C ~ L E . 1988. Dynamics of m e Mich- igan plankton: a model evaluation of nutrient loading, competition, and predation. Can. J. Fish. Aquat. Sci. 45: 165-177.
SPANGLER, 6. W., K. H. LOFTBIS, AND W. 9. C ~ I S T I B . 2987. Introduction to the Hnkmationd Symposium on Stock Assessment and Yield Prediction (ASPY). Can. J. Fish. Aquat. Sci. #(Suppl. 2): 7-9.
S m v ~ m , W. G., S. B. BRANIBT, D. J. STEWART. M. MIRPIAWAR, E. H. JIN, AND J. LOVE. 8991. Biomass size spectrum of the M e Michigan pelagic food web. Can. J . Fish. Aquat. Sci. 48: 105-8 15.
STANSBY, M. E. 1976. Chemical characteristics of fish caught in the Northeast Pacific Ocean. Mar. Fish. Rev. 38: 1-1 1.
STEEDMAN, R. J., AND PI. A. REGIER. 1987. Ecosystem science for the Great Lakes: perspectives on degradative and rehabilitative tramsformatiom. Can. J. Fish. Aquat. Sci. U(Supp1. 2): 95-103.
S n w ~ w a , D. J. 1980. Salmonid p~da to r s and their forage base in Lake Mich- igan: a bioenergetics-modeling synthesis. Ph. B. thesis, University of Wis- consin-Madison, Madison, WI. 225 p.
STEWART, D. J., AND F. P. BIMOWSKI. 1986. Dynamics of consumption and f d conversion by Lake Michigan alewives: an energetics-modeling syn- thesis. Trans. Am. Fish. Soe. 115: ~ ~ 6 1 .
STEWART, D. J., 9. F. KITCHBLL, AND L. B. CROWHIEB. 1982. Forage fish md their salmonid predators in Lake Michigan. Trans. Am. Fish. Sw. 110: 75 1-763.
STEWART, B. J . , D. WEININGER, D. V. R O ~ I E R S , AND T. A. EDSALL. 8983. An energetics model for lake trout, Saivekinus mmycush: application to the Lake Michigan population. Can. J. Fish. Aquat. Sci. 40: 682498.
Can. 9. Fish. bhquat. Sci., hE. 48, 8991
T H O ~ O N , K. W., AND A. S. LESSEM. 1978. A temperature dgoriehm for WELLS, L. 1985. Changes in Lake Michigan's prey fish populations with modifying biological rates. Tsms. Am. Fish. Sw . 107: 284-287. increasing salmonaid abundance, 1962 to 1984, p. 13-25. In R. L. h h -
VAN Chsrn , J., AND %I. J. DEASON. 1938. The fwd sf the lake trout (Cri- emoder [ed. ] Resented papers from the Council sf Lake Comitees Plen- srivsmer namaycush) and sf the lawyer ( b t a rnacubsa) sf Lake Michi- ary Session on Great Lakes predator-prey issues, Mach 20, 1985. Great gan. Trans. Am. Fish. Sw. 67: 155-17'7. Lakes Fish. C o r n . Spec. h b l . 85-3, Ann Mar. MI.
WIEHS, D. 1973. Optimal fish cruising sped. Nature (kond.) 245: 48-50.


![[XLS]convocatorias.essalud.gob.peconvocatorias.essalud.gob.pe/convocatorias/files/evalPre... · Web viewHURTADO CASANCA, LEONIDAS ROQUE IBARRA ROBLES, LUCERO GERALDINE IBARRA TRUJILLO,](https://static.documents.pub/doc/80x56/5bc09d3809d3f2c7178bc98f/xls-web-viewhurtado-casanca-leonidas-roque-ibarra-robles-lucero-geraldine.jpg)


