112
Stockport Council Transport Asset Management Strategy Stockport’s vision and strategy for maintenance of transport infrastructure 2015-2034
Stockport Council Transport Asset Management Strategy
Stockport’s vision and strategy for maintenance of transport infrastructure 2015-2034
TAMS PART 1 CORE ASSET MANAGEMENT STRATEGY Stockport Council
1
TABLE OF CONTENTS
Contents
PART 1 CORE ASSET MANAGEMENT STRATEGY ................... 1
1.1 INTRODUCTION .................................................................................. 1
1.2 OUTLINE OF THE TRANSPORT ASSET MANAGEMENT STRATEGY ........ 1
1.2.1 Overview ..................................................................................................... 1
1.2.2 Outline of the Core Asset Management Strategy .......................................... 1
1.2.3 Note on the layout of the document ............................................................ 2
1.3 TRANSPORT ASSET MANAGEMENT FRAMEWORK .............................. 3
1.4 TRANSPORT ASSET MANAGEMENT POLICY ........................................ 5
1.4.1 Scope ........................................................................................................... 5
1.4.2 Policy statement .......................................................................................... 5
1.4.3 Principles ..................................................................................................... 6
1.5. STRATEGY CONTEXT ........................................................................ 8
1.5.1 Risks ............................................................................................................ 8
1.5.2 Demand ..................................................................................................... 10
1.5.3 Opportunities ............................................................................................ 10
1.5.4 National policy and strategy ....................................................................... 11
1.5.5 Greater Manchester Strategy and Growth and Reform Plan ........................ 11
1.5.6 Greater Manchester Local Transport Plan (GMLTP) ..................................... 12
1.5.7 Stockport 2020 and the Council Plan 2015-16 ............................................. 14
1.5.8 Town Centre regeneration proposals and the Town Centre Access Plan ...... 15
1.6 CORE ASSET MANAGEMENT OBJECTIVES ......................................... 17
1.7 CORE ASSET MANAGEMENT STRATEGY ............................................ 18
1.8 STRATEGIC RISKS .............................................................................. 21
PART 2 ASSET INVESTMENT STRATEGIES ........................ 24
2.1 INTRODUCTION ................................................................................ 25
2.2 ROADS ............................................................................................. 26
2.2.1 Classification and inventory ....................................................................... 26
2.2.2 Trends in roads investment and performance ............................................ 28
TAMS PART 1 CORE ASSET MANAGEMENT STRATEGY Stockport Council
2
2.2.3 Future demands, risks and opportunities for the Road Asset Investment Strategy 33
2.2.4 Investment options and value for money assessment ................................ 36
2.2.5 Road Asset Investment Strategy Objectives ............................................... 37
2.2.6 Road Asset Investment Strategy ................................................................ 38
2.2.7 Risk assessment for Road Asset Investment Strategy ................................. 39
2.2.8 Monitoring of the Road Asset Investment Strategy .................................... 42
2.2.9 Review of the Road Asset Investment Strategy .......................................... 43
2.3 PAVEMENTS AND SURFACED FOOTPATHS ....................................... 44
2.3.1 Pavement classification and inventory ....................................................... 44
2.3.2 Trends in investment and performance of pavements ............................... 46
2.3.3 Future demands, risks and opportunities for the Pavement Asset Investment Strategy 49
2.3.4 Investment options and value for money assessment for the Pavement Asset Investment Strategy ................................................................................................ 50
2.3.5 Objectives for the Pavement Asset Investment Strategy ............................. 51
2.3.6 Pavement Asset Investment Strategy ......................................................... 52
2.3.7 Strategic risk assessment for the Pavement Asset Investment Strategy ....... 53
2.3.8 Monitoring of the Pavement Asset Investment Strategy ............................ 56
2.3.9 Review of the Pavement Asset Investment Strategy ................................... 57
2.4 HIGHWAY BRIDGES AND STRUCTURES ............................................ 58
2.4.1 Classification and inventory of Highway Bridges and Structures ................. 58
2.4.2 Trends in investment and performance of Highway Bridges and Structures 59
2.4.3 Future demands, risks and opportunities for Highway Structures Asset Investment Strategy ................................................................................................ 64
2.4.4 Forecasts of condition and performance of Highway Bridges and Structures 67
2.4.5 Objectives for the Highway Structures Asset Investment Strategy .............. 71
2.4.6 Highway Structures Asset Investment Strategy .......................................... 72
2.4.7 Risk Register for Highway Structures Asset Investment Strategy ................ 73
2.4.8 Monitoring of Highway Structures Asset Investment Strategy .................... 75
2.4.9 Review of the Highway Structures Asset Investment Strategy ..................... 76
2.5 DRAINAGE ASSET INVESTMENT STRATEGY ....................................... 77
2.5.1 Classification and Inventory ....................................................................... 77
2.5.2 Strategy ..................................................................................................... 77
2.6 STREET LIGHTING ASSET INVESTMENT STRATEGY ............................ 79
TAMS PART 1 CORE ASSET MANAGEMENT STRATEGY Stockport Council
3
2.6.1 Classification and inventory of Street Lighting ............................................ 79
2.6.2 Trends in performance of Street Lighting .................................................... 79
2.6.3 Strategy ..................................................................................................... 79
2.7 PUBLIC RIGHTS OF WAY ASSET INVESTMENT STRATEGY .................. 80
2.7.1 Classification and inventory of Public Rights of Way assets ......................... 80
2.7.2 Trends in performance of Public Rights of Way assets ................................ 80
2.7.3 Strategy ..................................................................................................... 80
2.8 STREET FURNITURE ASSET INVESTMENT STRATEGY ......................... 81
2.8.1 Classification and inventory of street furniture assets ................................. 81
2.8.2 Trends in performance of street furniture assets ........................................ 81
2.8.3 Strategy ..................................................................................................... 81
2.9.2 Trends in performance of highways green infrastructure assets .................. 82
2.9.3 Strategy ..................................................................................................... 82
PART 3 PERFORMANCE PLAN ............................................ 83
3.1 OUTLINE ........................................................................................... 84
3.2 PRIORITISATION FRAMEWORK ........................................................... 85
3.2.1 Guiding principles ...................................................................................... 85
3.2.2 Two-tier process ........................................................................................ 85
3.2.3 Tier 1 Prioritisation .................................................................................... 86
3.2.4 Tier 2 Value Engineering ............................................................................. 90
3.3 FINANCIAL REPORTING ....................................................................... 93
3.4 ASSET INFORMATION MANAGEMENT ................................................. 94
ANNEX 1 GLOSSARY OF TERMS AND ACRONYMS .............. 96
ANNEX 2 REFERENCES .................................................... 99
ANNEX 3 SUMMARY OF STOCKPORT’S TRANSPORT ASSETS 101
ANNEX 4 INVESTMENT PROJECTIONS, AVAILABLE FUNDS AND SHORTFALL (INCLUDING INFLATION) ....................... 104

TAMS PART 1 CORE ASSET MANAGEMENT STRATEGY Stockport Council
1
PART 1 CORE ASSET MANAGEMENT STRATEGY
TAMS PART 1 CORE ASSET MANAGEMENT STRATEGY Stockport Council
1
1.1 INTRODUCTION This document is Stockport Council’s Transport Asset Management Strategy (TAMS) which is a 20 year strategy covering the management of our roads, pavements and associated infrastructure. These include (amongst others):
944km of roads
1,502km of pavements and 437km of footpaths, bridleways and byways
72,214 gullies (with associated connections) and 49km of culverts
92 bridges and 117 retaining walls
33,141 street lights
18,475 signs and 13,330 bollards
Collectively these assets have a gross value of £1.69bn and as such comprise the most valuable publicly owned assets in Stockport.
The Audit Commission report “Going the Distance, Achieving Better Value for Money in Road Maintenance” recommends that local highway authorities in England should adopt the principles of asset management when making investment decisions in order to optimise the use of available resources.
The TAMS provides the guiding principles, objectives, processes, actions and investments that are needed to ensure that the performance of Stockport’s transport infrastructure can support our corporate aspirations whilst maintaining long term financial sustainability over the period from 2015 to 2034. It clarifies the links between our approach to management of transport assets and specific objectives for economic growth, environmental sustainability and the promotion of greater independence of people in Stockport to enable them to get out and about.
The TAMS also starts from the firm principle that strategy options can only be deemed to be affordable if this is true for current and future generations over and beyond the next 20 year period. By providing a long term view this edition of the TAMS has brought us closer to achieving this by identifying investments that will bring down long term costs. However, it also identifies affordability gaps that need to be addressed for the next and future editions.
In the face of increasing uncertainty from global macro-economic conditions and climate change a key focus of the TAMS is on the need to increase the resilience of our infrastructure and our ability to manage risks over the next 20 year period. Alongside this, on the basis of demographic trends and projections for Stockport it is clear that there will be a substantial increase in pressure on other Council services and budgets over the same period. In this context the TAMS is clear that the only way to meet our infrastructure objectives is through, improved efficiency and effectiveness and continual innovation supported by a robust risk management approach. Reliable, relevant and timely data and robust analyses will be at the heart of this approach.
In April 2011 the Greater Manchester Combined Authority (GMCA) was established. A key point in the setting up of the GMCA was to place a statutory duty on the 10 Greater

TAMS PART 1 CORE ASSET MANAGEMENT STRATEGY Stockport Council
2
Manchester Highway Authorities (Bolton, Bury, Manchester, Oldham, Rochdale, Salford, Stockport, Tameside, Trafford and Wigan) to work together in the delivery of transportation projects and the management and maintenance of the highway network. The strategies and policies of Transport for Greater Manchester (TfGM) are set by GMCA and its TfGM Committee. TfGM is the primary public body responsible for co-ordinating public transport services throughout Greater Manchester; and for investments in improving transport services and facilities and supporting the largest regional economy outside London.
TAMS PART 1 CORE ASSET MANAGEMENT STRATEGY Stockport Council
1
1.2 OUTLINE OF THE TRANSPORT ASSET MANAGEMENT STRATEGY
1.2.1 Overview
The Transport Asset Management Strategy is laid out in three parts.
PART 1 CORE ASSET MANAGEMENT STRATEGY: The Core Asset Management Strategy outlines the high level principles, policy, objectives and strategy common to all our transport infrastructure. The purpose of the Core Strategy is to translate Corporate and wider policy and strategy into clear objectives for the TAMS.
PART 2 ASSET INVESTMENT STRATEGIES: Asset Investment Strategies are developed for individual asset types to provide more detail on the asset specific context and demands and the long term investment requirements. The full financial model associated with these investment strategies is given in ANNEX 4. In the current edition, Asset Investment Strategies have been completed for Roads, Pavements and Surfaced Footpaths and Highway Bridges and Structures. Action plans are included to develop strategies for Drainage, Street lighting, Public Rights of Way, Green Infrastructure and Street Furniture. It should be noted that the boroughs Traffic Signals are managed and maintained by TfGM who have their own management plan.
PART 3 PERFORMANCE PLAN: This covers the processes that are needed to enable the delivery of key asset management requirements. The first of these is the Prioritisation Framework which sets out the process flow and criteria for decision making for the 5 year capital programme for maintenance. Secondly it briefly outlines the requirements for financial reporting through the Whole of Government Accounts programme. Finally, it briefly outlines the requirement for Asset Information Management, in part to enable compliance with standards for asset data systems that will come into force in 2016 for all Government construction projects.
1.2.2 Outline of the Core Asset Management Strategy
The remainder of PART 1 is arranged as follows:
SECTION 1.3 TRANSPORT ASSET MANAGEMENT FRAMEWORK: This describes the key documents and processes used in standards for Asset Management contained in PAS 55-1:2008 and ISO 55000:2014 and locates the TAMS within this framework
SECTION 1.4 TRANSPORT ASSET MANAGEMENT POLICY: This provides a high level policy statement and a set of 10 principles that will guide the development of the strategy.
SECTION 1.5 STRATEGY CONTEXT: This section describes the context of risks, future demands and opportunities that are underlying drivers behind our long term approach in the TAMS. It then details the links to other national, regional and Stockport strategies.
SECTION 1.6 CORE ASSET MANAGEMENT OBJECTIVES: This section effectively translates wider policy and strategy objectives into high level objectives for the TAMS taking into account the context of risks, trends in demand and future opportunities.
SECTION 1.7 CORE ASSET MANAGEMENT STRATEGY: This section contains the high level actions required to deliver the Core Asset Management Objectives
TAMS PART 1 CORE ASSET MANAGEMENT STRATEGY Stockport Council
2
SECTION 1.8 STRATEGIC RISKS: This section contains a strategic risk register describing key risks to the delivery of the strategy, identified as either medium or high priority, and mitigation actions.
1.2.3 Note on the layout of the document
For ease of cross-referencing and navigation some colour coding is used to direct readers to key pieces of information. Where appropriate summary and conclusions are contained in blue shaded boxes at the end of the sections and strategy actions are contained in green shaded boxes. Where additional technical information is provided to explain the derivation of indicators or model forecasts these have been put in buff shaded boxes.
TAMS PART 1 CORE ASSET MANAGEMENT STRATEGY Stockport Council
3
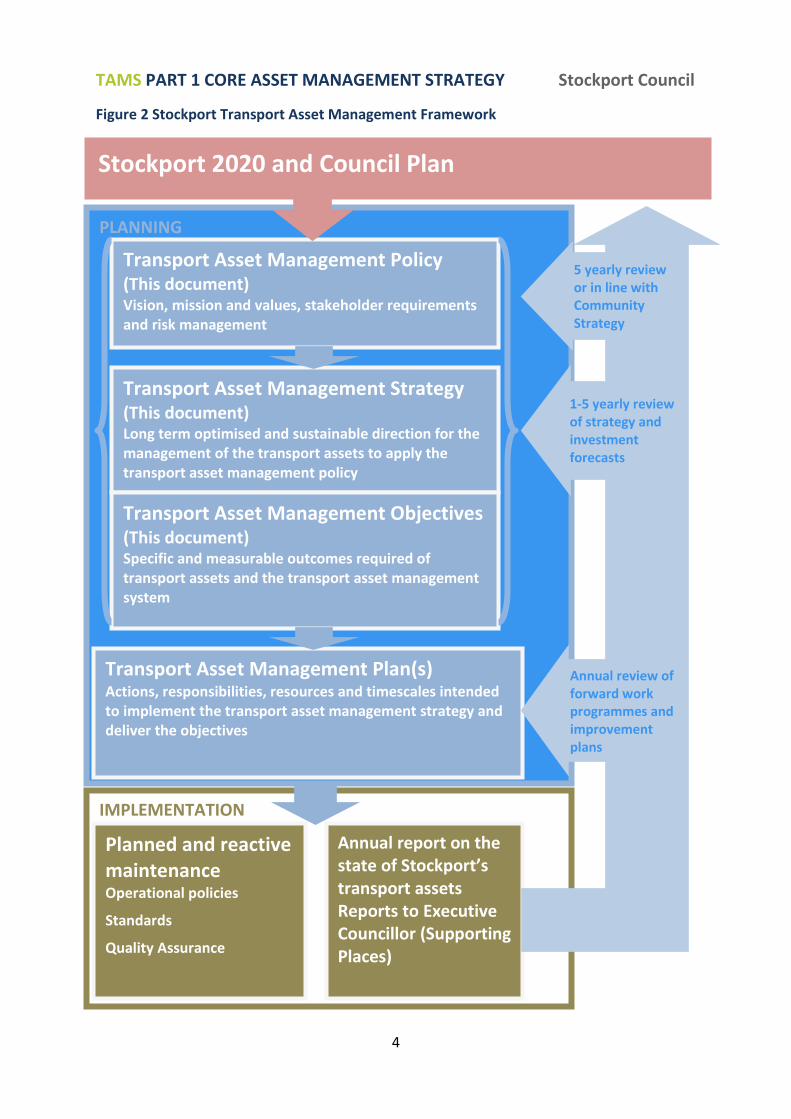
1.3 TRANSPORT ASSET MANAGEMENT FRAMEWORK Transport asset management is a multi-disciplinary function and affects a wide range of stakeholders. For this reason the TAMS sits within an overall transport asset management framework which consists of a number of different documents that are required for planning in different specialist areas and at different levels and timescales.
Figure 2 overleaf summarises Stockport’s Transport Asset Management Framework highlighting how the asset management system links with wider corporate strategy. The Framework shown in Figure 2 is based on the PAS 55:20081 standards and is consistent with the new ISO 55001:20142 with some adjustment as appropriate for management of Local Authority highway assets.
The framework also indicates the frequency of review of elements within the TAMS and the individual plans that come under the umbrella of the TAMS. The timing of review of specific items and corresponding approval mechanisms are detailed in the Review sections of the strategy.
The TAMS should remain the key document outlining Stockport’s 20 year strategy for investment and should be reviewed on at most a 5 yearly basis. As this provides a key link to Stockport Council’s corporate strategy, reviews should take place in line with reviews of the Community Strategy.
This document effectively contains the top 3 elements in the asset management planning framework, namely:
Transport Asset Management Policy
Transport Asset Management Strategy
Transport Asset Management Objectives
The fourth element of the asset management planning framework is the Transport Asset Management Plan (TAMP). This will not exist as a single document. Instead it will be a range of documents referred to in the Performance Plan (Part 3 Paragraph 3.4) including a detailed prioritisation framework and 5 year forward works plans. The timings or frequencies of review of these elements are contained within the Performance Plan.
1 Publicly Available Specification (PAS) 55-1:2008 Asset Management
2 ISO 55001:2014 Asset Management
TAMS PART 1 CORE ASSET MANAGEMENT STRATEGY Stockport Council
4
Figure 2 Stockport Transport Asset Management Framework
Planned and reactive maintenance Operational policies
Standards
Quality Assurance
IMPLEMENTATION
Annual report on the state of Stockport’s transport assets Reports to Executive Councillor (Supporting Places)
Stockport 2020 and Council Plan
PLANNING
Transport Asset Management Policy (This document) Vision, mission and values, stakeholder requirements and risk management
Transport Asset Management Strategy (This document) Long term optimised and sustainable direction for the management of the transport assets to apply the transport asset management policy Transport Asset Management Objectives (This document) Specific and measurable outcomes required of transport assets and the transport asset management system
Transport Asset Management Plan(s) Actions, responsibilities, resources and timescales intended to implement the transport asset management strategy and deliver the objectives
Annual review of forward work programmes and improvement plans
1-5 yearly review of strategy and investment forecasts
5 yearly review or in line with Community Strategy
TAMS PART 1 CORE ASSET MANAGEMENT STRATEGY Stockport Council
5
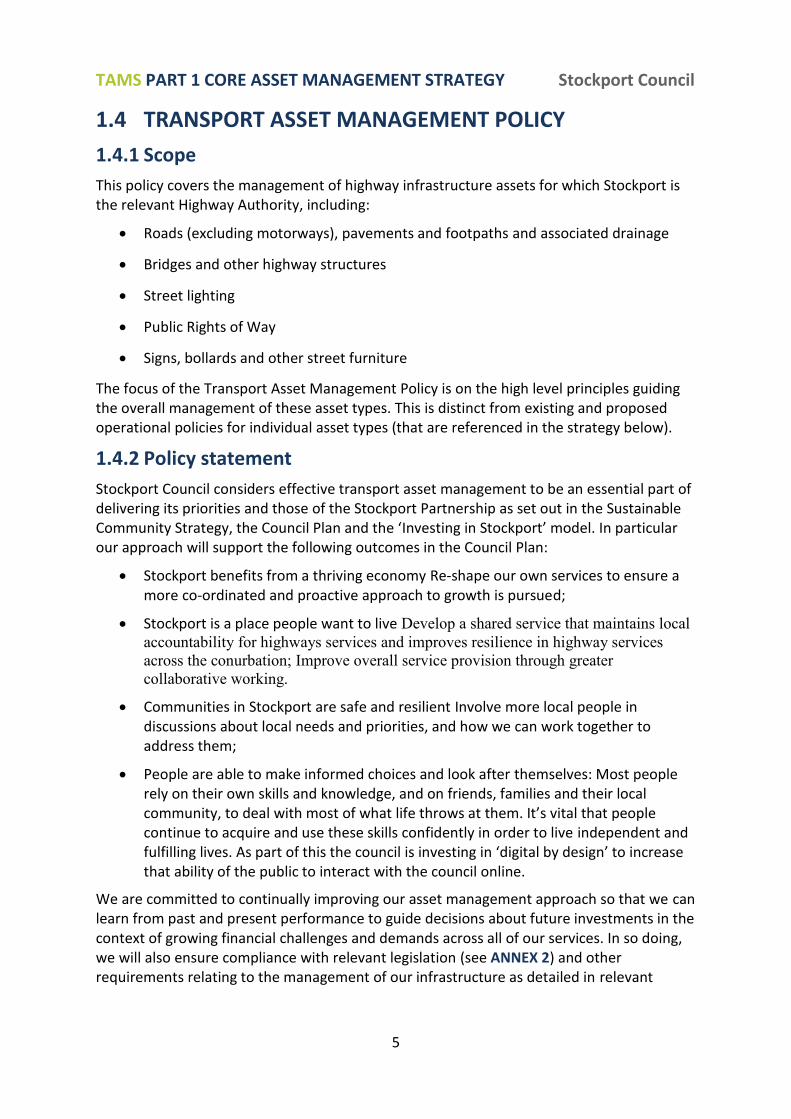
1.4 TRANSPORT ASSET MANAGEMENT POLICY
1.4.1 Scope
This policy covers the management of highway infrastructure assets for which Stockport is the relevant Highway Authority, including:
Roads (excluding motorways), pavements and footpaths and associated drainage
Bridges and other highway structures
Street lighting
Public Rights of Way
Signs, bollards and other street furniture
The focus of the Transport Asset Management Policy is on the high level principles guiding the overall management of these asset types. This is distinct from existing and proposed operational policies for individual asset types (that are referenced in the strategy below).
1.4.2 Policy statement
Stockport Council considers effective transport asset management to be an essential part of delivering its priorities and those of the Stockport Partnership as set out in the Sustainable Community Strategy, the Council Plan and the ‘Investing in Stockport’ model. In particular our approach will support the following outcomes in the Council Plan:
Stockport benefits from a thriving economy Re-shape our own services to ensure a more co-ordinated and proactive approach to growth is pursued;
Stockport is a place people want to live Develop a shared service that maintains local accountability for highways services and improves resilience in highway services across the conurbation; Improve overall service provision through greater collaborative working.
Communities in Stockport are safe and resilient Involve more local people in discussions about local needs and priorities, and how we can work together to address them;
People are able to make informed choices and look after themselves: Most people rely on their own skills and knowledge, and on friends, families and their local community, to deal with most of what life throws at them. It’s vital that people continue to acquire and use these skills confidently in order to live independent and fulfilling lives. As part of this the council is investing in ‘digital by design’ to increase that ability of the public to interact with the council online.
We are committed to continually improving our asset management approach so that we can learn from past and present performance to guide decisions about future investments in the context of growing financial challenges and demands across all of our services. In so doing, we will also ensure compliance with relevant legislation (see ANNEX 2) and other requirements relating to the management of our infrastructure as detailed in relevant
TAMS PART 1 CORE ASSET MANAGEMENT STRATEGY Stockport Council
6
Codes of Practice (also listed in ANNEX 2). We will also ensure compliance with requirements for financial reporting as part of the Whole of Government Accounts process.
1.4.3 Principles
Below are the principles that will guide the development of our strategy for highways asset management.
1. Our first priority in all contexts is to ensure the safety of residents and people travelling or working in Stockport and in other areas that might be directly or indirectly affected by the condition of our infrastructure or our operations. We will continually review our operational maintenance policies to ensure that they minimise safety risks.
2. In keeping with our obligations under the Traffic Management Act 2004 we will prioritise operations that minimise disruption over the whole life of a highway asset. In particular we will prioritise maintenance options that improve the overall resilience and reliability of the network in the context of increasing occurrence of extreme weather events.
3. We will apply risk based approaches to prioritisation of our short, medium and long term plans using analysis of local, regional and national data. We will prepare and review 3-5 year rolling programmes of work on an annual basis using a risk assessment framework to prioritise across all asset types.
4. We will identify the most cost effective long term maintenance options through lifecycle cost optimisation and through contractor engagement and unit cost targets.
5. Our asset management strategy will be supported by long term forecasts of investment needs based on the optimum allocation of resources and informed by models of asset performance and risks. Investment options will be considered where they are very likely to achieve high value for money or where there is evidence of significant social benefits including those which are gained through the promotion of economic growth and vitality.
6. In view of the challenges that Stockport Council will face in meeting growing demands on budgets across all portfolios over the next 20 years, innovation will be a fundamental part of our future strategy to reduce whole life costs without compromising safety or network reliability. We will continue to develop relations with partners and contractors to elicit their proactive engagement in identifying new solutions. As innovation brings new risks this approach will be accompanied by robust data management and risk analysis.
7. We will establish and periodically review appropriate targets in support of the Council Plan priority to achieve the lowest possible levels of waste, raw material consumption and carbon emissions incurred by our highway infrastructure maintenance operations.
8. We will ensure that levels of satisfaction and expectations from residents and road users, and in particular the views of vulnerable and disabled people, are taken into account when establishing levels of service and condition standards.
9. We will support the Council Plan priority to promote greater transparency and encourage active involvement in decision making by stakeholders by making all data on

TAMS PART 1 CORE ASSET MANAGEMENT STRATEGY Stockport Council
7
the performance and maintenance of our assets available online for viewing, downloading and analysing (subject to legal and commercial considerations).
10. We will establish all necessary processes and protocols at a high level to ensure our asset data systems are fit for the purposes of supporting all of the above principles and have regard to current and emerging standards for asset information management.
TAMS PART 1 CORE ASSET MANAGEMENT STRATEGY Stockport Council
8
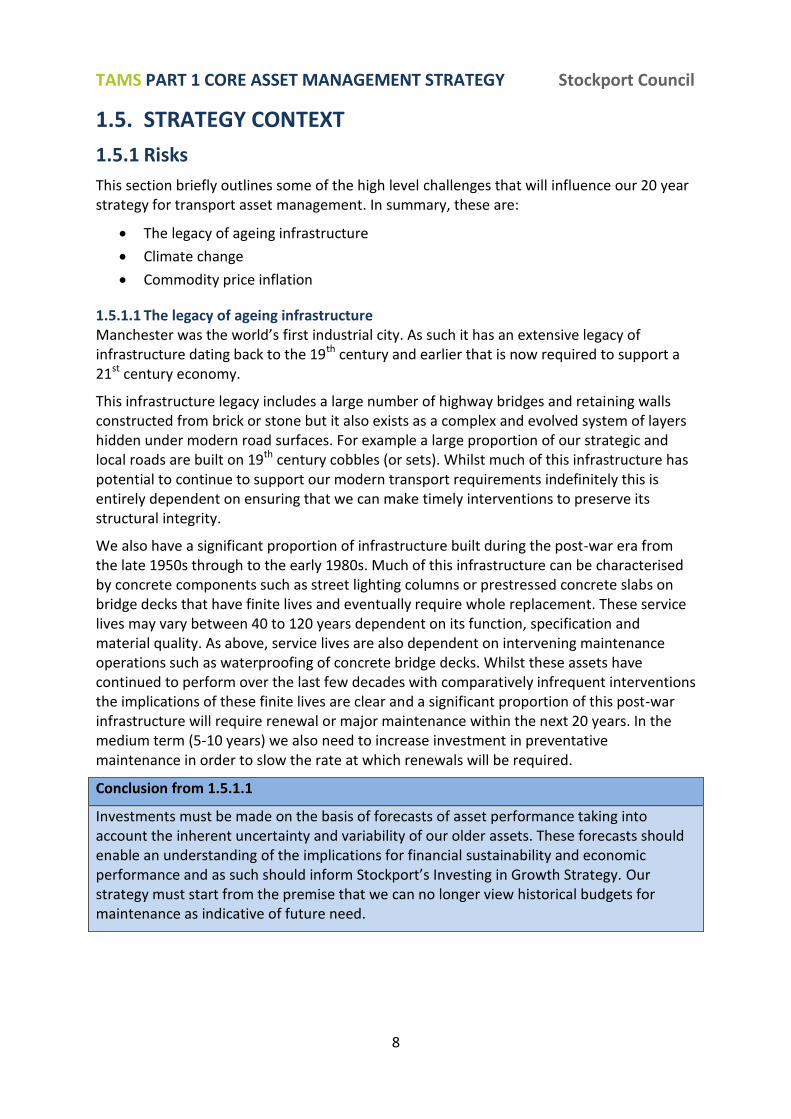
1.5. STRATEGY CONTEXT
1.5.1 Risks
This section briefly outlines some of the high level challenges that will influence our 20 year strategy for transport asset management. In summary, these are:
The legacy of ageing infrastructure
Climate change
Commodity price inflation
1.5.1.1 The legacy of ageing infrastructure Manchester was the world’s first industrial city. As such it has an extensive legacy of infrastructure dating back to the 19th century and earlier that is now required to support a 21st century economy.
This infrastructure legacy includes a large number of highway bridges and retaining walls constructed from brick or stone but it also exists as a complex and evolved system of layers hidden under modern road surfaces. For example a large proportion of our strategic and local roads are built on 19th century cobbles (or sets). Whilst much of this infrastructure has potential to continue to support our modern transport requirements indefinitely this is entirely dependent on ensuring that we can make timely interventions to preserve its structural integrity.
We also have a significant proportion of infrastructure built during the post-war era from the late 1950s through to the early 1980s. Much of this infrastructure can be characterised by concrete components such as street lighting columns or prestressed concrete slabs on bridge decks that have finite lives and eventually require whole replacement. These service lives may vary between 40 to 120 years dependent on its function, specification and material quality. As above, service lives are also dependent on intervening maintenance operations such as waterproofing of concrete bridge decks. Whilst these assets have continued to perform over the last few decades with comparatively infrequent interventions the implications of these finite lives are clear and a significant proportion of this post-war infrastructure will require renewal or major maintenance within the next 20 years. In the medium term (5-10 years) we also need to increase investment in preventative maintenance in order to slow the rate at which renewals will be required.
Conclusion from 1.5.1.1
Investments must be made on the basis of forecasts of asset performance taking into account the inherent uncertainty and variability of our older assets. These forecasts should enable an understanding of the implications for financial sustainability and economic performance and as such should inform Stockport’s Investing in Growth Strategy. Our strategy must start from the premise that we can no longer view historical budgets for maintenance as indicative of future need.
TAMS PART 1 CORE ASSET MANAGEMENT STRATEGY Stockport Council
9
1.5.1.2 Climate change Whilst there is considerable uncertainty over forecasts of the nature, extent and severity of weather patterns as a result of global warming there is a broad-based scientific consensus that extreme weather events of some form will become more frequent and intense. Projections for Greater Manchester (Cavan, 2010) in the 2050s indicate that under a high emission scenario we may anticipate a 14% increase in winter precipitation from a 1961-1990 average baseline. Similarly, we may expect an average of 3 days per annum with temperatures over 30°C by the 2050s over a baseline of < 1 over the period 1961-1990.
Recent experiences of consecutive extreme weather events in Stockport demonstrate the fragility of our highway infrastructure. Since 2010 Stockport Council has made £3.7M of additional expenditure over and above basic Government capital maintenance funding to address the impacts of extreme weather on road surfaces and undertake associated drainage repairs.
Conclusion from 1.5.1.2
There is a need to plan for greater uncertainty. In order to do this we need to build up our intelligence base using data on changes in asset condition and associated maintenance costs as result of extreme weather events.
Preventative treatments will be crucial to increasing our resilience to climate change, particularly where they relate to prevention of water penetration or accommodating movements due to expansion and contraction in extreme temperatures.
1.5.1.3 Commodity price inflation The macro-economic context of infrastructure management has changed significantly in the last two decades and with rapid growth in China and South Asia in particular leading to a shift in the core of demand for raw construction materials and energy. Alongside this our dependence on bitumen bound materials for road surfacing means that highway maintenance services are comparatively more vulnerable to oil price volatility than other branches of the construction industry.
Whilst medium term forecasts indicate that Consumer Price inflation should remain within the 1.5-2.5% range (BoE, 2014), construction prices are expected to grow at a much faster rate over the next 4 years with estimates of annual tender price inflation in 2017 ranging between 4% and 7.3% across the UK and between 3.5% and 4.4% in the North-West (Gardiner & Theobold, Q2 2014, Sweett Group, Q1 2014). Given that the global construction market is forecast to grow by over 70% by 2025 (Global Construction Perspectives and Oxford Economics, 2013) it is likely that this inflation trend will continue.
Conclusion for 1.5.1.3
We need to engage with partners and contractors to identify ways of reducing dependence on primary raw materials and increase our resilience to volatile macro-economic conditions.
The difference between Consumer Price and Construction Price inflation represents a substantial comparative risk that needs to be explicitly quantified in investment forecasts for highways.
TAMS PART 1 CORE ASSET MANAGEMENT STRATEGY Stockport Council
10
1.5.2 Demand
1.5.2.1 Demographic trends The number of people nationally who are aged over 65 is expected to increase as a percentage of the total population from 16% in 2011 to 19% by 2021. In Stockport these figures are slightly higher at 17% in 2011 rising to 20% in 2021 although this is in stronger contrast with the situation across Greater Manchester as a whole where there is expected to be a far smaller increase from 15% to 16%3.
These demographic trends are likely to lead to a change in perceptions of safety on the highway network and the ease with which people are able to physically access services.
Equally, it is important to recognise the context of growing demand for older people’s services that will place greater and competing pressure on Council budgets. These pressures will inevitably place limits on our expectations for higher standards of condition and performance of the Borough’s highway network and will drive the need to find further efficiencies in the delivery of highway services in the medium term.
Conclusion for 1.5.2.1
In the context of competing demands on budgets it also important to recognise the fundamental contribution that highway maintenance services provides in enabling people, in particular people with restricted mobility, to live independent lives. With the expected rate of growth in the population of older people in the Borough in the next 20 years it is necessary to establish a long term strategy for meeting the travel needs of people with mobility and sensory impairments in particular.
The role of Stockport’s residential roads should be emphasised here as they form the start and end of the majority of journeys, in particular to bus and rail stations. We will seek to secure the necessary investments in Stockport’s residential roads as part of this strategy.
1.5.3 Opportunities
1.5.3.1 Opportunities for borrowing There are a number of alternative opportunities for borrowing to fund infrastructure
improvements including utilising the local authorities own opportunities, accessing funding
from the Public Works Loan Board (PWLB) or investigating the opportunities presented by
theLocal Capital Finance Company created by the LGA in associaton with a number of
authorities in 2014 .
Conclusion for 1.5.3.1
The TAMS Asset Investment Strategies (PART 2) provide very strong cases for investment
that would be suitable for prudential borrowing arrangements and indeed the Council has
already approved in February 2014 a first phase of borrowing for the Highway Investment
Programme (HIP).
3 ONS (2014)
TAMS PART 1 CORE ASSET MANAGEMENT STRATEGY Stockport Council
11
1.5.4 National policy and strategy
In September 2014, the Department for Transport undertook a policy review of local
highway maintenance funding with a view to incentivising greater efficiency in the delivery
of highway services. Whilst overall funding for local highway maintenance from 2015/16-
2020/21, as set out in the June 2013 statement, represents a 19% increase over the average
annual allocation over the period 2012-15, the Department has established the principle
that Local Authorities’ relative share of this funding will be subject to new criteria reflecting
the extent to which they have planned or implemented measures to increase short and long
term efficiency.
In terms of the scale of efficiency measures envisaged, the Department for Transport has
endorsed targets established by the Highways Maintenance Efficiency Programme (HMEP),
which is an industry partnership with public and private sector organisations (including Local
Authorities). In December 2013 HMEP published its annual plan with targets to achieve 15%
efficiency gains by 2015 and 30% by 2020 across the industry. The incentive mechanisms
being proposed through the review of capital funding will be designed to support the
achievement of these targets.
More relevant to the construction industry as a whole, in July 2013 the Government
published its Industrial Strategy for Construction, titled Construction 2025 which outlines
shared priorities between the Government and the construction industry. The strategy
vision includes an efficiency target to reduce overall lifecycle costs of assets by 33% over a
2009/10 baseline, which broadly aligns with the HMEP target. A further target is introduced
to reduce greenhouse gas emissions from the built environment by 50% over 1990 levels.
The strategy includes a new review of procurement to promote greater efficiency and
address persisting problems of a highly fragmented client base and poor economies of scale.
It also seeks to promote the UK’s research and innovation capability, in particular in the
development of low carbon construction materials and methods.
Conclusions for 1.5.4
The TAMS will present strong evidence of our commitment to contribute to national
efficiency targets for both the highways sector and the construction industry as a whole
through the adoption of investment strategies that minimise long term costs. At the same
time it is important to recognise opportunities arising from the economies of scale that
these investment strategies produce to establish appropriate targets for reducing unit costs
and lifecycle carbon emissions. This should also ensure that we are able to secure our share
of central government capital grant over the period 2015/16-2020/21.
1.5.5 Greater Manchester Strategy and Growth and Reform Plan
The Greater Manchester Strategy 2013 sets out aspirations to create a new model for low
carbon growth and to become a city region that can compete for international investment
TAMS PART 1 CORE ASSET MANAGEMENT STRATEGY Stockport Council
12
and skills. The quality of public realm as well as the connections to the surrounding natural
environment will be crucial assets in achieving this.
The strategy recognises the need for a more sustainable approach to the management of
existing highway infrastructure and contains proposals for a review of delivery of highway
services across the city region to identify where economies of scale can be achieved whilst
ensuring that local priorities can still be addressed.
As part of the Growth and Reform Plan submitted to Government in March 2014 the GMCA,
AGMA and GMLEP have secured an agreement through a City Growth Deal with
Government to increase the flexibility of funding structures so that they can be aligned to
local needs.
Conclusions for 1.5.5
The review of governance and delivery of highway services will substantially influence the efficiency outcomes discussed in the previous section. However, as the timescales of this governance review do not align with the TAMS it is recommended that separate or interim efficiency targets are established for the specific investment programmes detailed in PART 2.
Given this context it is inappropriate for the TAMS to include recommendations that pre-suppose a particular governance structure for delivery of highway services. Nonetheless, Stockport Council will ensure that objectives and targets established through the TAMS form the basis for output specifications. The level of ambition in the TAMS objectives will also reflect the opportunities that will arise from long term partnership approaches and bulk purchasing arrangements to explore fresh solutions to some of the key sustainability challenges that Stockport Council faces. Given the level of ambition required to tackle these challenges it is recommended that a Competitive Dialogue Procedure process is considered as part of the procurement of a new delivery framework.
Following the announcement of the Growth Deal for Greater Manchester in July 2014, the introduction of greater flexibility of funding arrangements in Greater Manchester may present important opportunities for bidding to the Greater Manchester Local Enterprise Partnership (GMLEP) and Local Transport Board (GMLTB) to secure the shortfalls in funding identified below in PART 2 and ANNEX 4.
1.5.6 Greater Manchester Local Transport Plan (GMLTP)
The current third Greater Manchester Local Transport Plan (GMLTP3) sets out key priorities for the city region transport network. In the light of growing concern about the resilience of the transport network to the effects of climate change and the implications for economic growth the GMLTP3 places emphasis on the role of asset management in supporting the wider aspirations for meeting and managing travel demand in the conurbation. Particular priorities that the TAMS support are:
Maintain high standards of safety and reliability on the network to support economic growth

TAMS PART 1 CORE ASSET MANAGEMENT STRATEGY Stockport Council
13
Improve the resilience of the highway network to the effects of climate change by undertaking timely preventative maintenance and incorporating risk assessment of critical infrastructure.
Improve the reliability of the highway network by ensuring the traffic impacts of alternative lifecycle options are considered in the identification of investment strategies
Use best practice procurement to minimise the carbon impact of infrastructure maintenance investments and in particular their dependence on primary oil supplies.
Reduce the incidence and severity of casualties on the network through risk based maintenance of roads, pavements, lighting and structures
Increase walking and cycling in priority neighbourhoods by improving the quality of public realm
Ensuring that the public realm meets the needs of all users including those with mobility and sensory impairments.
Minimising traffic noise by improving and maintaining ride quality in sensitive areas
Maximise value for money through the implementation of asset management and network management approaches.
Conclusions for 1.5.6
The TAMS will support GMLTP objectives through the development of relevant service levels, long term investment strategies and decision making criteria and weightings for the prioritisation of medium term (3-5 year) maintenance programmes. Some of these objectives are more relevant to specific asset types and so links to these objectives will be clarified in PART 2.
Transport for Greater Manchester has started consultation on the Greater Manchester
Transport Strategy 2040. This identifies maintenance and renewal as vital to the safety
and efficiency of the network. This is an initial step in the replacement of the Local
Transport Plan 3 when the full Greater Manchester Transport Strategy and delivery plan is
publicised in 2016.
TAMS PART 1 CORE ASSET MANAGEMENT STRATEGY Stockport Council
14
1.5.7 Stockport 2020 and the Council Plan 2015-16
Stockport 2020 is Stockport’s overarching Community Strategy setting out the shared
priorities of Stockport Council and its public, private and voluntary sector partners.
Brief explanations are provided below to demonstrate the strength of the relationship
between the TAMS and the priority outcomes in Stockport 2020 and the Council Plan:
Stockport benefits from a thriving economy: Stockport plays a key role in the economy of
Greater Manchester, and many residents both benefit from and help create a thriving local
economy. The Borough though still has pockets of above-average deprivation, where better
skills and training are needed to reverse long-term unemployment and the impact this can
have on wider social issues. Achieving this outcome also means making the right
investments across the Borough, but particularly to help our Town Centre fulfil its potential
to be the best in the southern part of Greater Manchester.
Although independent evidence of the direct effects of road and pavement condition on
economic vitality is limited, in a recent survey of small to medium enterprises across the UK4
the condition of local roads emerged as a key factor in selecting new business locations
ahead of proximity to major rail hubs or airports. The Stockport Highway Design Guide
supports the need for efficient and appropriate maintenance of the borough will still
providing quality which supports economic vitality.
Conclusion for 1.5.7
Prioritisation of public realm maintenance in the Town Centre and other district and local
centres in the 3-5 year rolling programmes will play a significant role in attracting inward
investment and enabling regeneration and will complement new and enhanced
infrastructure proposals (e.g. Town Centre Access Package) in delivering these outcomes.
People are able to make informed choices and look after themselves: Most people rely on their own skills and knowledge, and on friends, families and their local community, to deal with most of what life throws at them. It’s vital that people continue to acquire and use these skills confidently in order to live independent and fulfilling lives.
Evidence from regular meetings with disabled groups5 has highlighted that poor condition of
pavements can be a critical factor affecting the ability of people with mobility and sensory
impairments to access services. Annual attitudinal surveys of Stockport residents6 also show
that people with long term disabilities are significantly less satisfied with the condition of
footways (34%) than has been the case for the sample as a whole (46%).
Conclusion for 1.5.7
It is important to continue to work with local groups for people with mobility and sensory
4 YouGov – AIA survey into the impact of local road condition on SMEs (2012) 5 Stockport Disability Transport and Access Forum
6 National Highways and Transportation Survey (IPSOS Mori)

TAMS PART 1 CORE ASSET MANAGEMENT STRATEGY Stockport Council
15
impairments to ensure that the TAMS will deliver real improvements to people’s lives. We
will also continue to monitor the specific levels of satisfaction amongst respondents with
long term disabilities through annual attitudinal surveys.
Stockport is a place people want to live: Increasing prosperity in some parts of the Borough
will lead to other challenges which will need to be managed; in other places this outcome
will only be achieved if there is investment to build more sustainable communities.
In a Borough with substantial rural areas that penetrate into the urban areas along river
valleys it is clear that dependencies between our transport infrastructure and the natural
environment work both ways. The stability of slopes supporting our highways and control of
surface water is dependent on adequate levels of vegetation and tree cover. Equally,
maintenance of complex drainage infrastructure is necessary to prevent major pollution
incidents during heavy rainfall events. Our vulnerability due to dependence on global
natural resources has been discussed in section 1.5.1.3 in relation to risks from price
instability and again in section 1.5.6 in relation to the GMLTP objective to reduce
dependence on oil reserves.
Conclusion for 1.5.7
There is considerable scope to achieve multiple objectives at the local level through
preventative maintenance and enhancement approaches, such as vegetating slopes. Equally
the TAMS recognises that there will be opportunities to reduce raw material consumption
through recycling methods or lowering energy requirements that will enable us to meet
both cost efficiency and environmental objectives.
1.5.8 Town Centre regeneration proposals and the Town Centre Access Plan
The Town Centre Prospectus outlines Stockport Council’s key regeneration proposals for the
Town Centre including proposals for Redrock, Stockport Exchange, Gorsy Bank and the
Covent Garden housing plan. It is recognised that these proposals need to be underpinned
by a transformational improvement in the connectivity with and within the Town Centre to
ensure that the Town Centre can attract the inward investment required. The Town Centre
Access Plan has been developed specifically to tackle under-capacity at key links between
the A6 and the M60 and accessibility improvements for walking and cycling into and across
the Town Centre. It is included within the Growth Deal package and Phase 1 has been
approved by the Greater Manchester Combined Authority. Phase 1 implementation has
begun on site in spring 2015. Phase 2 is being developed and subject to the same approval
process will commence delivery in spring 2017.
The town centre proposals will be informed by the Green Infrastructure Plan for the Town
Centre and the Highways and Street Furniture Design Guide.
TAMS PART 1 CORE ASSET MANAGEMENT STRATEGY Stockport Council
16
Stockport Town Centre contains a number of critical structures that support major retail
areas (Merseyway), routes through the Town Centre (Wellington Road Viaduct) and routes
linking to the M60 (Greek St Bridge). A number of these structures have been identified in
the Bridge Asset Investment Strategy as being at risk or requiring interventions in the short
to medium term. The nature of these structures is such that our approach to addressing
these issues should be integral to the proposals for the Town Centre. These are discussed
further in a section of the Bridge Asset Investment Strategy.
Conclusion for 1.5.8
Town Centre proposals will need to be considered in tandem with key works required to
critical structures in the Town Centre. Whilst some of these interventions are preventative
(such as waterproofing) the overall reduction in lifecycle costs achieved by the interventions
should be carefully considered against the potential for additional disruption to businesses
and the regeneration proposals around Redrock and Merseyway.
TAMS PART 1 CORE ASSET MANAGEMENT STRATEGY Stockport Council
17
1.6 CORE ASSET MANAGEMENT OBJECTIVES Our objectives for asset management are derived from understanding of the contextual
issues described above and recognition of the potential contribution of the TAMS to
national, regional and local policy and strategy. Some of these objectives have yet to be
defined as fully measurable targets and actions to address this are described in the Core
Transport Asset Management Strategy in Section 1.7 below. Other objectives are linked to
service level targets described in the individual Asset Investment Strategies.
CO1 To ensure that risks to the safety and well-being of current and future users of
Stockport’s transport network are minimised.
CO2 To ensure that service level options do not result in higher and unaffordable future
costs to rate payers, businesses and road users during and beyond the 20 year strategy
period
CO3 To ensure that the condition of our transport network is maintained to a level that
minimises risk of disruption to traffic particularly as a result of extreme weather events
CO4 To minimise the cost of third party claims for damage or injury
CO5 To build financial resilience to the effects of rising raw material prices
CO6 To ensure that the condition of the public realm encourages walking and cycling and
enables accessibility for all.
CO7 To ensure that the condition of our public realm in designated retail and
employment centres is maintained to a level that can support and enhance economic
activity
CO8 To ensure that the condition and appearance of the public realm is maintained such
that it supports regeneration and community cohesion
CO9 To protect and enhance the local natural environment in areas where our
infrastructure both impacts on and depends on sensitive habitats
CO10 To minimise the contribution of transport infrastructure to adverse environmental
impacts
CO11 To reduce lifecycle carbon emissions from our transport infrastructure throughout
the supply chain
CO12 To ensure appropriate communication with all stakeholders on issues impacting on
our transport infrastructure
TAMS PART 1 CORE ASSET MANAGEMENT STRATEGY Stockport Council
18
1.7 CORE ASSET MANAGEMENT STRATEGY The Core Transport Asset Management Strategy provides the high level actions required to
deliver the above objectives.
Central to the strategy is the identification of a £134M capital investment in maintenance of
highways and structures over the next 8 years (from 2015/16-2022/23) and continued
annual investments from 2023 onwards to maintain the network in a steady state. The full
proposed 20 year financial profile is contained in ANNEX 4. The investment is needed to
improve the current condition and performance of the network, minimise potential for
disruption to traffic and importantly address a growing backlog of preventative
maintenance to reduce deterioration rates that are currently growing to unsustainable
levels.
£100M of capital funds have been identified as part of the 8 year programme subject to a
mid-term review in 2018, which includes £88M of unsupported borrowing for the Highway
Investment Programme and Footway Invest to Save. However, there is a need to identify
funding sources for a potential additional £22M for highway structures, drainage and street
lighting for 2015/16-2022/23.
The proposed financial profile in ANNEX 4 crucially identifies the shortfall in funding to
maintain the network in a steady state from 2023 onwards. On the basis of lowest cost
lifecycle models and current unit costs the requirement for capital maintenance expenditure
is £10M per annum The strategy is therefore focused towards driving efficiency and
effectiveness in the delivery process and engaging with partner Research &Development
organisations to identify solutions that provide lower unit costs over the whole life cycle and
engaging more widely with DfT and Greater Manchester bodies to identify funding sources.
It is important to note that the financial profilel in ANNEX 4 includes expected inflation for
those particular maintenance types. In most cases the inflation rates are higher than Bank of
England projections for Consumer Price Inflation and this reflects the actual trend over the
last 25 years.
Table 1.7 Core Transport Asset Management Strategy
Ref Description Objectives
CS1 We will pursue the 8 year investment strategies contained in PART 2
and summarised in ANNEX 4 including £134M of investment from
2015/16 to 2022/23 in order to improve overall condition, address a
backlog of preventative maintenance and reduce deterioration rates.
We will engage both internally and externally with LGA, DfT and GM
LEP on options for meeting the shortfall in available funds over the next
8 years.
CO1/ CO2
CO3 / CO4
CO6 / CO7
CO8 / CO9
CO10
TAMS PART 1 CORE ASSET MANAGEMENT STRATEGY Stockport Council
19
Ref Description Objectives
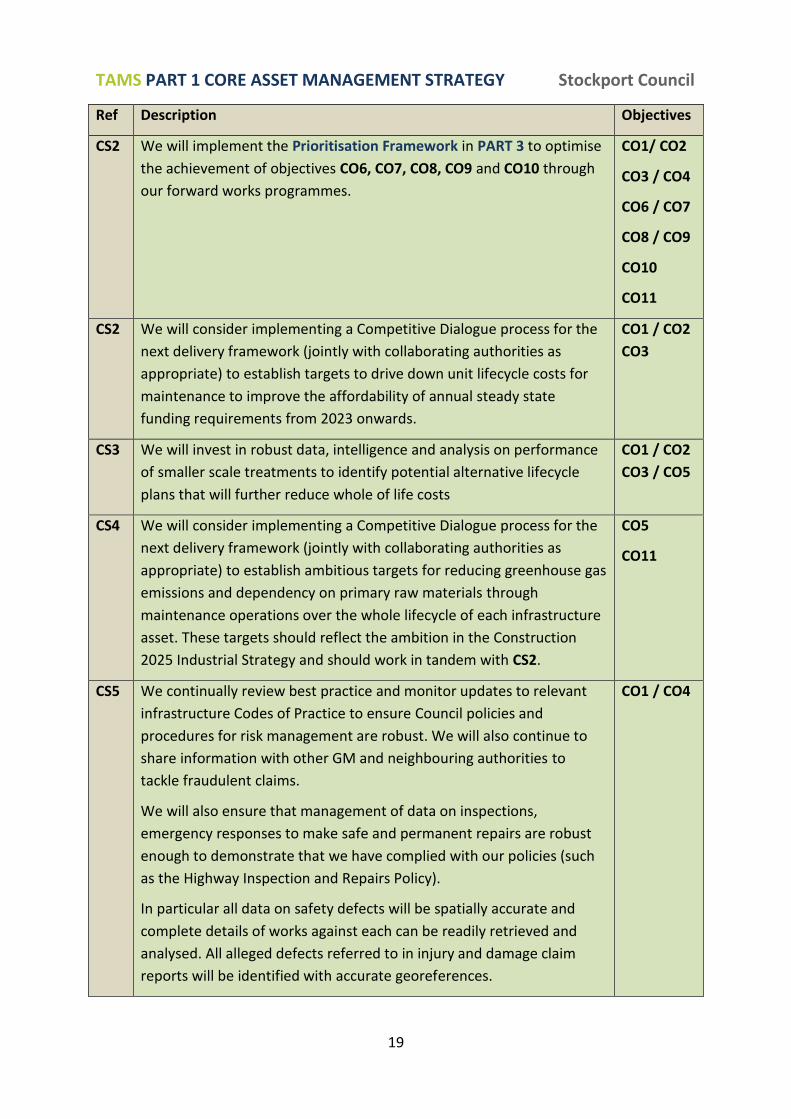
CS2 We will implement the Prioritisation Framework in PART 3 to optimise
the achievement of objectives CO6, CO7, CO8, CO9 and CO10 through
our forward works programmes.
CO1/ CO2
CO3 / CO4
CO6 / CO7
CO8 / CO9
CO10
CO11
CS2 We will consider implementing a Competitive Dialogue process for the
next delivery framework (jointly with collaborating authorities as
appropriate) to establish targets to drive down unit lifecycle costs for
maintenance to improve the affordability of annual steady state
funding requirements from 2023 onwards.
CO1 / CO2
CO3
CS3 We will invest in robust data, intelligence and analysis on performance
of smaller scale treatments to identify potential alternative lifecycle
plans that will further reduce whole of life costs
CO1 / CO2
CO3 / CO5
CS4 We will consider implementing a Competitive Dialogue process for the
next delivery framework (jointly with collaborating authorities as
appropriate) to establish ambitious targets for reducing greenhouse gas
emissions and dependency on primary raw materials through
maintenance operations over the whole lifecycle of each infrastructure
asset. These targets should reflect the ambition in the Construction
2025 Industrial Strategy and should work in tandem with CS2.
CO5
CO11
CS5 We continually review best practice and monitor updates to relevant
infrastructure Codes of Practice to ensure Council policies and
procedures for risk management are robust. We will also continue to
share information with other GM and neighbouring authorities to
tackle fraudulent claims.
We will also ensure that management of data on inspections,
emergency responses to make safe and permanent repairs are robust
enough to demonstrate that we have complied with our policies (such
as the Highway Inspection and Repairs Policy).
In particular all data on safety defects will be spatially accurate and
complete details of works against each can be readily retrieved and
analysed. All alleged defects referred to in injury and damage claim
reports will be identified with accurate georeferences.
CO1 / CO4
TAMS PART 1 CORE ASSET MANAGEMENT STRATEGY Stockport Council
20
Ref Description Objectives
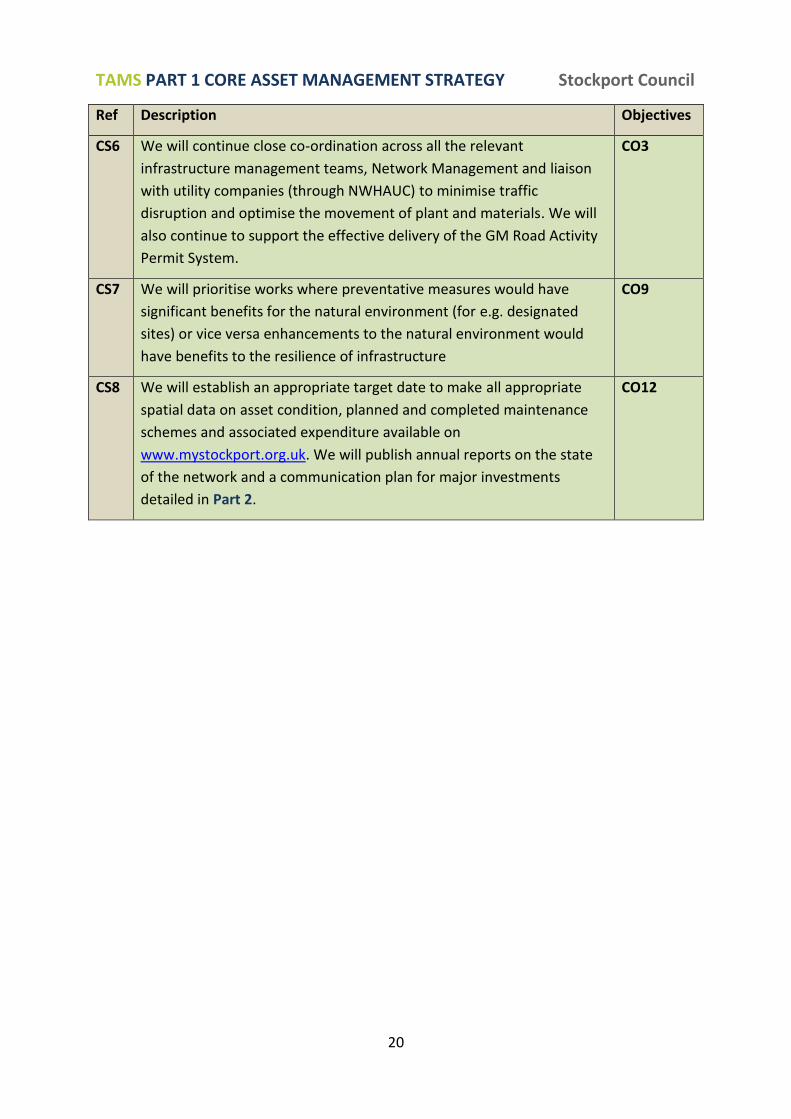
CS6 We will continue close co-ordination across all the relevant
infrastructure management teams, Network Management and liaison
with utility companies (through NWHAUC) to minimise traffic
disruption and optimise the movement of plant and materials. We will
also continue to support the effective delivery of the GM Road Activity
Permit System.
CO3
CS7 We will prioritise works where preventative measures would have
significant benefits for the natural environment (for e.g. designated
sites) or vice versa enhancements to the natural environment would
have benefits to the resilience of infrastructure
CO9
CS8 We will establish an appropriate target date to make all appropriate
spatial data on asset condition, planned and completed maintenance
schemes and associated expenditure available on
www.mystockport.org.uk. We will publish annual reports on the state
of the network and a communication plan for major investments
detailed in Part 2.
CO12
TAMS PART 1 CORE ASSET MANAGEMENT STRATEGY Stockport Council
21
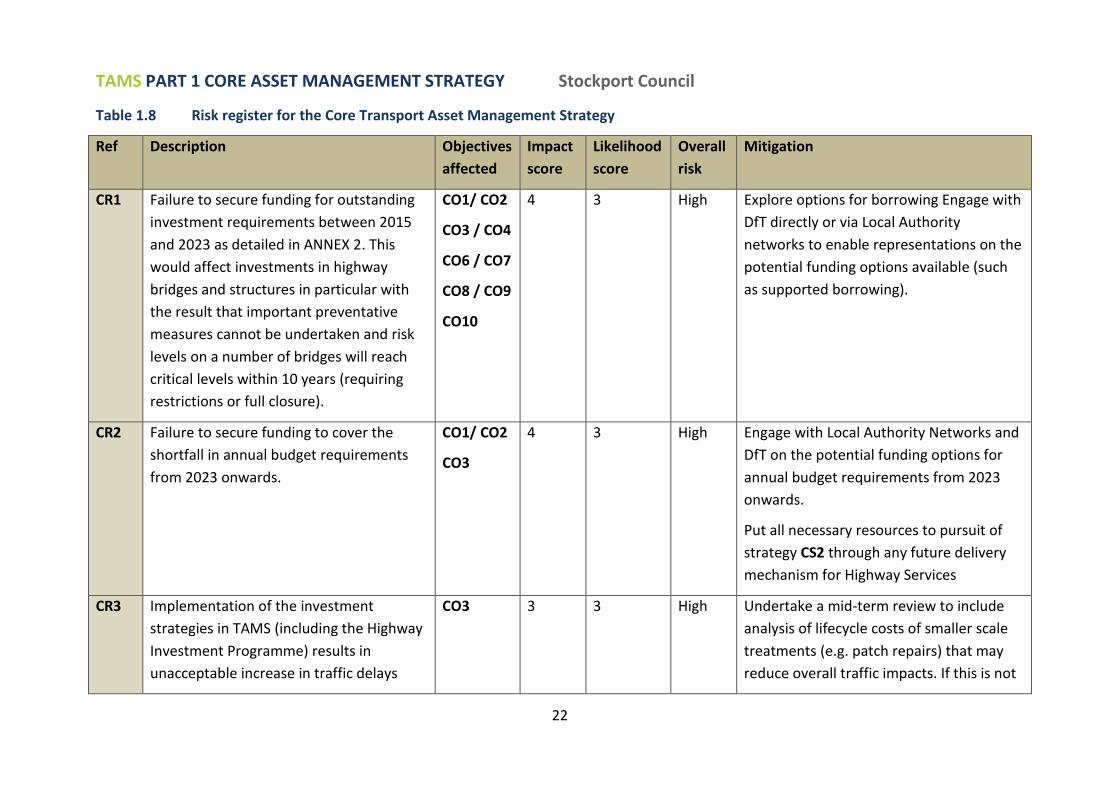
1.8 STRATEGIC RISKS It is recognised that there are many uncertainties currently within the Core Transport Asset
Management Strategy and key actions are subject to significant risks, notably our ability to
meet funding requirements for identified investment needs. These risks are contained
within the Strategic Risk Register in Table 1.8 below.
The Strategic Risk Register is structured in line with Stockport Council’s Risk Management
Framework and Strategy and will be reported annually to the Executive Member
(Supporting Places). Only medium and high risk items are included here.
TAMS PART 1 CORE ASSET MANAGEMENT STRATEGY Stockport Council
22
Table 1.8 Risk register for the Core Transport Asset Management Strategy
Ref Description Objectives
affected
Impact
score
Likelihood
score
Overall
risk
Mitigation
CR1 Failure to secure funding for outstanding
investment requirements between 2015
and 2023 as detailed in ANNEX 2. This
would affect investments in highway
bridges and structures in particular with
the result that important preventative
measures cannot be undertaken and risk
levels on a number of bridges will reach
critical levels within 10 years (requiring
restrictions or full closure).
CO1/ CO2
CO3 / CO4
CO6 / CO7
CO8 / CO9
CO10
4 3 High Explore options for borrowing Engage with
DfT directly or via Local Authority
networks to enable representations on the
potential funding options available (such
as supported borrowing).
CR2 Failure to secure funding to cover the
shortfall in annual budget requirements
from 2023 onwards.
CO1/ CO2
CO3
4 3 High Engage with Local Authority Networks and
DfT on the potential funding options for
annual budget requirements from 2023
onwards.
Put all necessary resources to pursuit of
strategy CS2 through any future delivery
mechanism for Highway Services
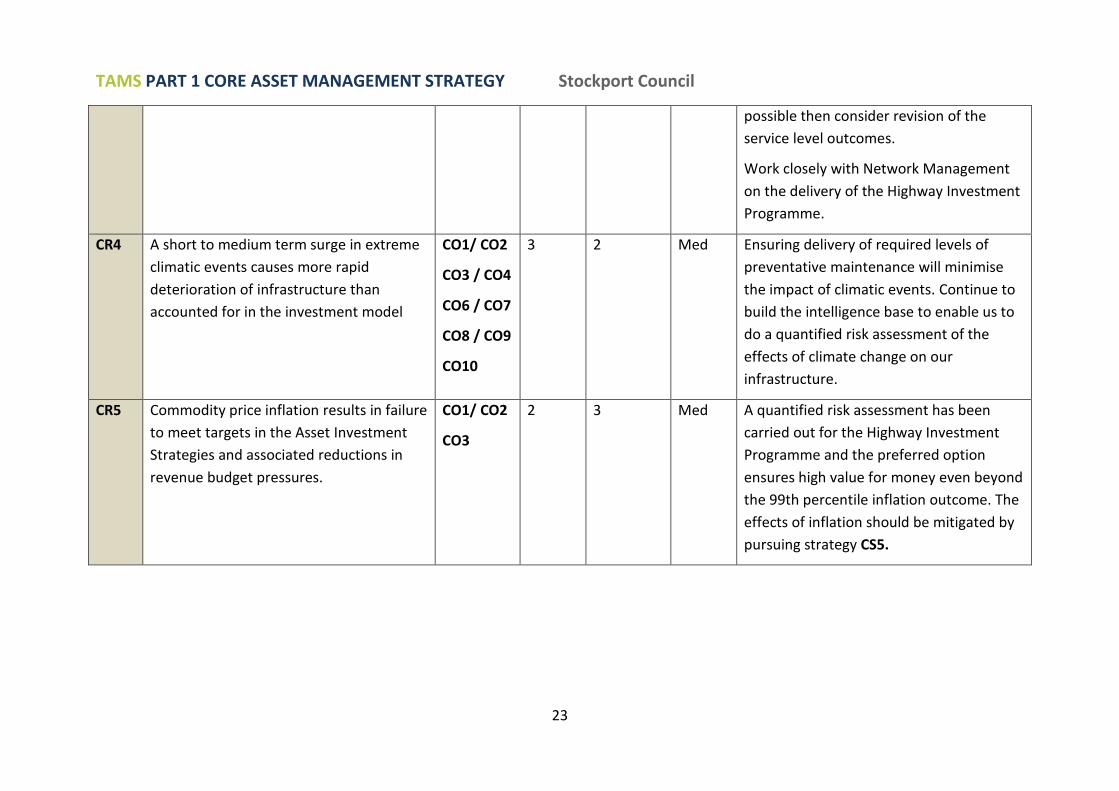
CR3 Implementation of the investment
strategies in TAMS (including the Highway
Investment Programme) results in
unacceptable increase in traffic delays
CO3 3 3 High Undertake a mid-term review to include
analysis of lifecycle costs of smaller scale
treatments (e.g. patch repairs) that may
reduce overall traffic impacts. If this is not
TAMS PART 1 CORE ASSET MANAGEMENT STRATEGY Stockport Council
23
possible then consider revision of the
service level outcomes.
Work closely with Network Management
on the delivery of the Highway Investment
Programme.
CR4 A short to medium term surge in extreme
climatic events causes more rapid
deterioration of infrastructure than
accounted for in the investment model
CO1/ CO2
CO3 / CO4
CO6 / CO7
CO8 / CO9
CO10
3 2 Med Ensuring delivery of required levels of
preventative maintenance will minimise
the impact of climatic events. Continue to
build the intelligence base to enable us to
do a quantified risk assessment of the
effects of climate change on our
infrastructure.
CR5 Commodity price inflation results in failure
to meet targets in the Asset Investment
Strategies and associated reductions in
revenue budget pressures.
CO1/ CO2
CO3
2 3 Med A quantified risk assessment has been
carried out for the Highway Investment
Programme and the preferred option
ensures high value for money even beyond
the 99th percentile inflation outcome. The
effects of inflation should be mitigated by
pursuing strategy CS5.

TAMS PART 2 ASSET INVESTMENT STRATEGIES Stockport Council
24
PART 2 ASSET INVESTMENT STRATEGIES
TAMS PART 2 ASSET INVESTMENT STRATEGIES Stockport Council
25
2.1 INTRODUCTION This section details the links between the issues, challenges and high level strategy
objectives described in Section 4.2 and the specific performance requirements for
particular asset types. This translates into detailed objectives and investment strategies.
A summary of Stockport’s transport assets is given in ANNEX 1. This also provides a
summary of the financial indicators reported in the closing accounts for 2013/14 as part of
the Whole of Government Accounts return.
A tabular summary of the preferred 20 year investment projection for all asset types is
presented in ANNEX 2, detailing projected funding sources and shortfalls. The approaches
to addressing the funding shortfalls are described in the relevant sections.
Asset investment strategies are described for the following asset types:
SECTION 2.2 ROADS
SECTION 2.3 PAVEMENTS, FOOTPATHS AND CYCLEWAYS
SECTION 2.4 HIGHWAY BRIDGES AND STRUCTURES
In each section the following aspects are covered:
1. Classification and inventory
2. Trends in investment and performance
3. Future demands and risks
4. Forecasts of condition and performance
5. Objectives
6. Strategy
7. Risk management
8. Monitoring
9. Review
Further work is required to address important gaps in condition and risk data for Street
Lighting, Drainage and Public Rights of Way before a clear strategic direction can be defined
for these assets. However, available information on performance is presented in:
SECTION 2.5 HIGHWAY DRAINAGE
SECTION 2.6 PUBLIC RIGHTS OF WAY
SECTION 2.7 STREET LIGHTING
SECTION 2.8 STREET FURNITURE
SECTION 2.9 HIGHWAY GREEN INFRASTRUCTURE
TAMS PART 2 ASSET INVESTMENT STRATEGIES Stockport Council
26
2.2 ROADS
2.2.1 Classification and inventory
A summary of Stockport’s road network inventory is given in terms of length and surface
area in ANNEX 3. The summary also presents a full valuation of Stockport’s road assets
which include the gross value (referred to as Gross Replacement Cost – see the GLOSSARY
AND ACRONYMS in ANNEX 1) of the road surface, underlying structure and associated
lining and iron work, which stands at £1.106bn.
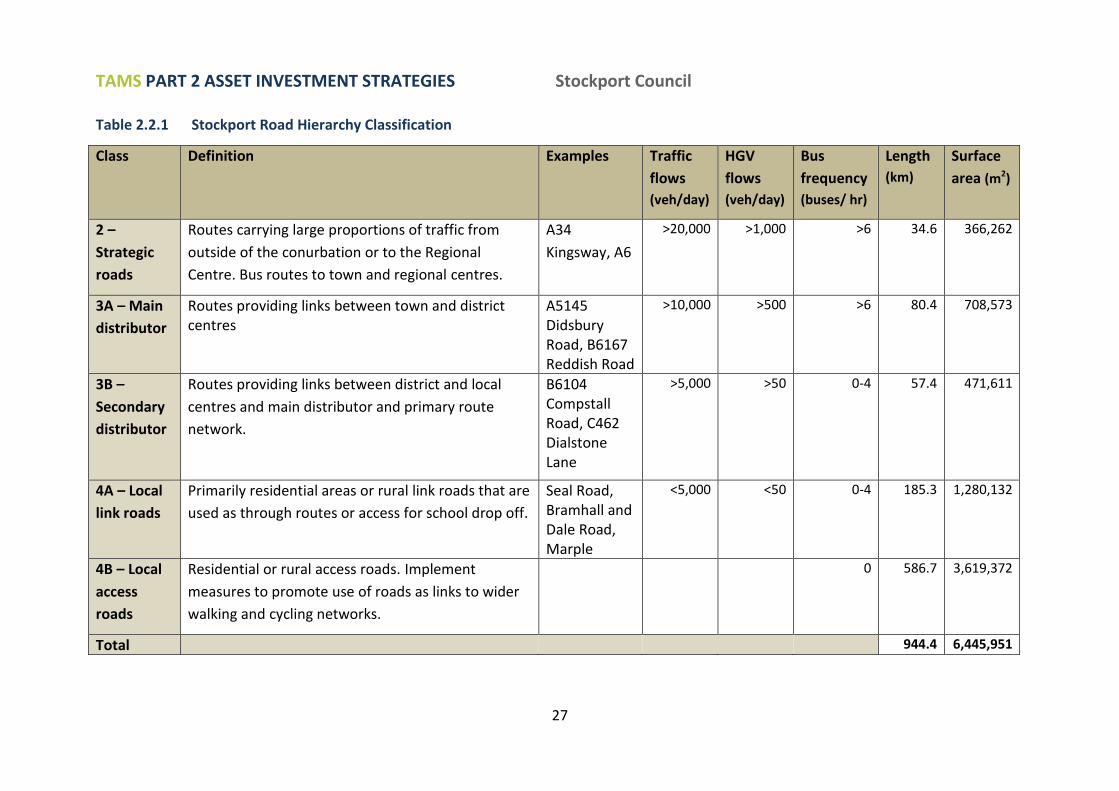
2.2.1.1 Road hierarchy classification For the purposes of risk prioritisation and network management Stockport Council uses a
local road hierarchy in accordance with the Code of Practice for Highways Maintenance
Management. These do not align exactly with the national road classifications presented in
ANNEX 3. These are defined in Table 2.2.1 overleaf.
Additionally, within each of these road classes it is important to consider a Cycle Network
Hierarchy to reflect the level of risk to cyclists on our roads and the actual levels of cycling
on those routes. Currently our Cycle Network Hierarchy only considers the actual provision
of on-road cycle lanes (see ANNEX 3). However, prioritising maintenance on this basis will
be ineffective in targeting resources to achieve the most benefit for cyclists’ safety. It is
therefore important that this hierarchy is refined in future reviews.
Summary
The road hierarchy is an important element of TAMS and will be used as a means of
prioritising forward works programmes. It also determines inspection frequencies as
detailed in the Highway Inspection and Repairs Policy and Plan
(http://www.stockport.gov.uk/2013/3006/53395/highwaysafetyinspectionandrepairsplan)
TAMS PART 2 ASSET INVESTMENT STRATEGIES Stockport Council
27
Table 2.2.1 Stockport Road Hierarchy Classification
Class Definition Examples Traffic
flows
(veh/day)
HGV
flows
(veh/day)
Bus
frequency
(buses/ hr)
Length
(km)
Surface
area (m2)
2 –
Strategic
roads
Routes carrying large proportions of traffic from
outside of the conurbation or to the Regional
Centre. Bus routes to town and regional centres.
A34
Kingsway, A6
>20,000
>1,000 >6 34.6 366,262
3A – Main
distributor
Routes providing links between town and district centres
A5145 Didsbury Road, B6167 Reddish Road
>10,000 >500 >6 80.4 708,573
3B –
Secondary
distributor
Routes providing links between district and local
centres and main distributor and primary route
network.
B6104 Compstall Road, C462 Dialstone Lane
>5,000 >50 0-4 57.4 471,611
4A – Local
link roads
Primarily residential areas or rural link roads that are
used as through routes or access for school drop off.
Seal Road, Bramhall and Dale Road, Marple
<5,000 <50 0-4 185.3 1,280,132
4B – Local
access
roads
Residential or rural access roads. Implement
measures to promote use of roads as links to wider
walking and cycling networks.
0 586.7 3,619,372
Total 944.4 6,445,951
TAMS PART 2 ASSET INVESTMENT STRATEGIES Stockport Council
28
2.2.2 Trends in roads investment and performance
This section summarises historical trends in capital investment in road maintenance and the resulting performance of the road network.
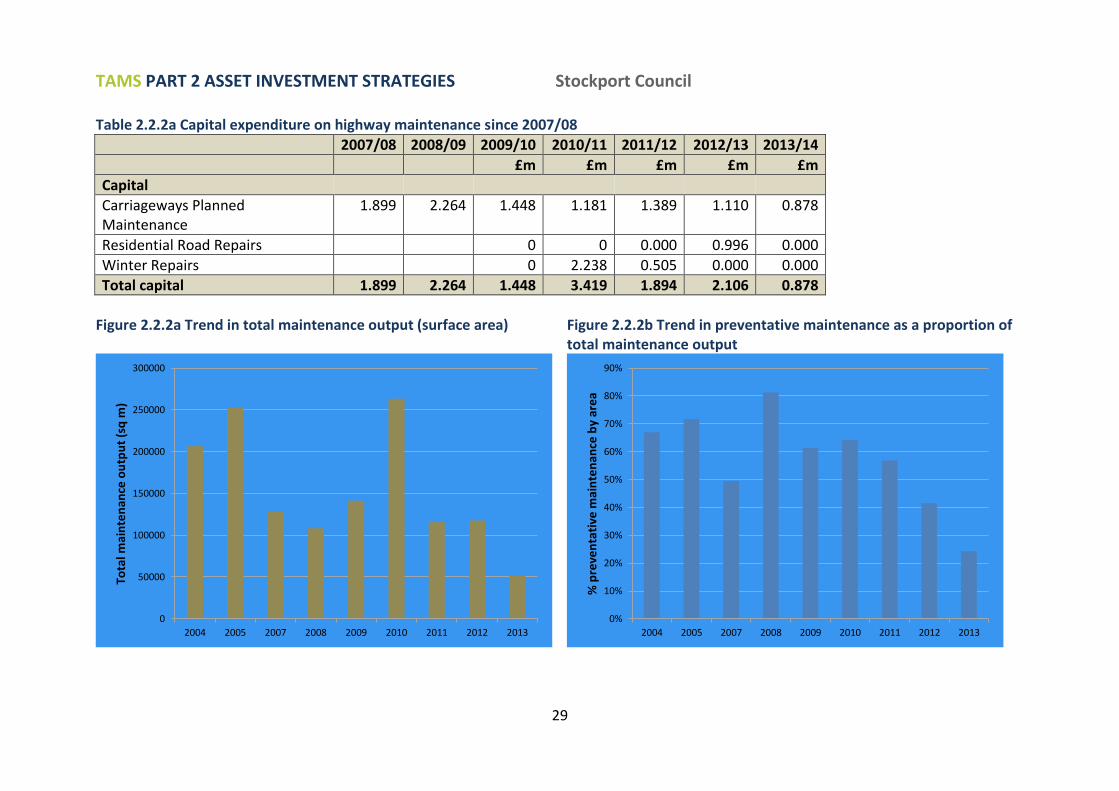
2.2.2.1 Investment and maintenance output Table 2.2.2a shows the trend in capital spend on road maintenance since 2007/08. A particular pattern since 2010/11 has been an increase in the use of supplementary funds to address sudden deterioration across the network due to extreme weather, notably in 2010/11 with the £2.238M winter repairs fund of which Stockport Council directly contributed £2.000M of capital funding. However over the period basic allocations through the capital maintenance block have declined steadily.
Figure 2.2.2a shows the trend in total maintenance output since 2004/05. This shows that, with the exception of the 2010/11 programme with elevated funding, output has been steadily declining. This is in part due to the decline in capital funding but has also been compounded by price inflation for maintenance work which has risen far above the Consumer Price Index over the period. For example unit costs for carriageway resurfacing rose by over 45% between 2004/05 and 2013/14.
Figure 2.2.2b demonstrates that this decline has been at the expense of preventative treatments which comprised only 24% of the maintenance output in 2013/14 compared to 67% in 2004/05. The decline in preventative maintenance has been as a result of pressure to prioritise limited funding towards addressing roads in poorest condition.
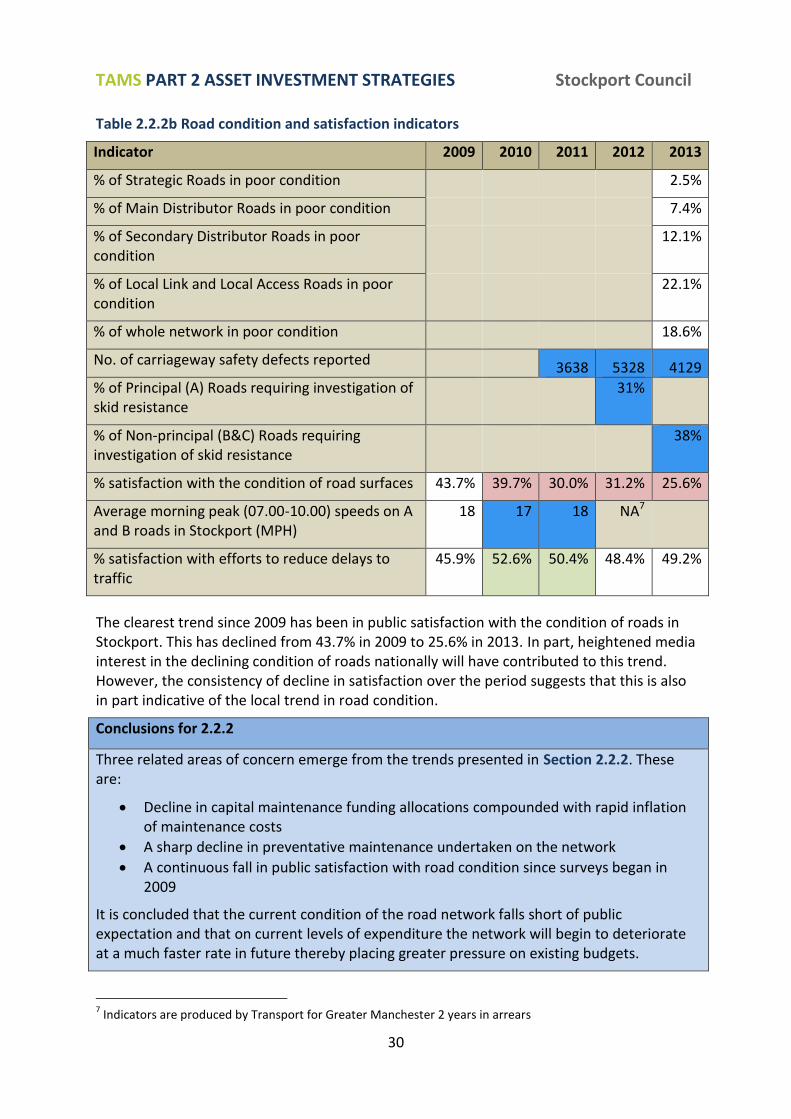
2.2.2.2 Performance Table 2.2.2b provides a summary of condition and performance indicators for roads since 2009. An explanation of the indicators is provided in Boxes 2.2.2a, b and c.
There is a lack of consistent historical data on road condition as previous surveys
undertaken to produce the National Indicators for road condition were too unreliable for
asset management purposes. Reliable condition trends are critical for asset management
planning and the 2013 figures should now provide a firm baseline for future monitoring. In
particular the 2013 condition survey highlights significant proportions of roads that are in
mid to late stages in the lifecycle where more rapid deterioration will be expected. This
would indicate the potential for more rapid decline in the condition of the network in the
next 5-10 years. Modelling work has been undertaken that draws out underlying evidence
from the 2013 condition data and historical maintenance records to provide forecasts of
changes in condition. This is work is described further in Section 2.2.4.
Consistent data on safety defects is only available from 2011 (see Box 2.2.2a for an
explanation). With only 3 points of data it is not possible to provide a clear picture of trends
since then and it is crucial that consistent monitoring is undertaken to inform future reviews
of the TAMS.
TAMS PART 2 ASSET INVESTMENT STRATEGIES Stockport Council
29
Table 2.2.2a Capital expenditure on highway maintenance since 2007/08
2007/08 2008/09 2009/10 2010/11 2011/12 2012/13 2013/14
£m £m £m £m £m
Capital
Carriageways Planned Maintenance
1.899 2.264 1.448 1.181 1.389 1.110 0.878
Residential Road Repairs 0 0 0.000 0.996 0.000
Winter Repairs 0 2.238 0.505 0.000 0.000
Total capital 1.899 2.264 1.448 3.419 1.894 2.106 0.878
Figure 2.2.2a Trend in total maintenance output (surface area) Figure 2.2.2b Trend in preventative maintenance as a proportion of
total maintenance output
0
50000
100000
150000
200000
250000
300000
2004 2005 2007 2008 2009 2010 2011 2012 2013
Tota
l mai
nte
nan
ce o
utp
ut
(sq
m)
0%
10%
20%
30%
40%
50%
60%
70%
80%
90%
2004 2005 2007 2008 2009 2010 2011 2012 2013
% p
reve
nta
tive
mai
nte
nan
ce b
y ar
ea
TAMS PART 2 ASSET INVESTMENT STRATEGIES Stockport Council
30
Table 2.2.2b Road condition and satisfaction indicators
Indicator 2009 2010 2011 2012 2013
% of Strategic Roads in poor condition 2.5%
% of Main Distributor Roads in poor condition 7.4%
% of Secondary Distributor Roads in poor condition
12.1%
% of Local Link and Local Access Roads in poor condition
22.1%
% of whole network in poor condition 18.6%
No. of carriageway safety defects reported 3638 5328 4129
% of Principal (A) Roads requiring investigation of skid resistance
31%
% of Non-principal (B&C) Roads requiring investigation of skid resistance
38%
% satisfaction with the condition of road surfaces 43.7% 39.7% 30.0% 31.2% 25.6%
Average morning peak (07.00-10.00) speeds on A and B roads in Stockport (MPH)
18 17 18 NA7
% satisfaction with efforts to reduce delays to traffic
45.9% 52.6% 50.4% 48.4% 49.2%
The clearest trend since 2009 has been in public satisfaction with the condition of roads in Stockport. This has declined from 43.7% in 2009 to 25.6% in 2013. In part, heightened media interest in the declining condition of roads nationally will have contributed to this trend. However, the consistency of decline in satisfaction over the period suggests that this is also in part indicative of the local trend in road condition.
Conclusions for 2.2.2
Three related areas of concern emerge from the trends presented in Section 2.2.2. These are:
Decline in capital maintenance funding allocations compounded with rapid inflation of maintenance costs
A sharp decline in preventative maintenance undertaken on the network
A continuous fall in public satisfaction with road condition since surveys began in 2009
It is concluded that the current condition of the road network falls short of public expectation and that on current levels of expenditure the network will begin to deteriorate at a much faster rate in future thereby placing greater pressure on existing budgets.
7 Indicators are produced by Transport for Greater Manchester 2 years in arrears
TAMS PART 2 ASSET INVESTMENT STRATEGIES Stockport Council
31
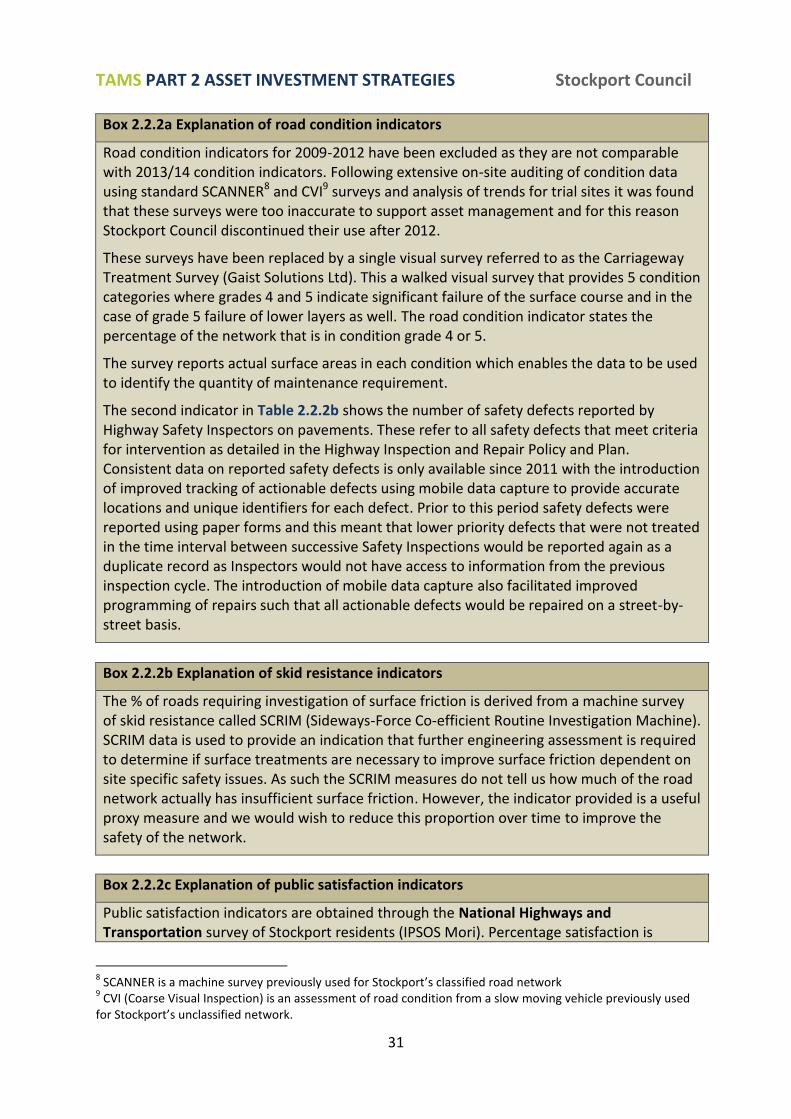
Box 2.2.2a Explanation of road condition indicators
Road condition indicators for 2009-2012 have been excluded as they are not comparable with 2013/14 condition indicators. Following extensive on-site auditing of condition data using standard SCANNER8 and CVI9 surveys and analysis of trends for trial sites it was found that these surveys were too inaccurate to support asset management and for this reason Stockport Council discontinued their use after 2012.
These surveys have been replaced by a single visual survey referred to as the Carriageway Treatment Survey (Gaist Solutions Ltd). This a walked visual survey that provides 5 condition categories where grades 4 and 5 indicate significant failure of the surface course and in the case of grade 5 failure of lower layers as well. The road condition indicator states the percentage of the network that is in condition grade 4 or 5.
The survey reports actual surface areas in each condition which enables the data to be used to identify the quantity of maintenance requirement.
The second indicator in Table 2.2.2b shows the number of safety defects reported by Highway Safety Inspectors on pavements. These refer to all safety defects that meet criteria for intervention as detailed in the Highway Inspection and Repair Policy and Plan. Consistent data on reported safety defects is only available since 2011 with the introduction of improved tracking of actionable defects using mobile data capture to provide accurate locations and unique identifiers for each defect. Prior to this period safety defects were reported using paper forms and this meant that lower priority defects that were not treated in the time interval between successive Safety Inspections would be reported again as a duplicate record as Inspectors would not have access to information from the previous inspection cycle. The introduction of mobile data capture also facilitated improved programming of repairs such that all actionable defects would be repaired on a street-by-street basis.
Box 2.2.2b Explanation of skid resistance indicators
The % of roads requiring investigation of surface friction is derived from a machine survey of skid resistance called SCRIM (Sideways-Force Co-efficient Routine Investigation Machine). SCRIM data is used to provide an indication that further engineering assessment is required to determine if surface treatments are necessary to improve surface friction dependent on site specific safety issues. As such the SCRIM measures do not tell us how much of the road network actually has insufficient surface friction. However, the indicator provided is a useful proxy measure and we would wish to reduce this proportion over time to improve the safety of the network.
Box 2.2.2c Explanation of public satisfaction indicators
Public satisfaction indicators are obtained through the National Highways and Transportation survey of Stockport residents (IPSOS Mori). Percentage satisfaction is
8 SCANNER is a machine survey previously used for Stockport’s classified road network
9 CVI (Coarse Visual Inspection) is an assessment of road condition from a slow moving vehicle previously used
for Stockport’s unclassified network.
TAMS PART 2 ASSET INVESTMENT STRATEGIES Stockport Council
32
Box 2.2.2c Explanation of public satisfaction indicators
measured by respondents providing a 1-5 rating where 1 is taken to be 0%, 2 is taken to be 25% satisfied etc. Figures on percentage satisfaction are highlighted in green or red to indicate respectively where a significant10 improvement or decline in satisfaction has occurred as compared to the preceding 3 year average.
Stockport has participated in the survey since 2009/10.
10
Statistical significance is taken to be any result that differs by greater than 2 standard errors from the preceding 3 year average
TAMS PART 2 ASSET INVESTMENT STRATEGIES Stockport Council
33
2.2.3 Future demands, risks and opportunities for the Road Asset Investment Strategy
2.2.3.1 Climate change Section 1.5.1.2 provides a discussion of the forecasts for climate change and extreme
weather. The likely increases in average rainfall and intensity of individual rainfall events are
of particular concern as this will inevitably increase deterioration rates. These occur through
a number of processes:
1. Hydraulic pressure as water is compressed under tyres as the vehicle passes over the
road surface. Preventative treatments are crucial to ensuring that water does not
penetrate into the surface causing erosion and widening of cracks.
2. Rising water tables (as experienced in the winter of 2013/14) breaching the lower
layers of the road weaken the road structure as vehicles pass over the road surface.
3. Increased likelihood of breaching surface water or mains sewer capacity and
leakages causing leaching of material, creating voids and localised failures. This
process leads to more sudden failures and should be minimised through a robust risk
management approach supported by comprehensive data and knowledge on assets
below ground, ground conditions and associated risks as well as integrated works
programmes between drainage and highway maintenance.
Heat wave events also present risks through softening of bitumen binders in the surface of
the road at high temperatures. This can lead to deformation of the surface and ‘fatting up’
of bitumen on the surface causing skidding hazards. Specification of ‘stiffer’ bitumen grades
may reduce this future risk although these typically require higher temperatures prior to
laying which result in higher energy costs and carbon emissions. It is therefore important to
continue to engage with contractors to find solutions that enable stiffer bitumen grades to
be laid at lower temperatures.
During the winter of 2010/11 freeze-thaw processes led to a 90% increase in potholes over
the average for a winter period. Importantly, most of these were associated with roads that
were already in poor condition or had some degree of surface deterioration. This highlights
the potential to improve our resilience to climate change through implementing
improvements to the overall condition of the network.
2.2.3.2 Global demand for raw construction materials The macroeconomic context leading to rising demand for raw construction materials has
been discussed in Section 1.5.1.3. In relation to road maintenance operations price inflation
is to expected to be between 3.5% and 4.8% for preventative treatments (e.g. surface
dressing) and between 4.2% and 5.7% for structural maintenance (e.g. plane and resurface
TAMS PART 2 ASSET INVESTMENT STRATEGIES Stockport Council
34
operations)11. By 2033 this will result in a 42% increase in maintenance costs relative to the
Consumer Price Index (assuming a target CPI rate of 2.5%) although this excludes further
super-inflationary effects on bitumen prices as oil reserves become scarcer.
2.2.3.3 Population growth The population of Stockport is projected to grow by approximately 6% by 2033 over 2015
levels12. The National Trip End Model (NTEM) projects growth in car trips in Stockport
ranging from 7% in the central area to 13% in High Lane over the same period.
NTEM projections are the subject of continued discussions about the realism of car
ownership and trip making models, particularly in the context of very slow growth or decline
in traffic levels over last decade. In particular, in Stockport there has been a 6% reduction in
car traffic on A and B roads since 2005 in part as a result of demand management and public
transport measures delivered through the GMLTP.
In spite of the mixed picture over the last decade, with continued population growth in
Stockport and Greater Manchester as a whole it can only be concluded that demand for
high quality road space will grow.
The GMLTP sets out a strategy to manage this demand for road space through measures to
improve and promote the use of alternative modes of travel (including public transport and
active modes). However, the GMLTP is also clear that improvements should be made to the
functioning of the network itself to accommodate growth in traffic. The TAMS therefore has
a role to play in ensuring that investment options are selected that minimise traffic delays
over the full lifecycle of the road.
2.2.3.4 Housing growth and distribution policies Reviews of housing distribution policies across Greater Manchester, Cheshire East and High
Peak will impact on the concentrations of traffic growth, in particular on strategic roads in
Stockport. Stockport is working with High Peak and Cheshire East to assess the impacts of
their respective Local Plans on the A6 and A34 corridors. With a clearer view on the likely
traffic impacts and scale of capacity improvements required on these corridors it will be
possible to consider more optimum timings of major maintenance interventions on the A34
in particular in the medium (5 year) term.
2.2.3.5 Freight trends Growth in online retail will lead to mixed impacts on traffic. Whilst this should have a
negative effect on the rate of growth in car traffic there will be likely to be an increase in
freight movements and distance travelled13. However, it is important to place this in the
11
Calculated on the basis of historical commodity, plant and labour price indices since 1990 and apportioned to typical weightings for preventative and structural treatments. The ranges represent 90% most credible values. 12
Oxford Economics (2013) Greater Manchester Forecast Model 13
OECD international Transport Forum (2013) Long Run Trends in Car Use. Roundtable Report
TAMS PART 2 ASSET INVESTMENT STRATEGIES Stockport Council
35
context of recent trends in Stockport. Since 2005 there has been a 22% decrease in Heavy
Goods Vehicle (HGV) traffic in Stockport coupled with a 7% increase in Light Goods Vehicle
(LGV) traffic. This is likely to be a result of an increased consolidation of freight in centralised
distribution centres.
The impact of HGVs on the rate of deterioration of the road structure is disproportionately
greater by weight than the impacts of LGVs and other vehicles and so even if there is a
continued increase in LGV journeys and tonnage carried on Stockport’s local roads this is
unlikely to have a significant impact on rates of structural deterioration.
2.2.3.6 New road schemes: A6 Manchester Airport Relief Road and Poynton Bypass TheA6 to Manchester Airport Relief Road Planning Applications have been approved and
works started on site in 2015. The cost implications for long term maintenance of the route
within Stockport’s boundaries have been considered within the Major Scheme Business
Case and will be integrated within the core of the TAMS in the next review. Notwithstanding
the whole life cost implications of the new infrastructure there are additional important
considerations for changes in freight movements and volumes on the existing network and
in particular on the A555, A34 and A6. Work has been undertaken to quantify the impacts of
the A6 MARR on structural maintenance requirements on these roads. This was undertaken
using traffic model outputs for the forecast years 2017 and 2032 and combined with
measurements of the strength of the existing road structure (using a machine survey
referred to as Deflectograph). The results indicated that even under increased loading from
HGV traffic over 97% of the length of the A555 and A34 would continue to perform for at
least a further 20 years without major reconstruction of the underlying road structure.
However, isolated areas would need addressing and early preventative interventions are
required along the routes to ensure that this life can be achieved.
The Poynton Bypass proposal will also have significant impacts on traffic on A555 and A34.
Cheshire East Council are currently preparing their Major Scheme Business Case and further
work should be undertaken to understand if additional HGV traffic flows will require a
review of the current conclusion above.
Conclusion for 2.2.3
The historical evidence of declining road condition and associated risks indicates that our
network is not sufficiently resilient to growing occurrences of extreme weather with
growing impacts on the wider economy in Stockport and Greater Manchester as a whole.
This establishes a clear case for investing to improve the overall condition of the road
network.
The combined effects of the above trends are difficult to quantify at this stage. It is clear
that dependency of road maintenance operations on primary raw materials has long term
sustainability implications and a target will be established to increase the use of recycled
materials, in particular bitumen binder, in road surfacing. Broadly speaking, an increase in
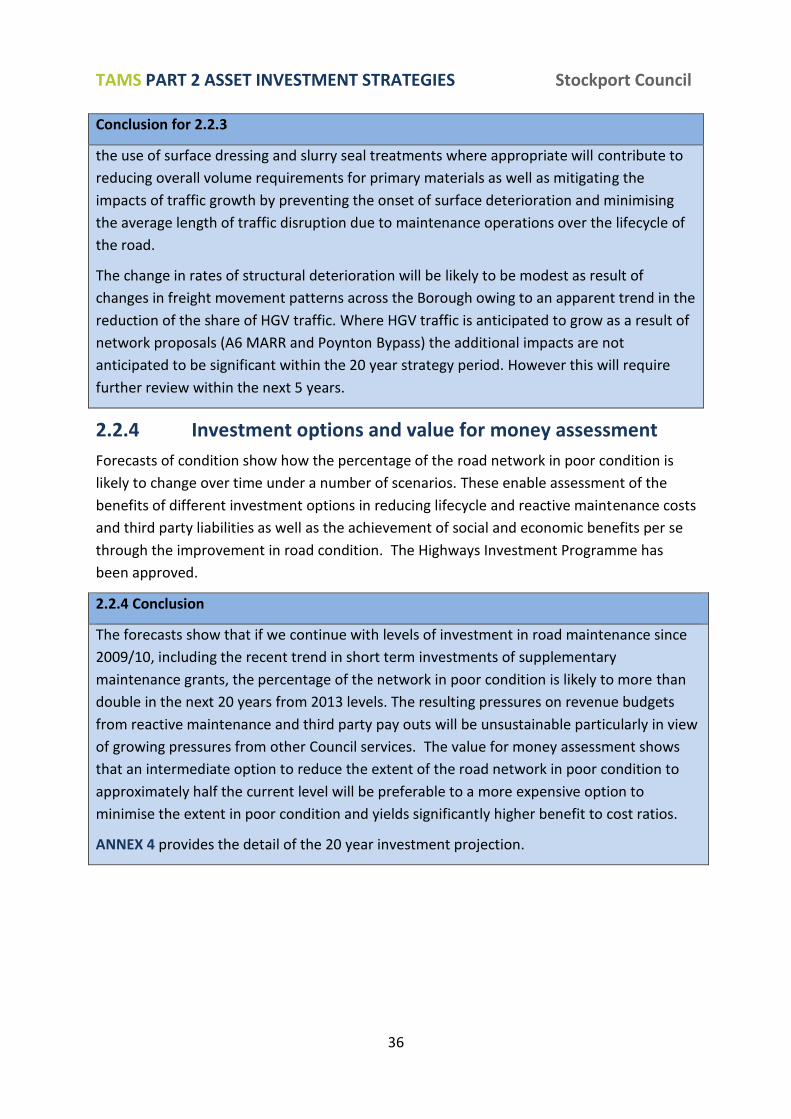
TAMS PART 2 ASSET INVESTMENT STRATEGIES Stockport Council
36
Conclusion for 2.2.3
the use of surface dressing and slurry seal treatments where appropriate will contribute to
reducing overall volume requirements for primary materials as well as mitigating the
impacts of traffic growth by preventing the onset of surface deterioration and minimising
the average length of traffic disruption due to maintenance operations over the lifecycle of
the road.
The change in rates of structural deterioration will be likely to be modest as result of
changes in freight movement patterns across the Borough owing to an apparent trend in the
reduction of the share of HGV traffic. Where HGV traffic is anticipated to grow as a result of
network proposals (A6 MARR and Poynton Bypass) the additional impacts are not
anticipated to be significant within the 20 year strategy period. However this will require
further review within the next 5 years.
2.2.4 Investment options and value for money assessment
Forecasts of condition show how the percentage of the road network in poor condition is
likely to change over time under a number of scenarios. These enable assessment of the
benefits of different investment options in reducing lifecycle and reactive maintenance costs
and third party liabilities as well as the achievement of social and economic benefits per se
through the improvement in road condition. The Highways Investment Programme has
been approved.
2.2.4 Conclusion
The forecasts show that if we continue with levels of investment in road maintenance since
2009/10, including the recent trend in short term investments of supplementary
maintenance grants, the percentage of the network in poor condition is likely to more than
double in the next 20 years from 2013 levels. The resulting pressures on revenue budgets
from reactive maintenance and third party pay outs will be unsustainable particularly in view
of growing pressures from other Council services. The value for money assessment shows
that an intermediate option to reduce the extent of the road network in poor condition to
approximately half the current level will be preferable to a more expensive option to
minimise the extent in poor condition and yields significantly higher benefit to cost ratios.
ANNEX 4 provides the detail of the 20 year investment projection.
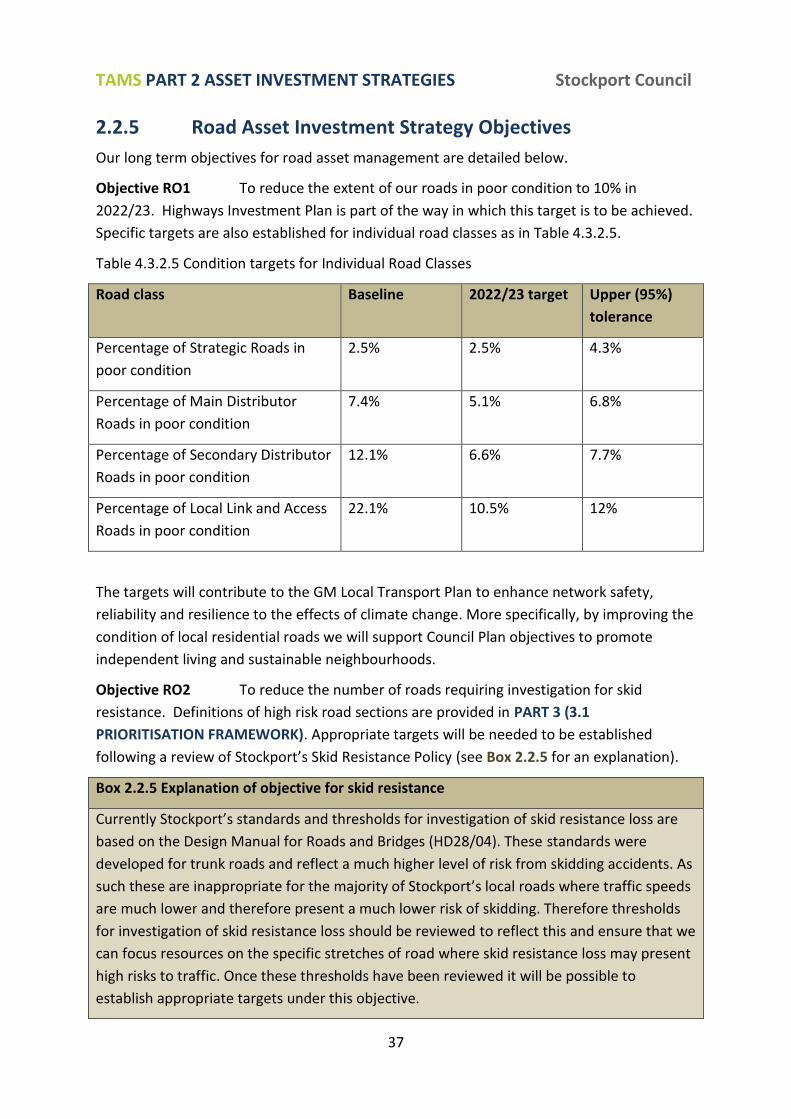
TAMS PART 2 ASSET INVESTMENT STRATEGIES Stockport Council
37
2.2.5 Road Asset Investment Strategy Objectives
Our long term objectives for road asset management are detailed below.
Objective RO1 To reduce the extent of our roads in poor condition to 10% in
2022/23. Highways Investment Plan is part of the way in which this target is to be achieved.
Specific targets are also established for individual road classes as in Table 4.3.2.5.
Table 4.3.2.5 Condition targets for Individual Road Classes
Road class Baseline 2022/23 target Upper (95%)
tolerance
Percentage of Strategic Roads in
poor condition
2.5% 2.5% 4.3%
Percentage of Main Distributor
Roads in poor condition
7.4% 5.1% 6.8%
Percentage of Secondary Distributor
Roads in poor condition
12.1% 6.6% 7.7%
Percentage of Local Link and Access
Roads in poor condition
22.1% 10.5% 12%
The targets will contribute to the GM Local Transport Plan to enhance network safety,
reliability and resilience to the effects of climate change. More specifically, by improving the
condition of local residential roads we will support Council Plan objectives to promote
independent living and sustainable neighbourhoods.
Objective RO2 To reduce the number of roads requiring investigation for skid
resistance. Definitions of high risk road sections are provided in PART 3 (3.1
PRIORITISATION FRAMEWORK). Appropriate targets will be needed to be established
following a review of Stockport’s Skid Resistance Policy (see Box 2.2.5 for an explanation).
Box 2.2.5 Explanation of objective for skid resistance
Currently Stockport’s standards and thresholds for investigation of skid resistance loss are
based on the Design Manual for Roads and Bridges (HD28/04). These standards were
developed for trunk roads and reflect a much higher level of risk from skidding accidents. As
such these are inappropriate for the majority of Stockport’s local roads where traffic speeds
are much lower and therefore present a much lower risk of skidding. Therefore thresholds
for investigation of skid resistance loss should be reviewed to reflect this and ensure that we
can focus resources on the specific stretches of road where skid resistance loss may present
high risks to traffic. Once these thresholds have been reviewed it will be possible to
establish appropriate targets under this objective.
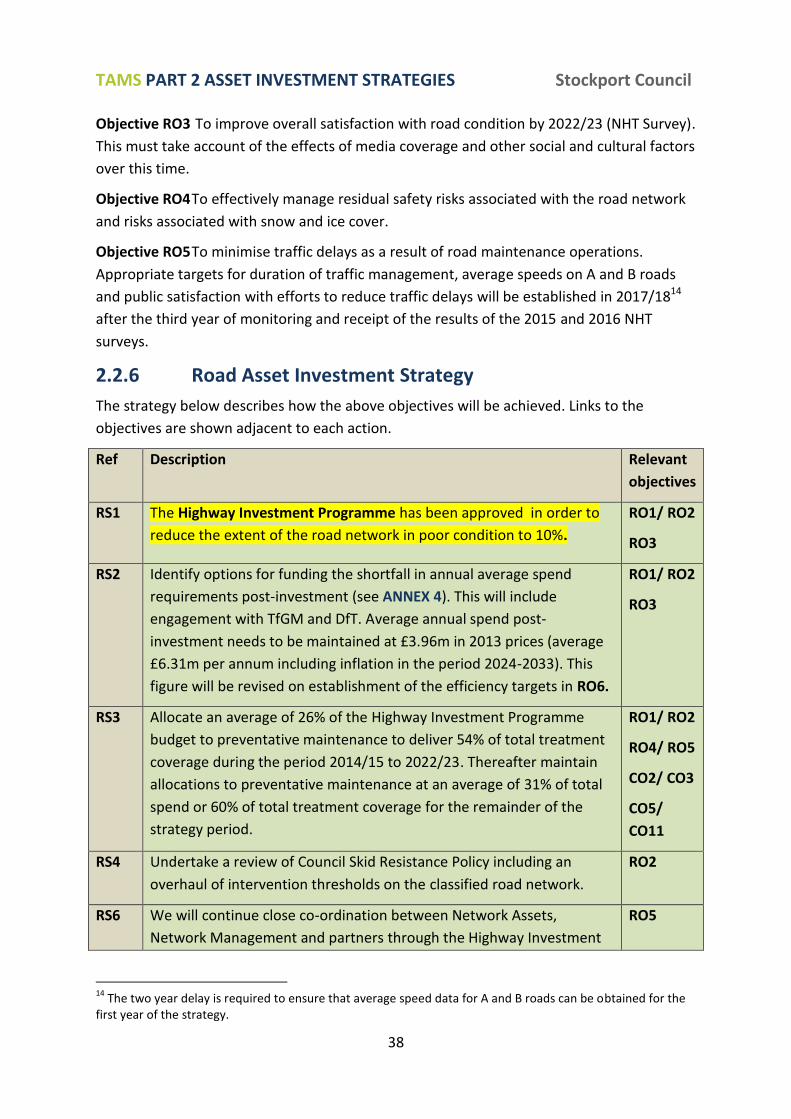
TAMS PART 2 ASSET INVESTMENT STRATEGIES Stockport Council
38
Objective RO3 To improve overall satisfaction with road condition by 2022/23 (NHT Survey).
This must take account of the effects of media coverage and other social and cultural factors
over this time.
Objective RO4 To effectively manage residual safety risks associated with the road network
and risks associated with snow and ice cover.
Objective RO5 To minimise traffic delays as a result of road maintenance operations.
Appropriate targets for duration of traffic management, average speeds on A and B roads
and public satisfaction with efforts to reduce traffic delays will be established in 2017/1814
after the third year of monitoring and receipt of the results of the 2015 and 2016 NHT
surveys.
2.2.6 Road Asset Investment Strategy
The strategy below describes how the above objectives will be achieved. Links to the
objectives are shown adjacent to each action.
Ref Description Relevant
objectives
RS1 The Highway Investment Programme has been approved in order to
reduce the extent of the road network in poor condition to 10%.
RO1/ RO2
RO3
RS2 Identify options for funding the shortfall in annual average spend
requirements post-investment (see ANNEX 4). This will include
engagement with TfGM and DfT. Average annual spend post-
investment needs to be maintained at £3.96m in 2013 prices (average
£6.31m per annum including inflation in the period 2024-2033). This
figure will be revised on establishment of the efficiency targets in RO6.
RO1/ RO2
RO3
RS3 Allocate an average of 26% of the Highway Investment Programme
budget to preventative maintenance to deliver 54% of total treatment
coverage during the period 2014/15 to 2022/23. Thereafter maintain
allocations to preventative maintenance at an average of 31% of total
spend or 60% of total treatment coverage for the remainder of the
strategy period.
RO1/ RO2
RO4/ RO5
CO2/ CO3
CO5/
CO11
RS4 Undertake a review of Council Skid Resistance Policy including an
overhaul of intervention thresholds on the classified road network.
RO2
RS6 We will continue close co-ordination between Network Assets,
Network Management and partners through the Highway Investment
RO5
14
The two year delay is required to ensure that average speed data for A and B roads can be obtained for the first year of the strategy.
TAMS PART 2 ASSET INVESTMENT STRATEGIES Stockport Council
39
Programme to optimise the movement and storage of plant and
material as well as minimising traffic disruption. We will also continue
to support the effective delivery of the GM Road Activity Permit
System.
2.2.7 Risk assessment for Road Asset Investment Strategy
Table 2.2.7 overleaf provides a strategic risk register that will be maintained and updated on
an annual basis. This details the residual risks that objectives in Section 2.2.5 are not
achieved through the strategy in Section 2.2.6. The risk register is structured in line with
Stockport Council’s Risk Management Framework and Strategy and will be reported
annually.
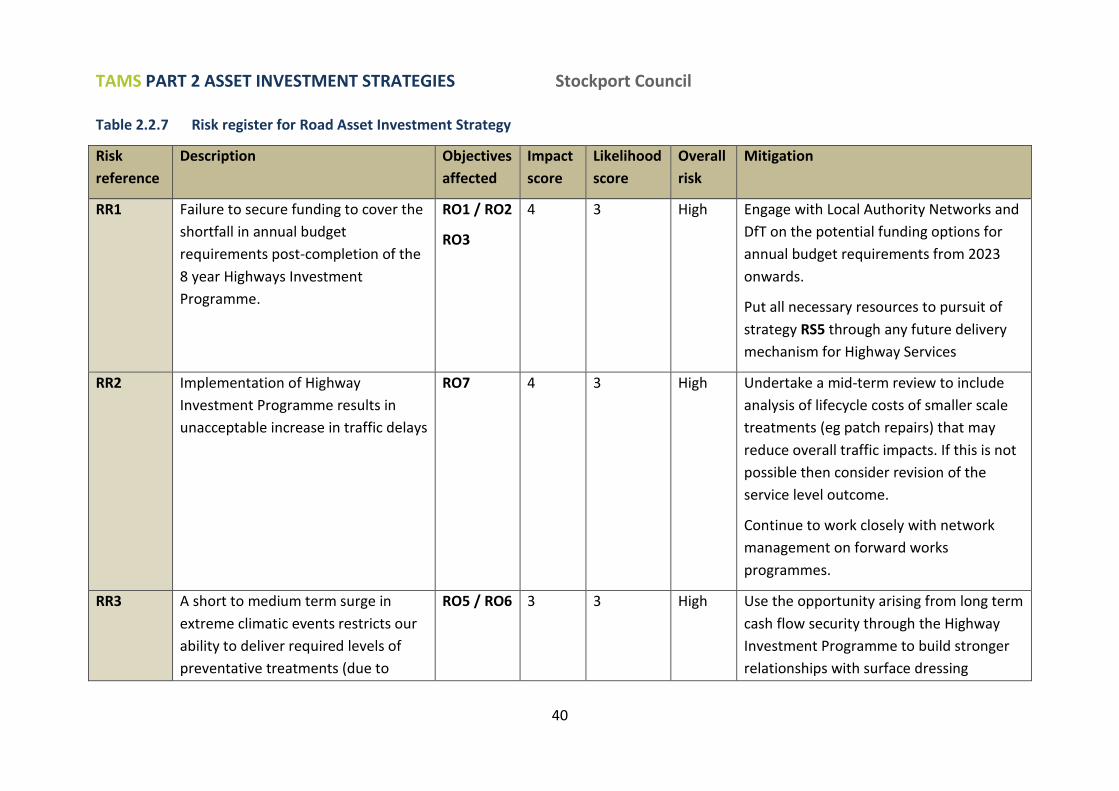
TAMS PART 2 ASSET INVESTMENT STRATEGIES Stockport Council
40
Table 2.2.7 Risk register for Road Asset Investment Strategy
Risk
reference
Description Objectives
affected
Impact
score
Likelihood
score
Overall
risk
Mitigation
RR1 Failure to secure funding to cover the
shortfall in annual budget
requirements post-completion of the
8 year Highways Investment
Programme.
RO1 / RO2
RO3
4 3 High Engage with Local Authority Networks and
DfT on the potential funding options for
annual budget requirements from 2023
onwards.
Put all necessary resources to pursuit of
strategy RS5 through any future delivery
mechanism for Highway Services
RR2 Implementation of Highway
Investment Programme results in
unacceptable increase in traffic delays
RO7 4 3 High Undertake a mid-term review to include
analysis of lifecycle costs of smaller scale
treatments (eg patch repairs) that may
reduce overall traffic impacts. If this is not
possible then consider revision of the
service level outcome.
Continue to work closely with network
management on forward works
programmes.
RR3 A short to medium term surge in
extreme climatic events restricts our
ability to deliver required levels of
preventative treatments (due to
RO5 / RO6 3 3 High Use the opportunity arising from long term
cash flow security through the Highway
Investment Programme to build stronger
relationships with surface dressing
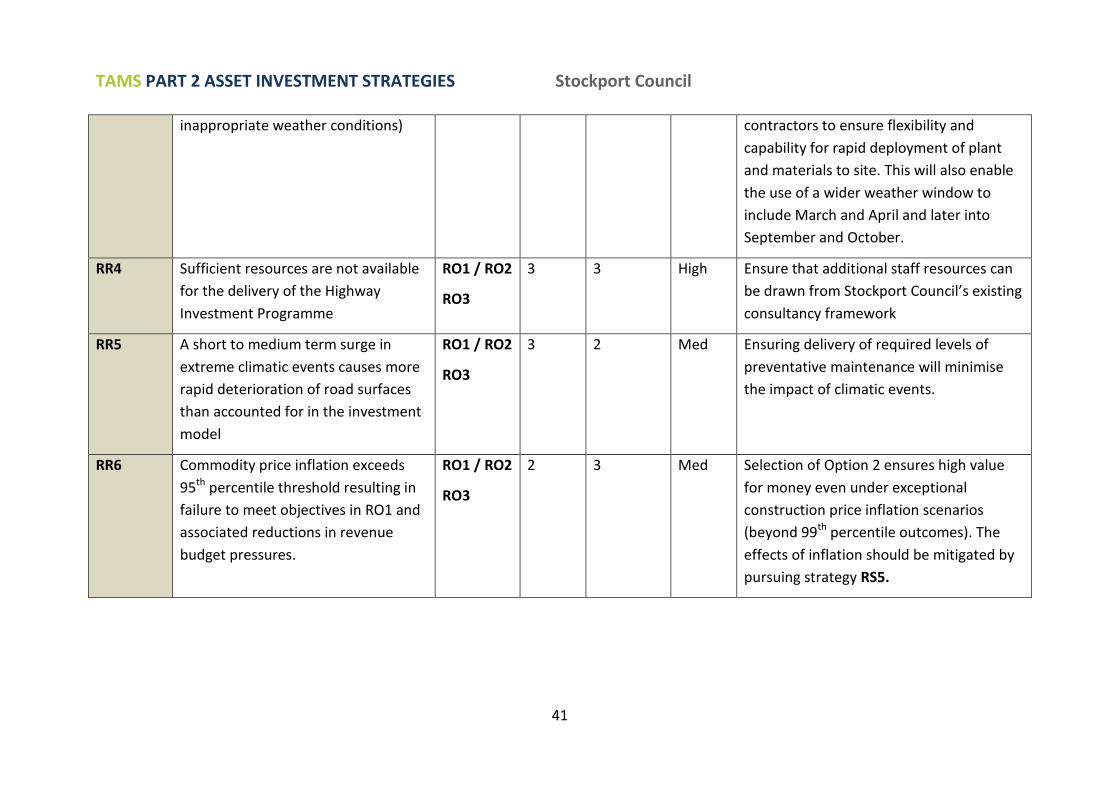
TAMS PART 2 ASSET INVESTMENT STRATEGIES Stockport Council
41
inappropriate weather conditions) contractors to ensure flexibility and
capability for rapid deployment of plant
and materials to site. This will also enable
the use of a wider weather window to
include March and April and later into
September and October.
RR4 Sufficient resources are not available
for the delivery of the Highway
Investment Programme
RO1 / RO2
RO3
3 3 High Ensure that additional staff resources can
be drawn from Stockport Council’s existing
consultancy framework
RR5 A short to medium term surge in
extreme climatic events causes more
rapid deterioration of road surfaces
than accounted for in the investment
model
RO1 / RO2
RO3
3 2 Med Ensuring delivery of required levels of
preventative maintenance will minimise
the impact of climatic events.
RR6 Commodity price inflation exceeds
95th percentile threshold resulting in
failure to meet objectives in RO1 and
associated reductions in revenue
budget pressures.
RO1 / RO2
RO3
2 3 Med Selection of Option 2 ensures high value
for money even under exceptional
construction price inflation scenarios
(beyond 99th percentile outcomes). The
effects of inflation should be mitigated by
pursuing strategy RS5.
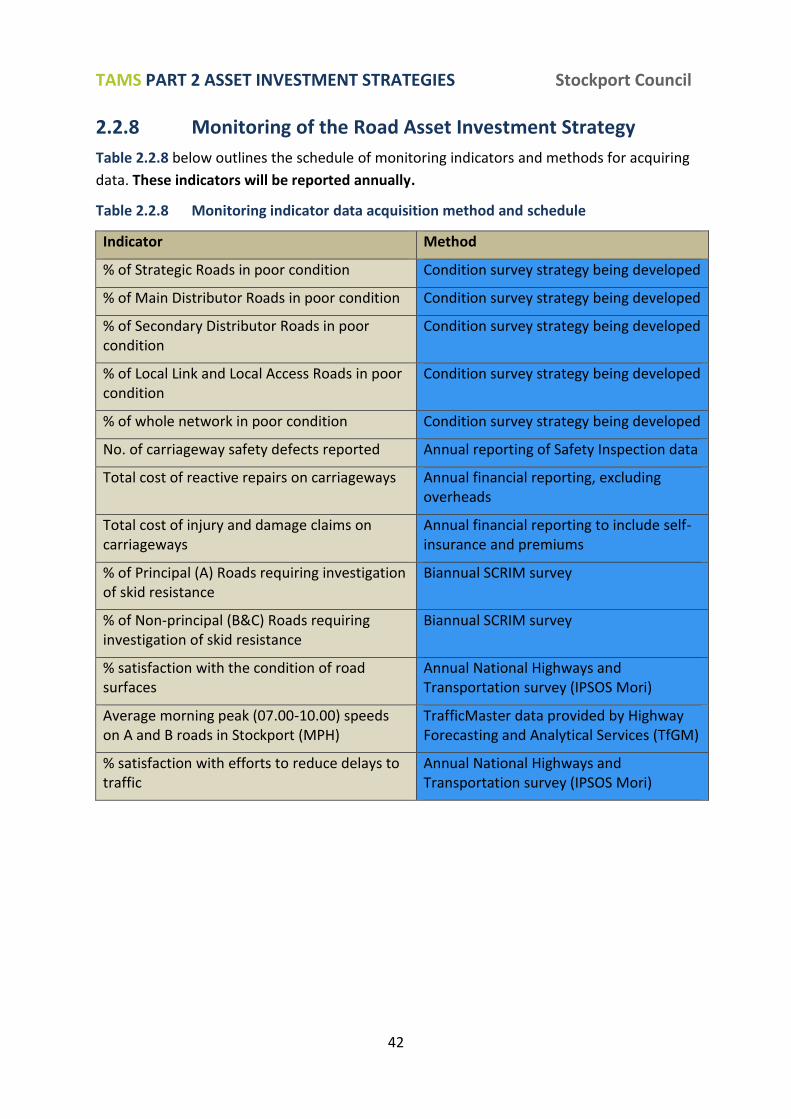
TAMS PART 2 ASSET INVESTMENT STRATEGIES Stockport Council
42
2.2.8 Monitoring of the Road Asset Investment Strategy
Table 2.2.8 below outlines the schedule of monitoring indicators and methods for acquiring
data. These indicators will be reported annually.
Table 2.2.8 Monitoring indicator data acquisition method and schedule
Indicator Method
% of Strategic Roads in poor condition Condition survey strategy being developed
% of Main Distributor Roads in poor condition Condition survey strategy being developed
% of Secondary Distributor Roads in poor condition
Condition survey strategy being developed
% of Local Link and Local Access Roads in poor condition
Condition survey strategy being developed
% of whole network in poor condition Condition survey strategy being developed
No. of carriageway safety defects reported Annual reporting of Safety Inspection data
Total cost of reactive repairs on carriageways Annual financial reporting, excluding overheads
Total cost of injury and damage claims on carriageways
Annual financial reporting to include self-insurance and premiums
% of Principal (A) Roads requiring investigation of skid resistance
Biannual SCRIM survey
% of Non-principal (B&C) Roads requiring investigation of skid resistance
Biannual SCRIM survey
% satisfaction with the condition of road surfaces
Annual National Highways and Transportation survey (IPSOS Mori)
Average morning peak (07.00-10.00) speeds on A and B roads in Stockport (MPH)
TrafficMaster data provided by Highway Forecasting and Analytical Services (TfGM)
% satisfaction with efforts to reduce delays to traffic
Annual National Highways and Transportation survey (IPSOS Mori)
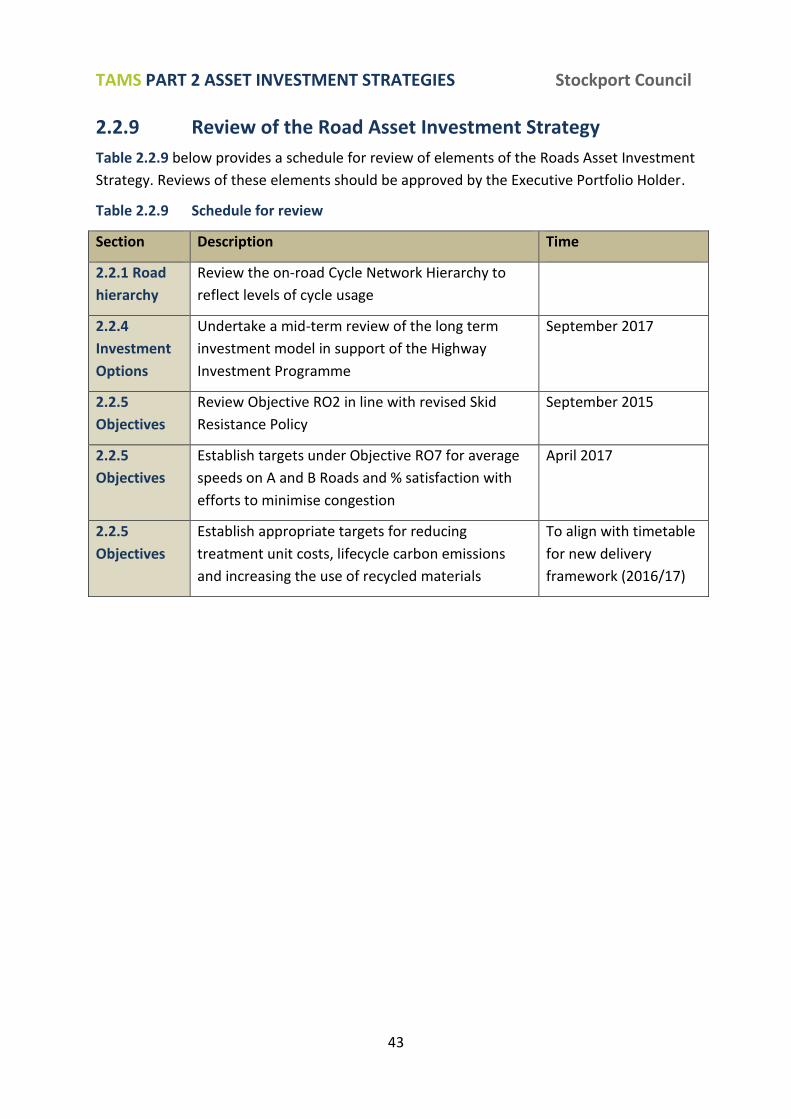
TAMS PART 2 ASSET INVESTMENT STRATEGIES Stockport Council
43
2.2.9 Review of the Road Asset Investment Strategy
Table 2.2.9 below provides a schedule for review of elements of the Roads Asset Investment
Strategy. Reviews of these elements should be approved by the Executive Portfolio Holder.
Table 2.2.9 Schedule for review
Section Description Time
2.2.1 Road
hierarchy
Review the on-road Cycle Network Hierarchy to
reflect levels of cycle usage
2.2.4
Investment
Options
Undertake a mid-term review of the long term
investment model in support of the Highway
Investment Programme
September 2017
2.2.5
Objectives
Review Objective RO2 in line with revised Skid
Resistance Policy
September 2015
2.2.5
Objectives
Establish targets under Objective RO7 for average
speeds on A and B Roads and % satisfaction with
efforts to minimise congestion
April 2017
2.2.5
Objectives
Establish appropriate targets for reducing
treatment unit costs, lifecycle carbon emissions
and increasing the use of recycled materials
To align with timetable
for new delivery
framework (2016/17)

TAMS PART 2 ASSET INVESTMENT STRATEGIES Stockport Council
44
2.3 PAVEMENTS AND SURFACED FOOTPATHS
2.3.1 Pavement classification and inventory
2.3.1.1 Definitions In this document we use the term pavements and surfaced footpaths in a more familiar
sense to refer to pedestrian routes both on-road and providing off-road links that have a
formal surface that is either bound (with bitumen binder or concrete) or modular (such as
with flags or block paving). See the Glossary for more clarification of terms. For the purposes
of brevity in the remainder of the section we will use the term pavements to mean all of the
above unless making specific reference to off-road footpaths.
These are defined separately from Public Rights of Way, which are often unsurfaced or have
loose bound surfacing materials and are typically less heavily used for everyday purposes.
Although it is difficult to generalise in terms of their physical entities and usage, they have
different legal contexts and consequently different approaches to management and risk.
Through the future development of the Rights of Way Asset Investment Strategy, Stockport
Council will harmonise management approaches such that common principles can be
applied on the basis of the physical characteristics of the infrastructure and usage. In
particular this will cover risk management, long term financial planning and physical works
prioritisation.
A summary of Stockport’s pavement inventory is given in terms of length and surface area in
ANNEX 3. The summary also presents a full valuation of pavement and surfaced footpath
assets with a Gross Value of £0.241bn.
2.3.1.2 Pavement Hierarchy Stockport Council uses a local hierarchy for pavements in accordance with the Code of
Practice for Highways Maintenance Management for the purposes of risk prioritisation and
network management. These determine inspection frequencies as outlined in the Highway
Inspection and Repair Policy and Plan.
The Pavement Hierarchy is defined in Table 2.3.1a. In addition Stockport Council uses a
Cycle Network Hierarchy which is shown in Table 2.3.1b. Although the Cycle Network
Hierarchy is also used for the purposes of risk prioritisation it is important to note that it
reflects the physical nature of the asset and the level of risk that it presents to users rather
than the actual levels of usage as this may vary considerably. Therefore only category 2
(segregated Cycleways) applies to this section.
2.3.1 Conclusion
The Pavement Hierarchy and Cycle Network Hierarchy will be used as a means of prioritising
investments in maintenance forward works programmes.
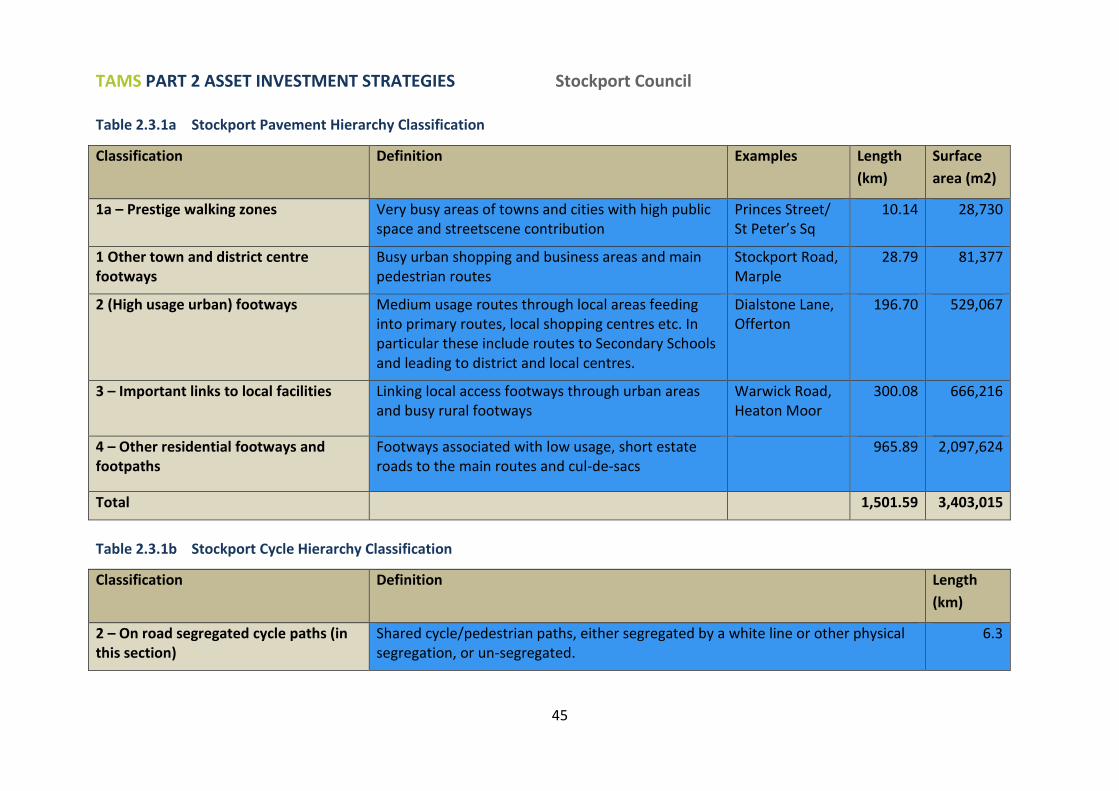
TAMS PART 2 ASSET INVESTMENT STRATEGIES Stockport Council
45
Table 2.3.1a Stockport Pavement Hierarchy Classification
Classification Definition Examples Length
(km)
Surface
area (m2)
1a – Prestige walking zones Very busy areas of towns and cities with high public space and streetscene contribution
Princes Street/ St Peter’s Sq
10.14 28,730
1 Other town and district centre footways
Busy urban shopping and business areas and main pedestrian routes
Stockport Road, Marple
28.79 81,377
2 (High usage urban) footways Medium usage routes through local areas feeding into primary routes, local shopping centres etc. In particular these include routes to Secondary Schools and leading to district and local centres.
Dialstone Lane, Offerton
196.70 529,067
3 – Important links to local facilities Linking local access footways through urban areas and busy rural footways
Warwick Road, Heaton Moor
300.08 666,216
4 – Other residential footways and footpaths
Footways associated with low usage, short estate roads to the main routes and cul-de-sacs
965.89 2,097,624
Total 1,501.59 3,403,015
Table 2.3.1b Stockport Cycle Hierarchy Classification
Classification Definition Length
(km)
2 – On road segregated cycle paths (in this section)
Shared cycle/pedestrian paths, either segregated by a white line or other physical segregation, or un-segregated.
6.3
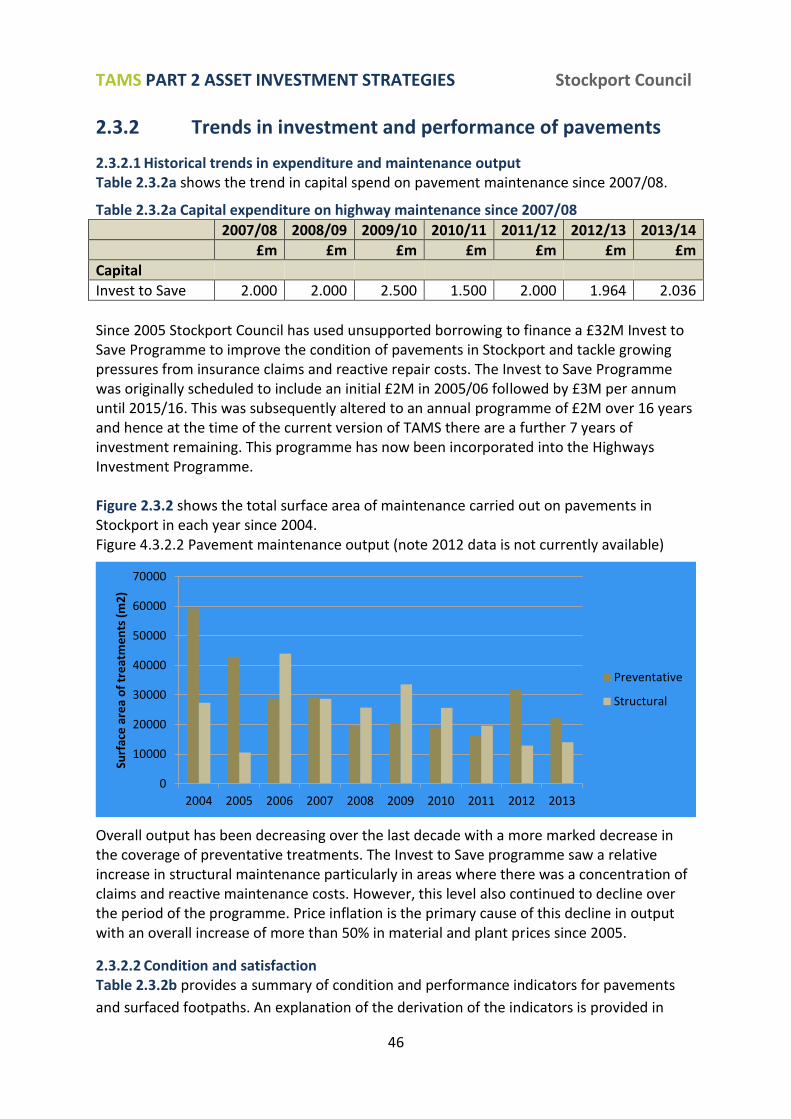
TAMS PART 2 ASSET INVESTMENT STRATEGIES Stockport Council
46
2.3.2 Trends in investment and performance of pavements
2.3.2.1 Historical trends in expenditure and maintenance output Table 2.3.2a shows the trend in capital spend on pavement maintenance since 2007/08.
Table 2.3.2a Capital expenditure on highway maintenance since 2007/08
2007/08 2008/09 2009/10 2010/11 2011/12 2012/13 2013/14
£m £m £m £m £m £m £m
Capital
Invest to Save 2.000 2.000 2.500 1.500 2.000 1.964 2.036
Since 2005 Stockport Council has used unsupported borrowing to finance a £32M Invest to Save Programme to improve the condition of pavements in Stockport and tackle growing pressures from insurance claims and reactive repair costs. The Invest to Save Programme was originally scheduled to include an initial £2M in 2005/06 followed by £3M per annum until 2015/16. This was subsequently altered to an annual programme of £2M over 16 years and hence at the time of the current version of TAMS there are a further 7 years of investment remaining. This programme has now been incorporated into the Highways Investment Programme. Figure 2.3.2 shows the total surface area of maintenance carried out on pavements in Stockport in each year since 2004. Figure 4.3.2.2 Pavement maintenance output (note 2012 data is not currently available)
Overall output has been decreasing over the last decade with a more marked decrease in the coverage of preventative treatments. The Invest to Save programme saw a relative increase in structural maintenance particularly in areas where there was a concentration of claims and reactive maintenance costs. However, this level also continued to decline over the period of the programme. Price inflation is the primary cause of this decline in output with an overall increase of more than 50% in material and plant prices since 2005.
2.3.2.2 Condition and satisfaction Table 2.3.2b provides a summary of condition and performance indicators for pavements
and surfaced footpaths. An explanation of the derivation of the indicators is provided in
0
10000
20000
30000
40000
50000
60000
70000
2004 2005 2006 2007 2008 2009 2010 2011 2012 2013
Surf
ace
are
a o
f tr
eat
me
nts
(m
2)
Preventative
Structural
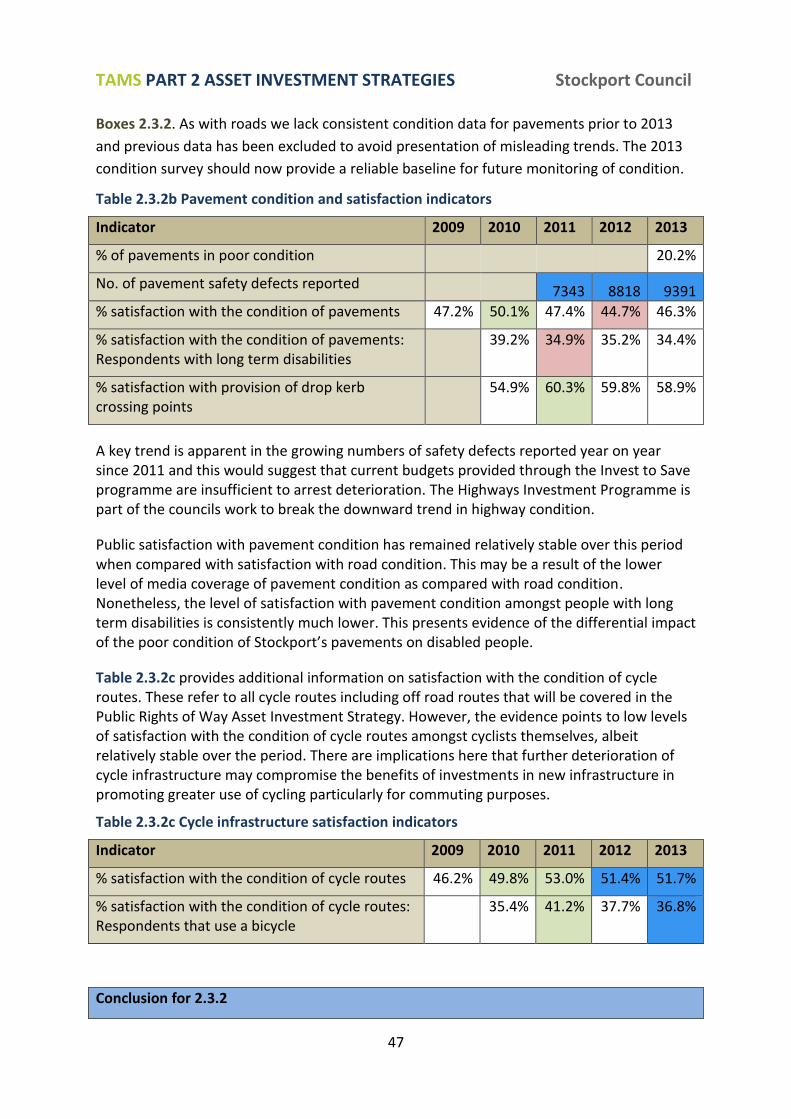
TAMS PART 2 ASSET INVESTMENT STRATEGIES Stockport Council
47
Boxes 2.3.2. As with roads we lack consistent condition data for pavements prior to 2013
and previous data has been excluded to avoid presentation of misleading trends. The 2013
condition survey should now provide a reliable baseline for future monitoring of condition.
Table 2.3.2b Pavement condition and satisfaction indicators
Indicator 2009 2010 2011 2012 2013
% of pavements in poor condition 20.2%
No. of pavement safety defects reported 7343 8818 9391
% satisfaction with the condition of pavements 47.2% 50.1% 47.4% 44.7% 46.3%
% satisfaction with the condition of pavements: Respondents with long term disabilities
39.2% 34.9% 35.2% 34.4%
% satisfaction with provision of drop kerb crossing points
54.9% 60.3% 59.8% 58.9%
A key trend is apparent in the growing numbers of safety defects reported year on year since 2011 and this would suggest that current budgets provided through the Invest to Save programme are insufficient to arrest deterioration. The Highways Investment Programme is part of the councils work to break the downward trend in highway condition.
Public satisfaction with pavement condition has remained relatively stable over this period when compared with satisfaction with road condition. This may be a result of the lower level of media coverage of pavement condition as compared with road condition. Nonetheless, the level of satisfaction with pavement condition amongst people with long term disabilities is consistently much lower. This presents evidence of the differential impact of the poor condition of Stockport’s pavements on disabled people.
Table 2.3.2c provides additional information on satisfaction with the condition of cycle routes. These refer to all cycle routes including off road routes that will be covered in the Public Rights of Way Asset Investment Strategy. However, the evidence points to low levels of satisfaction with the condition of cycle routes amongst cyclists themselves, albeit relatively stable over the period. There are implications here that further deterioration of cycle infrastructure may compromise the benefits of investments in new infrastructure in promoting greater use of cycling particularly for commuting purposes.
Table 2.3.2c Cycle infrastructure satisfaction indicators
Indicator 2009 2010 2011 2012 2013
% satisfaction with the condition of cycle routes 46.2% 49.8% 53.0% 51.4% 51.7%
% satisfaction with the condition of cycle routes: Respondents that use a bicycle
35.4% 41.2% 37.7% 36.8%
Conclusion for 2.3.2
TAMS PART 2 ASSET INVESTMENT STRATEGIES Stockport Council
48
Conclusion for 2.3.2
Evidence from the numbers of safety defects emerging year on year suggests that the condition and resilience or our pavement network is declining in spite of the Invest to Save programme. The reason for this is evident from the declining maintenance output year on year which in turn is a result of price inflation over the period of the Invest to Save programme.
The low level of satisfaction amongst disabled people with the condition of pavements highlights a continued imperative to both arrest deterioration and improve the overall condition of the pavement network. Prioritisation of physical works should also take account of the condition of segregated and non-segregated cycleways.
Box 2.3.2 Explanation of pavement condition indicators
Prior to 2013 pavement condition indicators had only been available for category 1a, 1 and 2 routes and there was no reliable condition data for the majority of the network. Data from 2009-2012 have been excluded as they are not comparable with 2013/14 condition indicators. Stockport Council has discontinued the use of standard UKPMS surveys as they were too inaccurate to support asset management.
These surveys have been replaced by a single visual survey referred to as the Footway Treatment Survey (Gaist Solutions Ltd). This a walked visual survey that provides 5 condition categories where grades 4 and 5 indicate significant failure of the surface course and in the case of grade 5 failure of lower layers as well. The condition indicator states the percentage of the network that is in condition grade 4 or 5.
The second indicator shows the number of safety defects reported by Highway Safety Inspectors on pavements. These refer to all safety defects that meet criteria for intervention as detailed in the Highway Inspection and Repair Policy and Plan.
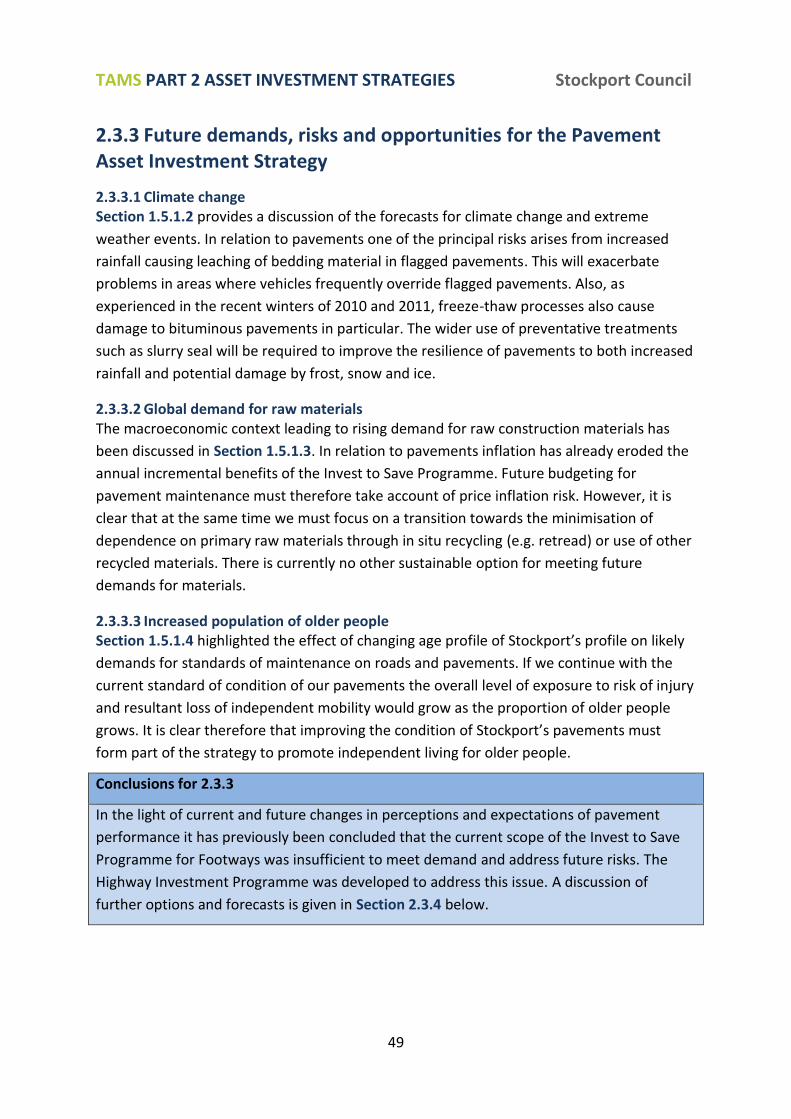
TAMS PART 2 ASSET INVESTMENT STRATEGIES Stockport Council
49
2.3.3 Future demands, risks and opportunities for the Pavement Asset Investment Strategy
2.3.3.1 Climate change Section 1.5.1.2 provides a discussion of the forecasts for climate change and extreme
weather events. In relation to pavements one of the principal risks arises from increased
rainfall causing leaching of bedding material in flagged pavements. This will exacerbate
problems in areas where vehicles frequently override flagged pavements. Also, as
experienced in the recent winters of 2010 and 2011, freeze-thaw processes also cause
damage to bituminous pavements in particular. The wider use of preventative treatments
such as slurry seal will be required to improve the resilience of pavements to both increased
rainfall and potential damage by frost, snow and ice.
2.3.3.2 Global demand for raw materials The macroeconomic context leading to rising demand for raw construction materials has
been discussed in Section 1.5.1.3. In relation to pavements inflation has already eroded the
annual incremental benefits of the Invest to Save Programme. Future budgeting for
pavement maintenance must therefore take account of price inflation risk. However, it is
clear that at the same time we must focus on a transition towards the minimisation of
dependence on primary raw materials through in situ recycling (e.g. retread) or use of other
recycled materials. There is currently no other sustainable option for meeting future
demands for materials.
2.3.3.3 Increased population of older people Section 1.5.1.4 highlighted the effect of changing age profile of Stockport’s profile on likely
demands for standards of maintenance on roads and pavements. If we continue with the
current standard of condition of our pavements the overall level of exposure to risk of injury
and resultant loss of independent mobility would grow as the proportion of older people
grows. It is clear therefore that improving the condition of Stockport’s pavements must
form part of the strategy to promote independent living for older people.
Conclusions for 2.3.3
In the light of current and future changes in perceptions and expectations of pavement
performance it has previously been concluded that the current scope of the Invest to Save
Programme for Footways was insufficient to meet demand and address future risks. The
Highway Investment Programme was developed to address this issue. A discussion of
further options and forecasts is given in Section 2.3.4 below.

TAMS PART 2 ASSET INVESTMENT STRATEGIES Stockport Council
50
2.3.4 Investment options and value for money assessment for the Pavement Asset Investment Strategy
Forecasts of condition show how the percentage of pavements in poor condition is likely to
change over time under a number of scenarios. These enable assessment of the benefits of
different investment options in reducing lifecycle and reactive maintenance costs and third
party liabilities as well as the achievement of social and economic benefits per se through
the improvement in pavement condition.
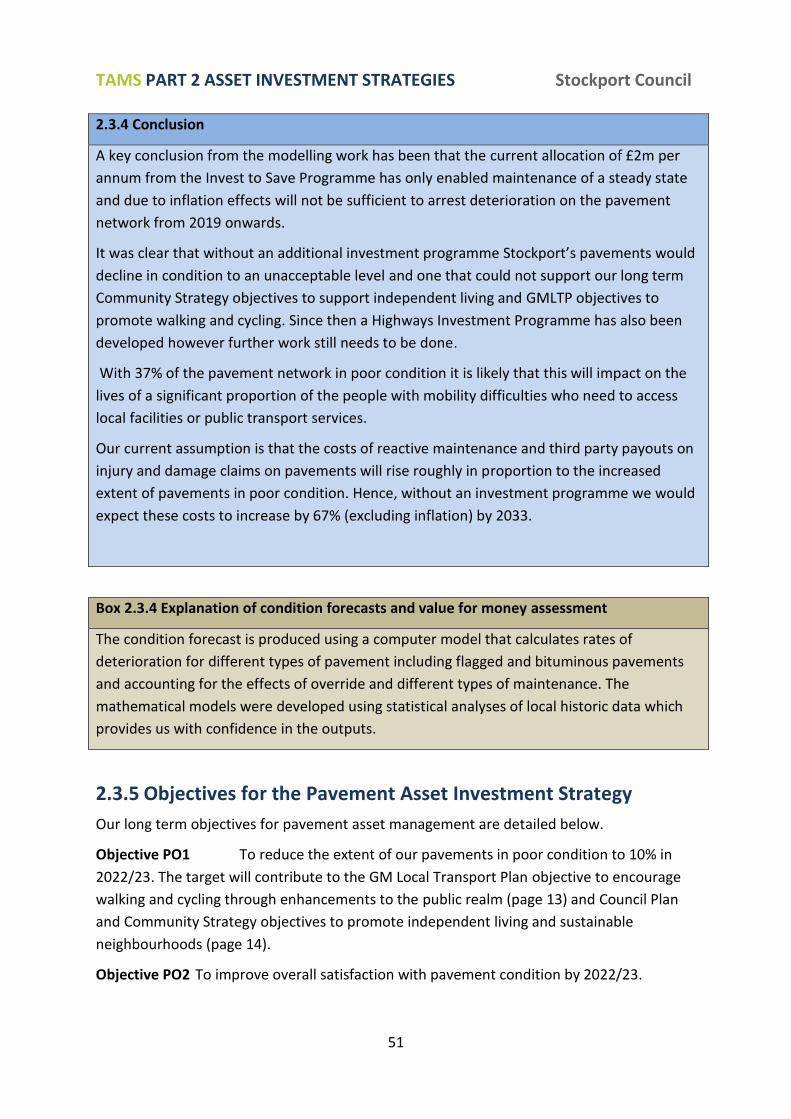
TAMS PART 2 ASSET INVESTMENT STRATEGIES Stockport Council
51
2.3.4 Conclusion
A key conclusion from the modelling work has been that the current allocation of £2m per
annum from the Invest to Save Programme has only enabled maintenance of a steady state
and due to inflation effects will not be sufficient to arrest deterioration on the pavement
network from 2019 onwards.
It was clear that without an additional investment programme Stockport’s pavements would
decline in condition to an unacceptable level and one that could not support our long term
Community Strategy objectives to support independent living and GMLTP objectives to
promote walking and cycling. Since then a Highways Investment Programme has also been
developed however further work still needs to be done.
With 37% of the pavement network in poor condition it is likely that this will impact on the
lives of a significant proportion of the people with mobility difficulties who need to access
local facilities or public transport services.
Our current assumption is that the costs of reactive maintenance and third party payouts on
injury and damage claims on pavements will rise roughly in proportion to the increased
extent of pavements in poor condition. Hence, without an investment programme we would
expect these costs to increase by 67% (excluding inflation) by 2033.
Box 2.3.4 Explanation of condition forecasts and value for money assessment
The condition forecast is produced using a computer model that calculates rates of
deterioration for different types of pavement including flagged and bituminous pavements
and accounting for the effects of override and different types of maintenance. The
mathematical models were developed using statistical analyses of local historic data which
provides us with confidence in the outputs.
2.3.5 Objectives for the Pavement Asset Investment Strategy
Our long term objectives for pavement asset management are detailed below.
Objective PO1 To reduce the extent of our pavements in poor condition to 10% in
2022/23. The target will contribute to the GM Local Transport Plan objective to encourage
walking and cycling through enhancements to the public realm (page 13) and Council Plan
and Community Strategy objectives to promote independent living and sustainable
neighbourhoods (page 14).
Objective PO2 To improve overall satisfaction with pavement condition by 2022/23.
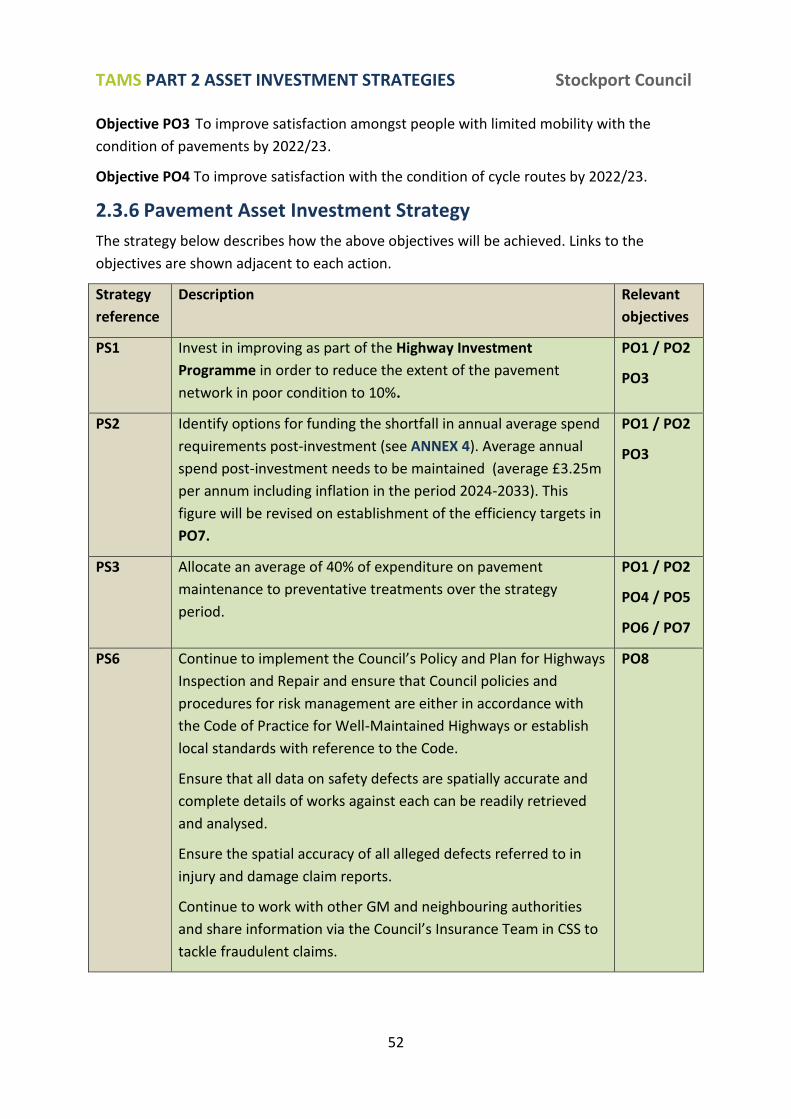
TAMS PART 2 ASSET INVESTMENT STRATEGIES Stockport Council
52
Objective PO3 To improve satisfaction amongst people with limited mobility with the
condition of pavements by 2022/23.
Objective PO4 To improve satisfaction with the condition of cycle routes by 2022/23.
2.3.6 Pavement Asset Investment Strategy
The strategy below describes how the above objectives will be achieved. Links to the
objectives are shown adjacent to each action.
Strategy
reference
Description Relevant
objectives
PS1 Invest in improving as part of the Highway Investment
Programme in order to reduce the extent of the pavement
network in poor condition to 10%.
PO1 / PO2
PO3
PS2 Identify options for funding the shortfall in annual average spend
requirements post-investment (see ANNEX 4). Average annual
spend post-investment needs to be maintained (average £3.25m
per annum including inflation in the period 2024-2033). This
figure will be revised on establishment of the efficiency targets in
PO7.
PO1 / PO2
PO3
PS3 Allocate an average of 40% of expenditure on pavement
maintenance to preventative treatments over the strategy
period.
PO1 / PO2
PO4 / PO5
PO6 / PO7
PS6 Continue to implement the Council’s Policy and Plan for Highways
Inspection and Repair and ensure that Council policies and
procedures for risk management are either in accordance with
the Code of Practice for Well-Maintained Highways or establish
local standards with reference to the Code.
Ensure that all data on safety defects are spatially accurate and
complete details of works against each can be readily retrieved
and analysed.
Ensure the spatial accuracy of all alleged defects referred to in
injury and damage claim reports.
Continue to work with other GM and neighbouring authorities
and share information via the Council’s Insurance Team in CSS to
tackle fraudulent claims.
PO8

TAMS PART 2 ASSET INVESTMENT STRATEGIES Stockport Council
53
2.3.7 Strategic risk assessment for the Pavement Asset Investment Strategy
Table 2.3.7 overleaf provides a strategic risk register that will be maintained and updated on
an annual basis. This details the residual risks that objectives in Section 2.3.5 are not
achieved through the strategy in Section 2.3.6. The risk register is designed to comply with
Stockport Council’s Risk Management Framework and Strategy and will be reported
annually.
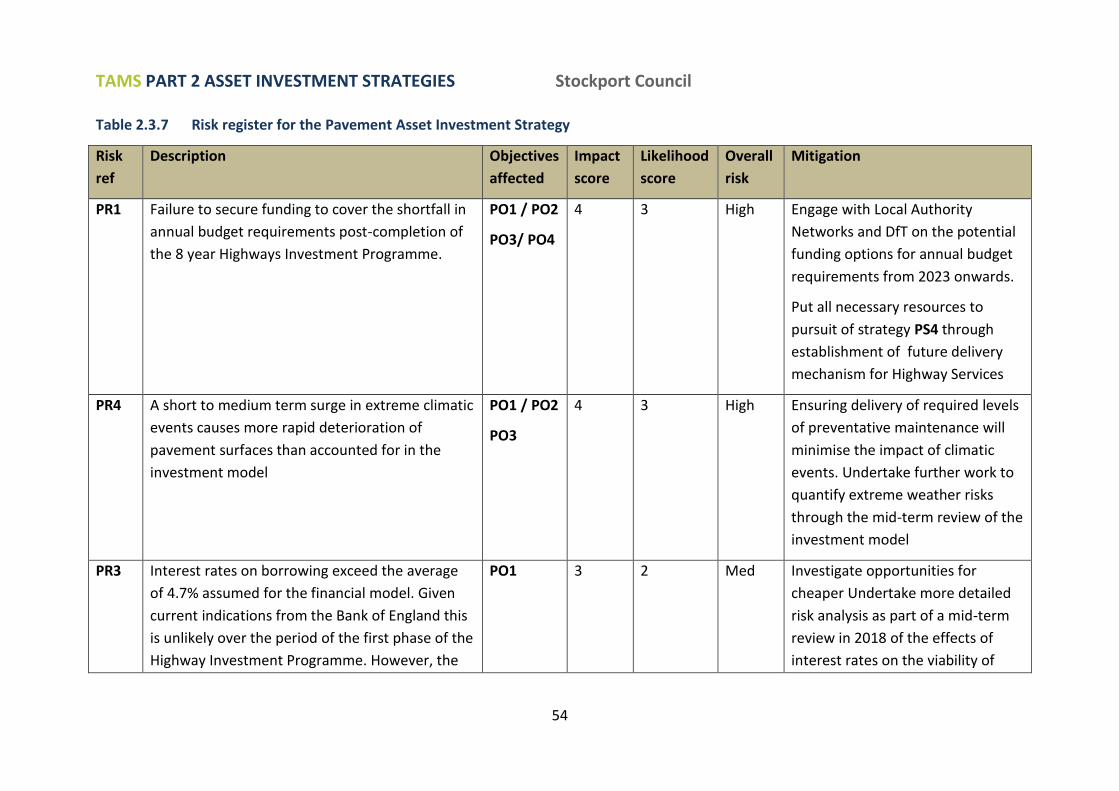
TAMS PART 2 ASSET INVESTMENT STRATEGIES Stockport Council
54
Table 2.3.7 Risk register for the Pavement Asset Investment Strategy
Risk
ref
Description Objectives
affected
Impact
score
Likelihood
score
Overall
risk
Mitigation
PR1 Failure to secure funding to cover the shortfall in
annual budget requirements post-completion of
the 8 year Highways Investment Programme.
PO1 / PO2
PO3/ PO4
4 3 High Engage with Local Authority
Networks and DfT on the potential
funding options for annual budget
requirements from 2023 onwards.
Put all necessary resources to
pursuit of strategy PS4 through
establishment of future delivery
mechanism for Highway Services
PR4 A short to medium term surge in extreme climatic
events causes more rapid deterioration of
pavement surfaces than accounted for in the
investment model
PO1 / PO2
PO3
4 3 High Ensuring delivery of required levels
of preventative maintenance will
minimise the impact of climatic
events. Undertake further work to
quantify extreme weather risks
through the mid-term review of the
investment model
PR3 Interest rates on borrowing exceed the average
of 4.7% assumed for the financial model. Given
current indications from the Bank of England this
is unlikely over the period of the first phase of the
Highway Investment Programme. However, the
PO1 3 2 Med Investigate opportunities for
cheaper Undertake more detailed
risk analysis as part of a mid-term
review in 2018 of the effects of
interest rates on the viability of
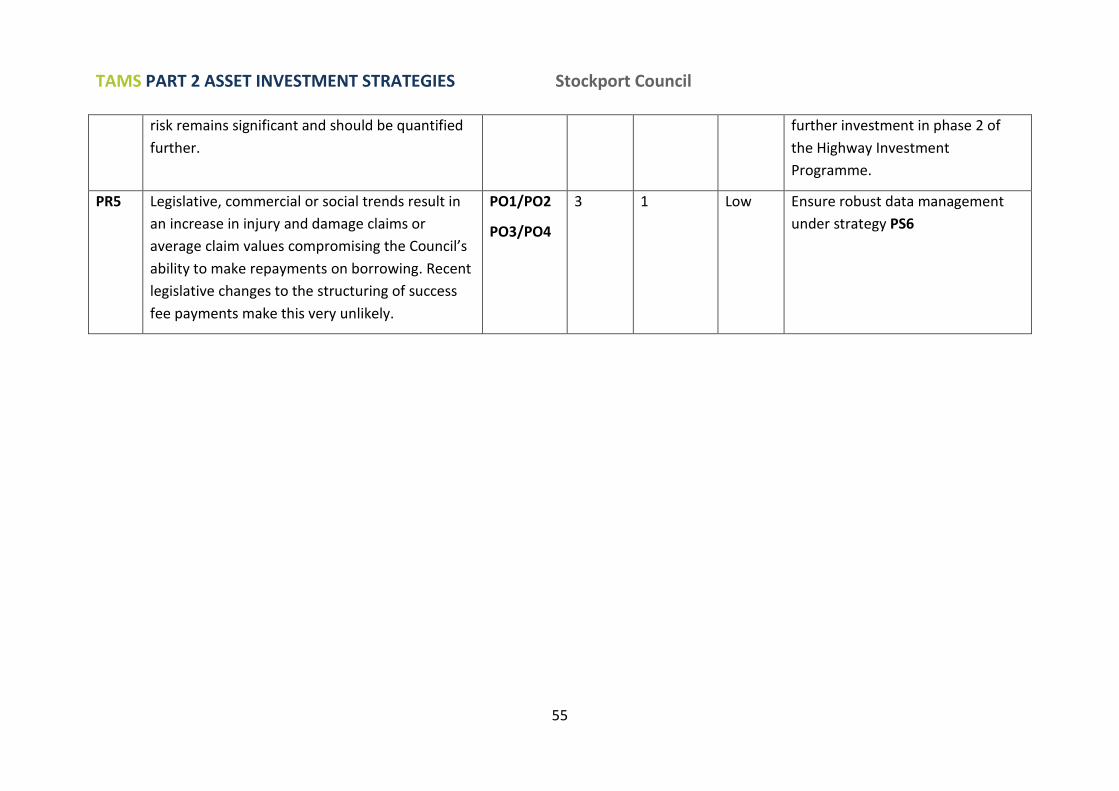
TAMS PART 2 ASSET INVESTMENT STRATEGIES Stockport Council
55
risk remains significant and should be quantified
further.
further investment in phase 2 of
the Highway Investment
Programme.
PR5 Legislative, commercial or social trends result in
an increase in injury and damage claims or
average claim values compromising the Council’s
ability to make repayments on borrowing. Recent
legislative changes to the structuring of success
fee payments make this very unlikely.
PO1/PO2
PO3/PO4
3 1 Low Ensure robust data management
under strategy PS6
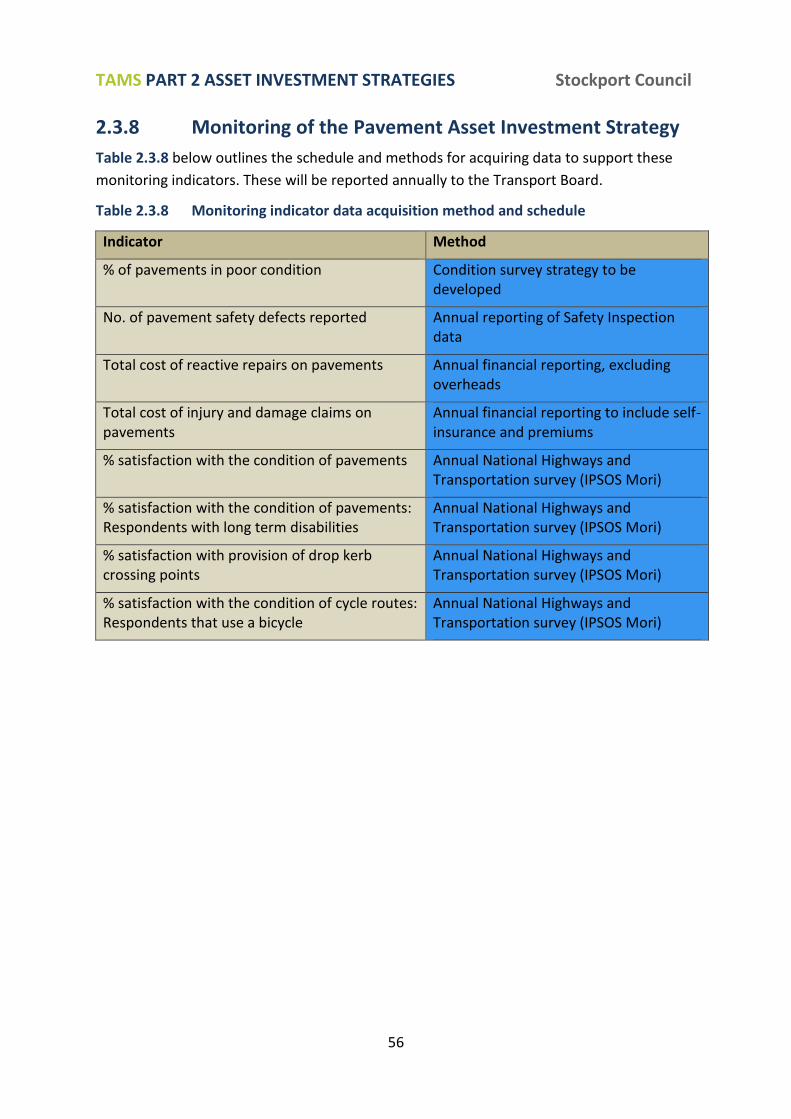
TAMS PART 2 ASSET INVESTMENT STRATEGIES Stockport Council
56
2.3.8 Monitoring of the Pavement Asset Investment Strategy
Table 2.3.8 below outlines the schedule and methods for acquiring data to support these
monitoring indicators. These will be reported annually to the Transport Board.
Table 2.3.8 Monitoring indicator data acquisition method and schedule
Indicator Method
% of pavements in poor condition Condition survey strategy to be developed
No. of pavement safety defects reported Annual reporting of Safety Inspection data
Total cost of reactive repairs on pavements Annual financial reporting, excluding overheads
Total cost of injury and damage claims on pavements
Annual financial reporting to include self-insurance and premiums
% satisfaction with the condition of pavements Annual National Highways and Transportation survey (IPSOS Mori)
% satisfaction with the condition of pavements: Respondents with long term disabilities
Annual National Highways and Transportation survey (IPSOS Mori)
% satisfaction with provision of drop kerb crossing points
Annual National Highways and Transportation survey (IPSOS Mori)
% satisfaction with the condition of cycle routes: Respondents that use a bicycle
Annual National Highways and Transportation survey (IPSOS Mori)
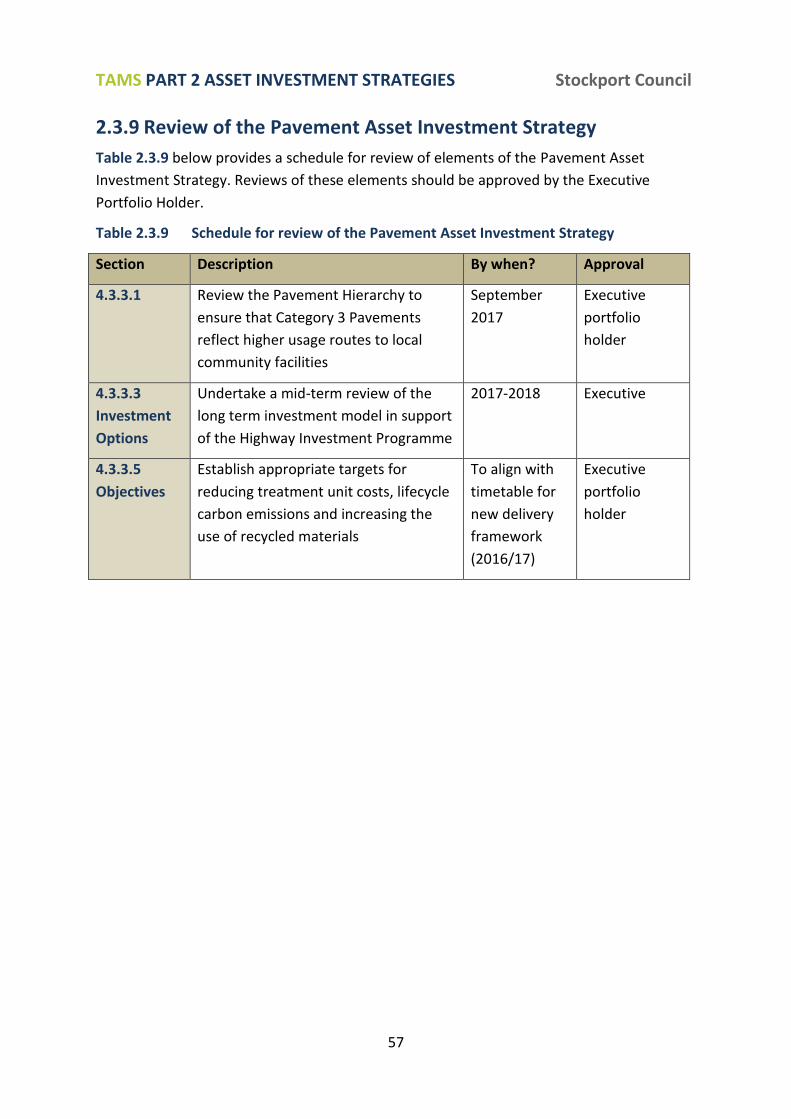
TAMS PART 2 ASSET INVESTMENT STRATEGIES Stockport Council
57
2.3.9 Review of the Pavement Asset Investment Strategy
Table 2.3.9 below provides a schedule for review of elements of the Pavement Asset
Investment Strategy. Reviews of these elements should be approved by the Executive
Portfolio Holder.
Table 2.3.9 Schedule for review of the Pavement Asset Investment Strategy
Section Description By when? Approval
4.3.3.1 Review the Pavement Hierarchy to
ensure that Category 3 Pavements
reflect higher usage routes to local
community facilities
September
2017
Executive
portfolio
holder
4.3.3.3
Investment
Options
Undertake a mid-term review of the
long term investment model in support
of the Highway Investment Programme
2017-2018 Executive
4.3.3.5
Objectives
Establish appropriate targets for
reducing treatment unit costs, lifecycle
carbon emissions and increasing the
use of recycled materials
To align with
timetable for
new delivery
framework
(2016/17)
Executive
portfolio
holder

TAMS PART 2 ASSET INVESTMENT STRATEGIES Stockport Council
58
2.4 HIGHWAY BRIDGES AND STRUCTURES
2.4.1 Classification and inventory of Highway Bridges and Structures
There are currently 859 bridges and structures in Stockport Council’s ownership. Of these, the current version of the TAMS provides detailed modelling of only those structures that are defined within the scope of the Code of Practice for Management of Highway Structures, as defined in Table 2.4.1a below:
Table 2.4.1a Classification of Stockport’s Highway Bridges and Structures
Structure type No.
Bridges >=1.5m span supporting adopted roads 78
Footbridges >=1.5m span supporting adopted footpaths 14
Retaining Walls >=1.5m height supporting or adjacent to adopted highways 117
Culverts >=1.5m diameter for watercourses beneath adopted highways 35
Sign gantries 5
Subways 17
Tunnels 1
All highway structures 267
The gross value of these structures is £273.8M.
Stockport Council also monitors slopes providing structural support to highways across the Borough. As geotechnical investigations are carried out on these slopes are included within the structures database. The TAMS financial projection includes works required to be carried out on these slopes.
The Borough also has a large number of Steps which are being monitored and maintained as structures. These steps are being upgraded to meet modern guidance as necessary.
There are also a large number of structures supporting public rights of way and routes in parks and open space as detailed in Table 2.4.1b below:
Table 2.4.1b Other structures managed by Stockport Council
Structure type Public Rights of Way Parks and Open Space
Bridges >=1.5m span 0 7
Footbridges >=1.5m span 49 64
Retaining Walls >=1.5m height 1 84
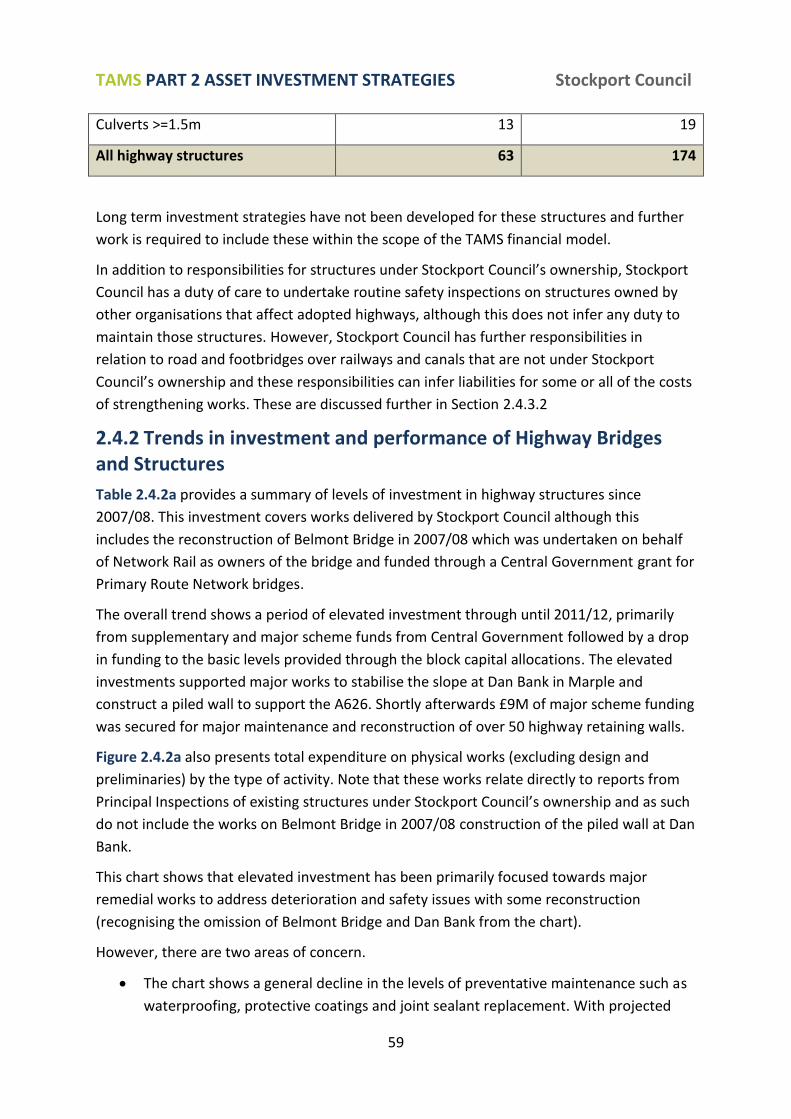
TAMS PART 2 ASSET INVESTMENT STRATEGIES Stockport Council
59
Culverts >=1.5m 13 19
All highway structures 63 174
Long term investment strategies have not been developed for these structures and further
work is required to include these within the scope of the TAMS financial model.
In addition to responsibilities for structures under Stockport Council’s ownership, Stockport
Council has a duty of care to undertake routine safety inspections on structures owned by
other organisations that affect adopted highways, although this does not infer any duty to
maintain those structures. However, Stockport Council has further responsibilities in
relation to road and footbridges over railways and canals that are not under Stockport
Council’s ownership and these responsibilities can infer liabilities for some or all of the costs
of strengthening works. These are discussed further in Section 2.4.3.2
2.4.2 Trends in investment and performance of Highway Bridges and Structures
Table 2.4.2a provides a summary of levels of investment in highway structures since
2007/08. This investment covers works delivered by Stockport Council although this
includes the reconstruction of Belmont Bridge in 2007/08 which was undertaken on behalf
of Network Rail as owners of the bridge and funded through a Central Government grant for
Primary Route Network bridges.
The overall trend shows a period of elevated investment through until 2011/12, primarily
from supplementary and major scheme funds from Central Government followed by a drop
in funding to the basic levels provided through the block capital allocations. The elevated
investments supported major works to stabilise the slope at Dan Bank in Marple and
construct a piled wall to support the A626. Shortly afterwards £9M of major scheme funding
was secured for major maintenance and reconstruction of over 50 highway retaining walls.
Figure 2.4.2a also presents total expenditure on physical works (excluding design and
preliminaries) by the type of activity. Note that these works relate directly to reports from
Principal Inspections of existing structures under Stockport Council’s ownership and as such
do not include the works on Belmont Bridge in 2007/08 construction of the piled wall at Dan
Bank.
This chart shows that elevated investment has been primarily focused towards major
remedial works to address deterioration and safety issues with some reconstruction
(recognising the omission of Belmont Bridge and Dan Bank from the chart).
However, there are two areas of concern.
The chart shows a general decline in the levels of preventative maintenance such as
waterproofing, protective coatings and joint sealant replacement. With projected

TAMS PART 2 ASSET INVESTMENT STRATEGIES Stockport Council
60
Central Government allocations for structures unlikely to increase above £1.000M
for the next spending review period, this general trend will inevitably continue
without additional investment.
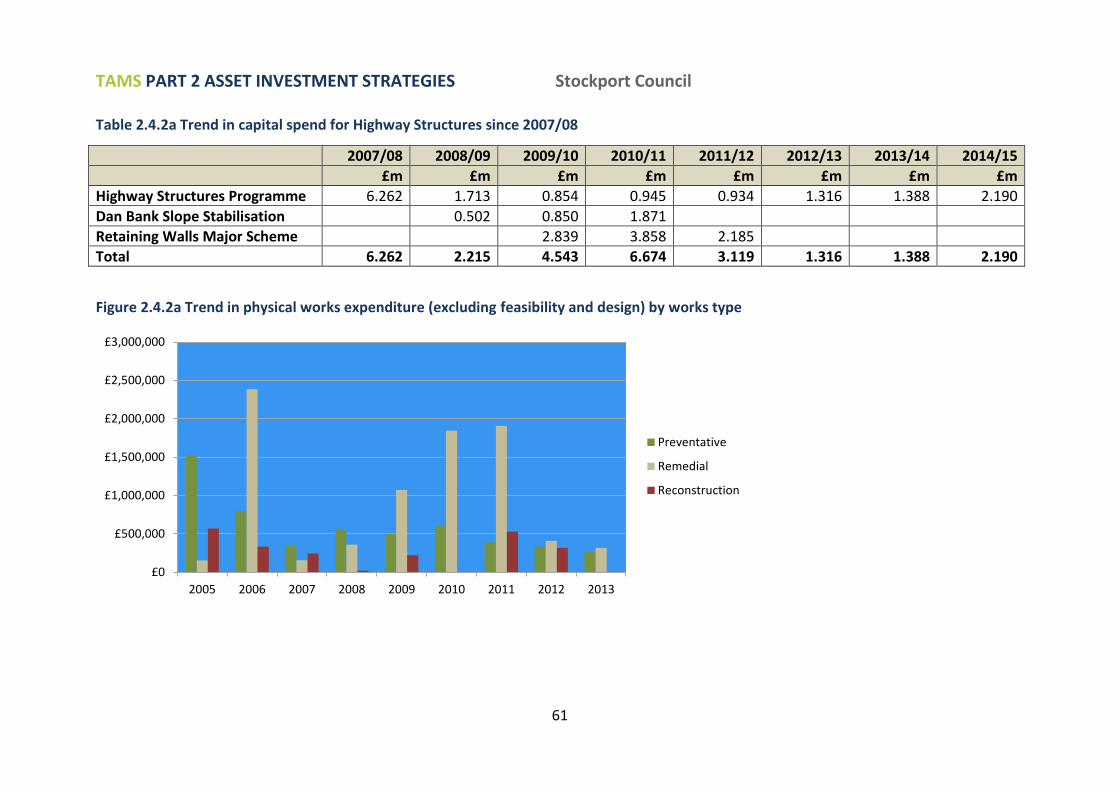
TAMS PART 2 ASSET INVESTMENT STRATEGIES Stockport Council
61
Table 2.4.2a Trend in capital spend for Highway Structures since 2007/08
2007/08 2008/09 2009/10 2010/11 2011/12 2012/13 2013/14 2014/15
£m £m £m £m £m £m £m £m
Highway Structures Programme 6.262 1.713 0.854 0.945 0.934 1.316 1.388 2.190
Dan Bank Slope Stabilisation 0.502 0.850 1.871
Retaining Walls Major Scheme 2.839 3.858 2.185
Total 6.262 2.215 4.543 6.674 3.119 1.316 1.388 2.190
Figure 2.4.2a Trend in physical works expenditure (excluding feasibility and design) by works type
£0
£500,000
£1,000,000
£1,500,000
£2,000,000
£2,500,000
£3,000,000
2005 2006 2007 2008 2009 2010 2011 2012 2013
Preventative
Remedial
Reconstruction
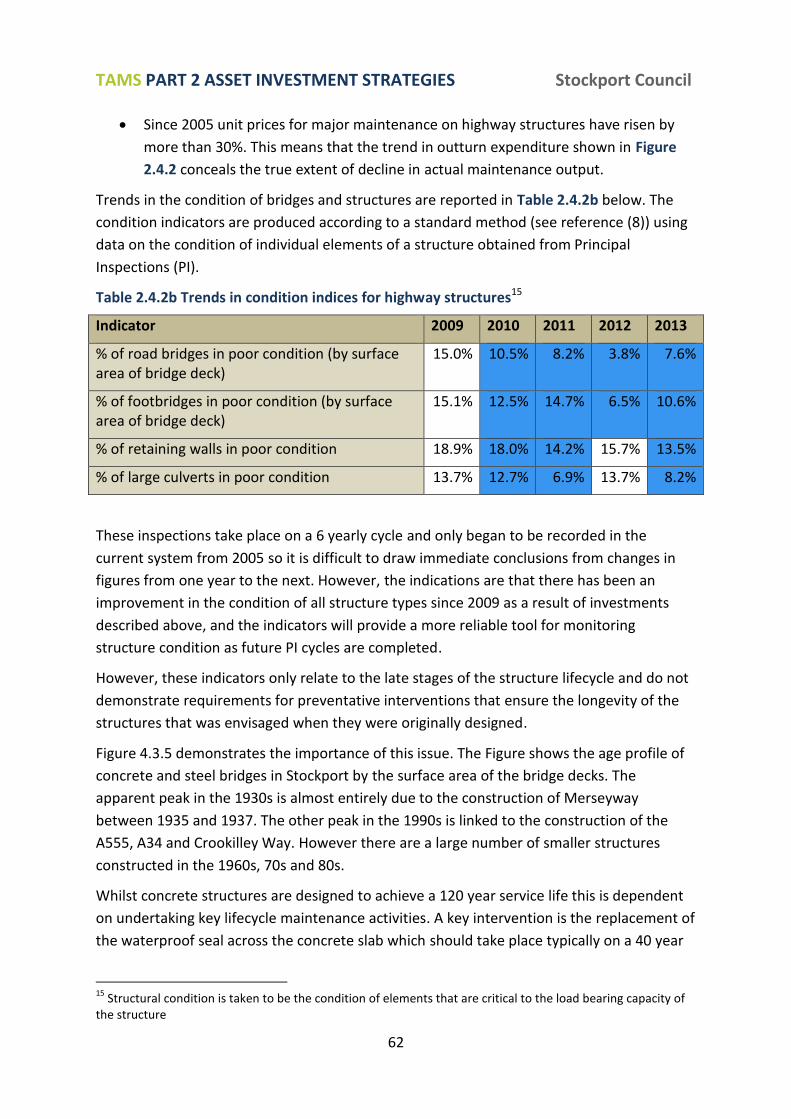
TAMS PART 2 ASSET INVESTMENT STRATEGIES Stockport Council
62
Since 2005 unit prices for major maintenance on highway structures have risen by
more than 30%. This means that the trend in outturn expenditure shown in Figure
2.4.2 conceals the true extent of decline in actual maintenance output.
Trends in the condition of bridges and structures are reported in Table 2.4.2b below. The
condition indicators are produced according to a standard method (see reference (8)) using
data on the condition of individual elements of a structure obtained from Principal
Inspections (PI).
Table 2.4.2b Trends in condition indices for highway structures15
Indicator 2009 2010 2011 2012 2013
% of road bridges in poor condition (by surface area of bridge deck)
15.0% 10.5% 8.2% 3.8% 7.6%
% of footbridges in poor condition (by surface area of bridge deck)
15.1% 12.5% 14.7% 6.5% 10.6%
% of retaining walls in poor condition 18.9% 18.0% 14.2% 15.7% 13.5%
% of large culverts in poor condition 13.7% 12.7% 6.9% 13.7% 8.2%
These inspections take place on a 6 yearly cycle and only began to be recorded in the
current system from 2005 so it is difficult to draw immediate conclusions from changes in
figures from one year to the next. However, the indications are that there has been an
improvement in the condition of all structure types since 2009 as a result of investments
described above, and the indicators will provide a more reliable tool for monitoring
structure condition as future PI cycles are completed.
However, these indicators only relate to the late stages of the structure lifecycle and do not
demonstrate requirements for preventative interventions that ensure the longevity of the
structures that was envisaged when they were originally designed.
Figure 4.3.5 demonstrates the importance of this issue. The Figure shows the age profile of
concrete and steel bridges in Stockport by the surface area of the bridge decks. The
apparent peak in the 1930s is almost entirely due to the construction of Merseyway
between 1935 and 1937. The other peak in the 1990s is linked to the construction of the
A555, A34 and Crookilley Way. However there are a large number of smaller structures
constructed in the 1960s, 70s and 80s.
Whilst concrete structures are designed to achieve a 120 year service life this is dependent
on undertaking key lifecycle maintenance activities. A key intervention is the replacement of
the waterproof seal across the concrete slab which should take place typically on a 40 year
15
Structural condition is taken to be the condition of elements that are critical to the load bearing capacity of the structure
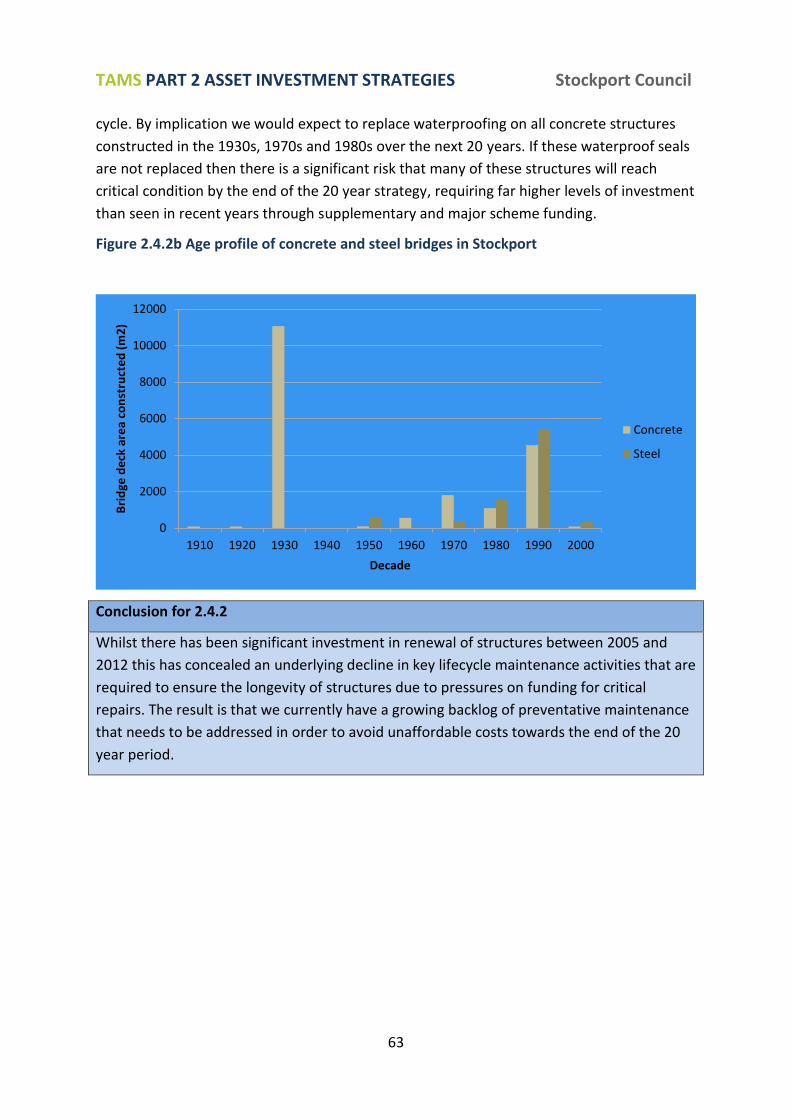
TAMS PART 2 ASSET INVESTMENT STRATEGIES Stockport Council
63
cycle. By implication we would expect to replace waterproofing on all concrete structures
constructed in the 1930s, 1970s and 1980s over the next 20 years. If these waterproof seals
are not replaced then there is a significant risk that many of these structures will reach
critical condition by the end of the 20 year strategy, requiring far higher levels of investment
than seen in recent years through supplementary and major scheme funding.
Figure 2.4.2b Age profile of concrete and steel bridges in Stockport
Conclusion for 2.4.2
Whilst there has been significant investment in renewal of structures between 2005 and
2012 this has concealed an underlying decline in key lifecycle maintenance activities that are
required to ensure the longevity of structures due to pressures on funding for critical
repairs. The result is that we currently have a growing backlog of preventative maintenance
that needs to be addressed in order to avoid unaffordable costs towards the end of the 20
year period.
0
2000
4000
6000
8000
10000
12000
1910 1920 1930 1940 1950 1960 1970 1980 1990 2000
Bri
dge
de
ck a
rea
con
stru
cte
d (
m2
)
Decade
Concrete
Steel
TAMS PART 2 ASSET INVESTMENT STRATEGIES Stockport Council
64
2.4.3 Future demands, risks and opportunities for Highway Structures Asset Investment Strategy
2.4.3.1 Climate change As already mentioned, forecasts for Greater Manchester in the 2050s indicate that rainfall
events leading to surface water flooding and high river flow will become more frequent.
Heatwaves are also likely to become more frequent by the 2050s with most years
experiencing at least 1-3 days with temperatures over 30°C. Less certain is the likely
frequency of extreme cold weather, although recent experience of record breaking winter
weather between 2010 and 2012 in the UK would suggest that we must be prepared for this
risk over the next 20 years.
Given the strategic nature of many structures the risks posed by climate change are detailed
in the strategic risk register in Section 2.4.7.
Engineering solutions to many of these problems are a matter of ensuring timely
preventative interventions. However, it is clear from the previous section that current
budgets do not enable this to happen. As a result our structures assets will become
increasingly vulnerable to these growing risks.
In the case of bridges over rivers and a number of critical slopes in the east of Stockport
there is a need for additional protection measures to prevent scour and erosion during
periods of high river flow. Additionally, relatively low cost interventions to stabilise slopes
by planting trees and shrubs will have benefits in terms of soil conservation and habitat
enhancement.
2.4.3.2 Network rail and Canal and River Trust bridges Road bridges and footbridges over railways and canals are owned and maintained
respectively by Network Rail and the Canal and River Trust and as such do not fall within the
scope of Stockport Council’s highway infrastructure assets. However, in maintaining those
bridges, Network Rail and the Canal and River Trust are only legally required to ensure that
the bridges are designed to bear 24 tonne loading from traffic16 which is far short of the
requirements for modern traffic load bearing on highways17. The responsibility for meeting
the remainder of the load bearing capacity for these bridges falls with Stockport Council for
local highways in Stockport.
If, following an assessment, it is determined on the basis of design and current condition
that the structure is insufficient to meet modern traffic loading requirements an
arrangement for cost sharing is usually made on the basis of the relative extents to which
the bridge fails to meet the respective requirements of each party.
16
Contained within the Technical Memorandum (Bridges) No. BE4 The Assessment of Highway Bridges for Construction and Use Vehicles (1967) as amended up to 11th November 1970, Ministry of Transport 17
BD21 The Assessment of Highway Bridges and Structures (DMRB 3.4.3) requires structures to meet 40 tonne load bearing capacity

TAMS PART 2 ASSET INVESTMENT STRATEGIES Stockport Council
65
Under existing arrangements Stockport Council is unable constrained it its ability to actively
plan for long term investments in these structures and any future costs must be treated as a
financial risk to the Council.
Whilst Stockport Council is aware of assessments to Network Rail bridges last undertaken in
2000, Stockport council does not currently have Network Rails condition results from its
inspections most recently undertaken on these bridges. Of particular concern is the status of
Greek St Bridge which traverses the West Coast Mainline to the south of Stockport Rail
Station which had a number of issues raised about its load bearing capacity in its 2000
assessment. Network Rail currently hopes to address issues with this structure in 2017
however, until then it remains a risk to the success of the Town Centre Access Package.
Stockport Council will seek to liaise with Network Rail on the current condition of the
bridges and risks to the structure within the next 5-10 year time frame.
2.4.3.3 Town Centre Structures
The context of the Town Centre regeneration proposals and Town Centre Access Plan has been discussed in Section 1.5.8. There are a number of key structures that are central to future proposals for the Town Centre. Two structures in particular require major interventions to ensure continued performance beyond the 20 year strategy period.
Merseyway, is formed from a substantial system of reinforced portal frames with reinforced concrete slabs spanning across the River Mersey and supporting the central retail area with a total deck area of 9000m2. The structure currently requires continuous annual budgets in order to complete concrete repairs to the frames and slabs. Whilst these repairs should ensure continued structural performance of the structure for a further 40 years this is dependent on replacement of the transverse and longitudinal movement joints and application of a continuous waterproof system over the deck for the full extent of Merseyway.
Wellington Road Viaduct, which is a 140m long series of masonry arches supporting the A6 through the town centre. The waterproof system along the width and length of the viaduct requires replacement in order to avoid structural damage to the arches and damage to the infrastructure (electric sub-station) below. Clearly any works to these structures and to Greek St Bridges mentioned above, will have significant impacts on accessibility to the Town Centre and so the timing is crucial. It is also important to consider the whole lifecycle options and future risks for these structures in detail to ensure that interventions provide optimum outcomes in terms of costs and benefits to the Town Centre economy
Other Structures
Queens Road Bridge, which was constructed in 1959 is a single span reinforced concrete bridge supported on mass concrete abutments which carries Queens Road over Micker Brook in the Cheadle Hulme area. The bridge was assessed in 1995 and it was concluded that the

TAMS PART 2 ASSET INVESTMENT STRATEGIES Stockport Council
66
bridge was only capable of carrying 17 tonne Assessment Live Loading (ALL) and a 7.5 tonne weight restriction was imposed on the bridge. In order to increase the capacity of the bridge to carry the full 40/44T ALL and 45 units of HB loading the bridge superstructure requires full replacement.
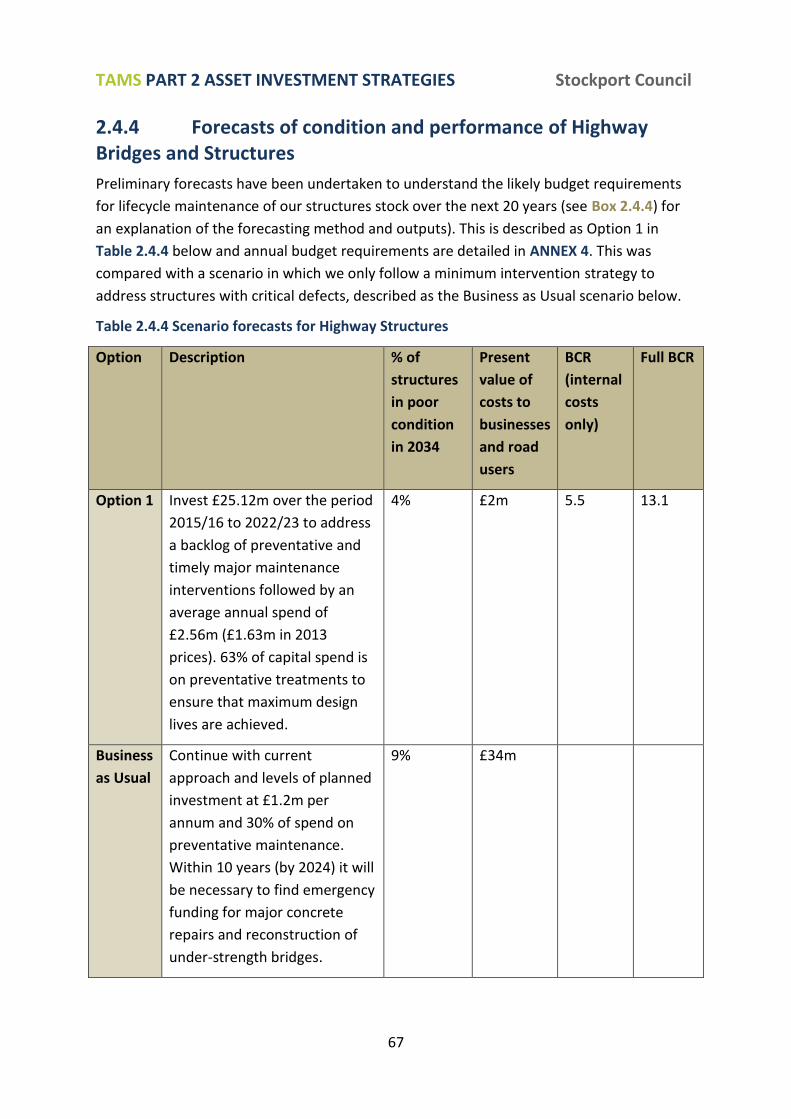
TAMS PART 2 ASSET INVESTMENT STRATEGIES Stockport Council
67
2.4.4 Forecasts of condition and performance of Highway Bridges and Structures
Preliminary forecasts have been undertaken to understand the likely budget requirements
for lifecycle maintenance of our structures stock over the next 20 years (see Box 2.4.4) for
an explanation of the forecasting method and outputs). This is described as Option 1 in
Table 2.4.4 below and annual budget requirements are detailed in ANNEX 4. This was
compared with a scenario in which we only follow a minimum intervention strategy to
address structures with critical defects, described as the Business as Usual scenario below.
Table 2.4.4 Scenario forecasts for Highway Structures
Option Description % of
structures
in poor
condition
in 2034
Present
value of
costs to
businesses
and road
users
BCR
(internal
costs
only)
Full BCR
Option 1 Invest £25.12m over the period
2015/16 to 2022/23 to address
a backlog of preventative and
timely major maintenance
interventions followed by an
average annual spend of
£2.56m (£1.63m in 2013
prices). 63% of capital spend is
on preventative treatments to
ensure that maximum design
lives are achieved.
4% £2m 5.5 13.1
Business
as Usual
Continue with current
approach and levels of planned
investment at £1.2m per
annum and 30% of spend on
preventative maintenance.
Within 10 years (by 2024) it will
be necessary to find emergency
funding for major concrete
repairs and reconstruction of
under-strength bridges.
9% £34m
TAMS PART 2 ASSET INVESTMENT STRATEGIES Stockport Council
68
The model outputs indicate that following a minimum intervention strategy (Business as
Usual) will result in substantially higher maintenance costs over the 20 year period as we
will need to undertake more expensive repairs to concrete and masonry structures. At the
same time, owing to the fact that the minimum intervention strategy will inevitably be
reactive this will result in the need for prolonged traffic restrictions to avoid significant
safety risks. The present value of costs of traffic disruption to businesses, commuters and
other road users is estimated at £34m over the 20 year period.
The model used for this edition of the TAMS is only able to provide us with an indication of
scope and is not reliable enough to provide details on numbers of structures affected.
Further work needs to be undertaken to develop a more robust model for these purposes.
Future programmes are being developed which will ensure that the existing backlog is
addressed at a sufficient rate to enable us to anticipate deterioration on other structures in
the medium term. The programme will includes a number of preventative measures such as
scour protection, slope toe protection and deck waterproofing.
Conclusions for 2.4.4
Further work is required to validate and improve the model on which the 20 year forecasts
are based. However, this provides scope and quantified evidence to direct the need for
elevated investment in lifecycle maintenance activities and demonstrates that following a
minimum intervention strategy will result in higher costs for the Council and tax payer.
TAMS PART 2 ASSET INVESTMENT STRATEGIES Stockport Council
69
Box 2.4.4. Explanation of highway structures forecasts and options
Structures deterioration model
The forecasts have been undertaken by adapting outputs from the Structures Asset
Management Planning Toolkit produced by the UK Bridges Board using detailed data on
Stockport’s bridges and structures. This data includes information on structure elements
and their current condition as well as other risk factors affecting deterioration and impacts
of works and restrictions on traffic disruption.
The model forecasts deterioration taking account of uncertainty in deterioration rates and
random events. It uses data on Stockport’s forward works programme (up to 5 years in
advance) after which the model uses predetermined decision rules to identify appropriate
maintenance treatments according to a chosen strategy.
The deterioration models require further validation with historical and current data. Models
should be reviewed on a regular basis as new data becomes available to ensure that risk
forecasting is as reliable as possible.
Traffic delay costs
The model also uses information on the design features of structures to determine the type
of traffic management required for different types of work and the typical levels of delay to
road users. Total delays and congestion from closures and diversions have been estimated
using a basic traffic model for a sample of 80 structures across Stockport. The costs of delays
to businesses and road users have been calculated using standard parameters in the DfT’s
Transport Analysis Guidance (WebTAG).
How the scenarios are defined
In this assessment an investment strategy with 63% of capital spend on early life
preventative interventions (for example waterproofing) was compared against a largely
reactive approach which focuses annual programmes on structures in critical condition and
only allows for 30% spend on preventative treatments. This reflects the situation that
Stockport Council currently faces as we are unable to allocate sufficient funding to
preventative treatments.
Assessment and modelling of investment options for structures requires a different
approach to those for roads and footways. Structures can be assessed to be unsafe if load
bearing elements deteriorate to an unacceptable condition. At this point engineering risk
assessment is used to determine if traffic restrictions are required or even full closure of the
road. Therefore the economic costs of a reactive approach to management of structures can
be prohibitive to the extent that the Local Authority must seek emergency funds to address
the problem.
In assessing the Business as Usual scenario we have not used current budgets as constraints
TAMS PART 2 ASSET INVESTMENT STRATEGIES Stockport Council
70
Box 2.4.4. Explanation of highway structures forecasts and options
but rather set the approach to prioritising works such that it reflects current practice. In this
way it is demonstrated that continuation of current practice will lead to both unacceptably
high costs to road users and also will directly affect the Council’s own financial
sustainability.
Value for money assessment
We have compared the present value of costs of Investment Option 1 with the Business as
Usual approach to present Benefit Cost Ratios (BCR) to provide a measure of value for
money. These are presented both in terms of the internal benefits and costs for the Council
(or public accounts) and also as a full economic BCR to include a comparison of the wider
costs to road users and businesses as a result of traffic delays.
TAMS PART 2 ASSET INVESTMENT STRATEGIES Stockport Council
71
2.4.5 Objectives for the Highway Structures Asset Investment Strategy
BO1 Achieve maximum design lives from our bridges and structures by undertaking
necessary preventative and routine measures, subject to the need to limit disruption to
traffic.
BO2 Ensure that interventions to address deterioration are early enough to avoid any
need for prolonged restrictions or closures on any roads supported by bridges and retaining
walls under Stockport Council’s ownership. This is with the exception of restrictions for
network management purposes and those in place for the duration of maintenance
schemes.
BO3 Manage the condition of structures at the network level to ensure that there is
sufficient in-built redundancy and network resilience in the event of an emergency or failure
due to storm damage.
BO4 Ensure that necessary protection systems are installed to bridges, retaining walls and
slopes to enable contingency for anticipated frequencies and intensities of storm events and
fluvial flooding under current climate change projections.
BO5 Protect and enhance sensitive habitats that affect or are affected by our structures
or slopes supporting roads.
BO6 Continue to meet recommended and best practice in the Code of Practice for
Highway Bridges and Structures and other documents referenced therein.
BO7 Fulfil our Flood and Water Management Act obligations in relation to large culverts.
BO8 Reduce the level of lifecycle carbon emissions in structures maintenance operations
and maximise the use of recycled materials where appropriate.

TAMS PART 2 ASSET INVESTMENT STRATEGIES Stockport Council
72
2.4.6 Highway Structures Asset Investment Strategy
Ref Description Relevant
objectives
BS1 Pursue an elevated investment over the period 2015/16 to 2022/23 to
address a backlog of preventative and timely major maintenance
interventions.
Secure funding to enable additional investment in structures in
2016/17. Use the indicative scope of £21m for 2017/18-2022/23 as
shown in ANNEX 4 to identify appropriate funding options through
discussion with GMLTB and DfT.
Review the forecast model to obtain a more accurate prediction of
investment requirements over the period 2017/18-2022/23 and
beyond.
BO1 / BO2
BO3 / BO4
BO5
BS2 Identify options to address the shortfall in average annual spend
requirements from 2023 onwards. This is currently estimated at
£2.56m (£1.63m in 2013 prices).
BO1 / BO2
BO3
BS3 Allocate an average of 60% of expenditure on preventative and routine
maintenance over the strategy period to ensure design lives are
achieved
BO1 / BO2
BO3 / BO4
BO5
BS4 Undertake a network level study to review Stockport’s register of
critical structures. Ensure that it reflects risks, impacts and the need for
built-in redundancy.
BO3 / BO4
BO7
BS5 Establish appropriate targets within future delivery mechanisms for
reducing lifecycle carbon emissions for structures maintenance
schemes
BO8
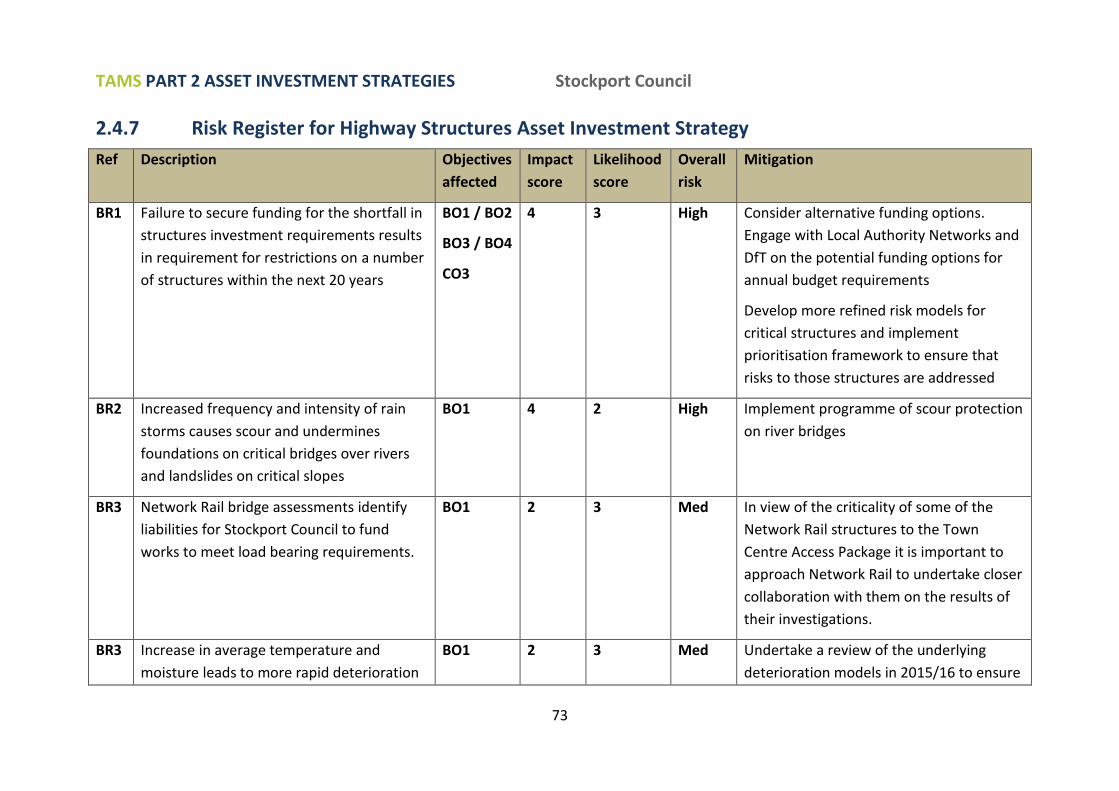
TAMS PART 2 ASSET INVESTMENT STRATEGIES Stockport Council
73
2.4.7 Risk Register for Highway Structures Asset Investment Strategy
Ref Description Objectives
affected
Impact
score
Likelihood
score
Overall
risk
Mitigation
BR1 Failure to secure funding for the shortfall in
structures investment requirements results
in requirement for restrictions on a number
of structures within the next 20 years
BO1 / BO2
BO3 / BO4
CO3
4 3 High Consider alternative funding options.
Engage with Local Authority Networks and
DfT on the potential funding options for
annual budget requirements
Develop more refined risk models for
critical structures and implement
prioritisation framework to ensure that
risks to those structures are addressed
BR2 Increased frequency and intensity of rain
storms causes scour and undermines
foundations on critical bridges over rivers
and landslides on critical slopes
BO1 4 2 High Implement programme of scour protection
on river bridges
BR3 Network Rail bridge assessments identify
liabilities for Stockport Council to fund
works to meet load bearing requirements.
BO1 2 3 Med In view of the criticality of some of the
Network Rail structures to the Town
Centre Access Package it is important to
approach Network Rail to undertake closer
collaboration with them on the results of
their investigations.
BR3 Increase in average temperature and
moisture leads to more rapid deterioration
BO1 2 3 Med Undertake a review of the underlying
deterioration models in 2015/16 to ensure

TAMS PART 2 ASSET INVESTMENT STRATEGIES Stockport Council
74
Ref Description Objectives
affected
Impact
score
Likelihood
score
Overall
risk
Mitigation
of concrete structures (due to increased
rate of carbonation etc.) beyond those
accounted for in the financial forecast
that this is accounted for.
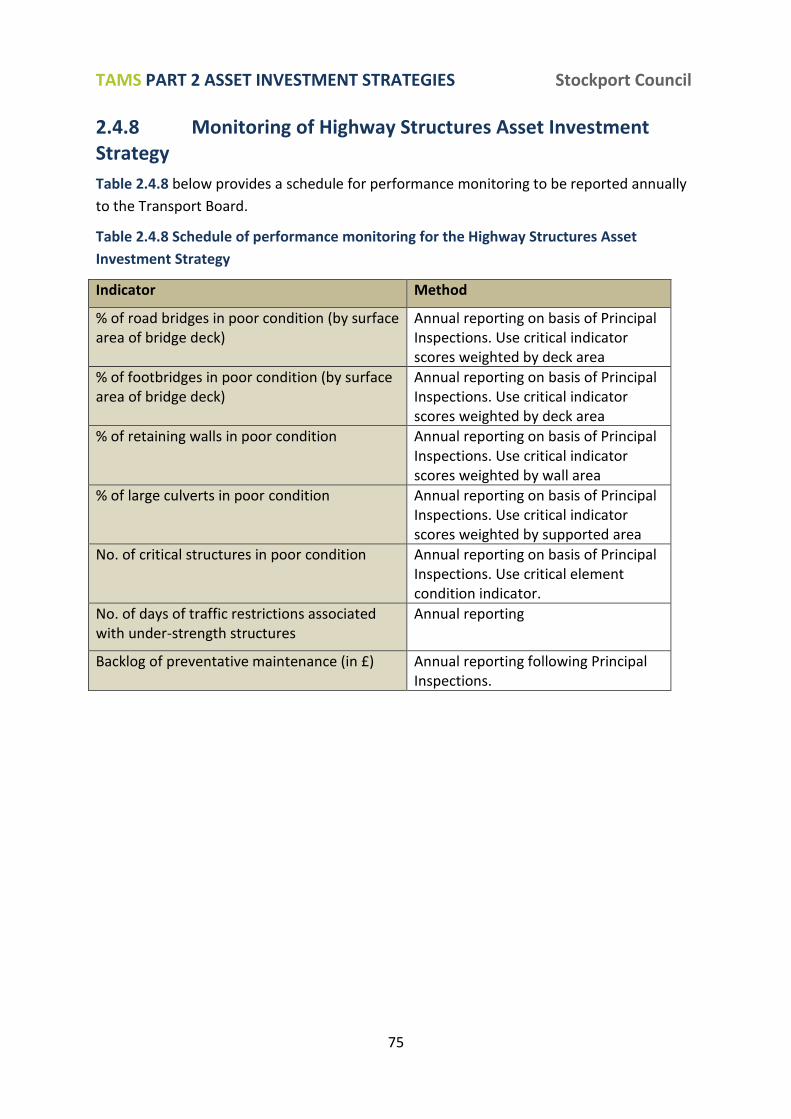
TAMS PART 2 ASSET INVESTMENT STRATEGIES Stockport Council
75
2.4.8 Monitoring of Highway Structures Asset Investment Strategy
Table 2.4.8 below provides a schedule for performance monitoring to be reported annually
to the Transport Board.
Table 2.4.8 Schedule of performance monitoring for the Highway Structures Asset
Investment Strategy
Indicator Method
% of road bridges in poor condition (by surface area of bridge deck)
Annual reporting on basis of Principal Inspections. Use critical indicator scores weighted by deck area
% of footbridges in poor condition (by surface area of bridge deck)
Annual reporting on basis of Principal Inspections. Use critical indicator scores weighted by deck area
% of retaining walls in poor condition Annual reporting on basis of Principal Inspections. Use critical indicator scores weighted by wall area
% of large culverts in poor condition Annual reporting on basis of Principal Inspections. Use critical indicator scores weighted by supported area
No. of critical structures in poor condition Annual reporting on basis of Principal Inspections. Use critical element condition indicator.
No. of days of traffic restrictions associated with under-strength structures
Annual reporting
Backlog of preventative maintenance (in £) Annual reporting following Principal Inspections.
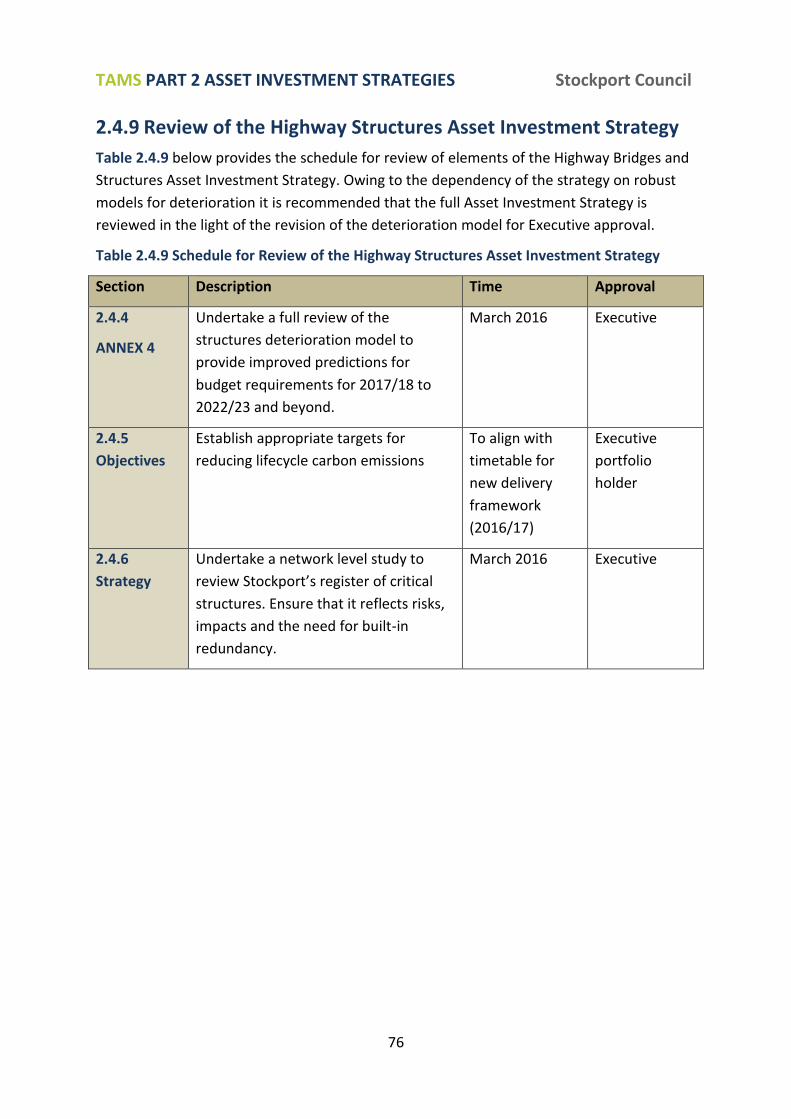
TAMS PART 2 ASSET INVESTMENT STRATEGIES Stockport Council
76
2.4.9 Review of the Highway Structures Asset Investment Strategy
Table 2.4.9 below provides the schedule for review of elements of the Highway Bridges and
Structures Asset Investment Strategy. Owing to the dependency of the strategy on robust
models for deterioration it is recommended that the full Asset Investment Strategy is
reviewed in the light of the revision of the deterioration model for Executive approval.
Table 2.4.9 Schedule for Review of the Highway Structures Asset Investment Strategy
Section Description Time Approval
2.4.4
ANNEX 4
Undertake a full review of the
structures deterioration model to
provide improved predictions for
budget requirements for 2017/18 to
2022/23 and beyond.
March 2016 Executive
2.4.5
Objectives
Establish appropriate targets for
reducing lifecycle carbon emissions
To align with
timetable for
new delivery
framework
(2016/17)
Executive
portfolio
holder
2.4.6
Strategy
Undertake a network level study to
review Stockport’s register of critical
structures. Ensure that it reflects risks,
impacts and the need for built-in
redundancy.
March 2016 Executive
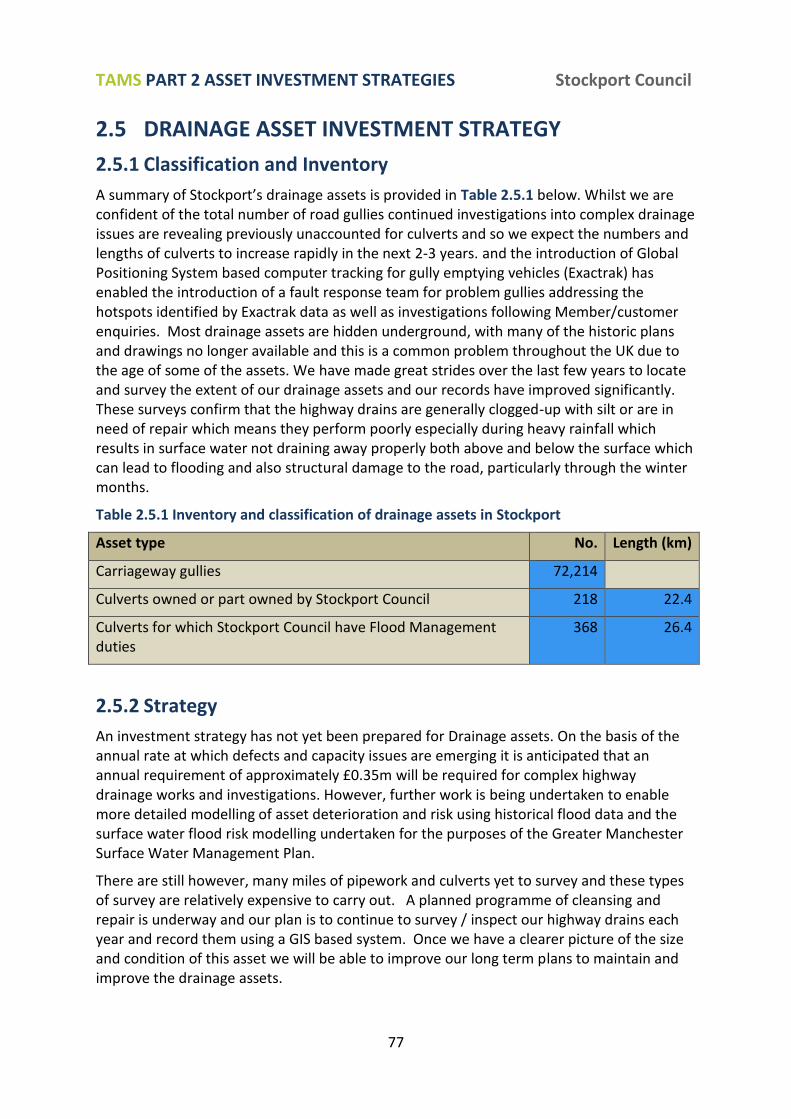
TAMS PART 2 ASSET INVESTMENT STRATEGIES Stockport Council
77
2.5 DRAINAGE ASSET INVESTMENT STRATEGY
2.5.1 Classification and Inventory
A summary of Stockport’s drainage assets is provided in Table 2.5.1 below. Whilst we are confident of the total number of road gullies continued investigations into complex drainage issues are revealing previously unaccounted for culverts and so we expect the numbers and lengths of culverts to increase rapidly in the next 2-3 years. and the introduction of Global Positioning System based computer tracking for gully emptying vehicles (Exactrak) has enabled the introduction of a fault response team for problem gullies addressing the hotspots identified by Exactrak data as well as investigations following Member/customer enquiries. Most drainage assets are hidden underground, with many of the historic plans and drawings no longer available and this is a common problem throughout the UK due to the age of some of the assets. We have made great strides over the last few years to locate and survey the extent of our drainage assets and our records have improved significantly. These surveys confirm that the highway drains are generally clogged-up with silt or are in need of repair which means they perform poorly especially during heavy rainfall which results in surface water not draining away properly both above and below the surface which can lead to flooding and also structural damage to the road, particularly through the winter months.
Table 2.5.1 Inventory and classification of drainage assets in Stockport
Asset type No. Length (km)
Carriageway gullies 72,214
Culverts owned or part owned by Stockport Council 218 22.4
Culverts for which Stockport Council have Flood Management duties
368 26.4
2.5.2 Strategy
An investment strategy has not yet been prepared for Drainage assets. On the basis of the annual rate at which defects and capacity issues are emerging it is anticipated that an annual requirement of approximately £0.35m will be required for complex highway drainage works and investigations. However, further work is being undertaken to enable more detailed modelling of asset deterioration and risk using historical flood data and the surface water flood risk modelling undertaken for the purposes of the Greater Manchester Surface Water Management Plan.
There are still however, many miles of pipework and culverts yet to survey and these types of survey are relatively expensive to carry out. A planned programme of cleansing and repair is underway and our plan is to continue to survey / inspect our highway drains each year and record them using a GIS based system. Once we have a clearer picture of the size and condition of this asset we will be able to improve our long term plans to maintain and improve the drainage assets.
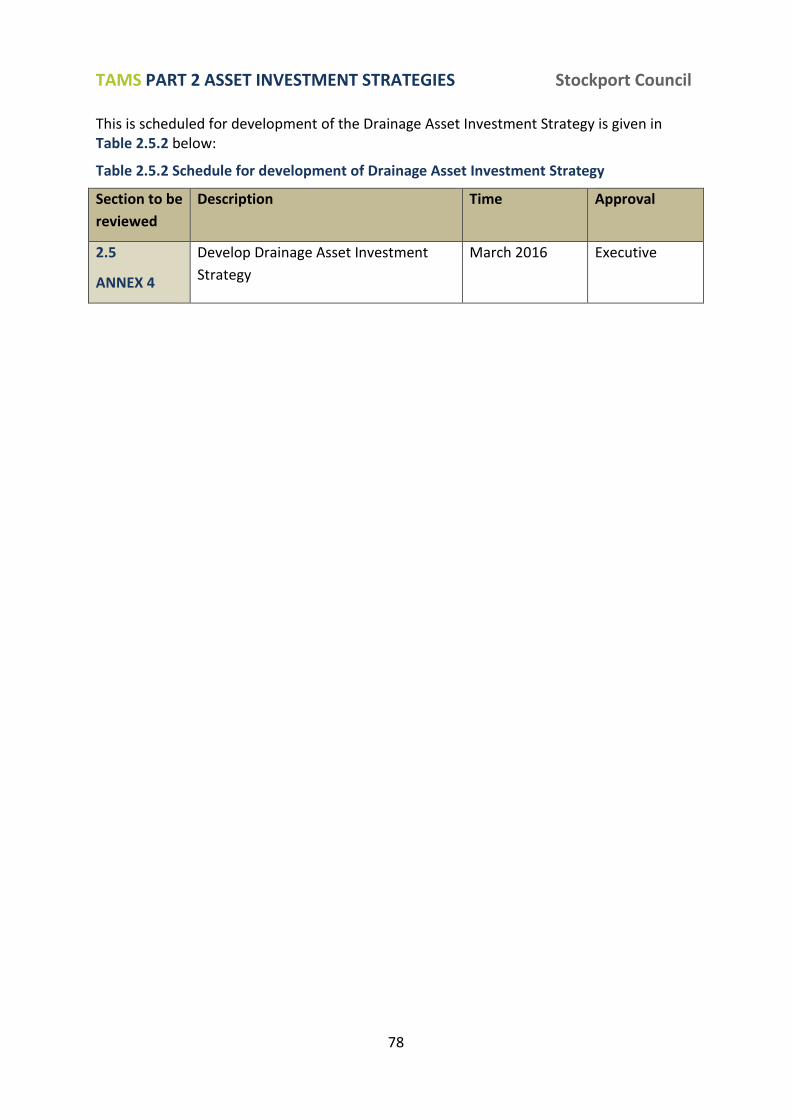
TAMS PART 2 ASSET INVESTMENT STRATEGIES Stockport Council
78
This is scheduled for development of the Drainage Asset Investment Strategy is given in Table 2.5.2 below:
Table 2.5.2 Schedule for development of Drainage Asset Investment Strategy
Section to be
reviewed
Description Time Approval
2.5
ANNEX 4
Develop Drainage Asset Investment
Strategy
March 2016 Executive
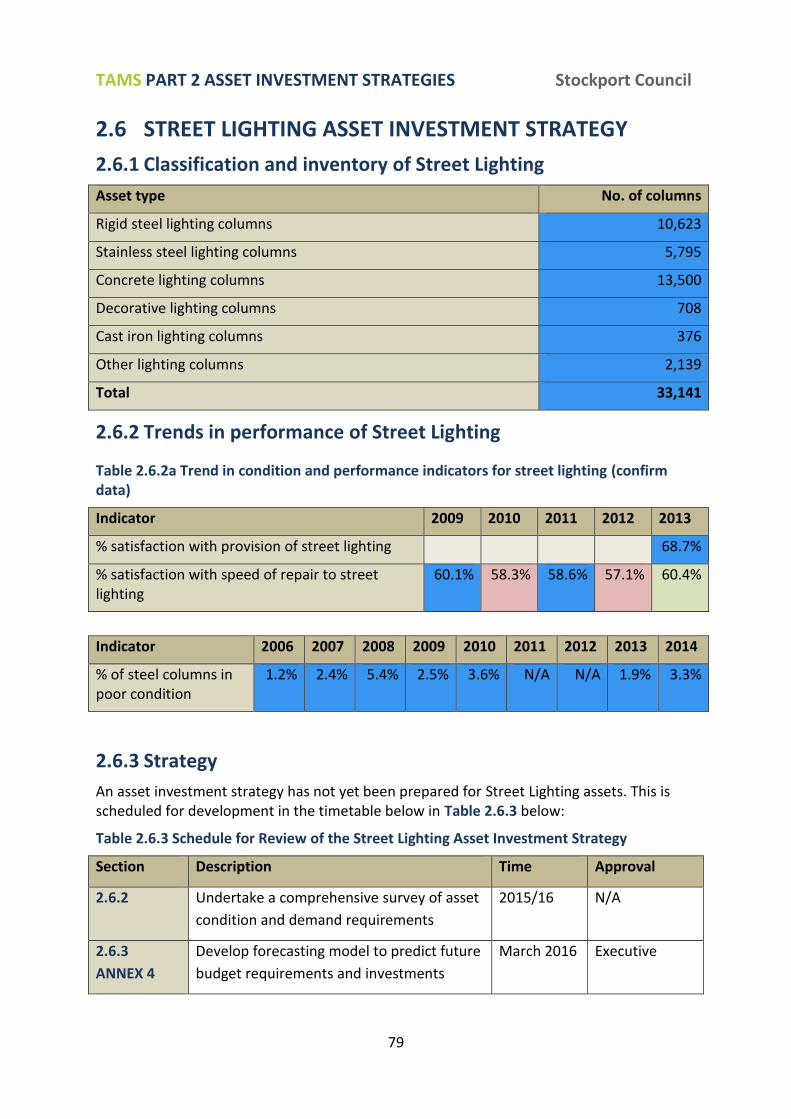
TAMS PART 2 ASSET INVESTMENT STRATEGIES Stockport Council
79
2.6 STREET LIGHTING ASSET INVESTMENT STRATEGY
2.6.1 Classification and inventory of Street Lighting
Asset type No. of columns
Rigid steel lighting columns 10,623
Stainless steel lighting columns 5,795
Concrete lighting columns 13,500
Decorative lighting columns 708
Cast iron lighting columns 376
Other lighting columns 2,139
Total 33,141
2.6.2 Trends in performance of Street Lighting
Table 2.6.2a Trend in condition and performance indicators for street lighting (confirm data)
Indicator 2009 2010 2011 2012 2013
% satisfaction with provision of street lighting 68.7%
% satisfaction with speed of repair to street lighting
60.1% 58.3% 58.6% 57.1% 60.4%
2.6.3 Strategy
An asset investment strategy has not yet been prepared for Street Lighting assets. This is scheduled for development in the timetable below in Table 2.6.3 below:
Table 2.6.3 Schedule for Review of the Street Lighting Asset Investment Strategy
Section Description Time Approval
2.6.2 Undertake a comprehensive survey of asset
condition and demand requirements
2015/16 N/A
2.6.3
ANNEX 4
Develop forecasting model to predict future
budget requirements and investments
March 2016 Executive
Indicator 2006 2007 2008 2009 2010 2011 2012 2013 2014
% of steel columns in poor condition
1.2% 2.4% 5.4% 2.5% 3.6% N/A N/A 1.9% 3.3%
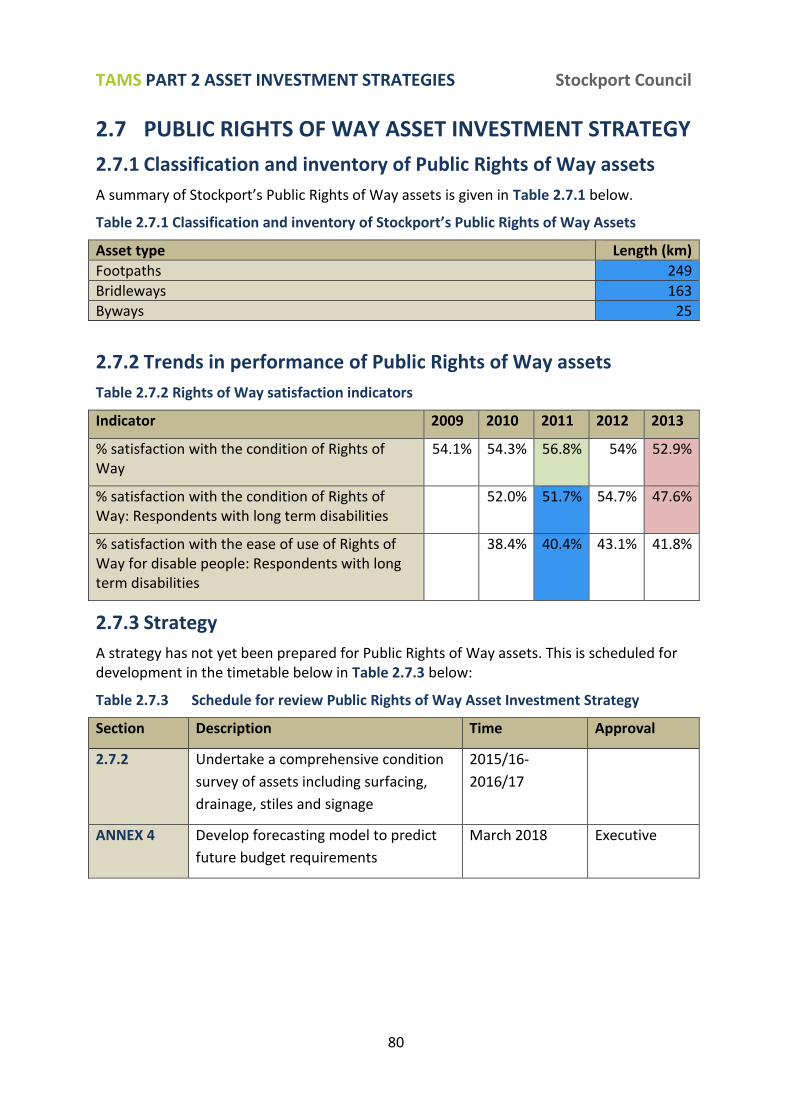
TAMS PART 2 ASSET INVESTMENT STRATEGIES Stockport Council
80
2.7 PUBLIC RIGHTS OF WAY ASSET INVESTMENT STRATEGY
2.7.1 Classification and inventory of Public Rights of Way assets
A summary of Stockport’s Public Rights of Way assets is given in Table 2.7.1 below.
Table 2.7.1 Classification and inventory of Stockport’s Public Rights of Way Assets
Asset type Length (km)
Footpaths 249
Bridleways 163
Byways 25
2.7.2 Trends in performance of Public Rights of Way assets
Table 2.7.2 Rights of Way satisfaction indicators
Indicator 2009 2010 2011 2012 2013
% satisfaction with the condition of Rights of Way
54.1% 54.3% 56.8% 54% 52.9%
% satisfaction with the condition of Rights of Way: Respondents with long term disabilities
52.0% 51.7% 54.7% 47.6%
% satisfaction with the ease of use of Rights of Way for disable people: Respondents with long term disabilities
38.4% 40.4% 43.1% 41.8%
2.7.3 Strategy
A strategy has not yet been prepared for Public Rights of Way assets. This is scheduled for development in the timetable below in Table 2.7.3 below:
Table 2.7.3 Schedule for review Public Rights of Way Asset Investment Strategy
Section Description Time Approval
2.7.2
Undertake a comprehensive condition
survey of assets including surfacing,
drainage, stiles and signage
2015/16-
2016/17
ANNEX 4 Develop forecasting model to predict
future budget requirements
March 2018 Executive
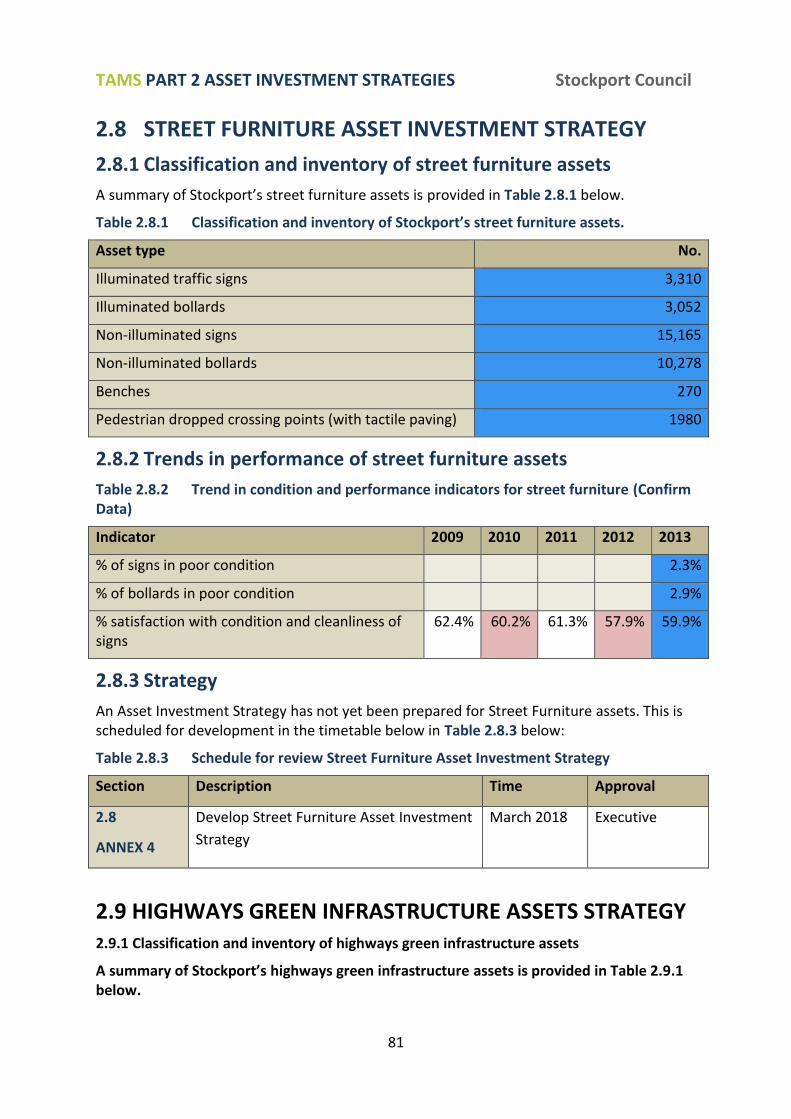
TAMS PART 2 ASSET INVESTMENT STRATEGIES Stockport Council
81
2.8 STREET FURNITURE ASSET INVESTMENT STRATEGY
2.8.1 Classification and inventory of street furniture assets
A summary of Stockport’s street furniture assets is provided in Table 2.8.1 below.
Table 2.8.1 Classification and inventory of Stockport’s street furniture assets.
Asset type No.
Illuminated traffic signs 3,310
Illuminated bollards 3,052
Non-illuminated signs 15,165
Non-illuminated bollards 10,278
Benches 270
Pedestrian dropped crossing points (with tactile paving) 1980
2.8.2 Trends in performance of street furniture assets
Table 2.8.2 Trend in condition and performance indicators for street furniture (Confirm Data)
Indicator 2009 2010 2011 2012 2013
% of signs in poor condition 2.3%
% of bollards in poor condition 2.9%
% satisfaction with condition and cleanliness of signs
62.4% 60.2% 61.3% 57.9% 59.9%
2.8.3 Strategy
An Asset Investment Strategy has not yet been prepared for Street Furniture assets. This is scheduled for development in the timetable below in Table 2.8.3 below:
Table 2.8.3 Schedule for review Street Furniture Asset Investment Strategy
Section Description Time Approval
2.8
ANNEX 4
Develop Street Furniture Asset Investment
Strategy
March 2018 Executive
2.9 HIGHWAYS GREEN INFRASTRUCTURE ASSETS STRATEGY 2.9.1 Classification and inventory of highways green infrastructure assets
A summary of Stockport’s highways green infrastructure assets is provided in Table 2.9.1 below.
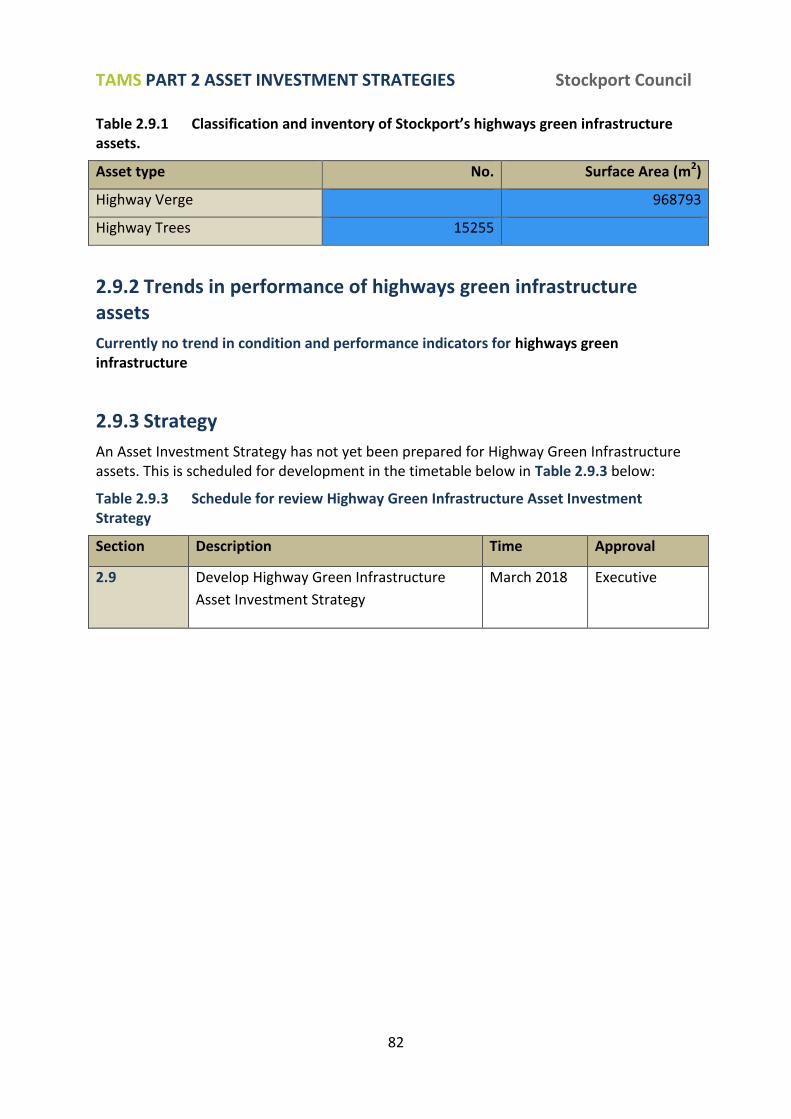
TAMS PART 2 ASSET INVESTMENT STRATEGIES Stockport Council
82
Table 2.9.1 Classification and inventory of Stockport’s highways green infrastructure assets.
Asset type No. Surface Area (m2)
Highway Verge 968793
Highway Trees 15255
2.9.2 Trends in performance of highways green infrastructure assets
Currently no trend in condition and performance indicators for highways green infrastructure
2.9.3 Strategy
An Asset Investment Strategy has not yet been prepared for Highway Green Infrastructure assets. This is scheduled for development in the timetable below in Table 2.9.3 below:
Table 2.9.3 Schedule for review Highway Green Infrastructure Asset Investment Strategy
Section Description Time Approval
2.9
Develop Highway Green Infrastructure
Asset Investment Strategy
March 2018 Executive

TAMS PART 3 PERFORMANCE PLAN Stockport Council
83
PART 3 PERFORMANCE PLAN
TAMS PART 3 PERFORMANCE PLAN Stockport Council
84
3.1 OUTLINE This section provides an outline of the corporate processes required to support asset management. The section is laid out as follows:
SECTION 3.2 PRIORITISATION FRAMEWORK Provides the decision making criteria for prioritising physical works including our approach to managing critical risks. This will be applied in the development of rolling 5 year forward works programmes.
SECTION 3.3 FINANCIAL REPORTING This section summarises financial reporting requirements through the Whole of Government Accounts process, associated actions and an estimate of capacity and resources required.
SECTION 3.4 ASSET INFORMATION MANAGEMENT This section summarises requirements in relevant standards within BS1192 for Asset Information Management with an estimate of resources required and timescales.
TAMS PART 3 PERFORMANCE PLAN Stockport Council
85
3.2 PRIORITISATION FRAMEWORK
3.2.1 Guiding principles
3.2.1.1 Delivering the optimum service There will never be sufficient resources to undertake every maintenance operation that is identified through inspections and condition assessments in the desired time frame. The investment options identified in the Asset Investment Strategies take this into account by working towards optimum levels of service rather than simply quantifying everything that needs doing. However, the forecasting models used for TAMS are primarily reliability or risk-based and as such cannot take into account all the localised factors associated with a potential scheme that are relevant to the strategy objectives in the TAMS.
With the optimum levels of investment identified through the forecast models, the prioritisation framework is then required to enable decisions on which physical works should be included in medium term plans and which should be deferred or even not undertaken at all. This should ensure that the optimum outcome is achieved taking into account the TAMS strategy objectives.
This framework does not prescribe in detail the tools that should be used and weightings to be applied to criteria. The aim of this document is to enable a practicable, consistent and systematic approach to assessing critical risks and applying value engineering criteria across all asset types. However, where multiple options are identified for a large number of schemes it may be necessary to employ the use of optimisation programs to avoid the need for excessive staff resources in preparation.
3.2.1.2 Application to capital maintenance works The framework applies to capital works that have a function in:
Enhancing performance for example by reducing failure risks, providing better ride quality or more reliable journey times or
Extending its life by reducing deterioration rates and improving the long term economic performance of the asset
This is distinct from reactive works that deal directly with the consequences of failures and seek to minimise harm caused by them. Although the definitions are not always clear cut, reactive works are not expected to reduce the risk of failure happening again over the planning period and do not improve the economic performance of the asset. Prioritisation methods for reactive works are detailed in relevant operational policies, such as the Highway Inspection and Repair Policy and Codes of Practice and do not form part of this framework.
3.2.2 Two-tier process
The framework uses a two-tier process. The first tier contains scheme proposals that are associated with specific critical infrastructure or potential critical failure modes where the risks associated with not undertaking the scheme are scored as high or medium. The second tier contains the remaining scheme proposals that have been selected through a value engineering process. This process is summarised in Figure 3.1.2 below.
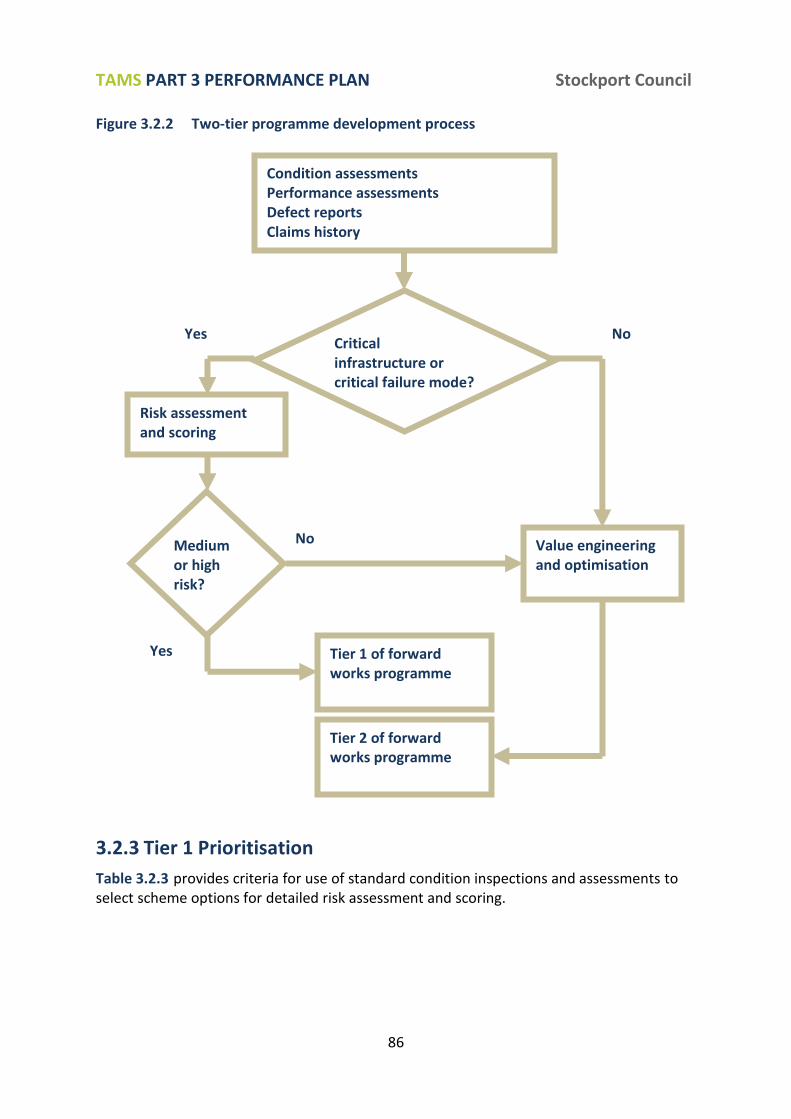
TAMS PART 3 PERFORMANCE PLAN Stockport Council
86
Figure 3.2.2 Two-tier programme development process
3.2.3 Tier 1 Prioritisation
Table 3.2.3 provides criteria for use of standard condition inspections and assessments to select scheme options for detailed risk assessment and scoring.
Condition assessments Performance assessments Defect reports Claims history
Risk assessment and scoring
Critical infrastructure or critical failure mode?
No Yes
Medium or high risk?
Value engineering and optimisation
Tier 1 of forward works programme
Tier 2 of forward works programme
No
Yes
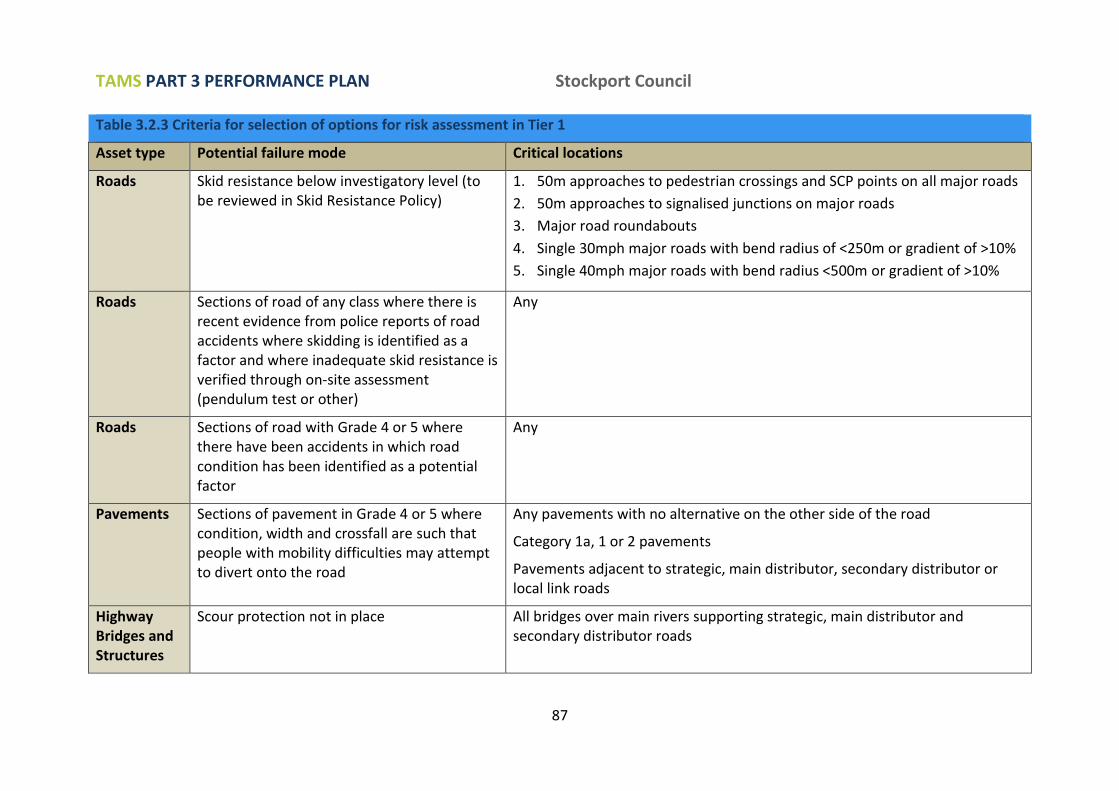
TAMS PART 3 PERFORMANCE PLAN Stockport Council
87
Table 3.2.3 Criteria for selection of options for risk assessment in Tier 1
Asset type Potential failure mode Critical locations
Roads Skid resistance below investigatory level (to be reviewed in Skid Resistance Policy)
1. 50m approaches to pedestrian crossings and SCP points on all major roads
2. 50m approaches to signalised junctions on major roads
3. Major road roundabouts
4. Single 30mph major roads with bend radius of <250m or gradient of >10%
5. Single 40mph major roads with bend radius <500m or gradient of >10%
Roads Sections of road of any class where there is recent evidence from police reports of road accidents where skidding is identified as a factor and where inadequate skid resistance is verified through on-site assessment (pendulum test or other)
Any
Roads Sections of road with Grade 4 or 5 where there have been accidents in which road condition has been identified as a potential factor
Any
Pavements Sections of pavement in Grade 4 or 5 where condition, width and crossfall are such that people with mobility difficulties may attempt to divert onto the road
Any pavements with no alternative on the other side of the road
Category 1a, 1 or 2 pavements
Pavements adjacent to strategic, main distributor, secondary distributor or local link roads
Highway Bridges and Structures
Scour protection not in place All bridges over main rivers supporting strategic, main distributor and secondary distributor roads
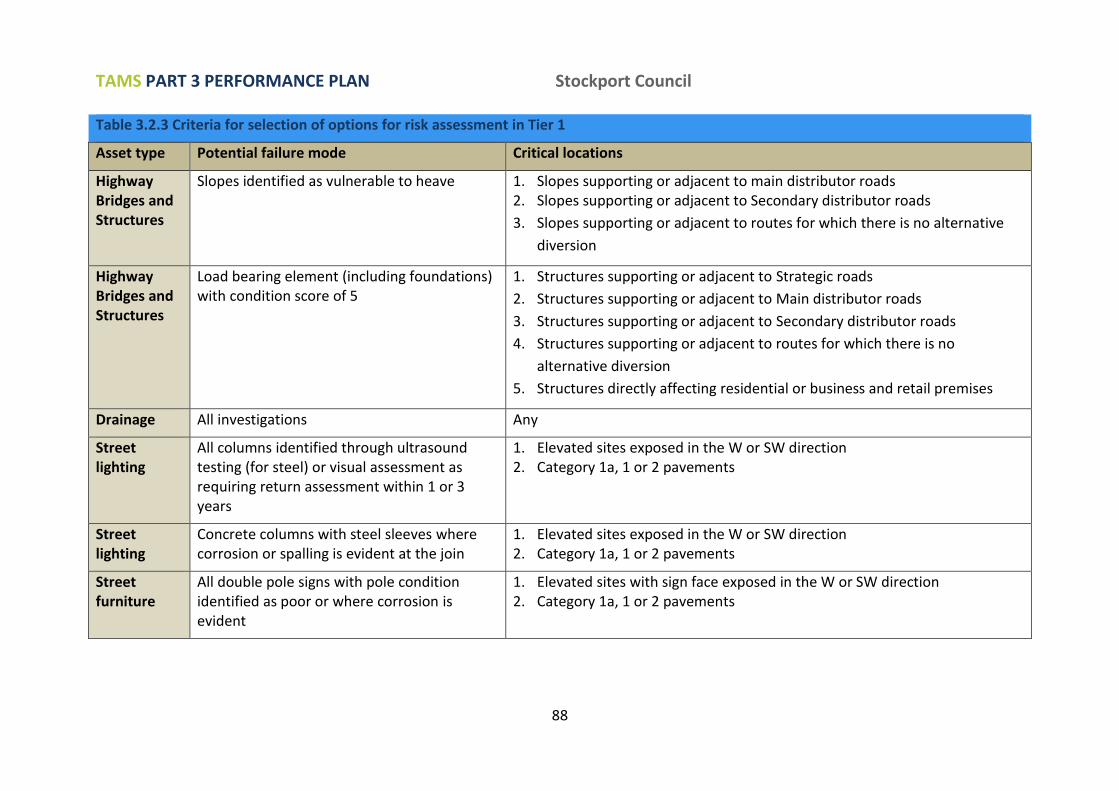
TAMS PART 3 PERFORMANCE PLAN Stockport Council
88
Table 3.2.3 Criteria for selection of options for risk assessment in Tier 1
Asset type Potential failure mode Critical locations
Highway Bridges and Structures
Slopes identified as vulnerable to heave 1. Slopes supporting or adjacent to main distributor roads 2. Slopes supporting or adjacent to Secondary distributor roads
3. Slopes supporting or adjacent to routes for which there is no alternative
diversion
Highway Bridges and Structures
Load bearing element (including foundations) with condition score of 5
1. Structures supporting or adjacent to Strategic roads
2. Structures supporting or adjacent to Main distributor roads
3. Structures supporting or adjacent to Secondary distributor roads
4. Structures supporting or adjacent to routes for which there is no
alternative diversion
5. Structures directly affecting residential or business and retail premises
Drainage All investigations Any
Street lighting
All columns identified through ultrasound testing (for steel) or visual assessment as requiring return assessment within 1 or 3 years
1. Elevated sites exposed in the W or SW direction 2. Category 1a, 1 or 2 pavements
Street lighting
Concrete columns with steel sleeves where corrosion or spalling is evident at the join
1. Elevated sites exposed in the W or SW direction 2. Category 1a, 1 or 2 pavements
Street furniture
All double pole signs with pole condition identified as poor or where corrosion is evident
1. Elevated sites with sign face exposed in the W or SW direction 2. Category 1a, 1 or 2 pavements
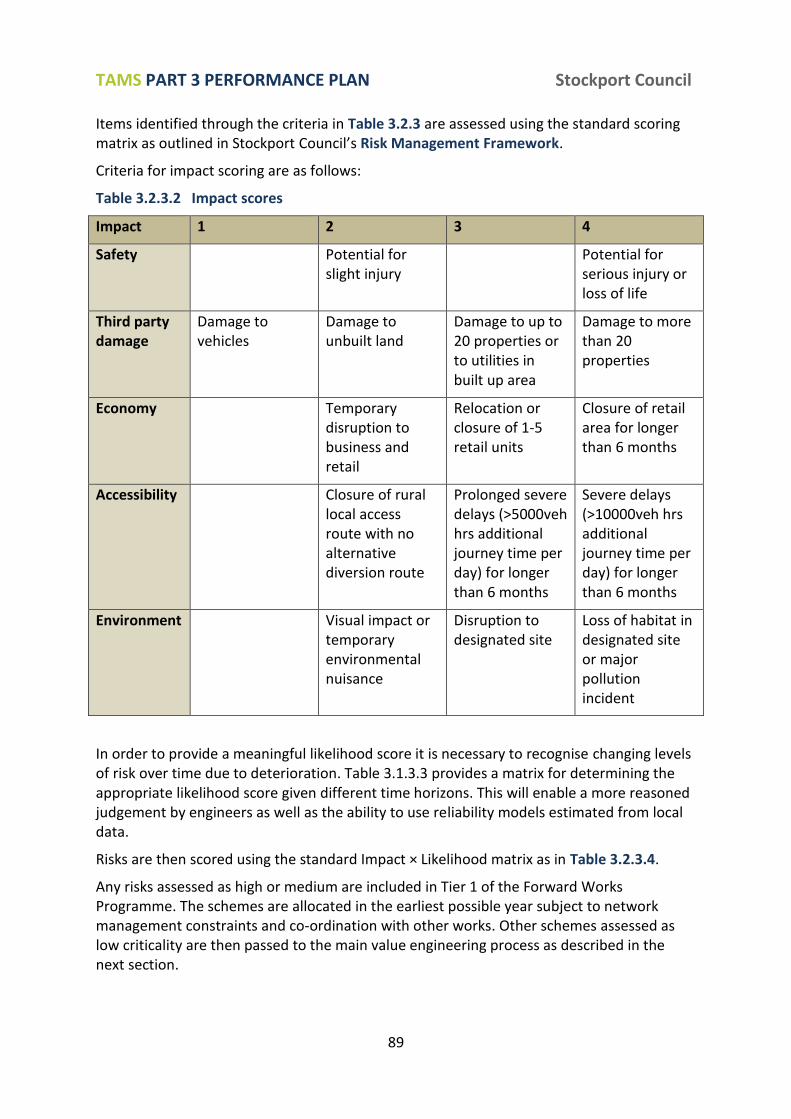
TAMS PART 3 PERFORMANCE PLAN Stockport Council
89
Items identified through the criteria in Table 3.2.3 are assessed using the standard scoring matrix as outlined in Stockport Council’s Risk Management Framework.
Criteria for impact scoring are as follows:
Table 3.2.3.2 Impact scores
Impact 1 2 3 4
Safety Potential for slight injury
Potential for serious injury or loss of life
Third party damage
Damage to vehicles
Damage to unbuilt land
Damage to up to 20 properties or to utilities in built up area
Damage to more than 20 properties
Economy Temporary disruption to business and retail
Relocation or closure of 1-5 retail units
Closure of retail area for longer than 6 months
Accessibility Closure of rural local access route with no alternative diversion route
Prolonged severe delays (>5000veh hrs additional journey time per day) for longer than 6 months
Severe delays (>10000veh hrs additional journey time per day) for longer than 6 months
Environment Visual impact or temporary environmental nuisance
Disruption to designated site
Loss of habitat in designated site or major pollution incident
In order to provide a meaningful likelihood score it is necessary to recognise changing levels of risk over time due to deterioration. Table 3.1.3.3 provides a matrix for determining the appropriate likelihood score given different time horizons. This will enable a more reasoned judgement by engineers as well as the ability to use reliability models estimated from local data.
Risks are then scored using the standard Impact × Likelihood matrix as in Table 3.2.3.4.
Any risks assessed as high or medium are included in Tier 1 of the Forward Works Programme. The schemes are allocated in the earliest possible year subject to network management constraints and co-ordination with other works. Other schemes assessed as low criticality are then passed to the main value engineering process as described in the next section.
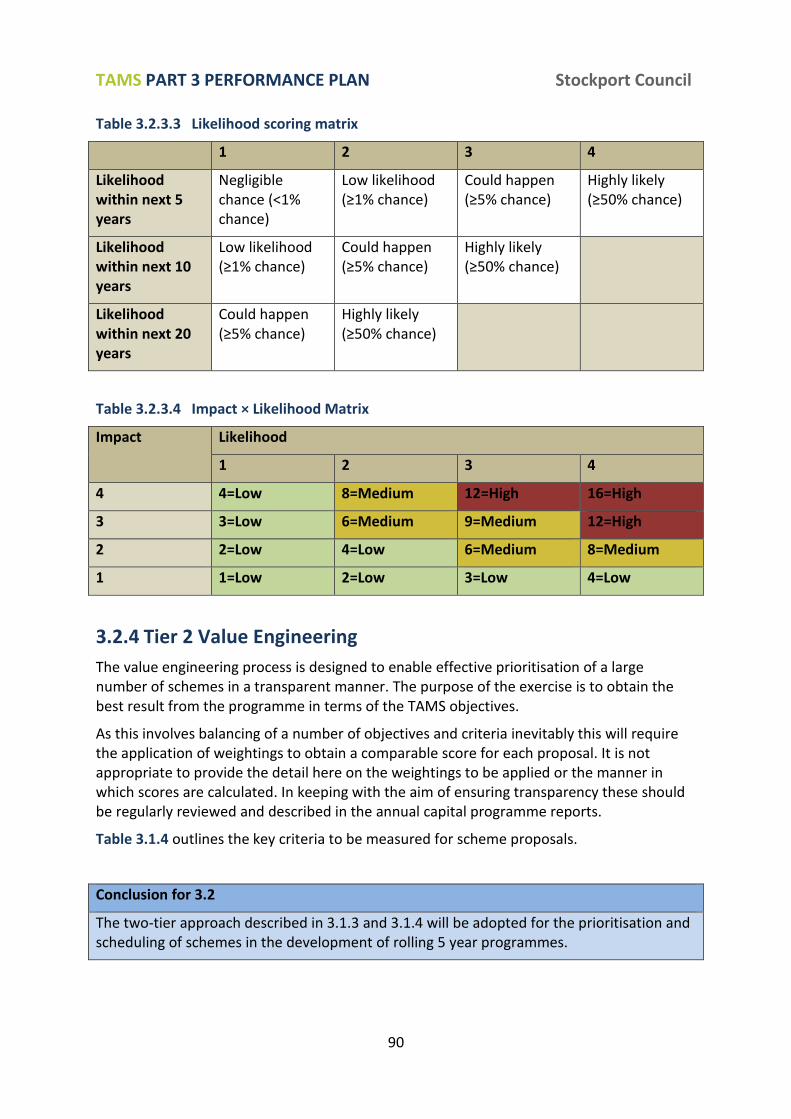
TAMS PART 3 PERFORMANCE PLAN Stockport Council
90
Table 3.2.3.3 Likelihood scoring matrix
1 2 3 4
Likelihood within next 5 years
Negligible chance (<1% chance)
Low likelihood (≥1% chance)
Could happen (≥5% chance)
Highly likely (≥50% chance)
Likelihood within next 10 years
Low likelihood (≥1% chance)
Could happen (≥5% chance)
Highly likely (≥50% chance)
Likelihood within next 20 years
Could happen (≥5% chance)
Highly likely (≥50% chance)
Table 3.2.3.4 Impact × Likelihood Matrix
Impact Likelihood
1 2 3 4
4 4=Low 8=Medium 12=High 16=High
3 3=Low 6=Medium 9=Medium 12=High
2 2=Low 4=Low 6=Medium 8=Medium
1 1=Low 2=Low 3=Low 4=Low
3.2.4 Tier 2 Value Engineering
The value engineering process is designed to enable effective prioritisation of a large number of schemes in a transparent manner. The purpose of the exercise is to obtain the best result from the programme in terms of the TAMS objectives.
As this involves balancing of a number of objectives and criteria inevitably this will require the application of weightings to obtain a comparable score for each proposal. It is not appropriate to provide the detail here on the weightings to be applied or the manner in which scores are calculated. In keeping with the aim of ensuring transparency these should be regularly reviewed and described in the annual capital programme reports.
Table 3.1.4 outlines the key criteria to be measured for scheme proposals.
Conclusion for 3.2
The two-tier approach described in 3.1.3 and 3.1.4 will be adopted for the prioritisation and scheduling of schemes in the development of rolling 5 year programmes.
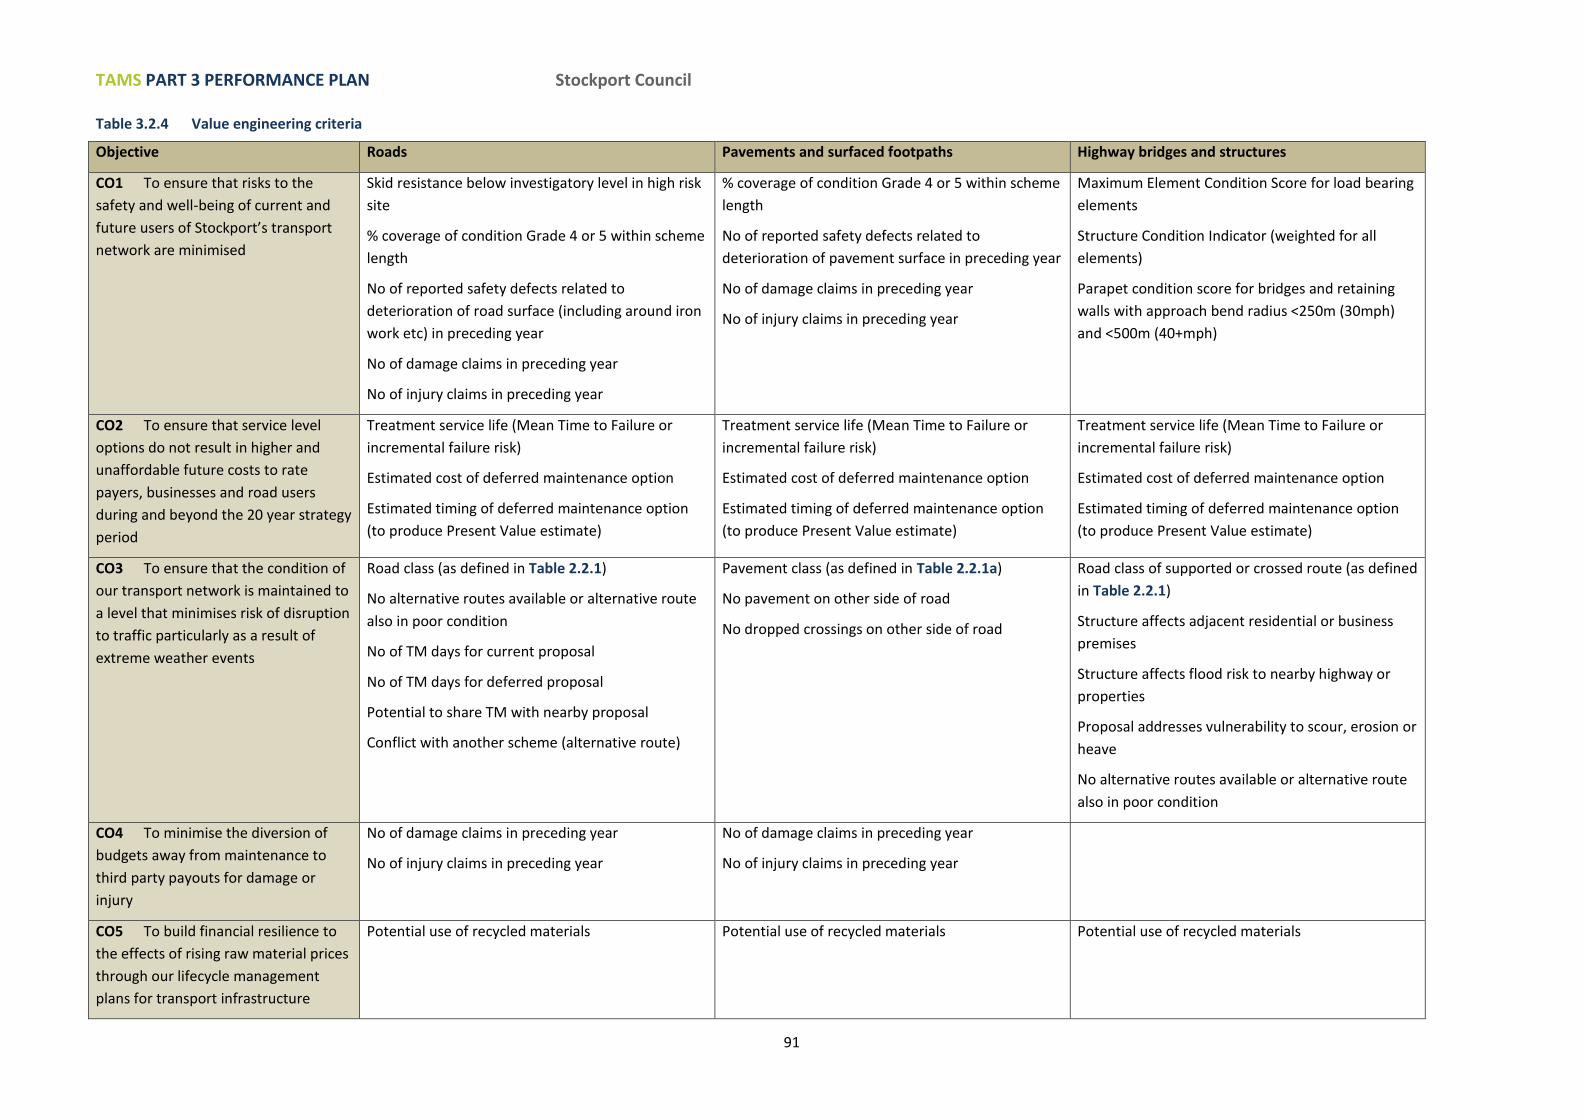
TAMS PART 3 PERFORMANCE PLAN Stockport Council
91
Table 3.2.4 Value engineering criteria
Objective Roads Pavements and surfaced footpaths Highway bridges and structures
CO1 To ensure that risks to the
safety and well-being of current and
future users of Stockport’s transport
network are minimised
Skid resistance below investigatory level in high risk
site
% coverage of condition Grade 4 or 5 within scheme
length
No of reported safety defects related to
deterioration of road surface (including around iron
work etc) in preceding year
No of damage claims in preceding year
No of injury claims in preceding year
% coverage of condition Grade 4 or 5 within scheme
length
No of reported safety defects related to
deterioration of pavement surface in preceding year
No of damage claims in preceding year
No of injury claims in preceding year
Maximum Element Condition Score for load bearing
elements
Structure Condition Indicator (weighted for all
elements)
Parapet condition score for bridges and retaining
walls with approach bend radius <250m (30mph)
and <500m (40+mph)
CO2 To ensure that service level
options do not result in higher and
unaffordable future costs to rate
payers, businesses and road users
during and beyond the 20 year strategy
period
Treatment service life (Mean Time to Failure or
incremental failure risk)
Estimated cost of deferred maintenance option
Estimated timing of deferred maintenance option
(to produce Present Value estimate)
Treatment service life (Mean Time to Failure or
incremental failure risk)
Estimated cost of deferred maintenance option
Estimated timing of deferred maintenance option
(to produce Present Value estimate)
Treatment service life (Mean Time to Failure or
incremental failure risk)
Estimated cost of deferred maintenance option
Estimated timing of deferred maintenance option
(to produce Present Value estimate)
CO3 To ensure that the condition of
our transport network is maintained to
a level that minimises risk of disruption
to traffic particularly as a result of
extreme weather events
Road class (as defined in Table 2.2.1)
No alternative routes available or alternative route
also in poor condition
No of TM days for current proposal
No of TM days for deferred proposal
Potential to share TM with nearby proposal
Conflict with another scheme (alternative route)
Pavement class (as defined in Table 2.2.1a)
No pavement on other side of road
No dropped crossings on other side of road
Road class of supported or crossed route (as defined
in Table 2.2.1)
Structure affects adjacent residential or business
premises
Structure affects flood risk to nearby highway or
properties
Proposal addresses vulnerability to scour, erosion or
heave
No alternative routes available or alternative route
also in poor condition
CO4 To minimise the diversion of
budgets away from maintenance to
third party payouts for damage or
injury
No of damage claims in preceding year
No of injury claims in preceding year
No of damage claims in preceding year
No of injury claims in preceding year
CO5 To build financial resilience to
the effects of rising raw material prices
through our lifecycle management
plans for transport infrastructure
Potential use of recycled materials Potential use of recycled materials Potential use of recycled materials
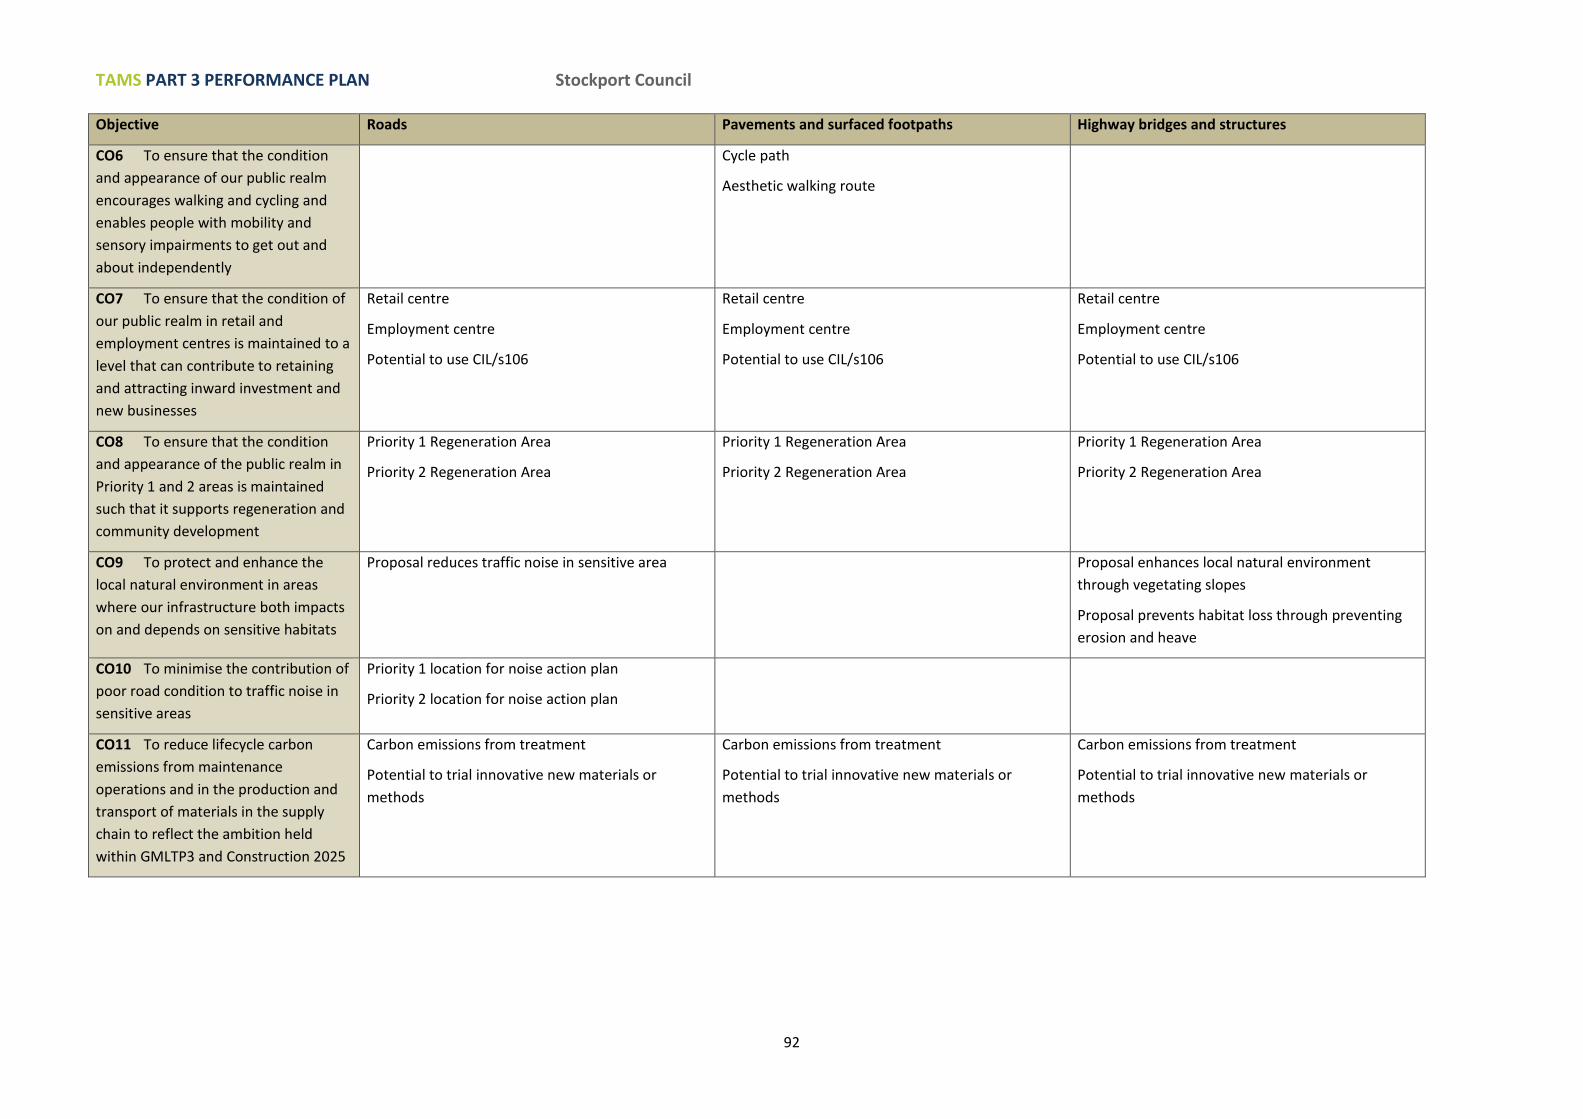
TAMS PART 3 PERFORMANCE PLAN Stockport Council
92
Objective Roads Pavements and surfaced footpaths Highway bridges and structures
CO6 To ensure that the condition
and appearance of our public realm
encourages walking and cycling and
enables people with mobility and
sensory impairments to get out and
about independently
Cycle path
Aesthetic walking route
CO7 To ensure that the condition of
our public realm in retail and
employment centres is maintained to a
level that can contribute to retaining
and attracting inward investment and
new businesses
Retail centre
Employment centre
Potential to use CIL/s106
Retail centre
Employment centre
Potential to use CIL/s106
Retail centre
Employment centre
Potential to use CIL/s106
CO8 To ensure that the condition
and appearance of the public realm in
Priority 1 and 2 areas is maintained
such that it supports regeneration and
community development
Priority 1 Regeneration Area
Priority 2 Regeneration Area
Priority 1 Regeneration Area
Priority 2 Regeneration Area
Priority 1 Regeneration Area
Priority 2 Regeneration Area
CO9 To protect and enhance the
local natural environment in areas
where our infrastructure both impacts
on and depends on sensitive habitats
Proposal reduces traffic noise in sensitive area Proposal enhances local natural environment
through vegetating slopes
Proposal prevents habitat loss through preventing
erosion and heave
CO10 To minimise the contribution of
poor road condition to traffic noise in
sensitive areas
Priority 1 location for noise action plan
Priority 2 location for noise action plan
CO11 To reduce lifecycle carbon
emissions from maintenance
operations and in the production and
transport of materials in the supply
chain to reflect the ambition held
within GMLTP3 and Construction 2025
Carbon emissions from treatment
Potential to trial innovative new materials or
methods
Carbon emissions from treatment
Potential to trial innovative new materials or
methods
Carbon emissions from treatment
Potential to trial innovative new materials or
methods
TAMS PART 3 PERFORMANCE PLAN Stockport Council
93
3.3 FINANCIAL REPORTING The Code of Practice on Transport Infrastructure Assets (CIPFA, 2013) requires Local Authorities to adopt an asset management approach to financial reporting from 2017 onwards. This involves a fully audited statement of the depreciated value of our transport assets ensuring that Local Authorities comply with the requirements of Government policy on Whole of Government Accounts, International Financial Reporting Standards (IFRS) and International Accounting Standard 16 (IAS16), which have been adopted in the UK as of 2010/11.
The Code is therefore one of the driving forces behind ongoing changes to our asset management systems including the need to improve the accuracy and reliability of data on physical condition, maintenance costs and risks to enable an accurate representation of the current value of our assets and associated financial liabilities (see Section 3.4 next).
There are specific requirements within the Code that require significantly different approaches to accounting from the current practice:
1. Valuation of assets needs to reflect the condition or level of performance of the asset. This is a requirement of HMT policy.
2. Consequently, in year changes in value must also reflect any improvements or deterioration in asset performance. This requires the same deterioration models as used in the forecasts for the Asset Investment Strategies. In line with IAS16, in year changes may be calculated through the subtraction of annual depreciation and addition of capital investment, or through periodic full revaluations.
3. As a requirement of IAS16, all assets must be identified as individual physical components in a database, and their value and in-year depreciation accounted for individually as per IFRS requirements. This requirement holds insofar as the attributes, performance and environment of the asset are unique and thus assets that are effectively identical should be identified as a single group.
Local Authorities are required to produce three indicators for the valuation:
1. Gross Replacement Cost (GRC) 2. Depreciated Replacement Cost (DRC) 3. Annualised Depreciation (AD) Definitions of these terms are given in the glossary in ANNEX 1. The calculation of AD is the most crucial aspect of this exercise. If capital expenditure does not at least equal the value of AD then the annual return will show a reduction in the value of the asset.
Conclusion for 3.3
The WGA returns will be subject to independent audit as part of the overall audit of the Council’s closing book accounts for 2016/17 onwards (June 2017). By implication this requires all systems for reporting to be in place for the calculation of 2015/16 closing book accounts (June 2016) as these must be restated for the following year. Additional resources (to be estimated) will be required to enable these systems to be implemented.
TAMS PART 3 PERFORMANCE PLAN Stockport Council
94
3.4 ASSET INFORMATION MANAGEMENT
3.4.1 The purpose of Asset Information Management The delivery and review of the TAMS and associated performance management processes will require reliable and accurate spatial data on asset performance, risks and event histories. In particular, asset data should be captured and held in formats that enable the management of the long term performance of transport assets.
3.4.2 Requirements for Asset Information Management Most of the information that is required for strategic asset management planning should also be relevant for effective operational management. However, strategic asset management planning requires that data from numerous operational processes are readily available through a central data hub and can be queried at a network level or for different asset types.
The 2014 publication of the Publicly Available Standard (PAS) 1192-3:2014 provides a framework for development of an Asset Information Model to support the delivery of the TAMS. This ensures that all asset information is held in formats that enable transfer, storage and querying. The standard requires that business information requirements are clearly identified and translated into asset information requirements. The asset information requirements should then direct the development of an Asset Information Model.
Importantly, the development of an Asset Information Model will enable Stockport Council and its partners to meet requirements for Building Information Modelling (BIM) which will be mandated for all public sector construction projects from 2016. These requirements relate to the transfer of data on new infrastructure by contractors or partners. However, by implication it also requires that Stockport Council as client has an established Asset Information Model that will direct the specification of the information to be provided on new infrastructure.
With growing pressures on Council staff resources the Asset Information Model must enable effective communication of information without dependence on individual system super-users and prevent limited time and resources being wasted in locating critical asset information. Through the Local Information System project, Stockport Council has already developed a firm basis of ICT infrastructure to enable work to progress towards these ends. However, an Asset Information Management Plan will be required to direct the development of an Asset Information Model to support the business needs of the TAMS.
The highway network is of significant interest to the public and the media particularly during challenging weather conditions and resulting damage to the highway network which often provide the focus for significant national and local media coverage. Due to the trend towards transparency in the public sector we are developing a GIS based Local Information System and focusing on providing clarity and transparency in how we make decisions in the identification, assessment, programming and delivery of asset management activities, including maintenance works, and how the public are/will be involved in making decisions for the service provided by the network.
Conclusion for 3.4
An Asset Information Management Plan will be developed that provides detail on the

TAMS PART 3 PERFORMANCE PLAN Stockport Council
95
Information Requirements for business processes associated with the delivery of the TAMS.
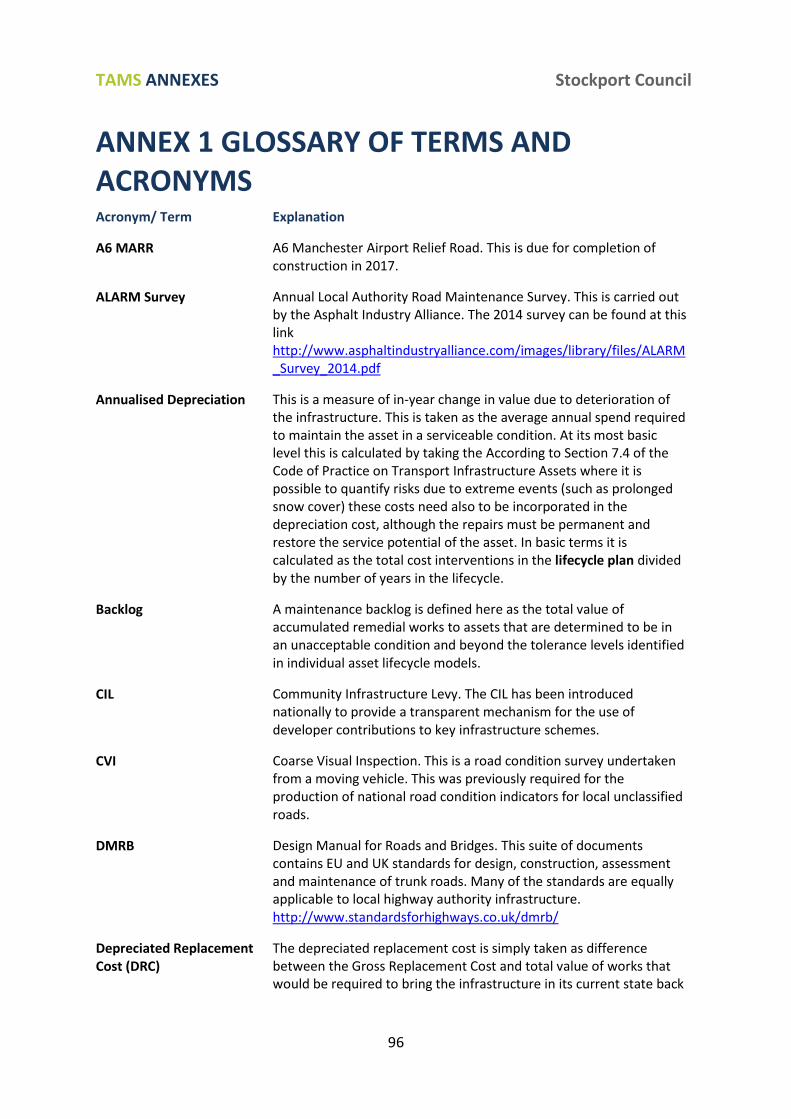
TAMS ANNEXES Stockport Council
96
ANNEX 1 GLOSSARY OF TERMS AND ACRONYMS Acronym/ Term Explanation
A6 MARR A6 Manchester Airport Relief Road. This is due for completion of construction in 2017.
ALARM Survey Annual Local Authority Road Maintenance Survey. This is carried out by the Asphalt Industry Alliance. The 2014 survey can be found at this link http://www.asphaltindustryalliance.com/images/library/files/ALARM_Survey_2014.pdf
Annualised Depreciation This is a measure of in-year change in value due to deterioration of the infrastructure. This is taken as the average annual spend required to maintain the asset in a serviceable condition. At its most basic level this is calculated by taking the According to Section 7.4 of the Code of Practice on Transport Infrastructure Assets where it is possible to quantify risks due to extreme events (such as prolonged snow cover) these costs need also to be incorporated in the depreciation cost, although the repairs must be permanent and restore the service potential of the asset. In basic terms it is calculated as the total cost interventions in the lifecycle plan divided by the number of years in the lifecycle.
Backlog A maintenance backlog is defined here as the total value of accumulated remedial works to assets that are determined to be in an unacceptable condition and beyond the tolerance levels identified in individual asset lifecycle models.
CIL Community Infrastructure Levy. The CIL has been introduced nationally to provide a transparent mechanism for the use of developer contributions to key infrastructure schemes.
CVI Coarse Visual Inspection. This is a road condition survey undertaken from a moving vehicle. This was previously required for the production of national road condition indicators for local unclassified roads.
DMRB Design Manual for Roads and Bridges. This suite of documents contains EU and UK standards for design, construction, assessment and maintenance of trunk roads. Many of the standards are equally applicable to local highway authority infrastructure. http://www.standardsforhighways.co.uk/dmrb/
Depreciated Replacement Cost (DRC)
The depreciated replacement cost is simply taken as difference between the Gross Replacement Cost and total value of works that would be required to bring the infrastructure in its current state back
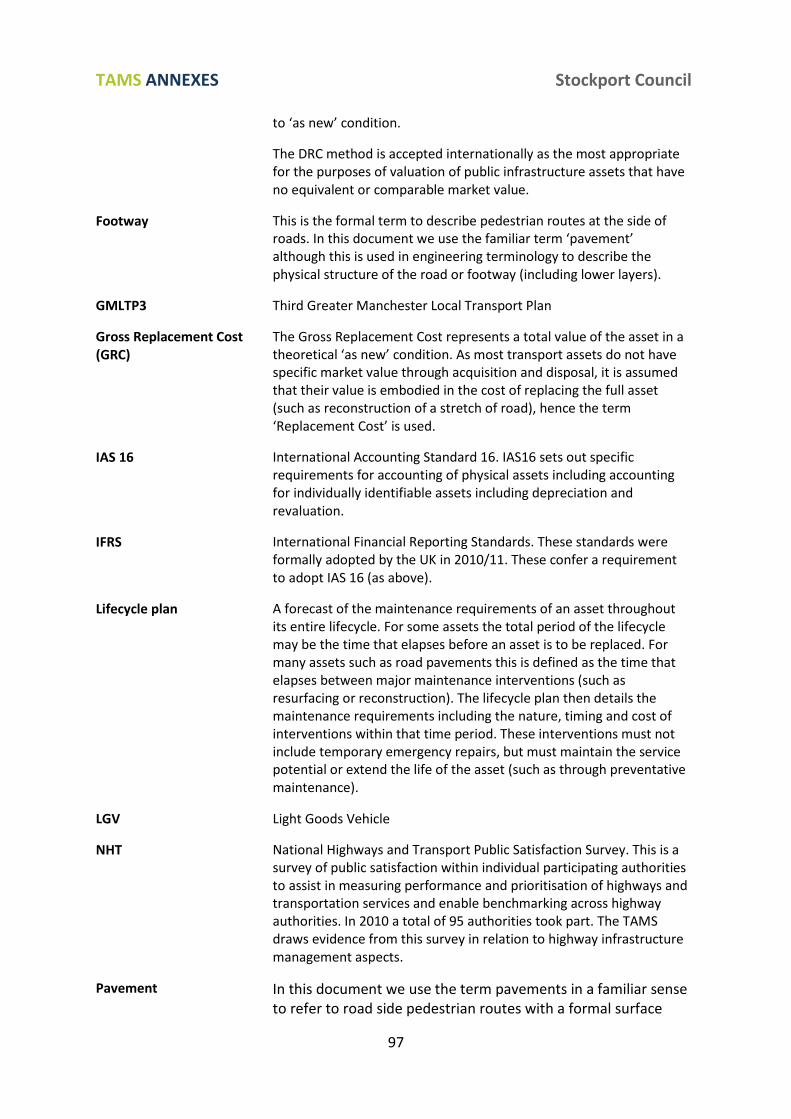
TAMS ANNEXES Stockport Council
97
to ‘as new’ condition.
The DRC method is accepted internationally as the most appropriate for the purposes of valuation of public infrastructure assets that have no equivalent or comparable market value.
Footway This is the formal term to describe pedestrian routes at the side of roads. In this document we use the familiar term ‘pavement’ although this is used in engineering terminology to describe the physical structure of the road or footway (including lower layers).
GMLTP3 Third Greater Manchester Local Transport Plan
Gross Replacement Cost (GRC)
The Gross Replacement Cost represents a total value of the asset in a theoretical ‘as new’ condition. As most transport assets do not have specific market value through acquisition and disposal, it is assumed that their value is embodied in the cost of replacing the full asset (such as reconstruction of a stretch of road), hence the term ‘Replacement Cost’ is used.
IAS 16 International Accounting Standard 16. IAS16 sets out specific requirements for accounting of physical assets including accounting for individually identifiable assets including depreciation and revaluation.
IFRS International Financial Reporting Standards. These standards were formally adopted by the UK in 2010/11. These confer a requirement to adopt IAS 16 (as above).
Lifecycle plan A forecast of the maintenance requirements of an asset throughout its entire lifecycle. For some assets the total period of the lifecycle may be the time that elapses before an asset is to be replaced. For many assets such as road pavements this is defined as the time that elapses between major maintenance interventions (such as resurfacing or reconstruction). The lifecycle plan then details the maintenance requirements including the nature, timing and cost of interventions within that time period. These interventions must not include temporary emergency repairs, but must maintain the service potential or extend the life of the asset (such as through preventative maintenance).
LGV Light Goods Vehicle
NHT National Highways and Transport Public Satisfaction Survey. This is a survey of public satisfaction within individual participating authorities to assist in measuring performance and prioritisation of highways and transportation services and enable benchmarking across highway authorities. In 2010 a total of 95 authorities took part. The TAMS draws evidence from this survey in relation to highway infrastructure management aspects.
Pavement In this document we use the term pavements in a familiar sense to refer to road side pedestrian routes with a formal surface
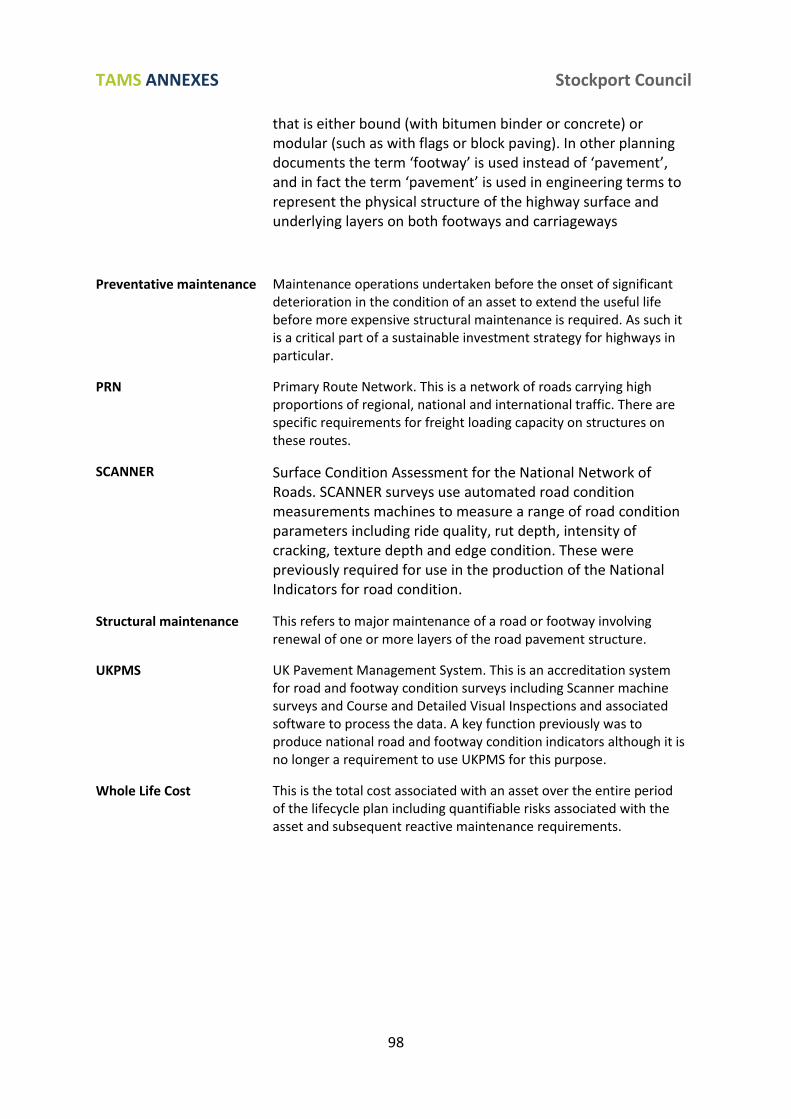
TAMS ANNEXES Stockport Council
98
that is either bound (with bitumen binder or concrete) or modular (such as with flags or block paving). In other planning documents the term ‘footway’ is used instead of ‘pavement’, and in fact the term ‘pavement’ is used in engineering terms to represent the physical structure of the highway surface and underlying layers on both footways and carriageways
Preventative maintenance Maintenance operations undertaken before the onset of significant deterioration in the condition of an asset to extend the useful life before more expensive structural maintenance is required. As such it is a critical part of a sustainable investment strategy for highways in particular.
PRN Primary Route Network. This is a network of roads carrying high proportions of regional, national and international traffic. There are specific requirements for freight loading capacity on structures on these routes.
SCANNER Surface Condition Assessment for the National Network of Roads. SCANNER surveys use automated road condition measurements machines to measure a range of road condition parameters including ride quality, rut depth, intensity of cracking, texture depth and edge condition. These were previously required for use in the production of the National Indicators for road condition.
Structural maintenance This refers to major maintenance of a road or footway involving renewal of one or more layers of the road pavement structure.
UKPMS UK Pavement Management System. This is an accreditation system for road and footway condition surveys including Scanner machine surveys and Course and Detailed Visual Inspections and associated software to process the data. A key function previously was to produce national road and footway condition indicators although it is no longer a requirement to use UKPMS for this purpose.
Whole Life Cost This is the total cost associated with an asset over the entire period of the lifecycle plan including quantifiable risks associated with the asset and subsequent reactive maintenance requirements.
TAMS ANNEXES Stockport Council
99
ANNEX 2 REFERENCES Standards (1). Institute of Asset Management IAM (2008) Publicly Available Specification (PAS) 55-
1:2008 Specification for the optimized management of physical assets (2). BSI (2014) BS ISO55000:2014 Asset Management (3). BSI (2013) PAS 1192-2:2013 Specification for information management for the
capital/delivery phase of construction projects using building information modelling (4). BSI (2014) PAS 1192-3:2014 Specification for information management for the
operational phase of assets using building information modelling Codes of Practice
(5). Well-Maintained Highways (2005, updated 2013): A Code of Practice for Highways Maintenance Management (updated 2013)
(6). Management of Highway Structures (2005, updated 2013: A Code of Practice for Highway Bridges and Structures (updated 2013)
(7). Well-lit Highways (2004, updated 2013) A Code of Practice for Highways Lighting Management
(8). CIPFA (2013) Code of Practice on Transport Infrastructure Assets
National Policy and Strategy (9). Highway Maintenance Efficiency Programme (HMEP, 2013) Annual Plan
http://www.highwaysefficiency.org.uk/about-us/hmeps-vision-and-annual-plan.html (10). Department for Business, Innovation and Skills (2013) Construction 2025
https://www.gov.uk/government/uploads/system/uploads/attachment_data/file/210099/bis-13-955-construction-2025-industrial-strategy.pdf
Greater Manchester Strategy (11). AGMA (2014) Greater Manchester Growth and Reform Plan
http://www.agma.gov.uk/gmca/gm-growth-reform-plan/index.html (12). Greater Manchester Local Transport Plan (Third Edition)
http://www.tfgm.com/ltp3/Pages/Local-Transport-Plan.aspx
Stockport Strategies (13). The Stockport Partnership (2009) The Stockport Strategy 2020
http://www.stockportpartnership.org.uk/521360/671117/stockport2020strategy
Stockport Council Operational Policies and Plans (14). Footways Policy (15). Highways Inspection and Repair Policy and Plan
http://www.stockport.gov.uk/2013/3006/53395/inspectionandrepairspolicy
TAMS ANNEXES Stockport Council
100
(16). Winter Maintenance Operational Plan http://www.stockport.gov.uk/2013/3006/53395/239061/operationalplan
Other guidance documents (17). CSS Bridges Group (2007) Guidance Document for Performance Measurement of
Highway Structures Part B1: Condition Performance Indicator
Bibliography and citations (18). Cavan G. (2010). Climate Change Projections for Greater Manchester. EcoCities
project, University of Manchester. (19). Bank of England (2014) Inflation Report May 2014
http://www.bankofengland.co.uk/publications/Pages/inflationreport/irprobab.aspx (20). Gardiner & Theobold (Q2 2014) Tender Price Indicator
http://www.gardiner.com/assets/files/files/06e05956fabda14ee8b463fbdbb0a9fdca6a6bf8/TPI_Q2%202014.pdf and
(21). Sweett Group (Q1 2014) Tender Price Update http://www.sweettgroup.com/wp-content/uploads/2014/07/Tender-Price-Forecast-Q2-2014.pdf
(22). Global Construction Perspectives and Oxford Economics (2013) Global Construction 2025

TAMS ANNEXES Stockport Council
101
ANNEX 3 SUMMARY OF STOCKPORT’S TRANSPORT ASSETS Asset type Gross
Value (£M)
Depreciation Rate (£M per Annum)
Net Value (£M)
Asset sub-category No. Length (km)
Surface area (m2)
Roads £1,106.0 £3.9 £1,023.1 Principal (A) Roads 102.45 952,167
B Roads 37.18 327,489
Other classified (C) Roads 38.86 312,641
Unclassified 765.90 4,853,653
Total 944.39 6,445,951
Pavements and footpaths £241.0 £1.4 £214.6 1a (Prestige) footways 10.14 28,730
1 (Other town and district centre) footways
28.79 81,377
2 (High usage urban) footways
196.70 529,067
3 – Important links to local facilities
300.08 666,216
4 – Other residential footways and footpaths
965.89 2,097,624
Total 1,501.59 3,403,015
Public Rights of Way Footpaths 249
Bridleways 163
Byways 25
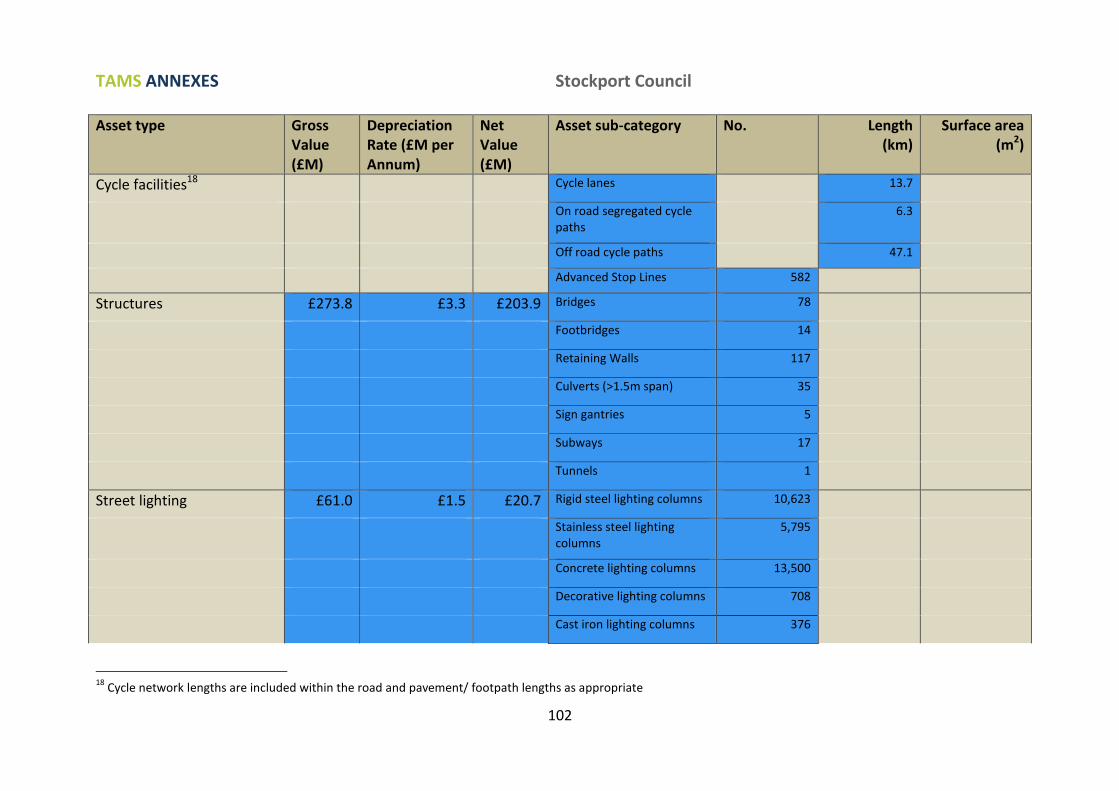
TAMS ANNEXES Stockport Council
102
Asset type Gross Value (£M)
Depreciation Rate (£M per Annum)
Net Value (£M)
Asset sub-category No. Length (km)
Surface area (m2)
Cycle facilities18 Cycle lanes 13.7
On road segregated cycle paths
6.3
Off road cycle paths 47.1
Advanced Stop Lines 582
Structures £273.8 £3.3 £203.9 Bridges 78
Footbridges 14
Retaining Walls 117
Culverts (>1.5m span) 35
Sign gantries 5
Subways 17
Tunnels 1
Street lighting £61.0 £1.5 £20.7 Rigid steel lighting columns 10,623
Stainless steel lighting columns
5,795
Concrete lighting columns 13,500
Decorative lighting columns 708
Cast iron lighting columns 376
18
Cycle network lengths are included within the road and pavement/ footpath lengths as appropriate
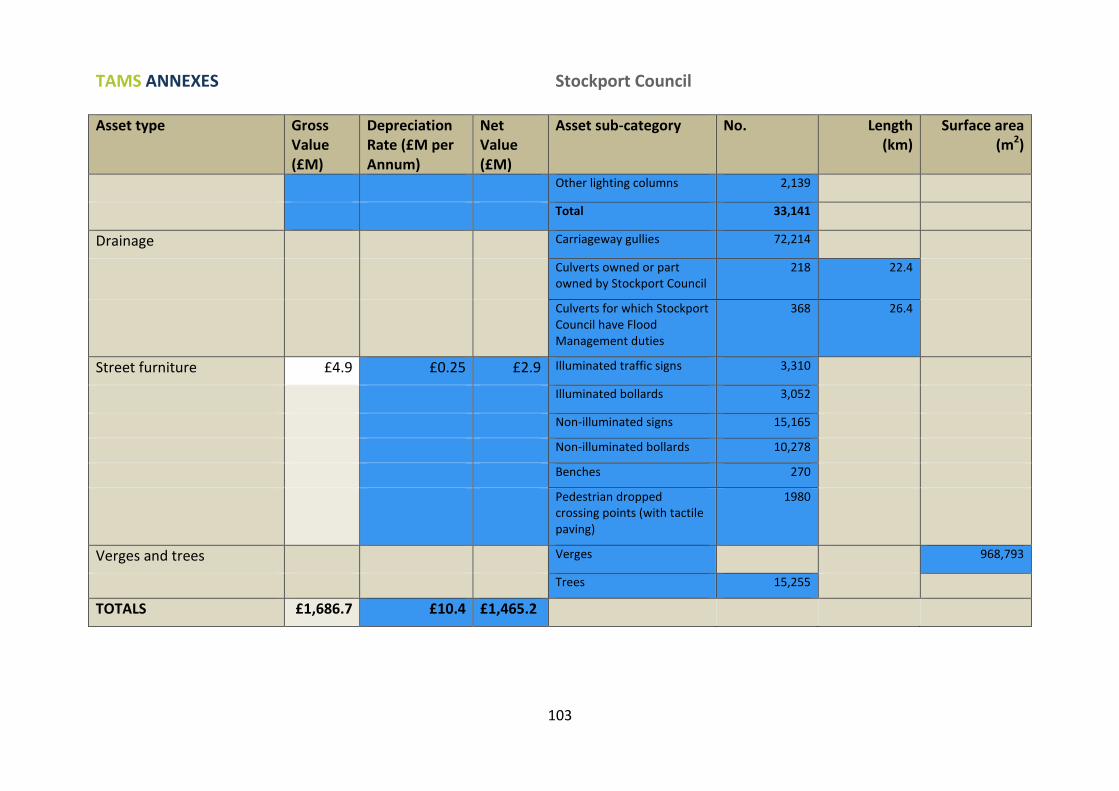
TAMS ANNEXES Stockport Council
103
Asset type Gross Value (£M)
Depreciation Rate (£M per Annum)
Net Value (£M)
Asset sub-category No. Length (km)
Surface area (m2)
Other lighting columns 2,139
Total 33,141
Drainage Carriageway gullies 72,214
Culverts owned or part owned by Stockport Council
218 22.4
Culverts for which Stockport Council have Flood Management duties
368 26.4
Street furniture £4.9 £0.25 £2.9 Illuminated traffic signs 3,310
Illuminated bollards 3,052
Non-illuminated signs 15,165
Non-illuminated bollards 10,278
Benches 270
Pedestrian dropped crossing points (with tactile paving)
1980
Verges and trees Verges 968,793
Trees 15,255
TOTALS £1,686.7 £10.4 £1,465.2
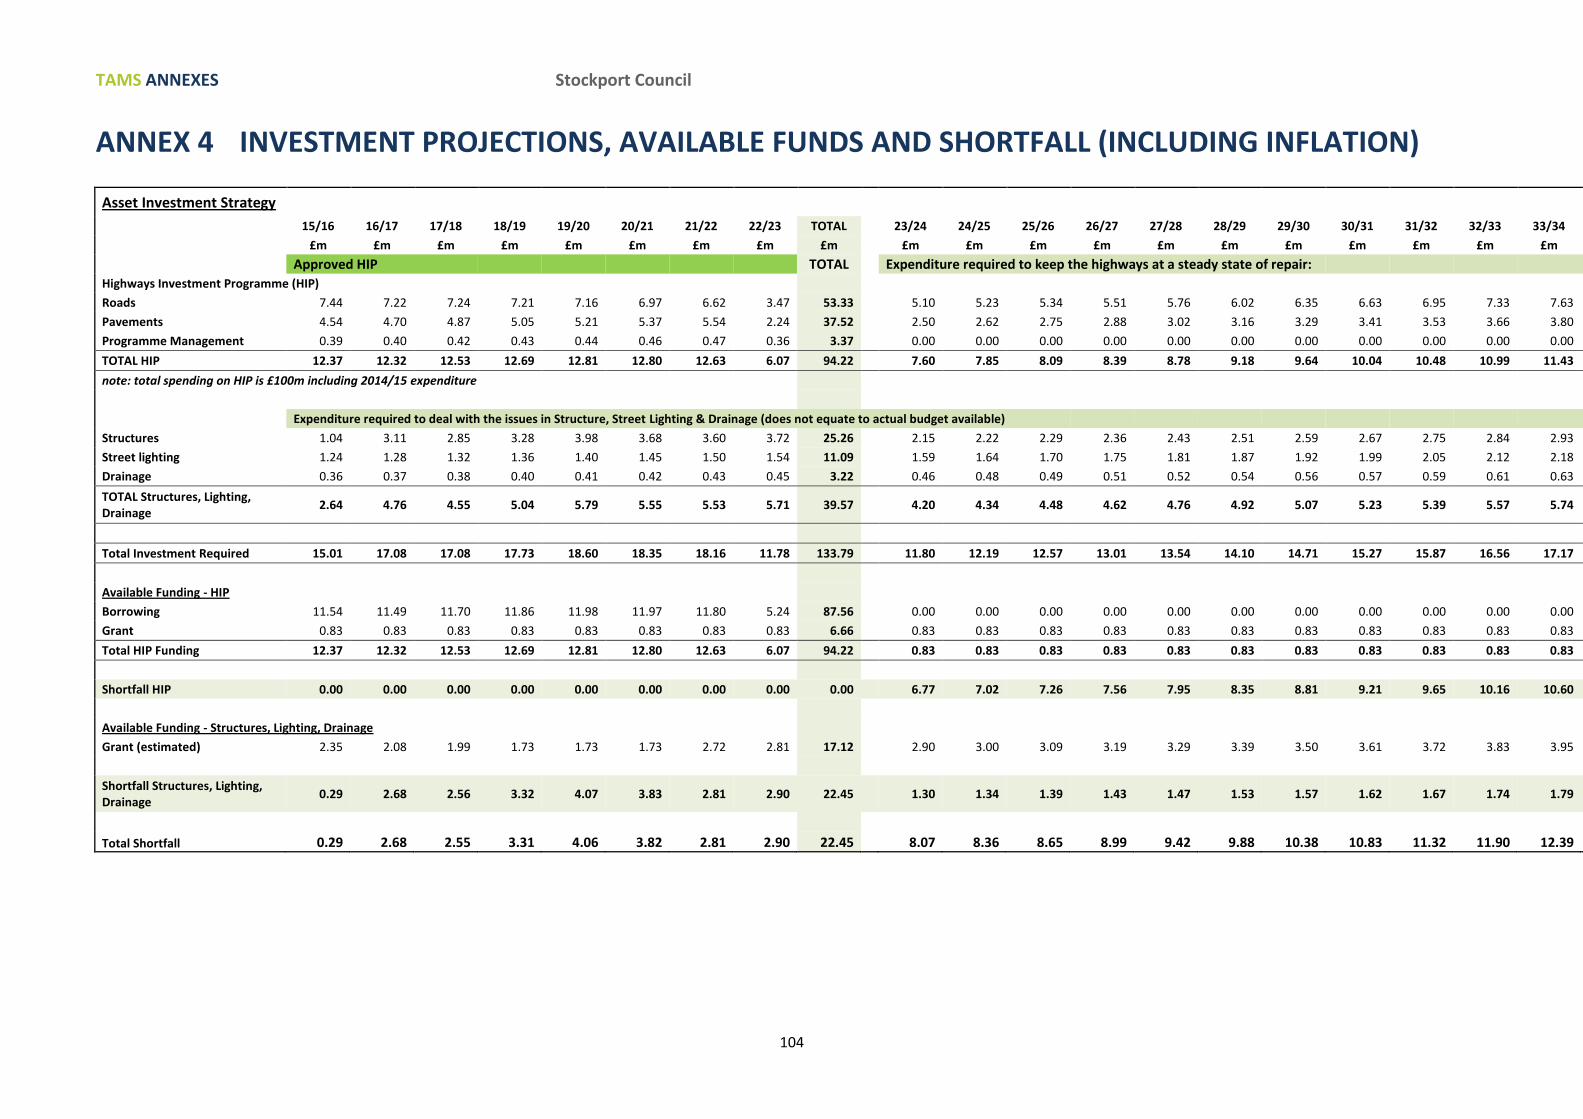
TAMS ANNEXES Stockport Council
104
ANNEX 4 INVESTMENT PROJECTIONS, AVAILABLE FUNDS AND SHORTFALL (INCLUDING INFLATION) Asset Investment Strategy
15/16 16/17 17/18 18/19 19/20 20/21 21/22 22/23 TOTAL
23/24 24/25 25/26 26/27 27/28 28/29 29/30 30/31 31/32 32/33 33/34 34/35
£m £m £m £m £m £m £m £m £m
£m £m £m £m £m £m £m £m £m £m £m £m
Approved HIP TOTAL
Expenditure required to keep the highways at a steady state of repair:
Highways Investment Programme (HIP)
Roads 7.44 7.22 7.24 7.21 7.16 6.97 6.62 3.47 53.33
5.10 5.23 5.34 5.51 5.76 6.02 6.35 6.63 6.95 7.33 7.63 7.91
Pavements 4.54 4.70 4.87 5.05 5.21 5.37 5.54 2.24 37.52
2.50 2.62 2.75 2.88 3.02 3.16 3.29 3.41 3.53 3.66 3.80 3.95
Programme Management 0.39 0.40 0.42 0.43 0.44 0.46 0.47 0.36 3.37
0.00 0.00 0.00 0.00 0.00 0.00 0.00 0.00 0.00 0.00 0.00 0.00
TOTAL HIP 12.37 12.32 12.53 12.69 12.81 12.80 12.63 6.07 94.22 7.60 7.85 8.09 8.39 8.78 9.18 9.64 10.04 10.48 10.99 11.43 11.86
note: total spending on HIP is £100m including 2014/15 expenditure
Expenditure required to deal with the issues in Structure, Street Lighting & Drainage (does not equate to actual budget available)
Structures 1.04 3.11 2.85 3.28 3.98 3.68 3.60 3.72 25.26
2.15 2.22 2.29 2.36 2.43 2.51 2.59 2.67 2.75 2.84 2.93 3.02
Street lighting 1.24 1.28 1.32 1.36 1.40 1.45 1.50 1.54 11.09
1.59 1.64 1.70 1.75 1.81 1.87 1.92 1.99 2.05 2.12 2.18 2.25
Drainage 0.36 0.37 0.38 0.40 0.41 0.42 0.43 0.45 3.22
0.46 0.48 0.49 0.51 0.52 0.54 0.56 0.57 0.59 0.61 0.63 0.65
TOTAL Structures, Lighting, Drainage
2.64 4.76 4.55 5.04 5.79 5.55 5.53 5.71 39.57 4.20 4.34 4.48 4.62 4.76 4.92 5.07 5.23 5.39 5.57 5.74 5.92
Total Investment Required 15.01 17.08 17.08 17.73 18.60 18.35 18.16 11.78 133.79 11.80 12.19 12.57 13.01 13.54 14.10 14.71 15.27 15.87 16.56 17.17 17.78
Available Funding - HIP
Borrowing 11.54 11.49 11.70 11.86 11.98 11.97 11.80 5.24 87.56
0.00 0.00 0.00 0.00 0.00 0.00 0.00 0.00 0.00 0.00 0.00 0.00
Grant 0.83 0.83 0.83 0.83 0.83 0.83 0.83 0.83 6.66
0.83 0.83 0.83 0.83 0.83 0.83 0.83 0.83 0.83 0.83 0.83 0.83
Total HIP Funding 12.37 12.32 12.53 12.69 12.81 12.80 12.63 6.07 94.22 0.83 0.83 0.83 0.83 0.83 0.83 0.83 0.83 0.83 0.83 0.83 0.83
Shortfall HIP 0.00 0.00 0.00 0.00 0.00 0.00 0.00 0.00 0.00 6.77 7.02 7.26 7.56 7.95 8.35 8.81 9.21 9.65 10.16 10.60 11.03
Available Funding - Structures, Lighting, Drainage
Grant (estimated) 2.35 2.08 1.99 1.73 1.73 1.73 2.72 2.81 17.12
2.90 3.00 3.09 3.19 3.29 3.39 3.50 3.61 3.72 3.83 3.95 4.07
Shortfall Structures, Lighting, Drainage
0.29 2.68 2.56 3.32 4.07 3.83 2.81 2.90 22.45 1.30 1.34 1.39 1.43 1.47 1.53 1.57 1.62 1.67 1.74 1.79 1.85
Total Shortfall 0.29 2.68 2.55 3.31 4.06 3.82 2.81 2.90 22.45 8.07 8.36 8.65 8.99 9.42 9.88 10.38 10.83 11.32 11.90 12.39 12.88

TAMS ANNEXES Stockport Council
105


