64
Transport ASSET MANAGEMENT PLAN 2020

City of Unley 1
Transport ASSET MANAGEMENT PLAN 2020

1 Executive Summary 6
2 Introduction 8
2.1 Background 8
2.2 Goals and Objectives of Asset Ownership 12
2.3 Plan Framework 14
2.4 Core and Advanced Asset Management 17
3 Levels of Service 18
3.1 Customer Research and Expectation 18
3.2 Legislative Requirements 19
3.3 Current Level of Service 20
4 Future Demand 24
5 Lifecycle Management 29
5.1 Background 29
5.1.1 Physical Parameters 34
5.1.2 Asset Condition 34
5.1.3 Useful Life 37
5.1.4 Asset Valuation 38
5.1.5 Historical Expenditure 39
5.2 Operations and Maintenance Plan 40
5.2.1 Operations and Maintenance Strategies 40
5.2.2 Summary of Future Costs 42
5.3 Renewal Plan (Capital) 43
5.3.1 Renewal Identification 43
Contents

5.3.2 Renewal Strategies 43
5.3.3 Summary of Future Costs 44
5.4 Creation � Acquisition Plan (New Capital) 48
5.4.1 Capital Investment Strategies 48
5.4.2 Summary of Future Costs 49
5.5 Decommission Plan 50
6 Risk Management 52
6.1 Critical Assets 52
6.2 Risk Assessment 53
7 Financial Summary 56
7.1 Valuation forecast 56
7.2 Expenditure forecast 56
7.3 Asset Renewal Funding Ratio 57
7.4 Funding Strategy 57
7.5 Key Assumptions 58
7.6 Forecast Reliability and Confidence 59
8 Improvement and Monitoring 60
8.1 Status of Asset Management Practices 60
8.1.1 Accounting and Financial Systems 60
8.1.2 Asset Management System 60
8.2 Improvement Programs 62
8.3 Monitoring and Review Procedure 63
8.4 Performance Measures 63

Transport Assets Summary
KERBING
Replacement cost: $28,047,504
Condition: 91%
BUS STOPS
Replacement cost: $390,762
Condition: 97%
CAR PARKS
Replacement cost: $3,214,725
Condition: 100%
PATHWAY
Replacement cost: $57,447,644
Condition: 99%
BRIDGES
Replacement cost: $9,617,655
Condition: 74%

ROAD
Replacement cost: $161,325,020
Condition: 92%
TRAFFIC CONTROL
Replacement cost: $5,700,088
Condition: 97%
STREET LIGHTING
Replacement cost: $3,085,184
Condition: 99%
TotalReplacement cost: $268,828,582Condition: 93%Condition percentage represents assets in fair to very good condition.
Transport Asset Management Plan6
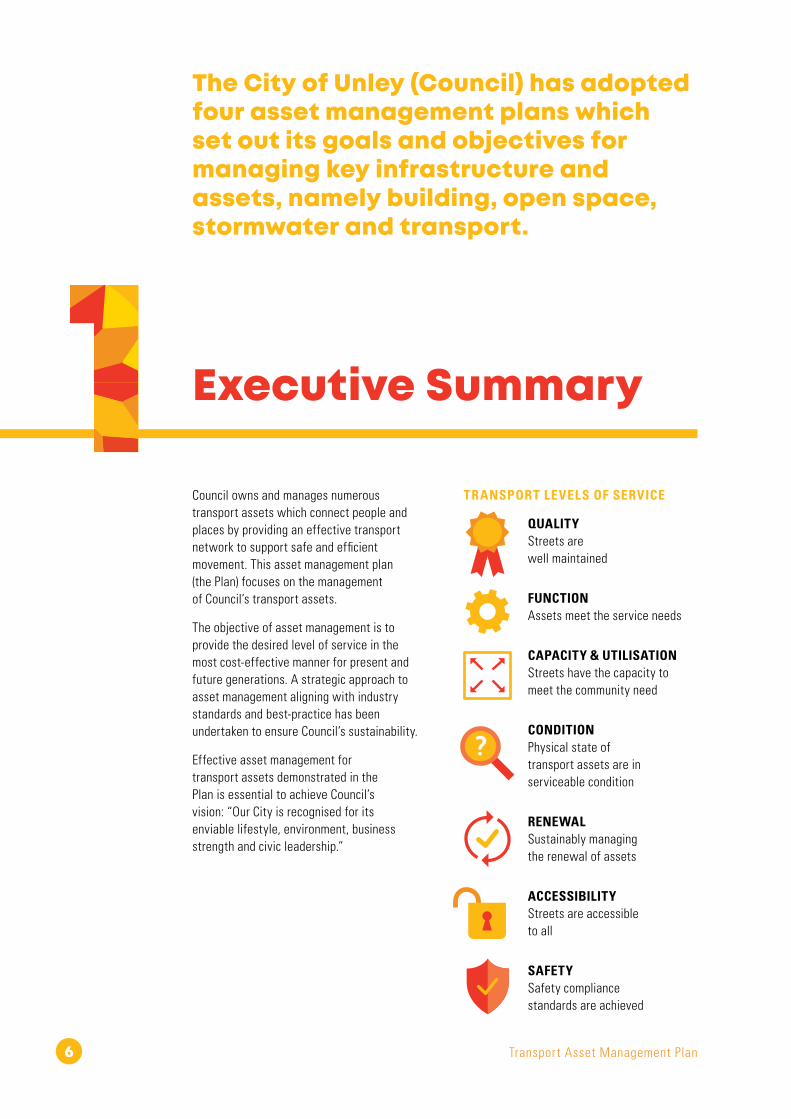
Executive Summary
Council owns and manages numerous transport assets which connect people and places by providing an effective transport network to support safe and efficient movement. This asset management plan (the Plan) focuses on the management of Council’s transport assets.
The objective of asset management is to provide the desired level of service in the most cost-effective manner for present and future generations. A strategic approach to asset management aligning with industry standards and best-practice has been undertaken to ensure Council’s sustainability.
Effective asset management for transport assets demonstrated in the Plan is essential to achieve Council’s vision: “Our City is recognised for its enviable lifestyle, environment, business strength and civic leadership.”
The City of Unley (Council) has adopted four asset management plans which set out its goals and objectives for managing key infrastructure and assets, namely building, open space, stormwater and transport.
TRANSPORT LEVELS OF SERVICE
QUALITY Streets are well maintained
FUNCTION Assets meet the service needs
CAPACITY & UTILISATION Streets have the capacity to meet the community need
CONDITION Physical state of transport assets are in serviceable condition
RENEWAL Sustainably managing the renewal of assets
ACCESSIBILITY Streets are accessible to all
SAFETY Safety compliance standards are achieved

City of Unley 7
FUTURE DEMANDS
POPULATION & DEMOGRAPHICS Population is forecast to increase 13% by 2040 Over the last five years 30% of residents are new to Council
CLIMATE CHANGE Awareness of the Council’s role in climate sustainability Increasing trend of severe weather events
TECHNOLOGY Global trends towards smart cities
CONDITION
93% transport asset condition satisfaction
FINANCIAL SUMMARY
TRANSPORT TEN YEAR FORECAST EXPENDITURE
The forecast contained within the Plan will be reviewed annually with an update completed every four years.
Council is committed to continuously improving the quality and maturity of its asset management practices. The improvement program specifies its commitment to increase asset management maturity and data confidence. Key performance measures have been established to track Council’s performance of its assets and asset management practices.
20
� 21
$0
$2M
$4M
$6M
$8M
$10M
21
� 22
22
� 23
23
� 24
24
� 25
25
� 26
26
� 27
27
� 28
28
� 29
29
� 30
Maintenance Renew New
Transport Asset Management Plan8
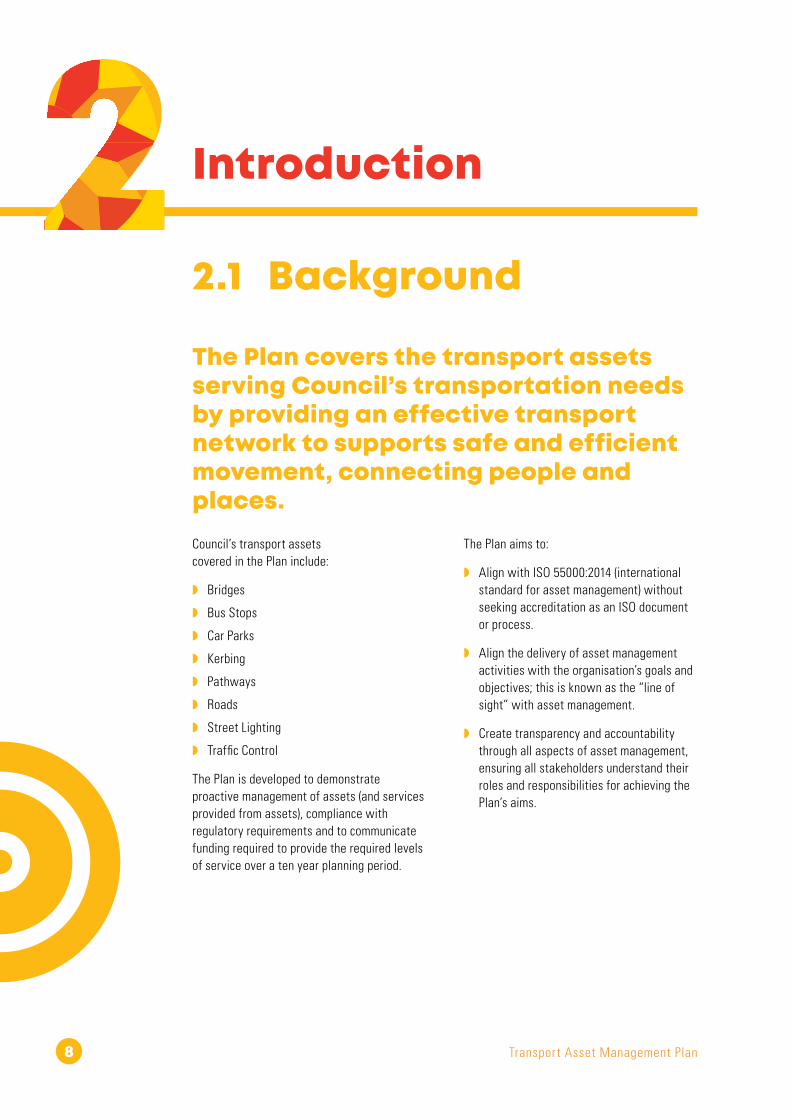
Introduction
Council’s transport assets covered in the Plan include:
◗ Bridges
◗ Bus Stops
◗ Car Parks
◗ Kerbing
◗ Pathways
◗ Roads
◗ Street Lighting
◗ Traffic Control
The Plan is developed to demonstrate proactive management of assets (and services provided from assets), compliance with regulatory requirements and to communicate funding required to provide the required levels of service over a ten year planning period.
The Plan covers the transport assets serving Council’s transportation needs by providing an effective transport network to supports safe and efficient movement, connecting people and places.
2.1 Background
The Plan aims to:
◗ Align with ISO 55000:2014 (international standard for asset management) without seeking accreditation as an ISO document or process.
◗ Align the delivery of asset management activities with the organisation’s goals and objectives; this is known as the “line of sight” with asset management.
◗ Create transparency and accountability through all aspects of asset management, ensuring all stakeholders understand their roles and responsibilities for achieving the Plan’s aims.
City of Unley 9
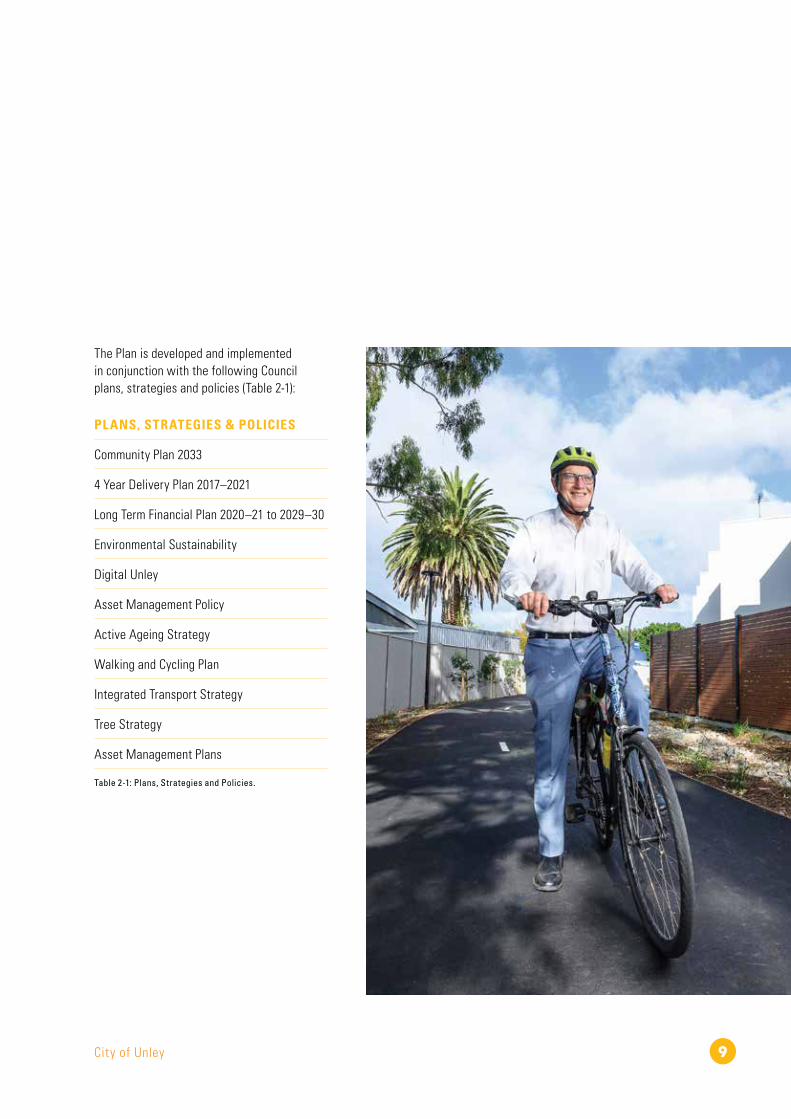
The Plan is developed and implemented in conjunction with the following Council plans, strategies and policies (Table 2-1):
PLANS, STRATEGIES & POLICIES
Community Plan 2033
4 Year Delivery Plan 2017–2021
Long Term Financial Plan 2020–21 to 2029–30
Environmental Sustainability
Digital Unley
Asset Management Policy
Active Ageing Strategy
Walking and Cycling Plan
Integrated Transport Strategy
Tree Strategy
Asset Management Plans
Table 2-1: Plans, Strategies and Policies.
Transport Asset Management Plan10
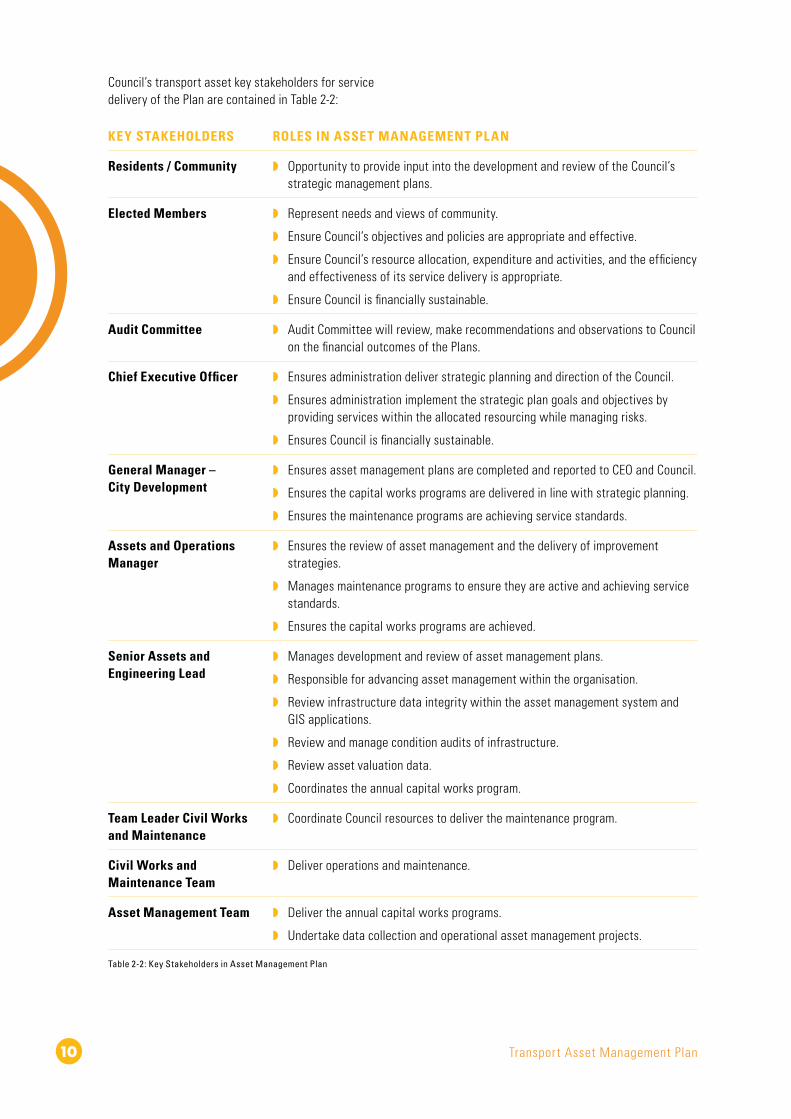
Council’s transport asset key stakeholders for service delivery of the Plan are contained in Table 2-2:
KEY STAKEHOLDERS ROLES IN ASSET MANAGEMENT PLAN
Residents / Community ◗ Opportunity to provide input into the development and review of the Council’s strategic management plans.
Elected Members ◗ Represent needs and views of community.
◗ Ensure Council’s objectives and policies are appropriate and effective.
◗ Ensure Council’s resource allocation, expenditure and activities, and the efficiency and effectiveness of its service delivery is appropriate.
◗ Ensure Council is financially sustainable.
Audit Committee ◗ Audit Committee will review, make recommendations and observations to Council on the financial outcomes of the Plans.
Chief Executive Officer ◗ Ensures administration deliver strategic planning and direction of the Council.
◗ Ensures administration implement the strategic plan goals and objectives by providing services within the allocated resourcing while managing risks.
◗ Ensures Council is financially sustainable.
General Manager – City Development
◗ Ensures asset management plans are completed and reported to CEO and Council.
◗ Ensures the capital works programs are delivered in line with strategic planning.
◗ Ensures the maintenance programs are achieving service standards.
Assets and Operations Manager
◗ Ensures the review of asset management and the delivery of improvement strategies.
◗ Manages maintenance programs to ensure they are active and achieving service standards.
◗ Ensures the capital works programs are achieved.
Senior Assets and Engineering Lead
◗ Manages development and review of asset management plans.
◗ Responsible for advancing asset management within the organisation.
◗ Review infrastructure data integrity within the asset management system and GIS applications.
◗ Review and manage condition audits of infrastructure.
◗ Review asset valuation data.
◗ Coordinates the annual capital works program.
Team Leader Civil Works and Maintenance
◗ Coordinate Council resources to deliver the maintenance program.
Civil Works and Maintenance Team
◗ Deliver operations and maintenance.
Asset Management Team ◗ Deliver the annual capital works programs.
◗ Undertake data collection and operational asset management projects.
Table 2-2: Key Stakeholders in Asset Management Plan

City of Unley 11

Transport Asset Management Plan12
2.2 Goals and Objectives of Asset Ownership

City of Unley 13
The goal of asset management is to provide the desired level of service through the provision and management of physical assets in the most cost-effective manner, for present and future generations.
The Plan demonstrates alignment with the Council’s Community Plan 2033 through its vision and themes:
Our City is recognised for its enviable lifestyle, environment, business strength and civic leadership.
COMMUNITY LIVING
GOAL:
People value our City with its enviable lifestyle, activities, facilities and services.
OBJECTIVES:
◗ Our Community is active, healthy and feels safe.
◗ Our Community participates in community activities, learning opportunities and volunteering.
◗ Our City meets the needs of all generations.
◗ Our Community is proud to be part of our City.
◗ Our City is connected and accessible.
ECONOMIC PROSPERITY
GOAL:
Our businesses are valued because of the range of goods, services and facilities they provide, and new businesses are supported, not burdened with bureaucracy.
OBJECTIVES:
◗ Unley is recognised as an easy place to do business.
◗ Thriving main streets and other business activities operate across our City.
ENVIRONMENT STEWARDSHIP
GOAL:
We will maintain and enhance our urban environment and strengthen our City’s resilience to climate change by providing leadership to our Community.
OBJECTIVES:
◗ Unley’s urban forest is maintained and improved.
◗ Excellence in waste management is achieved through avoidance, re-use and diversion.
◗ The energy efficiency of the City if increased and our carbon footprint reduced.
◗ Efficient, effective & sustainable water management is ensured.
◗ The City’s resilience to climate change is increased.
CIVIC LEADERSHIP
GOAL:
Council will listen to the community and make transparent decisions for the long-term benefit of the City.
OBJECTIVES:
◗ We have strong leadership and governance.
◗ Council provides best value services to the community.
◗ Our business systems are effective and transparent.
These objectives will be considered in all decision-making aspects regarding transport assets to ensure Council consistently strives to achieve these strategic objectives. There are several initiatives that feed into the above objectives outside of the asset management process that ultimately support the stated objectives.

Transport Asset Management Plan14
2.3 Plan Framework
Key elements of the Plan include:
◗ Levels of service – specifies the levels of service objectives and how they are measured.
◗ Future demand – how this will impact on future service delivery and how the demand will be met.
◗ Lifecycle management – how Council manages existing and future assets to provide the levels of service.
◗ Risk management – how Council manages asset risks.
◗ Financial summary – funds required to provide the levels of service.
◗ Improvement plan and monitoring – how Council will improve asset management maturity and how the Plan will be measured to ensure it’s meeting Council’s objectives.
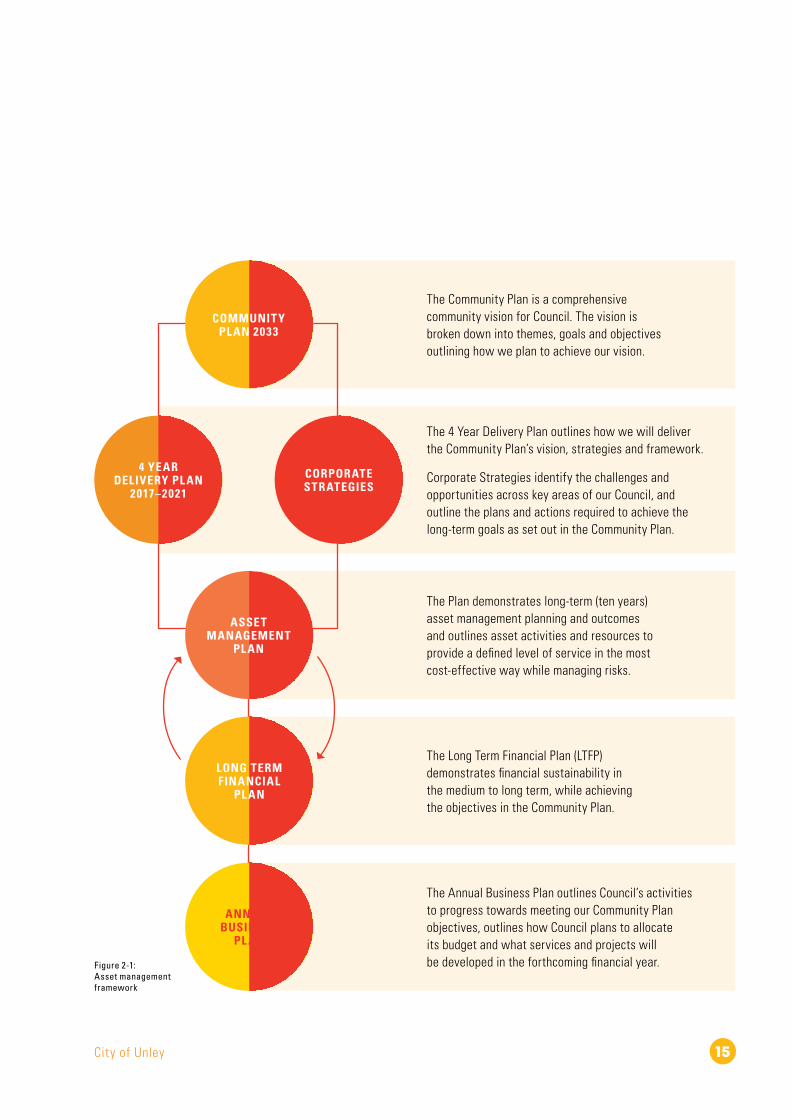
The asset management framework is shown in Figure 2-1 and the roadmap for preparing an asset management plan is in Figure 2-2.
City of Unley 15
Figure 2-1: Asset management framework
The Community Plan is a comprehensive community vision for Council. The vision is broken down into themes, goals and objectives outlining how we plan to achieve our vision.
COMMUNIT Y PL AN 2033
ANNUAL BUSINESS
PL AN
4 YEAR DELIVERY PL AN
2017–2021
CORPORATE STRATEGIES
ASSET MANAGEMENT
PL AN
LONG TERM FINANCIAL
PL AN
The Annual Business Plan outlines Council’s activities to progress towards meeting our Community Plan objectives, outlines how Council plans to allocate its budget and what services and projects will be developed in the forthcoming financial year.
The Long Term Financial Plan (LTFP) demonstrates financial sustainability in the medium to long term, while achieving the objectives in the Community Plan.
The Plan demonstrates long-term (ten years) asset management planning and outcomes and outlines asset activities and resources to provide a defined level of service in the most cost-effective way while managing risks.
The 4 Year Delivery Plan outlines how we will deliver the Community Plan’s vision, strategies and framework.
Corporate Strategies identify the challenges and opportunities across key areas of our Council, and outline the plans and actions required to achieve the long-term goals as set out in the Community Plan.

Transport Asset Management Plan16
AM PL AN REVIEW &
AUDIT
IMPLEMENT IMPROVEMENT
STRATEGY
ANNUAL PL AN/
BUSINESS PL AN
ITERATION
◗ Reconsider service statements
◗ Options for funding ◗ Consult
IS THE PL AN AFFORDABLE?
INFO
RM
ATI
ON
MA
NA
GEM
ENT
AN
D D
ATA
IM
PR
OV
EMEN
T
◗ Assess current/desired practices
◗ Develop improvement plan
IMPROVEMENT PL AN
◗ Lifecycle analysis ◗ Financial forecast summary
◗ Valuation depreciation ◗ Funding
FINANCIAL FORECASTS
◗ Develop lifecycle strategies ◗ Describe service delivery
strategy ◗ Risk management strategies ◗ Demand forecasting and
management
◗ Optimised decision making (renewals, new works, disposals)
◗ Optimise maintenance strategies
LIFECYCLE MANAGEMENT STRATEGIES
◗ Establish strategic linkages ◗ Define and adopt
statements
◗ Establish measures and targets
◗ Consultation
ESTABLISH LEVELS OF SERVICE
◗ Existing information sources ◗ Identify and describe assets ◗ Data collection
◗ Condition assessments ◗ Performance monitoring ◗ Valuation data
REVIEW/COLL ATE ASSET INFORMATION
◗ Confirm strategic objectives and establish AM policies, strategies and goals
◗ Define responsibilities and ownership
◗ Decide core or advanced AM Plan
◗ Gain organisation commitment
CORPORATE PL ANNING
DEFINE SCOPE &
STRUCTURE OF PL AN
Figure 2-2: Road map for preparing an Asset Management Plan
Source: IPWEA, 2006, International Infrastructure Management Manual (IIMM) Fig 1.5.1, p 1.11

City of Unley 17
2.4 Core and Advanced Asset Management
The Plan is prepared as a core level maturity over the ten year planning period in line with the International Infrastructure Management Manual (IIMM). Core asset management is a top down approach with analysis applied at a network level.
The Plan is prepared to meet legislative and organisational requirements for sustainable service delivery and long-term financial planning and reporting. The improvement program (Section 8) outlines and prioritises the steps required to an advanced asset management maturity.
Transport Asset Management Plan18
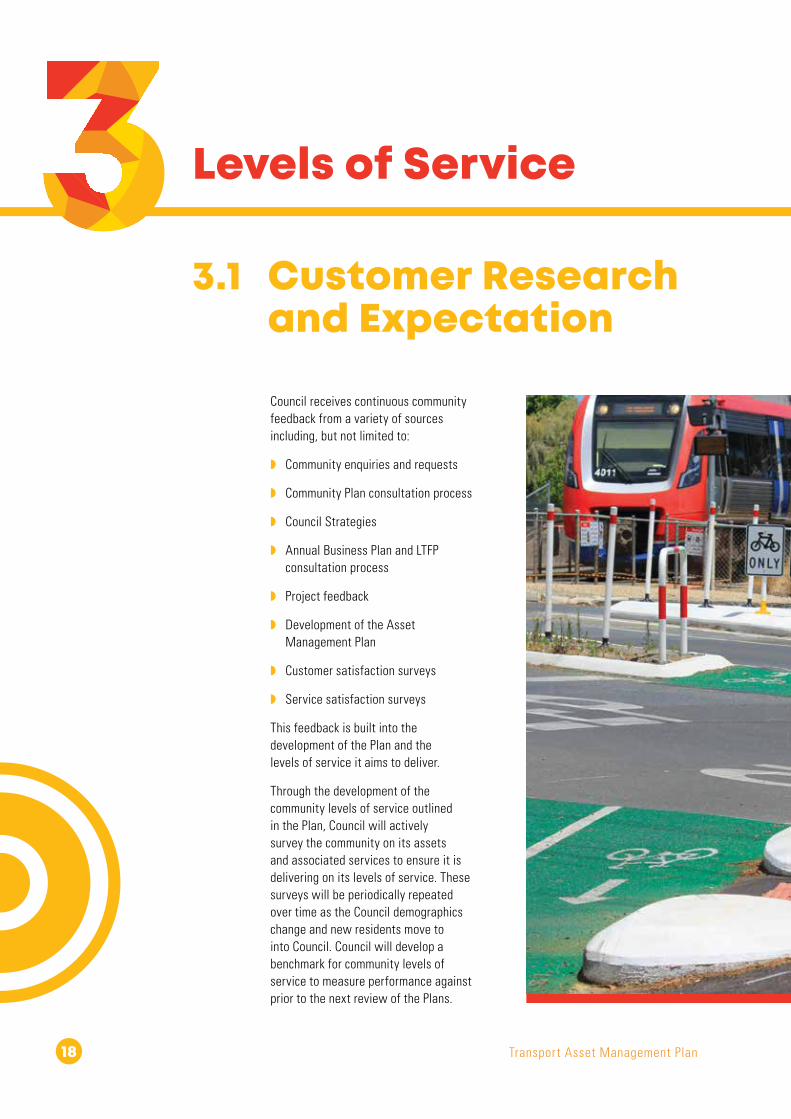
Levels of Service
Council receives continuous community feedback from a variety of sources including, but not limited to:
◗ Community enquiries and requests
◗ Community Plan consultation process
◗ Council Strategies
◗ Annual Business Plan and LTFP consultation process
◗ Project feedback
◗ Development of the Asset Management Plan
◗ Customer satisfaction surveys
◗ Service satisfaction surveys
This feedback is built into the development of the Plan and the levels of service it aims to deliver.
Through the development of the community levels of service outlined in the Plan, Council will actively survey the community on its assets and associated services to ensure it is delivering on its levels of service. These surveys will be periodically repeated over time as the Council demographics change and new residents move to into Council. Council will develop a benchmark for community levels of service to measure performance against prior to the next review of the Plans.
3.1 Customer Research and Expectation

City of Unley 19
3.2 Legislative Requirements
Council must meet many legislative requirements including Federal and State Government legislation and regulations as well as non-legislative requirements including Australian Standards and Council policies as contained in Table 3-1.
LEGISLATION REQUIREMENT
Aboriginal Heritage Act 1988
An Act to provide for the protection and preservation of the Aboriginal heritage; to repeal the Aboriginal and Historic Relics Preservation Act 1965 and the Aboriginal Heritage Act 1979; and for other purposes.
Austroads Guide to Road Design Part 6A: Paths for Walking and Cycling
Have consideration of, adhere to and fulfil the requirements of the Standards.
Australian Accounting Standards
Standards applied in preparing financial statements, relating to the valuation, revaluation and depreciation of transport assets.
Development Act 1993 An Act to provide for planning and regulate development in the State; to regulate the use and management of land and buildings, and the design and construction of buildings; to make provision for the maintenance and conservation of land and buildings where appropriate; and for other purposes.
Disability Discrimination Act 1992
Provides protection for everyone in Australia against discrimination based on disability. It encourages everyone to be involved in implementing the Act and to share in the overall benefits to the community and the economy that flow from participation by the widest range of people.
Environmental Protection Act 1993
An Act to provide the protection of the environment; to establish the Environment Protection Authority and define its functions and powers; and for other purposes. Consideration of this act should be undertaken for the provision, development or management of transport assets.
Highways Act 1926 An Act to provide for the appointment of a Commissioner of Highways, and to make further and better provision for the construction and maintenance of roads and works and for other purposes.
Local Government Act 1999
Sets out role, purpose, responsibilities and powers of local governments including the preparation of long-term financial plan supported by asset management plans for sustainable service delivery.
Road Traffic Act 1961 An Act to consolidate and amend certain enactments relating to road traffic; and for other purposes.
Summary Offences Act 1953
This Act provides provisions for road closure to motor vehicles in accordance with section 59.
Work Health and Safety Act 2012
An Act to provide for the health, safety and welfare of persons at work; and for other purposes.
Table 3-1: Legislative requirements

Transport Asset Management Plan20
3.3 Current Level of Service
Levels of service are a key business driver and influence all asset management decisions. It describes:
◗ The outputs Council intends to deliver to customers.
◗ The service attributes such as quality, functionality and capacity.
◗ The performance measures.
Performance measures are used to indicate how Council is doing in relation to delivering levels of service.
Council has defined two levels of service categories:
◗ Community Levels of Service – measures the service the community expects.
◗ Technical Levels of Service – measures the service the organisation provides.
Community levels of service measure the community’s perception of Council’s service performance, while the technical levels of service measure against technical indicators of performance.
Council’s desired level of service is the technical level of service as a minimum. The level of service will be constantly monitored and reviewed with the introduction of the community survey to develop community level of service key performance indicators (KPIs). It’s anticipated the next review will be in four years. Council’s levels of service are captured in Table 3-2.

City of Unley 21
COMMUNITY LEVELS OF SERVICE
PERFORMANCE MEASURE
LEVEL OF SERVICE OBJECTIVE
PERFORMANCE MEASURE
KPI 2020
QualityStreets are well maintained
Community survey on the physical quality of the streets for driving, cycling, walking and public transport.
KPI based on survey (see improvement program)
Survey to set baseline
FunctionAsset to meet service needs – ‘fit for purpose’
Community survey on the functionality of the streets for driving, cycling, walking and public transport.
KPI based on survey (see improvement program)
Survey to set baseline
TECHNICAL LEVELS OF SERVICE
PERFORMANCE MEASURE
LEVEL OF SERVICE OBJECTIVE
PERFORMANCE MEASURE
KPI 2020
ConditionPhysical state of transport assets in a serviceable condition
Average condition of transport assets
Equal or less than condition rating 3
2.1
Average condition of bridge assets
Equal or less than condition rating 3
2.9
Average condition of bus stop assets
Equal or less than condition rating 3
2.0
Average condition of car park assets
Equal or less than condition rating 3
1.7
Average condition of kerbing assets
Equal or less than condition rating 3
2.5
Average condition of pathway assets
Equal or less than condition rating 3
1.5
Average condition of road assets
Equal or less than condition rating 3
1.9
Average condition of street lighting assets
Equal or less than condition rating 3
2.0
Average condition of traffic control assets
Equal or less than condition rating 3
2.4
Transport Asset Management Plan22
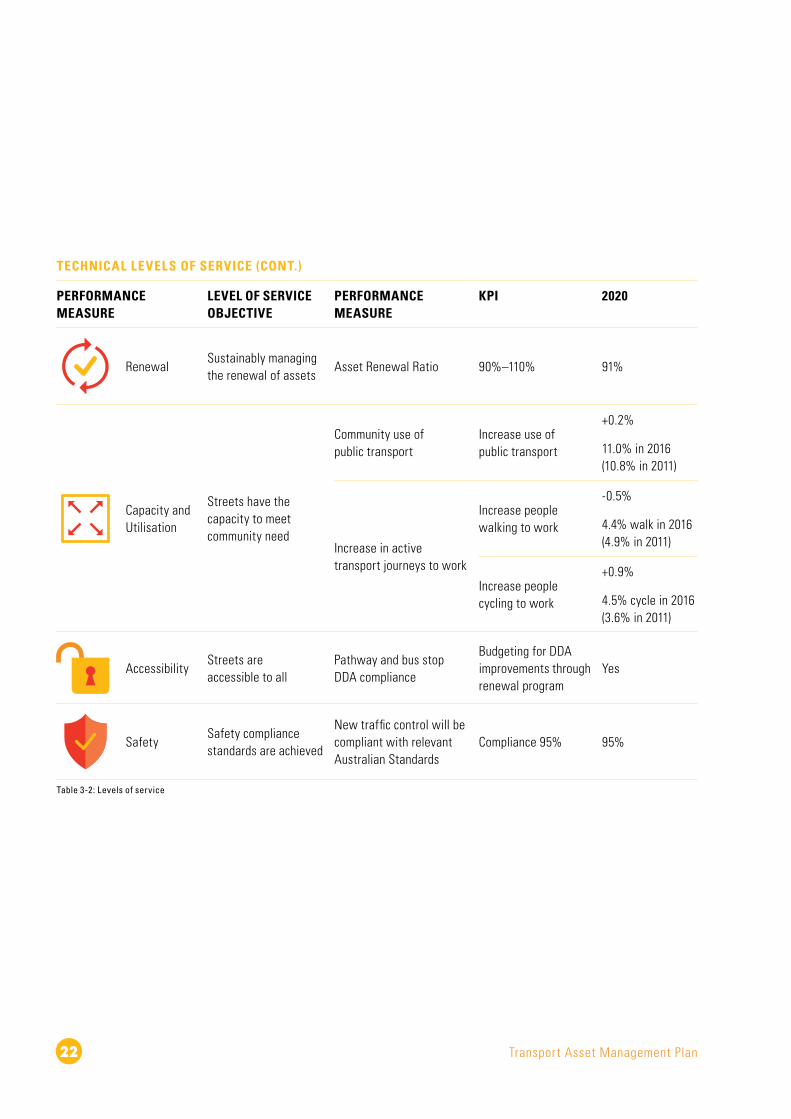
RenewalSustainably managing the renewal of assets
Asset Renewal Ratio 90%–110% 91%
Capacity and Utilisation
Streets have the capacity to meet community need
Community use of public transport
Increase use of public transport
+0.2%
11.0% in 2016 (10.8% in 2011)
Increase in active transport journeys to work
Increase people walking to work
-0.5%
4.4% walk in 2016 (4.9% in 2011)
Increase people cycling to work
+0.9%
4.5% cycle in 2016 (3.6% in 2011)
AccessibilityStreets are accessible to all
Pathway and bus stop DDA compliance
Budgeting for DDA improvements through renewal program
Yes
SafetySafety compliance standards are achieved
New traffic control will be compliant with relevant Australian Standards
Compliance 95% 95%
Table 3-2: Levels of service
TECHNICAL LEVELS OF SERVICE (CONT.)
PERFORMANCE MEASURE
LEVEL OF SERVICE OBJECTIVE
PERFORMANCE MEASURE
KPI 2020

City of Unley 23

Transport Asset Management Plan24
Future Demand
The community’s demand for services changes overtime. The reason for change can be varied, some of the common drivers are population, demographics, environment and technology. As service demand changes, Council’s assets may also need to change to meet the changing demand. A summary of Council’s forecast demands and how these are proposed to be managed is contained in Table 4.1.
CURRENT POSITION DEMAND FORECAST DEMAND IMPACT DEMAND MANAGEMENT PLAN IMPACT ON ASSETS
POPULATION AND DEMOGRAPHICS
Population increase:
◗ Total estimated population 39,208 (ABS 2019).
Planned to accommodate an additional 5,000 people by 2040.
Higher than average provision of medium density housing (38%), which is anticipated to further increase in the next 30 years.
Increased demand and use of transport assets.
As streets have increased numbers, the demand will increase for traffic control, car parking and access for alternate forms of transport (cycling, public transport, walking).
Through Council’s Community Plan Objective 1.5 – Our City is connected and accessible. Council has developed the Integrated Transport Strategy with the vision: ‘Unley’s transport system and people movement will be safe, accessible, sustainable and effective.’
The strategy’s focus areas include active transport, parking, public transport and shared transport, and traffic management and road safety. The strategy is actioned through the Walking and Cycling Plan and Local Area Traffic Management Studies.
Council’s Walking and Cycling Plan and Local Area Traffic Management Study outcomes are delivered though the new capital budget.
All transport asset renewals to be informed by modern standards and Council’s integrated transport strategy.
The addition of new transport assets and any increases in standards for renewals will have ongoing maintenance and operational costs.
Changing demographics:
◗ 11,257 new residents have moved into the Council within the last five years – 30% are new to Council.
◗ Average age is 39 years old.
◗ A quarter of the population are families (couples with children).
Growth in aging population.
Growth in children aged between 0–9 years.
Increase in families moving to Council.
Increasing multiculturalism.
Diverse demographics may create demand for improved accessibility and service demands through transport infrastructure. This includes:
◗ High standards of footpaths condition and DDA requirements.
◗ Cycling infrastructure.
◗ Bus stop infrastructure.
◗ Signage including wayfinding.
◗ Traffic control to control traffic movements and integrate vehicles, cyclists and pedestrians.
Along with the Integrated Transport Strategy, the Council has developed an Age Friendly Streetscape Guidelines through the Community Plan Objective 1.3 and the Active Aging strategy to consider in all redevelopments of streets and open spaces.
The Age Friendly Streetscape Guidelines includes design considerations for lighting, signage, footpaths and traffic management devices. The guidelines outline integration between transport assets and open space assets within the streets such as street furniture, seating and vegetation.

City of Unley 25
The community’s demand for services changes overtime. The reason for change can be varied, some of the common drivers are population, demographics, environment and technology. As service demand changes, Council’s assets may also need to change to meet the changing demand. A summary of Council’s forecast demands and how these are proposed to be managed is contained in Table 4.1.
CURRENT POSITION DEMAND FORECAST DEMAND IMPACT DEMAND MANAGEMENT PLAN IMPACT ON ASSETS
POPULATION AND DEMOGRAPHICS
Population increase:
◗ Total estimated population 39,208 (ABS 2019).
Planned to accommodate an additional 5,000 people by 2040.
Higher than average provision of medium density housing (38%), which is anticipated to further increase in the next 30 years.
Increased demand and use of transport assets.
As streets have increased numbers, the demand will increase for traffic control, car parking and access for alternate forms of transport (cycling, public transport, walking).
Through Council’s Community Plan Objective 1.5 – Our City is connected and accessible. Council has developed the Integrated Transport Strategy with the vision: ‘Unley’s transport system and people movement will be safe, accessible, sustainable and effective.’
The strategy’s focus areas include active transport, parking, public transport and shared transport, and traffic management and road safety. The strategy is actioned through the Walking and Cycling Plan and Local Area Traffic Management Studies.
Council’s Walking and Cycling Plan and Local Area Traffic Management Study outcomes are delivered though the new capital budget.
All transport asset renewals to be informed by modern standards and Council’s integrated transport strategy.
The addition of new transport assets and any increases in standards for renewals will have ongoing maintenance and operational costs.
Changing demographics:
◗ 11,257 new residents have moved into the Council within the last five years – 30% are new to Council.
◗ Average age is 39 years old.
◗ A quarter of the population are families (couples with children).
Growth in aging population.
Growth in children aged between 0–9 years.
Increase in families moving to Council.
Increasing multiculturalism.
Diverse demographics may create demand for improved accessibility and service demands through transport infrastructure. This includes:
◗ High standards of footpaths condition and DDA requirements.
◗ Cycling infrastructure.
◗ Bus stop infrastructure.
◗ Signage including wayfinding.
◗ Traffic control to control traffic movements and integrate vehicles, cyclists and pedestrians.
Along with the Integrated Transport Strategy, the Council has developed an Age Friendly Streetscape Guidelines through the Community Plan Objective 1.3 and the Active Aging strategy to consider in all redevelopments of streets and open spaces.
The Age Friendly Streetscape Guidelines includes design considerations for lighting, signage, footpaths and traffic management devices. The guidelines outline integration between transport assets and open space assets within the streets such as street furniture, seating and vegetation.

Transport Asset Management Plan26
Council and the community are increasingly aware of its impact to the environment and Council’s role in environmental sustainability.
Council is committed to pursuing, supporting and creating an environment that will sustain current and future generations. This goal is shared by the community and is a primary objective of most governments across the world.
Council is committed to using fewer of precious resources, reducing its carbon footprint and looking for smarter ways to achieve this objective.
Greater environmental sustainability requirements placed on the construction industry.
Council’s Environmental Sustainability Strategy 2016–2020 is the lead strategy implementing the Environmental Stewardship goal and objectives identified in the Community Plan 2033 and 4 Year Delivery Plan.
The Strategy’s themes guide direction and inform priorities for environmental projects:
◗ Green Unley
◗ Waterwise Unley
◗ Resilient Unley
◗ Resourceful Unley
◗ Energywise Unley
Council has aligned with Resilient East provides opportunities for the Eastern Region to collaborate to increase resilience to climate change.
Council’s Environmental Sustainability Strategy provides principals for the delivery of new and renewal of assets, these include:
◗ LED lighting introduced to local and collector streets.
◗ Natural and renewable materials to be used in the construction of transport assets (recycled roads, composite materials for boardwalks and bridges, permeable surfaces)
◗ Electric car changing station at Hayward Park promoting energy efficient lifestyles in the community.
Integration of transport assets with natural and stormwater assets to deliver:
◗ An increase tree population in the streets to absorb carbon dioxide from the air.
◗ Water Sensitive Urban Design (WSUD) within Council streets. See Stormwater Asset Management Plan.
Higher costs are associated with environmentally sustainable construction methods.
Increase trend in severe weather events including heat, droughts, storms and storm surges.
Trend for a decrease in average annual rainfall and an increased awareness to minimise water usage.
Hot and dry consecutive summer days on the rise. The number of days over 40°C in eastern Adelaide is projected to double by 2050, and the frequency and duration of heatwaves is projected to increase.
Assets not reaching their stated useful lives due to lack of consideration of climate change.
Increasing management and maintenance demand associated with climate change adaptation.
Investigate the impact climate change on transport infrastructure with industry partners.
Include climate change within the asset risk management plan.
Council is developing a Climate and Energy Plan to be endorsed in 2020/21.
Condition is to be monitored for changes in asset performance within extreme climate conditions.
TECHNOLOGY
Global trend towards smart cities creating simplified services through smart technology.
Growing expectation to implement digital service improvements.
Demand for increased technology provision/access.
Council must adapt to the changing way the community operates, thinks and plans.
Digital Unley outlines Council’s Digital Vision through the strategic use of digital technologies to enhance the lifestyle of residents, better manage the environment, support the local economy and continuously improve the delivery of Council services.
Smart poles provide energy efficient LED lighting with the capability for Wi-Fi signal points, sensors and public address system.
Interactive smart screens located around the City can deliver Council’s messages in near real time.
Smart infrastructure and data collection provide opportunities for business improvement.
Maintenance and operating costs will be required for all smart systems.
Table 4-1: Future demands
CURRENT POSITION DEMAND FORECAST DEMAND IMPACT DEMAND MANAGEMENT PLAN IMPACT ON ASSETS
CLIMATE CHANGE

City of Unley 27
Council and the community are increasingly aware of its impact to the environment and Council’s role in environmental sustainability.
Council is committed to pursuing, supporting and creating an environment that will sustain current and future generations. This goal is shared by the community and is a primary objective of most governments across the world.
Council is committed to using fewer of precious resources, reducing its carbon footprint and looking for smarter ways to achieve this objective.
Greater environmental sustainability requirements placed on the construction industry.
Council’s Environmental Sustainability Strategy 2016–2020 is the lead strategy implementing the Environmental Stewardship goal and objectives identified in the Community Plan 2033 and 4 Year Delivery Plan.
The Strategy’s themes guide direction and inform priorities for environmental projects:
◗ Green Unley
◗ Waterwise Unley
◗ Resilient Unley
◗ Resourceful Unley
◗ Energywise Unley
Council has aligned with Resilient East provides opportunities for the Eastern Region to collaborate to increase resilience to climate change.
Council’s Environmental Sustainability Strategy provides principals for the delivery of new and renewal of assets, these include:
◗ LED lighting introduced to local and collector streets.
◗ Natural and renewable materials to be used in the construction of transport assets (recycled roads, composite materials for boardwalks and bridges, permeable surfaces)
◗ Electric car changing station at Hayward Park promoting energy efficient lifestyles in the community.
Integration of transport assets with natural and stormwater assets to deliver:
◗ An increase tree population in the streets to absorb carbon dioxide from the air.
◗ Water Sensitive Urban Design (WSUD) within Council streets. See Stormwater Asset Management Plan.
Higher costs are associated with environmentally sustainable construction methods.
Increase trend in severe weather events including heat, droughts, storms and storm surges.
Trend for a decrease in average annual rainfall and an increased awareness to minimise water usage.
Hot and dry consecutive summer days on the rise. The number of days over 40°C in eastern Adelaide is projected to double by 2050, and the frequency and duration of heatwaves is projected to increase.
Assets not reaching their stated useful lives due to lack of consideration of climate change.
Increasing management and maintenance demand associated with climate change adaptation.
Investigate the impact climate change on transport infrastructure with industry partners.
Include climate change within the asset risk management plan.
Council is developing a Climate and Energy Plan to be endorsed in 2020/21.
Condition is to be monitored for changes in asset performance within extreme climate conditions.
TECHNOLOGY
Global trend towards smart cities creating simplified services through smart technology.
Growing expectation to implement digital service improvements.
Demand for increased technology provision/access.
Council must adapt to the changing way the community operates, thinks and plans.
Digital Unley outlines Council’s Digital Vision through the strategic use of digital technologies to enhance the lifestyle of residents, better manage the environment, support the local economy and continuously improve the delivery of Council services.
Smart poles provide energy efficient LED lighting with the capability for Wi-Fi signal points, sensors and public address system.
Interactive smart screens located around the City can deliver Council’s messages in near real time.
Smart infrastructure and data collection provide opportunities for business improvement.
Maintenance and operating costs will be required for all smart systems.
Table 4-1: Future demands
CURRENT POSITION DEMAND FORECAST DEMAND IMPACT DEMAND MANAGEMENT PLAN IMPACT ON ASSETS
CLIMATE CHANGE

Transport Asset Management Plan28

City of Unley 29
Lifecycle Management
This section outlines the transport asset data (condition, valuation, revaluation, useful life) and processes needed to effectively manage, renew and upgrade the infrastructure assets.
Significant time is spent on the decision to create or acquire a new asset, likewise financial costs of maintaining an asset from creation to disposal or replacement will need to be planned. New assets require initial expenditure; however, the required financial commitment for the asset’s lifecycle costs can be up to five times the initial expenditure.
Lifecycle management details how Council plans to manage and operate (from planning to disposing) its transport assets at the agreed level of service while optimising total cost of ownership at an appropriate level of risk.
5.1 Background
The cost of an asset lifecycle can be divided into four major stages:
◗ Creation/Acquisition (Planning, Design/Procurement, Construction)
◗ Maintenance and Operations (Operate, Maintain, Monitor)
◗ Capital Renewal/Replacement (Requirements/Specifications, Upgrade/Modify, Replace)
◗ Decommission (Trigger, Decommission, Disposal)
These major stages are further detailed in this Lifecycle Management section.
Variability of these stages also exists within different transport categories, as function may influence the renewal versus replacement strategies.
The major stages can be further divided into specific processes as listed in Figure 5-1.
Capital Renewal/Replacement
Creation/Acquisition
Maintenance and Operations
Decommission
Figure 5-1: Asset lifecycle flowchart

Transport Asset Management Plan30
CLARENCE PARKLALARENCE PAPUNLEY PARKPP
HYDE PARK
MALVERNLV
UNLEYLE
INGSSKIARKPA
BLACK FORESTF T
EVERARD PARKPAEVERARD PARK
FORESTVILLETVFORESTVILL
GOODWOODGOODWOD
WAYVILLEVILLELLEWAYVWAYVILLELL
PARKSIDEAR
FULLARTON
HIGHGATE MYRTLE BANKA
MILLSWOODSWOODMILLS
RAILWAY
CLDO
LLIN
G
KESWICK
BARRACKS
SHOWGROUNDS
WAYVILLE
AV
RD
AVSP
ENCE
AVRI
DGE
ALE
AVWAY
FERGUSON
BARR-SMITH
AV
AVMOORHOUSE
AVW
ASHI
NGTO
N
TYNE
PLCHARLES
PLM
ARY LNMARY
PLAMBER
MILLER
ROBE
RTS
ROBERTS
LAHUGHES
PLHU
GHES
CROSS RD
CTTH
BYBO
O
AV
SIDE
GLEN
AV
AV
STHONE
ST
CR
ST
FULL
ARTO
N
ST
OSMOND
GLEN
DUTH
Y
WATTLE
FISHER ST
ST
GEOR
GEST
UNLE
Y
STPARK
KING
WILL
IAM
RD
RDAVGLENFERRIE
AVAUBURN
AVRINGAROOMA
AVCLINTON
FERGUSON RDRI
VERD
ALE
AVGL
ENRO
WAN
AVUR
RBRA
E
AVGL
ENFO
RD
AVM
YRTL
E
AVJE
NKIN
SAVHE
XHAM
ROSS
INGT
ON
WOO
LTAN
A
RDRO
DDAAV
BRAE
SIDE
BURN
HAM
RDBA
ULDE
RSTO
NE
AV
AV
AVW
ILGEN
A
RDSE
DGEF
ORD
AV
TCTA
LLAL
A
STBR
IDGE
BEAC
ONSF
IELD
STTE
NNAN
T
STM
ILTONST
HALL
RDAL
MA
STSE
AVIE
W
STFR
EW
STDA
RBY
STW
YCLIF
F
STAR
THUR
GRRALDONAV
PALMER AVLINDSAY
STHALLAMAVCULROSS
AVOSMONDPL
PICKERING
STWATSON
STM
OORE
STNE
LSON
TCW
ELLIN
GTON
AVRESTORMALSTARAGON
STKATHERINE
STMEDWAY
STAILSA
STAN
DERS
ON
AV
MARTENS
STFLORENCE
ST
STDAWSON
GLADSTONE
AVHA
MPS
TEAD
HIGH
GATE
AVRO
SEBE
RRY
AVST
AUNT
ON
ST
TCW
EST
STBA
LMOR
AL
AVSU
NNYM
EADE
STCR
OSS
TORR
ENS
AVFE
RN
WIN
DSOR
RUGB
Y
CAM
BRID
GE
AVEUSTON
AVINVERGOWRIE
STCARLTON
STCHURCH
RDAVENUE
AVYEO
TCNORTH
AV
TC
ST
ST
ST
ST
AVWHITE
AVWOODFIELD
FRANCIS
ST
ST
MALVERN
AUSTRAL
SHEFFIELD
DOVER
WINCHESTER
CHELTENHAM
MARLBOROUGH
ETON
CLIFTON
AVCO
OTRA
STGR
EVILL
ECA
STLE
TCLA
NGHA
M
TCTR
IMM
ER
TC
ST
CTAUDLEY
AVRANDOLPH
ST
AV
TC
ST
CREMORNE
FAIRFORD
EDMUND
OXFORD
FREDERICK
KENI
LWOR
TH
STNE
LLY
STM
YRA
ST
ST
DAVEYST
MACKLIN
ST
OXENBOULDAV
STYOUNG
STALFRED
PLST ANNS
ST
ST
STST HELENST
STOLIV E
STBIRKSST
PARINGA
RDCAMPBELL
ST
ST
ARNOLD
DUDLEY
RD
ST
ST
ST
ST
ST
STWALLIS
BLYTH
FOSTER
WILKINSON
SCOTT
HILL
FULLER
LEICESTER
ROBSART
STREGENT
STMARION
ST
MAUD ST
CULVERTSTWHITTHAM
CTBELGRAVE STELLA
STDUNKS
STTOWNSEND
STCLYDE
STCO
LLIN
S
AVTO
NDIE
RD
PORT
ER
STPI
NE
STAM
FORD
JAFF
REYAN
GLO
MON
TPEL
IER
DOUG
LAS
LISTO
N
PLBE
LLEV
UEST
VIEW
STGE
ORGE
PLRA
MO
STGR
OVE
AVW
HIST
LER
STKING
STHIGH
STTHORNBERAVHEYWOOD
PLADDISCOMBE
STNORTHGATE
STFASHODA
AVHATHERLEY STGREER
RDCOMMERCIAL
STJASPERSTPENONG
AVW
ARW
ICK
AVW
OODL
YN
STCA
ROON
A
AVHA
GUE
CHAR
RA
WES
TALL
WILL
IAM
KING
STNA
LPA
ST
ST
GULL
YSTM
ACKL
INSTEN
TERP
RISEST
MAN
NSTRDSTOX
FORD
AVW
OODH
URST
STBA
RROWGR
STRU
SSEL
LSTCL
AREN
CE
STHA
RLEY
AVRO
YAL
ESMONDE STRD
BEACONSFIELD
AVOPEY
AVHART
STMARY
RDM
ORNI
N
AVM
IZPA
H
STCA
ITHN
ESS
QUEE
N
STAU
STEL
LAV
BEEC
H
STRA
MAG
E
AVAS
H
AVOA
K
STPL
AVCL
ELAN
D
STER
SKIN
E
ST
ALLEN
THOMAS
AVMCGOWAN
ARTHUR STLA
DUNNSAVBIRDWOOD
STCHARLES
STWALTER
PLBOFFA
STBLOOMSBURY
ST
STALBERT
ST
PD
STHUGHES
BARTLEY
ST
MILLER
LA
LA
PL
IRW
IN
SALIS
BURY
PALM
ERSO
N
RDPA
LMER
STON
ST
PL
ROBE
RTS
STKI
LLIC
OAT
STYOUNG
TCROSE
LAWELLER
CL
ARUN
STO’
CONN
ELL
SCHOOL AV
WOOD LA LADAVENPORT
VICT
ORIA
AV
CLAR
K
RD
STKNEEBONE
STMANSFIELD
STDOLLMAN
UNION
GRACE
JOHN
STON
E
TC
CANTERBURY
CROSS RD
AVEA
ST
STMITCHELL
GOOD
WOO
DRD
STLEADER
AV
JELLICOE
STH
TC
NANTHEA
NTH
TC
NANTHEA
AVSE
YMOU
R
AVNI
NGAN
A
STEL
M
AVM
IEGU
NYAH
THWK
LAMBE AVGLEN
AVRUTLAND
GRASHLEIGHAVCEDAR
STNORTHGATE
AVLAWSON
CTPASCOE
AVVALMAI
STSTANLEYSTDI
XON
STAV
ONDA
LESTJA
MES
STTH
AMES
AVCH
URCH
ILL
ST
HAM
MON
D
STHENRYDR
OVERBURY
STGEORGE
AVBIRKDALE
FRANCIS
STCULLEYTC
PARKER
AVROSSLYN
STW
ILLIA
M
STFR
EDER
ICK
AVOA
KFIE
LD
STM
ARGA
RET
RDRI
PON
RDHO
MER
RDGO
RDON
AVLANGDON
AVLORRAINE
AVKELVIN
RDEMERSON
RDDRYDEN
RDCOWPER
RDBYRON
CT ISHPAR
TC
VARDON
HEATHCOTECR
STEV
A
STDO
UGLA
S
STW
OOD
STRE
GENT
AVAL
EXAN
DERST
PERC
Y
STMALCOLM
AVANDREW
AVWOOLDRIDGE
STAVENUE
STJARVIS
TCRE
ELLERSME
TCLO
NSD
AVRAVENSTHORPE
LLYOD
MILLSWOOD
PD
CROMER
AV
AV
ARUNDEL AV
AVAR
GYLE
AVNO
RTHB
ROOK
STSURREY
SOUTHST
DEVONPDE
LYONS
TC
RAILWAY
TC
AROHA
AVCU
RZON
AVGR
AHAM
STSP
IERS
AVFA
IRM
ONT
AVCO
ULTE
R
AVEG
LINGT
ONAV
DAVI
D
AVBU
SBY
AVW
ILSON
AVHA
RTLA
ND
STGR
AYAV
WIN
IFRED
AVSE
LKIR
K
MILLS
AVLYNTON
AVORMONDE
CRANBROOK AV
GRANTLEY AV
ADDISON
CTHILL
IRWIN
MEREDYTH
AVFAIRFAX
STDUNROBIN
AVERIC
AVMERLON
AVHACKETT
AVALLENBYAVLAUGHT
AVCHELMSFORD
VICTORIA
AVFOREST
AVLINCOLN
RDFIE
LDIN
G
RDGO
RDON
AVKE
RTA
WEE
TAAVOB
AN
TCTCRICHARDS
TCNAIRNE
STNICHOLS
TC
TC
NORMAN
STROSS
AVMASTERS
AVEURILPA
STHALE
EVERARD
AVORCHARD
AVNIBLEY
AVBERKLEY
AV
HILLSLEYAV
VE
GRO
AVOA
KLEY
STHA
MPT
ONSO
UTH
SOUT
HST
ESSE
X
STFO
STER
STNE
WM
AN
NORT
HSTHA
MPT
ONNORT
HST
ESSE
X
NORT
HST
DEVO
N
STET
HEL
STCH
ARLE
S
STLE
AH
AVFIR
ST
AVSE
COND
AVTH
IRD
FOUR
THAV
AVAF
RICA
INE
AVHA
LMON
NORTH
STBLACKET
TON
WE
STW
ELLE
R
STEL
IZAB
ETH
STFO
X
STHA
RDY
STHA
RVEY
STLE
WISST
RUSH
TON
STAD
A
STJO
HN
STFO
UNDR
YSTAL
MON
DST
ST
ST
ROGE
RS
MUS
GRAV
E
STH
AVLANOR
STLOUISA
ST
ST
CLIFTON
STANGUS
STOPHIR
STGILBERT
STLILY
STROSA STGURR
STOWENSTFLORENCE
STALBERT
STHINTON
SIMPSONSTBENDAL L
ST
TREVELYAN
MORESBY
JOSL
IN
AVRH
YL
STHOXTONSTPARSONS
STHUNTELE
ST
STSH
ORT
COTH
AM
STYOUNG
TCDAVENPORT
STLAROSETCROSE
AVMAPLE
WKWILBERFORCE
ST CHINNER
STSTAVSTSTSTTS
LAPARKLAGREENHILL
GREENHILL RD
TC ST
SOUT
HRD
ANZAC
HY
GTON
GA
S
COOK
E TC
GREENHILL RD
Adelaide Parklands
City of West Torrens
City of Burnside
City of Mitcham
NORTH ROAD HIERARCHYLEGEND
Primary Arterial Road (State Government Road) Train Station
Tram Station
Bus Stops Secondary Arterial Road (State Government Road)
Major Collector Road
Railway Line (State Government Rail)
Tram Line (State Government Tram)
Local Crossing Collector Local Road
Unl
ey R
oad
Kin
g W
illia
m R
d
Duth
y St
Wattle StPark StMitchell St
Mills St
Forest Ave
Vict
oria
Ave
East
Ave
Fisher St
Ferguson Av
Leader St
Fulla
rton
Rd
Good
woo
d Rd
Greenhill Rd
Cross Rd
Anza
c Hwy
Sout
h Ro
ad
Glen Osmond Rd
Mike Turtur
Bikeway
6.2km to Glenelg
Marino RocksGreenway
12.5km to Marino
2km to Mitcham Precinct
Belair RailwayMarino R
ocks
Charles Walk
Albert St
Victoria St
Arthur St

City of Unley 31
CLARENCE PARKLALARENCE PAPUNLEY PARKPP
HYDE PARK
MALVERNLV
UNLEYLE
INGSSKIARKPA
BLACK FORESTF T
EVERARD PARKPAEVERARD PARK
FORESTVILLETVFORESTVILL
GOODWOODGOODWOD
WAYVILLEVILLELLEWAYVWAYVILLELL
PARKSIDEAR
FULLARTON
HIGHGATE MYRTLE BANKA
MILLSWOODSWOODMILLS
RAILWAY
CLDO
LLIN
G
KESWICK
BARRACKS
SHOWGROUNDS
WAYVILLE
AV
RD
AVSP
ENCE
AVRI
DGE
ALE
AVWAY
FERGUSON
BARR-SMITH
AV
AVMOORHOUSE
AVW
ASHI
NGTO
N
TYNE
PLCHARLES
PLM
ARY LNMARY
PLAMBER
MILLER
ROBE
RTS
ROBERTS
LAHUGHES
PLHU
GHES
CROSS RD
CTTH
BYBO
O
AV
SIDE
GLEN
AV
AV
STHONE
ST
CR
ST
FULL
ARTO
N
ST
OSMOND
GLEN
DUTH
Y
WATTLE
FISHER ST
ST
GEOR
GEST
UNLE
Y
STPARK
KING
WILL
IAM
RD
RD
AVGLENFERRIE
AVAUBURN
AVRINGAROOMA
AVCLINTON
FERGUSON RDRI
VERD
ALE
AVGL
ENRO
WAN
AVUR
RBRA
E
AVGL
ENFO
RD
AVM
YRTL
E
AVJE
NKIN
SAVHE
XHAM
ROSS
INGT
ON
WOO
LTAN
A
RDRO
DDAAV
BRAE
SIDE
BURN
HAM
RDBA
ULDE
RSTO
NE
AV
AV
AVW
ILGEN
A
RDSE
DGEF
ORD
AV
TCTA
LLAL
A
STBR
IDGE
BEAC
ONSF
IELD
STTE
NNAN
T
STM
ILTONST
HALL
RDAL
MA
STSE
AVIE
W
STFR
EW
STDA
RBY
STW
YCLIF
F
STAR
THUR
GRRALDONAV
PALMER AVLINDSAY
STHALLAMAVCULROSS
AVOSMONDPL
PICKERING
STWATSON
STM
OORE
STNE
LSON
TCW
ELLIN
GTON
AVRESTORMALSTARAGON
STKATHERINE
STMEDWAY
STAILSA
STAN
DERS
ON
AV
MARTENS
STFLORENCE
ST
STDAWSON
GLADSTONE
AVHA
MPS
TEAD
HIGH
GATE
AVRO
SEBE
RRY
AVST
AUNT
ON
ST
TCW
EST
STBA
LMOR
AL
AVSU
NNYM
EADE
STCR
OSS
TORR
ENS
AVFE
RN
WIN
DSOR
RUGB
Y
CAM
BRID
GE
AVEUSTON
AVINVERGOWRIE
STCARLTON
STCHURCH
RDAVENUE
AVYEO
TCNORTH
AV
TC
ST
ST
ST
ST
AVWHITE
AVWOODFIELD
FRANCIS
ST
ST
MALVERN
AUSTRAL
SHEFFIELD
DOVER
WINCHESTER
CHELTENHAM
MARLBOROUGH
ETON
CLIFTON
AVCO
OTRA
STGR
EVILL
ECA
STLE
TCLA
NGHA
M
TCTR
IMM
ER
TC
ST
CTAUDLEY
AVRANDOLPH
ST
AV
TC
ST
CREMORNE
FAIRFORD
EDMUND
OXFORD
FREDERICK
KENI
LWOR
TH
STNE
LLY
STM
YRA
ST
ST
DAVEYST
MACKLIN
ST
OXENBOULDAV
STYOUNG
STALFRED
PLST ANNS
ST
ST
STST HELENST
STOLIV E
STBIRKSST
PARINGA
RDCAMPBELL
ST
ST
ARNOLD
DUDLEY
RD
ST
ST
ST
ST
ST
STWALLIS
BLYTH
FOSTER
WILKINSON
SCOTT
HILL
FULLER
LEICESTER
ROBSART
STREGENT
STMARION
ST
MAUD ST
CULVERTSTWHITTHAM
CTBELGRAVE STELLA
STDUNKS
STTOWNSEND
STCLYDE
STCO
LLIN
S
AVTO
NDIE
RD
PORT
ER
STPI
NE
STAM
FORD
JAFF
REYAN
GLO
MON
TPEL
IER
DOUG
LAS
LISTO
N
PLBE
LLEV
UEST
VIEW
STGE
ORGE
PLRA
MO
STGR
OVE
AVW
HIST
LER
STKING
STHIGH
STTHORNBERAVHEYWOOD
PLADDISCOMBE
STNORTHGATE
STFASHODA
AVHATHERLEY STGREER
RDCOMMERCIAL
STJASPERSTPENONG
AVW
ARW
ICK
AVW
OODL
YN
STCA
ROON
A
AVHA
GUE
CHAR
RA
WES
TALL
WILL
IAM
KING
STNA
LPA
ST
ST
GULL
YSTM
ACKL
INSTEN
TERP
RISEST
MAN
NSTRDSTOX
FORD
AVW
OODH
URST
STBA
RROWGR
STRU
SSEL
LSTCL
AREN
CE
STHA
RLEY
AVRO
YAL
ESMONDE STRD
BEACONSFIELD
AVOPEY
AVHART
STMARY
RDM
ORNI
N
AVM
IZPA
H
STCA
ITHN
ESS
QUEE
N
STAU
STEL
LAV
BEEC
H
STRA
MAG
E
AVAS
H
AVOA
K
STPL
AVCL
ELAN
D
STER
SKIN
E
ST
ALLEN
THOMAS
AVMCGOWAN
ARTHUR STLA
DUNNSAVBIRDWOOD
STCHARLES
STWALTER
PLBOFFA
STBLOOMSBURY
ST
STALBERT
ST
PD
STHUGHES
BARTLEY
ST
MILLER
LA
LA
PL
IRW
IN
SALIS
BURY
PALM
ERSO
N
RDPA
LMER
STON
ST
PL
ROBE
RTS
STKI
LLIC
OAT
STYOUNG
TCROSE
LAWELLER
CL
ARUN
STO’
CONN
ELL
SCHOOL AV
WOOD LA LADAVENPORT
VICT
ORIA
AV
CLAR
K
RD
STKNEEBONE
STMANSFIELD
STDOLLMAN
UNION
GRACE
JOHN
STON
E
TC
CANTERBURY
CROSS RD
AVEA
ST
STMITCHELL
GOOD
WOO
DRD
STLEADER
AV
JELLICOE
STH
TC
NANTHEA
NTH
TC
NANTHEA
AVSE
YMOU
R
AVNI
NGAN
A
STEL
M
AVM
IEGU
NYAH
THWK
LAMBE AVGLEN
AVRUTLAND
GRASHLEIGHAVCEDAR
STNORTHGATE
AVLAWSON
CTPASCOE
AVVALMAI
STSTANLEYSTDI
XON
STAV
ONDA
LESTJA
MES
STTH
AMES
AVCH
URCH
ILL
ST
HAM
MON
D
STHENRYDR
OVERBURY
STGEORGE
AVBIRKDALE
FRANCIS
STCULLEYTC
PARKER
AVROSSLYN
STW
ILLIA
M
STFR
EDER
ICK
AVOA
KFIE
LD
STM
ARGA
RET
RDRI
PON
RDHO
MER
RDGO
RDON
AVLANGDON
AVLORRAINE
AVKELVIN
RDEMERSON
RDDRYDEN
RDCOWPER
RDBYRON
CT ISHPAR
TC
VARDON
HEATHCOTECR
STEV
A
STDO
UGLA
S
STW
OOD
STRE
GENT
AVAL
EXAN
DERST
PERC
Y
STMALCOLM
AVANDREW
AVWOOLDRIDGE
STAVENUE
STJARVIS
TCRE
ELLERSME
TCLO
NSD
AVRAVENSTHORPE
LLYOD
MILLSWOOD
PD
CROMER
AV
AV
ARUNDEL AV
AVAR
GYLE
AVNO
RTHB
ROOK
STSURREY
SOUTHST
DEVONPDE
LYONS
TC
RAILWAY
TC
AROHA
AVCU
RZON
AVGR
AHAM
STSP
IERS
AVFA
IRM
ONT
AVCO
ULTE
R
AVEG
LINGT
ONAV
DAVI
D
AVBU
SBY
AVW
ILSON
AVHA
RTLA
ND
STGR
AYAV
WIN
IFRED
AVSE
LKIR
K
MILLS
AVLYNTON
AVORMONDE
CRANBROOK AV
GRANTLEY AV
ADDISON
CTHILL
IRWIN
MEREDYTH
AVFAIRFAX
STDUNROBIN
AVERIC
AVMERLON
AVHACKETT
AVALLENBYAVLAUGHT
AVCHELMSFORD
VICTORIA
AVFOREST
AVLINCOLN
RDFIE
LDIN
G
RDGO
RDON
AVKE
RTA
WEE
TAAVOB
AN
TCTCRICHARDS
TCNAIRNE
STNICHOLS
TC
TC
NORMAN
STROSS
AVMASTERS
AVEURILPA
STHALE
EVERARD
AVORCHARD
AVNIBLEY
AVBERKLEY
AV
HILLSLEYAV
VE
GRO
AVOA
KLEY
STHA
MPT
ONSO
UTH
SOUT
HST
ESSE
X
STFO
STER
STNE
WM
AN
NORT
HSTHA
MPT
ONNORT
HST
ESSE
X
NORT
HST
DEVO
N
STET
HEL
STCH
ARLE
S
STLE
AH
AVFIR
ST
AVSE
COND
AVTH
IRD
FOUR
THAV
AVAF
RICA
INE
AVHA
LMON
NORTH
STBLACKET
TON
WE
STW
ELLE
R
STEL
IZAB
ETH
STFO
X
STHA
RDY
STHA
RVEY
STLE
WISST
RUSH
TON
STAD
A
STJO
HN
STFO
UNDR
YSTAL
MON
DST
ST
ST
ROGE
RS
MUS
GRAV
E
STH
AVLANOR
STLOUISA
ST
ST
CLIFTON
STANGUS
STOPHIR
STGILBERT
STLILY
STROSA STGURR
STOWENSTFLORENCE
STALBERT
STHINTON
SIMPSONSTBENDAL L
ST
TREVELYAN
MORESBY
JOSL
IN
AVRH
YL
STHOXTONSTPARSONS
STHUNTELE
ST
STSH
ORT
COTH
AM
STYOUNG
TCDAVENPORT
STLAROSETCROSE
AVMAPLE
WKWILBERFORCE
ST CHINNER
STSTAVSTSTSTTS
LAPARKLAGREENHILL
GREENHILL RD
TC ST
SOUT
HRD
ANZAC
HY
GTON
GA
S
COOK
E TC
GREENHILL RD
Adelaide Parklands
City of West Torrens
City of Burnside
City of Mitcham
NORTH ROAD HIERARCHYLEGEND
Primary Arterial Road (State Government Road) Train Station
Tram Station
Bus Stops Secondary Arterial Road (State Government Road)
Major Collector Road
Railway Line (State Government Rail)
Tram Line (State Government Tram)
Local Crossing Collector Local Road
Unl
ey R
oad
Kin
g W
illia
m R
d
Duth
y St
Wattle StPark StMitchell St
Mills St
Forest Ave
Vict
oria
Ave
East
Ave
Fisher St
Ferguson Av
Leader St
Fulla
rton
Rd
Good
woo
d Rd
Greenhill Rd
Cross Rd
Anza
c Hwy
Sout
h Ro
ad
Glen Osmond Rd
Mike Turtur
Bikeway
6.2km to Glenelg
Marino RocksGreenway
12.5km to Marino
2km to Mitcham Precinct
Belair RailwayMarino R
ocks
Charles Walk
Albert St
Victoria St
Arthur St
Figure 5-2: Road network
hierarchies

Transport Asset Management Plan32
CLARENCE PARKLALARENCE PAPUNLEY PARKPP
HYDE PARK
MALVERNLV
UNLEYLE
INGSSKIARKPA
BLACK FORESTF T
EVERARD PARKPAEVERARD PARK
FORESTVILLETVFORESTVILL
GOODWOODGOODWOD
WAYVILLEVILLELLEWAYVWAYVILLELL
PARKSIDEAR
FULLARTON
HIGHGATE MYRTLE BANKA
MILLSWOODSWOODMILLS
RAILWAY
CLDO
LLIN
G
KESWICK
BARRACKS
SHOWGROUNDS
WAYVILLE
AV
RD
AVSP
ENCE
AVRI
DGE
ALE
AVWAY
FERGUSON
BARR-SMITH
AV
AVMOORHOUSE
AVW
ASHI
NGTO
N
TYNE
PLCHARLES
PLM
ARY LNMARY
PLAMBER
MILLER
ROBE
RTS
ROBERTS
LAHUGHES
PLHU
GHES
CROSS RD
CTTH
BYBO
O
AV
SIDE
GLEN
AV
AV
STHONE
ST
CR
ST
FULL
ARTO
N
ST
OSMOND
GLEN
DUTH
Y
WATTLE
FISHER ST
ST
GEOR
GEST
UNLE
Y
STPARK
KING
WILL
IAM
RD
RDAVGLENFERRIE
AVAUBURN
AVRINGAROOMA
AVCLINTON
FERGUSON RDRI
VERD
ALE
AVGL
ENRO
WAN
AVUR
RBRA
E
AVGL
ENFO
RD
AVM
YRTL
E
AVJE
NKIN
SAVHE
XHAM
ROSS
INGT
ON
WOO
LTAN
A
RDRO
DDAAV
BRAE
SIDE
BURN
HAM
RDBA
ULDE
RSTO
NE
AV
AV
AVW
ILGEN
A
RDSE
DGEF
ORD
AV
TCTA
LLAL
A
STBR
IDGE
BEAC
ONSF
IELD
STTE
NNAN
T
STM
ILTONST
HALL
RDAL
MA
STSE
AVIE
W
STFR
EW
STDA
RBY
STW
YCLIF
F
STAR
THUR
GRRALDONAV
PALMER AVLINDSAY
STHALLAMAVCULROSS
AVOSMONDPL
PICKERING
STWATSON
STM
OORE
STNE
LSON
TCW
ELLIN
GTON
AVRESTORMALSTARAGON
STKATHERINE
STMEDWAY
STAILSA
STAN
DERS
ON
AV
MARTENS
STFLORENCE
ST
STDAWSON
GLADSTONE
AVHA
MPS
TEAD
HIGH
GATE
AVRO
SEBE
RRY
AVST
AUNT
ON
ST
TCW
EST
STBA
LMOR
AL
AVSU
NNYM
EADE
STCR
OSS
TORR
ENS
AVFE
RN
WIN
DSOR
RUGB
Y
CAM
BRID
GE
AVEUSTON
AVINVERGOWRIE
STCARLTON
STCHURCH
RDAVENUE
AVYEO
TCNORTH
AV
TC
ST
ST
ST
ST
AVWHITE
AVWOODFIELD
FRANCIS
ST
ST
MALVERN
AUSTRAL
SHEFFIELD
DOVER
WINCHESTER
CHELTENHAM
MARLBOROUGH
ETON
CLIFTON
AVCO
OTRA
STGR
EVILL
ECA
STLE
TCLA
NGHA
M
TCTR
IMM
ER
TC
ST
CTAUDLEY
AVRANDOLPH
ST
AV
TC
ST
CREMORNE
FAIRFORD
EDMUND
OXFORD
FREDERICK
KENI
LWOR
TH
STNE
LLY
STM
YRA
ST
ST
DAVEYST
MACKLIN
ST
OXENBOULDAV
STYOUNG
STALFRED
PLST ANNS
ST
ST
STST HELENST
STOLIV E
STBIRKSST
PARINGA
RDCAMPBELL
ST
ST
ARNOLD
DUDLEY
RD
ST
ST
ST
ST
ST
STWALLIS
BLYTH
FOSTER
WILKINSON
SCOTT
HILL
FULLER
LEICESTER
ROBSART
STREGENT
STMARION
ST
MAUD ST
CULVERTSTWHITTHAM
CTBELGRAVE STELLA
STDUNKS
STTOWNSEND
STCLYDE
STCO
LLIN
S
AVTO
NDIE
RD
PORT
ER
STPI
NE
STAM
FORD
JAFF
REYAN
GLO
MON
TPEL
IER
DOUG
LAS
LISTO
N
PLBE
LLEV
UEST
VIEW
STGE
ORGE
PLRA
MO
STGR
OVE
AVW
HIST
LER
STKING
STHIGH
STTHORNBERAVHEYWOOD
PLADDISCOMBE
STNORTHGATE
STFASHODA
AVHATHERLEY STGREER
RDCOMMERCIAL
STJASPERSTPENONG
AVW
ARW
ICK
AVW
OODL
YN
STCA
ROON
A
AVHA
GUE
CHAR
RA
WES
TALL
WILL
IAM
KING
STNA
LPA
ST
ST
GULL
YSTM
ACKL
INSTEN
TERP
RISEST
MAN
NSTRDSTOX
FORD
AVW
OODH
URST
STBA
RROWGR
STRU
SSEL
LSTCL
AREN
CE
STHA
RLEY
AVRO
YAL
ESMONDE STRD
BEACONSFIELD
AVOPEY
AVHART
STMARY
RDM
ORNI
N
AVM
IZPA
H
STCA
ITHN
ESS
QUEE
N
STAU
STEL
LAV
BEEC
H
STRA
MAG
E
AVAS
H
AVOA
K
STPL
AVCL
ELAN
D
STER
SKIN
E
ST
ALLEN
THOMAS
AVMCGOWAN
ARTHUR STLA
DUNNSAVBIRDWOOD
STCHARLES
STWALTER
PLBOFFA
STBLOOMSBURY
ST
STALBERT
ST
PD
STHUGHES
BARTLEY
ST
MILLER
LA
LA
PL
IRW
IN
SALIS
BURY
PALM
ERSO
N
RDPA
LMER
STON
ST
PL
ROBE
RTS
STKI
LLIC
OAT
STYOUNG
TCROSE
LAWELLER
CL
ARUN
STO’
CONN
ELL
SCHOOL AV
WOOD LA LADAVENPORT
VICT
ORIA
AV
CLAR
K
RD
STKNEEBONE
STMANSFIELD
STDOLLMAN
UNION
GRACE
JOHN
STON
E
TC
CANTERBURY
CROSS RD
AVEA
ST
STMITCHELL
GOOD
WOO
DRD
STLEADER
AV
JELLICOE
STH
TC
NANTHEA
NTH
TC
NANTHEA
AVSE
YMOU
R
AVNI
NGAN
A
STEL
M
AVM
IEGU
NYAH
THWK
LAMBE AVGLEN
AVRUTLAND
GRASHLEIGHAVCEDAR
STNORTHGATE
AVLAWSON
CTPASCOE
AVVALMAI
STSTANLEYSTDI
XON
STAV
ONDA
LESTJA
MES
STTH
AMES
AVCH
URCH
ILL
ST
HAM
MON
D
STHENRYDR
OVERBURY
STGEORGE
AVBIRKDALE
FRANCIS
STCULLEYTC
PARKER
AVROSSLYN
STW
ILLIA
M
STFR
EDER
ICK
AVOA
KFIE
LD
STM
ARGA
RET
RDRI
PON
RDHO
MER
RDGO
RDON
AVLANGDON
AVLORRAINE
AVKELVIN
RDEMERSON
RDDRYDEN
RDCOWPER
RDBYRON
CT ISHPAR
TC
VARDON
HEATHCOTECR
STEV
A
STDO
UGLA
S
STW
OOD
STRE
GENT
AVAL
EXAN
DERST
PERC
YSTMALCOLM
AVANDREW
AVWOOLDRIDGE
STAVENUE
STJARVIS
TCRE
ELLERSME
TCLO
NSD
AVRAVENSTHORPE
LLYOD
MILLSWOOD
PD
CROMER
AV
AV
ARUNDEL AV
AVAR
GYLE
AVNO
RTHB
ROOK
STSURREY
SOUTHST
DEVONPDE
LYONS
TC
RAILWAY
TC
AROHA
AVCU
RZON
AVGR
AHAM
STSP
IERS
AVFA
IRM
ONT
AVCO
ULTE
R
AVEG
LINGT
ONAV
DAVI
D
AVBU
SBY
AVW
ILSON
AVHA
RTLA
ND
STGR
AYAV
WIN
IFRED
AVSE
LKIR
K
MILLS
AVLYNTON
AVORMONDE
CRANBROOK AV
GRANTLEY AV
ADDISON
CTHILL
IRWIN
MEREDYTH
AVFAIRFAX
STDUNROBIN
AVERIC
AVMERLON
AVHACKETT
AVALLENBYAVLAUGHT
AVCHELMSFORD
VICTORIA
AVFOREST
AVLINCOLN
RDFIE
LDIN
G
RDGO
RDON
AVKE
RTA
WEE
TAAVOB
AN
TCTCRICHARDS
TCNAIRNE
STNICHOLS
TC
TC
NORMAN
STROSS
AVMASTERS
AVEURILPA
STHALE
EVERARD
AVORCHARD
AVNIBLEY
AVBERKLEY
AV
HILLSLEYAV
VE
GRO
AVOA
KLEY
STHA
MPT
ONSO
UTH
SOUT
HST
ESSE
X
STFO
STER
STNE
WM
AN
NORT
HSTHA
MPT
ONNORT
HST
ESSE
X
NORT
HST
DEVO
N
STET
HEL
STCH
ARLE
S
STLE
AH
AVFIR
ST
AVSE
COND
AVTH
IRD
FOUR
THAV
AVAF
RICA
INE
AVHA
LMON
NORTH
STBLACKET
TON
WE
STW
ELLE
R
STEL
IZAB
ETH
STFO
X
STHA
RDY
STHA
RVEY
STLE
WISST
RUSH
TON
STAD
A
STJO
HN
STFO
UNDR
YSTAL
MON
DST
ST
ST
ROGE
RS
MUS
GRAV
E
STH
AVLANOR
STLOUISA
ST
ST
CLIFTON
STANGUS
STOPHIR
STGILBERT
STLILY
STROSA STGURR
STOWENSTFLORENCE
STALBERT
STHINTON
SIMPSONSTBENDAL L
ST
TREVELYAN
MORESBY
JOSL
IN
AVRH
YL
STHOXTONSTPARSONS
STHUNTELE
ST
STSH
ORT
COTH
AM
STYOUNG
TCDAVENPORT
STLAROSETCROSE
AVMAPLE
WKWILBERFORCE
ST CHINNER
STSTAVSTSTSTTS
LAPARKLAGREENHILL
GREENHILL RD
TC ST
SOUT
HRD
ANZAC
HY
GTON
GA
S
COOK
E TC
GREENHILL RD
Ferguson Ave
Mike Turtur Bikeway
Main Road Routes
Glen Osmond Trail
Secondary Routes
Rugby/Porter Bikeway
Low Vehicle Traffic Routes
Neighbouring Route
Pedestrian Crossing
Marino Rocks Greenway
UNLEY CYCLING ROUTES
LEGENDRidge Park Barr-smith Ave,Myrtle BankScammell ReserveFisher St, Myrtle Bank
Fullarton Park/Commu-nity CentreCnr Fisher St +Fullarton Rd, Fullarton
Howard Florey ReserveCampbell Rd, Parkside
Village Green Rugby St, Unley
Orphanage ParkMitchell St, Millswood
Goodwood OvalCurzon Ave, Millswood
Princess Margaret Park Byron Rd, Black Forest
Henry Codd ReserveCnr Maud St + Windsor St, Parkside
North Unley ParkYoung St, Goodwood
Soutar ParkAlbert St, Goodwood
Forestville ReserveEthel St, Forestville
Everard Park ReserveHillsley Ave, Everard Park Soldiers Memorial Gardens
Public Toilets
Shopping Precinct
Playspace
Goodwood Rd Precinct Retail/Library
King William Rd Precinct
Unley Rd Precinct Retail/Library/Civic
Fullarton Rd Precinct
Glen Osmond Precinct
Median Refuge
Rail Crossing
Unley OvalTrimmer Tce, Unley
Heywood Park, Addiscombe Pl, Unley Park
Dora Gild ParkChurchill Ave, Clarence Park
Page ParkCnr Cross Rd + East Ave, Clarence Park
20
20
21
22
23
23
21
22
01
02
01
02
03
03
04
07
10
13
16
1310
07
04
05
08
11
14
14
17
18
18
19
19
17
11
08
05
06
09
12
15
15
09
06
Unl
ey R
oad
Kin
g W
illia
m R
d
Duth
y St
Josl
in S
t
Cros
s St
Hig
hgat
e St
Wes
t Tce
Wattle St
Maud St
Winchester St
Avenue Rd
Park StMitchell St
Rugb
y/Po
rter
Bik
eway
Vict
oria
Ave
East
Ave
Sasmee Ln
Avenue St
Angus St
Thomas St
Young St
Victoria St
Albert St
Wel
ler
St
Wes
tall
St
Gray
St
Gord
on R
d
Ormonde Ave
Commercial Rd
Leader St
Young St Young St
Cast
le S
t
Ross
ingt
on A
ve
Fulla
rton
Rd
Good
woo
d Rd
Greenhill Rd
Cross Rd
Anza
c Hwy
Sout
h Ro
ad
Glen Osmond RdMike Turtur
Bikeway
6.2km to Glenelg
Marino RocksGreenway
12.5km to Marino
2km to Mitcham Precinct
Belair RailwayMarino R
ocks
Charles Walk
Win
dsor
St
Wilberforce Walk
Adelaide Parklands
City of West Torrens
City of Mitcham
City of Burnside
NORTH
3km to Rundle Mall Precinct
3.7km East Tce Precinct
4km ParadePrecinct
12.5km to Adelaide Hills
Stirling
3.5km to North Terrace Precinct
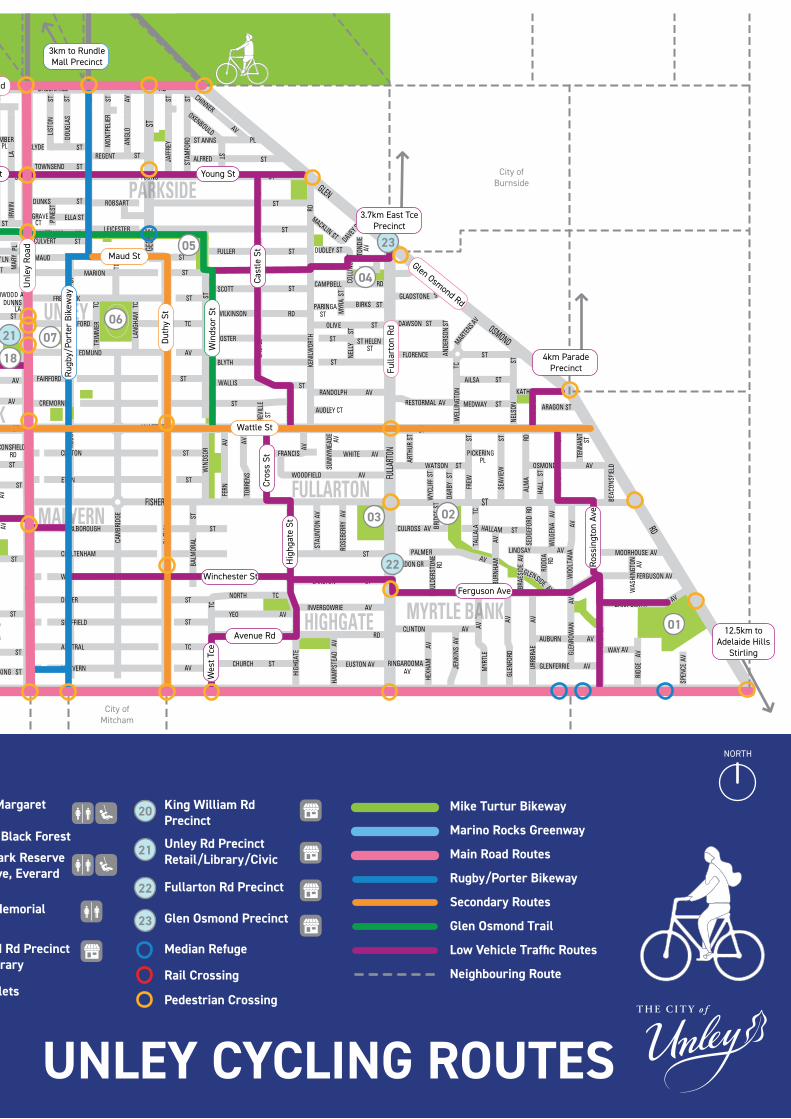
City of Unley 33
Figure 5-3: Cycle network
CLARENCE PARKLALARENCE PAPUNLEY PARKPP
HYDE PARK
MALVERNLV
UNLEYLE
INGSSKIARKPA
BLACK FORESTF T
EVERARD PARKPAEVERARD PARK
FORESTVILLETVFORESTVILL
GOODWOODGOODWOD
WAYVILLEVILLELLEWAYVWAYVILLELL
PARKSIDEAR
FULLARTON
HIGHGATE MYRTLE BANKA
MILLSWOODSWOODMILLS
RAILWAY
CLDO
LLIN
G
KESWICK
BARRACKS
SHOWGROUNDS
WAYVILLE
AV
RD
AVSP
ENCE
AVRI
DGE
ALE
AVWAY
FERGUSON
BARR-SMITH
AV
AVMOORHOUSE
AVW
ASHI
NGTO
N
TYNE
PLCHARLES
PLM
ARY LNMARY
PLAMBER
MILLER
ROBE
RTS
ROBERTS
LAHUGHES
PLHU
GHES
CROSS RD
CTTH
BYBO
O
AV
SIDE
GLEN
AV
AV
STHONE
ST
CR
ST
FULL
ARTO
N
ST
OSMOND
GLEN
DUTH
Y
WATTLE
FISHER ST
ST
GEOR
GEST
UNLE
Y
STPARK
KING
WILL
IAM
RD
RD
AVGLENFERRIE
AVAUBURN
AVRINGAROOMA
AVCLINTON
FERGUSON RDRI
VERD
ALE
AVGL
ENRO
WAN
AVUR
RBRA
E
AVGL
ENFO
RD
AVM
YRTL
E
AVJE
NKIN
SAVHE
XHAM
ROSS
INGT
ON
WOO
LTAN
A
RDRO
DDAAV
BRAE
SIDE
BURN
HAM
RDBA
ULDE
RSTO
NE
AV
AV
AVW
ILGEN
A
RDSE
DGEF
ORD
AV
TCTA
LLAL
A
STBR
IDGE
BEAC
ONSF
IELD
STTE
NNAN
T
STM
ILTONST
HALL
RDAL
MA
STSE
AVIE
W
STFR
EW
STDA
RBY
STW
YCLIF
F
STAR
THUR
GRRALDONAV
PALMER AVLINDSAY
STHALLAMAVCULROSS
AVOSMONDPL
PICKERING
STWATSON
STM
OORE
STNE
LSON
TCW
ELLIN
GTON
AVRESTORMALSTARAGON
STKATHERINE
STMEDWAY
STAILSA
STAN
DERS
ON
AV
MARTENS
STFLORENCE
ST
STDAWSON
GLADSTONE
AVHA
MPS
TEAD
HIGH
GATE
AVRO
SEBE
RRY
AVST
AUNT
ON
ST
TCW
EST
STBA
LMOR
AL
AVSU
NNYM
EADE
STCR
OSS
TORR
ENS
AVFE
RN
WIN
DSOR
RUGB
Y
CAM
BRID
GE
AVEUSTON
AVINVERGOWRIE
STCARLTON
STCHURCH
RDAVENUE
AVYEO
TCNORTH
AV
TC
ST
ST
ST
ST
AVWHITE
AVWOODFIELD
FRANCIS
ST
ST
MALVERN
AUSTRAL
SHEFFIELD
DOVER
WINCHESTER
CHELTENHAM
MARLBOROUGH
ETON
CLIFTON
AVCO
OTRA
STGR
EVILL
ECA
STLE
TCLA
NGHA
M
TCTR
IMM
ER
TC
ST
CTAUDLEY
AVRANDOLPH
ST
AV
TC
ST
CREMORNE
FAIRFORD
EDMUND
OXFORD
FREDERICKKE
NILW
ORTH
STNE
LLY
STM
YRA
ST
ST
DAVEYST
MACKLIN
ST
OXENBOULDAV
STYOUNG
STALFRED
PLST ANNS
ST
ST
STST HELENST
STOLIV E
STBIRKSST
PARINGA
RDCAMPBELL
ST
ST
ARNOLD
DUDLEY
RD
ST
ST
ST
ST
ST
STWALLIS
BLYTH
FOSTER
WILKINSON
SCOTT
HILL
FULLER
LEICESTER
ROBSART
STREGENT
STMARION
ST
MAUD ST
CULVERTSTWHITTHAM
CTBELGRAVE STELLA
STDUNKS
STTOWNSEND
STCLYDE
STCO
LLIN
S
AVTO
NDIE
RD
PORT
ER
STPI
NE
STAM
FORD
JAFF
REYAN
GLO
MON
TPEL
IER
DOUG
LAS
LISTO
N
PLBE
LLEV
UEST
VIEW
STGE
ORGE
PLRA
MO
STGR
OVE
AVW
HIST
LER
STKING
STHIGH
STTHORNBERAVHEYWOOD
PLADDISCOMBE
STNORTHGATE
STFASHODA
AVHATHERLEY STGREER
RDCOMMERCIAL
STJASPERSTPENONG
AVW
ARW
ICK
AVW
OODL
YN
STCA
ROON
A
AVHA
GUE
CHAR
RA
WES
TALL
WILL
IAM
KING
STNA
LPA
ST
ST
GULL
YSTM
ACKL
INSTEN
TERP
RISEST
MAN
NSTRDSTOX
FORD
AVW
OODH
URST
STBA
RROWGR
STRU
SSEL
LSTCL
AREN
CE
STHA
RLEY
AVRO
YAL
ESMONDE STRD
BEACONSFIELD
AVOPEY
AVHART
STMARY
RDM
ORNI
N
AVM
IZPA
H
STCA
ITHN
ESS
QUEE
N
STAU
STEL
LAV
BEEC
H
STRA
MAG
E
AVAS
H
AVOA
K
STPL
AVCL
ELAN
D
STER
SKIN
E
ST
ALLEN
THOMAS
AVMCGOWAN
ARTHUR STLA
DUNNSAVBIRDWOOD
STCHARLES
STWALTER
PLBOFFA
STBLOOMSBURY
ST
STALBERT
ST
PD
STHUGHES
BARTLEY
ST
MILLER
LA
LA
PL
IRW
IN
SALIS
BURY
PALM
ERSO
N
RDPA
LMER
STON
ST
PL
ROBE
RTS
STKI
LLIC
OAT
STYOUNG
TCROSE
LAWELLER
CL
ARUN
STO’
CONN
ELL
SCHOOL AV
WOOD LA LADAVENPORT
VICT
ORIA
AV
CLAR
K
RD
STKNEEBONE
STMANSFIELD
STDOLLMAN
UNION
GRACE
JOHN
STON
E
TC
CANTERBURY
CROSS RD
AVEA
ST
STMITCHELL
GOOD
WOO
DRD
STLEADER
AV
JELLICOE
STH
TC
NANTHEA
NTH
TC
NANTHEA
AVSE
YMOU
R
AVNI
NGAN
A
STEL
M
AVM
IEGU
NYAH
THWK
LAMBE AVGLEN
AVRUTLAND
GRASHLEIGHAVCEDAR
STNORTHGATE
AVLAWSON
CTPASCOE
AVVALMAI
STSTANLEYSTDI
XON
STAV
ONDA
LESTJA
MES
STTH
AMES
AVCH
URCH
ILL
ST
HAM
MON
D
STHENRYDR
OVERBURY
STGEORGE
AVBIRKDALE
FRANCIS
STCULLEYTC
PARKER
AVROSSLYN
STW
ILLIA
M
STFR
EDER
ICK
AVOA
KFIE
LD
STM
ARGA
RET
RDRI
PON
RDHO
MER
RDGO
RDON
AVLANGDON
AVLORRAINE
AVKELVIN
RDEMERSON
RDDRYDEN
RDCOWPER
RDBYRON
CT ISHPAR
TC
VARDON
HEATHCOTECR
STEV
A
STDO
UGLA
S
STW
OOD
STRE
GENT
AVAL
EXAN
DERST
PERC
Y
STMALCOLM
AVANDREW
AVWOOLDRIDGE
STAVENUE
STJARVIS
TCRE
ELLERSME
TCLO
NSD
AVRAVENSTHORPE
LLYOD
MILLSWOOD
PD
CROMER
AV
AV
ARUNDEL AV
AVAR
GYLE
AVNO
RTHB
ROOK
STSURREY
SOUTHST
DEVONPDE
LYONS
TC
RAILWAY
TC
AROHA
AVCU
RZON
AVGR
AHAM
STSP
IERS
AVFA
IRM
ONT
AVCO
ULTE
R
AVEG
LINGT
ONAV
DAVI
D
AVBU
SBY
AVW
ILSON
AVHA
RTLA
ND
STGR
AYAV
WIN
IFRED
AVSE
LKIR
K
MILLS
AVLYNTON
AVORMONDE
CRANBROOK AV
GRANTLEY AV
ADDISON
CTHILL
IRWIN
MEREDYTH
AVFAIRFAX
STDUNROBIN
AVERIC
AVMERLON
AVHACKETT
AVALLENBYAVLAUGHT
AVCHELMSFORD
VICTORIA
AVFOREST
AVLINCOLN
RDFIE
LDIN
G
RDGO
RDON
AVKE
RTA
WEE
TAAVOB
AN
TCTCRICHARDS
TCNAIRNE
STNICHOLS
TC
TC
NORMAN
STROSS
AVMASTERS
AVEURILPA
STHALE
EVERARD
AVORCHARD
AVNIBLEY
AVBERKLEY
AV
HILLSLEYAV
VE
GRO
AVOA
KLEY
STHA
MPT
ONSO
UTH
SOUT
HST
ESSE
X
STFO
STER
STNE
WM
AN
NORT
HSTHA
MPT
ONNORT
HST
ESSE
X
NORT
HST
DEVO
N
STET
HEL
STCH
ARLE
S
STLE
AH
AVFIR
ST
AVSE
COND
AVTH
IRD
FOUR
THAV
AVAF
RICA
INE
AVHA
LMON
NORTH
STBLACKET
TON
WE
STW
ELLE
R
STEL
IZAB
ETH
STFO
X
STHA
RDY
STHA
RVEY
STLE
WISST
RUSH
TON
STAD
A
STJO
HN
STFO
UNDR
YSTAL
MON
DST
ST
ST
ROGE
RS
MUS
GRAV
E
STH
AVLANOR
STLOUISA
ST
ST
CLIFTON
STANGUS
STOPHIR
STGILBERT
STLILY
STROSA STGURR
STOWENSTFLORENCE
STALBERT
STHINTON
SIMPSONSTBENDAL L
ST
TREVELYAN
MORESBY
JOSL
IN
AVRH
YL
STHOXTONSTPARSONS
STHUNTELE
ST
STSH
ORT
COTH
AM
STYOUNG
TCDAVENPORT
STLAROSETCROSE
AVMAPLE
WKWILBERFORCE
ST CHINNER
STSTAVSTSTSTTS
LAPARKLAGREENHILL
GREENHILL RD
TC ST
SOUT
HRD
ANZAC
HY
GTON
GA
S
COOK
E TC
GREENHILL RD
Ferguson Ave
Mike Turtur Bikeway
Main Road Routes
Glen Osmond Trail
Secondary Routes
Rugby/Porter Bikeway
Low Vehicle Traffic Routes
Neighbouring Route
Pedestrian Crossing
Marino Rocks Greenway
UNLEY CYCLING ROUTES
LEGENDRidge Park Barr-smith Ave,Myrtle BankScammell ReserveFisher St, Myrtle Bank
Fullarton Park/Commu-nity CentreCnr Fisher St +Fullarton Rd, Fullarton
Howard Florey ReserveCampbell Rd, Parkside
Village Green Rugby St, Unley
Orphanage ParkMitchell St, Millswood
Goodwood OvalCurzon Ave, Millswood
Princess Margaret Park Byron Rd, Black Forest
Henry Codd ReserveCnr Maud St + Windsor St, Parkside
North Unley ParkYoung St, Goodwood
Soutar ParkAlbert St, Goodwood
Forestville ReserveEthel St, Forestville
Everard Park ReserveHillsley Ave, Everard Park Soldiers Memorial Gardens
Public Toilets
Shopping Precinct
Playspace
Goodwood Rd Precinct Retail/Library
King William Rd Precinct
Unley Rd Precinct Retail/Library/Civic
Fullarton Rd Precinct
Glen Osmond Precinct
Median Refuge
Rail Crossing
Unley OvalTrimmer Tce, Unley
Heywood Park, Addiscombe Pl, Unley Park
Dora Gild ParkChurchill Ave, Clarence Park
Page ParkCnr Cross Rd + East Ave, Clarence Park
20
20
21
22
23
23
21
22
01
02
01
02
03
03
04
07
10
13
16
1310
07
04
05
08
11
14
14
17
18
18
19
19
17
11
08
05
06
09
12
15
15
09
06
Unl
ey R
oad
Kin
g W
illia
m R
d
Duth
y St
Josl
in S
t
Cros
s St
Hig
hgat
e St
Wes
t Tce
Wattle St
Maud St
Winchester St
Avenue Rd
Park StMitchell St
Rugb
y/Po
rter
Bik
eway
Vict
oria
Ave
East
Ave
Sasmee Ln
Avenue St
Angus St
Thomas St
Young St
Victoria St
Albert St
Wel
ler
St
Wes
tall
St
Gray
St
Gord
on R
d
Ormonde Ave
Commercial Rd
Leader St
Young St Young St
Cast
le S
t
Ross
ingt
on A
ve
Fulla
rton
Rd
Good
woo
d Rd
Greenhill Rd
Cross Rd
Anza
c Hwy
Sout
h Ro
ad
Glen Osmond RdMike Turtur
Bikeway
6.2km to Glenelg
Marino RocksGreenway
12.5km to Marino
2km to Mitcham Precinct
Belair RailwayMarino R
ocks
Charles Walk
Win
dsor
St
Wilberforce Walk
Adelaide Parklands
City of West Torrens
City of Mitcham
City of Burnside
NORTH
3km to Rundle Mall Precinct
3.7km East Tce Precinct
4km ParadePrecinct
12.5km to Adelaide Hills
Stirling
3.5km to North Terrace Precinct

Transport Asset Management Plan34
5.1.1 Physical ParametersFigure 5-2 and 5-3 define Council’s road and cycling networks, which inform strategic decision making and levels of service to optimise transport network supporting safe and efficient movement.
Council maintains a higher level of service within our main street precincts. These are active and economically prosperous public spaces which support community interaction and gathering. The upgraded King William Road precinct is an example of a higher level of service. The project was designed through surveys, research, discussions and feedback from the community to deliver social, environmental and economic benefits on top of the scheduled asset renewal. The project included renewal of the road pavement, stormwater and footpaths, planting of over 80 mature trees to create a cooler environment, installation of LED lighting and the introduction of over 70 flexible street spaces for on street parking, outdoor dining and other activations. The design features key safety improvements including two additional pedestrian crossings whilst respecting the precinct’s distinctive village character and heritage. Council recognises these improved levels of service required higher operational and maintenance resourcing and a King William Road maintenance guideline was created with this project to inform future operational costs. Similarly design guidelines for our other main street precincts such as Unley Road are being created to inform their unique levels of service.
5.1.2 Asset ConditionThe objective of a condition assessment is to provide sufficient information on asset condition to allow informed strategic asset planning and asset management decisions to be made. The condition rating is based on the collected asset audits undertaken through visual inspections.
Condition assessments are undertaken every three to five years, Table 5-1 outlines the frequency of these assessments by asset category:
ASSET CATEGORY
LAST CONDITION ASSESSMENT
NEXT CONDITION ASSESSMENT
Bridges 2017 2021
Bus Stops 2020 2024
Car Parks 2020 2024
Kerbing 2017 2022
Pathway 2020 2024
Road 2017 2022
Street Lighting 2020 2024
Traffic Control 2020 2024
Table 5-1: Condition assessment schedule
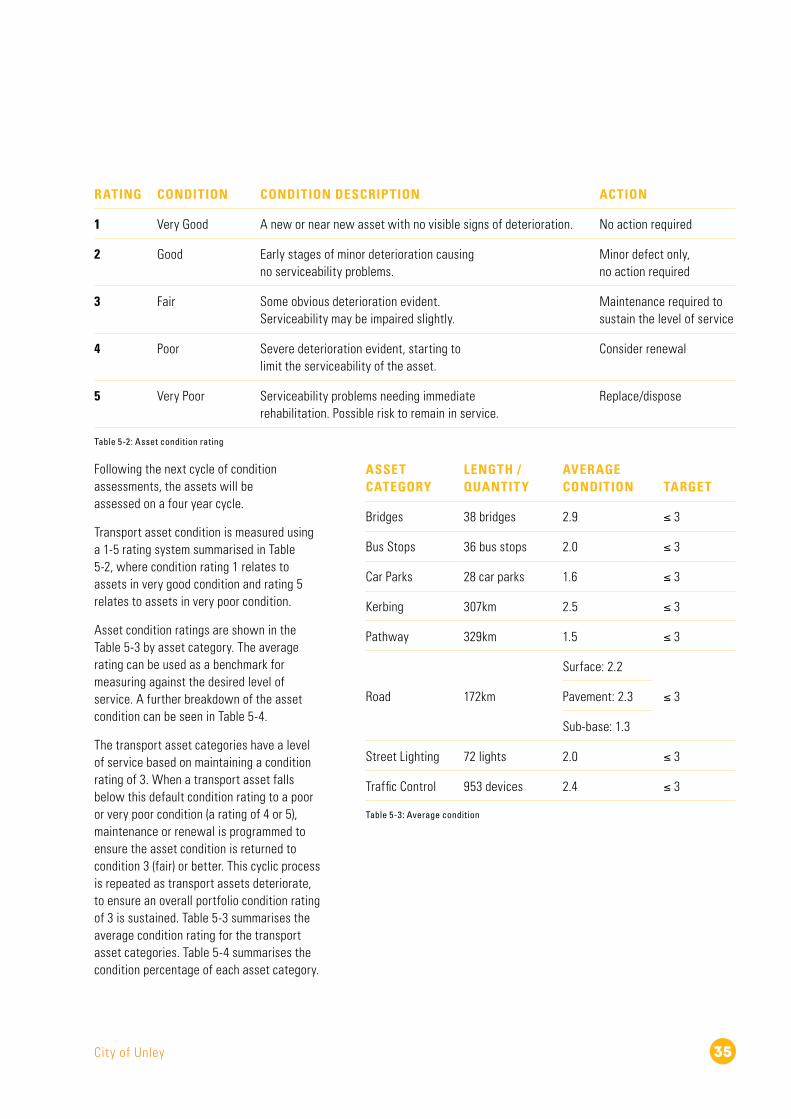
City of Unley 35
RATING CONDITION CONDITION DESCRIPTION ACTION
1 Very Good A new or near new asset with no visible signs of deterioration. No action required
2 Good Early stages of minor deterioration causing no serviceability problems.
Minor defect only, no action required
3 Fair Some obvious deterioration evident. Serviceability may be impaired slightly.
Maintenance required to sustain the level of service
4 Poor Severe deterioration evident, starting to limit the serviceability of the asset.
Consider renewal
5 Very Poor Serviceability problems needing immediate rehabilitation. Possible risk to remain in service.
Replace/dispose
Table 5-2: Asset condition rating
Following the next cycle of condition assessments, the assets will be assessed on a four year cycle.
Transport asset condition is measured using a 1-5 rating system summarised in Table 5-2, where condition rating 1 relates to assets in very good condition and rating 5 relates to assets in very poor condition.
Asset condition ratings are shown in the Table 5-3 by asset category. The average rating can be used as a benchmark for measuring against the desired level of service. A further breakdown of the asset condition can be seen in Table 5-4.
The transport asset categories have a level of service based on maintaining a condition rating of 3. When a transport asset falls below this default condition rating to a poor or very poor condition (a rating of 4 or 5), maintenance or renewal is programmed to ensure the asset condition is returned to condition 3 (fair) or better. This cyclic process is repeated as transport assets deteriorate, to ensure an overall portfolio condition rating of 3 is sustained. Table 5-3 summarises the average condition rating for the transport asset categories. Table 5-4 summarises the condition percentage of each asset category.
ASSET CATEGORY
LENGTH / QUANTITY
AVERAGE CONDITION TARGET
Bridges 38 bridges 2.9 ≤ 3
Bus Stops 36 bus stops 2.0 ≤ 3
Car Parks 28 car parks 1.6 ≤ 3
Kerbing 307km 2.5 ≤ 3
Pathway 329km 1.5 ≤ 3
Road 172km
Surface: 2.2
≤ 3Pavement: 2.3
Sub-base: 1.3
Street Lighting 72 lights 2.0 ≤ 3
Traffic Control 953 devices 2.4 ≤ 3
Table 5-3: Average condition

Transport Asset Management Plan36
ASSET CATEGORY
CONDITION 1
CONDITION 2
CONDITION 3
CONDITION 4
CONDITION 5
Bridges 8% 15% 50% 26% 2%
Bus Stops 22% 58% 17% 3% 0%
Car Parks 25% 75% 0% 0% 0%
Kerbing 17% 30% 44% 5% 4%
Pathway 57% 40% 2% 1% 0%
Road:
◗ Surface
◗ Pavement
◗ Sub-base
23%
4%
60%
31%
58%
33%
29%
32%
5%
11%
5%
1%
6%
1%
0%
Street Lighting 17% 72% 10% 1% 0%
Traffic Control 2% 63% 33% 3% 0%
TOTAL 24% 48% 22% 6% 1%
Table 5-4: Condition percentage

City of Unley 37
5.1.3 Useful Life
A summary of useful life is further defined into asset groups in Table 5-5:
ASSET CATEGORY
ASSET GROUP
USEFUL LIFE (YEARS)
Bridges Pedestrian Bridge 50–100
Bridges Road Bridge 50–100
Bus Stops Shelter 30
Car Parks Surface 15–40
Car Parks Pavement 80
Car Parks Sub-base 100
Kerbing Kerbing 35–100
Kerbing Spoon Drain 80
Pathway Boardwalk 10–20
Pathway Footpath 15–50
Pathway Reserve Path 10–50
Pathway Shared Use Path 30–50
Road Surface 25–35
Road Pavement 20–100
Road Sub-base 25–400
Street Lighting Street Lighting 20–40
Traffic Control Crossing 20–40
Traffic Control Dead End 40
Traffic Control One Way 40
Traffic Control Protuberance 30–40
Traffic Control Roundabout 40
Traffic Control Slow Point 30–40
Traffic Control Speed Hump 15–40
Traffic Control Traffic Control 20–50
Traffic Control Traffic Lights 40
Table 5-5: Asset useful life
The impact of climate change to infrastructure assets useful life is not yet quantified and may continue to change as increased temperature, heatwaves, higher storm and rainfall intensities will increasingly affect the useful life of infrastructure at a material level. These impacts have been identified in risk management and future demands.
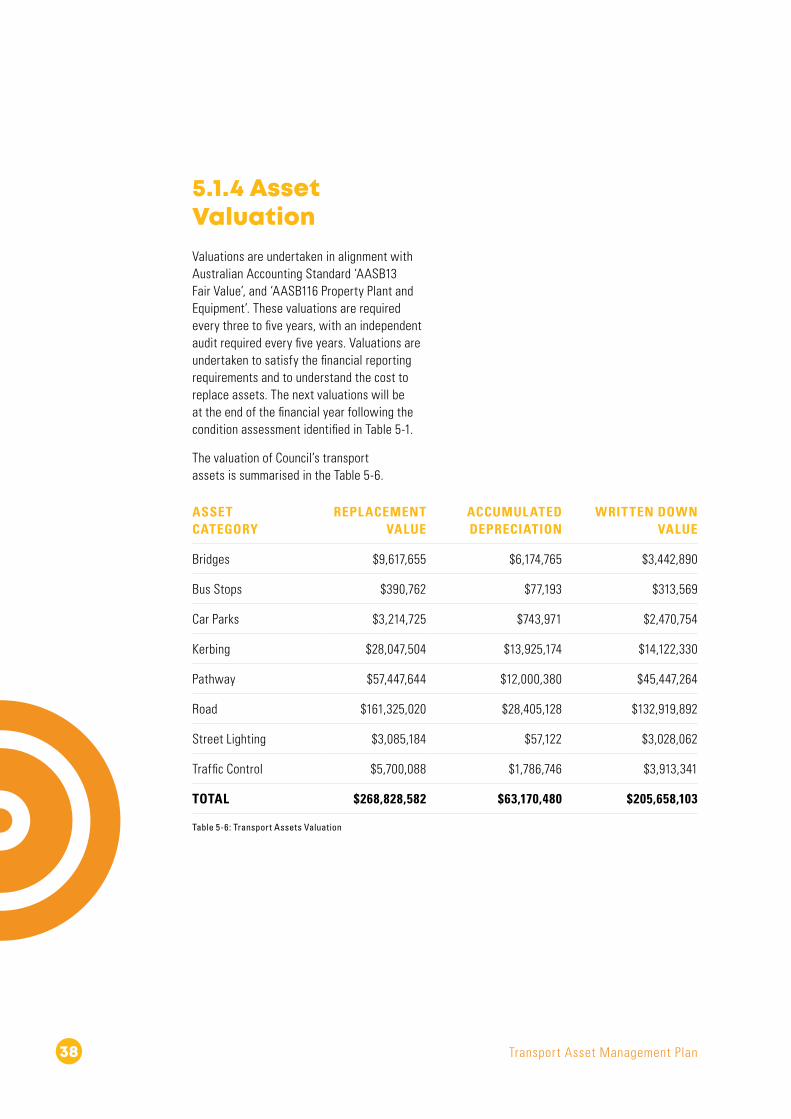
Transport Asset Management Plan38
5.1.4 Asset ValuationValuations are undertaken in alignment with Australian Accounting Standard ‘AASB13 Fair Value’, and ‘AASB116 Property Plant and Equipment’. These valuations are required every three to five years, with an independent audit required every five years. Valuations are undertaken to satisfy the financial reporting requirements and to understand the cost to replace assets. The next valuations will be at the end of the financial year following the condition assessment identified in Table 5-1.
The valuation of Council’s transport assets is summarised in the Table 5-6.
ASSET CATEGORY
REPLACEMENT VALUE
ACCUMULATED DEPRECIATION
WRITTEN DOWN VALUE
Bridges $9,617,655 $6,174,765 $3,442,890
Bus Stops $390,762 $77,193 $313,569
Car Parks $3,214,725 $743,971 $2,470,754
Kerbing $28,047,504 $13,925,174 $14,122,330
Pathway $57,447,644 $12,000,380 $45,447,264
Road $161,325,020 $28,405,128 $132,919,892
Street Lighting $3,085,184 $57,122 $3,028,062
Traffic Control $5,700,088 $1,786,746 $3,913,341
TOTAL $268,828,582 $63,170,480 $205,658,103
Table 5-6: Transport Assets Valuation

City of Unley 39
5.1.5 Historical ExpenditureThe maintenance budget has increase annually due to CPI and the asset portfolio growing in size, complexity and age. The new capital budget in 2019/20 was significantly increased due to the delivery of the King William Road Upgrade, with renewal funding being diverted to King William Road for the renewal portion of the project. Historical expenditure information is contained in Figure 5-4.
Figure 5-4: Historical expenditure
Operational/Maintenance
Renew Capital
New Capital
$0
$3M
$6M
$12M
$15M
2015
� 16
2016
� 17
2017
� 1
8
2018
� 1
9
2019
� 2
0
TRANSPORT HISTORICAL EXPENDITURE
$9M

Transport Asset Management Plan40
5.2 Operations and Maintenance Plan
5.2.1 Operations and Maintenance StrategiesMaintenance is recurrent expenditure, which is periodically or regularly required as part of the anticipated schedule of works to ensure the asset maintains its condition, achieves its useful life and provides the required level of service. The expenditure is anticipated in determining the asset’s useful life.
As the years progress, the maintenance budget is projected to increase due to CPI and an asset portfolio growing in size, complexity and age. Figure 5-5 outlines the asset maintenance process.
In 2020/21 Council will conduct a review of all Depot operations in terms of levels of service to identify operational and financial efficiencies.
This review will be inclusive of all levels of service and processes to identify opportunities for efficiencies across all key depot operations including:
◗ Civil works
◗ Response and signage
◗ Open Space, Parks and Recreation
◗ Arboriculture
The outcomes of this service review may impact the operational and maintenance forecast with any changes made to be reflected in the LTFP following the conclusion of the review.
OPERATIONAL MAINTENANCE
UPDATE OF F WP
SCHEDULED CONDITION
ASSESSMENT
CUSTOMER REQUESTS
FORWARD WORKS
PROGRAM
PL ANNED MAINTENANCE
UPDATE OF F WP
ASSESSMENT OF REQUEST
REACTIVE MAINTENANCE
Figure 5-5: Asset maintenance process flowchart

City of Unley 41
The civil works and maintenance team undertake maintenance and operational activities for bridges, bus stops, car parks, kerbing, pathways, roads and traffic control. The maintenance process flowchart (Figure 5-6) outlines how maintenance is programmed. The condition assessments inform the forward maintenance program and additional maintenance is identified though routine customer enquiries and staff inspections until the next cycle of condition assessments.
Bridges are identified as a critical asset and can undergo three levels of assessments to inform maintenance and operational programs along with capital programs:
◗ Level 1: Routine maintenance inspection, visual inspection to check the general serviceability of the structure, particularly for the safety of road users, and to identify any emerging problems.
◗ Level 2: Condition rating inspection to assess and rate the condition of a structure (as a basis for assessing the effectiveness of past maintenance treatments, identifying current maintenance needs, modelling and forecasting future changes in condition and estimating future budget requirements).
◗ Level 3: Special inspection, typically an engineering inspection to provide improved knowledge of the condition, load capacity, in-service performance or any other characteristic beyond the scope of other types of inspection.
The next bridge level 2 inspection will be completed in 2020/21 to inform the forward maintenance and capital programs. Between level 2 inspections, additional maintenance is identified though and customer enquiries and staff inspections.
Bus stop asset requirements are determined by the state government bus service routes. Council does not operate the bus services, however provides infrastructure including bus pads and bus shelters at suitable locations. Council has a target for 100% compliance of existing bus shelters and pads by 31 December 2022. A shelter is not a DDA requirement for bus stops.
Council currently has an external agreement for the operation and maintenance of 50 additional bus shelters to the Plan. The maintenance obligations include 24-hour response to personal safety hazards, 48-hour response to hazards preventing use and a weekly inspection and cleaning program. The current contract concludes in 2021, where a new agreement will be negotiated, or the assets will be handed over to council. The bus stop assets owned by council are maintained through the internal maintenance and operations teams.
Council has completed a LED changeover for all local street lighting and is progressing this rollout to all collector roads. A vast majority of lighting on the Council’s road network are South Australia Power Network (SAPN) owned lighting with asset renewal and maintenance covered by tariffs. The remaining lights are either CLER lighting (customer lighting equipment rate) owned by council or individually metered lighting where it’s not practical to connect to the SAPN lighting network. All lighting is renewed and maintained to SAPN and Australian Standards.

Transport Asset Management Plan42
Figure 5-6: Ten Year operational and maintenance expenditure forecast
$0
$1M
$2M
$3M
$4M20
20
� 21
2021
� 2
2
2022
� 2
3
2023
� 2
4
2024
� 2
5
2025
� 2
6
2026
� 2
7
2027
� 2
8
2028
� 2
9
2029
� 3
0
TEN YEAR OPERATIONAL AND MAINTENANCE EXPENDITURE FORECAST
5.2.2 Summary of Future CostsFigure 5-6 outlines the forecast of planned and unplanned operations and maintenance works over the next ten years. It has been projected with CPI increase over ten years, which aligns with the LTFP. As Australia is facing economic impacts that will have unknown consequences at this time, the CPI assumptions will change on an annual basis through the LTFP.

City of Unley 43
5.3 Renewal Plan (Capital)
Asset renewal is the replacement or refurbishment of an existing asset to return it to the modern standard equivalent performance and level of service. Renewal planning is necessary to ensure adequate funding is available, and assets are replaced at an optimum time to maintain the level of service.
5.3.1 Renewal IdentificationProjected future renewal expenditures are forecast to increase over time as the asset portfolio grows in size, complexity and age.
Renewals are programmed across asset classes using the following methods:
1 Forward projection based on historic expenditure.
2 Broad estimates based on replacing assets at the end of their useful lives.
3 Predictive modelling of varying degrees of complexity.
4 Bottom-up approach with a high confidence in asset data. Projects are identified via asset monitoring, prioritised and allocated.
These methods increase in sophistication, which is reflected by the data confidence level.
5.3.2 Renewal Strategies Renewal works identified in terms of renewal strategies may be deferred if the cost is beyond the current financial ability to fund it. This can occur when there are higher priority works on other asset groups. When renewal works are deferred, the impact of the deferral on the assets ability to still provide the required level of service will be assessed. Although the deferral of some renewal works may not impact significantly on the short-term operation of the assets, repeated deferral will create a liability in the longer term.
Renewals are primarily programmed based on condition, however early implementation of renewal may be undertaken for upgrades and replacements due to changes in standards, safety issues, changes in levels of service, funding opportunities or alignment with external projects, strategies and plans.

Transport Asset Management Plan44
5.3.3 Summary of Future CostsThe projected future required renewal expenditure is summarised in Figure 5-7 and the transport category ten year renewal forecast is contained in Table 5-9. The four sets of data in the graphs include:
◗ The condition-based renewal bar graph displays the replacement value of assets reaching the end of their useful life.
◗ The LTFP line displays the current LTFP projection based on past Plans and asset data.
◗ The annual depreciation dashed line displays the annual cost of depreciation for the asset class. Annual depreciation is the standard yearly rate at which depreciation is charged to a fixed asset. This rate is consistent from year to year using the straight-line method and can provide a guide to the annual spend per year for an asset class.
◗ The projection line indicates the projected future renewal forecasted expenditure for the asset category based on the Plan.
It is recognised matching condition-based renewal fluctuations from year to year is not generally possible from both a budget and resourcing perspective. Distributing the renewal costs over the ten year timeframe is preferable from a budget and resourcing perspective.
The average annual expenditure for the next ten years:
Renewal projection $3,512,875
LTFP $3,196,403
Annual depreciation $3,909,000
The condition-based renewal for road and kerbing assets contained in Figure 5-7 is based on condition modelling validated by visual assessments from Council. The projection for kerbing is based on the average annual condition-based funding and the projection for roads is based on the annual depreciation. These projections are contained in Table 5-9. Council will reassess the road and kerbing category funding following the next condition assessment in 2021/22.
A budget of $40,000 for bus stop infrastructure renewal has been committed to 2020/21 and 2021/22 for compliance with the Disability Discrimination Act (DDA). Legislation requires all bus stops to be DDA compliant by December 2022. Following 2021/22 a $15,000 budget will be allocated for the continuing renewal of bus stops.

City of Unley 45
Figure 5-7: Transport ten year renewal expenditure forecast
2020
� 2
1
$0
$1M
$2M
$3M
$4M
2021
� 2
2
2022
� 2
3
2023
� 2
4
2024
� 2
5
2025
� 2
6
2026
� 2
7
2027
� 2
8
2028
� 2
9
2029
� 3
0
TRANSPORT TEN YEAR RENEWAL EXPENDITURE FORECAST
Renewal LTFPAnnual Depreciation
Projection
Transport Asset Management Plan46
Council’s street lighting and car park assets were condition assessed and revalued in 2019/20 with high confidence. The condition of these assets has been assessed as good with minimal condition based forecasted expenditure in the next ten years. An annual budget of $20,000 for renewals in each of these asset categories has been projected for early implementation of renewals based on changes in standards, safety issues, changes in levels of service, funding opportunities or alignment with external projects, strategies and plans.
Council’s bridge asset projections are currently in line with the annual depreciation. In 2020/21 the bridge assets will undergo a condition audit to inform future renewal projections.
Council’s pathway assets were condition assessed and revalued in 2019/20 with high confidence. The condition of pathways is good with minimal condition based forecasted expenditure in the next ten years. A total of $250,000 is projected for the renewal program to improve the walkability, safety and functionality of footpaths and kerb ramps for:
◗ Paving lift and relay to prevent trip hazards.
◗ Early renewal implementation for pathway assets projected to address functionality and non-compliance.
◗ DDA compliance of kerb ramps based on the 2019/20 condition assessment identifying 51% of kerb ramps not meeting DDA compliance.
Council’s traffic control assets were condition assessed and revalued in 2019/20. The overall condition of traffic control is fair with minimal condition based forecasted expenditure in the next ten years. An annual budget of $50,000 for traffic control renewals is forecasted due to the criticality of these assets, physical damage attained on these assets prior to the end of their useful life and early implementation of renewals based on changes in standards, safety issues, changes in levels of service, funding opportunities or alignment with external projects, strategies and plans. This figure includes signage renewal ($20,000).
Council’s data confidence level is discussed further in Section 7.4, which dictate assumptions built into the forward program.
The Plan identifies an average annual spend of $3,512,875 for transport asset renewal over the next ten years. The annual depreciation in 2020/21 for transport is $3,909,000, which indicates an increase will be required in the LTFP spending for transport as the asset portfolio ages.
Council’s asset renewal ratio (planned renewal / the Plan’s identified renewal) is at 91% over the next ten years. The ratio represents the level of capital expenditure on the renewal of assets (LTFP) relative to the expenditure projected in the Plan.
The current LTFP expenditure is under the budget projection and an increase of $3,165,000 to the budget over ten years will be required to maintain a ratio of 100%. Council’s target is a 100% average over the next ten years.

City of Unley 47
ASSET CATEGORY
TEN YEAR RENEWAL
PROJECTION
TEN YEAR LTFP
ASSET RENEWAL RATIO (LTFP / RENEWAL
PROJECTION)
AVERAGE ANNUAL
RENEWAL BUDGET
ANNUAL DEPRECIATION
2020/21
Bridges $1,090,000 $530,000 49% $109,000 $109,000
Bus Stops $200,000 $220,000 110% $20,000 $85,000
Car Parks $200,000 $270,000 135% $20,000 $75,000
Kerbing $11,758,750 $9,600,000 82% $1,175,875 $270,000
Pathway $2,500,000 $5,550,000 222% $250,000 $1,160,000
Road $18,680,000 $15,040,000 81% $1,868,000 $1,868,000
Street Lighting $200,000 $205,000 103% $20,000 $190,000
Traffic Control $500,000 $549,000 110% $50,000 $152,000
TOTAL $35,128,750 $31,964,000 91% $3,512,875 $3,909,000
Table 5-9: Transport ten year renewal expenditure projection

Transport Asset Management Plan48
5.4 Creation � Acquisition Plan (New Capital)
New capital relates to new assets or a significantly improved level of service that did not previously exist. They may result from various needs derived from demands such as population growth, environmental and technology change (as mentioned in Section 4).
5.4.1 Capital Investment StrategiesThe need for new transport assets arises from a variety of sources including community requests, Council resolutions, proposals identified by Council strategies, grant opportunities or partnerships with external organisations. These projects are prioritised each year against all other asset categories and Council proposals.

City of Unley 49
5.4.2 Summary of Future CostsFigure 5-8 outlines the projected future spend through new capital works for transport assets. Council reviews its new capital projects on an annual basis, allowing only one year (2020/21) of works to be shown as approved through the Annual Business Plan. The projection for the remainder of the ten year renewal is based upon Council’s annual priorities for new capital expenditure across Council and the need for new capital across all asset classes based on upcoming projects.
Year one (2020/21) is significantly lower than the remaining years as Council has one year of decreased new capital spending the LTFP to offset the high new capital expenditure in 2019/20.
As timing and costs for these projects are still to be confirmed the projection for transport assets has been distributed with an average of $605,000 per year expected to be budgeted across ten years. These budgets are subject to individual year bids, Council strategies and funding opportunities and are expected to fluctuate year to year.
The upcoming new capital projects for the transport asset class in the next ten years include:
◗ Local Area Traffic Management (LATM) Implementation.
◗ Walking and Cycling Plan Implementation – This project proposes to implement priorities contained in Council’s Walking and Cycling Plan as adopted in 2016.
◗ Unley Road Infrastructure and Public Realm Upgrade.
◗ Glen Osmond Road Infrastructure and Public Realm Upgrade.
Figure 5-8: Projected new capital expenditure$0
$200K
$400K
$600K
$800K
2020
� 2
1
2021
� 2
2
2022
� 2
3
2023
� 2
4
2024
� 2
5
2025
� 2
6
2026
� 2
7
2027
� 2
8
2028
� 2
9
2029
� 3
0
TRANSPORT PROJECTED NEW CAPITAL EXPENDITURE

50
5.5 Decommission Plan
Disposal includes any activity associated with disposal of a decommissioned asset including sale, demolition or relocation. Decommission of assets can be triggered in the following situations:
◗ The end of useful life of existing assets.
◗ Safety factors inherent to the asset.
◗ Non-compliance of the asset and prompting a modern equivalent replacement.
Decommission of assets can involve the following courses of action:
◗ Design and replacement of the asset with a modern fit for purpose equivalent.
◗ Removal of the asset with the aim of repurposing the land in line with the long term strategy of Council.
◗ The sale of the asset (in part or in whole), in situations where Council is looking to consolidate the asset portfolio.

City of Unley 51

Transport Asset Management Plan52
Risk Management
Critical assets are those assets which have a high consequence of failure but not necessarily a high likelihood of failure. The identification of critical assets and failure modes means investigative activities, condition inspection programs, maintenance and capital expenditure plans can be effectively targeted.
Factors influencing criticality may be risk scored on safety, production/effort, cost and reputation.
Critical assets within the transport assets include road bridges, traffic control and street lighting, which all directly impact public safety. Other critical transport assets include the roads and pathways, making sure Council provide surfaces that are rideable for vehicles and cyclists and walkable for all users.
6.1 Critical Assets
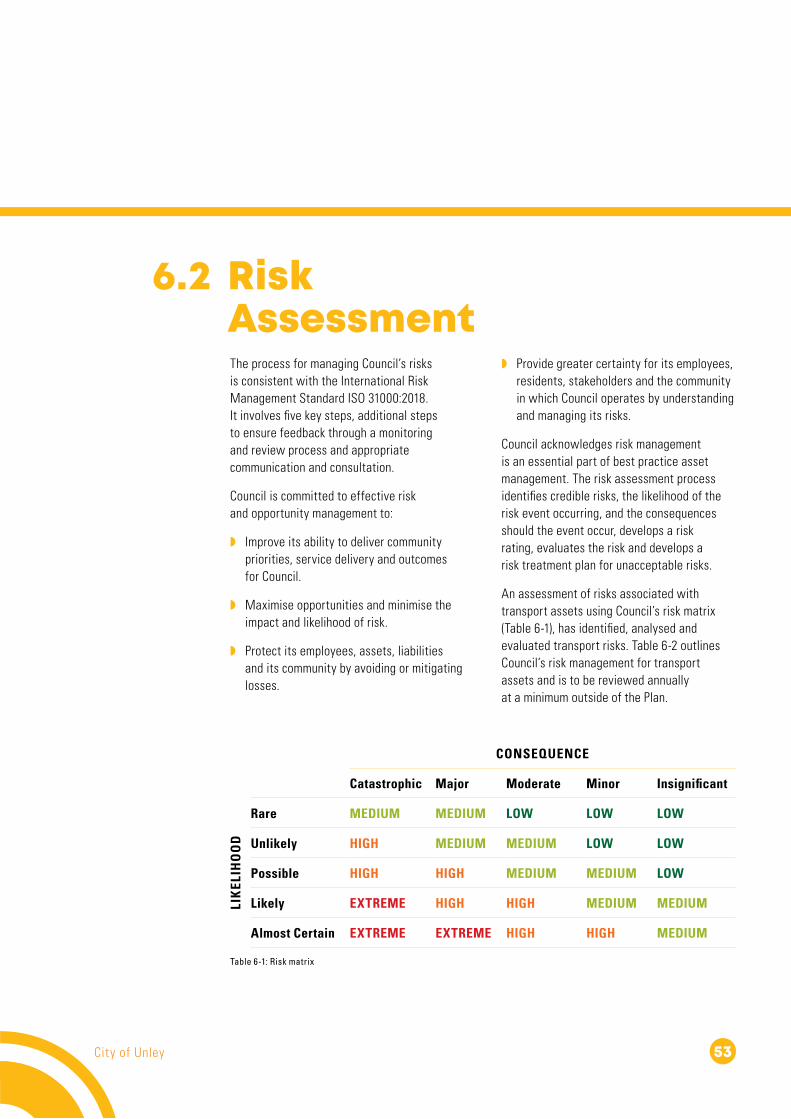
City of Unley 53
The process for managing Council’s risks is consistent with the International Risk Management Standard ISO 31000:2018. It involves five key steps, additional steps to ensure feedback through a monitoring and review process and appropriate communication and consultation.
Council is committed to effective risk and opportunity management to:
◗ Improve its ability to deliver community priorities, service delivery and outcomes for Council.
◗ Maximise opportunities and minimise the impact and likelihood of risk.
◗ Protect its employees, assets, liabilities and its community by avoiding or mitigating losses.
6.2 Risk Assessment
◗ Provide greater certainty for its employees, residents, stakeholders and the community in which Council operates by understanding and managing its risks.
Council acknowledges risk management is an essential part of best practice asset management. The risk assessment process identifies credible risks, the likelihood of the risk event occurring, and the consequences should the event occur, develops a risk rating, evaluates the risk and develops a risk treatment plan for unacceptable risks.
An assessment of risks associated with transport assets using Council’s risk matrix (Table 6-1), has identified, analysed and evaluated transport risks. Table 6-2 outlines Council’s risk management for transport assets and is to be reviewed annually at a minimum outside of the Plan.
CONSEQUENCE
Catastrophic Major Moderate Minor Insignificant
LIK
ELIH
OO
D
Rare MEDIUM MEDIUM LOW LOW LOW
Unlikely HIGH MEDIUM MEDIUM LOW LOW
Possible HIGH HIGH MEDIUM MEDIUM LOW
Likely EXTREME HIGH HIGH MEDIUM MEDIUM
Almost Certain EXTREME EXTREME HIGH HIGH MEDIUM
Table 6-1: Risk matrix

Transport Asset Management Plan54
RISK DESCRIPTION
(Event or potential event focused and their impact upon objectives)
INHERENT RISK
Level of risk with NO controls in place
CONTROLS ALREADY IN PLACE
(What existing controls are in place to prevent and/or manage the risk?)
Are
the
Cont
rols
eff
ecti
ve
at m
anag
ing
the
risk
?
RESIDUAL RISK
Level of risk if existing controls
are effective
Is th
e Re
sidu
al R
isk
Ratin
g To
lera
ble?
TREATMENTS/ADDITIONAL CONTROLS
(Additional controls that can be implemented to further reduce the level of risk)
TREATMENT OWNER & TIMING
(Who is responsible for implementing the treatment and when it should be implemented/completed)
RISK LEVEL AFTER TREATMENTS
If treatments implemented are effective
Cons
eque
nce
Like
lihoo
d
Risk
Rat
ing
Cons
eque
nce
Like
lihoo
d
Risk
Rat
ing
Cons
eque
nce
Like
lihoo
d
Risk
Rat
ing
1Unsustainable management of assets due to poor quality data within asset management plan. M
ajor
Like
ly
High Periodic delivery of condition assessments and
revaluations in line with industry standards.
Part
ially
eff
ectiv
e
Maj
or
Poss
ible
High No
Continuous improvements in asset management maturity and activities through the improvement program.
Assets and Operations and Finance & Procurement
See improvement program (Section 8.2)
Maj
or
Unlik
ely
Med
ium
2Council staff and/or members of the public injured as a result of poorly maintained infrastructure.
Cata
stro
phic
Like
ly
Extr
eme
Annual maintenance budgets.
Periodic delivery of condition assessments.
Maintenance inspections.
Timely response to reported hazards in alignment with the service level agreement.
Maj
ority
eff
ectiv
e
Cata
stro
phic
Rare
Med
ium
Yes
N/A N/A N/A
N/A
N/A
3Council staff and/or members of the public injured as a result of non-compliance to standards.
Cata
stro
phic
Like
ly
Extr
eme
Engaging suitably qualified consultants to undertake transport designs compliant to relevant Australian Standards. M
ajor
ity
effe
ctiv
e
Cata
stro
phic
Rare
Med
ium
Yes
N/A N/A N/A
N/A
N/A
4Council unable to fund required capital and maintenance due to economic downturn. M
oder
ate
Like
ly
High
Maintain strong sustainability ratio to avoid a backlog of capital works.
Ability to fund capital program through borrowings.
Ability to reduce levels of service.
Maj
ority
ef
fect
ive
Mod
erat
e
Rare
Low
Yes
N/A N/A N/A
N/A
N/A
5Climate change not appropriately planned for with respect to asset management. M
oder
ate
Like
ly
High High level targets are set through the objectives and
targets within the Environmental Sustainability Strategy.
Part
ially
eff
ectiv
e
Mod
erat
e
Poss
ible
Med
ium
No
Climate change addressed with respect to Councils impact on the environment as well as the environments impact to councils’ assets.
Include climate change as a considered factor throughout the Plan’s, outlining the impact and associated demand on assets.
Address assets within Climate and Energy Plan.
Assets and Operations
Ongoing as asset management plans and council strategies are updated
Mod
erat
e
Rare
Low
Table 6-2: Transport risks
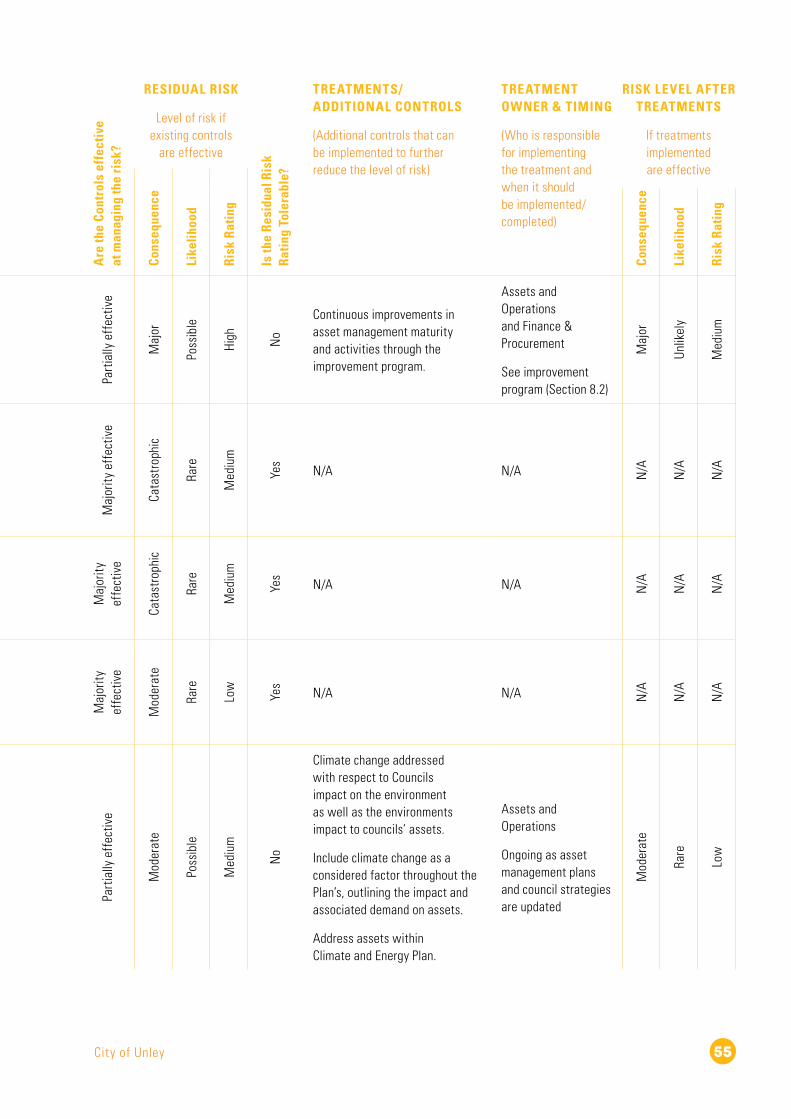
City of Unley 55
RISK DESCRIPTION
(Event or potential event focused and their impact upon objectives)
INHERENT RISK
Level of risk with NO controls in place
CONTROLS ALREADY IN PLACE
(What existing controls are in place to prevent and/or manage the risk?)
Are
the
Cont
rols
eff
ecti
ve
at m
anag
ing
the
risk
?
RESIDUAL RISK
Level of risk if existing controls
are effective
Is th
e Re
sidu
al R
isk
Ratin
g To
lera
ble?
TREATMENTS/ADDITIONAL CONTROLS
(Additional controls that can be implemented to further reduce the level of risk)
TREATMENT OWNER & TIMING
(Who is responsible for implementing the treatment and when it should be implemented/completed)
RISK LEVEL AFTER TREATMENTS
If treatments implemented are effective
Cons
eque
nce
Like
lihoo
d
Risk
Rat
ing
Cons
eque
nce
Like
lihoo
d
Risk
Rat
ing
Cons
eque
nce
Like
lihoo
d
Risk
Rat
ing
1Unsustainable management of assets due to poor quality data within asset management plan. M
ajor
Like
ly
High Periodic delivery of condition assessments and
revaluations in line with industry standards.
Part
ially
eff
ectiv
e
Maj
or
Poss
ible
High No
Continuous improvements in asset management maturity and activities through the improvement program.
Assets and Operations and Finance & Procurement
See improvement program (Section 8.2)
Maj
or
Unlik
ely
Med
ium
2Council staff and/or members of the public injured as a result of poorly maintained infrastructure.
Cata
stro
phic
Like
ly
Extr
eme
Annual maintenance budgets.
Periodic delivery of condition assessments.
Maintenance inspections.
Timely response to reported hazards in alignment with the service level agreement.
Maj
ority
eff
ectiv
e
Cata
stro
phic
Rare
Med
ium
Yes
N/A N/A N/A
N/A
N/A
3Council staff and/or members of the public injured as a result of non-compliance to standards.
Cata
stro
phic
Like
ly
Extr
eme
Engaging suitably qualified consultants to undertake transport designs compliant to relevant Australian Standards. M
ajor
ity
effe
ctiv
e
Cata
stro
phic
Rare
Med
ium
Yes
N/A N/A N/A
N/A
N/A
4Council unable to fund required capital and maintenance due to economic downturn. M
oder
ate
Like
ly
High
Maintain strong sustainability ratio to avoid a backlog of capital works.
Ability to fund capital program through borrowings.
Ability to reduce levels of service.
Maj
ority
ef
fect
ive
Mod
erat
e
Rare
Low
Yes
N/A N/A N/A
N/A
N/A
5Climate change not appropriately planned for with respect to asset management. M
oder
ate
Like
ly
High High level targets are set through the objectives and
targets within the Environmental Sustainability Strategy.
Part
ially
eff
ectiv
e
Mod
erat
e
Poss
ible
Med
ium
No
Climate change addressed with respect to Councils impact on the environment as well as the environments impact to councils’ assets.
Include climate change as a considered factor throughout the Plan’s, outlining the impact and associated demand on assets.
Address assets within Climate and Energy Plan.
Assets and Operations
Ongoing as asset management plans and council strategies are updated
Mod
erat
e
Rare
Low
Table 6-2: Transport risks
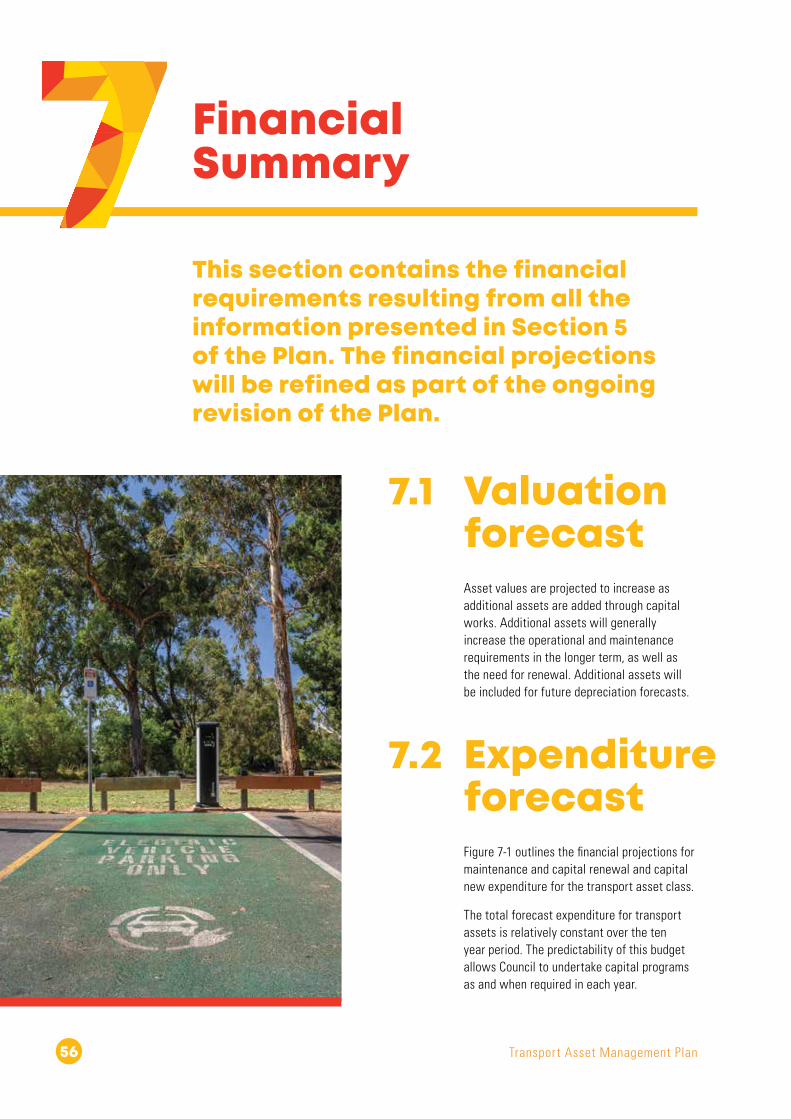
Transport Asset Management Plan56
Financial Summary
7.1 Valuation forecast
This section contains the financial requirements resulting from all the information presented in Section 5 of the Plan. The financial projections will be refined as part of the ongoing revision of the Plan.
Asset values are projected to increase as additional assets are added through capital works. Additional assets will generally increase the operational and maintenance requirements in the longer term, as well as the need for renewal. Additional assets will be included for future depreciation forecasts.
7.2 Expenditure forecast
Figure 7-1 outlines the financial projections for maintenance and capital renewal and capital new expenditure for the transport asset class.
The total forecast expenditure for transport assets is relatively constant over the ten year period. The predictability of this budget allows Council to undertake capital programs as and when required in each year.

City of Unley 57
7.3 Asset Renewal Funding Ratio
This ratio indicates whether Council has the financial capacity to fund asset renewal at continued existing service levels. Council’s target is a 100% average over the next ten years.
ASSET RENEWAL FUNDING RATIO – TRANSPORT: 91%
This ratio is an important budget indicator over the next ten years. Council’s LTFP has budgeted 91% of funds identified in this plan for the optimal renewal and replacement of transport assets. An increase of $$3,165,000 to the renewal budget over ten years is required to maintain a ratio of 100%.
7.4 Funding Strategy
Key strategic milestones:
◗ The Plan will inform Council’s future LTFPs.
◗ The next major condition assessment and revaluation will as outlined in Table 5-1 and will inform future renewal strategies.
◗ The Depot operations service review will be undertaken in 2020/21, which will inform future maintenance and operating budgets.
Repayment of existing loans has been extracted from the current loan schedule. The LTFP assumption indicates no additional funding through borrowings is required to meet new capital commitments in the future. The Local Government Finance Authority (LGFA) Cash Advance Debenture (CAD) Facility will continue to be used to balance funding requirements in terms of borrowing.
The projected expenditure is to be funded from Council’s operating, maintenance and capital budgets.
Figure 7-1: Transport ten year forecast expenditure
TRANSPORT TEN YEAR FORECAST EXPENDITURE
20
� 21
$0
$2M
$4M
$6M
$8M
$10M
21
� 22
22
� 23
23
� 24
24
� 25
25
� 26
26
� 27
27
� 28
28
� 29
29
� 30
Maintenance Renew New

Transport Asset Management Plan58
7.5 Key Assumptions
The assumptions and data used in presenting this forecast information were:
◗ Replacement costs derived from the fixed asset register in Technology One asset database.
◗ Condition data derived from:
◗ Bridges Condition Assessment 2017
◗ Bus Stop Condition Assessment 2020
◗ Car Park Condition Assessment 2020
◗ Kerbing Condition Assessment 2017
◗ Pathway Condition Assessment 2020
◗ Road Condition Assessment 2017
◗ Street Lighting Condition Assessment 2020
◗ Traffic Control Condition Assessment 2020
◗ Key financial assumptions derived from LTFP 2020/21.
◗ Operation funding will be made without reduction.
◗ Capital funding will be made without reduction.
◗ Appropriate resources will be made available to manage the Plan.
◗ Council income will remain consistent with LTFP.
◗ There will be no natural disasters.

City of Unley 59
7.6 Forecast Reliability and Confidence
The expenditure projections are based on the best available data. Data confidence is critical for an accurate expenditure projection. As new data becomes available, the forward plans will be updated. There are five levels that measures data confidence.
Council’s transport asset data confidence is displayed below in Table 7-2. Major categories including bridges, traffic control, road and kerbing have a C rating and will be progressed to B through the condition assessment program outlined in the Plan.
CONFIDENCE LEVEL DESCRIPTION
A – Highly Reliable Data based on sound records, procedures, investigations and analysis, documented properly and agreed as the best method of assessment. Data set is complete and estimated to be accurate +-2%.
B – Reliable Data based on sound records, procedures, investigations and analysis, documented properly but has minor shortcomings, e.g. some of the data is old, some documentation is missing and /or reliance is placed on unconfirmed reports or some extrapolation. Dataset is complete and estimated to be accurate +-10%.
C – Uncertain Data based on sound records, procedures, investigations and analysis which is incomplete or unsupported, or extrapolated from a limited sample for which grade A or B data are available. Dataset is substantially complete but up to 50% is extrapolated data and accuracy estimated +-25%.
D – Very Uncertain Data is based on unconfirmed verbal reports and/or cursory inspections and analysis. Dataset may not be fully complete, and most data is estimated or extrapolated. Accuracy +-40%.
E – Unknown None or very little data held.
Table 7-1: Data confidence level
ASSET CATEGORY CONFIDENCE LEVEL
Bridges C – Uncertain
Bus Stops B – Reliable
Car Parks B – Reliable
Kerbing C – Uncertain
Pathway B – Reliable
Road C – Uncertain
Street Lighting B – Reliable
Traffic Control B – Reliable
OVERALL C – Uncertain
Table 7-2: Transport data confidence level

Transport Asset Management Plan60
Improvement and Monitoring
8.1.1 Accounting and Financial SystemsCouncil uses Technology One as its financial management and accounting system. Technology One has the capability to report the full lifecycle of assets providing full transparency from acquisition to disposal of assets.
Council is committed to improve the data quality and confidence by implementing actions within the improvement program in Table 8-1.
8.1 Status of Asset Management Practices
8.1.2 Asset Management SystemCouncil uses Technology One – Enterprise Asset Management software as its Asset Management System. Initial set up of the asset management system is crucial to ensure integration between operating and financial functions. Council’s initial set up of the asset management system was incomplete and is being addressed through the improvement program, periodically updating the asset registers during revaluations.
A future improvement is to integrate the financial system and asset management system following each asset categories condition assessment and revaluation.
Council’s geographic information system (GIS) data is stored within a specialised GIS software suite. An improvement will be to integrate the GIS data with the asset register to provide live spatial data.

City of Unley 61
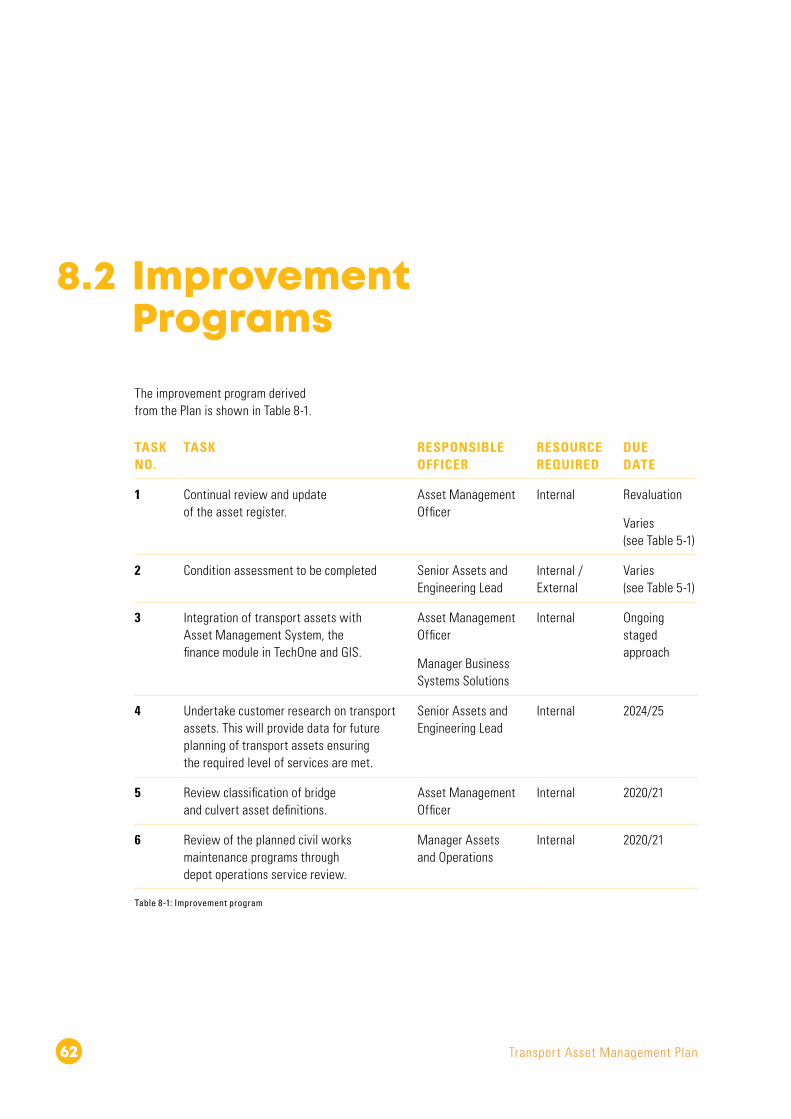
Transport Asset Management Plan62
8.2 Improvement Programs
The improvement program derived from the Plan is shown in Table 8-1.
TASK NO.
TASK RESPONSIBLE OFFICER
RESOURCE REQUIRED
DUE DATE
1 Continual review and update of the asset register.
Asset Management Officer
Internal Revaluation
Varies (see Table 5-1)
2 Condition assessment to be completed Senior Assets and Engineering Lead
Internal / External
Varies (see Table 5-1)
3 Integration of transport assets with Asset Management System, the finance module in TechOne and GIS.
Asset Management Officer
Manager Business Systems Solutions
Internal Ongoing staged approach
4 Undertake customer research on transport assets. This will provide data for future planning of transport assets ensuring the required level of services are met.
Senior Assets and Engineering Lead
Internal 2024/25
5 Review classification of bridge and culvert asset definitions.
Asset Management Officer
Internal 2020/21
6 Review of the planned civil works maintenance programs through depot operations service review.
Manager Assets and Operations
Internal 2020/21
Table 8-1: Improvement program

City of Unley 63
8.3 Monitoring & Review Procedure
Council will schedule the Plan review into its strategic and annual planning and budget processes. The Plan has a life of four years.
8.4 Performance Measures
Council will track the performance of the Plan through the following performance measures:
1 Level of Service Key Performance Indicators (KPIs).
2 Delivery of improvement program.
3 Improved data confidence.
4 Review of the Plan minimum every four years.

Transport Asset Management Plan64
(08) 8372 5111 [email protected] Unley Civic Centre 181 Unley Road, Unley SA 5061
unley.sa.gov.au
© City of Unley 2021


