Storage density of shift-multiplexed holographic memory
Gregory J. Steckman, Allen Pu, and Demetri Psaltis
The storage density of shift-multiplexed holographic memory is calculated and compared with experi-mentally achieved densities by use of photorefractive and write-once materials. We consider holo-graphic selectivity as well as the recording material’s dynamic range ~My#! and required diffractionefficiencies in formulating the calculations of storage densities, thereby taking into account all majorfactors limiting the raw storage density achievable with shift-multiplexed holographic storage systems.We show that the My# is the key factor in limiting storage densities rather than the recording material’sthickness for organic materials in which the scatter is relatively high. A storage density of 100 bitsymm2
One of the most important attributes of holographicdata storage is its potential for high storage densi-ties.1 In practice, the achievable density is limitedby the quality of the holographic recording material.A holographic material should have sufficient thick-ness for low cross talk, high dynamic range for a largerecovered signal strength, long-term hologram stabil-ity, and nondestructive readout. Recent progress inmaterials research in photorefractives2–4 and write-once photopolymers5–7 shows promise for addressingthe material issues.
Our purpose in this paper is to address specificallythe influences of material thickness and the material’sdynamic range ~My#! on the storage density achievable
ith shift-multiplexed holographic disk systems.8Past analyses on the storage capacity of holographicstorage systems8–10 have considered only the influenceof geometric constraints, such as material thickness onstorage densities, without taking into account the lim-its imposed by the My#. When both geometric anddynamic range factors are included, a more accurate
When this research was performed the authors were with theDepartment of Electrical Engineering, California Institute of Tech-nology, Mail Stop 136-93, Pasadena, California 91125. G. J. Steck-man ~e-mail: [email protected]! is now with Ondax,Inc., 850 East Duarte Road, Monrovia, California 91016. A. Pu isnow attending The Anderson School, University of California, LosAngeles, Los Angeles, California 90095-1481 for his master of busi-ness administration.
Received 26 April 2000; revised manuscript received 20 March2001.
prediction of potential storage densities can be made.Furthermore, these predictions can act as a guide formaterial researchers who need to obtain a minimumlevel of performance before their materials are ready tobe implemented in high-density holographic storagesystems.
In Section 2 a description of the optical systemconsidered is described followed by the calculationsnecessary to compute the holographic data-storagedensity of such a system. Variations of the calcula-tion for use with rewritable photorefractive or write-once photopolymer materials are presented.Because the derived formulas are, in general, tran-scendental, and optimizations over many parametersare required, numerical techniques are used to solvethe calculation problem, specifically a genetic algo-rithm. In Section 3 calculated values for storagedensity are compared with experimentally obtaineddensities from shift-multiplexing experiments withboth lithium niobate and a write-once photopolymer.Finally, calculations of possible data-storage densi-ties with shift-multiplexed holographic memories aremade relative to the performance and thickness of thestorage material and the wavelength of light used.
2. Calculation of Storage Density
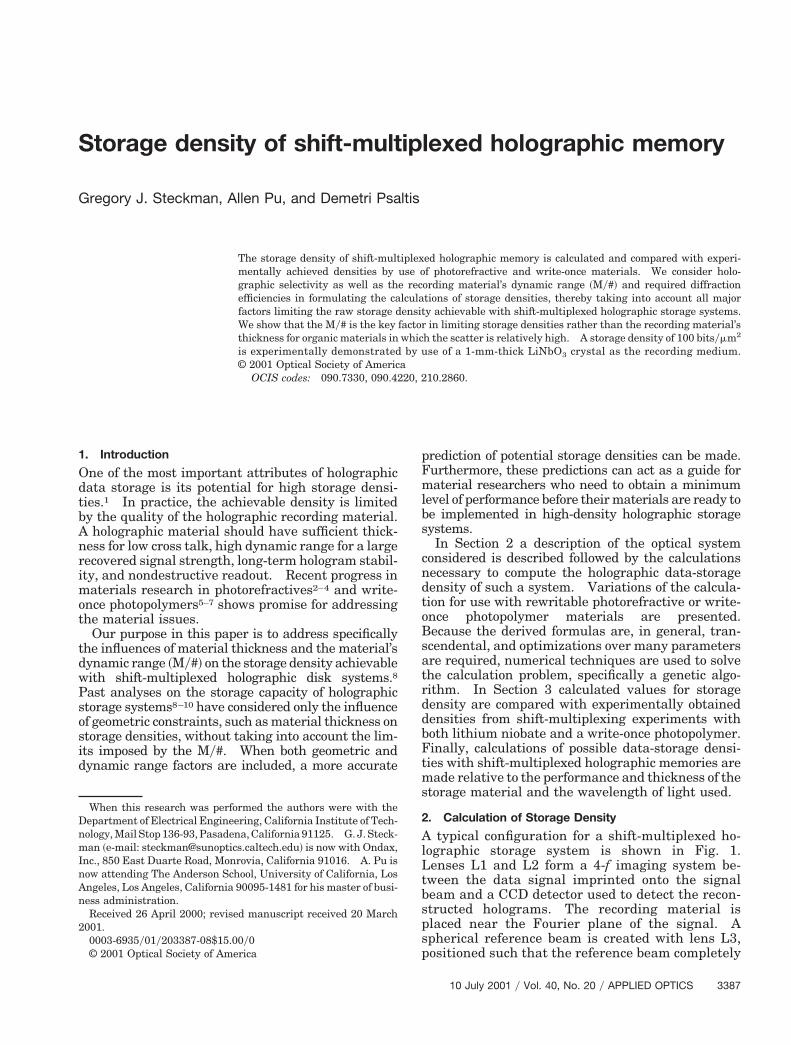
A typical configuration for a shift-multiplexed ho-lographic storage system is shown in Fig. 1.Lenses L1 and L2 form a 4-f imaging system be-tween the data signal imprinted onto the signalbeam and a CCD detector used to detect the recon-structed holograms. The recording material isplaced near the Fourier plane of the signal. Aspherical reference beam is created with lens L3,positioned such that the reference beam completely
10 July 2001 y Vol. 40, No. 20 y APPLIED OPTICS 3387
a
ba
wtwtBeimscr
3
overlaps the signal beam throughout the material.Rotation of the disk serves as the in-plane shiftmechanism, and radial translations of the opticalsystem access different tracks.
The storage density for a holographic disk systemthat uses shift multiplexing can be computed by therelation D 5 Npy~d 3 dr!, where Np is the number ofbits stored per hologram. d is the shift distance re-quired between holograms to reconstruct them with-out substantial cross talk and to limit the number ofoverlapped holograms to obtain sufficient diffractionefficiency. dr is the radial shift distance requiredbetween tracks of holograms. Np and dr are deter-mined by the optical system and material thickness,whereas d is determined from shift selectivity anddynamic range limitations.
A requirement of the optical system is to have thereference beam completely overlap the signal beamthroughout the volume of the material. Each beamwill form an ellipse on the top and bottom surfaces ofthe material. The sizes and positions of the four el-lipses are first determined in Subsections 2.A and 2.B.The beam ellipses are used for two purposes. First,by comparing the sizes and positions of the ellipses wecan ensure that the signal and reference beams willcompletely overlap each other on both the first andsecond surfaces of the recording material. If completeoverlapping is not obtained, the density is computed aszero. Second, the sizes of the beams are needed todetermine the shift distances required between adja-cent holograms when we take into account the My#.
A. Reference Beam Geometry
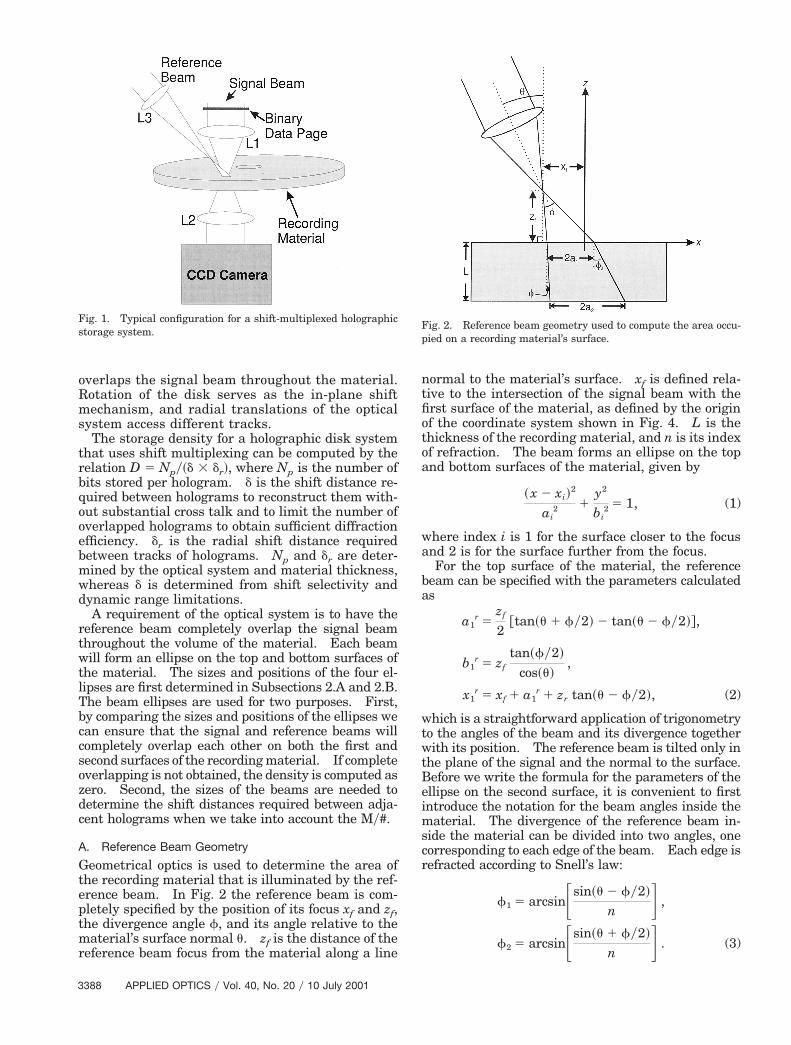
Geometrical optics is used to determine the area ofthe recording material that is illuminated by the ref-erence beam. In Fig. 2 the reference beam is com-pletely specified by the position of its focus xf and zf,the divergence angle f, and its angle relative to thematerial’s surface normal u. zf is the distance of thereference beam focus from the material along a line
Fig. 1. Typical configuration for a shift-multiplexed holographicstorage system.
388 APPLIED OPTICS y Vol. 40, No. 20 y 10 July 2001
normal to the material’s surface. xf is defined rela-tive to the intersection of the signal beam with thefirst surface of the material, as defined by the originof the coordinate system shown in Fig. 4. L is thethickness of the recording material, and n is its indexof refraction. The beam forms an ellipse on the topand bottom surfaces of the material, given by
~ x 2 xi!2
ai2 1
y2
bi2 5 1, (1)
where index i is 1 for the surface closer to the focusnd 2 is for the surface further from the focus.For the top surface of the material, the reference
eam can be specified with the parameters calculateds
a1r 5
zf
2@tan~u 1 fy2! 2 tan~u 2 fy2!#,
b1r 5 zf
tan~fy2!
cos~u!,
x1r 5 xf 1 a1
r 1 zr tan~u 2 fy2!, (2)
hich is a straightforward application of trigonometryo the angles of the beam and its divergence togetherith its position. The reference beam is tilted only in
he plane of the signal and the normal to the surface.efore we write the formula for the parameters of thellipse on the second surface, it is convenient to firstntroduce the notation for the beam angles inside the
aterial. The divergence of the reference beam in-ide the material can be divided into two angles, oneorresponding to each edge of the beam. Each edge isefracted according to Snell’s law:
f1 5 arcsinFsin~u 2 fy2!
n G ,
f2 5 arcsinFsin~u 1 fy2!
n G . (3)
Fig. 2. Reference beam geometry used to compute the area occu-pied on a recording material’s surface.
Tt
tnbrbetfasb
The parameters of the ellipse on the surface furtherfrom the focal point are now easily written in terms ofthe parameters on the first surface as
a2r 5 a1
r 1L2
@tan~f2! 1 tan~f1!#,
b2r 5 b1
r 1 L tanHarcsinFsin~fy2!
n GJ ,
x2r 5 x1
r 1L2
@tan~f1! 1 tan~f2!#. (4)
B. Signal Beam Geometry
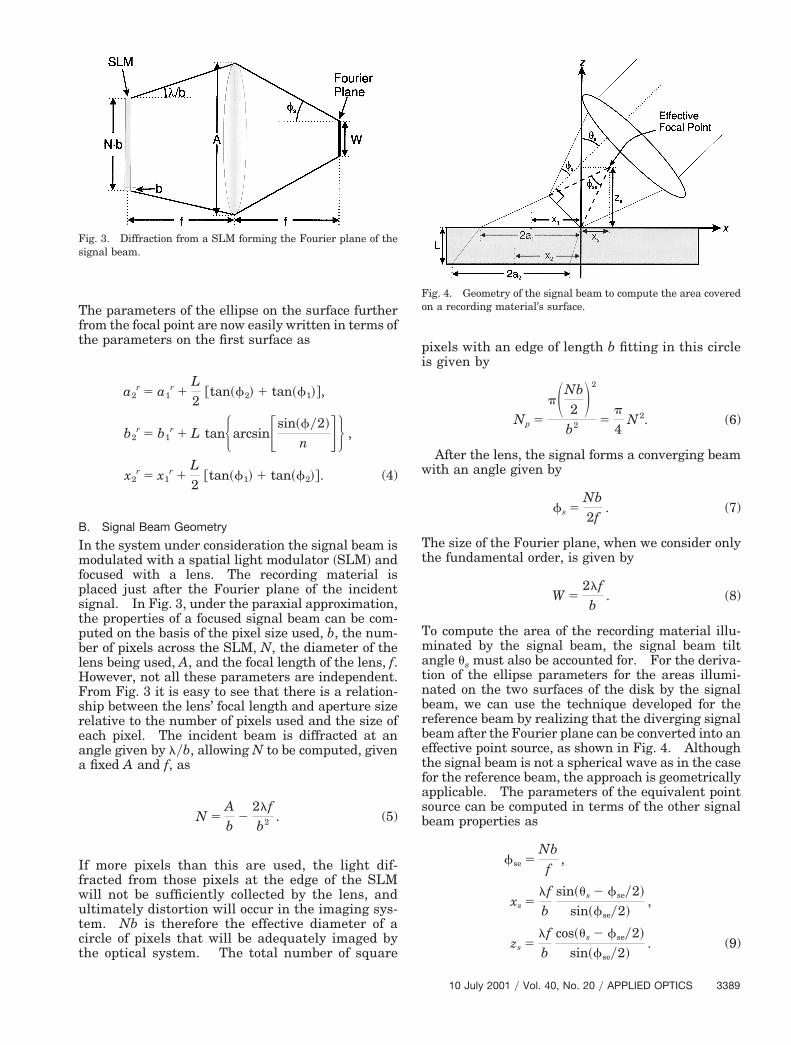
In the system under consideration the signal beam ismodulated with a spatial light modulator ~SLM! andfocused with a lens. The recording material isplaced just after the Fourier plane of the incidentsignal. In Fig. 3, under the paraxial approximation,the properties of a focused signal beam can be com-puted on the basis of the pixel size used, b, the num-ber of pixels across the SLM, N, the diameter of thelens being used, A, and the focal length of the lens, f.However, not all these parameters are independent.From Fig. 3 it is easy to see that there is a relation-ship between the lens’ focal length and aperture sizerelative to the number of pixels used and the size ofeach pixel. The incident beam is diffracted at anangle given by lyb, allowing N to be computed, givena fixed A and f, as
N 5Ab
22lfb2 . (5)
If more pixels than this are used, the light dif-fracted from those pixels at the edge of the SLMwill not be sufficiently collected by the lens, andultimately distortion will occur in the imaging sys-tem. Nb is therefore the effective diameter of acircle of pixels that will be adequately imaged bythe optical system. The total number of square
Fig. 3. Diffraction from a SLM forming the Fourier plane of thesignal beam.
pixels with an edge of length b fitting in this circleis given by
Np 5
pSNb2 D2
b2 5p
4N 2. (6)
After the lens, the signal forms a converging beamwith an angle given by
fs 5Nb2f
. (7)
he size of the Fourier plane, when we consider onlyhe fundamental order, is given by
W 52lfb
. (8)
To compute the area of the recording material illu-minated by the signal beam, the signal beam tiltangle us must also be accounted for. For the deriva-ion of the ellipse parameters for the areas illumi-ated on the two surfaces of the disk by the signaleam, we can use the technique developed for theeference beam by realizing that the diverging signaleam after the Fourier plane can be converted into anffective point source, as shown in Fig. 4. Althoughhe signal beam is not a spherical wave as in the caseor the reference beam, the approach is geometricallypplicable. The parameters of the equivalent pointource can be computed in terms of the other signaleam properties as
fse 5Nbf
,
xs 5lfb
sin~us 2 fsey2!
sin~fsey2!,
zs 5lfb
cos~us 2 fsey2!
sin~fsey2!. (9)
Fig. 4. Geometry of the signal beam to compute the area coveredon a recording material’s surface.
10 July 2001 y Vol. 40, No. 20 y APPLIED OPTICS 3389
Tt
Ftsts
tgad
3
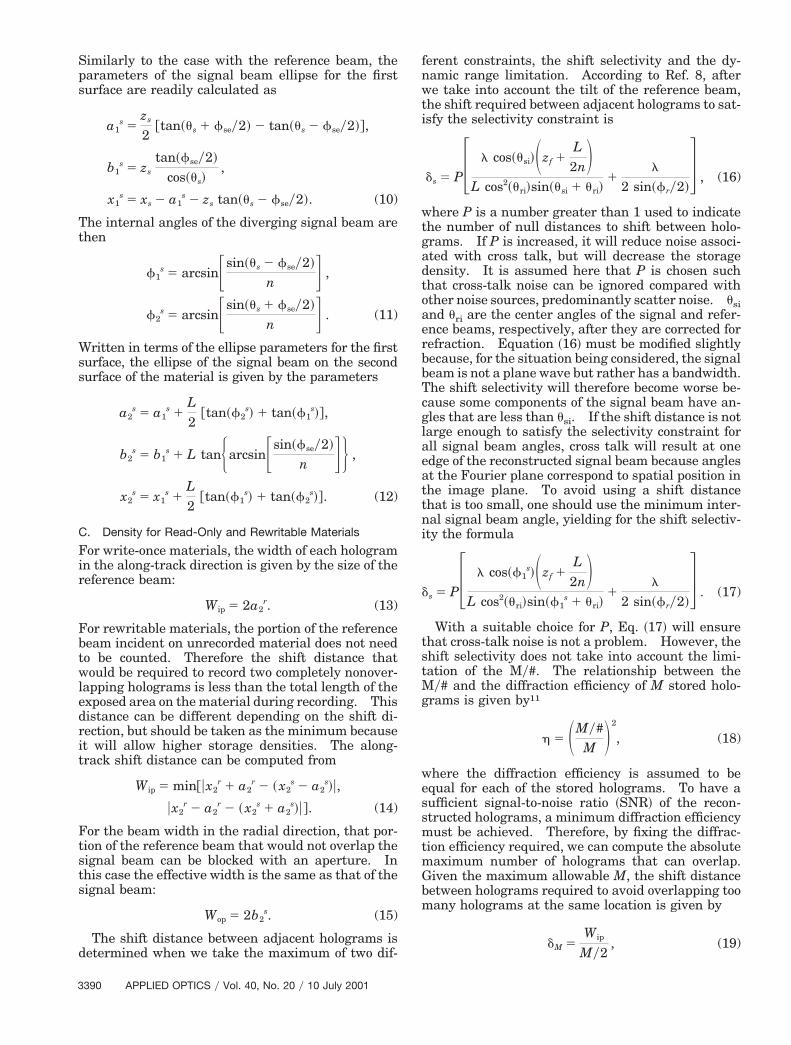
Similarly to the case with the reference beam, theparameters of the signal beam ellipse for the firstsurface are readily calculated as
a1s 5
zs
2@tan~us 1 fsey2! 2 tan~us 2 fsey2!#,
b1s 5 zs
tan~fsey2!
cos~us!,
x1s 5 xs 2 a1
s 2 zs tan~us 2 fsey2!. (10)
he internal angles of the diverging signal beam arehen
f1s 5 arcsinFsin~us 2 fsey2!
n G ,
f2s 5 arcsinFsin~us 1 fsey2!
n G . (11)
Written in terms of the ellipse parameters for the firstsurface, the ellipse of the signal beam on the secondsurface of the material is given by the parameters
a2s 5 a1
s 1L2
@tan~f2s! 1 tan~f1
s!#,
b2s 5 b1
s 1 L tanHarcsinFsin~fsey2!
n GJ ,
x2s 5 x1
s 1L2
@tan~f1s! 1 tan~f2
s!#. (12)
C. Density for Read-Only and Rewritable Materials
For write-once materials, the width of each hologramin the along-track direction is given by the size of thereference beam:
Wip 5 2a2r. (13)
For rewritable materials, the portion of the referencebeam incident on unrecorded material does not needto be counted. Therefore the shift distance thatwould be required to record two completely nonover-lapping holograms is less than the total length of theexposed area on the material during recording. Thisdistance can be different depending on the shift di-rection, but should be taken as the minimum becauseit will allow higher storage densities. The along-track shift distance can be computed from
Wip 5 min@ux2r 1 a2
r 2 ~ x2s 2 a2
s!u,
ux2r 2 a2
r 2 ~ x2s 1 a2
s!u#. (14)
or the beam width in the radial direction, that por-ion of the reference beam that would not overlap theignal beam can be blocked with an aperture. Inhis case the effective width is the same as that of theignal beam:
Wop 5 2b2s. (15)
The shift distance between adjacent holograms isdetermined when we take the maximum of two dif-
390 APPLIED OPTICS y Vol. 40, No. 20 y 10 July 2001
ferent constraints, the shift selectivity and the dy-namic range limitation. According to Ref. 8, afterwe take into account the tilt of the reference beam,the shift required between adjacent holograms to sat-isfy the selectivity constraint is
ds 5 P3 l cos~usi!Szf 1L2nD
L cos2~uri!sin~usi 1 uri!1
l
2 sin~fry2!4 , (16)
where P is a number greater than 1 used to indicatehe number of null distances to shift between holo-rams. If P is increased, it will reduce noise associ-ted with cross talk, but will decrease the storageensity. It is assumed here that P is chosen such
that cross-talk noise can be ignored compared withother noise sources, predominantly scatter noise. usiand uri are the center angles of the signal and refer-ence beams, respectively, after they are corrected forrefraction. Equation ~16! must be modified slightlybecause, for the situation being considered, the signalbeam is not a plane wave but rather has a bandwidth.The shift selectivity will therefore become worse be-cause some components of the signal beam have an-gles that are less than usi. If the shift distance is notlarge enough to satisfy the selectivity constraint forall signal beam angles, cross talk will result at oneedge of the reconstructed signal beam because anglesat the Fourier plane correspond to spatial position inthe image plane. To avoid using a shift distancethat is too small, one should use the minimum inter-nal signal beam angle, yielding for the shift selectiv-ity the formula
ds 5 P3 l cos~f1s!Szf 1
L2nD
L cos2~uri!sin~f1s 1 uri!
1l
2 sin~fry2!4 . (17)
With a suitable choice for P, Eq. ~17! will ensurethat cross-talk noise is not a problem. However, theshift selectivity does not take into account the limi-tation of the My#. The relationship between theMy# and the diffraction efficiency of M stored holo-grams is given by11
h 5 SMy#M D2
, (18)
where the diffraction efficiency is assumed to beequal for each of the stored holograms. To have asufficient signal-to-noise ratio ~SNR! of the recon-structed holograms, a minimum diffraction efficiencymust be achieved. Therefore, by fixing the diffrac-tion efficiency required, we can compute the absolutemaximum number of holograms that can overlap.Given the maximum allowable M, the shift distancebetween holograms required to avoid overlapping toomany holograms at the same location is given by
dM 5Wip
My2, (19)
vtpot
wd
Sdgtibrtphs
ssdT
ff
sil
ewa
fi
w
where Wip is taken from either Eq. ~13! for write-oncematerials or Eq. ~14! for rewritable materials. Thealue My2 is used because it is assumed that half ofhe holograms will be multiplexed by shifts in thelane of the reference and signal beams, whereas thether half of the holograms are to be multiplexedhrough an out-of-plane, or radial, shift.
Finally, the storage density can be calculated whene combine Eqs. ~6!, ~17!, ~19!, and ~15!. The finalensity is then
D 5Np
max~dM, ds!~Wopy2!. (20)
imply put, this is the number of bits per holographicata page divided by the effective area for each holo-ram. The effective area of each hologram is half ofhe width in the radial direction multiplied by then-track shift that is required, the maximum requiredy either selectivity or the My# limit. Half of theadial width is used because that is the shift requiredo cause a reconstructed hologram to rotate com-letely off the detector and will allow twice as manyolograms to be recorded in the same area, compen-ating for the My2 used in Eq. ~19!.Although use of Eq. ~20! to compute the surface
torage density appears simple, embedded in it areeveral parameters that may need to be optimizedepending on the particular situation to be modeled.ypically these are the reference beam angle ur, the
signal beam angle us, the reference beam divergenceand position xr, zr, the pixel size b, the imaging lens
, A, and material thickness L. Other parametersare typically fixed, such as the My# and the index ofrefraction n. Also, for a given system the amount ofnoise will dictate the required diffraction efficiency hneeded to obtain an acceptable SNR. While at-tempting to solve numerically for the parametersthat maximize the storage density, we discoveredthat local extrema exist in the function. Typically,when the number of parameters to be optimized ex-ceeded two, use of gradient-descent approaches tomaximize the density function resulted in solutionsdepending on the initial parameter values. To cir-cumvent this limitation, a genetic algorithm12 ap-proach was employed for optimizations.
3. Comparison with Experimental Results
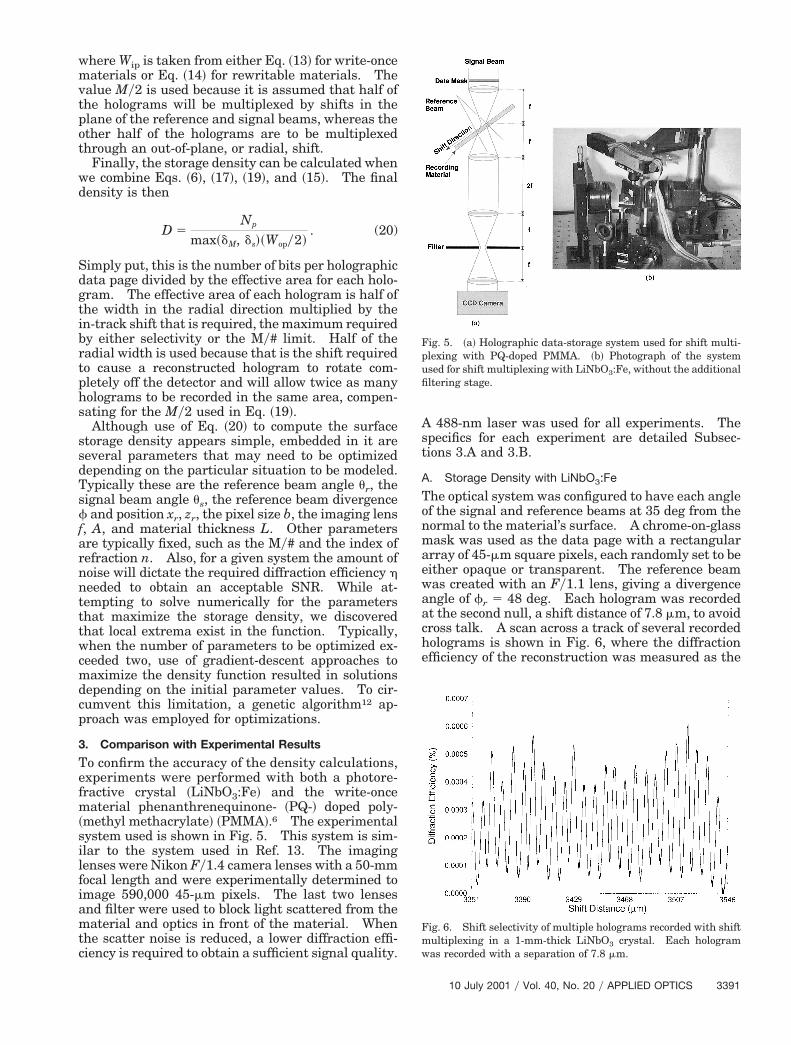
To confirm the accuracy of the density calculations,experiments were performed with both a photore-fractive crystal ~LiNbO3:Fe! and the write-oncematerial phenanthrenequinone- ~PQ-! doped poly-~methyl methacrylate! ~PMMA!.6 The experimentalystem used is shown in Fig. 5. This system is sim-lar to the system used in Ref. 13. The imagingenses were Nikon Fy1.4 camera lenses with a 50-mm
focal length and were experimentally determined toimage 590,000 45-mm pixels. The last two lensesand filter were used to block light scattered from thematerial and optics in front of the material. Whenthe scatter noise is reduced, a lower diffraction effi-ciency is required to obtain a sufficient signal quality.
A 488-nm laser was used for all experiments. Thespecifics for each experiment are detailed Subsec-tions 3.A and 3.B.
A. Storage Density with LiNbO3:Fe
The optical system was configured to have each angleof the signal and reference beams at 35 deg from thenormal to the material’s surface. A chrome-on-glassmask was used as the data page with a rectangulararray of 45-mm square pixels, each randomly set to beither opaque or transparent. The reference beamas created with an Fy1.1 lens, giving a divergencengle of fr 5 48 deg. Each hologram was recorded
at the second null, a shift distance of 7.8 mm, to avoidcross talk. A scan across a track of several recordedholograms is shown in Fig. 6, where the diffractionefficiency of the reconstruction was measured as the
Fig. 5. ~a! Holographic data-storage system used for shift multi-plexing with PQ-doped PMMA. ~b! Photograph of the systemused for shift multiplexing with LiNbO3:Fe, without the additional
ltering stage.
Fig. 6. Shift selectivity of multiple holograms recorded with shiftmultiplexing in a 1-mm-thick LiNbO3 crystal. Each hologram
as recorded with a separation of 7.8 mm.
10 July 2001 y Vol. 40, No. 20 y APPLIED OPTICS 3391
t3
4
pbed
mcvasubm
mu3tm
3
material was translated. Multiple tracks were re-corded with a separation of 0.75 mm, enough for thereconstruction to shift off the CCD detector.
At 590,000 pixelsyhologram, and a hologram areaof 0.75 mm 3 7.8 mm, the storage density is 100bitsymm2. The scatter noise integrated over the en-ire solid angle of the signal beam was measured as.4 3 1027, relative to the incident reference beam
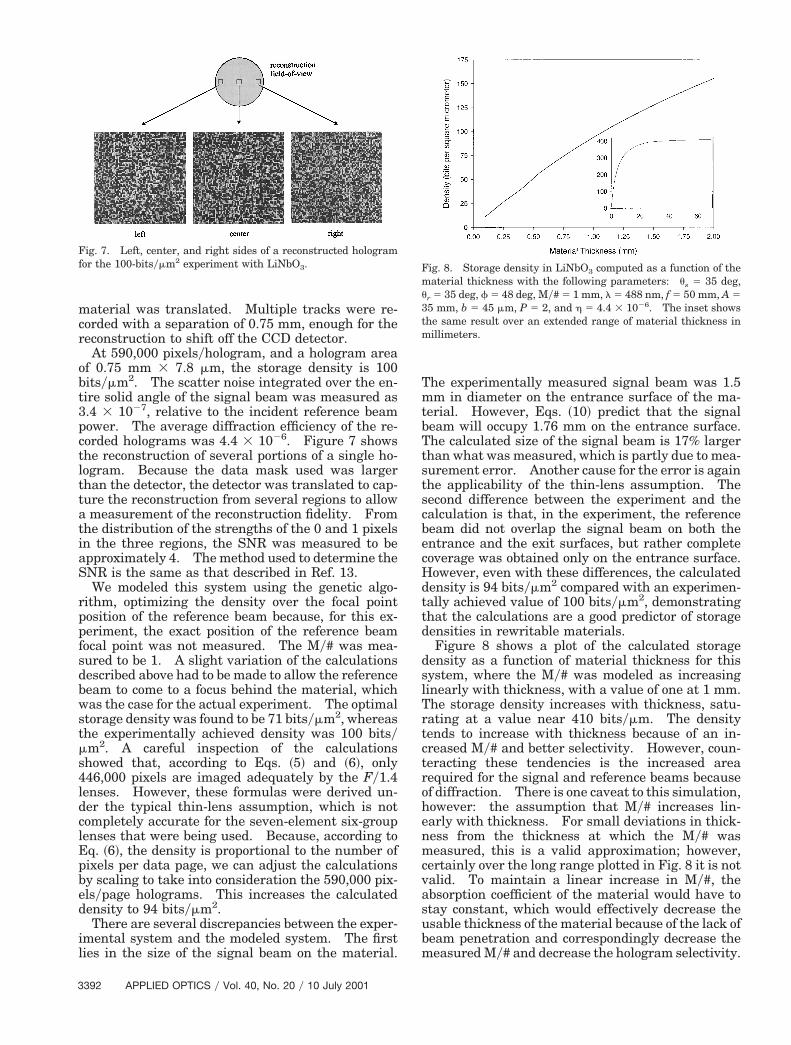
power. The average diffraction efficiency of the re-corded holograms was 4.4 3 1026. Figure 7 showsthe reconstruction of several portions of a single ho-logram. Because the data mask used was largerthan the detector, the detector was translated to cap-ture the reconstruction from several regions to allowa measurement of the reconstruction fidelity. Fromthe distribution of the strengths of the 0 and 1 pixelsin the three regions, the SNR was measured to beapproximately 4. The method used to determine theSNR is the same as that described in Ref. 13.
We modeled this system using the genetic algo-rithm, optimizing the density over the focal pointposition of the reference beam because, for this ex-periment, the exact position of the reference beamfocal point was not measured. The My# was mea-sured to be 1. A slight variation of the calculationsdescribed above had to be made to allow the referencebeam to come to a focus behind the material, whichwas the case for the actual experiment. The optimalstorage density was found to be 71 bitsymm2, whereasthe experimentally achieved density was 100 bitsymm2. A careful inspection of the calculationsshowed that, according to Eqs. ~5! and ~6!, only46,000 pixels are imaged adequately by the Fy1.4
lenses. However, these formulas were derived un-der the typical thin-lens assumption, which is notcompletely accurate for the seven-element six-grouplenses that were being used. Because, according toEq. ~6!, the density is proportional to the number of
ixels per data page, we can adjust the calculationsy scaling to take into consideration the 590,000 pix-lsypage holograms. This increases the calculatedensity to 94 bitsymm2.There are several discrepancies between the exper-
imental system and the modeled system. The firstlies in the size of the signal beam on the material.
Fig. 7. Left, center, and right sides of a reconstructed hologramfor the 100-bitsymm2 experiment with LiNbO3.
392 APPLIED OPTICS y Vol. 40, No. 20 y 10 July 2001
The experimentally measured signal beam was 1.5mm in diameter on the entrance surface of the ma-terial. However, Eqs. ~10! predict that the signalbeam will occupy 1.76 mm on the entrance surface.The calculated size of the signal beam is 17% largerthan what was measured, which is partly due to mea-surement error. Another cause for the error is againthe applicability of the thin-lens assumption. Thesecond difference between the experiment and thecalculation is that, in the experiment, the referencebeam did not overlap the signal beam on both theentrance and the exit surfaces, but rather completecoverage was obtained only on the entrance surface.However, even with these differences, the calculateddensity is 94 bitsymm2 compared with an experimen-tally achieved value of 100 bitsymm2, demonstratingthat the calculations are a good predictor of storagedensities in rewritable materials.
Figure 8 shows a plot of the calculated storagedensity as a function of material thickness for thissystem, where the My# was modeled as increasinglinearly with thickness, with a value of one at 1 mm.The storage density increases with thickness, satu-rating at a value near 410 bitsymm. The densitytends to increase with thickness because of an in-creased My# and better selectivity. However, coun-teracting these tendencies is the increased arearequired for the signal and reference beams becauseof diffraction. There is one caveat to this simulation,however: the assumption that My# increases lin-early with thickness. For small deviations in thick-ness from the thickness at which the My# was
easured, this is a valid approximation; however,ertainly over the long range plotted in Fig. 8 it is notalid. To maintain a linear increase in My#, thebsorption coefficient of the material would have totay constant, which would effectively decrease thesable thickness of the material because of the lack ofeam penetration and correspondingly decrease theeasured My# and decrease the hologram selectivity.
Fig. 8. Storage density in LiNbO3 computed as a function of theaterial thickness with the following parameters: us 5 35 deg,
r 5 35 deg, f 5 48 deg, My# 5 1 mm, l 5 488 nm, f 5 50 mm, A 55 mm, b 5 45 mm, P 5 2, and h 5 4.4 3 1026. The inset showshe same result over an extended range of material thickness inillimeters.
tlmrtom1cdb
lcc0u
B. Storage Density with Phenanthrenequinone-DopedPoly~methyl methacrylate!
For this experiment, the recording system was config-ured for the reference beam to be incident normallyonto the material, while we kept the signal beam at a35-deg angle. A chrome-on-glass data mask was usedagain, but with square pixels with an edge length of 40mm. The reference beam came to a focus approxi-mately 2 cm in front of the material, with a divergenceangle measured as 8.6 deg. Between hologram expo-sures the material was shifted normal to the referencein the plane of the recording beams by 50 mm, thedistance required to multiplex at the second null forthe 3-mm-thick material. The diameter of the signalbeam on the material was approximately 1.7 mm,yielding a density of 7 bitsymm2. In this case, theholograms were recorded in nonoverlapping tracks.The measured SNR was 3, with an average hologramdiffraction efficiency of 4 3 1024.
The simulation of this system was made with theactual values for all parameters except for the posi-tion of the focal point of the reference beam. Opti-mization over these two parameters was madebecause measurement of the exact position relative tothe incidence of the signal beam on the material couldnot be made accurately enough for use in the simu-lation. For example, when we use the above-quotedfocal point distance of 2 cm and optimize the laterallocation of the focal point xf, the calculations showhat it is not possible for the reference beam to over-ap the signal beam completely on both surfaces of the
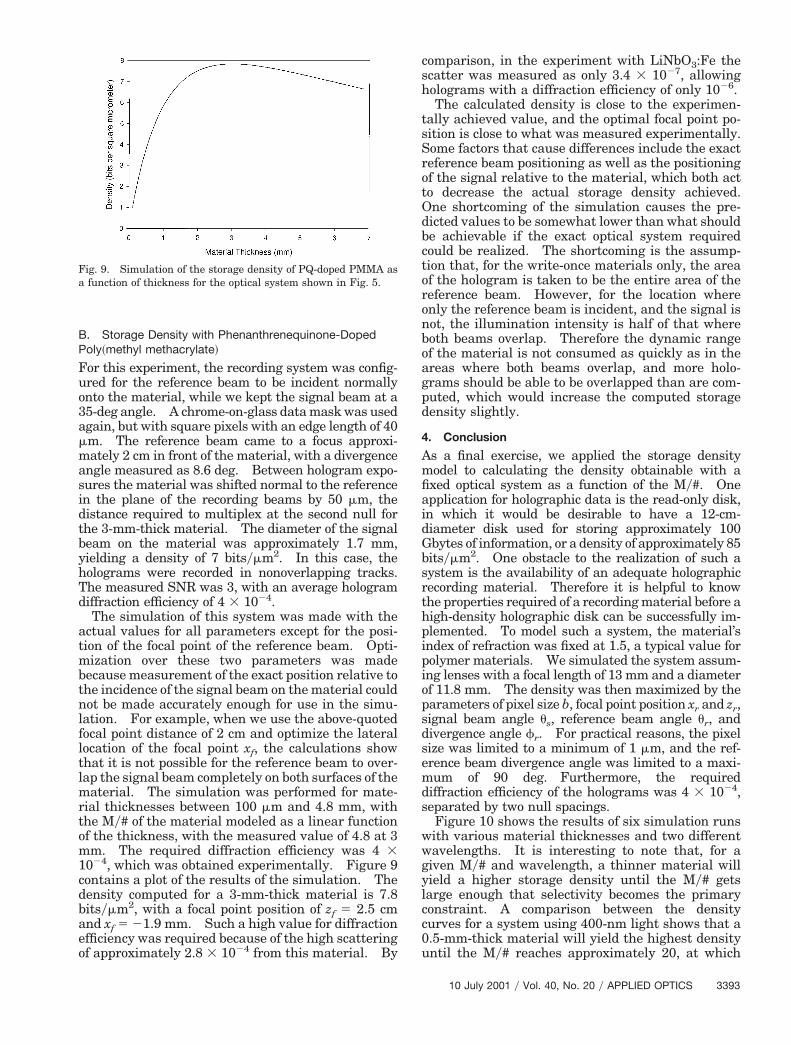
aterial. The simulation was performed for mate-ial thicknesses between 100 mm and 4.8 mm, withhe My# of the material modeled as a linear functionf the thickness, with the measured value of 4.8 at 3m. The required diffraction efficiency was 4 3
024, which was obtained experimentally. Figure 9ontains a plot of the results of the simulation. Theensity computed for a 3-mm-thick material is 7.8itsymm2, with a focal point position of zf 5 2.5 cm
and xf 5 21.9 mm. Such a high value for diffractionefficiency was required because of the high scatteringof approximately 2.8 3 1024 from this material. By
Fig. 9. Simulation of the storage density of PQ-doped PMMA asa function of thickness for the optical system shown in Fig. 5.
comparison, in the experiment with LiNbO3:Fe thescatter was measured as only 3.4 3 1027, allowingholograms with a diffraction efficiency of only 1026.
The calculated density is close to the experimen-tally achieved value, and the optimal focal point po-sition is close to what was measured experimentally.Some factors that cause differences include the exactreference beam positioning as well as the positioningof the signal relative to the material, which both actto decrease the actual storage density achieved.One shortcoming of the simulation causes the pre-dicted values to be somewhat lower than what shouldbe achievable if the exact optical system requiredcould be realized. The shortcoming is the assump-tion that, for the write-once materials only, the areaof the hologram is taken to be the entire area of thereference beam. However, for the location whereonly the reference beam is incident, and the signal isnot, the illumination intensity is half of that whereboth beams overlap. Therefore the dynamic rangeof the material is not consumed as quickly as in theareas where both beams overlap, and more holo-grams should be able to be overlapped than are com-puted, which would increase the computed storagedensity slightly.
4. Conclusion
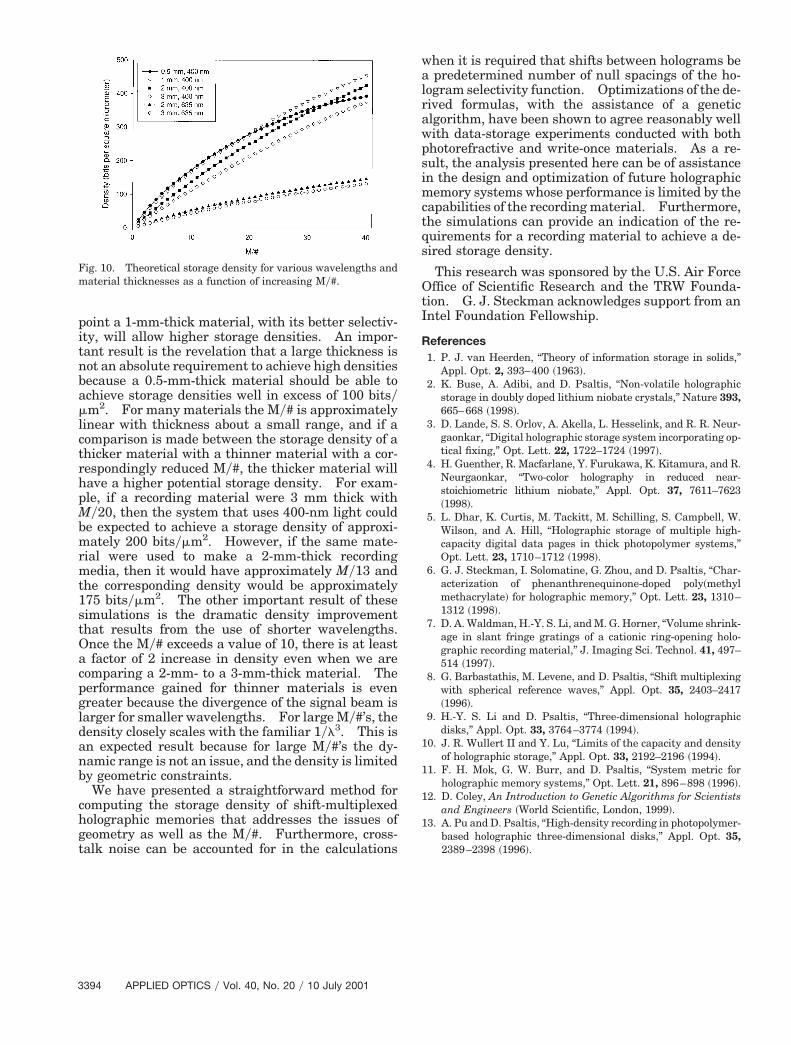
As a final exercise, we applied the storage densitymodel to calculating the density obtainable with afixed optical system as a function of the My#. Oneapplication for holographic data is the read-only disk,in which it would be desirable to have a 12-cm-diameter disk used for storing approximately 100Gbytes of information, or a density of approximately 85bitsymm2. One obstacle to the realization of such asystem is the availability of an adequate holographicrecording material. Therefore it is helpful to knowthe properties required of a recording material before ahigh-density holographic disk can be successfully im-plemented. To model such a system, the material’sindex of refraction was fixed at 1.5, a typical value forpolymer materials. We simulated the system assum-ing lenses with a focal length of 13 mm and a diameterof 11.8 mm. The density was then maximized by theparameters of pixel size b, focal point position xr and zr,signal beam angle us, reference beam angle ur, anddivergence angle fr. For practical reasons, the pixelsize was limited to a minimum of 1 mm, and the ref-erence beam divergence angle was limited to a maxi-mum of 90 deg. Furthermore, the requireddiffraction efficiency of the holograms was 4 3 1024,separated by two null spacings.
Figure 10 shows the results of six simulation runswith various material thicknesses and two differentwavelengths. It is interesting to note that, for agiven My# and wavelength, a thinner material willyield a higher storage density until the My# getsarge enough that selectivity becomes the primaryonstraint. A comparison between the densityurves for a system using 400-nm light shows that a.5-mm-thick material will yield the highest densityntil the My# reaches approximately 20, at which
10 July 2001 y Vol. 40, No. 20 y APPLIED OPTICS 3393
m
acpgl
3
point a 1-mm-thick material, with its better selectiv-ity, will allow higher storage densities. An impor-tant result is the revelation that a large thickness isnot an absolute requirement to achieve high densitiesbecause a 0.5-mm-thick material should be able toachieve storage densities well in excess of 100 bitsy
m2. For many materials the My# is approximatelylinear with thickness about a small range, and if acomparison is made between the storage density of athicker material with a thinner material with a cor-respondingly reduced My#, the thicker material willhave a higher potential storage density. For exam-ple, if a recording material were 3 mm thick withMy20, then the system that uses 400-nm light couldbe expected to achieve a storage density of approxi-mately 200 bitsymm2. However, if the same mate-rial were used to make a 2-mm-thick recordingmedia, then it would have approximately My13 andthe corresponding density would be approximately175 bitsymm2. The other important result of thesesimulations is the dramatic density improvementthat results from the use of shorter wavelengths.Once the My# exceeds a value of 10, there is at least
factor of 2 increase in density even when we areomparing a 2-mm- to a 3-mm-thick material. Theerformance gained for thinner materials is evenreater because the divergence of the signal beam isarger for smaller wavelengths. For large My#’s, the
density closely scales with the familiar 1yl3. This isan expected result because for large My#’s the dy-namic range is not an issue, and the density is limitedby geometric constraints.
We have presented a straightforward method forcomputing the storage density of shift-multiplexedholographic memories that addresses the issues ofgeometry as well as the My#. Furthermore, cross-talk noise can be accounted for in the calculations
Fig. 10. Theoretical storage density for various wavelengths andmaterial thicknesses as a function of increasing My#.
394 APPLIED OPTICS y Vol. 40, No. 20 y 10 July 2001
when it is required that shifts between holograms bea predetermined number of null spacings of the ho-logram selectivity function. Optimizations of the de-rived formulas, with the assistance of a geneticalgorithm, have been shown to agree reasonably wellwith data-storage experiments conducted with bothphotorefractive and write-once materials. As a re-sult, the analysis presented here can be of assistancein the design and optimization of future holographicmemory systems whose performance is limited by thecapabilities of the recording material. Furthermore,the simulations can provide an indication of the re-quirements for a recording material to achieve a de-sired storage density.
This research was sponsored by the U.S. Air ForceOffice of Scientific Research and the TRW Founda-tion. G. J. Steckman acknowledges support from anIntel Foundation Fellowship.
References1. P. J. van Heerden, “Theory of information storage in solids,”
Appl. Opt. 2, 393–400 ~1963!.2. K. Buse, A. Adibi, and D. Psaltis, “Non-volatile holographic
storage in doubly doped lithium niobate crystals,” Nature 393,665–668 ~1998!.
3. D. Lande, S. S. Orlov, A. Akella, L. Hesselink, and R. R. Neur-gaonkar, “Digital holographic storage system incorporating op-tical fixing,” Opt. Lett. 22, 1722–1724 ~1997!.
4. H. Guenther, R. Macfarlane, Y. Furukawa, K. Kitamura, and R.Neurgaonkar, “Two-color holography in reduced near-stoichiometric lithium niobate,” Appl. Opt. 37, 7611–7623~1998!.
5. L. Dhar, K. Curtis, M. Tackitt, M. Schilling, S. Campbell, W.Wilson, and A. Hill, “Holographic storage of multiple high-capacity digital data pages in thick photopolymer systems,”Opt. Lett. 23, 1710–1712 ~1998!.
6. G. J. Steckman, I. Solomatine, G. Zhou, and D. Psaltis, “Char-acterization of phenanthrenequinone-doped poly~methylmethacrylate! for holographic memory,” Opt. Lett. 23, 1310–1312 ~1998!.
7. D. A. Waldman, H.-Y. S. Li, and M. G. Horner, “Volume shrink-age in slant fringe gratings of a cationic ring-opening holo-graphic recording material,” J. Imaging Sci. Technol. 41, 497–514 ~1997!.
8. G. Barbastathis, M. Levene, and D. Psaltis, “Shift multiplexingwith spherical reference waves,” Appl. Opt. 35, 2403–2417~1996!.
9. H.-Y. S. Li and D. Psaltis, “Three-dimensional holographicdisks,” Appl. Opt. 33, 3764–3774 ~1994!.
10. J. R. Wullert II and Y. Lu, “Limits of the capacity and densityof holographic storage,” Appl. Opt. 33, 2192–2196 ~1994!.
11. F. H. Mok, G. W. Burr, and D. Psaltis, “System metric forholographic memory systems,” Opt. Lett. 21, 896–898 ~1996!.
12. D. Coley, An Introduction to Genetic Algorithms for Scientistsand Engineers ~World Scientific, London, 1999!.
13. A. Pu and D. Psaltis, “High-density recording in photopolymer-based holographic three-dimensional disks,” Appl. Opt. 35,2389–2398 ~1996!.