Page 1
1
Part IStrengthening EMIS in India
Strengthening EMIS in IndiaDISE Initiatives
Background
Free and compulsory education to all children
up to the age of fourteen years is a
Constitutional commitment in India. The
Government of India initiated a number of programmes
to achieve the goal of Universalisation of Elementary
Education (UEE) among which the Sarva Shiksha Abhiyan
(SSA), launched in 2001, is the most recent one. It aims
at achieving universal elementary education of
satisfactory quality by 2010.
For successful implementation of any educational
programme, effective monitoring and an efficient
information system are essential. While monitoring
framework for SSA is developed
separately, concerted efforts have also
been made towards strengthening
Educational Management Information
System (EMIS) in case of elementary
level of education. District Elementary
Education Plans (DEEP) across the
country are being developed primarily
based on the data generated though
the information system developed for
the SSA, i.e. the District Information
System for Education (DISE). This
section deals with the efforts made under DISE towards
developing a school-based information system covering
management and organization of information collection,
dissemination and utilization, as also limitations and
major areas of concern. A number of government and
semi-government agencies are involved in the collection
of information on educational variables. Among them
the Department of Higher Education of the Ministry of
Human Resource Development (MHRD), Government
of India, is the main agency responsible for the collection
of numeric information on regular basis. The MHRD
collects information from all the recognized institutions
of the country annually with 30th September as the
reference date and school being the unit of data
collection. MHRD publishes the state-specific
information through its publication, namely Education
in India. The latest available volumes of this publication
covering various aspects are: 1999-2000, Volume I:
Numeric Information; 1997-98, Volume II: Financial
Data; and 1999-2000, Volume III: Examination Results.
However, another publication, though a provisional one,
titled Selected Educational Statistics, is the latest available
for the year 2005-06.
The National Council of Educational Research and
Training (NCERT) also collects information on special
variables through its All India Educational Survey, once
in every five to eight years with habitation as its unit of
data collection. Full results of the Seventh Survey, with
September 30, 2002 as its date of
reference, were made available in
2007. The basic purpose of collecting
information on special variables
through the all-India school survey
is to provide inputs for formulating
five-year plans. It may also be noted
that neither the MHRD nor NCERT
disseminates full set of district-
specific data; hence time-series data
on key indicators is not available.
On the other hand, a number of semi-government
agencies, like the National Sample Survey Organization
(NSSO), Census of India, and the International Institute
for Population Studies (National Family Health Survey),
also from time to time collect information on a few
educational variables as part of their regular household
sample surveys. NSSO in addition conducts special survey
on education through its Participation in Education series,
64th Round being the latest one. The Government of
India through the Educational Consultants India Limited
(Ed. CIL) and Indian Market Research Bureau (IMRB),
had recently commissioned a nation-wide survey for
estimating the out-of-school children of age group 6-
14 years. Similarly, a non-government organization,
Pratham, also conducts a household survey to estimate
“District ElementaryEducation Plans across the
country are being developedprimarily based on the data
generated though theinformation system
developed for the SSA, i.e.the District InformationSystem for Education”
Page 2
Part I
2
Elementary Education in India : Analytical Report
out-of-school children (6-13 years), facilities in schools
and learning ability of children in the rural India. It has
decided to conduct such surveys till 2010 (for details
see Student Flow at Primary Level: A Study Based on
DISE Data. MHRD, Government of India; and NUEPA,
New Delhi, 2007). In addition, the Government of India
through the Ed. CIL has also commissioned studies on
student's attendance, drop-out rates and teacher's
absence in primary and upper primary schools in a
few select states. NCERT also conducted learner's
assessment studies, both in case of primary and upper
limitations are: (i) multiple data collection agencies and
directorates involved in data collection and lack of
coordination among them; (ii) lack of understanding of
the concept and definitions of educational statistics; (iii)
lack of adequate, qualified and trained staff at different
levels; (iv) problems in distribution and collection of
data-capture formats; (v) lack of district-specific time-
series data; (vi) time-lag in data; (vii) reliability of
education data; (viii) data gaps; (ix) lack of computers
at lower levels; (x) creation of new districts and re-
demarcation of boundaries of the existing districts; (xi)
primary levels of education. It intends to monitor
quality of elementary education through a set of
formats that it has developed for SSA.
Indian education system is one of the largest
education systems in the world as it caters to the needs
of more than 1,000 million people. In view of its size,
the information system has certain limitations, both
administrative and non-administrative. Some of these
poor dissemination and utilization of data; and (xii) lack
of accountability at different levels. Notwithstanding
these limitations, the school statistics form the basis of
planning, monitoring and evaluation of various aspects
of education, in general, and primary and elementary
education, in particular. The manual system of
information collection under the MHRD even does not
have uniform school format. Rather it has got
consolidated sheets at different levels. In view of this, it
Page 3
3
Part IStrengthening EMIS in India
is not possible to undertake validation of data at any
level. The first consolidation of data takes place at the
block level and in large blocks in view of a large number
of schools; it is not an easy task to consolidate the data
manually, especially when officers at this level are
generally not properly trained to deal with huge amount
of data.
Sporadic attempts have been made in the past to
develop a computerized educational management
information system in India. Of these, efforts made under
the District Primary Education Programme (DPEP) and
Sarva Shiksha Abhiyan (SSA) are apparently among the
most successful ones. Most of the earlier attempts at
the Central and State Governments levels failed to sustain
and as such the overall situation remained a matter of
concern. At the time of initiating District Primary
Education Programme (DPEP) in 1994-95, it was felt
that a sound information system was
essential for successful monitoring
and implementation of the
programme. It was also realized that
to strengthen educational statistical
database for planning and
management in a decentralized
framework, an innovative model
was needed. It was expressed that
DPEP, with a focus on decentralized
planning, required up-to-date and
reliable school level information as
soon as it was collected. It further
reiterated, in the context of
decentralization of primary education, the imperativeness
of more efficient and effective school and community
databases so that the signals relating to the trends in
critical indicators could be tracked at various levels of
decision-making. The MHRD in 1994-95, as a part of
the DPEP national endeavour, decided to design and
develop a school-based computerized information
system, and entrusted the main responsibility to the
National Institute of Educational Planning and
Administration (NIEPA), New Delhi, (now National
University of Educational Planning and Administration
[NUEPA]).
In this background, a pilot project for revitalization
of educational statistics in India was initiated at NUEPA
during 1995 with financial assistance from UNICEF. The
project aimed at examining issues related to identification
of data needs, processes and procedures for data
collection, developing a framework for data flows and
computerization, and facilitating the use of educational
indicators in planning, management, monitoring and
evaluation. Such a comprehensive and integrated
approach was necessitated by the fact that the then
existing system could not provide the school level data
in time and that it was highly limited in scope and
coverage. Similarly, the use of educational statistics for
planning and monitoring in the decentralized framework
was also minimal. There were no systematic checks on
the internal consistency of data. Data on many critical
variables was either not collected at all or was not
processed to facilitate decision-making. In tune with the
spirit of the DPEP, district was selected as a nodal point
for collection, computerization, analysis and use of school
level data. NUEPA designed and
developed the core Data-Capture
Formats in consultation with the
experts and states. Accordingly,
NUEPA designed the software for
implementation at the district level
and provided necessary technical
and professional support to all the
DPEP districts.
The first version (dbase) of
the software, named as 'District
Information System for Education'
(DISE), was released in the middle
of 1995. The district level
professionals were assisted and
trained in the establishment of EMIS units. The first major
review of the DISE software was undertaken during
1997-98 (PowerBuilder/SQL Anywhere). The software
was later re-designed in 2001 in the light of requirements
of the SSA (PowerBuilder/Oracle). Not only the coverage
of DISE was extended to non-DPEP states but it was
also expanded to cover the entire elementary level of
education. In view of the state-specific requirements,
NUEPA conducted workshops in 2005 and 2006 and
sought suggestions about DISE format and software in
the light of which DISE format as well as software was
modified and made available to all the DISE users across
the country. Efforts are being made to further improve
the DISE software so as to make it complete user-friendly
menu-driven software with emphasis on report module.
“NNNNNUEPA designed anddeveloped the core Data-
Capture Formats in
consultation with the expertsand states. Accordingly,
NUEPA designed the software
for implementation at thedistrict level and provided
necessary technical and
professional support toall the districts”
Page 4
Part I
4
Elementary Education in India : Analytical Report
DISE 2001 Software: Main Features
The main features of DISE 2001 Software are
briefly presented below:
� The system covers eight years of schooling in
all recognized primary, upper primary and
primary/upper primary sections of the secondary
and higher secondary schools
� The concept and definitions of educational
variables involved therein have been
standardized at the national level and are
uniformally followed by all districts and states.
� Manual aggregation of data at
different levels is completely
replaced by computerized data
entry and report generation
system.
� The system defines core
data on school location,
management, rural-urban,
enrolment, buildings, equip-
ment, teachers, incentives,
medium of instruction,
chi ldren with disabi l i t ies,
examination results and student flows.
� Detailed data on individual teachers, para-
teachers, community teachers and their profile,
including data on in-service training received,
is collected and made available.
� The states/districts have flexibility of adding
supplementary variables depending upon their
specific requirements on year-to-year basis. No
additional software for computerization and
analysis of state/district specific data is required.
� The states/districts can develop their own large
database using 'designer' module and integrate
a variety of school/cluster/block level data with
it. The software handles multiple databases at
various levels and provides tools of data analysis
and presentation.
� A large number of standardized reports on
school-related variables and performance
indicators aggregated at the cluster, block and
district levels, are generated by the software.
� DISE ensures two-way flow of information.
School Report Card for each school is generated
for sharing with the school and members of
Village Education Committee.
� DISE presents multi-user and modular system of
software design for better management and
security of databases.
� It responds to pre-defined
queries on standard aspects, like
school list, list of villages without
primary and upper primary
schools, single-teacher schools,
schools with type of building,
schools with high PTR, etc.
� Data can be exported to
many other formats for statistical
and other analysis by users.
Major Outcome of DISEEfforts
� Through the concerted efforts, MIS Unit is now
operational both at the district and state levels
and is equipped with necessary hardware and
software.
� The DISE software is now operational in all the
districts of the country (35 States & UTs) and is
providing vital information for preparation of
district elementary education plans.
� What is more remarkable about DISE is that it
has drastically reduced the time-lag in the
availability of educational statistics which is now
down from 7-8 years to about a year at the
national level and only a few months at the
district and state levels.
� DISE has also el iminated data gaps as
comprehensive information is now available on
“What is more remarkableabout DISE is that it
has drastically reduced
the time-lag in the availabilityof educational statisticswhich is now down from
7-8 years to about ayear at the nationallevel and only a few
months at the districtand state levels”
Page 5
5
Part IStrengthening EMIS in India
all aspects of universal elementary education at
different levels.
� As a part of DISE activities, District Report Cards
on elementary education is being released
annually, which contain cross-sectional data on
a number of variables at the district level. State
Report Cards are also being disseminated for the
last five years. The Analytical Report containing
detailed analysis of DISE data is also being
published annually (see Table A1).
� A few states have extended the coverage of DISE
to the unrecognized schools. A study based on
the unrecognized schools of Punjab was recently
brought out by NUEPA.
� Every effort is made to
promote the use of DISE
data for planning,
management and
monitoring of SSA through
case studies, orientation
and training workshops of
educational planners and
administrators. It has now
become a regular feature to
share the DISE data at
different levels every year.
At the national level, major
findings of DISE data are
being shared every year with planners,
administrators, policy makers, educationists and
other data users.
� Official website of DISE (http://dise.in) has been
developed and is being updated frequently.
District Report Cards and raw data in case of
each of the district covered under DISE are
uploaded along with other DISE publications. All
the DISE publications are also available to users
in a Compact Disk.
� As an online help to users, DISE group of users
is formed on the Internet, which is very active.
Users post problems of common interest to
group for their solutions.
� The Government of India has recently
constituted a committee to review educational
statistics (including DISE activities), report of
which is awaited. Most likely the committee may
recommend expansion of DISE from elementary
to secondary and higher secondary levels of
education. In fact, a few states at their own have
already expanded the coverage of DISE in their
states. A few states have also decided to have
DISE as the only source of information so far as
elementary level of education is concerned.
NUEPA has also undertaken a massive project
to strengthen secondary education MIS.
In addition to the annual
publications mentioned above (see
Table A1), the Union Minister of
Human Resource Development
recently released School Report
Cards of more than one million
primary and upper primary
schools/sections, based on DISE
data. Besides quantitat ive
information, the Report Cards also
provide qualitative information
and a descriptive report about
individual schools. All that can now
be accessed with the click of a mouse (http://
schoolreportcards.in). Option of downloading raw data,
of late is also being provided to users so that empirical
studies based on DISE data can be undertaken.
Through the DISE Flash Statistics: 2006-07, an
effort has been made to compute an Educational
Development Index based on DISE data and states
are ranked accordingly. To facilitate computation of
district-specific EDIs, NUEPA recently conducted
workshop to orient state level officers towards
computation of an EDI. It is hoped that EDI will help
decide the future course of investment on elementary
education.
“Government of India
has recently constituted
a committee to review
educational statistics
report of which is awaited.
Most likely the committee
may recommend expansion
of DISE from elementary
to secondary and higher
secondary levels of
education”
Page 6
Part I
6
Elementary Education in India : Analytical Report
DISE : Coverage
Initially, 42 districts across seven DPEP phase-one
states, namely Assam, Haryana, Karnataka, Kerala,
Madhya Pradesh, Maharashtra and Tamil Nadu, were
covered under DISE. The number of districts covered
has gradually increased with the expansion of the DPEP
as the districts included under phase-two and three have
also been covered. At the end of 2001, more than 270
districts spread over 18 states of the country had adopted
DISE. With the launching of the Sarva Shiksha Abhiyan
in 2001, the scope of DISE was enlarged to cover the
entire elementary level of education, embracing all the
districts of the country. Even prior to SSA, a number of
DPEP states expanded the coverage of DISE to their non-
DPEP districts. In 2002-03, the coverage was further
expanded to 461 districts across 18 states. However, the
coverage was confined only to DPEP states. During 2003-
04, the coverage was further widened to bring in its
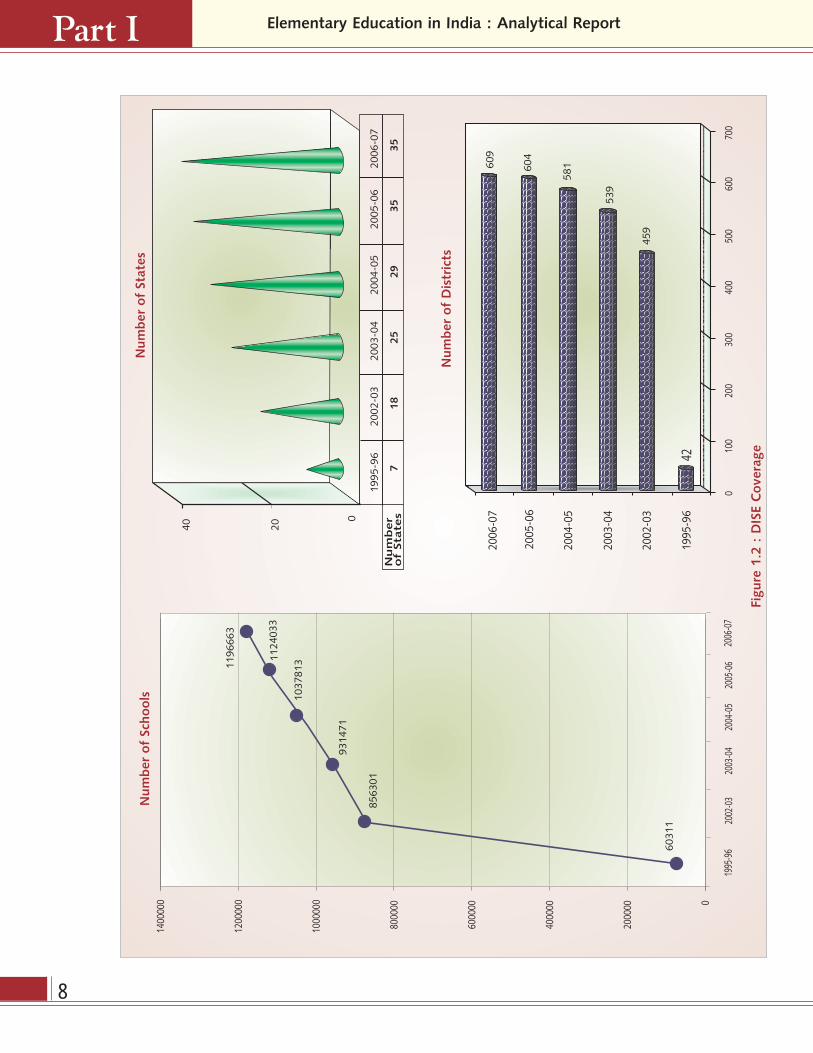
covered under DISE further increased to 609
compared to 604 in 2005-06.
Publications
The District Report Cards: 2006-07 and the State
Report Cards: 2006-07 are being published separately
(Elementary Education in India: Where do we stand-
District Report Cards: 2006-07, Volume I & II; and
Elementary Education in India: Where do we stand -
State Report Cards: 2006-07 , NUEPA and
Government of India, New Delhi). In addition, DISE
Flash Statistics: 2006-07 containing state-specific key
indicators was also released recently. Thus, the state-
wise DISE data is now available for five years and the
district-wise data for more than seven years. The data
is also available on the official website of DISE, i.e.
http://dise.in.
Though over time, data utilisation has improved,
which is reflected in the District Elementary Education
Plans developed under the aegis of Sarva Shiksha
Abhiyan, yet there is still scope for further improvement.
Efforts have been made to create demand for the DISE
data. All the DISE publications have been made available
to a large number of university libraries, research and
resource institutions, educationists, planners,
administrators, policy makers and other data users across
the country which has created awareness about the DISE
data. Through concerted efforts, it is hoped that demand
for DISE data will be generated in years that follow.
fold as many as 539 districts (including bifurcated
districts) across 25 States & UTs of the country (Table
A2). It was for the first time that seven non-DPEP states
i.e. Chandigarh, Manipur, Meghalaya, Mizoram,
Nagaland, Punjab and Tripura adopted DISE during 2003-
04. During 2004-05, four more States and UTs, i.e.
Arunachal Pradesh, Delhi, Jammu & Kashmir, and
Puducherry, were covered under DISE. By the year 2005-
06, all the districts of the country spread over all the
35 States and UTs had been covered for the first
time under DISE (see Figure 1.2). During 2006-07
(as on 30th September 2006), the number of districts
Table A1
DISE : Annual Publications
• Elementary Education in India: Progress towards UEE: DISE Flash Statistics
• Elementary Education in India: Where do we stand?, District Report Cards, Volume I
• Elementary Education in India: Where do we stand?, District Report Cards, Volume II
• Elementary Education in India: Where do we stand?, State Report Cards
• Elementary Education in India: Progress towards UEE, Analytical Report
• Elementary Education in India: Progress towards UEE, Analytical Tables
• Elementary Education in Rural India: Analytical Tables
• Elementary Education in Urban India: Analytical Tables
• CD Containing DISE Publications
• Websites : www.schoolreportcards.inwww.dise.in
Page 7
7
Part IStrengthening EMIS in India
Table A2DISE : 2006-07 : Coverage
School Structure
State/UTPrimary Upper 2001
Primary Census2003-04 2004-05 2005-06 2006-07
1 Andaman & Nicobar Islands I-V VI-VIII 2 – – 2 3
2 Andhra Pradesh I-V VI-VIII 23 23 23 23 23
3 Arunachal Pradesh I-V VI-VIII 13 – 15* 15* 16*
4 Assam I-IV V-VII 23 23 23 23 23
5 Bihar I-V VI-VIII 37 37 37 37 37
6 Chandigarh I-V VI-VIII 1 1 1 1 1
7 Chhattisgarh I-V VI-VIII 16 16 16 16 16
8 Dadra & Nagar Haveli I-IV V-VII 1 – – 1 1
9 Daman & Diu I-IV V-VII 2 – – 2 2
10 Delhi I-V VI-VIII 9 – 9 9 9
11 Goa I-IV V-VII 2 – – 2 2
12 Gujarat I-IV V-VII 25 25 25 25 25
13 Haryana I-V VI-VIII 19 17+ 19 19 20
14 Himachal Pradesh I-V VI-VIII 12 12 12 12 12
15 Jammu & Kashmir I-V VI-VIII 14 – 12+ 14 14
16 Jharkhand I-V VI-VIII 18 22* 22* 22* 22*
17 Karnataka I-IV V-VII 27 27 27 27 27
18 Kerala I-IV V-VII 14 14 14 14 14
19 Lakshadweep I-IV V-VII 1 – – 1 1
20 Madhya Pradesh I-V VI-VIII 45 45 45 48* 48*
21 Maharashtra I-IV V-VII 35 35 35 35 35
22 Manipur I-V VI-VIII 9 – – 9 9
23 Meghalaya I-IV V-VII 7 7 7 7 7
24 Mizoram I-IV V-VII 8 8 8 8 8
25 Nagaland I-V VI-VIII 8 8 8 8 8
26 Orissa I-V VI-VII 30 30 30 30 30
27 Puducherry I-V VI-VIII 4 – 4 4 4
28 Punjab I-V VI-VIII 17 17 17 17 19
29 Rajasthan I-V VI-VIII 32 32 32 32 32
30 Sikkim I-V VI-VIII 4 4 4 4 4
31 Tamil Nadu I-V VI-VIII 30 29 29 30 30
32 Tripura I-V VI-VIII 4 4 4 4 4
33 Uttar Pradesh I-V VI-VIII 70 70 70 70 70
34 Uttarakhand I-V VI-VIII 13 13 13 13 13
35 West Bengal I-IV V-VIII 18 20* 20* 20* 20*
Number of Districts – – 593 539* 581* 604* 609*
* Including bifurcated districts.
+ Data for all districts not reported.
Sl.No.
Number of Districts
Reported DISE Data
Page 8
Part I
8
Elementary Education in India : Analytical Report
Fig
ure
1.2
: D
ISE C
overa
ge
Page 9
9
Part IStrengthening EMIS in India
Table A3DISE 2006-07: State Summary
Data Reported FromSl. No. State/UT
Districts Blocks Villages Schools Enrolment** Teachers
1 A & N Islands 3 9 196 350 52426 3521
2 Andhra Pradesh 23 1128 25666 100932 11306819 511579
3 Arunachal Pradesh 16* 79 2753 3412 276457 12829
4 Assam 23 145 22037 63996 5422711 221047
5 Bihar 37 532 32471 54884 15120547 237449
6 Chandigarh 1 20 20 178 125123 5353
7 Chhattisgarh 16 146 22298 48968 4195222 155652
8 D & N Haveli 1 1 70 276 46699 1038
9 Daman & Diu 2 2 41 86 20858 637
10 Delhi 9 28 413 4742 2344914 93657
11 Goa 2 11 626 1420 164963 6854
12 Gujarat 25 230 19615 38472 7540861 216564
13 Haryana 20 119 7603 16180 2492009 78157
14 Himachal Pradesh 12 118 9995 16614 1081599 59143
15 Jammu & Kashmir 14 200 6985 20711 1628930 101959
16 Jharkhand 22* 212 28480 40618 6355016 131646
17 Karnataka 27 180 27473 55364 7889506 249971
18 Kerala 14 165 1921 12183 3401987 127672
19 Lakshadweep 1 8 10 30 8082 417
20 Madhya Pradesh 48* 316 53958 125858 15182309 398744
21 Maharashtra 35 378 42728 86429 15342625 552369
22 Manipur 9 35 2117 3869 462190 22650
23 Meghalaya 7 44 5433 9268 539515 29873
24 Mizoram 8 36 813 2782 226923 16025
25 Nagaland 8 49 1276 2537 471439 21075
26 Orissa 30 418 34922 51198 4927827 150692
27 Puducherry 4 6 365 668 179739 7612
28 Punjab 19 142 12773 20950 2702272 85118
29 Rajasthan 32 341 37767 100965 12462231 396930
30 Sikkim 4 9 855 1226 121995 9779
31 Tamil Nadu 30 412 19273 52423 9776589 360463
32 Tripura 4 45 951 3679 697525 31013
33 Uttar Pradesh 70 966 90804 168969 32162514 608638
34 Uttarakhand 13 102 11489 19161 1269903 49326
35 West Bengal 20* 483 38612 67265 13342492 263126
All States 609 7115 562809 1196663 179342817 5218578
* Including bifurcated districts.**Enrolment as per school structure.
Page 10
Part I
10
Elementary Education in India : Analytical Report
State-wise number of blocks, villages, schools etc,
from which data is received is presented in Table A3.
The Analytical Report: 2006-07 is divided into two parts:
first part presents analysis of data, whereas, the part two
presents state-wise information on key indicators. The
indicators analyzed and tables presented are organised
into School and Facility Indicators, Teacher-Related
Indicators and Enrolment-Related Indicators. The Tables
contain information on a large number of variables,
mostly presented by school category and wherever
necessary by rural and urban areas, and management
category. Indicators required for formulating reliable
elementary education plans are presented in a ready-
to-use form. Wherever necessary, time-series data is also
presented either at the national and/or state level.
Except on quality of education, comprehensive
information is presented on all the
aspects of universalisation.
Examination results in the terminal
Grades IV/V and VII/VIII are
considered as proxy indicator of
achievement levels and the same is
presented separately in the case of
boys and girls. An attempt has also
been made to compute indicators of
internal efficiency of education
system, which are based on DISE
2005-06 and 2006-07 data. More specifically, the
analysis covers the following important areas of
elementary education:
a) Number of schools, enrolment, and teachers,
classified by school category and school
management
b) Examination results for the previous academic
session for the terminal classes at primary and upper
primary levels of education
c) Classrooms, categorized into good condition,
requiring minor repair, and requiring major repair
by school category
d) Number of schools by category and by type of
buildings
e) Sex-wise enrolment of children with disabilities at
primary and upper primary levels
f) Gender and caste distribution of regular and para-
teachers and the proportion of teachers undergoing
in-service teacher training during the pervious year
g) Distribution of regular and para-teachers by
educational and professional qualifications and by
school category
h) Enrolment by school category
i) Performance indicators in
terms of school category; ratio of
primary to upper primary schools/
sections; enrolment distribution:
total, Scheduled Castes, Scheduled
Tribes and Other Backward Class
and Muslim minority, percentage
female enrolment; gender-parity
index; schools with attached pre-
primary classes; percentage of under-age and over-
age children in primary and upper primary classes;
apparent survival rate at primary level, dropout and
retention rates, and transition rate from primary to
upper primary level; and
j) Quality indicators according to category of schools;
teacher-pupil ratio; students-classroom ratio;
availability of drinking water, common toilet, and
girl’s toilet in school.
“Indicators
analyzed and tables
presented are organised
into School and Facility
Indicators, Teacher-
Related Indicators and
Enrolment-Related
Indicators”
The main indicators presented in the Analytical Report/Tables have been derived by using the following illustrative
formulae. The formulae are given for schools in the primary category only. The same method is applied for other
categories and classification groups.
Primary schools having single classroom1. % Single–classroom schools = x 100
Total primary schools
Primary schools with single teacher in position2. % Single–teacher schools = x 100
Total primary schools
Page 11
11
Part IStrengthening EMIS in India
Primary schools having student classroom ratio > 603. % Schools with SCR > 60 = x 100
Total primary schools
Primary schools having pre-primary sections4. % Schools with pre-primary = x 100
sections Total primary schools
Primary schools having common toilet5. % Schools with common = x 100
toilet Total primary schools
Primary schools having girls’ toilet6. % Schools with girls’ toilet = x 100
Total primary schools
Enrolment in primary schools having EducationDepartment, Local Body, Tribal Welfare Department
& others as school management7. % Enrolment in government = x 100
schools Total enrolment in primary schools
Enrolment in primary schools having private aided and private unaided as school management
8. % Enrolment in private = x 100schools Total enrolment in primary schools
Enrolment in primary schools having single teacher9. % Enrolment in single-teacher = x 100
schools Enrolment in total number of schoolshaving primary category
Primary schools having teacher > 2 butno female teacher
10. % No-female teacher schools = x 100(teacher > 2) Total primary schools
Enrolment in primary schools having no building11. % Students in schools = x 100
without building Enrolment in primary schools
Enrolment in Grades I-V below ‘6’ & above ‘11’ years12. % Under-age & over-age = x 100
children Total enrolment in Grades I-V
Enrolment of SC in primary classes13. % SC enrolment = x 100
Total enrolment in primary classes
Enrolment of SC girls in primary classes14. % SC girls to SC enrolment = x 100
SC enrolment in primary classes
Enrolment of ST in primary classes15. % ST enrolment = x 100
Total enrolment in primary classes
Page 12
Part I
12
Elementary Education in India : Analytical Report
Enrolment of Muslim minority in primary classes16. % Muslim enrolment = x 100
Total enrolment in primary classes
Enrolment of ST girls in primary classes17. % ST girls to ST enrolment = x100
ST enrolment in primary classes
Total enrolment in schools of primary category18. Pupil–Teacher Ratio (PTR) =
Total teachers in schools of primary category
(Para-teachers have been included while calculating PTR)
Total enrolment in primary schools19. Student–Classroom Ratio =
(SCR) Total classrooms in primary schools
Number of primary schools havingenrolment < 50 in Grades I – IV/V
20. % Schools with < 50 = x 100students in Grades I – IV/V Total primary schools
Total primary schools having PTR > 10021. % Schools with PTR > 100 = x 100
Total primary schools
Total female teachers in primary schools22. % Female teachers = x 100
Total teachers in primary schools
(Para-teachers have been included while calculating this indicator)
Total primary schools established since 199423. % of Primary schools established = x 100
Total primary schools
(The denominator excludes those schools for which year of establishment is not given)
24. Flow Rates
(a) Promotion Rate
Pg+1
t+1
(Pt
g) = x 100
Eg
t
where
Pg+1
t+1 = Number of students promoted to Grade ‘g+1’in year ‘t+1’, and
Eg
t= Total number of students in Grade ‘g’ in year ‘t’.
(b) Repetition Rate
Rg
t+1
(rtg) = x 100
Eg
t
Page 13
13
Part IStrengthening EMIS in India
where
Rg t+1 = Number of repeaters in Grade ‘g’ in year ‘t+1’
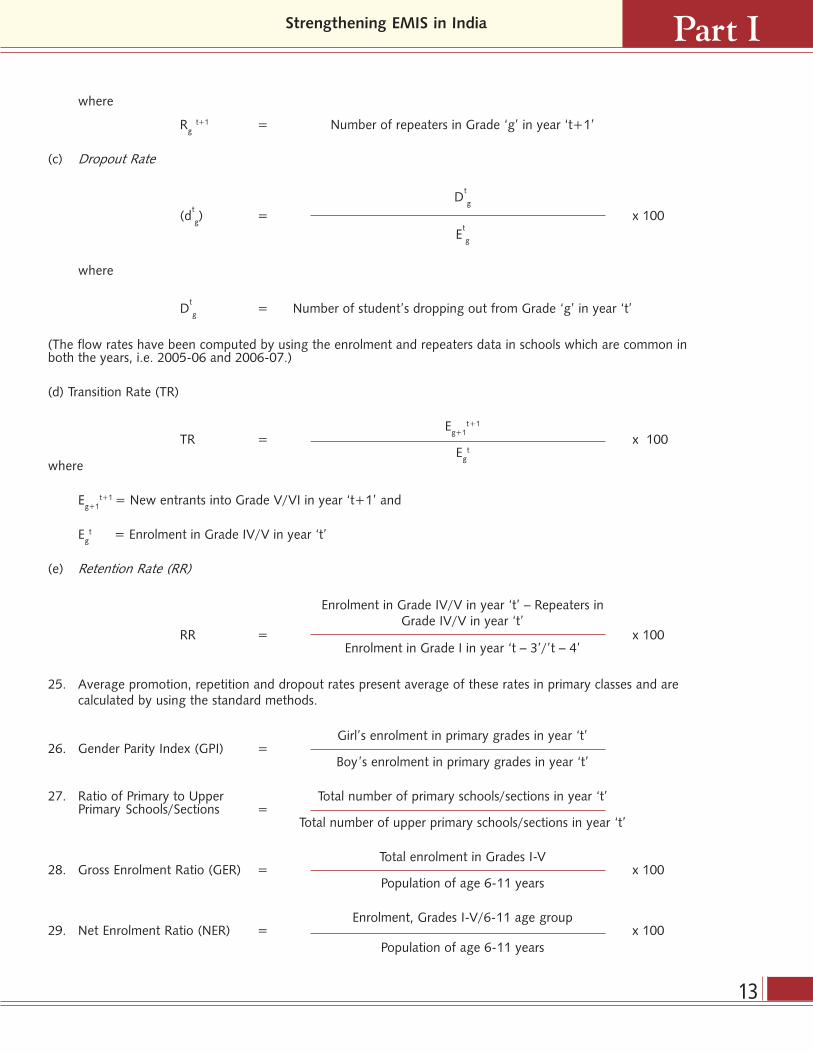
(c) Dropout Rate
Dt
g
(dt
g) = x 100
Et
g
where
Dt
g= Number of student’s dropping out from Grade ‘g’ in year ‘t’
(The flow rates have been computed by using the enrolment and repeaters data in schools which are common inboth the years, i.e. 2005-06 and 2006-07.)
(d) Transition Rate (TR)
Eg+1
t+1
TR = x 100E
gt
where
Eg+1
t+1 = New entrants into Grade V/VI in year ‘t+1’ and
Eg
t = Enrolment in Grade IV/V in year ‘t’
(e) Retention Rate (RR)
Enrolment in Grade IV/V in year ‘t’ – Repeaters inGrade IV/V in year ‘t’
RR = x 100Enrolment in Grade I in year ‘t – 3’/’t – 4’
25. Average promotion, repetition and dropout rates present average of these rates in primary classes and arecalculated by using the standard methods.
Girl’s enrolment in primary grades in year ‘t’26. Gender Parity Index (GPI) =
Boy’s enrolment in primary grades in year ‘t’
27. Ratio of Primary to Upper Total number of primary schools/sections in year ‘t’Primary Schools/Sections =
Total number of upper primary schools/sections in year ‘t’
Total enrolment in Grades I-V28. Gross Enrolment Ratio (GER) = x 100
Population of age 6-11 years
Enrolment, Grades I-V/6-11 age group29. Net Enrolment Ratio (NER) = x 100
Population of age 6-11 years
Page 14
Part I
14
Elementary Education in India : Analytical Report
30. Input per graduate presents average number of years an education system is taking in producing primary
graduate which is based upon the Reconstructed Cohort Method by assuming that no child will repeat a grade
more than three times;
31. In-service training, school & TLM grants received, examination results etc. are presented for the previous
academic year;
32. Percentage of teachers in different age groups is presented only for teachers under government
managements; and
33. Average number of days teachers spent on non-teaching assignments is applicable to only those teachers who
were assigned non-teaching assignments and not to all teachers.
dissemination and analysis at the national level. From
the national level, feedback on data quality was provided
to all the States and UTs.
Procedures for the data validation and verification
of sample data capture formats at the district level have
been prescribed, and the districts
reported the steps taken by them to
ensure quality and reliability of data
collection. The DISE software also
checks for internal inconsistencies in
the data and generates reports for
verification by the District Project
Office. The State Project Office while
transferring the data from the district
to the state database ensures that the
data received from the district is
complete and free from any
inconsistency. Most of the states have engaged an
independent agency for sample checking of data. At the
national level, data from the State Project Office is
received to ensure compliance with various quality
control measures. Despite these efforts, some
inconsistencies and missing data are observed at the
national level. A few schools have not responded to all
the classificatory variables like management, year of
establishment, rural/urban classification, school category,
building status, academic and professional qualifications
of teachers, and caste and sex code for teachers.
Wherever possible, efforts are made to analyse the data
by excluding the no-response values. However, in some
cases, the ‘no-responses’ are explicit from the tables and
hence the totals may not match across various tables
due to different number of no-responses. In cross-
tabulation analysis, the no-responses are excluded.
Concerns about Quality of Data
Raw data presented in the document or used for
calculating indicators are essentially based on data
provided by the States and UTs through annual data
collection under SSA (DISE).
NUEPA is committed to provide
professional and software support
to all States and UTs as well as for
dissemination and analysis of
the data as it is provided by the
individual States and UTs. In no
way, it is involved in data collection
as such and therefore, the accuracy
and truthfulness of the data rest
with the States and UTs.
The data is provided by the
State Project/Mission Directors
through the Technical Support Group of the Department
of School Education and Literacy, MHRD. The data was
supposed to be first cross-checked and validated at the
district and then at the state level. Before that, the Cluster
Resource Centre Coordinator was supposed to
thoroughly check the filled-in formats received from the
schools falling under his or her jurisdiction. CRC
coordinators are made accountable to ensure that data
is consistent and there are no missing values. Before
the formats were passed on to the block level, they were
also supposed to ensure that the coverage was complete
and to certify that the data was free from all
inconsistencies. Similarly, consistency module provided
in the DISE software was required to run at the district
level. After the state was satisfied with the quality and
reporting of the data, the data was submitted for
“Procedures for thedata validation and
verification of sample datacapture formats at thedistrict level have been
prescribed, and thedistricts reported thesteps taken by them to
ensure quality and reliabilityof data collection”
Page 15
15
Part IStrengthening EMIS in India
Needless to mention that the percentages, rates
and ratios presented in the report are based on the
schools that have responded to a particular question and
hence may not be applicable to the entire state. Thus,
schools by management, there location in rural and urban
areas, type of schools, schools by category, enrolment
(general, SC. ST, OBC, Muslim and by medium of
instructions), pupil-teacher ratio, student-classroom ratio,
percentage of girls in primary and upper primary classes
and other such indicators should therefore be viewed in
the light of these limitations.
Over a period of time, the number of schools
covered under DISE increased significantly. During 2006-
07, data has been collected from
more than 1.2 million schools, with
a comprehensive profile of more
than 5.2 million teachers also being
maintained by DISE. Despite best
efforts, it is still possible that the
field agencies might have not
covered all the recognised schools
imparting elementary education
supposed to be covered under DISE
which is specifically true for schools
under private managements. A few
districts have collected data from
these schools while others might not have covered all
such schools. Despite significant increase in number
of private schools covered under DISE (225 thousand
in 2006-07), field level functionaries reported that
data from a few private un-aided schools couldn’t be
obtained for the one or the other reason. We are
trying to reach all such schools and are hopeful that
these efforts will be reflected in the following year.
In addition, un-recognised schools are not supposed
to be covered under DISE which in a few states may
be in large numbers. However, states like Andhra
Pradesh and Punjab have extended the coverage of
DISE to un-recognised schools in their states and
collected information by using the DISE Data Capture
Format. NUEPA would be happy to provide assistance
to states extending coverage of DISE to un-recognised
schools in their states.
It has also been observed that a few schools did
not report age and grade matrix which is crucial in
knowing the status of elementary education. A few states
even did not report enrolment of Grade VIII because of
composition of school structure in the state. Therefore,
enrolment in upper primary classes does not present the
complete picture in Grades VI-VIII; thus GER and NER
may not give correct portrayal of universalisation in such
states and the same may be considered as percentage
of children of an age-group enrolled in schools that
reported data under DISE. The remaining children may
either be out-of-school or enrolled in unrecognized
schools, Education Guarantee Schools (EGS), non-formal
education centers and other learning centers not covered
under DISE. Irrespective of the school structure,
enrolment ratio at the Primary level
is based on Grades I-V and of the
Upper Primary level, Grades VI-VIII.
The single-age projected population
provided by the Office of the
Registrar General of India has been
used in estimating child population.
An attempt has also been made to
compute flow rates in case of States
and UTs having DISE data for more
than two years. While analysing the
flow rates, it is noticed that in some
cases the data is inconsistent which is also true for
apparent survival, retention and transition rate. Indicators
in case of such States and UTs have not been reported.
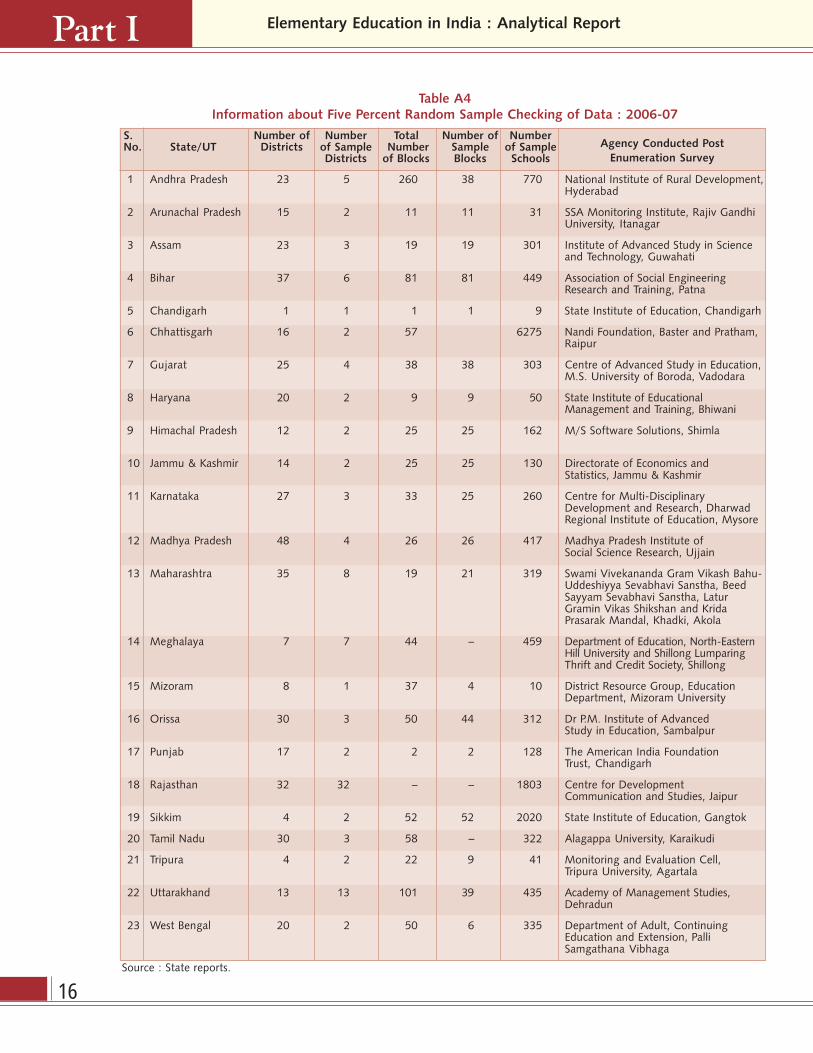
Random Checking of Data
With an aim to further improve the quality and
reliability of data, it has been made mandatory for all
the States & UTs to get the DISE data sample checked
by an independent agency from the year 2006-07
onwards, for which NUEPA suggested the sampling
methodology and developed a special data capture
format for post enumeration survey. It is heartening to
note that as many as 23 states initiated random sample
checking of data in its very first year, most of which are
conducted by the monitoring institutions (ICSSR funded
institutions) identified for the states (see Table A4).
However, in a few states the task was entrusted to private
agencies. It is hoped that more such institutions will be
entrusted the task of sample checking of DISE data in
year that follows and the quality of reports would also
“Un-recognised schools arenot supposed to be coveredunder DISE which in a few
states may be in largenumbers. States like Andhra
Pradesh and Punjab haveextended the coverage of
DISE to un-recognised schoolsin their states and collected
information by using the DISEData Capture Format”
Page 16
Part I
16
Elementary Education in India : Analytical Report
Table A4Information about Five Percent Random Sample Checking of Data : 2006-07
S. Number of Number Total Number of NumberNo. State/UT Districts of Sample Number Sample of Sample
Districts of Blocks Blocks Schools
1 Andhra Pradesh 23 5 260 38 770 National Institute of Rural Development,Hyderabad
2 Arunachal Pradesh 15 2 11 11 31 SSA Monitoring Institute, Rajiv GandhiUniversity, Itanagar
3 Assam 23 3 19 19 301 Institute of Advanced Study in Scienceand Technology, Guwahati
4 Bihar 37 6 81 81 449 Association of Social EngineeringResearch and Training, Patna
5 Chandigarh 1 1 1 1 9 State Institute of Education, Chandigarh
6 Chhattisgarh 16 2 57 6275 Nandi Foundation, Baster and Pratham,Raipur
7 Gujarat 25 4 38 38 303 Centre of Advanced Study in Education,M.S. University of Boroda, Vadodara
8 Haryana 20 2 9 9 50 State Institute of EducationalManagement and Training, Bhiwani
9 Himachal Pradesh 12 2 25 25 162 M/S Software Solutions, Shimla
10 Jammu & Kashmir 14 2 25 25 130 Directorate of Economics andStatistics, Jammu & Kashmir
11 Karnataka 27 3 33 25 260 Centre for Multi-DisciplinaryDevelopment and Research, DharwadRegional Institute of Education, Mysore
12 Madhya Pradesh 48 4 26 26 417 Madhya Pradesh Institute ofSocial Science Research, Ujjain
13 Maharashtra 35 8 19 21 319 Swami Vivekananda Gram Vikash Bahu-Uddeshiyya Sevabhavi Sanstha, BeedSayyam Sevabhavi Sanstha, LaturGramin Vikas Shikshan and KridaPrasarak Mandal, Khadki, Akola
14 Meghalaya 7 7 44 – 459 Department of Education, North-EasternHill University and Shillong LumparingThrift and Credit Society, Shillong
15 Mizoram 8 1 37 4 10 District Resource Group, EducationDepartment, Mizoram University
16 Orissa 30 3 50 44 312 Dr P.M. Institute of AdvancedStudy in Education, Sambalpur
17 Punjab 17 2 2 2 128 The American India FoundationTrust, Chandigarh
18 Rajasthan 32 32 – – 1803 Centre for DevelopmentCommunication and Studies, Jaipur
19 Sikkim 4 2 52 52 2020 State Institute of Education, Gangtok
20 Tamil Nadu 30 3 58 – 322 Alagappa University, Karaikudi
21 Tripura 4 2 22 9 41 Monitoring and Evaluation Cell,Tripura University, Agartala
22 Uttarakhand 13 13 101 39 435 Academy of Management Studies,Dehradun
23 West Bengal 20 2 50 6 335 Department of Adult, ContinuingEducation and Extension, PalliSamgathana Vibhaga
Source : State reports.
Agency Conducted Post
Enumeration Survey
Page 17
17
Part IStrengthening EMIS in India
improve. NUEPA is planning to conduct a workshop
of data users in which sample checking of data will
also be discussed and monitoring institutions would
be invited to participate in the workshop.
The main objectives of sample checking were
to judge the accuracy of data and to identify the gaps
and weaknesses and seek suggestions regarding
remedial measures for strengthening the system and
for further improving the quality of data. A sample
of 10 percent of districts with a minimum of 2 districts
in each state was suggested to be
drawn. Depending upon the total
number of blocks in a district, a
sample of 3 to 4 blocks was
recommended for selection. While
selecting the sample blocks, due
consideration was given to the
present status of educational
development in terms of literacy
rate, rural/urban areas and proportion of SC and ST
population; and within each sample block, a random
sample of 5 percent of the total schools was selected.
A careful examination of reports reveals that only in
the case of a few variables, such as enrolment and
examination results, the deviation noticed in post-
enumeration and DISE data is found significant and
in case of other variables, such as school particulars
and infrastructure facilities, only a little deviation is
noticed. In a few states, such as Tamil Nadu, no
deviation is observed in case of the most of the
variables included in the post-enumeration survey.
Some of the suggestions provided by the institutions,
who conducted PES, are summarized below:
• Keep DISE format short and simple. School
particulars, post sanctioned budget release etc,
should be collected from the authorities at block/
district level.
• DISE format may also include some qualitative
variables concerning problems of students, teachers
and parents, effectiveness of teaching etc.
• VEC and PTA members should be involved in the
process of data collection, dissemination and
utilization. BRC and CRC Coordinators should visit
the schools frequently.
• Training on DISE once in a year
is not sufficient. Rigorous and
quality training should be arranged
for teachers and teachers preferably
with mathematics background be
involved in data collection.
• There is a need for frequent
monitoring and validation of
information at the grassroots level. Nevertheless,
scrutiny of DISE formats, preferably at the cluster
level, is needed to be made mandatory.
• All the schools covered under DISE have been
provided school report cards. The District Project
Coordinators should ensure sharing of report cards
with the head teachers, CRC and village
community.
• MIS Unit at the district level should be strengthened
and it be provided with sufficient staff.
• Time-lag between DISE and PES should be
minimized. States should be requested to initiate
corrective measures in the light of findings and
recommendations of the PES.
“With an aim to furtherimprove the quality and
reliability of data, it has beenmade mandatory for all the
States to get the DISE datasample checked by an
independent agency from theyear 2006-07 onwards”
Page 19
19
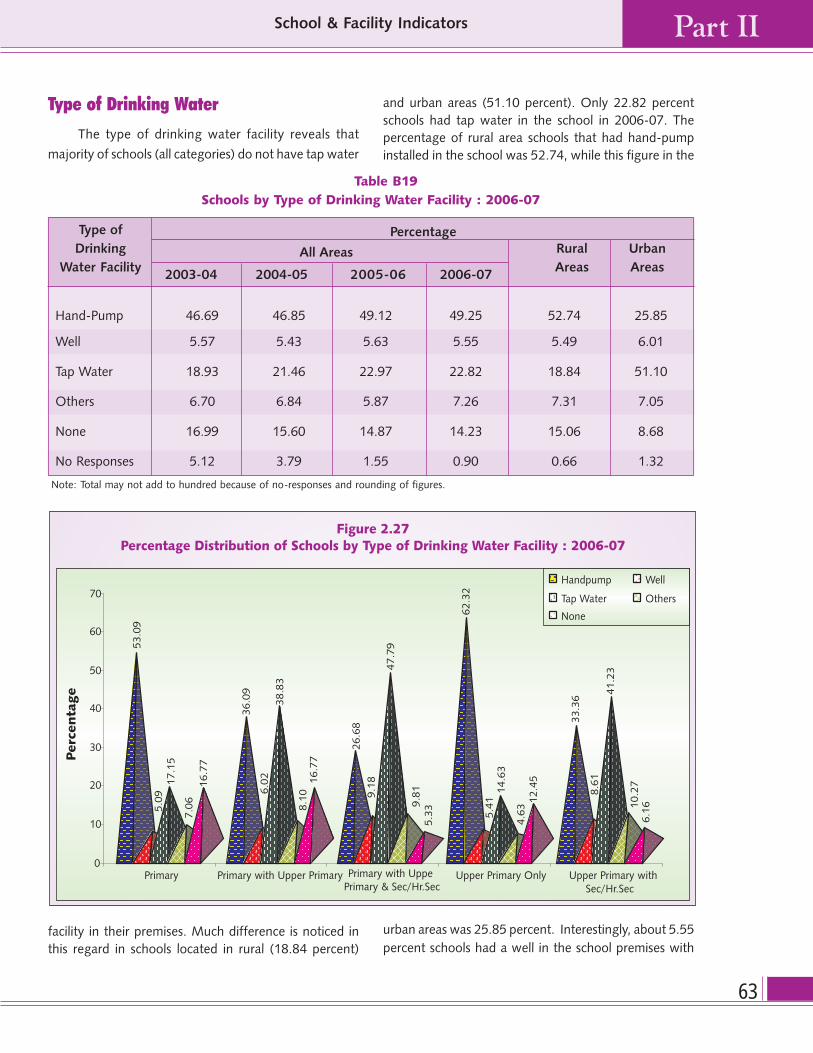
Part IISchool & Facility Indicators
with Upper Primary, Secondary & Higher Secondary; (iv)
Independent Upper Primary; and (v) Upper Primary with
Secondary & Higher Secondary, for all the 35 States &
UTs, and the average of all states covered under DISE in
2006-07, together with selected indicators for previous
years, are presented. DISE mandate being to collect
information from all the recognized institutions imparting
elementary education (Classes I to VIII), irrespective of
the school type; the six management types, by which
information has been analysed are Department of
Education, Local Body, Tribal and Social Welfare
Departments and Private Aided, Private Unaided, and
Other Managements. Wherever necessary, an indicator
is also separately presented for all the Government
(Department of Education, Local Body, Tribal & Social
Welfare Departments and Other
managements) and Private (Aided
and Unaided) managements
together as well as separately for
rural and urban areas. Other
managements are in fact the
Government managements but are
not included in the first three
managements presented above.
First, the total number of
schools is presented. It is followed
by ratio of Primary to Upper Primary schools/sections
by school management. While calculating the ratio, all
the Primary schools/sections are added together and then
divided by the total number of all schools/sections
imparting Upper Primary education. This is followed by
percentage distribution of schools by management and
schools located in the rural areas. Distance from the
Cluster Resource Centre (CRC) is the next indicator that
is analysed by distance slabs, followed by a few other
indicators, such as schools visited by CRC coordinators,
average number of classrooms, single-classroom and
single-teacher schools, schools with enrolment below
50, and schools with classroom ratio above 60, all of
which reveal useful information on different aspects of
universalisation of elementary education. Presence of
Introduction
One of the important components of
universalisation of education is universal
access, which is measured in terms of
availability of Primary and Upper Primary schools/
sections within a distance of one and three km
respectively from the habitation. Apart from distance,
opening of school is also linked to population size of
habitation which is 300 and 500 and more respectively
in case of Primary and Upper Primary schools. The
national norms of distance and population size are
indicative in nature as the states have their own norms
in view of hilly areas, bordering districts, difficult areas,
SC and ST dominant areas etc.
Since 1950, the country has
made significant progress towards
making available schooling facilities
in general and Primary and Upper
Primary schools/sections in
particular. Hence over a period of
time, the number of schools across
the country has increased many-
fold which is also evident from the
percentage of habitations served by
the Primary and Upper Primary
schools/sections as per the data generated by the NCERT
through its all-India educational survey. It is also true for
the percentage of rural population served by the
schooling facilities. Schooling facilities might have further
significantly improved since 2002, the year in which
NCERT conducted Seventh Survey. It is also important
to note that activities under SSA got momentum from
the year 2002 onwards and a large number of Primary
and Upper Primary schools/sections have been opened
across the country which is also reflected in the ratio of
Primary to Upper Primary schools/sections.
In this section, a variety of school and facility-related
indicators in respect of five school categories, that is, (i)
Primary; (ii) Primary with Upper Primary; (iii) Primary
School & Facility Indicators
“Total number of schools
covered under DISE
increased from 8,53,601
in 2002-03 to 11,96,663 in
2006-07; thus showing an
increase of 3,43,062 schools
which is 40.19 percent
of total schools in 2002-03”
Page 20
Part II
20
Elementary Education in India : Analytical Report
schools does not necessarily mean that all of them have
minimum essential facilities required for smooth
functioning and also for effective teaching-learning
transaction. In addition to the above mentioned
indicators, the following set of facility indicators have
also been analysed: availability and type of drinking water
facility in schools, common toilet and girls’ toilet facility
03 to 11,96,663 in 2006-07; thus showing an increase
of 3,43,062 schools which is 40.19 percent of total
schools in 2002-03 (Table B1). Table B1 reveals that the
percent share of schools in the rural areas during the
period 2002-03 to 2006-07 has remained almost
stagnant. Of as many as 11,96,663 schools covered from
609 districts across 35 States and UTs in 2006-07, nearly
in schools, and availability of kitchen-shed, ramps and
usable computers in schools. Further, pre-primary
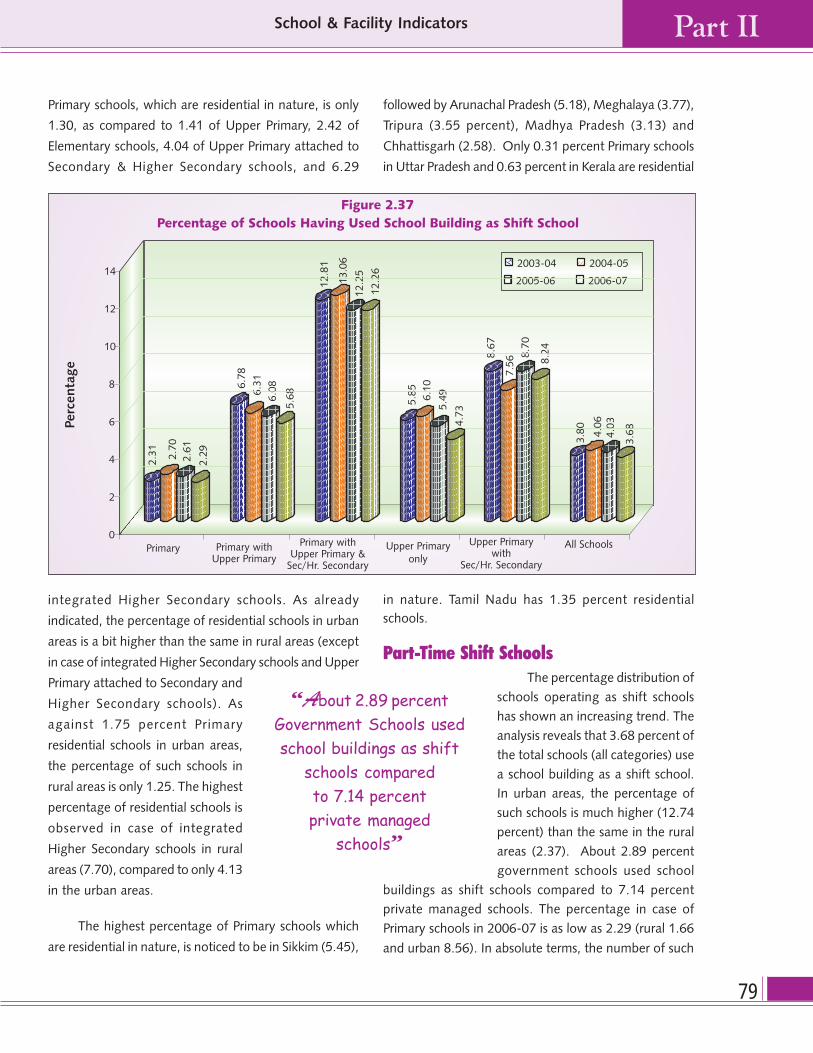
sections in schools, use of school building as shift school
and residential schools, as well as, schools that received
school development and TLM grants, have also been
analysed briefly. First, number of schools over a period
of time (2002-03 to 2006-07) by school category is
briefly analysed.
Number of Schools
The total number of schools covered under DISE
over a period of time increased from 8,53,601 in 2002-
87.15 percent schools are located in the rural areas.
During the previous year 2005-06, information from
11,24,033 schools covered from 604 districts across 35
States and UTs was received. Of these 87.23 percent
schools were located in the rural areas. A cursory look at
the distribution of schools reveals that almost a similar
pattern prevails in most of the States and UTs, with the
majority of schools located in the rural areas.
Obviously because of its size, Uttar Pradesh with
the highest number of districts (70), has the highest
number of schools (1,68,969) as in 2006-07, which is
14.12 percent of the total number of schools across 35
Table B1
Distribution of Schools by School Category : 2002-03 to 2006-07
School Category
Year Number Primary Primary Primary Upper Upper No Total Schoolsof Only with Upper with Upper Primary Primary & Response Schools Located
Districts Primary Primary & Only Secondary in RuralSecondary /Hr. Areas
/Hr. SecondarySecondary
Number of Schools
2002-03 461 601866 131558 18598 50878 35330 15371 853601 742633
2003-04 539 637469 153096 19531 63779 45716 11880 931471 811520
2004-05 581 693030 179094 23723 71880 58970 11116 1037813 901824
2005-06 604 738150 199946 27907 89164 60306 8560 1124033 980526
2006-07 609 779482 210014 29312 108095 67601 2159 1196663 1042929
Percentage
2002-03 461 70.51 15.41 2.18 5.96 4.14 1.80 100.00 87.00
2003-04 539 68.44 16.44 2.10 6.85 4.91 1.28 100.00 87.12
2004-05 581 66.78 17.26 2.29 6.93 5.68 1.07 100.00 86.90
2005-06 604 65.67 17.79 2.48 7.93 5.37 0.76 100.00 87.23
2006-07 609 65.14 17.55 2.45 9.03 5.65 0.18 100.00 87.15
Page 21
21
Part IISchool & Facility Indicators
States and UTs. Uttar Pradesh is followed by
Madhya Pradesh (1,25,858),
Rajasthan (1,00,965), Andhra Pradesh
(1,00,932), West Bengal (67,265),
Assam (63,996), Karnataka (55,364),
Bihar (54,884), Tamil Nadu (52,423),
Orissa (51,198), Chhattisgarh
(48,968) etc. On the other hand,
because of its size, Lakshadweep has
the lowest number of schools (30).
There are 86 schools in Daman and
Diu, 178 in Chandigarh and 350 in
Andaman and Nicobar Islands. The
other states with comparatively less number of schools
are Kerala (12,183), Haryana (16,180), Himachal Pradesh
(16,614), Uttarakhand (19,161) etc. Six of the north-
eastern states, namely Arunachal Pradesh (3,412),
Meghalaya (9,268), Mizoram (2,782), Nagaland (2,537),
Sikkim (1,226), and Tripura (3,679), too have smaller
number of schools imparting elementary education,
compared to other states; this is because of their small
size and less population. On the other hand, Goa has
1,420 schools as in 2006-07. The capital city of Delhi
too reported only 4,742 schools that impart elementary
education in its 9 districts.
The number of schools distributed by category
further reveals that majority of the
schools (65.14 percent) are
independent Primary schools. The
percentage of such Primary
schools has, however, shown a
declining trend over the previous
years. It was 65.67 percent in
2005-06 and 66.78 percent in
2004-05. Only two out of every
ten schools imparting elementary
education across 609 districts that
reported data in 2006-07, are
independent elementary schools. The percentages of
other category schools are: Upper Primary only – 9.03
percent (against 7.93 percent in 2005-06); Upper
Primary integrated with Secondary and Higher Secondary
– 5.65 percent (against 5.37 percent in 2005-06); and
Primary integrated with Upper Primary, Secondary and
Higher Secondary – 2.45 percent (against 2.48 percent
in 2005-06).
It is further observed that the percentage of Upper
Primary schools has significantly improved over a period
of time from 2002-03 (5.96 percent) to 2006-07 (9.03
“Percentage of UpperPrimary schools has
significantly improved overa period of time whichmay be because of theSSA intervention that
would have createddemand for Upper Primary
schools/sections”
Page 22
Part II
22
Elementary Education in India : Analytical Report
percent) which may be because of the SSA intervention
that would have created demand for Upper Primary
schools/sections. During 2005-06 and 2006-07, the
same has increased from 7.93 to 9.03 percent. In absolute
terms, the number of Upper Primary schools covered
under DISE increased from 50,878 in 2002-03 to 71,880
in 2004-05 and to 89,164 schools in 2005-06. During
the current year, information from as many as 1,08,095
Upper Primary schools has been received under DISE
operations. This shows an impressive increase of 57,217
schools which is more than 100 percent of total Upper
Primary schools in 2002-03 (Table B1). During 2005-06
and 2006-07, the number of Upper Primary schools
increased by 18,931 which is 21.23 percent of the total
number of Upper Primary schools in 2005-06. During
the same period, the number of Upper Primary &
Secondary/Higher Secondary
schools increased from 35,330 in
2002-03 to 67,601 in 2006-07; an
increase of 32,271 schools (91.34
percent). This shows that not only
the number of Elementary schools
increased from 1,31,558 in 2002-
03 to 2,10,014 schools in 2006-07
but the SSA intervention has also
helped in creating demand for other
types of schools. This is reflected in
the increase in number of Upper
Primary and Upper Primary & Secondary/Higher
Secondary schools during the same period.
It may be observed that different states have
different shares of Primary schools in the total schools.
For example, in 2006-07 West Bengal has as many as
82.66 percent (against 83.62 percent in 2005-06)
Primary schools, while Gujarat has 32.19 percent (against
34.20 percent in 2005-06), Karnataka 51.11 percent
(against 49.90 percent in 2005-06), Uttar Pradesh 72.76
percent (against 73.37 percent in 2005-06), Bihar 67.39
percent (against 69.75 percent in 2005-06), Jharkhand
73.91 percent (against 73.30 percent in 2005-06),
Mizoram 56.33 percent (against 55.30 percent in 2005-
06), and Kerala 54.41 percent (against 54.86 percent in
2005-06). The percentage of Primary schools in Delhi
in 2006-07 is little over 50 percent, compared to 78.08
percent in Arunachal Pradesh. Chandigarh, on the other
hand, has only 16.85 percent (against 15.68 percent in
2005-06) independent Primary schools as majority of its
Primary schools are integrated with Upper Primary &
Secondary/Higher Secondary schools (62.92 percent).
In Manipur, of the total 3,869 schools, 64.87 percent
are independent Primary schools compared to 43.26
percent in Puducherry.
The distribution of schools further reveals that the
percentage of Primary schools integrated with Upper
Primary schools is only 17.55 (17.79 percent in 2005-
06) and the rest of the types of schools have a very low
percentage to the total schools. However, in states like
Gujarat (64.49 percent), Karnataka (45.31 percent),
Jammu and Kashmir (31.42 percent), Maharashtra (30.43
percent), and Tripura (27.37 percent), the percentage
of Primary schools integrated with the Upper Primary
schools is quite high compared to the same in other
states. The percentage is as low as 1.07 percent in West
Bengal, followed by 2.31 percent in Himachal Pradesh
and 3.68 percent in Uttar Pradesh.
Assam (1.87 percent), Uttarakhand
(2.89 percent), Delhi (13.96
percent), Madhya Pradesh (9.74
percent), Arunachal Pradesh (18.12
percent), Puducherry (22.31
percent), Orissa (23.30 percent),
Bihar (25.88 percent) etc. too have
a small number of Primary schools
integrated with the Upper Primary
schools. In North-Eastern region,
the percentage of Primary schools
varies from 4.92 in Meghalaya to
27.37 percent in Tripura. On the other hand smaller
states, such as Andaman and Nicobar Islands, has 18.57
percent, Dadra and Nagar Haveli 36.96 percent, Daman
and Diu 8.14 percent and Goa 7.39 percent such schools.
It is further observed that the percentage of
independent Upper Primary schools has increased from
5.96 in 2002-03 to 9.03 in 2006-07. Across the states,
the percentage of these schools is low. However, in a
few states like Mizoram (30.01 percent), Assam (14.96
percent), Chhattisgarh (21.28 percent), Meghalaya
(14.04 percent), Himachal Pradesh (13.13 percent),
Madhya Pradesh (17.90 percent), Uttar Pradesh (22.10
percent) and Uttarakhand (16.64 percent), the
percentage of such schools is comparatively higher than
the national average (9.03 percent). The percentage of
independent Upper Primary schools in Delhi is only 1.98
while Andaman and Nicobar Islands, Arunachal Pradesh,
Jammu & Kashmir, and Puducherry have negligible
number of such schools. In states such as Bihar, Gujarat,
Jharkhand, Karnataka, Maharashtra, and Rajasthan, the
“Not only the numberof Elementary schools
increased from 1,31,558in 2002-03 to 2,10,014
schools in 2006-07but the SSA intervention
has also helped increating demand for
other types of schools”
Page 23
23
Part IISchool & Facility Indicators
percentage of independent Upper Primary schools to
total number of schools is very low. Andhra Pradesh,
Dadra & Nagar Haveli and Tripura did not report any
independent Upper Primary school operating in 2006-
07, which is also the case for 2005-06.
The percentage of Upper Primary schools attached
to Secondary and Higher Secondary schools is low at
5.65; it was 5.37 in the previous year. States, such as
Andhra Pradesh (15.91 percent), Delhi (10.61 percent),
Haryana (12.33 percent), Himachal Pradesh (10.59
percent), Kerala (12.09 percent), Maharashtra (19.04
percent), Puducherry (13.62 percent), Punjab (13.79
percent) and West Bengal (11.01 percent) are a few
states that have a good number of
such schools. Rest of the states has
only a few Upper Primary schools
attached to Secondary and Higher
Secondary schools.
The percentage of integrated
Higher Secondary schools in 2006-
07 imparting education from
Classes I to XII is only 2.45 of the
total schools/sections that impart
elementary education in the
country; this percentage was 2.48
in the previous year. No significant
improvement is observed in their percentage over the
percentage for 2004-05, which was 2.29. Except
Andaman and Nicobar Islands (18.29 percent), Goa
(12.27 percent), Manipur (12.87 percent), Chandigarh
(32.92 percent), Delhi (22.90 percent), Tripura (16.36
percent), Puducherry (19.76 percent), Sikkim (12.32
percent), most of the other States & UTs have below 10
percent integrated Higher Secondary schools.
The analysis presented above clearly shows that
the total number of schools imparting elementary
education covered under DISE has increased impressively
over a period of time. Despite significant increase, a few
schools, however, still remain uncovered. Efforts are
being made to cover all uncovered recognised schools
that impart elementary education, during 2007-08.
States & UTs are advised to prepare a fresh list of all
recognized schools that impart elementary education in
their state to identify all the uncovered schools. They
are also advised to prepare a master list of such
schools by school type and management which needs
to be updated regularly. Therefore, the total number
of schools that impart elementary education may be a
bit higher than the number of schools covered under
DISE in 2006-07.
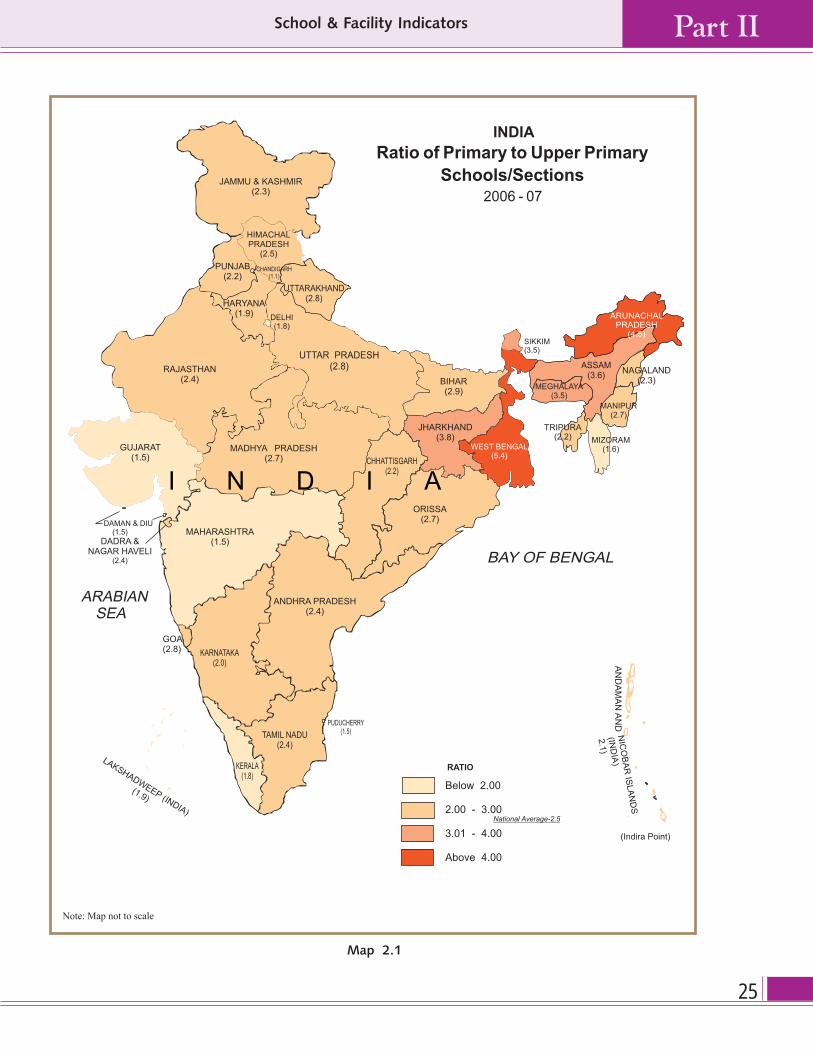
Ratio of Primary to Upper PrimarySchools/Sections
The Programme of Action (1992) envisaged an
Upper Primary school/section for every set of two
Primary schools/sections. The ratio calculated for 2006-
07 comes to one Upper Primary school/section for every
set of 2.45 Primary schools/sections at the national level;
this ratio in 2005-06, was 2.57 and in 2004-05, 2.68
(Table B2). The same was as high
as 3.18 in 2002-03. Lower ratio
means more availability of Upper
Primary schools/sections for the
existing Primary schools/sections.
For the present year, i.e. 2006-07,
the average pertains to all the 609
districts/35 states from which data
under DISE was obtained. Despite
increase in the number of Primary
schools by 41,332 during the
intervening period, the improved
ratio reflects the impact of
interventions being made in extending schooling facilities
in general and Upper Primary in particular (significant
number of schools have been opened since 1994, the
year in which DPEP was launched which got momentum
in 2001 when SSA was launched. Majority of new schools
opened also have school building, see Table B3(A) and
B3(B) ). However, the ratio is still high at 2.67 (2.79 in
2005-06) in the rural areas compared to only 1.54 in
the urban areas (1.57 in 2005-06). Irrespective of area,
a declining trend is noticed in ratio during the period
2004-05 to 2006-07. In rural areas, it declined from 2.93
in 2004-05 to 2.79 in 2005-06 and to 2.67 in 2006-07.
Similarly, in urban areas the ratio declined from 1.64 in
2004-05 to 1.57 in 2005-06 and further to 1.54 in 2006-
07. All areas together have also shown decline in ratio
during the period 2002-03 to 2006-07. From a high of
3.18 in 2002-03, it declined to 2.87 in 2003-04 and
further to 2.68 in 2004-05, 2.56 in 2005-06 and to 2.45
in 2006-07.
“Despite increase in thenumber of Primary schools
by 41,332 during theintervening period, theimproved ratio reflects
the impact of interventionsbeing made in extending
schooling facilities ingeneral and Upper
Primary in particular”
Page 24
Part II
24
Elementary Education in India : Analytical Report
The improved ratio of Primary to Upper Primary
schools/sections clearly shows availability of more Upper
Primary schooling facilities across the country which is
an encouraging signal. Despite significant improvement,
there are still a few locations where the ratio of Primary
to Upper Primary schools/sections is not as envisaged.
It is hoped that during the remaining period of SSA,
attention would be paid to un-served locations all which
need careful analysis of available data which is very rich
in nature and is available at all disaggregated levels. A
number of activities have already been initiated under
SSA in this direction and it is hoped that more Upper
Primary schooling facilities would be available in the years
to come.
Further, a significant difference in ratio of Primary
to Upper Primary schools/sections is noticed in schools
run by the Government and Private managements which
is also true for both rural and urban areas. The ratio in
Government run schools works out to be 3.02 (3.13 in
2005-06) compared to 1.25 in Private managed schools
(Table B3). However, no significant difference is noticed
in the ratio in Private managed schools in rural (1.30)
and urban (1.18) areas. All the three types of
Government managements, namely Department of
Education, Tribal and Social Welfare Department, and
Table B3
Ratio of Primary to Upper Primary Schools/Sections
by Management : 2004-05 to 2006-07
Management
2004-05 2005-06 2006-07 2004-05 2005-06 2006-07 2003-04 2004-05 2005-06 2006-07
Department 3.49 3.23 3.07 2.31 2.31 2.35 3.53 3.37 3.14 3.00of Education
Tribal/Social 3.38 3.04 2.61 2.14 1.92 1.65 3.19 3.29 2.96 2.55WelfareDepartment
Local Body 3.11 3.24 3.34 2.10 2.08 1.99 3.32 2.99 3.11 3.19
All Government 3.38 3.22 3.11 2.24 2.23 2.22 3.46 3.26 3.13 3.02Managements
Private Aided 0.93 0.87 0.78 1.00 0.92 0.88 0.98 0.95 0.89 0.81
Private 1.54 1.60 1.63 1.36 1.31 1.30 1.54 1.46 1.47 1.49Unaided
All Private 1.27 1.31 1.30 1.25 1.19 1.18 1.27 1.26 1.26 1.25Managements
All Schools 2.93 2.79 2.67 1.64 1.57 1.54 2.87 2.68 2.57 2.45
Local Body, have higher ratio in rural areas than in the
urban areas and the difference between the two is wide
and significant. A similar trend was also observed during
the previous year, i.e. 2005-06. Further, in urban areas,
it has been observed that the ratio in case of both the
Local Body, and Social and Tribal Welfare Department is
just below two but the same is not true in case of ratio
in rural areas. Both in rural (3.07) and urban (2.35) areas,
the ratio of Primary to Upper Primary schools/sections is
well above two in case of schools run by the Department
of Education.
It is noticed that in about 21 states, the ratio ofPrimary to Upper Primary schools/sections is better than
the national average of 2.45. Many of these states
Table B2
Ratio of Primary to Upper Primary
Schools/Sections 2002-03 to 2006-07
Year Average Based on Ratio
2002-03 461 districts/18 states 3.18
2003-04 539 districts/25 states 2.87
2004-05 581 districts/29 states 2.68
2005-06 604 districts/35 states 2.57
2006-07 609 districts/35 states 2.45
All Areas Urban AreasRural Areas
Page 25
25
Part IISchool & Facility Indicators
Page 26
Part II
26
Elementary Education in India : Analytical Report
have the ratio around two. Among the major states,
Karnataka (2.02), Kerala (1.81) and Maharashtra (1.50)
have almost one Upper Primary school/section for every
two Primary schools/sections. On the other hand, in a
few states, such as Chandigarh (1.09), Daman and Diu
Table B3(B)
Percentage of Schools Established Since
1994 to Total Schools by Category : 2006-07
Percentage School Category
Rural Areas Urban Areas All Areas
Primary Only 33.33 31.94 33.20
Primary with Upper Primary 18.68 34.91 21.87
Primary with Upper Primary 31.92 27.55 30.17
& Secondary/Hr. Secondary
Upper Primary Only 50.59 26.59 48.09
Upper Primary & Secondary/ 24.38 21.64 23.70
Hr. Secondary
All Schoos 32.10 30.89 31.94
(1.46), Delhi (1.77), Gujarat (1.45), Mizoram (1.59) and
Puducherry (1.53), the ratio of Primary to Upper Primary
schools/sections is below two.
It is observed that barring a few states, others have
shown improvement in the ratio over the previous year.
But still in a few states, the ratio is much above two. At
least, six States and UTs reported a ratio of three and
above compared to nine such states in the previous year.
West Bengal is the only state in the country that has
reported a ratio of above 5 (5.41); meaning availability
of one Upper Primary school/section for every five
Primary schools/sections it has. It is hoped that recent
initiative undertaken by the state would help in
improving the ratio in the coming year. The ratio in
Arunachal Pradesh (4.52), Assam (3.61), Bihar (2.94),
Jharkhand (3.75), Meghalaya (3.47), Orissa (2.70),
Table B3(A)
Schools Established Since 1994 by Category
Up to Up to % Schools Up to % Schools Schools2002-03 2005-06 with 2006-07 with Opened
School Category Building Building during2002-03 &2006-07
Primary Only 120176 214106 80.31 258780 90.71 138604
Primary with Upper Primary 16546 37565 97.04 45921 98.23 29375
Primary with Upper Primary 3368 7696 98.08 8842 97.92 5474
& Secondary/Hr. Secondary
Upper Primary Only 15623 39908 80.37 51988 88.56 36365
Upper Primary & Secondary/ 3943 12074 93.85 16023 96.22 12080
Hr. Secondary
All Schools* 161279 313570 83.40 382271 91.73 220992
*Including non-responded schools.
Page 27
27
Part IISchool & Facility Indicators
Sikkim (3.54) and Uttar Pradesh (2.79) is still high, as
average number of Primary schools/sections per Upper
Primary school/section in these states is well above two.
All these states need careful analysis of block and district-
specific data available so that additional Upper Primary
schools/sections can be provided or even a few existing
Primary schools can also be upgraded to Upper Primary
schools. While doing so they are also advised to analyse
Table B4
Location of Schools from the Cluster Resource Centre : 2006-07(Percentage)
School CategoryDistance
Less than 1 km 2 to 5 km Beyond 5 km
Primary Only 30.10 44.99 24.90
Primary with Upper Primary 51.19 33.04 15.77
Primary with Upper Primary & 53.60 35.23 11.17Secondary/Hr. Secondary
Upper Primary Only 28.33 47.30 24.37
Upper Primary & Secondary/ Hr. Secondary 48.15 33.85 17.90
All Schools (All Areas) 35.36 42.16 22.48
All Schools (Rural Areas) 32.53 42.59 24.88
All Schools (Urban Areas) 54.02 39.71 6.27
All Schools (2005-06) 27.74 45.39 26.87
All Schools (2004-05) 23.94 46.97 29.10
All Schools (2003-04) 24.75 45.52 29.73
All Schools (2002-03) 32.64 36.93 30.41
Note: Total may not add to hundred because of no responses and rounding of figures.
Page 28
Part II
28
Elementary Education in India : Analytical Report
population size of habitation and distance from the
nearby school.
Location of Schools
It is generally believed that if a Cluster Resource
Centre (CRC) is located near to the school, the same
may ensure better coordination of activities within the
school and between schools falling under a CRC which
is more specifically true for Primary schools. Keeping this
in view, a school is identified as the Cluster Resource
Centre and in most of the cases, the Head Master of
such a school is designated as the CRC Coordinator. To
examine this aspect, the location of schools from the
CRC is analysed and is presented by school category
(Table B4). Schools are distributed in distance slabs of up
to 1 km, 2 to 5 km and beyond 5 km, based on the DISE
data.
The average of all states reveals that only 30.10
percent (against 21.84 percent in 2005-06) Primary
schools are located within one km from the CRC, and
that 44.99 percent (against 48.51 percent in 2005-06)
schools are located 2 to 5 km from CRC (Table B4). About
66 percent Primary schools are located even beyond 5
km from the Block HQ. Comparatively, more schools in
2006-07 are located within 1 km from the CRC than
during the previous year (Table B4). However, a
significant difference may be observed in schools located
within 1 km from CRC in rural and urban areas. On the
other hand, of the total 11,96,663 schools/sections
imparting elementary education in the country, 22.48
percent (against 26.87 percent in 2005-06) are located
even more than 5 km from the CRC. Much difference is
noticed in the percentage of such schools located in the
rural (24.88 percent) and urban (6.27 percent) areas.
Further, it may be observed that every second
independent elementary school is located within 1 km
from the CRC which is also true for integrated Higher
Secondary schools. More than 48 percent of the Upper
Primary attached to Secondary and Higher Secondary
schools are located within 1 km from the CRC.
The state-specific study of locations of Primary
schools from the CRC shows that 76.35 percent schools
in Delhi, 96.47 percent in Karnataka and 79.50 percent
Table B5
Schools Visited by CRC Coordinators and Schools Inspected : 2005-06
Percentage Schools
Visited by CRCInspected School Category Coordinator
All Rural Urban All Rural Urban
Areas Areas Areas Areas Areas Areas
Primary Only 66.69 68.40 49.74 54.81 54.99 53.16
Primary with Upper Primary 62.38 66.15 46.95 54.53 56.50 46.50
Primary with Upper Primary & 35.92 41.11 28.04 38.31 40.83 34.52
Secondary/ Hr. Secondary
Upper Primary Only 63.14 65.77 40.43 56.78 57.11 53.96
Upper Primary & Secondary/ 44.10 46.15 37.77 46.82 45.52 50.93
Hr. Secondary
All Schools (2005-06) 63.46 66.22 45.30 53.99 54.71 49.70
All Schools (2004-05) 62.33 65.30 43.49 55.29 55.97 52.53
All Schools (2003-04) 63.01 66.39 43.25 56.71 57.87 52.47
All Schools (2002-03) 57.84 60.77 40.85 57.26 58.10 55.88
All Schools (2001-02) 53.31 56.30 36.45 58.44 59.60 57.43
Page 29
29
Part IISchool & Facility Indicators
in Nagaland are located within 1 km from the CRC.
Rajasthan reported that almost every school in the
state is located within 1 km from the CRC. On the
other hand, more than half of the Primary schools in
Andaman and Nicobar Islands (50.26 percent) and
West Bengal (57.95 percent) are located beyond 5
km from the CRC. Even in the UT of Chandigarh,
76.67 percent of Primary schools are located at a
distance of 2 to 5 km from the CRC against only 10.68
percent in Delhi. In West Bengal, only 14.36 percent
Primary schools are located within 1 km from CRC
against 27.69 percent between 2 to 5 and remaining
57.95 percent beyond 5 km, which is as good as in
Bihar.
It is felt that if the office of the Block Education
Officer/Block Resource Centre (BRC) Coordinator is
located near the schools, it helps in providing better
guidance to school Head Master/Head Teacher. To
examine it, the location of schools from the Block HQ
is analysed by school category. The data reveals that
66 percent Primary schools are located beyond 5 km
from the Block HQ.
Besides visit by the CRC Coordinators, the
school inspectors are also supposed to visit schools.
Table B5 shows the schools visited by the CRC
Coordinator and inspected by the officers during the
previous academic year. Nearly 63.46 percent of the
total schools (all categories) were visited by the CRC
Coordinators during the previous academic year, i.e.
2005-06, against 62.33 percent schools in yet earlier
year 2004-05. However, the percentage of schools
inspected (53.99 percent) was a bit lower than the
schools visited by the CRC Coordinators (63.46
percent). It is also observed that the number of
schools visited and inspected was much higher in rural
areas than the same in the urban areas, which is true
for all school types. Further, it has been observed
that the percentage of integrated Higher Secondary
schools visited and inspected was much lower in case
of other types of schools. The Primary schools visited
were about 66.69 percent (against 66 percent in
2004-05), and those inspected were 54.81 percent
(against 56 percent in 2004-05).
Page 30
Part II
30
Elementary Education in India : Analytical Report
The states in which CRC Coordinators visited more
than 75 percent Primary schools are: Andhra Pradesh
(88.08 percent), Assam (75.70 percent), Bihar (75.21
percent), Chhattisgarh (81.96 percent), Gujarat (80.63
percent), Jammu & Kashmir (87.91 percent), Jharkhand
(80.36 percent), Karnataka (86.91 percent), Maharashtra
(85.03 percent), Manipur (95.26 percent), Orissa (95.93
percent), and Uttarakhand (81.47 percent). The
percentage of such schools was as low as 1.38 percent
in Delhi, 9.36 percent in Goa, 6.25
percent in Lakshadweep, 1.38
percent in Rajasthan and 14.67
percent in Tamil Nadu. Further, it
may be observed that only 4 out
of 10 schools (all categories) in
urban areas were visited by the
CRC Coordinator compared to 6
out of 10 in schools located in the
rural areas. On the other hand, 6
out of 10 schools in rural areas and
5 out of 10 schools in urban areas were inspected
during the previous academic year, that is, 2005-06
which is quite similar to the pattern in 2004-05.
Head Master in Schools
On the one hand, a few schools were not visited
by CRC Coordinators or inspected. On the other hand,
a good number of schools are yet to be provided with
regular Head Master. DISE 2006-07 data reveals that a
little more than half of the total (all categories) schools
are yet to be provided regular Head Masters. Rural areas
have a fewer number of schools (46.54 percent) having
Head Masters, compared to schools in the urban areas,
of which 56.75 percent do have
the Head Masters.
The percentage of Head
Masters in the private managed
schools (63.36) is much higher
than the same in the government
managed schools (44.26). The
highest percentage of schools with
Head Masters is in independent
Elementary schools (58.88). The
percentage of such schools in urban areas is high at 64.11
compared to 57.62 in rural areas. The lowest 41.15
percent schools with Head Master is observed in case of
“DISE 2006-07
data reveals that
a little more than
half of the total
schools are yet to
be provided regular
Head Masters”
Page 31
31
Part IISchool & Facility Indicators
Upper Primary attached to Secondary and Higher
Secondary schools. Further, it is noticed that 44.51
percent Primary schools had Head Masters in position
in 2006-07. The remaining schools might have Head
Teachers in-charge of the schools.
Further, it has been observed that about 94
percent Primary schools in Kerala had a Head Master;
the figure is the highest amongst 35 States & UTs. The
majority of Primary schools in Delhi (88.69 percent),
Gujarat (90.35 percent), Meghalaya (88.72 percent),
Tamil Nadu (89.70 percent), Uttar Pradesh (79.11
percent), West Bengal (70.55 percent) and Sikkim
(77.84 percent), had Head Masters. In rest of the states,
percentage of Primary schools with Head Masters is
much lower than in the states presented above. For
effective functioning of schools, it is essential that all
the schools are provided with a regular Head Master,
both in the small and big schools.
School Management
The number of schools run by the government
managements covered under DISE increased over a
period of time, though in percentage terms, they have
shown a declining trend during the period 2002-03 to
2006-07. Correspondingly, the share of private managed
schools (aided and unaided), during the same period,
increased significantly. About 81 percent (9,67,250
schools) of the total schools in 2006-07 are government
run schools; this percentage was 83.14 (9,29,345 schools)
during the previous year. In 2002-03, the percentage of
schools run by government managements was as high as
87.30. Government run schools in 2006-07 include
schools run by the Department of Education (68.64
percent), Local Bodies (25.02 percent) and the Tribal
Welfare Department (5.34 percent). It also includes 1.00
percent other management schools which do not come
under the above three management categories. About
0.32 percent schools did not report management type.
The balance of 2,25,635 schools (18.86 percent, all
category schools) in 2006-07 have private managements.
There were 1,89,521 (16.86 percent) such schools during
the previous year, and 1,57,268 schools (15.15 percent)
in 2004-05. Within the private managed schools, 30.79
percent (69,473 schools) are private aided schools and
the remaining 69.21 percent (1,56,162 schools) are
private unaided schools. The corresponding figures in
2005-06 were 33.46 percent (63,411 schools) private
Page 32
Part II
32
Elementary Education in India : Analytical Report
aided and 66.54 percent (1,26,110 schools) private
unaided schools. This shows that with improved
coverage under DISE, the percent share of private schools
imparting elementary education also increased from
11.70 percent in 2002-03 to 13.51 percent in 2003-04
and further to 15.15 percent in 2004-
05, 16.86 percent in 2005-06 and to
18.86 percent in 2006-07.
Correspondingly, the share of
government run schools to total
schools declined. It may also be of
interest to know that the percentage
of government and government
aided schools is as high as 86.63
which shows that nine out of every
ten schools imparting elementary
education in the country are funded
by the government.
Department of EducationManagement
It may be observed that about 81 percent of the
total schools are being run by the government
managements, amongst which 68.64 percent alone are
being run by the Department of Education. Further, it is
observed that between government managements, the
share of the Department of Education has declined from
59.68 percent in 2003-04 to 55.48 percent in 2006-07.
During the previous year, i.e. 2005-06, the percentage
of such schools was 57.64. About 58.85 and 33.03
percent (all category) schools respectively in rural and
urban areas are being run by the Department of
Education. Their respective percentages during the
previous year were 61.09 and 35.10. It is further
observed that a number of states in 2006-07 have a
much higher percentage of schools (all categories) run
by the Department of Education
than the national average of
55.48 percent. For instance, states
like Arunachal Pradesh (93.05
percent), Bihar (97.70 percent),
Jharkhand (94.91 percent) and
Tripura (96.30 percent) have
more than 90 percent such
schools. On the other hand, the
percentage of such schools in
Andhra Pradesh is only 2.85, in
Maharashtra 0.64, in Delhi
19.89, in Gujarat 8.36, in Kerala
36.90 and in Tamil Nadu 8.36.
The category-wise distribution of schools (all
categories) run by the Department of Education shows
that on an average 60.82 percent (against 63.44 percent
in 2005-06) of the total Primary schools in the country
are being run by the Department of Education itself.
More than 88 percent of the total Primary schools are
being run by the government managements. A cursory
look, however, reveals that in many states, percentage
of such schools is above 95. In Arunachal Pradesh, Bihar,
Jharkhand and Tripura, over 95 percent of the total
Primary schools are being run by the Department of
Table B6
Distribution of Schools by Management : 2006-07
All Government All Private TotalManagement Category Managements Managements Schools
Number 9,67,250 Number 2,25,635 11,96,663*
% 81.14* % 18.86 100.00
Department of Education 68.64 Private Aided 30.79 69,473
Tribal/Social Welfare Department 5.34 Private Unaided 69.21 1,56,162
Local Body 25.02
Other Managements 1.00
All Government Schools 100.00 All Private Schools 100.00 2,25,635
* Including 0.32 percent non responding schools.
“With improvedcoverage under DISE,the percent share of
private schools imparting
elementary educationincreased from 16.86 percentin 2005-06 to 18.86 percent
in 2006-07. Correspondingly,the share of government
run schools to
total schools declined”
Page 33
33
Part IISchool & Facility Indicators
Uttarakhand (82.63 percent), majority of the
independent Upper Primary schools are being run by
the Department of Education. States like Kerala (11.95
percent) and Tamil Nadu (39.80 percent) had only a few
such schools in 2006-07.
Further, Table B7 shows that only 41.66 percent
schools each of Primary integrated with Upper Primary
and 33.15 percent Upper Primary integrated with
Secondary & Higher Secondary schools are managed by
the Department of Education. In states like Bihar (97.05
percent), Dadra & Nagar Haveli (96.08 percent),
Jharkhand (92.70 percent), Lakshadweep (100.00
percent), Orissa (93.07 percent) and Tripura (97.62
percent), majority of Primary integrated with the Upper
Primary schools are being run by the Department of
Education. On the other hand, Andhra Pradesh (1.82
percent), Gujarat (6.91 percent), Maharashtra (0.71
and West Bengal (98.48 percent) too have majority of
Primary schools being run by the Department of Education.
But in states like Andhra Pradesh (2.47 percent), Delhi
(1.46 percent), Maharashtra (0.76 percent) and Tamil Nadu
(1.64 percent), the percentage of Primary schools run by
the Department of Education is much lower than the
national average of 60.82 percent.
More than 76 percent of the total Upper Primary
schools are being run by the Government managements
amongst which the majority of such schools are being
run by the Department of Education. The percent share
of such schools run by the Department of Education
alone in 2006-07 is 66.51 against 68.46 percent in 2005-
06. In Arunachal Pradesh, Jammu & Kashmir, and
Lakshadweep, all Upper Primary schools are being run
under the management of Department of Education. In
the states of Bihar (94.34 percent), Haryana (92.06
Education. Assam (89.41 percent), Goa (91.87 percent),
Haryana (94.00 percent), Himachal Pradesh (92.11
percent), Karnataka (86.71 percent), Orissa (92.30 percent)
percent), Himachal Pradesh (99.36 percent), Nagaland
(98.39 percent), Punjab (96.84 percent), Rajasthan
(84.54 percent), Uttar Pradesh (73.38 percent) and
Table B7
Percentage of Schools by Management and Category : 2006-07
School Management
School Category Department Tribal/Social Local Private Private Other
of Education Welfare Body Aided Unaided Managements
Department
Primary Only 60.82 4.59 21.79 2.95 8.70 0.81
Primary with Upper Primary 41.66 1.79 28.11 5.20 22.51 0.67
Primary with Upper Primary 27.21 3.59 3.25 12.00 50.98 2.85
& Secondary/ Hr. Secondary
Upper Primary Only 66.51 8.39 1.04 10.55 13.06 0.44
Upper Primary & Secondary/ 33.15 3.00 16.29 30.38 16.37 0.76
Hr. Secondary
All Schools 55.48 4.32 20.22 5.81 13.05 0.80
All Schools (Rural Areas) 58.85 4.73 21.51 4.71 9.27 0.72
All Schools (Urban Areas) 33.03 1.56 11.65 13.36 38.59 1.40
All Schools (2005-06) 57.64 4.51 19.85 5.64 11.22 0.67
All Schools (2004-05) 59.68 4.34 19.39 5.72 9.44 0.47
All Schools (2003-04) 59.68 4.30 20.89 5.75 7.76 0.40
All Schools (2002-03) 61.06 4.38 20.61 4.96 6.74 0.39
Note: Totals may not add to hundred because of no-responses and rounding of figures.
Page 34
Part II
34
Elementary Education in India : Analytical Report
percent) and Tamil Nadu (1.74 percent) have much less
number of such schools being run by the state Education
Department. Almost similar trend is noticed in the case
of Upper Primary integrated with the Secondary and
Higher Secondary schools run by the Department of
Education.
Tribal/Social Welfare Department
The percentage of schools being run by the Tribal/
Social Welfare Department in 2006-07 is only 4.32,
which is almost the same in the previous year, i.e, 4.51
percent. Except in the states of Chhattisgarh (39.86
percent), Madhya Pradesh (14.79 percent) and Manipur
(22.59 percent), in all other states the percentage of
schools being run by the respective state Tribal/Social
Welfare Departments is much lower than the all-India
average of 4.32 percent. Almost
similar percentage share is observed
in case of the other types of schools
under the managements of Tribal/
Social Welfare Departments.
However, the highest percentage is
noticed in case of independent
Upper Primary schools (8.39
percent) followed by Primary
schools (4.59 percent). Further, it is
observed that of the total integrated
Higher Secondary schools, about
3.59 percent schools are being run
under the Tribal/Social Welfare Departments which is
quite similar to Upper Primary attached to Secondary
and Higher Secondary schools (3.00 percent).
Local Body Managements
The percentage of schools under Local Body
managements in 2006-07 (20.22 percent) shows slight
improvement over the previous year (19.85 percent).
However, in a few states, the percentage of such schools
is higher than the all-India average. This percentage is
as high as 38.21 in Andhra Pradesh, 75.67 in Gujarat,
67.16 in Maharashtra, 44.94 in Rajasthan and 55.39 in
Tamil Nadu. The capital city of Delhi too has 40.53
percent of schools under Local Body managements. Rest
of the states have below five percent schools being run
by the Local Body managements. Notably the Primary
integrated with the Upper Primary schools has the
highest percentage under the management of the Local
Bodies (28.11 percent). Similarly, the percentage of
independent Primary schools is 21.79 (against 20.98 in
2005-06), and in case of Upper Primary integrated with
the Secondary and Higher Secondary schools the
percentage is 16.29 (against 15.28 in 2005-06). In the
other school categories, it varies from 1.04 percent in
case of independent Upper Primary schools to 28.11
percent in case of the Primary integrated with the Upper
Primary schools. Majority of Primary schools in Andhra
Pradesh (74.42 percent), Delhi (76.39 percent), Gujarat
(77.15 percent), Maharashtra (85.63 percent), Rajasthan
(75.33 percent) and Tamil Nadu (65.96 percent) were
under Local Body managements in 2006-07.
Private Managements
As has already been presented
above that 18.86 percent of the
total 1.20 million schools are being
managed by the Private aided and
Unaided managements. However,
in a few states the percentage of
such schools is higher than the
national average. The highest
percentage of schools is observed
in Kerala (58.27) and the lowest
(1.55) in Bihar. More than 98
percent schools in Bihar are being
managed by the Department of Education alone. Both
private managements together also have high
percentage in a few other states, such as Delhi (37.05),
Jammu & Kashmir (20.47 percent), Karnataka (19.01),
Maharashtra (28.39), Meghalaya (59.40), Puducherry
(35.03), Rajasthan (21.26) and Uttar Pradesh (23.68).
In most of these states, schools run by the Private
Unaided managements are more than the same in case
of Private Aided managements.
The state-wise distribution of schools having Private
Aided managements shows that their number is as high
as 55.24 percent in Kerala, 19.99 percent in Maharashtra,
22.82 percent in Goa, and 16.11 percent in Tamil Nadu.
Delhi too has 6.58 percent schools under Private Aided
managements and Chandigarh 3.93 percent. Meghalaya,
“Except Chhattisgarh,
Madhya Pradesh and
Manipur, in all other
states the percentage of
schools being run by the
respective state Tribal/Social
Welfare Departments
is much lower than the
all-India average of
4.32 percent”
Page 35
35
Part IISchool & Facility Indicators
a north-eastern state, has a high percentage (51.33) of
such schools as in 2006-07. Rest of the major states, except
Andhra Pradesh (3.53 percent), Assam 7.03 percent),
Karnataka (4.40 percent), Uttar Pradesh (4.03 percent),
and Uttarakhand (3.05 percent), have only a few Private
Aided schools. Bihar too has a low percentage of 0.54.
Further, it has also been noticed that 30.38 percent
Upper Primary integrated with the Secondary and Higher
Secondary schools have Private Aided managements, and
their percentage is almost the same as in the previous
year. In the rest of the school categories, the percentage
varies from 2.95 percent in case of Primary to 12.00
percent in case of Primary integrated with the Upper
Primary, Secondary and Higher
Secondary schools.
It has also been observed that
barring Primary integrated with
Upper Primary, Secondary and
Higher Secondary schools (29.24
percent), majority of other types of
schools in Kerala has Private Aided
management. Their percentage is as
high as 55.54 in case of Primary and
54.46 in case of Primary with Upper
Primary. Upper Primary only schools constitute 79.28
percent, and Upper Primary attached to Secondary and
Higher Secondary schools are 60.22 percent. In addition
to aided schools, a good number of schools in Kerala
have Private Unaided managements. Meghalaya also
have a good number of schools under Private Aided
managements. Compared to other school types, Tamil
Nadu also has a number of schools across school types
that have Private Aided managements. States such as
Bihar (8.97 percent), Kerala (29.24 percent), Meghalaya
(62.83 percent), Uttar Pradesh (29.90 percent),
Uttarakhand (22.02 percent) and West Bengal (34.00
percent) also have a good number of integrated Higher
Secondary schools that have Private Aided
managements. Delhi too has 12.06 percent of such
schools under Private Aided managements. On the other
hand, Lakshadweep and Nagaland have not reported
any integrated Higher Secondary school under Private
Aided management.
Table B7 also presents the number of schools having
Private Unaided managements. It may also be noted that
overall 22.51 percent (19.64 percent in 2005-06) Primary
integrated with Upper Primary schools have Private
Unaided managements compared to 5.20 percent under
Private Aided managements. A few states have a higher
percentage than the all-India average. On the other
hand, in about 19 states, the percentage is lower than
the national average of 22.51. Kerala has only 3.05
percent Primary integrated with Upper Primary schools
under Private Unaided managements, compared to
67.52 percent such schools in Delhi.
It is further observed that 50.98 percent (48.00
percent in 2005-06) of total integrated Higher Secondary
schools have Private Unaided managements. In this type
of schools, the percentage of Private Unaided
management is the highest
amongst all other management
types, including Government
managements. In a few states, such
as Chandigarh (29.46 percent),
Chhattisgarh (66.47 percent), Delhi
(49.63 percent), Gujarat (68.48
percent), Himachal Pradesh (94.88
percent), Karnataka (73.61
percent), Madhya Pradesh (80.06
percent), Mizoram (82.35 percent),
Nagaland (95.63 percent),
Puducherry (54.55 percent), Rajasthan (70.64 percent),
and Uttar Pradesh (50.36 percent), majority of integrated
Higher Secondary schools have Private Unaided
managements. On the other hand, the percentage of
such schools in Kerala is only 13.14. It may be noted
that more than 55 percent of the total schools in Kerala
are being managed by the Private managements and
percentage of such Primary schools is as high as 55.54
percent. In Gujarat, 53.15 percent, and Karnataka, 37.13
percent Upper Primary attached with Secondary and
Higher Secondary schools have private unaided
managements compared to 66.67 percent in Mizoram,
and 25.22 percent in Uttar Pradesh.
Schools Located in Rural Areas
It may be recalled that the rural population of the
country is about 72 percent. Against this, 87.15 percent
of the total 11,96,663 schools that impart elementary
education in 2006-07 are located in rural areas. This
percentage was 86.23 percent during the previous year.
“About 87.15 percentof the total 11,96,663
schools that impartelementary education
in 2006-07 are locatedin rural areas. This
percentage was 86.23percent during the
previous year”
Page 36
Part II
36
Elementary Education in India : Analytical Report
Further, it is observed that barring the states of
Chandigarh (19.66 percent), Daman & Diu (62.79
percent), Delhi (21.99 percent), Maharashtra (78.89
percent), Bihar (93.09 percent), Chhattisgarh (92.03
percent), Himachal Pradesh (95.52 percent), Jharkhand
(94.96 percent), Lakshadweep (96.67 percent),
percent), Mizoram (68.73 percent) and Puducherry
(53.29 percent), percentage of schools in rural areas in
the rest of the states is above 80. A few states, such as
Arunachal Pradesh (94.26 percent), Assam (94.45
Meghalaya (93.41 percent), Orissa (92.92 percent),
Sikkim (95.51 percent), Tripura (93.59 percent), UttarPradesh (90.35 percent) and Uttarakhand (82.23percent) have above 90 percent of the schools locatedin rural areas as in 2006-07.
Table B8
Percentage of Schools in Rural Areas : 2002-03 to 2006-07
2002-03 2003-04 2004-05 2005-06 2006-07
Primary Only 90.93 91.18 90.94 91.09 90.85
Primary with Upper Primary 82.68 81.52 81.67 81.44 80.39
Primary with Upper Primary & Secondary/ 58.29 59.15 58.17 61.67 60.62
Hr. Secondary
Upper Primary Only 90.54 90.84 91.17 90.00 89.59
Upper Primary & Secondary/ Hr. Secondary 75.79 74.70 75.02 74.50 75.59
All Schools 87.00 87.12 86.90 87.23 87.15
Note: Totals may not add to hundred because of no-responses and rounding of figures.
School CategoryYear
Page 37
37
Part IISchool & Facility Indicators
Further, it has also been noticed that majority of
schools, except integrated Higher Secondary schools
(60.62 percent), are located in rural areas. The
percentage is as high as 90.85 in case of independent
Primary schools, 89.59 in case of independent Upper
Primary schools, 80.39 in case of Primary integrated with
Upper Primary, and 75.59 in case of Upper Primary
integrated with Secondary and
Higher Secondary schools. On the
other hand, of the total 29,312
integrated Higher Secondary
schools, only 60.62 percent schools
are located in rural areas, which is
much lower than the other types
of schools located in these areas.
The distribution of schools by
management in rural areas does not
show any significant deviation from the distribution of
schools by management in all areas.
So far as Primary schools are concerned, about 91
percent of the total 7,79,482 Primary schools are located
in rural areas (Table B8). However, the percentage of
such schools in 21 states is well above the average of all
the 35 states. In the states of Andaman & Nicobar Islands
(96.83 percent), Arunachal Pradesh (96.85 percent),
Assam (95.01 percent), Bihar (94.28 percent),
Chhattisgarh (94.66 percent), Haryana (91.50 percent),
Himachal Pradesh (97.16 percent), Jammu & Kashmir
(92.55 percent), Jharkhand (96.81
percent), Lakshadweep (93.75
percent), Madhya Pradesh (92.37
percent), Meghalaya (95.51
percent), Nagaland (92.61 percent),
Orissa (94.01 percent), Punjab
(91.00 percent), Rajasthan (92.06
percent), Sikkim (96.93 percent),
Tripura (96.45 percent), Uttar
Pradesh (91.29 percent) and Uttarakhand (94.20
percent), more than 90 percent of Primary schools are
located in rural areas. On the other hand, the percentage
of such schools in Delhi is as low as 25.34 and in
“Of the total 29,312
integrated HigherSecondary schools,
only 60.62 percent schoolsare located in rural areas,which is much lower than
the other types of schoolslocated in these areas”
Table B9
Status of School Buildings by Category : 2006-07
Building Status
School Category Government
Private Rented Government School in Rent- Total*
Free Building
Primary Only 8.52 4.84 78.75 2.04 100.00
Primary with Upper Primary 15.95 14.29 67.14 1.29 100.00
Primary with Upper Primary 39.92 24.01 30.00 2.63 100.00
& Secondary/Hr. Secondary
Upper Primary Only 17.66 2.41 68.47 3.08 100.00
Upper Primary & Secondary/Hr.Secondary 19.89 19.18 52.54 5.78 100.00
All Schools (2006-07) 12.05 7.56 72.97 2.23 100.00
All Schools (2005-06) 11.88 7.45 73.19 2.43 100.00
All Schools (2004-05) 11.19 7.04 73.67 2.40 100.00
All Schools (2003-04) 11.10 6.52 79.41 2.97 100.00
All Schoos (2002-03) 9.55 6.57 80.46 3.41 100.00
* Schools without building and no responses are included in the total.
Page 38
Part II
38
Elementary Education in India : Analytical Report
Chandigarh 34.48. In all other states, the percentage is
well above 80. All the independent Upper Primary
schools in Andaman & Nicobar Islands, Andhra Pradesh,
Arunachal Pradesh, Lakshadweep, Puducherry and
Sikkim, and 98.21 percent schools in Himachal Pradesh,
are located in rural areas. Assam, Chhattisgarh and
Punjab too have a very high percentage of Upper Primary
schools (about 94 percent) located in rural areas.
Status of School Buildings
The status of school buildings, as reported, is of
four types: Private, Rented, Government and
Government School in Rent-Free Building. About
72.97 percent of the total 11,96,663 schools have
government buildings and 12.05 percent schools have
private buildings. Another 7.56 percent schools have
rented buildings (Table B9).
Compared to 8.52 percent Primary schools
having private buildings, the percentage of other
types of schools having private building is high. About
40 percent integrated Higher Secondary schools have
private buildings, 30 percent have government
buildings, and 24 percent such schools have rented
buildings. About 19 percent Upper Primary attached
to Higher Secondary schools also have rented
buildings, compared to 14.29 percent Primary with
Upper Primary schools. Altogether about 2.23
percent government schools are run in rent-free
buildings and another 7.56 percent in rented
buildings. Government and aided schools having
rented buildings can be provided buildings under the
SSA on priority basis.
Type of School Building
From the DISE database, type of building a school
has can be known in case of each of 1.20 million schools
imparting elementary level of education across the country.
To examine this, percentage distribution of schools is
presented by type of building. Pucca (permanent), partially
pucca (semi-permanent), kuchcha (temporary), tent and
multiple types are the different types of buildings that the
schools have. Schools having more than one type of
building are termed as having a multiple-type building.
Irrespective of the school type, the percentage of schools
with pucca building in urban areas is higher than the same
in the rural areas. All schools together in rural areas having
pucca building constitute 69.88 percent (70.36 percent in
Page 39
39
Part IISchool & Facility Indicators
2005-06) against 76.84 percent (74.57 percent in 2005-
06) in urban areas. About 8.23 percent (8.39 percent in
2005-06) schools have partially pucca building, 8.45
percent are in rural areas and 6.76 percent (8.61 and 7.06
percent in 2005-06) are in urban areas. About 3.00 percent
and 1.10 percent (1.91 percent and 0.88 percent in 2005-
06) schools (total) respectively in rural and urban areas,
have kuchcha buildings. Irrespective of the school type
and area, a few schools are functioning in tents. Both in
percentage and absolute number, such schools are only a
few. A large number of schools, both in rural (10.71
percent) and urban areas (7.61 percent), have multiple-
type buildings (Table B 10).
The distribution of schools by type of building
shows that 70.12 percent (71.31 percent in 2005-06)
Primary schools have pucca (permanent) buildings as
compared to 9.08 percent (9.47 percent schools in 2005-
06) having partially pucca buildings and another 3.38
percent (1.98 percent in 2005-06) kuchcha (temporary)
buildings. Only a few Primary schools (0.28 percent
against 0.14 percent in 2005-06) are functioning in tents.
In addition, about 8.80 percent Primary schools had
multiple-type school buildings in 2005-06. This,
otherwise, indicates that a good number of Primary
schools are yet to be provided with a pucca school
building, provision for which should be made under SSA
without delay.
Primary Schools
A cursory look at the state-specific percentages of
schools having pucca building reveals that barring Daman
& Diu, none of the other states have provided a pucca
building to all of its Primary schools. The provision of
pucca building varies from 100 percent in Daman & Diu
to 7.02 percent in Mizoram. Further, it is observed that
the percentage of schools having pucca building in case
of all the north-eastern states is very low. It varies from
7.34 percent in Manipur to 49.85 percent in Tripura.
The percentage of such schools in Kerala is 77.34, 55.33
in Tamil Nadu, and 51.10 in Delhi. About 75 percent
Primary schools in Bihar and 89 percent in Rajasthan also
have pucca school buildings compared to 48.90 percent
in Jharkhand. Further, it may be observed that states having
more than 80 percent Primary schools with pucca buildings
are Chandigarh (93.33 percent), Goa (96.50 percent),
Haryana (94.58 percent), Karnataka (90.36 percent),
Maharashtra (84.01 percent), Punjab (96.93 percent), Uttar
Page 40
Part II
40
Elementary Education in India : Analytical Report
Pradesh (96.44 percent) and Uttarakhand (92.64
percent). However, Orissa (24.64 percent) perhaps has
the lowest percentage of Primary schools that have
pucca buildings amongst the larger states.
Table B10
Percentage of Schools by Type of Building : 2006-07
Type of Building
School Category Pucca Partially Kuchcha Tent Multiple
Pucca Type
Primary Only 70.12 9.08 3.38 0.28 8.80
Primary with Upper Primary 72.58 6.28 0.93 0.05 16.06
Primary with Upper Primary & 75.85 6.52 1.32 0.05 10.43
Secondary/ Hr. Secondary
Upper Primary Only 70.42 7.69 2.87 0.06 7.62
Upper Primary & 70.52 6.19 1.88 0.05 14.82
Secondary/Hr. Secondary
All Schools(All Areas) 70.63 8.23 2.76 0.20 10.31
All Schools (Rural Areas) 69.88 8.45 3.00 0.22 10.71
All Schools (Urban Areas) 76.84 6.76 1.10 0.09 7.61
All Schools (2005-06) 70.56 8.39 1.78 0.12 10.41
All Schools (2004-05) 69.96 9.19 1.84 0.11 10.23
All Schools (2003-04) 69.29 10.09 2.01 0.15 10.16
All Schools (2002-03) 68.81 9.72 2.27 0.18 10.09
Note:Totals may not add up to hundred because of no-responses. The difference may be attributed to both schools not having buildingand no responses.
Page 41
41
Part IISchool & Facility Indicators
The percentage of Primary schools having partially
pucca building (9.08 percent) is lower than the schools
having pucca buildings (70.12 percent). However,
Andaman & Nicobar Islands (21.16 percent), Dadra &
Nagar Haveli (41.83 percent), Jammu & Kashmir (21.45
percent), Lakshadweep (20.00 percent), Orissa (34.84
percent), Tamil Nadu (18.38 percent) and West Bengal
(11.39 percent) are a few states which have got higher
percentage of Primary schools with partially pucca
buildings than the other states. In north-eastern states,
the percentage of schools having partially pucca buildings
is also high. The percentage is as high as 52.30 in
Meghalaya, 74.35 in Mizoram, 46.09 in Nagaland, 23.95
in Assam, 37.19 in Manipur, 30.18
in Sikkim, 22.63 in Arunachal
Pradesh and 13.91 in Tripura. These
states also have a good percentage
of schools that have kuchcha
buildings. In the capital city of Delhi,
16.99 percent Primary schools have
partially pucca school buildings
compared to 51.10 pucca and
30.81 percent multiple type
buildings. The number of Primary
schools having kuchcha building is
significant in the states of Arunachal Pradesh (26.09
percent), Assam (28.76 percent), Himachal Pradesh (3.20
percent), Jammu & Kashmir (9.06 percent), Manipur
(42.02 percent), Meghalaya (13.50 percent), Mizoram
(14.55 percent), Nagaland (29.32 percent), Sikkim (12.98
percent) and Tripura (10.64 percent). The condition of
classrooms also reveals that majority of classrooms in
north-eastern states need either minor or major repairs.
Elementary Schools
About 72.58 percent (69.88 percent in 2005-06)
Elementary schools have pucca buildings compared to
6.28 percent (5.77 percent in 2005-06) schools having
partially pucca buildings and another 0.93 percent (0.94
percent in 2005-06) having kuchcha
buildings. About 16 percent (17
percent in 2005-06) such schools
have multiple-type of school
buildings. It may also be noticed that
almost the same percentage of
Primary and Elementary schools
have pucca buildings (around 70
percent). In 12 States & UTs, more
than 80 percent Elementary schools
have pucca buildings. Further, it is
observed that in Chandigarh, Goa, Haryana, Himachal
“About 72.58 percent
Elementary schools have
pucca buildings compared
to 6.28 percent schools
having partially pucca
buildings and another
0.93 percent having
kuchcha buildings”
Page 42
Part II
42
Elementary Education in India : Analytical Report
Pradesh, Karnataka, Punjab, Uttar Pradesh and
Uttarakhand, more than 90 percent of all such schools
have pucca buildings. Delhi (82.64 percent), Gujarat
(82.53 percent) and Maharashtra (81.28 percent),) are
a few states where more than 80 percent Elementary
schools have pucca buildings. There are only 0.05 percent
Elementary schools in the country functioning in tents.
Upper Primary Schools
It may be observed that only 70.42 percent (68.19
percent in 2005-06) independent Upper Primary schools
have pucca buildings. In Chandigarh and Daman & Diu,
all independent Upper Primary schools have pucca school
buildings compared to no such school in Puducherry;
though the number of such schools in these states is
very small. About 88 percent Upper Primary schools in
Manipur have either kuchcha or partially pucca school
buildings. On the other hand, most of such schools in
Goa (96.88 percent), Gujarat (94.47 percent), Haryana
(96.53 percent), Punjab (96.74 percent), Rajasthan
(88.89 percent), Uttar Pradesh (96.05 percent) and
Uttarakhand (94.73 percent) have pucca buildings. More
than 51 percent such schools in Delhi had pucca school
buildings in 2006-07. Amongst the larger states, Assam
has a low percentage of such schools (28.91). Mizoram
too has only 9.46 percent such schools. Madhya Pradesh
and Kerala respectively have 61.57 and 70.24 percent
Upper Primary schools with pucca buildings. Percentage
of independent Upper Primary schools having partially
pucca buildings is 7.69 percent (8.56 percent in 2005-
06), compared to 2.87 percent (2.69 percent in 2005-
06) schools having kuchcha building in 2006-07.
Higher Secondary SchoolsIt may be noticed that it is not all the integrated
Higher Secondary schools that have a pucca building.
Only 75.85 percent integrated Higher Secondary schools
have pucca buildings, 6.52 percent have partially pucca,
and 1.32 percent only kuchcha buildings. About 10.43
percent of such schools have multiple-type of school
Table B11
Average Number of Classrooms by School Category : 2006-07
Number of Classrooms
All Rural Urban All All
Schools/ Areas Areas Government Private
All Areas Schools Schools
Primary Only 2.8 2.7 4.6 2.6 4.8
Primary with Upper Primary 6.3 5.8 8.0 5.6 8.0
Primary with Upper Primary & 11.0 9.2 13.8 9.2 12.0
Secondary/ Hr. Secondary
Upper Primary Only 4.7 4.1 9.8 3.6 8.1
Upper Primary & Secondary 8.5 7.5 11.4 7.2 9.9
/Hr. Secondary
All Schools (2006-07) 4.1 3.7 7.3 3.4 7.3
All Schools (2005-06) 3.8 3.5 6.7 3.2 7.2
All Schools (2004-05) 3.7 3.3 6.6 3.1 7.1
All Schools (2003-04) 3.7 3.3 6.7 3.1 7.4
All Schools (2002-03) 3.5 3.2 6.5 2.9 7.5
School Category
Page 43
43
Part IISchool & Facility Indicators
Page 44
Part II
44
Elementary Education in India : Analytical Report
buildings. Further, it is observed that more than 80
percent of integrated Higher Secondary schools in
Chandigarh, Daman & Diu, Goa, Gujarat, Haryana,
Himachal Pradesh, Karnataka, Maharashtra, Punjab,
Rajasthan, Uttar Pradesh and Uttarakhand, have pucca
buildings. More than 22 percent integrated Higher
Secondary schools in Assam, 30.18 percent in Manipur,
31.86 percent in Meghalaya, 29.41 percent in Mizoram,
23.14 percent in Nagaland, 49.84 percent in Orissa and
15.64 percent in Tripura have partially pucca buildings.
Only 60.91 percent integrated Higher Secondary schools
in the national capital city of Delhi had pucca buildings
in 2006-07 and another 6.82 percent schools had
partially pucca and 32 percent multiple type buildings.
Average Number of Classrooms
Having adequate number of instructional rooms is
an essential requirement for every school. In this context,
the Government of India initiated the Scheme of
Operation Blackboard in 1987. The schools covered
under the scheme were to be provided each with two
classrooms and a verandah. The DPEP, launched in 1994-
95, also provided additional classrooms to a number of
schools but only to Primary schools/sections and in 272
districts across 18 states. In 2001, the remaining districts
were covered under SSA and a number of new schools
were opened which is reflected in the analysis presented
above. In addition, a good number of schools were
provided with additional classrooms. Table B11 presents
the average number of instructional rooms by school
category. The analysis in case of average number of
classrooms and single-classrooms by school type is
critically analysed below.
Irrespective of the school type, there were on an
average 4.1 classrooms per school imparting elementary
education across 35 states in 2006-07. Significant
change is noticed over the previous year as the average
number of classrooms then was only 3.8 per school which
means that during the intermediary period, a good
number of schools were provided with additional
classrooms. However, a significant difference is noticed
in case of schools located in rural (3.7 classrooms) and
urban areas (7.3 classrooms). Irrespective of the school
type, schools managed by Private managements are
much comfortable in terms of number of classrooms
compared to schools managed by Government
managements. Government managed schools have an
average of 3.4 classrooms (3.2 in 2005-06) per school
compared to 7.3 classrooms in a Private school (7.2 in
Page 45
45
Part IISchool & Facility Indicators
2005-06). Further, it may be observed that Primary
schools have an average of 2.8 instructional rooms
(Government schools - 2.6 and Private schools - 4.8). A
significant difference is also noticed in the average
number of instructional rooms in Primary schools located
in rural (2.7 classrooms) and urban (4.6 classrooms) areas.
Except in Assam, Dadra & Nagar Haveli and
Jharkhand, Primary schools in all other States & UTs have
an average of more than 2 instructional rooms. Assam
and Jharkhand respectively have only 1.5 and 1.3
classrooms per school compared to 1.7 in Dadra & Nagar
Haveli. Chandigarh (12.7 classrooms), Delhi (11.5
Page 46
Part II
46
Elementary Education in India : Analytical Report
classrooms), Kerala (6.1 classrooms), Nagaland (5.2
classrooms), Mizoram (4.0 classrooms), Puducherry (5.3
classrooms), Punjab (3.5 classrooms) and Himachal
Pradesh (3.1 classrooms), have average number of
classrooms well above the national average of 2.8
classrooms. Bihar also has an average of 2.3 classrooms
per Primary school compared to 2.7 in West Bengal. It is
further revealed that on an average, an Elementary
school has 6.3 classrooms compared to 4.7 classrooms
in an independent Upper Primary school. Both the
integrated Higher Secondary schools and Upper Primary
attached to Higher Secondary schools have an average
of 11.0 and 8.5 classrooms respectively. Delhi, Kerala
and a few smaller states, such as Chandigarh, Daman &
Diu, Lakshadweep and Puducherry, have high average
across school categories. In Chandigarh, the average
varies from 12.7 classrooms in Primary schools to 35.7
classrooms in Upper Primary attached to Secondary and
Higher Secondary schools, and in Kerala, it varies from
6.1 classrooms in Primary schools to 23.3 classrooms in
an integrated Higher Secondary school. In Delhi, Primary
schools have an average of 11.5 classrooms compared
to 14.6 in Elementary, 26.0 in integrated Higher
Secondary, 12.0 in independent Upper Primary, and 22.1
in Upper Primary attached to Secondary and Higher
Secondary schools.
Single-Classroom Schools
The average number of instructional rooms
presented reveals that on an average all schools in
general and Primary schools in particular, have an
average of more than two classrooms. Despite
significant achievements, a few schools still may not
have adequate number of classrooms which is not
reflected in the average number of rooms presented
above (Table B11). Therefore, in addition to average
number of classrooms, single-classroom schools have
also been analysed.
Despite a decline in the percentage of single-
classroom schools during the period 2002-03 to 2006-
07 (Table B12), DISE data, however, reveals that still a
good number schools in the country have only one
classroom. In 2002-03, the percentage of single-
Table B12
Percentage of Single-Classroom Schools by Category : 2006-07
Percentage
All Rural Urban All All
Schools/ Areas Areas Government Private
All Areas Schools Schools
Primary Only 13.79 14.33 8.43 14.53 7.36
Primary with Upper Primary 1.62 1.65 1.51 1.69 1.45
Primary with Upper Primary
& Secondary/ Hr. Secondary 1.22 1.53 0.75 1.73 0.89
Upper Primary Only 3.75 3.90 2.47 3.40 4.91
Upper Primary &
Secondary/Hr. Secondary 1.38 1.64 0.57 1.80 0.90
All Schools (All Areas) 9.71 10.46 4.67 10.95 4.09
All Schools (2005-06) 9.54 10.37 3.99 11.04 2.43
All Schools (2004-05) 10.39 11.33 4.45 11.78 2.62
All Schools (2003-04) 10.94 11.86 4.96 12.24 2.62
All Schools (2002-03) 12.08 13.05 5.82 13.35 2.51
School Category
Page 47
47
Part IISchool & Facility Indicators
classroom schools was as high as 12.08 compared to
9.71 percent in 2006-07 for which the available DISE
data is the latest. However, the percentage is slightly
higher from 9.54 in 2005-06 to 9.71 in 2006-07. Though
the majority of single-classroom schools (13.79 percent
in 2006-07) are Primary schools, yet a good number of
other types of schools also have single classroom. In other
school types, the percentage varies from 1.22 in case of
integrated Higher Secondary schools to 1.38 in case of
Upper Primary attached to Secondary and Higher
Page 48
Part II
48
Elementary Education in India : Analytical Report
Page 49
49
Part IISchool & Facility Indicators
two classrooms, meaningful teaching-learning
transaction cannot be expected to take place. Further, it
may be observed that only 0.38 percent Primary schools
in Delhi and 0.80 percent in Kerala are single-classroom
schools, compared to 65.26 percent Primary schools in
Assam and 16.60 percent in Jammu & Kashmir. In a
few other states, like Andhra Pradesh (37.52 percent),
Bihar (11.51 percent), Goa (24.69 percent), Gujarat
(9.15 percent), Karnataka (17.89 percent), Meghalaya
classroom may not be in a good condition and hence
would need repairs. This is also reflected in the DISE
2006-07 data when distribution of classrooms by
condition is analysed in case of all the 35 States & UTs.
The analysis reveals that many (all types) schools need
either major or minor repairs. About 73 percent
classrooms (all types) in 2006-07 (71 percent in 2005-
06 against 68.48 percent in 2004-05) are of good
condition and remaining 27 percent needed either major
Secondary schools, 1.62 in case of independent
Elementary and 3.75 in case of independent Upper
Primary schools. Irrespective of the school type,
percentage of single-classroom schools is much lower in
urban areas (4.67 percent) than in rural areas (10.46
percent). Further, a marked difference in percentage of
single-classroom schools is noticed in case of government
(10.95 percent) and private managed schools (4.09
percent) (Table B 12).
Teaching in single-classroom Primary schools with
all the children sitting in one room is a challenging task.
It is specially true in case of single-classroom single-
teacher schools. Unless all schools are provided at least
(25.41 percent), Maharashtra (13.27 percent),
Madhya Pradesh (11.52 percent), Tripura (10.81
percent) and West Bengal (12.36 percent), the
number of single-classroom Primary schools is high.
Assam also has comparatively a high percentage of
other types of schools that have only single
classroom. On the other hand, Chandigarh,
Lakshadweep and Tamil Nadu did not report any
single-classroom school in 2006-07.
Condition of Classrooms
A few schools do not have adequate number of
classrooms. Even some such schools that have a
Table B13
Distribution of Classrooms by Condition and Category : 2006-07
Percentage
School Category Good Need Need Need Minor and Major Need Minor and MajorCondition Minor Major Repairs (All Areas) Repairs (Rural Areas)
Repairs Repairs
2004-05 2005-06 2006-07 2004-05 2005-06 2006-07
Primary Only 68.43 21.35 10.22 36.65 33.93 31.57 39.2 36.21 33.66
Primary with 75.74 16.85 7.41 27.51 26.08 24.26 31.04 29.59 27.78Upper Primary
Primary with Upper 84.39 11.22 4.39 13.80 15.19 15.61 20.91 20.87 22.05Primary & Secondary/Hr. Secondary
Upper Primary Only 77.50 14.94 7.56 36.30 26.79 22.50 37.25 29.98 25.41
Upper Primary 73.70 17.03 9.27 29.03 26.52 26.30 33.28 31.26 30.60& Secondary/Hr. Secondary
All Schools (2006-07) 72.96 18.33 8.71 – – 27.04 – – 30.49
All Schools (2005-06) 71.03 19.73 9.24 – – – – –
All Schools (2004-05) 68.48 21.13 10.39 – – – – –
All Schools (2003-04) 65.56 22.89 11.55 – – – – –
All Schools (2002-03) 63.48 24.73 11.80 – – – – –
Page 50
Part II
50
Elementary Education in India : Analytical Report
or minor repairs; the percentage of such schools being
29 percent during the previous year. The percentage of
schools that needed repairs is slightly higher in rural areas
(30.49 percent) than the same in the urban areas (27.04
percent), which is true for all types of schools. It is also
observed that the percentage of good condition
classrooms has improved from 65.56 in 2003-04 to 71.03
in 2005-06 and further to 72.96 in 2006-07.
Correspondingly, the percentage of schools that needed
major and minor repairs (barring
integrated Higher Secondary
schools) declined marginally during
the same period (Table B13). In the
present year, as many as 18.33
percent (all types) schools need
minor repairs and 8.71 percent
schools require major repairs, that
is, as many as 27.04 percent schools
imparting elementary education
need either major or minor repairs.
The percentage of such schools
during the previous year was 28.97. The provisions made
under SSA may best be utilized in these schools.
Disaggregated analysis of DISE data would be helpful
in identifying all such schools. It may also be observed
that integrated Higher Secondary schools have the
highest percentage (84.39) of good classrooms,
followed by Upper Primary (77.50), independent
Elementary (75.74) and Upper Primary attached to
Higher Secondary (73.70) schools. On the other hand,
Primary schools have the least percentage (68.43) of
good classrooms and 21.35
percent classrooms needed minor
repairs and 10.22 percent major
repairs. Comparatively, the
percentage of classrooms that
needed major and minor repairs in
other school types is lower than
that in the case of the Primary
schools (Table B 13).
More than 75 percent classrooms
in Primary schools in Andhra
Pradesh, Chandigarh, Delhi,
Gujarat, Haryana, Karnataka,
Madhya Pradesh, Maharashtra, Punjab, Tamil Nadu and
Uttar Pradesh, are of good condition as compared to
“The percentage
of schools that
needed repairs is
slightly higher in rural
areas than the same
in the urban areas
which is true for
all types of schools”
Page 51
51
Part IISchool & Facility Indicators
only 25.95 percent classrooms in Nagaland and 25.01
percent in Meghalaya. Assam too has only 35.77 percent
good condition classrooms in Primary schools. In Assam,
as many as 34.36 percent classrooms in Primary schools
needed minor and 36.20 percent major repairs. In Delhi,
more than 15 percent of classrooms needed minor
and major repairs. The majority of Primary school
classrooms in the north-eastern region needed major
and minor repairs as percentage of good condition
classrooms in the region is comparatively low.
Table B14
Student-Classroom Ratio by Category : 2006-07
Students per Classroom
School Category All Rural Urban All Government All Private
Areas Areas Areas Managements Managements
Primary Only 40 40 36 40 30
Primary with Upper Primary 37 38 36 41 30
Primary with Upper Primary 29 28 29 30 26
& Secondary/ Hr. Secondary
Upper Primary Only 31 33 26 31 27
Upper Primary & Secondary 30 31 27 27 30
/Hr. Secondary
All Schools (2006-07) 36 37 33 38 29
All Schools (2005-06) 39 40 35 40 29
All Schools (2004-05) 41 43 37 42 30
All Schools (2003-04) 42 43 37 43 32
All Schools (2002-03) 43 45 37 45 30
Page 52
Part II
52
Elementary Education in India : Analytical Report
Student-Classroom Ratio
Besides, average number of classrooms and
condition of classrooms, Student-Classroom Ratio (SCR)
pupils sitting in one classroom. The DISE data reveals
that in a few states, student-classroom ratio is high which
is true for both rural and urban areas. However, schools
located in rural areas have comparatively a high ratio
Provisions available to schools on account of school
repairs can be best utilized in the north-eastern states.
is also analysed both at the all-India and state levels.
Student-classroom ratio presents average number of
Page 53
53
Part IISchool & Facility Indicators
than the schools in urban areas. Irrespective of school
type, SCR presented in Table B14 shows improvement.
All schools together have an average of 36 (compared
to 39 in 2005-06) students per classroom (rural 37 and
urban 33 students per classroom). Government schools
have a classroom ratio of 38 against 29 in case of schools
Meghalaya, 18 in Mizoram, 22 in Nagaland and Tripura.
The national capital of Delhi has an average of 35
students in a Primary school classroom.
Average SCR presented above gives average
number of students per classroom
which has shown consistent
improvement over the past few
years. Despite comfortable ratio,
there may still be a few schools where
large number of students sit in one
classroom. To know more about such
schools, the percentage distribution
of schools having student-classroom
ratio above 60 have also been
analysed which reveals that about 16.45 percent (all
categories) schools have the student-classroom ratio of
60 and above compared to 18.37 in the previous year.
Barring Upper Primary attached to Secondary and Higher
Secondary schools, the percentage of such schools is
much higher in case of other school types. The
under private managements. Further, it has also been
observed that student-classroom ratio is higher in the
Primary schools (40 students per classroom) compared
to other school types. The lowest, 29 students per
classroom, is observed in case of the
integrated Higher Secondary
schools. Elementary schools have a
ratio of 37 students per classroom
(Table B14) compared to 30 in case
of Upper Primary attached to
Secondary and Higher Secondary
schools.
In case of Primary schools, the
ratio in Bihar (92), Jharkhand (79)
and Uttar Pradesh (53) is very high compared to other
states. Comparatively, Assam (45 students per
classroom), Madhya Pradesh (43), and West Bengal (50),
too have a high ratio. These states should look into the
matter without delay, otherwise, it would be difficult to
retain children in the school and may also be difficult for
teacher to handle all the children. Himachal Pradesh
(with 15 students per classroom) and Jammu & Kashmir
(with 14 students per classroom) and all the states from
the north-eastern region have comfortable student-
classroom ratio. The ratio is as low as 10 students per
classroom in case of Sikkim compared to 20 in
“In Bihar, Jharkhand,Uttar Pradesh and
West Bengal, the percentageof Primary schools having
60 students per classroom ismuch higher compared to other
states, and hence needimmediate interventions”
Page 54
Part II
54
Elementary Education in India : Analytical Report
percentage of such Primary schools is higher than that
of all categories of schools. It may also be noted that in
a few states, such as Bihar (68.51 percent), Jharkhand
(24.69 percent), Uttar Pradesh (35.82 percent) and West
Bengal (26.47 percent), the percentage of Primary
schools having 60 students per classroom is much higher
compared to other states, and hence need immediate
interventions.
Distribution of Schools by Enrolment &
Enrolment Size
Despite availability of schools and school-related
facilities, still there is no guarantee that adequate number
of children is enrolled in schools. To judge that, a variety
of indicators presenting information about the size of
school is analysed. One such indicator is distribution of
schools by enrolment size in different slabs. It reveals
that more than 48 percent schools (all categories) have
enrolment up to 100. In rural areas, the percentage of
such schools is 50.96. However, urban areas have only
30.08 percent schools that have enrolment up to 100.
There are about 7.91 percent (94,4661 schools) and
16.01 percent schools (1,91,628) which respectively
have enrolment between 1-25 and 26-50. On the
other hand, about 24.44 percent schools (37,076) in
urban areas have enrolment even more than 300
compared to 9.14 percent (95,327) schools in the
rural areas (Table B15).
About 58.86 percent of the total Primary schools
in 2006-07 (55.26 percent in 2005-06) have enrolment
up to 100 compared to 60.57 percent Primary schools
in rural areas (58.01 percent in 2005-06). The percentage
of such schools in urban areas is only 42.30 (38.22 in
2005-06). Further, it is observed that about 10.38 percent
(8.18 percent in 2005-06) Primary schools have an
average enrolment of 25 and another 20.74 percent
(19.94 percent in 2005-06) between 26 to 50. About
13.30 percent (13.91 percent in 2005-06) Primary
schools have enrolment between 101 to 140. On the
other hand, about 80 percent Elementary schools have
Table B15
Percentage Distribution of Schools by Enrolment : 2006-07
Enrolment Slabs
School Category 1-25 26-50 51-100 101-140 141-220 221-300 >300
Primary Only 10.38 20.74 27.77 13.30 14.77 6.52 5.64
Primary with 1.39 3.97 14.33 14.36 25.48 16.20 23.66Upper Primary
Primary with Upper 2.04 4.31 10.44 9.77 19.34 15.30 36.67Primary & Secondary/Hr. Secondary
Upper Primary Only 7.56 13.89 28.49 15.56 16.07 7.02 10.18
Upper Primary & 2.89 7.68 15.76 13.79 21.00 11.34 25.22Secondary/Hr.Secondary
All Schools, 2006-07 7.91 16.01 24.35 13.62 17.22 8.74 11.08
All Schools, 2005-06 6.17 15.20 24.25 13.81 17.62 9.02 11.01
All Schools, 2004-05 5.80 14.95 23.62 13.85 18.13 9.24 11.23
All Schools, 2003-04 5.23 13.74 23.42 14.52 18.48 9.49 11.47
All Schools, 2002-03 5.15 13.58 24.16 14.94 18.57 9.31 10.73
Note:Totals may not add to hundred because of missing values and rounding of figures. The percentages are calculated with regard tototal schools in a category.
Page 55
55
Part IISchool & Facility Indicators
enrolment of more than 100. It may also be noted that
1.39 percent integrated Higher Secondary schools have
an average enrolment of 25 and another 3.97 percent
schools have enrolment between 26 to 50. While
about 21 percent Upper Primary schools have
enrolment up to 50, 5.64 percent Primary schools
have enrolment more than 300 compared to 23.66
percent Elementary schools. The percentage of
schools having enrolment more than 300 in 2006-07
is as high as 36.67 and 25.22 percent respectively in
case of the integrated Higher Secondary and Upper
Primary attached to Higher
Secondary schools. Almost similar
trend is observed in case of
schools located in rural areas.
The state-specific distribution
of schools having enrolment below
25 reveals that the percentage of
such Primary schools in the states
of Arunachal Pradesh (45.98), Goa
(42.28), Himachal Pradesh (27.48),
Jammu & Kashmir (39.44),
Karnataka (26.69), Meghalaya
(29.14) and Sikkim (32.39) is above 25 percent. In a
few other states also, a good number of Primary schools
have enrolment below 25. More than half of Primary
schools in such states have an enrolment size up to 50.
For example, the percentage of such schools in Jammu
& Kashmir is as high as 80.79 against 64.19 percent in
Himachal Pradesh. On the other hand, there are only a
few such schools in Bihar (3.45 percent). This is also
reflected in student-classroom ratio presented above
which is very high compared to other states. The
percentage of such schools in Delhi and Uttar Pradesh is
also low, these respectively being at 4.42 and 4.21. In
Mizoram, even 16.18 percent
integrated Higher Secondary
schools have enrolment below 50.
Uttarakhand has 9.53 percent and
Himachal Pradesh 7.23 percent such
schools. About 51 percent Upper
Primary schools in Himachal
Pradesh, 50 percent in Sikkim, 33
percent in Mizoram and 42
percent in Uttarakhand have
enrolment below 50. Analysis of
all schools together reveals that about 59 percent
“About 58.86 percentof the total Primary schools
in 2006-07 have enrolmentup to 100 compared to60.57 percent Primary
schools in rural areas.The percentage of
such schools in urban
areas is only 42.30”
Page 56
Part II
56
Elementary Education in India : Analytical Report
schools in Meghalaya, 61 percent in Arunachal
Pradesh, 53 percent in Himachal Pradesh and 44
percent in Uttarakhand have enrolment below 50.
Kerala has 7.07 percent such schools compared to
7.55 percent in Uttar Pradesh and 2.47 percent in
Delhi. Percentage of smaller schools in rural areas in
many states is even higher than that reported above.
In addition to distribution of schools in different
enrolment slabs, average size of school in different
categories has also been analysed which reveals not much
Table B16
Average Enrolment by Category : 2006-07
Enrolment
School Category All Rural Urban All All
Areas Areas Areas Government Private
Managements Managements
Primary Only 113 107 167 108 155
Primary with Upper Primary 235 222 287 229 249
Primary with Upper Primary & Secondary/
Hr. Secondary 313 261 393 288 329
Upper Primary Only 146 133 259 122 223
Upper Primary & Secondary/ Hr. Secondary 250 231 308 202 304
All Schools(2006-07) 150 137 239 133 222
All Schools (2005-06) 150 138 237 135 225
All Schools (2004-05) 150 140 239 137 223
All Schools (2003-04) 154 143 250 140 245
All Schools (2002-03) 150 142 239 138 239
Page 57
57
Part IISchool & Facility Indicators
change over the previous year. All schools together have
an average enrolment of 150 which is exactly the same
as was in the previous year. Schools located in urban
areas have higher average of 239 compared to only 137
in rural areas which is also true for all other school types
(Table B16). Private schools have higher average
enrolment (222) than the government schools (133)
which is quite similar to all other school types. Further, it
is observed that the average size of a Primary school is
113, the corresponding figure in rural areas is 107 and
Page 58
Part II
58
Elementary Education in India : Analytical Report
in urban areas 167. The north-eastern region sates have
low enrolment (all schools). It varies from 58 in
Meghalaya to 81 in Arunachal Pradesh and 190 in Tripura.
The highest average enrolment of 468 in Primary schools
is observed in Chandigarh, followed by 404 in Delhi,
208 in Bihar, 197 in Uttar Pradesh. Kerala has an average
of 160 students per Primary school. The highest 556
average across school types in Kerala is observed in case
of integrated Higher Secondary schools, followed by 440
in case of Upper Primary attached to Secondary and
Higher Secondary schools and 416 in case of Elementary
schools. It is interesting to note that average size of an
integrated Higher Secondary school in Delhi is 722 and
582 in case of Upper Primary attached to Secondary and
Higher Secondary schools. Across school types, Delhi has
second highest average of 722 in case of integrated
Higher Secondary and Mizoram the lowest 170 in case
of Primary schools.
Data clearly reveals that a
large number of schools have
enrolment up to 25 which can be
termed as small schools. The
problems of small schools may be
different than those of the large
schools. In view of there being a
large number of small schools (in
terms of enrolment), perhaps there
is a need to have separate
programmes for these schools.
There is also need to evolve
planning methodology for small schools and before that
the definition of small school itself needs to be evolved.
Schools with fewer enrolment as well as single-classroom
and single-teacher schools can be treated as small
schools. Enrolment alone cannot be the only criterion of
small schools. If that is the case, then all the north-eastern
states, and a number of other smaller states, such as
Himachal Pradesh because of their demographic
structure, would fall under the category of having small
schools. DISE data can be further probed to know more
about small schools and their problems.
Single-Teacher Schools
A fairly good number of schools, both in rural areas
(11.76 percent in 2006-07 against 13.35 percent in
2005-06) and urban areas (5.22 percent in 2006-07
against 4.23 percent in 2005-06), had only one teacher
(Table B17). Of the total single-teacher schools (all
categories), 94.35 percent are located in the rural areas.
Urban areas have only a few such schools. All areas
together have about 11.76 percent single-teacher
schools (12.17 percent in 2005-06). Schools managed
by government have much higher percentage of single-
teacher schools (13.61 percent) compared to private
managed schools (3.10 percent). Further, it has been
observed that amongst major states, Assam (29.50
percent), Jharkhand (17.30 percent), Madhya Pradesh
(22.12 percent), Rajasthan (26.08 percent) and Uttar
Pradesh (15.47 percent), have a very high percentage
of single-teacher schools. Practically, every fourth school
in Rajasthan and Assam is a single-teacher school.
Andhra Pradesh (7.81 percent), Bihar (5.12 percent),
Chhattisgarh (13.12 percent), Dadra & Nagar Haveli
(28.99 percent), Goa (25.56 percent), Himachal Pradesh
(7.30 percent), Karnataka (12.63 percent), Maharashtra
(5.21 percent), Manipur (12.15
percent), Meghalaya (11.56
percent), Orissa (12.00 percent)
and Punjab (10.83 percent) also
have a large percentage of single-
teacher schools. Incidentally, many
of these states are DPEP states. In
the capital city of Delhi, only 0.19
percent schools (all categories) are
single-teacher schools. Chandigarh
does not have any such school and
Puducherry has 1.35 percent such
schools.
It has also been observed that the percentage of
single-teacher Primary schools is higher than that of other
school types. About 16 percent Primary schools have
only one teacher, of which 95 percent are located in the
rural areas. However, in case of other school types
(except Upper Primary schools) there are only a few
single-teacher schools. About 9.56 percent of the total
Upper Primary schools are single-teacher schools (Table
B17). The percentage of such schools in the urban areas
is only 2.15 percent.
A look at the percentage of single-teacher Primary
schools reveals that in a number of states, their number
is significant. A large number of schools have been
opened recently but a few of these schools are yet to be
provided adequate number of teachers. Chandigarh and
Lakshadweep have reported no single-teacher Primary
school and Kerala and Delhi respectively had only 31
“In view of therebeing a large number of
small schools, perhaps thereis a need to have separate
programmes for theseschools. There is also need
to evolve planningmethodology forsmall schools”
Page 59
59
Part IISchool & Facility Indicators
Table B17
Percentage of Single-Teacher Schools by Category : 2006-07
Percentage
School Category All Rural Urban All All
Areas Areas Areas Government Private
Managements Managements
Primary Only 15.90 16.60 8.96 17.05 5.37
Primary with Upper Primary 2.23 2.23 2.25 2.30 2.07
Primary with Upper Primary & 2.29 2.79 1.52 3.63 1.48
Secondary/Hr. Secondary
Upper Primary Only 9.56 10.42 2.15 12.06 1.49
Upper Primary & Secondary/Hr. Secondary 1.63 1.81 1.06 2.30 0.86
All Schools (2006-07) 11.76 12.74 5.22 13.61 3.10
All Schools (2005-06) 12.17 13.35 4.23 14.13 2.87
All Schools (2004-05) 13.36 14.66 4.41 15.13 3.45
All Schools (2003-04) 12.93 14.19 4.55 14.42 3.41
All Schools (2002-03) 14.40 15.72 5.28 15.87 3.31
Note: Totals may not add to hundred because of missing values and rounding of figures.
and 9 such schools in 2006-07. Similarly, Andaman &
Nicobar Islands, Daman & Diu, Puducherry, Sikkim, and
Tripura, have a few or no such schools. The percentageof single-teacher Primary schools is as high as 61.67 in
Arunachal Pradesh and 42.59 in Rajasthan, followed by
Assam with a percentage of 37.40, Madhya Pradesh
27.55, Jharkhand 22.48, Karnataka 22.04, Uttarakhand
19.17 and Andhra Pradesh 11.71. On the other hand,the percentage of such schools in Bihar (6.79) and Uttar
Pradesh (2.21) is comparatively low but in view of the
Page 60
Part II
60
Elementary Education in India : Analytical Report
large number of schools in these states, in absolute terms
they may be having higher number of single-teacher
Primary schools than in other states. Few states from
the north-eastern region have a low percentage of
single-teacher Primary schools but other smaller states,
such as Dadra & Nagar Haveli (50.33 percent), and Goa
(36.63 percent), have sizable number of such schools.
West Bengal too has 3.17 percent (6.07 percent in 2005-
06) single-teacher schools.
Despite decline in the single-teacher schools over a
period of time, there number is still high. Rationalization
of teachers across states may help improve number of
teachers in single-teacher schools which is also reflected
in average number of teachers per school which is found
to be well above 2. This should be supported by filling-
up of all the existing vacant teachers’ position across the
country. Like additional classrooms, a large number of
Secondary schools. Only 93.60 percent Higher Secondary
schools have got drinking water facility in schools.
Altogether, of the 1.20 million schools, 15.11 percent
schools are yet to be provided drinking water facility in
schools. The corresponding percentage in case of Primary
schools is about 18 percent.
Nonetheless, it is observed that Chandigarh (100.00
percent), Delhi (99.94 percent), Puducherry (96.86
teacher’s positions have also been sanctioned under SSA
which would also help in further ensuring at least two
teachers in each Primary school.
Facilities in Schools
Drinking Water Facility
Availability of drinking water in the school is the
most essential facility that every school should have.
Table B18
Schools Having Drinking Water Facility in School : 2006-07
Percentage
School Category All Areas Rural Urban All All
Areas Areas Government Private
2003-04 2004-05 2005-06 2006-07 Managements Managements
Primary Only 76.24 78.80 81.12 82.37 82.14 84.72 82.19 84.31
Primary with 83.89 86.68 82.78 89.95 88.85 94.48 87.84 95.43
Upper Primary
Primary with 90.44 92.75 93.22 93.60 92.19 96.10 91.31 95.04
Upper Primary
& Secondary/
Hr. Secondary
Upper Primary 78.77 79.87 83.22 87.00 86.36 92.54 87.21 86.33
Only
Upper Primary 91.33 91.82 92.31 93.47 92.43 96.84 90.93 96.39
& Secondary/
Hr. Secondary
All Schools 77.89 80.60 83.07 84.89 84.28 90.07 83.93 89.64
DISE data reveals that more schools in 2006-07 had
drinking water facility than in 2005-06. The distribution
of schools, however, further shows that this basic facility
is not yet made available in all the schools that reported
DISE data in 2006-07. About 85 percent schools (all
categories) are having drinking water facility available as
in 2006-07, compared to 83.07 percent in the previous
year. A significant difference is noticed in the number of
such schools located in rural (84.28 percent in 2006-07
and 82.59 percent in 2005-06) and urban areas (90.07
percent in 2006-07 and 89.26 percent in 2005-06). As
compared to 81.46 percent (83.93 percent in 2005-06)
schools under government managements, about 90
percent schools under private managements had drinking
water facilities in schools. In none of the school type,
drinking water facility is available in all schools. This facility
is not yet available even in all the integrated Higher
Page 61
61
Part IISchool & Facility Indicators
Page 62
Part II
62
Elementary Education in India : Analytical Report
percent), Punjab (97.98 percent) and Tamil Nadu (100.00
percent) have more than 95 percent schools with the
drinking water facility in schools. It is heartening to know
percentage than the Primary schools, which is true for
rural as well as urban areas. Like other school types, the
percentage of Primary schools with drinking water facility
that Tamil Nadu has provided drinking water
facility to its all schools across school types. Barring
Chandigarh and Tamil Nadu, not a single other
state has provided this facility as yet to all of its schools
though percentage of such schools in a number of
states is very high. On the other
hand, the percentage of schools
(all categories) where drinking
water is available is low in states
such as Arunachal Pradesh (72.33
percent), Assam (61.77 percent),
Jammu & Kashmir (71.39 percent),
Meghalaya (43.31 percent),
Nagaland (68.43 percent) and
Tripura (76.46 percent). Kerala has
also provided water facility to its
more than 96 percent schools (all categories) compared
to 80 percent such schools in Karnataka.
Table B18 reveals that 82.37 percent Primary
schools have drinking water facility in school, compared
to 89.95 percent Primary with Upper Primary schools.
All other types of schools having this facility have higher
in urban areas (84.72 percent) is higher than that in the
rural areas (82.14 percent). Such schools under private
managements (84.31 percent) have higher percentage
than the schools under the government managements
(82.19 percent). However, it is observed that many states
have provided drinking water facility
to almost all of the Primary schools.
For instance, Chandigarh (100.00
percent), Delhi (99.96 percent),
Kerala (95.91 percent), Puducherry
(97.23 percent), Punjab (97.56
percent), Tamil Nadu (100.00
percent) and Uttar Pradesh (98.61
percent), are such states that have
drinking water facility in most of their
Primary schools. At the same time, a
good number of Primary schools in Arunachal Pradesh,
Jammu & Kashmir and north-eastern states are yet to
be provided with drinking water facility in school. It is
hoped that DISE data would be used in identifying
schools without drinking water facility to help make
provisions under the SSA in extending drinking water
facility to all schools.
“It is hoped that DISE
data would be usedin identifying schools
without drinking water
facility to help makeprovisions under SSA inextending drinking water
facility to all schools”
Page 63
63
Part IISchool & Facility Indicators
Type of Drinking Water
The type of drinking water facility reveals that
majority of schools (all categories) do not have tap water
facility in their premises. Much difference is noticed in
this regard in schools located in rural (18.84 percent)
and urban areas (51.10 percent). Only 22.82 percent
schools had tap water in the school in 2006-07. The
percentage of rural area schools that had hand-pump
installed in the school was 52.74, while this figure in the
urban areas was 25.85 percent. Interestingly, about 5.55
percent schools had a well in the school premises with
Table B19
Schools by Type of Drinking Water Facility : 2006-07
Type of
Drinking All Areas Rural Urban
Water Facility2003-04 2004-05 2005-06 2006-07
Areas Areas
Hand-Pump 46.69 46.85 49.12 49.25 52.74 25.85
Well 5.57 5.43 5.63 5.55 5.49 6.01
Tap Water 18.93 21.46 22.97 22.82 18.84 51.10
Others 6.70 6.84 5.87 7.26 7.31 7.05
None 16.99 15.60 14.87 14.23 15.06 8.68
No Responses 5.12 3.79 1.55 0.90 0.66 1.32
Note: Total may not add to hundred because of no-responses and rounding of figures.
Percentage
Page 64
Part II
64
Elementary Education in India : Analytical Report
not much difference in rural (5.49 percent) and urban
(6.01 percent) areas. Almost an equal percentage of
schools had other arrangement of drinking water than
specified above (Table B19). It is observed that all
integrated Higher Secondary schools do not have tap
water facility. The percentage of Elementary schools
with tap water is 38.83 percent compared to only 14.63
percent such independent Upper Primary schools. On
the other hand, a good number of independent
Elementary schools (36.99 percent) draw water from
hand-pump. In case of independent Upper Primary
schools, the percentage of such schools is as high as
62.32. Amongst the major states, Uttar Pradesh (95.74
percent), Chhattisgarh (77.16 percent), Jharkhand (40.48
percent), Madhya Pradesh (69.85 percent) and Bihar
Common and Separate Toilets for Girls
Like drinking water facilities, toilet facilities in
schools have also improved impressively since the
inception of SSA. Data reveals that providing facilities
to schools got further momentum in 2006-07 (Table
B20). Percentage of schools with common toilets and
separate toilets for girls increased in 2006-07 over 2005-
06, irrespective of the school types (except integrated
Higher Secondary schools) and location (rural or urban).
Put together, about 58 percent schools (all categories)
across 609 districts had common toilets in schools; while
42.58 percent schools had separate toilets for girls in
2006-07. The corresponding figures in 2005-06 were
52.39 percent common toilets and 37.42 percent
(85.15 percent), had majority of Primary schools with
hand-pump facility in the school, whereas only 5.05
percent Primary schools in Delhi, 3.39 percent in Kerala,
1.03 percent in Goa, 3.20 percent in Himachal Pradesh,
5.71 percent in Arunachal Pradesh, 0.57 percent in
Mizoram, 2.71 percent in Meghalaya, 0.91 percent in
Sikkim and 5.16 percent in Nagaland had such a facility.
Comparatively, the percentage of tap water in north-
eastern states is much higher than the same in other states.
separate girls’ toilets. There are more schools with
common toilets in the urban areas (68.89 percent against
66.05 percent in 2005-06) than in the rural areas (56.66
percent against 50.72 percent in 2005-06); this is true
for all types of schools. Urban areas also have girls’ toilets
in case of 64.96 percent (61.90 percent in 2005-06)
schools, whereas 39.52 percent (34.17 percent in 2005-
06) such schools are located in rural areas. A significant
difference in percentage in the availability of toilets is
Page 65
65
Part IISchool & Facility Indicators
also noticed in schools under government and private
managements. As against 68.97 percent private schools
with common toilets, the percentage of such schools
under government managements is as low as 55.75
percent (48.95 percent in 2005-06). This is also true for
schools with girls’ toilets. As against 68.58 percent such
schools under private managements, the percentage in
case of government schools is low at 36.64 percent
Table B20
Percentage of Schools Having Common Toilets in School : 2006-07
All Areas
2003-04 2004-05 2005-06 2006-07
Primary Only 36.16 41.43 47.55 53.75 52.82 63.09 52.52 63.97
Primary with 56.93 61.61 63.86 69.01 67.44 75.48 66.51 75.57
Upper Primary
Primary with 69.61 69.88 66.25 71.78 68.65 76.86 65.93 75.33
Upper Primary &
Secondary/Hr.
Secondary
Upper Primary 44.25 48.52 56.25 60.33 59.61 66.57 59.71 62.33
Only
Upper Primary 63.61 60.49 64.39 66.91 64.73 73.80 60.02 74.78& Secondary/Hr. Secondary
All Schools 41.81 46.82 52.39 58.13 56.66 68.89 55.75 68.97
Percentage
School Category AllGovernment
Managements
AllPrivate
Managements
UrbanAreas
RuralAreas
Page 66
Part II
66
Elementary Education in India : Analytical Report
(30.73 per cent in 2005-06). Tables B20 and B21 further
reveal that a good percentage of schools are yet to be
provided toilets, which is true for all school types. About
69 percent independent Elementary and more than 67
Table B21
Percentage of Schools Having Girls Toilets in School : 2006-07
Percentage
2003-04 2004-05 2005-06 2006-07
Primary Only 20.61 24.27 28.85 34.06 32.44 50.15 31.11 56.98
Primary with 41.86 46.76 49.09 55.37 51.05 73.12 47.87 74.96Upper Primary
Primary with 72.48 76.55 76.28 74.49 68.20 84.45 60.24 82.96Upper Primary& Secondary/Hr.Secondary
Upper Primary 32.91 36.91 46.58 52.62 50.62 69.91 48.61 65.60Only
Upper Primary 69.31 70.47 72.42 72.32 68.67 83.74 60.20 86.12& Secondary/Hr. Secondary
All Schools 28.24 32.70 37.42 42.58 39.52 64.06 36.64 68.58
percent Upper Primary attached to Secondary and Higher
Secondary schools across 609 districts have provided
common toilets. However, about 28 percent integrated
Higher Secondary schools are yet to provide common
All Areas AllGovernment
Managements
AllPrivate
Managements
UrbanAreas
RuralAreas
School Category
Page 67
67
Part IISchool & Facility Indicators
Page 68
Part II
68
Elementary Education in India : Analytical Report
toilets. The percentage of such independent Upper Primary
schools is 40. Despite significant improvement, the analysis
suggests a good scope for further expansion of toilet
facilities in schools under the SSA.
The percentage of Primary schools with common
toilets in 2006-07 increased from its value in 2005-06;
however, still a good number of Primary schools are yet
to be provided with the facility. More than 50 percent
Primary schools have common toilet facilities (53.75
percent) and 34.06 percent schools having separate
toilets for girls. The situation has improved impressively
in the previous year, reaching a figure of 47.55 percent
in case of common toilets and 28.85 percent in case of
girls’ toilets (Tables B20 and B21).
The respective percentage of such Primary schools
in case of Bihar, Chhattisgarh and Jharkhand is only
38.88, 21.35 and 14.71 (common
toilets) and 10.28, 7.88 and 8.68
(separate girls’ toilets). In Kerala, as
many as 82.98 percent Primary
schools have common toilets in
school, compared to 67.87 percent
schools with separate toilet for girls.
More than 85 percent Primary
schools in Uttar Pradesh had
common toilets compared to 77
percent schools having separate
girls’ toilets. The national capital of Delhi had provided
common toilets to all of its schools and girls’ toilets to
84.65 percent of its Primary schools.
Further, it is observed that except in the case of
Mizoram (75.37 percent) and Sikkim (91.02 percent),
the percentage of schools having common toilets in the
other north-eastern states is much lower. Sikkim too has
a low percentage of schools with girls’ toilets (24.66
percent), and Mizoram has only 15.51 percent such
schools. Data reveals that not a single state has provided
common toilets (barring Delhi) and toilets for girls to all
of its schools. It is hoped that in the remaining period
of SSA, while formulating annual plans, all such schools
will be identified and provided with a toilet in school.
Listing of all such schools can be generated by using the
DISE software at any desired level.
Computers in Schools
The percentage distribution of schools having
computers reveals that all types of schools have
computers in school. During the period 2003-04 to 2006-
07, the number of schools with computers increased
substantially, both in percentage and absolute terms.
Though the percentage of Primary schools having
computer facility (6.51 percent) is much lower than
percentage of other types of schools, more than 160.7
thousand (13.43 percent) schools imparting elementary
education in the country in 2006-07 had computers in
place in school. The number of schools having provided
computers during the year 2005-06 was 120.6 thousand
(10.73 percent), during 2004-05, 93 thousand (8.99
percent) and in 2003-04, 72 thousand (7.68 percent)
(Table B22).
A significant difference is
noticed in percentage of schools
having computer in rural areas
(10.33 percent against 8.05
percent in 2005-06) and urban
areas (34.94 percent against 30.07
percent in 2005-06). The data
clearly shows that both in the rural
and urban areas, the percentage of
schools with computers has
increased considerably during the
period 2003-04 to 2006-07. However, of the total (160.7
thousand) schools that have computers, 67 percent are
located in rural areas and only 33 percent in urban areas
(Table B22). The percentage of government schools with
computers has shown improvement over the previous
year (6.57 percent in 2005-06 to 8.57 percent in 2006-
07). Compared to 8.57 percent government schools
having computers, the percentage in case of schools under
private managements is much higher at 34.43 percent.
This is also true for all other types of schools. About 62
percent integrated Higher Secondary and 59 percent Upper
Primary attached to Secondary and Higher Secondary
schools under the private managements have got
computers.
In absolute terms, Maharashtra has the highest
number of schools (28,882 all category schools; 33.42
percent) that have computers in schools, followed by
“More than 160.7 thousand
schools imparting elementaryeducation in the country hadcomputers in place in school.
The number of schools havingprovided computers during
the year 2005-06 was
120.6 thousand”
Page 69
69
Part IISchool & Facility Indicators
19,154 schools in Andhra Pradesh (18.987 percent),
16,064 schools in Madhya Pradesh (12.76 percent),
13,336 schools in Rajasthan (13.21 percent), 11,603
schools in Tamil Nadu ( 22.13 percent), 9,244 schools in
Gujarat (24.03 percent), 6,070 schools in Orissa (11.86
percent) and 7,429 schools in Kerala (60.90 percent).
About 68.85 percent schools in Delhi in 2006-07 had
computers. The lowest numbers, 12 schools, with
Table B22
Percentage of Schools Having Computers in School : 2006-07
Percentage
School Category All Areas All AllGovernment Private
2003-04 2004-05 2005-06 2006-07 Managements Managements
Primary Only 3.95 4.50 5.42 6.51 5.34 18.20 4.68 20.33
Primary with 10.12 12.68 15.65 21.31 16.55 40.83 15.04 37.65Upper Primary
Primary with 48.73 52.06 46.57 52.33 42.05 68.38 35.81 62.09Upper Primary& Secondary/Hr. Secondary
Upper Primary 7.14 7.50 11.05 14.61 11.82 38.66 10.60 27.57Only
Upper Primary 35.70 35.64 41.18 50.36 45.04 66.99 42.43 59.40& Secondary/Hr. Secondary
All Schools 7.68 8.99 10.73 13.43 10.33 34.94 8.57 34.43
Number of 71,501 93,249 1,20,591 1,60,749 1,07,702 53,047 82,859 77,890Schools with
Computers
UrbanAreas
RuralAreas
Page 70
Part II
70
Elementary Education in India : Analytical Report
computer facility is in the Dadra & Nagar Haveli, followed
by 15 schools in Daman & Diu, 22 schools in
Lakshadweep, and 119 schools in Andaman & Nicobar
Islands. In Bihar too, the percentage of schools with
computers was found to be low at 2.62 (1,436 schools).
As mentioned above, the percentage of Primary
schools having computers is much lower (6.51 percent)
than that of the other school types. It is high at 18.20
percent in urban areas and low at 5.34 percent in rural
areas. As many as 50,747 Primary schools in 2006-07
of the states. In absolute terms, Madhya Pradesh (7,404
schools; 8.44 percent) had the highest number of Primary
schools with computers. The percentage of such schools
was as low as 2.16 percent in Bihar (800 schools) and
2.65 percent in West Bengal (1,476 schools).
Ramp in Schools
Every fourth school that imparts elementary
education in the country has a ramp. The percentage of
such schools, irrespective of school type, has increased
are provided computers, of which 75 percent schools
are in rural areas and only 25 percent in urban areas.
The percentage of Primary schools with computers,
except in the states of Chandigarh (23.33 percent), Delhi
(58.20 percent), Gujarat (10.80 percent), Kerala (41.35
percent), Lakshadweep (75.00 percent), Maharashtra
(11.34 percent), Orissa (10.79 percent), Pudhucherry
(20.42 percent), Sikkim (12.50 percent) and Tamil Nadu
(11.49 percent), has been lower than two digits in rest
significantly in 2006-07 from its previous level. The
percentage of such schools is still as low as 25.82 (15.65
percent in 2005-06) in the case of Primary schools,
compared to 34.12 (26.19 percent in 2005-06) in case
of independent Elementary schools (Table B23). On the
other hand, about 22 percent integrated Higher
Secondary schools also had ramp in school. The
percentage of such schools in urban areas (22.65
percent) is slightly higher than the same in rural areas
Table B23
Percentage of Schools Having Ramp in School : 2006-07
Percentage
All AreasSchool Category
2003-04 2004-05 2005-06 2006-07
Primary Only 4.98 11.21 15.65 25.82 26.45 19.56 27.67 12.39
Primary with 5.16 14.48 26.19 34.12 36.86 22.91 41.61 14.64
Upper Primary
Primary with 8.58 12.85 18.05 21.97 21.59 22.65 29.73 17.46
Upper Primary
& Secondary/Hr.
Secondary
Upper Primary 4.69 8.33 12.78 22.74 22.98 20.69 25.64 13.36
Only
Upper Primary 6.64 10.87 13.32 21.44 21.95 19.85 24.48 17.99
& Secondary/
Hr. Secondary
All Schools 5.10 11.49 17.14 26.61 27.51 20.80 29.59 14.23
AllGovernment
Managements
AllPrivate
Managements
UrbanAreas
RuralAreas
Page 71
71
Part IISchool & Facility Indicators
Page 72
Part II
72
Elementary Education in India : Analytical Report
(21.59 percent). Upper Primary attached to Secondary
and Higher Secondary schools had the least percentage
of 21.44 (13.32 in 2005-06) with ramp in school. It is
interesting to note that the percentage of Primary schools
with ramp under government managements is much
higher (27.67) than the same in schools under Private
managements (12.39). This is also true for all other school
types which clearly shows that government managed
schools are more concerned about physically challenged
children than private managed schools.
It is further revealed that about 67.33 percent
Primary schools in Delhi, 75.67 percent in Maharashtra,
46.11 percent in Haryana, 58.74
percent in Gujarat, 52.45 percent in
Kerala, 23.02 percent in Chhattisgarh,
and 41.52 percent in Puducherry, had
a ramp in school in 2006-07. Among
major states, Maharashtra with 75.67
percent schools, has the highest
number of such schools in the
country; the lowest percentage of
such schools is in Dadra & Nagar
Havelli (1.96 percent). The
percentage of such schools is also low
in the states of Jharkhand (3.22
percent), Andhra Pradesh (7.16 percent), Jammu &
Kashmir (5.27 percent), Karnataka (9.77 percent) etc.
Significant difference is noticed in schools located in rural
(26.45 percent) and urban (19.56 percent) areas. The
analysis also reveals that majority of schools that impart
elementary education across all the States and UTs are
yet to be provided with ramp in the school; it is also true
for all school types both in rural and urban areas.
Kitchen-Sheds in School
Providing nutritious food (cooked) to all children
under the noon-meal (mid-day meal scheme)
programme is one of the ambitious programmes of the
government. The scheme is under implementation in all
the States and UTs of the country.
Perhaps it is one of the largest
programmes of its kind in the
world. The scheme has recently
been extended to Upper Primary
level of education. With this,
around 194 million children in
Grades I to VIII are supposed to
be covered under the scheme.
Management of a scheme of this
scale in itself is challenging one
for which each and every school
covered under the scheme is
supposed to have necessary infrastructure, such as
availability of kitchen-shed in school that is the most
Table B24
Percentage of Schools having Kitchen-Sheds : 2006-07
(Government and Aided Schools)
School Category All Areas Rural Areas Urban Areas
Primary Only 32.62 33.33 23.19
Primary with Upper Primary 21.84 32.81 25.14
Primary with Upper Primary &
Secondary/ Hr. Secondary 21.81 21.99 21.40
Upper Primary Only 11.02 10.00 23.30
Upper Primary & Secondary/Hr. Secondary 13.89 13.55 15.32
All Schools 29.36 30.03 22.59
“Percentage of Primaryschools with ramp under
government managementsis much higher than thesame in schools under
Private managements whichclearly shows that
government managed schoolsare more concerned about
physically challengedchildren than private
managed schools”
Page 73
73
Part IISchool & Facility Indicators
essential. Different states have evolved different
arrangements to ensure daily supply of nutritious food
to all of its children in Grades I to VIII. The full monitoring
information system is yet to be developed but for the
first time, a variable on availability of kitchen-shed in
school was added to DISE during 2006-07, details of
which are presented in Table B24.
Table B24 reveals that 29.26 percent of schools
managed by the Government and Aided schools (all
categories) have kitchen-shed in school. The percentage
of such schools are 30.03 and 22.59 respectively in the
rural and urban areas. The percentage of schools with
kitchen-shed varies from 80.11 in Tamil Nadu and
70.79 percent in Maharashtra to only 2.59 percent
in Jammu & Kashmir. The percentage of schools with
kitchen in Kerala is 43.19, compared to 13.22 percent
in the national capital of Delhi. Except Manipur (70.79
percent), around 35 percent schools in other north-
eastern states have kitchen-shed in school. A look at
percentage of Primary schools with kitchen-shed
suggests that majority of our Primary schools are yet
to be provided with kitchen-shed (32.62 percent).
However, a number of states have much higher
percentage than the national average of 32.62
percent. The percentage is as high as 77.56 in Tamil
Nadu, 41.25 in Uttar Pradesh, 67.89 in West Bengal,
47.50 percent in Assam etc. On the other hand, only
7.10 percent Primary schools in Bihar, 8.24 percent
in Maharashtra and 7.92 percent in Punjab had
kitchen-shed in their Primary schools. A few states
from the north-eastern region, such as Manipur
(75.85 percent), also have kitchen-sheds in good
number of its Primary schools.
A few schools without kitchen-sheds may have only
one teacher and managing cooked meal on daily basis
may be difficult. It is hoped that all the single-teacher
schools will not only be provided additional teacher but
necessary infrastructure also to ensure smooth
implementation of mid-day meal scheme.
Miscellaneous Facilities in Schools
Apart from the facility indicators presented above,
a number of other provisions such as availability of
boundary wall, playground facility, electricity connection,
Page 74
Part II
74
Elementary Education in India : Analytical Report
book-bank, medical check-up have also been brieflyanalysed in addition to shift and residential schools and
pre-primary facility.
Boundary Wall
About half of total 1.20 million schools (49.26
percent) in the country had boundary walls in 2006-07.
There is a significant difference in the number of schools
with boundary walls located in rural areas (45.35 percent)
and in urban areas (75.47 percent). It means that 8 out
of 10 schools located in urban areas and 5 out of 10
schools in rural areas have boundary walls. A significant
percentage difference in schools with boundary walls is
also observed in schools under government
managements and under private
managements. The percentage in
case of private managed schools
is much higher at 72.85 than of
government managed schools at
43.73.
On the other hand, it is
observed that a good number of
Primary schools are yet to provide
boundary walls as their
percentages are low (42.05
percent). Quite a good number of
the integrated Higher Secondary
schools (77.65 percent) and Upper Primary integrated
with Secondary & Higher Secondary schools (70.63
percent) have boundary walls. The percentage of schools
with boundary walls in urban areas is much higher than
the same in the rural areas; it is true for all schools types.
More than 89 percent integrated Higher Secondary schools
located in urban areas have boundary walls against 70
percent schools in rural areas. On the other hand, 84.21
percent private managed Higher Secondary schools in
urban areas have boundary walls compared to 66.49
percent in case of government managed schools.
So far as Primary schools are concerned, the highest
percentage of schools having boundary walls is noticed
in the state of Delhi (98.96 percent) and the lowest in
Tripura (12.91 percent). Majority of Primary schools in
Chandigarh, Daman & Diu, Haryana and Punjab also
had boundary walls in 2006-07. However, the situation
is not as good in a number of other states. Andhra
Pradesh, Arunachal Pradesh, Assam, Bihar, Chhattisgarh,
Himachal Pradesh, Jammu & Kashmir and Jharkhand,
are a few states which are yet to provide boundary walls
to majority of Primary schools. The percentage of Primary
schools without boundary walls is also high in all the
states in the north-eastern region.
Playground in Schools
More than 52 percent schools (all categories) had
playgrounds in school. The percentage of such schools
in rural areas was 51 compared to 63 in urban areas.
Distribution of schools having playground in 2006-07
further reveals that 45.89 percent Primary schools had
playground in the school. The corresponding figures for
Upper Primary schools and
Elementary schools were 89.85
percent and 61.29 percent
respectively. Almost an equal
percentage of integrated Higher
Secondary schools (78.44 percent)
and Upper Primary attached to
Secondary & Higher Secondary
schools (79.51 percent) had
playground in the school. While 84
percent schools (all categories) in
Delhi and 90 percent schools in
Chandigarh had playground in
school, only 20 percent schools in Orissa, 37 percent
schools in Bihar, and 24 percent schools in Jharkhand
had this facility. Tamil Nadu has a high percentage (77
percent) of such schools among the rest of the states. It
is further observed that about 77 percent Primary schools
in Haryana and 74 percent in Tamil Nadu had
playgrounds as compared to only 15 percent in Orissa.
About 64 percent schools in Uttar Pradesh and 77 percent
schools in Delhi also had playground in 2006-07. In
north-eastern states, the percentage of such Primary
schools varies from 9.44 percent in Mizoram to 52.70
percent in Tripura.
Electricity Connection
The percentage of schools with electricity
connection has shown an increasing trend over a period
of time. Even then, only 33.23 percent schools (all types)
had electricity connection in 2006-07. Majority of such
schools, 71 percent, in urban areas had electricity
“Almost all the schools
that impart Elementaryeducation in Delhi and
about 85 percentin Kerala had the
electricity connection.The percentage ofsuch schools was
low at 3.60 percent
in Bihar”
Page 75
75
Part IISchool & Facility Indicators
connection compared to only 28 percent schools located
in rural areas. Chandigarh could provide electricity
connection to all of its schools. Almost all the schools
(99.60 percent) that impart Elementary education in
Delhi and about 85 percent in Kerala had the electricity
connection. Majority of this type of schools in Daman &
Diu, Goa, and Lakshadweep also had electricity
connection in school. The percentage of such schools
was low at 3.60 percent in Bihar, 5.44 percent in
Jharkhand and 6.53 percent in Assam. Only 15 states
had electricity connection in more than 50 percent of
their total number of schools.
Further, about 77 percent Primary schools in Kerala
had electricity connection in 2006-07. Chandigarh has
electricity connection in all of its Primary schools, while
89 percent such schools in Goa have electricity
connection. The percentage of such schools was also
high in Delhi (99.54 percent) and Puducherry (97.23
percent). The percentage of schools with electricity
connection in other types of schools in these states was
also comparatively higher. In Tamil Nadu, more than 59
percent Primary schools had electricity connection in
2006-07. The percentage of Primary schools having
electricity connection remained as low as 1.60 percent
The lowest percentage of schools having electricity
connection across school categories in 2006-07 was in
Primary schools (21.39 percent). On the other hand, 31
percent Upper Primary schools had electricity connection.
Among other types of schools, Upper Primary attached
to Higher Secondary schools (77 percent) and integrated
Higher Secondary schools (77 percent) have electricity
connection in much higher numbers than that in Primary
and Upper Primary schools. More than 86 percent private
integrated Higher Secondary schools had electricity
connection while only 62 percent such schools under
government managements had this facility. The
percentage of such schools in urban areas is about 93
compared to 67 in rural areas.
in Bihar, 10.22 percent in Jammu & Kashmir and 2.17
percent in Jharkhand. Maharashtra too has a high
percentage (55.86 percent) of such Primary schools.
States from the north-eastern region too had a low
percentage of such schools.
Book-Bank in Schools
Much difference is noticed in the availability of
Book-Bank in schools located in rural (47 percent) and
urban areas (57 percent); it is true for all school types.
About 75 percent Upper Primary schools attached to
Secondary and Higher Secondary schools in urban areas
have Book-Banks against 71 percent in rural areas. About
87 percent schools (all categories) in Haryana and 86
Page 76
Part II
76
Elementary Education in India : Analytical Report
percent in Maharashtra have Book-Banks in their
premises. In Delhi, the percentage of schools with Book-
Bank is higher at 96. Further, about 59 percent
Elementary schools had the provision of Book-Bank in
school in 2006-07. About 96 percent this category of
schools in Delhi, 88 percent in Maharashtra, 84 percent
in Haryana and 68 percent in Uttar Pradesh had such
facility. The percentage in all the north-eastern states is
much lower than in other states.
The lowest percentage of
schools with Book-Banks is
observed in case of Primary schools.
About 93 percent Primary schools
in Delhi and 89 percent in Haryana
had a Book-Bank in school in 2006-
07. The percentage of such schools
is also high in the state of
Maharashtra (84.45 percent).
Comparatively, the percentage of
Primary schools with Book-Bank in the states of
Arunachal Pradesh (9.87 percent), Assam (17.04
percent), Bihar (28.11 percent) and Jammu & Kashmir
(29.45 percent), was found to be much lower than in
other states. It is also low at 5.17 percent in Mizoram,
14.35 percent in Meghalaya, 7.06 percent in Tripura,
and 14.09 percent in Sikkim. Incidentally, all these states
are from the north-eastern region of the country.
Medical Check-up in Schools
Altogether, about 52 percent (all categories) schools
arranged medical check-up in 2005-06. More schools in
urban areas (57 percent) arranged medical check-up than
schools in rural areas (51 percent).
The percentage in case of private
managed schools that arranged
medical check-up was found slightly
higher (53) than the same in case
of government managed schools
(52 percent). About 49 percent
Primary schools arranged medical
check-up in 2005-06. The
percentage of such schools was
higher in case of Elementary schools (64 percent),
integrated Higher Secondary schools (62 percent), and
Upper Primary with Secondary & Higher Secondary
schools (56 percent). Only 44 percent Upper Primary
schools arranged medical check-up. States, such as Delhi
“Altogether, about
52 percent schoolsarranged medical
check-up in 2005-06.
More schools in urbanareas arranged
medical check-up than
schools in rural areas”
Page 77
77
Part IISchool & Facility Indicators
(89 percent), Gujarat (92 percent), Maharashtra (88
percent), Rajasthan (76 percent) and Tamil Nadu (90
percent) arranged medical check-up in majority of their
schools (all categories). About 55 percent schools in
Uttarakhand and about 58 percent schools in Andhra
Pradesh also arranged medical check-up.
On the other hand, majority of schools in
Arunachal Pradesh, Assam, Bihar, Jammu & Kashmir,
Jharkhand, Manipur, Meghalaya, Nagaland, and West
Bengal did not arrange medical check-up for their
children. About 90 percent Primary schools in
Chandigarh, Delhi, Maharashtra and Tamil Nadu carried
out medical check-up in schools as compared to 5.97
percent schools in Assam and 6.29 percent in Manipur.
In Kerala also, more than 72 percent Primary schools
provided for medical check-up arrangement in school.
More than 87 percent Primary schools in Chhattisgarh
and 76 percent schools in Rajasthan also arranged
medical check-up during the year.
Pre-Primary Sections
The percentage of Primary schools having attachedpre-primary sections increased from 20.02 in 2005-06
to 26.69 percent in 2006-07. It is observed that schools
located in urban areas have more such sections (28
percent) than those located in rural areas (27 percent).
It is also observed that a pre-primary section is also
attached to a large number of Elementary schools (26
percent) and integrated Higher Secondary schools (36
percent). A wide deviation is noticed in the percentages
of these types of schools located in rural and urban
areas. As compared to 44 percent integrated Higher
Secondary schools with attached pre-primary sections
in urban areas, the percentage of such schools in rural
areas in 2006-07 is only 31. This is also true in case of
independent Elementary schools (rural areas, 24
percent; and urban areas, 35 percent). The percentage
of Primary schools with attached pre-primary sections is
much higher in schools under private managements (36)
than in schools under government managements (25).
The states of Arunachal Pradesh (60.92 percent),
Assam (54.53 percent), Haryana (62.38 percent), Jammu
& Kashmir (81.20 percent), Karnataka (34.51 percent),
Madhya Pradesh (46.92 percent), Maharashtra (41.74
percent) and Uttar Pradesh (32.12 percent), have a large
number of pre-primary sections attached to Primary
schools. Incidentally, all these states, except Arunachal
Pradesh and Jammu & Kashmir, are DPEP states. In
Page 78
Part II
78
Elementary Education in India : Analytical Report
Chandigarh too, majority of Primary schools have
attached pre-primary sections (86.67 percent). The
capital city of Delhi has 36.84 percent
such Primary schools. Majority of
Primary schools in the north-eastern
region also have attached pre-
primary sections. The percentage of
such schools is as high as 85.39 in
Meghalaya, 95.34 in Nagaland and
96.48 in Sikkim.
Not only Primary schools have
attached pre-primary sections but a
good number of independent Elementary schools in a
number of states also have attached pre-primary sections.
The percentage of such schools, as in 2006-07, has been
(77 percent), Nagaland (91 percent) and Sikkim (99
percent) too have a good number of such schools.
Residential Schools
The percentage distribution
of schools which are residential in
nature has been low across the
school categories. There were only
1.78 percent schools in 2006-07
that were residential in nature. Not
much difference is noticed
between rural (1.70 percent) and urban areas (2.37
percent). The highest number of such schools was in
Madhya Pradesh (3,812 schools) and the lowest (2) in
as high as 25.93. More than 35 percent of the Elementary
schools located in the urban areas have attached pre-
primary sections compared to 24 percent such schools
in rural areas. The percentage of such schools is as high
as 89 in Chandigarh compared to 60.99 and 75 percent
respectively in the states of Himachal Pradesh, and 82
percent in Jammu & Kashmir. States from the north-
eastern states, namely Meghalaya (79 percent), Mizoram
the Andaman & Nicobar Islands. Andhra Pradesh (3,096
schools) and Maharashtra (3,128 schools) also had a
good number of residential schools. The national capital
of Delhi has 57 such schools compared to only 7 in the
Union Territory of Chandigarh.
Further, all types of schools imparting Elementary
education have a few residential schools though their
percentage varies from type to type. The percentage of
“More than 35 percent
of the Elementary schoolslocated in the urbanareas have attached
pre-primary sectionscompared to 24 percent
such schools in
rural areas”
Page 79
79
Part IISchool & Facility Indicators
Primary schools, which are residential in nature, is only
1.30, as compared to 1.41 of Upper Primary, 2.42 of
Elementary schools, 4.04 of Upper Primary attached to
Secondary & Higher Secondary schools, and 6.29
integrated Higher Secondary schools. As already
indicated, the percentage of residential schools in urban
areas is a bit higher than the same in rural areas (except
in case of integrated Higher Secondary schools and Upper
Primary attached to Secondary and
Higher Secondary schools). As
against 1.75 percent Primary
residential schools in urban areas,
the percentage of such schools in
rural areas is only 1.25. The highest
percentage of residential schools is
observed in case of integrated
Higher Secondary schools in rural
areas (7.70), compared to only 4.13
in the urban areas.
The highest percentage of Primary schools which
are residential in nature, is noticed to be in Sikkim (5.45),
followed by Arunachal Pradesh (5.18), Meghalaya (3.77),
Tripura (3.55 percent), Madhya Pradesh (3.13) and
Chhattisgarh (2.58). Only 0.31 percent Primary schools
in Uttar Pradesh and 0.63 percent in Kerala are residential
in nature. Tamil Nadu has 1.35 percent residential
schools.
Part-Time Shift Schools
The percentage distribution of
schools operating as shift schools
has shown an increasing trend. The
analysis reveals that 3.68 percent of
the total schools (all categories) use
a school building as a shift school.
In urban areas, the percentage of
such schools is much higher (12.74
percent) than the same in the rural
areas (2.37). About 2.89 percent
government schools used school
buildings as shift schools compared to 7.14 percent
private managed schools. The percentage in case of
Primary schools in 2006-07 is as low as 2.29 (rural 1.66
and urban 8.56). In absolute terms, the number of such
“About 2.89 percent
Government Schools used
school buildings as shift
schools compared
to 7.14 percent
private managed
schools”
Page 80
Part II
80
Elementary Education in India : Analytical Report
Primary schools in 2006-07 was 17,845. Chandigarh
(10.00 percent), Daman & Diu (60.00 percent), Delhi
(43.05 percent), Goa (6.17 percent), Madhya Pradesh
(8.86 percent) and Maharashtra (7.66 percent) had a
good number of Primary schools in 2006-07 that used
school building as a shift school. In rest of the states, the
percentage of such Primary schools is very low.
It is further revealed that there are a number of
other types of schools that are also using school buildings
Table B25
Schools that Received and Utilized School Development Grant : 2006-07*
School Category
Grant Received Grant Utilized
All Areas Rural Areas Urban Areas All Areas Rural Areas Urban Areas
Primary Only 76.63 78.94 53.68 87.63 87.77 85.80
Primary with Upper Primary 68.82 76.03 39.29 84.05 83.88 85.18
Primary with Upper Primary 26.72 34.74 14.40 91.75 90.36 94.68
& Secondary/ Hr. Secondary
Upper Primary Only 62.79 64.87 44.91 89.65 89.84 88.30
Upper Primary & Secondary/ 52.26 56.22 40.01 90.45 91.29 86.89
Hr. Secondary
All Schools (2005-06) 71.27 75.28 44.60 87.83 87.96 86.73
All Schools (2004-05) 66.19 69.69 43.69 88.73 88.78 88.32
All Schools (2003-04) 69.83 73.84 46.00 88.77 88.73 89.13
All Schools (2002-03) 59.82 63.26 39.22 88.41 88.51 87.06
All Schools (2001-02) 42.28 45.62 21.20 90.21 90.17 90.48
Number of Schools Covered 8,52,920 7,85,160 67,672 – – –
in 2005-06
Number of Schools Covered 6,88,634 6,31,914 56,399 – – –
in 2004-05
Number of Schools Covered 7,24,682 6,65,872 57,287 – – –
in 2003-04
Number of Schools Covered 5,57,217 5,13,390 42,398 – – –
in 2002-03
Number of Schools Covered 3,60,892 3,38,787 19,079 – – –
in 2001-02
* In the previous academic year.
as shift schools. Compared to the Primary schools (2.29
percent), the percentage of other types of schools using
school building as a shift school is comparatively high.
About 5.68 percent Elementary schools used school
building as a shift school, and 12.26 percent integrated
Higher Secondary schools, 4.73 percent Upper Primary
schools, and 8.24 percent Upper Primary attached to
Secondary & Higher Secondary schools used school
building as shift school. In Delhi, Chandigarh,
Maharashtra, Madhya Pradesh, and Gujarat, in most of
Page 81
81
Part IISchool & Facility Indicators
the school types the percentage of schools using building
as a shift school is comparatively high. This is also true
for Tripura, a state in the north-eastern region.
School Development Grant
One of the important components of SSA is to
provide school development and TLM grants to all
government and aided schools. To examine the extent
of schools that have received and utilized these grants,
number of schools covered as well as percentage to
total schools is presented at the all-India level.
Provisions have been
made, under the SSA, to provide
a lumpsum grant of Rs 2000/-
per annum (now increased to Rs
5000/-) for school development
to al l schools that impart
elementary education. Similarly,
a provision of Rs 500/- per
teacher per annum has also been
made as TLM grant. A large number of schools
received both of these grants during 2005-06. The
utilization pattern suggests that the states have
utilized around 90 percent of the funds allotted, both
under the school development and TLM grants.
A marked increase in the number of schools that
received school development grant may be noticed
during the period from 2001-02 to 2005-06.
Compared to 3,60,892 schools that received
development grant in 2001-02, the corresponding
figure in 2005-06 was as high as 8,52,920 schools (Table
B24). Of the total schools that received school
development grant, more than 92 percent are located
in rural areas. Indeed the percentage
of such schools has been much higher
in rural areas (75.28 percent) than
that in urban areas (44.60 percent).
The state-specific percentage of
schools (all categories) that received
school development grant reveals
that barring a few states, such as
Kerala, Orissa and Tripura, more than
90 percent schools received
development grant. About 83
percent schools in Bihar also received school
development grant in 2005-06.
“Compared to 3,60,892schools that received
development grantin 2001-02, thecorresponding
figure in 2005-06was as high as
8,52,920 schools”
Page 82
Part II
82
Elementary Education in India : Analytical Report
Besides Primary schools, all other school types have
also received development grant during the previous year
but percentage of such schools varied from one type of
school to another. About 68.82 percent of the total
independent Elementary schools received development
grant compared to 26.72 percent integrated Higher
Secondary, 62.79 percent independent Upper Primary and
52.26 percent Upper Primary attached to Secondary and
Higher Secondary schools. Further, it is observed that about
77 percent of the total Primary schools received
development grant in 2005-06, and that the percentage
of Primary schools that received school development grant
has been much higher in rural areas (78.94 percent) than
in urban areas (53.68 percent). In a number of states, the
percentage of such schools was found to be well above
the all-India average (76.63 percent). In Bihar, Goa,
Himachal Pradesh, Kerala, Maharashtra, Orissa, Rajasthan
and Tripura, the percentage of Primary schools that received
development grant was above 85 percent.
Teaching-Learning Material (TLM) Grant
Like school development grant, the number of
schools that received TLM grant over a period of time
from 2002-03 to 2005-06 also increased significantly.
However, the number of schools that received TLM grant
has been a bit lower than the number of schools that
received development grant (Table B25). The number
of schools that received TLM grant was 8,12,349, that
Table B26
Schools that Received and Utilized TLM Grant : 2006-07*
School CategoryGrant Received Grant Utilized
All Areas Rural Areas Urban Areas All Areas Rural Areas Urban Areas
Primary Only 73.00 75.06 52.60 87.91 87.79 88.86
Primary with Upper Primary 66.48 73.58 37.40 87.81 86.98 91.86
Primary with Upper Primary 25.37 33.20 13.35 90.03 93.12 83.76
& Secondary/ Hr. Secondary
Upper Primary Only 58.05 59.74 43.49 90.66 90.46 92.14
Upper Primary & Secondary/ 49.51 53.34 37.66 91.80 92.27 91.08
Hr. Secondary
All Schools (2005-06) 67.88 71.61 43.14 88.63 88.36 90.15
All Schools (2004-05) 61.26 64.45 40.89 87.30 87.18 87.95
All Schools (2003-04) 61.81 65.11 42.50 93.00 92.94 93.39
All Schools (2002-03) 48.79 51.33 33.97 91.10 90.99 91.63
All Schools (2001-02) 33.70 36.50 16.44 92.56 92.34 94.55
Number of Schools Covered 8,12,349 7,46,805 65,459 – – –
in 2005-06
Number of Schools Covered 6,88,634 6,31,914 56,399 – – –
in 2004-05
Number of Schools Covered 6,41,519 5,87,184 52,927 – – –
in 2003-04
Number of Schools Covered 5,54,511 4,16,562 36,720 – –
in 2002-03
Number of Schools Covered 2,87,683 2,71,074 14,797 – – –
in 2001-02
* In the previous academic year.
Page 83
83
Part IISchool & Facility Indicators
is, 67.88 percent of all types of schools that impart
Elementary education in the country. Further, the
percentage of schools that received TLM grant in 2005-
06 has been much lower in urban areas (43.14 percent)
than in rural areas (71.61 percent). About 95 percent
schools in Orissa received TLM grant which is also the
highest amongst all the states, the lowest being 21.89
percent in Arunachal Pradesh. The percentage of such
schools is also high at 86 percent in Kerala and Tripura
and 84.49 percent in Himachal Pradesh.
Page 84
Part II
84
Elementary Education in India : Analytical Report
About 5,69,044 Primary schools, that is, 73.00
percent of the total schools, received TLM grant in 2005-
06. Against 75.06 percent Primary schools in rural areas,
the corresponding percentage of schools receiving TLM
grant in urban areas has been only 52.60. About 66.48
percent Elementary schools also received TLM grant. Not
only Primary and Upper Primary schools received the
school development and TLM grants, but a few
Secondary and Higher Secondary schools also received
the grant during the year 2005-06. Further, it is observed
that the percentage of schools that
received TLM grant has been lower
than the schools that received
school development grant. The
utilization pattern suggests that,
barring a few states, 88 percent or
more of the grant received under
school development and TLM
respectively was utilized. It is expected that both the
allocation and utilization under school development and
TLM grants are expected to further improve in the
remaining years of SSA.
Concluding ObservationsSchool-related indicators presented above clearly
show that the number of schools imparting Elementary
education has increased significantly over a period of
time. More Primary and Upper Primary schooling facilities
are available now. However, it does not necessarily mean
that every school has minimum essential facilities. This
is reflected in a variety of facility indicators presented
above. Though majority of schools have buildings and
adequate number of instructional rooms, yet despite all
these achievements, there are still a few schools without
adequate number of instructional rooms and teachers.
In addition, there are a good number of single-classroom
and single-teacher schools. Even though student-
classroom ratio is improved, in
many schools, still more than 60
pupils sit in one classroom and a few
others do not have regular Head
Master. Majority of schools are
located beyond one km. All these
schools were not visited by the CRC
Coordinator, and many of these
were even not inspected. Despite significant
improvements in schools (drinking water, toilets etc.),
still a good number of schools are to be provided with
minimum essential physical, ancillary and teaching-
learning facilities. It is hoped that provisions made
available under SSA will be optimally utilized in the years
that follow and all schools imparting Elementary
education across the country will be provided both
developmental as well as TLM grants.
“It is hoped that
provisions made available
under SSA will be
optimally utilized in
the years that follow”
Page 85
DISE Publications : A Few Comments
� Many thanks for your publication, Elementary Education in India: Progress towards UEE, Analytical Report,I greatly value the same, Dr. Sudarshan Iyengar, Vice-Chancellor, Gujarat Vidyapeeth, Ahmedabad
� It is really a big task that has been completed by NUEPA. It requires lot of patience and courage, now allschools are really at one click away, Prof. Sanjay Ganorkar, National Institute of Technical Teachers Trainingand Research, Bhopal
� Since we are working on several government programmes including education, DISE reports would bevery useful in process of our research and analysis, Dr. Jawad A Khan, Research Associate, Centre forBudget and Governance Accountability, New Delhi
� Thanks for sending me this invaluable volume, Prof. Anil Sadgopal, Sahkar Nagar, Bhopal
� DISE publications would help me immensely in my research work on education and gender,Ms. Meenu Anand, Women’s Studies & Development Centre, University of Delhi, Delhi
� The addition of Analytical Report has enriched the collection of our library, Librarian, G.B. Pant Universityof Agriculture & Technology, Nainital
� There is no doubt that the publication is very useful, informative and thought provoking. This provide awealth of data for understanding the state of elementary education in different districts of India, Dr. J.CGoyal, formerly with NCERT, New Delhi
� Your publications are surely useful and informative, always gives me a great encouragement to my furtherstudies, Ms. Hisako Akai, Fukuoka, Japan
� I am sure the document will be of great help to all those who are committed to universal elementaryeducation. Mr. Prakash Karat, General Secretary, Communist Party of India (Marxist),New Delhi
� Congratulations for launching over one million school report cards - this is wonderful achievement, Dr.Michael Ward, Senior Education Adviser, DFID India, British High Commission,New Delhi
� This is really amazing to see the remote village schools information on your website. The site will be veryuseful in understanding the status of the Indian schools, Mr. R. Venkat Reddy, [email protected]
� Thanks for felicitations for your monumental publication, Elementary Education in India: Progress towardsUEE, Analytical Report, Prof. Saiyid Hamid, former Vice-Chancellor, Aligarh Muslim University, Chancellor,Jamia Hamdard and Secretary, Hamdard Education Society, New Delhi
� The efforts put in by NUEPA, in compiling the publication is truly commendable, Ms. Mahrukh Singh, TheMother’s International School, Sri Aurobindo Ashram, New Delhi
� I find Analytical Report on elementary education very interesting and informative, Dr. TrilokN. Dhar, Yojana Vihar, New Delhi
� The data provided by DISE would be of immense help to the people who are working in the field ofprimary education. It would have been of great help to government to properly plan for the school leveleducation for Muslims, Mr. Kamal Faruqui, Chariman, Delhi Minorities Commission, Vikas Bhawan, NewDelhi
� The data so painstakingly collected and collated is bound to be found most valuable, Mr. SubashC. Kashyap, C. P. R Library, New Delhi
Page 86
� It was great to learn about the progress made regarding DISE, Dr. Deepa Sankar, Education Economist,The World Bank, New Delhi
� I will read it with interest, Prof. V.L. Chopra, Member, Planning Commission, Yojana Bhawan, New Delhi
� We hope to benefit from the publication, Dr. Montek Singh Ahluwalia, Deputy Chairman, PlanningCommission, New Delhi
� The publication contains a wealth of meaningful information, Prof. M. P. Kapoor, Project Director, NIITInstitute of Information Technology, New Delhi
� Congratulations on the excellent production of the two volumes of the District Report Cards,Prof. Amitabh Kundu, Centre for Studies in Regional Development, Jawaharlal Nehru University, NewDelhi
� The publication would definitely help the researchers and others in many significant ways,Prof. Asim Kumar Nath, Netaji Subhas Open University, Kolkata
� I have sent the copy for display in our library, Prof. Bipan Chandra, Chariman, National Book Trust, India,New Delhi
� I have been looking at the dpepmis.org site and am highly impressed by the content and context ofsystem in place, Mr. Harold Monu, Harmon-IT Limited, Stevenage
� The publication is very informative, Dr. Shyama Chona, Principal, Delhi Public School, R.K. Puram, NewDelhi
� The Analytical Report is quite informative and provides a wealth of opportunity to researchers & policymakers to access vital information pertaining to various facets of elementary education,Ms. S.V. Lakshmi, St Stephen's College, New Delhi
� The Analytical Report and State Report Cards brought out by NUEPA contains vital information related toelementary education, Prof. Ahrar Husain, [email protected]
� The publication has been very interesting and useful to us in our work, activities and library collection,Mr. Vijay Rawat, Priya, New Delhi
� Of course, the publication is very useful and interesting, Prof. N.C. Shah, Director, Sardar Patel Instituteof Economic & Social Research, Ahmedabad
� The publications and websites are very useful and will help our students to access information,Dr. Varsha Hooja, Director, Technical Operations, National Resource Centre for Inclusion, Mumbai
� I am sure that the researchers would find it immensely useful for their teaching and research,Mr. K.T. Dilli, Librarian, Loyola College, Chennai
� Thank you for sending me very useful publications, Shri J. Veeraraghavan, Director, Bhartiya Vidya Bhavan,New Delhi
� We are happy to express our sincere thanks to NUEPA for sending us the publication, Ms. VirgilD. Sami, Executive Director, Arunodhaya, Centre for Street and Working Children, Chennai
� We hope that the contents would be very useful to WHO staff members, Ms. Anchalee Chamchuklin,Information Management and Dissemination, World Health Organization, Regional Office for South-East Asia, New Delhi
� The School Report Cards e-database is a powerful tool to use for any large scale intervention in themetro cities, Dr. Sangeeta Dey, Michael & Susan Dell Foundation, New Delhi
Page 87
� These are very useful reference documents giving district-wise data on enrolment, number of teachersand facilities in schools, Prof. A B L Srivastava, Chief Consultant, Ed. CIL, New Delhi
� I would like to congratulate NUEPA for bringing out a publication that provides in-depth documentation and data on current trends and issues of elementary education in India,Prof. Aku-Ied, Director, The Aga Khan University, Karachi, Pakistan
� It is an invaluable sourcebook for understanding and strengthening the elementary education system inIndia, Prof. Debiprasad Mishra, Institute of Rural Management Anand, Gujarat
� I have circulated the publication among my colleagues, Prof. S. Neelamegham, President, NIILM, Centrefor Management Studies, New Delhi
� I have placed the publication in our library for wider consultation by our scholars, Prof. C.H. HanumanthaRao, Chairman, Centre for Economic and Social Studies, Hyderabad
� I am sure my colleagues and I will find it useful, Mr. K.C. Sivaramakrishnan, Centre for Policy Research,New Delhi
� As the publication is quite informative, I hope the teacher participants will be really benefited,Dr. H.S. Bhatia, Director, UGC-Academic Staff College, Guru Nanak Dev University, Amritsar
� I would like to congratulate NUEPA for the tireless effort made in bringing out the publication, I believethis will be an asset for the country in the field of education, Dr. Vipralhou Kesiezie, Director, SCERT,Kohima
� Really the publications are quite useful and informative, Mr. Aswini Kumar Pati, Director & CEO, IndiraGandhi Integral Education Centre, Orissa
� It is a valuable resource, which is added to our library, Mr. Anil Pradhan, Member-Secretary, Sikshasandhan,Orissa
� I would like to congratulate NUEPA for bring out the excellent report on Elementary Education in India:Analytical Report, Ms. Malathi Somaiah, Researcher, Indian Institute of Management, Bangalore
� We will surely share the report with all concerned, Ms. Meenakshi Batra, National Director, ChristianChildren's Fund, Banglaore
� NUEPA’s success in operationalising the nationally acclaimed DISE has been one such landmark,revolutionizing the role of education planners, who can now address local developmental needs from aninformed perspective, armed with statistical and situational data, Mr. Samphe Lhalungpa, Chief, EducationSection, UNICEF India Country Office, New Delhi
� The teachers of the Academic Staff College found the Analytical Report extremely useful, Dr. RakeshBatabyal, Director, Academic Staff College, Jawaharlal Nehru University, New Delhi
� It is, indeed, very informative compilation, which can be useful in various academic pursuits,Prof. R.K. Kale, Dean of Students, Jawaharlal Nehru University, New Delhi
� These reports will be of great help to us as reference material in our daily research work, Prof. M.M.Gandotra, Director, Centre for Operations Research and Training, Vododara
� It would be used with immense profit by hundreds of course participants who are university & collegelecturers drawn from all parts of the country, Prof. A.R. Kidwai, UGC Academic Staff College, AligarhMuslim University, Aligarh
� To understand strengths of the Indian elementary education, this type of comprehensive reports has agreat importance, Dr. D. Barkataki, Director, State Resource Centre Assam, National Literacy MissionAuthority, Guwahati
Page 88
� These are going to be extremely useful as a reference material, Mr. P.C. Mohanan, Deputy DirectorGeneral, Government of India, National Statistical Commission, New Delhi
� The publication contained good lot of materials useful to researchers pertaining to various aspects ofelementary education, Dr. K.S. Bhat, Regional Director, Council for Social Development, Hyderabad
� A great piece of work, congratulation for putting everything in black and white, Dr. Maheswar Lal, Ashafor Education, Philadelphia
� The publication indeed be of great help to us, Ms. Ranjana Shah, Research, Monitoring and Evaluation,State Resource Centre, Uttarakhand, Dehradun
� The document adds great value to understanding the education scene in India, Ms. Shabnam Sinha,CEO, Education & Technology Services Limited, Mumbai
� I congratulate NUEPA in bringing out such a comprehensive volume, for which massive efforts havebeen made, Dr. Jacob Aikara, Rajagiri College of Social Sciences, Kochi
� The document will be highly useful for teaching community and education loving people of our state,Prof. Abani Boral, Vice-President, World Federation of Teachers' Union, National Co-Ordination Committeeof Indian Teachers' Organisations, Bhubaneswar
� The publications (Elementary Education in Rural and Urban India) would be very useful addition to ourlibrary, Mr. Mohammad Hamid Ansari, Chairperson, National Commission for Minorities, Government ofIndia, New Delhi
� The publications containing valuable recent data on the state of elementary education in Indiawill no doubt be found most useful by myself and my students at JNU, Prof. D.N. Rao, Centrefor Economic Studies & Planning, School of Sciences, Jawaharlal Nehru University,New Delhi
� The publications have been displayed in our library for wider reading, Dr. N. Jayaram, Director, Institutefor Social and Economic Change, Bangalore
� The publication will benefit our scholars immensely as it contains useful data pertaining to all the states,Mrs. Bharati Baveja, [email protected]
� Both the volumes are very useful for education fraternity at large, Dr. Kamlesh P. Joshipura, Vice-Chancellor,Saurashtra University, Rajkot
� The DISE publications on Rural and Urban India are highly useful for our students & researchers, Prof. B.Hanumaiah, Vice-Chancellor, Babasaheb Bhimrao Ambedkar University, Lucknow
� These documents will provide wealth of opportunity to the researchers and policy makers to access vitalinformation pertaining to various facets of elementary education, Mr. Subhash Deshmukh, Librarian,Guru Gobind Singh Indraprastha University, Delhi
� The publications are very useful and informative and will benefit large section of our professional staff inthe University, Dr. R.P. Bajpai, Vice-Chancellor, Guru Jambheshwar University of Science & Technology,Hisar
� I hope the publications will go a long way in providing a wealth of opportunity to researchers & policymakers to access vital information pertaining to various facets of elementary education,Dr. S.N. Pathan, Vice-Chancellor, Rashtrasant Tukadoji Maharaj Nagpur University, Nagpur
� The data provided in the Analytical Tables are of immense utility, Prof. P.M. Kulkarni, Centre for the Studyof Regional Development, Jawaharlal Nehru University, New Delhi
Page 89
� The DISE Flash Statistics is becoming smarter with more and more information. I congratulate DISE teamfor their total dedication in compiling the data, Mr. S.S. Rajagopalan, The Hindu, Chennai
� I congratulate NUEPA in brining out Flash Statistics which is an important publication relating to elementaryeducation in India, Dr. S.Kumar, General Secretary, Forum of Senior Citizens in Education, Panchkula
� The publication is very useful and will be of immense help to research workers, Mr. S. Abdul Gulam, JointDirector (Retired), Evaluation and Applied Research Department, Madras
� DISE Flash Statistics would indeed be of great help to us, Ms. Ranjana Shah, State Resource Centre,Uttarkhand, Dehradun
� I have gone through the publication and found it useful and informative, Dr. R.S. Sharma, Ex- FacultyMember, NUEPA, Panchkula
� The statistics presented in the document is very useful for researchers and planners in planning forquality elementary education, Registrar, Sri Sathya Sai University, Anantapur District
� DISE Flash Statistics, guides us our future course of action towards achieving UEE, Mr. BijayaK. Rath, District Project Office, Sarva Shiksha Abhiyan, Cuttact
� DISE Flash Statistics has a stamp of excellence, Dr. S.L. Mehta, Vice-Chancellor, Maharana Pratap Universityof Agriculture and Technology, Udaipur
� I thank you for your kind gesture, the publication has been displayed in our library, Dr. D. Janaki, Vice-Chancellor, Mother Teresa Women's University, Kodaikanal
� The publication would prove to be very useful for basic planning in the education sector, Prof. Jai RupSingh, Vice-Chancellor, Guru Nanak Dev University, Amristar
� The publication would definitely enrich knowledge of researchers as well as teachers of our university inmany significant ways, Prof. Surabhi Banerjee, Vice-Chancellor, Netaji Subhas Open University, Kolkata
� This is a welcome step and I appreciate the efforts undertaken by NUEPA, Dr. LokeshK. Shekhawat, Vice-Chancellor, Jai Narain Vyas University, Jodhpur
� We are extremely thankful to you for sending such a valuable publication, Librarian, Tilak MaharashtraUniversity Library, Pune
� The state-specific data on key indicators including the Education Development Index is very informative.I am indebted to you for helping me to assimilate information of such a great magnitude, Dr. Indu Khetarpal,Principal, Salwan Public School, Gurgaon
� The publication is quite informative, Dr. C. R. Hazra, Vice-Chancellor, Indira Gandhi Agricultural University,Raipur
� The publication would be of immense help to our Centre, Prof. Eugene. D. Thomas, Director, StateResource Centre, North-Eastern Hill University, Shillong
� I am happy to acknowledge the receipt of DISE Flash Statistics on Elementary Education in India. I sincerelywish to put on record not only my appreciation for the statistical analysis and presentation of data butalso the way the raw data has been converted into a readily usable knowledge base,Dr. M.K. Ramachandran Nair, Vice-Chancellor, University of Kerala, Thiruvananthapuram
� We have kept the publication in the Central Library of the institute, which will be useful for our readers,Dr. Yogendra Singh, Ex-Scientist, Indian Institute of Technology, Roorkee
� The publication represents the result of enormous efforts put in by NUEPA; it will certainly be helpful instrengthening EMIS in India, Prof. V.C. Kulandai Swamy, Former Vice-Chancellor, Indira Gandhi NationalOpen University, Chennai
Page 90
� It is very informative, Prof. Anwar Alam, Vice-Chancellor, Sher-e-Kashmir, University of AgriculturalSciences & Technology of Kashmir, Srinagar
� The document very well describes the status of education all over the country and is quite impressive,Prof. N.K. Bansal, Vice-Chancellor, Shri Mata Vaishno Devi University, Jammu & Kashmir, Katra
� I found the Analytical Report very useful for comparative analysis at the state level, Prof. R.K. Menaria,SFS, Jaipur
� The document will be highly useful for teaching community and education loving people of our state,Prof. Abani Boral, Vice-president, World Federation of Teachers’ Union, National Co-ordination Committeeof Indian Teachers' Organizations, Bhubaneswar
� DISE publications annually produce a vast wealth of educational statistics and I am so happy that NUEPAhas kept up the standards in generating periodic information so useful for all of us,Dr. Preet Rustagi, Senior Fellow, Institute for Human Development, New Delhi
� I am sure that our board is going to benefit very much from the DISE Publications, Dr. W. IbempishakDevi, Chairperson, Board of Secondary Education, Manipur
� I shall be grateful if you include our library in your mailing list for further publications, Mr. S. SivChidambaram, National Institute of Public Finance and Policy, New Delhi
� We shall be pleased to review the Analytical Report in Indian Journal of Regional Science,Prof. C.R. Pathak, Managing Editor, Regional Science Association, Calcutta
� I must confess that after the monumental work of J.P.Naik on the history of Indian education your workrelated to elementary education in India is the most comprehensive data-base published so far. It will bean invaluable for all researchers and policy makers on education in the coming decades, Prof. GautamSen, Director General, Indian Institute of Education, Pune
� I appreciate the efforts put in brining out the publication, Dr. P. Kumar, Director, National TuberculosisInstitute, Bangalore
� The value of key indicators relating to elementary education in India will facilitate identification of importantareas of intervention. The huge database contained in these volumes will facilitate research work in thearea of school education, Prof. Mamata Ray, President, West Bengal Board of Secondary Education,Kolkata
� The DISE Flash Statistics is much appreciated and would be an useful addition to our Library,Dr. Nirmala Jeyaraj, Principal & Secretary, Lady Doak College, Maduari
� The DISE publications are extremely useful for research purpose, Mr. S.K. Varma, V. V. Giri NationalLabour Institute, Noida
� We find the DISE publications very useful, Dr. Atony Jose, Management Development Institute, Gurgaon
� It would be an immense help to future researchers in the field of education, Dr. Abdul Waheed, Director,Centre for Promotion of Educational and Cultural Advancement of Muslims of India, Aligarh MuslimUniversity, Aligarh
� I appreciate the efforts made by NUEPA in bringing out the publication, Prof. Arun S. Sutaria, DirectorGeneral, Mahatma Gandhi Labour Institute, Ahmedabad
� We found the publication of great significance providing vital information on key-indicators including theEducational Development Index, Ms. Renuka Palit, Chairman, Jan Shikshan Sansthan, Institute of People’sEducation, Gaya
Page 91
� The publication prove to be very useful to us in both research and teaching, Prof. Vishwanath Pandit,Head, Department of Economics, Sri Sathya Sai University, Anantapur District
� I am sure that the staff and researchers would find it immensely useful for their teaching and research,Mr. K.T. Dilli, Librarian Loyola College, Chennai
� The document is kept in our library for the reference, Secretary, Maharashtra State Board of Secondary& Higher Secondary Education, Shivajinagar, Pune
� The publication is very useful and will help our researchers, Prof. Indranee Dutta, Director, Omeo KumarDas Institute of Social Change & Development, Guwahati
� I find the publication well prepared, quite useful and informative, Dr. B.N. Yugandhar, Member, PlanningCommission of India, Yojana Bhawan, Parliament Street, New Delhi
� The publication will be of great help in our work with children, Ms. Virgil D’Sami, Executive Director,Arunodhaya, Centre for Street and Working Children, Chennai,
� The DISE Flash Statistics is very useful for our readers, Dr. Ghan Shyam Singh, Professor & In-charge,Chandra Shekhar Azad University of Agricultural & Technology, Kanpur
� The publication would be very useful for research scholars working on different aspects of elementaryeducation in India, Mr. P.G. Dhar Chakrabarti, IAS, Executive Director, National Institute of DisasterManagement, Ministry of Home Affairs, New Delhi
� I write to appreciate the efforts NUEPA has been making for the last several years in strengthening EMISin the country. The amount of data being disseminated regularly through DISE publications, enormousand rich in contents, attests to the significant achievement of NUEPA, Dr. RamanP. Singh, Deputy Advisor (Education), Planning Commission, Yojana Bhawan, New Delhi
� We would like to meet you to explore collaboration between UNESCO Institute for Statistics and NUEPA,Mr. Minja Yang, Director and UNESCO Representative, UNESCO, New Delhi
� District Report Cards on elementary education is a superb compilation providing critical information onkey aspects of elementary education in the country. It is a work of very high quality brought out withsuper perfection by the committed faculty, which deserves all the credit and compliments,Dr. Kailash Nautiyal, formally with NCERT, New Delhi
� I am completing a project on primary education, the publications from NUEPA are extremely useful, Prof.Gandhi Babu Veluri, Visaklhaptnam
� The publication contains all the data, which is useful for research studies, Dr. Padma Yadav, NationalCouncil of Educational Research and Training, New Delhi
� I am sure it is a valuable study and contribution which will help the cause of education in the country,Prof. Ranbir Singh, Vice-Chancellor, Nalsar University of Law, Hyderabad
� Congratulations on all your good work with DISE data. It is really a fantastic achievement to get increasinglyreliable data on 1.20 million elementary schools in India. I think a lot can be done in terms of district levelanalysis of the data. Dr. Geeta Kingdon, Department of Economics, University of Oxford, Oxford
� We are delighted to see that the new District Report Cards using DISE data are already online as theyhave wealth of interesting information, Dr. Vandana Sipahimalani Rao, Human Development Economist,Manila, Philippines
� Thanks for sending me two volumes of your valuable publication, Elementary Education in India: DistrictReport Cards, Prof. Ashish Bose, Leading Demographer and Former Professor, Institute of EconomicGrowth, Delhi
Page 92
� The publication will not only useful for my colleagues and me, but also for our students of B.EL.Ed, Dr.Sudipta Ghose, Department of Education, Delhi University, New Delhi
� It is, indeed, a treasure trove of the data relating to elementary education in India and can go a long way,if it is analyzed critically so as to hasten the process of UEE in the country, Dr. S. Kumar, Former Director,The Bharat Scouts and Guides, Panchkula
� It is huge collection of data, which is very useful for researchers. NUEPA must be congratulated fortaking up such a massive venture, Prof. Ruddar Datt, New Delhi
� Just received the two volumes of elementary education in India. Should I say I am privileged? I have justleafed through the pages and have had a sensation. What a tremendous job done! Really grateful forthe prompt dispatch, Dr. Soumen Hom, [email protected]
� I have greatly benefited from the rich database these reports are providing for academicians and researchscholars, we often use this data for various purposes while preparing our research reports and papers.Needless to mention how thankful I am for receiving these on a regular basis, Dr. M.D Usha Devi, Head,Institute for Social and Economic Change, Bangalore
� Kudos, this is an excellent information and thankless efforts done by NUEPA which provides usefulbaseline information for those who are involved in programme evaluation, Mr. P. S. [email protected]
� I find the publication very informative and useful, Mr. A. B. Bardhan, General Secretary, Communist Partyof India, New Delhi
� The publication provides comprehensive analysis about the status of elementary education in India, Ms.Sushma Berlia, President, PHD Chamber of Commerce and Industry, New Delhi
� District Report Cards will be of immense help in the activities in school education at CII, Ms. Alka Chaudhary,Director, Confederation of Indian Industry, New Delhi
� These publications would definitely enrich the knowledge of research workers as well as teachers of ourUniversity in many significant ways, Prof. Surabhi Benerjee, Vice-Chancellor, Netaji Subhas Open University,Kolkata
� We find this report useful addition for our library. Mrs. P.S. Sharma, Central Library, IIT Bombay, Powai,Mumbai
� I am astonished to see your hard work, Prof. V.G. Jadhao, Principal, Regional Institute of Education. Ajmer
� These volumes have wealth of information for understanding the situation of elementary education inIndia, Prof. Ila Patel, Professor, Institute of Rural Management, Gujarat
� Please accept our heartiest congratulation for presenting such colossal information in the form of VolumeI & II of Elementary Education in India: Where Do We Stand?, Col. B.S. Sharma, Chairman, Institute ofBusiness Administration, New Delhi
� The information would help us in many ways, Mr. Sunil Gautam, Indian Institute of Dalit Studies, NewDelhi
� I would thank NUEPA for the valuable inputs provided though the School Report Cards, Mr. G. JayaKumar, Capacity Building Specialist, American Red Cross, New Delhi
� Heartiest congratulations for bringing out http://schoolreportcards.in, this is amazing achievement in ashort time span, Mr. Madne Laxman Dhondiba, [email protected]
Page 93
� I have gone through your documents on the web, they are immensely useful for my research. I want tocongratulate you and also convey my thanks for providing such vast information, Prof. Amulya Chagapuram,ICFAI University, Hyderabad
� Many thanks for your publications, Elementary Education in India: State Report Cards, I greatly value thesame, Dr. Sudarshan Iyengar, Vice-Chancellor, Gujarat Vidyapeeth, Ahmedabad
� We have displayed this publication in our department library, which will be of great help to our studentsand scholars, Ms, Mini Dejo Kappen, Karunya University, Coimbatore
� I am really amazed with the data available on the internet on Indian schools even on remotely locatedareas, Mr. Kiran Kumar Avadhanula, Urban Sector Manger, Cinicinnati, USA.
� This publication has been added to the holdings of the library for consultation of research scholars, Mr.Naveen Mahajan, Nehru memorial Museum & Library, New Delhi
� It is an invaluable sourcebook for understanding and strengthening elementary education in India, Dr.Debiprasad Mishra, Professor, Institute of Rural Management Anand, Gujarat
� As the publication is quite informative and useful, I hope teacher participants will be really benefited, Mr.H.S. Bhatia, Director, UGC-Academic Staff College, Guru Nanak Dev University, Amritsar
� Really the publication is quite useful and informative, thank you once again for your collaboration byproviding information to us by sending us publication, Dr. Aswini Kumar Pati, Director & CEO, IndiraGandhi Integral Education Centre, Orissa
� It is a valuable resources which we will add to our library, Mr. Anil Pradhan, Member-Secretary,Sikshasandhan, Orissa
� We will surely share the report with all concerned, Ms. Meenakshi Batra, National Director, ChristianChildren’s Fund, Banglaore
� To understand the strengthen of the Indian elementary education system; this type of comprehensivereports have a great importance, Dr. D. Barkataki, Director, State Resource Centre Assam, NationalLiteracy Mission Authority, Guwahati
� The publication contained good lot of material useful to researchers pertaining to various aspects ofelementary education, it is very useful to us in our work, Dr. K.S. Bhat, Regional Director, Council forSocial Development, Hyderabad
� Analytical Report is marvelous piece of work and clearly demonstrates the kind of efforts this must havetaken, Mr. Suneet Sethi
� Really appreciate the gesture on your part and the expanse of the data converted, Mr. Subhrajit Singh, Sr.Managar, Development Support
� The http://schoolreportcards.in is nice move. It helps if you are an academician, it helps if you are apolicy maker, and it helps even if you are a common citizen. The data will help the process of empowermentand strengthen the democracy, Dr. Ram Manohar Vikas, Indian Institute of Technology, Kanpur
� I am sure it would be of great help, Dr. Sharada Jain, Director, Sandhan (Society for Education &Development), Jaipur
� It is indeed a very detailed document and holds valuable information, Mr. Kashinath Bhoosnurmath,Programme Director, Save the Children India Office, New Delhi
� This is what we have been waiting for, Ms. Varsha Hooja, Director, Technical Operations, NationalResource Centre for Inclusion Spastics Society of India, Mumbai
Page 94
� It is good, it will useful to our national portal, Mr. N. Srinivasa Rao, Indian Development Gatway, Centrefor Development of Advanced Computing (C-DAC), Hyderabad
� These publications would be very useful to both students and teachers, Dr. Savithri Singh, Principal,Acharya Narendra Deve College, Delhi University, Delhi
� Rest assured that our education team in India will make full use of this publication, and will encourageothers to do so well, Mr. Sam Carlson, Lead Education Specialist for India, The World Bank, New Delhi
� We highly appreciate NUEPA in bringing out such publications, Dr. Barnali Biswas, Senior Analyst, IndicusAnalytics Pvt. Ltd; Delhi
� The information contained in this publication is indeed very valuable for understanding the status ofschool education in India. It is the publication of this nature that will enhance the reputation of NUEPA,Prof. M. Anandakrishnan, Chairman, Madras Institute of Development Studies, Chennai
� We appreciate the efforts made by NUEPA, in strengthening EMIS in India, Prof. Sailabala Debi, Director,Centre for Multi-disciplinary Development Research, Dharwad
� The report is a rich source of data and useful for our research students, Prof. Geetha B. Nambissan,Chariman, Zakir Hussain Centre for Educational Studies, Jawaharlal Nehru University, New Delhi
� I was impressed the way the DISE has been implemented across the country and the pioneering workbeing done by NUEPA, Mr. K.S. Viswanathan, Chief Executive-India Operations, Wipro Infotech, Bangalore
� We express our deep and sincere appreciation for the extensive data collection that has been done;collated and presented, Mr. Vyjayanthi Sankar, Vice-President, Large Scale Assessments, EducationalInitiatives Private Limited, Hyderabad.