General rights Copyright and moral rights for the publications made accessible in the public portal are retained by the authors and/or other copyright owners and it is a condition of accessing publications that users recognise and abide by the legal requirements associated with these rights. Users may download and print one copy of any publication from the public portal for the purpose of private study or research. You may not further distribute the material or use it for any profit-making activity or commercial gain You may freely distribute the URL identifying the publication in the public portal If you believe that this document breaches copyright please contact us providing details, and we will remove access to the work immediately and investigate your claim. Downloaded from orbit.dtu.dk on: Feb 03, 2022 Stress concentration and optimal design of pinned connections Pedersen, Niels Leergaard Published in: The Journal of Strain Analysis for Engineering Design Link to article, DOI: 10.1177/0309324719842766 Publication date: 2019 Document Version Peer reviewed version Link back to DTU Orbit Citation (APA): Pedersen, N. L. (2019). Stress concentration and optimal design of pinned connections. The Journal of Strain Analysis for Engineering Design, 54(2), 95-104. https://doi.org/10.1177/0309324719842766
Transcript
General rights Copyright and moral rights for the publications made accessible in the public portal are retained by the authors and/or other copyright owners and it is a condition of accessing publications that users recognise and abide by the legal requirements associated with these rights.
Users may download and print one copy of any publication from the public portal for the purpose of private study or research.
You may not further distribute the material or use it for any profit-making activity or commercial gain
You may freely distribute the URL identifying the publication in the public portal If you believe that this document breaches copyright please contact us providing details, and we will remove access to the work immediately and investigate your claim.
Downloaded from orbit.dtu.dk on: Feb 03, 2022
Stress concentration and optimal design of pinned connections
Pedersen, Niels Leergaard
Published in:The Journal of Strain Analysis for Engineering Design
Link to article, DOI:10.1177/0309324719842766
Publication date:2019
Document VersionPeer reviewed version
Link back to DTU Orbit
Citation (APA):Pedersen, N. L. (2019). Stress concentration and optimal design of pinned connections. The Journal of StrainAnalysis for Engineering Design, 54(2), 95-104. https://doi.org/10.1177/0309324719842766
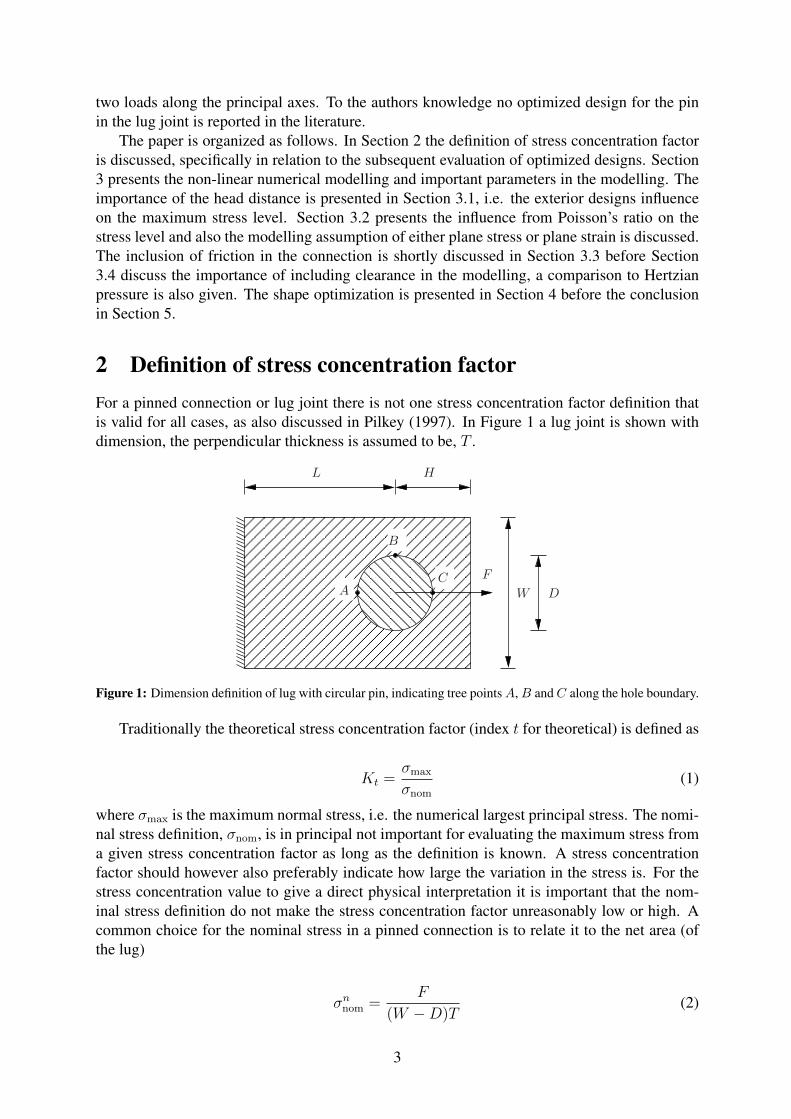
Figure 1: Dimension definition of lug with circular pin, indicating tree pointsA,B andC along the hole boundary.
Traditionally the theoretical stress concentration factor (index t for theoretical) is defined as
Kt =σmax
σnom(1)
where σmax is the maximum normal stress, i.e. the numerical largest principal stress. The nomi-
nal stress definition, σnom, is in principal not important for evaluating the maximum stress from
a given stress concentration factor as long as the definition is known. A stress concentration
factor should however also preferably indicate how large the variation in the stress is. For the
stress concentration value to give a direct physical interpretation it is important that the nom-
inal stress definition do not make the stress concentration factor unreasonably low or high. A
common choice for the nominal stress in a pinned connection is to relate it to the net area (of
the lug)
σnnom =
F
(W −D)T(2)
3
i.e. relating the stress concentration to the lug strength with a pin hole. For small values of
W/D the stress concentration will be low, although the variation in the stress level is high. For
this reason one could also choose to use the bearing area instead
σbnom =
F
D · T(3)
i.e. relating the stress concentration indirectly to the pin strength. For large values of W/D the
stress concentration will be low, although the maximum stress is not. Both relating the stress to
the net area or to the pin area fails in giving a stress concentration measure that is reasonable
for the whole variation range of W/D. Relating instead the stress concentration to the strength
of the lug without a hole (for the pin) the nominal stress can be defined as
σlnom =
F
W · T(4)
The latter choice is made in the present paper, as also done in Theocaris (1956). The reason
being that this gives a direct measure for what the increase in stress is relative to a connection
(with width, W , and thickness ,T ) without a pin. This stress concentration factor is also best
suited for evaluating optimized designs, i.e. what is the optimal ratio of W/D. It is clear that
there is a direct relation between the three nominal stress definitions and the stress concentra-
tions
σlnom =
11
σnnom
+1
σbnom
(5)
Leading to
K lt = Kn
t +Kbt (6)
where K lt = σmax/σ
lnom, Kn
t = σmax/σnnom and Kb
t = σmax/σbnom.
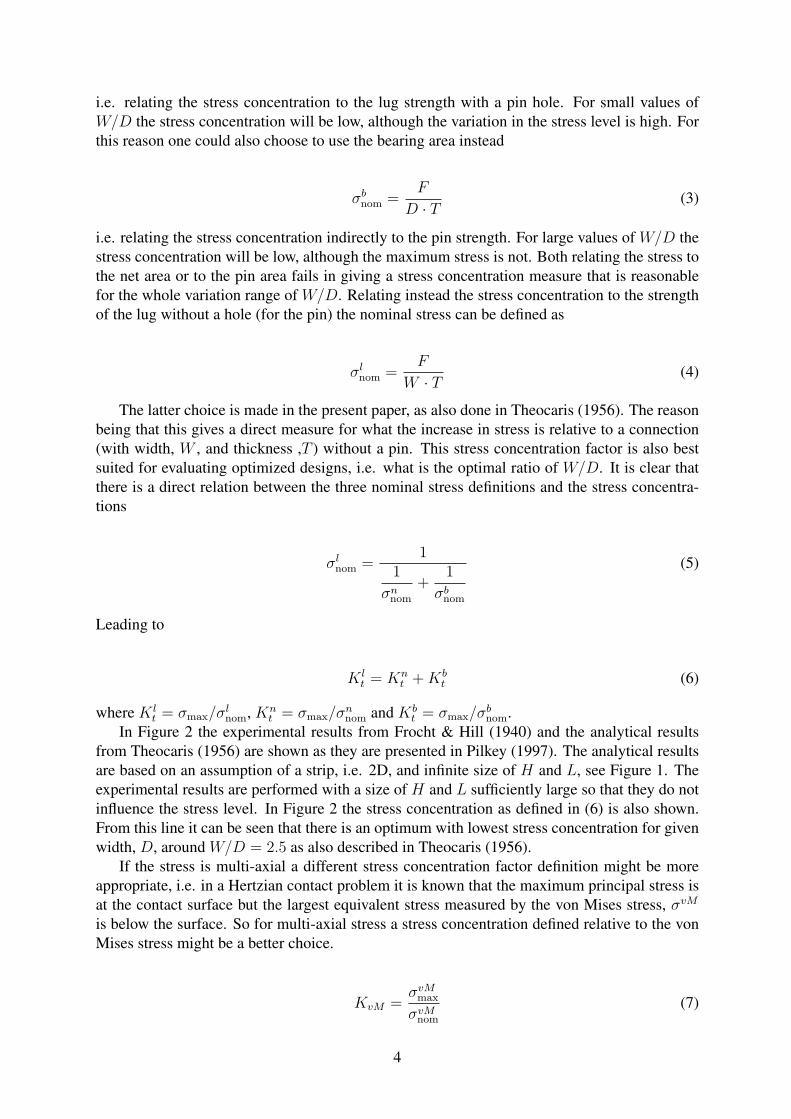
In Figure 2 the experimental results from Frocht & Hill (1940) and the analytical results
from Theocaris (1956) are shown as they are presented in Pilkey (1997). The analytical results
are based on an assumption of a strip, i.e. 2D, and infinite size of H and L, see Figure 1. The
experimental results are performed with a size of H and L sufficiently large so that they do not
influence the stress level. In Figure 2 the stress concentration as defined in (6) is also shown.
From this line it can be seen that there is an optimum with lowest stress concentration for given
width, D, around W/D = 2.5 as also described in Theocaris (1956).
If the stress is multi-axial a different stress concentration factor definition might be more
appropriate, i.e. in a Hertzian contact problem it is known that the maximum principal stress is
at the contact surface but the largest equivalent stress measured by the von Mises stress, σvM
is below the surface. So for multi-axial stress a stress concentration defined relative to the von
Mises stress might be a better choice.
KvM =σvMmax
σvMnom
(7)
4
1 3 5 7
1
3
5
7
9Kt
W/D
Klt
Knt
Kbt
Figure 2: The experimental stress concentration for lug with circular pin from Frocht & Hill (1940) and the
analytical results from Theocaris (1956) as they are shown in Pilkey (1997) (Knt
and Kbt) together with the curve
for Klt
derived from the two other curves and Eq. (6).
For the specific cases used in the present paper we will choose to use a stress concentration
defined as
K lvM =
σvMmax
σlnom
(8)
i.e. the nominal stress is given relative to the lug area as if there were no pin and in this case
this will also correspond to the von Mises stress since it is the only stress component.
3 Numerical modelling and important parameters
The stress evaluation in pinned connections is in the present paper performed numerically using
the finite element method (FEM). The numerical tool used is the COMSOL program COMSOL
AB (1986 -). Due to symmetry only half the lug/pin connection is modelled. A high number
of elements in the contact are used in order for the stress to converge, which have been checked
by mesh refinements. The elements used are triangles with a linear or quadratic displacement
assumption. The modelling is done by an assumption of plane stress or strain as discussed later.
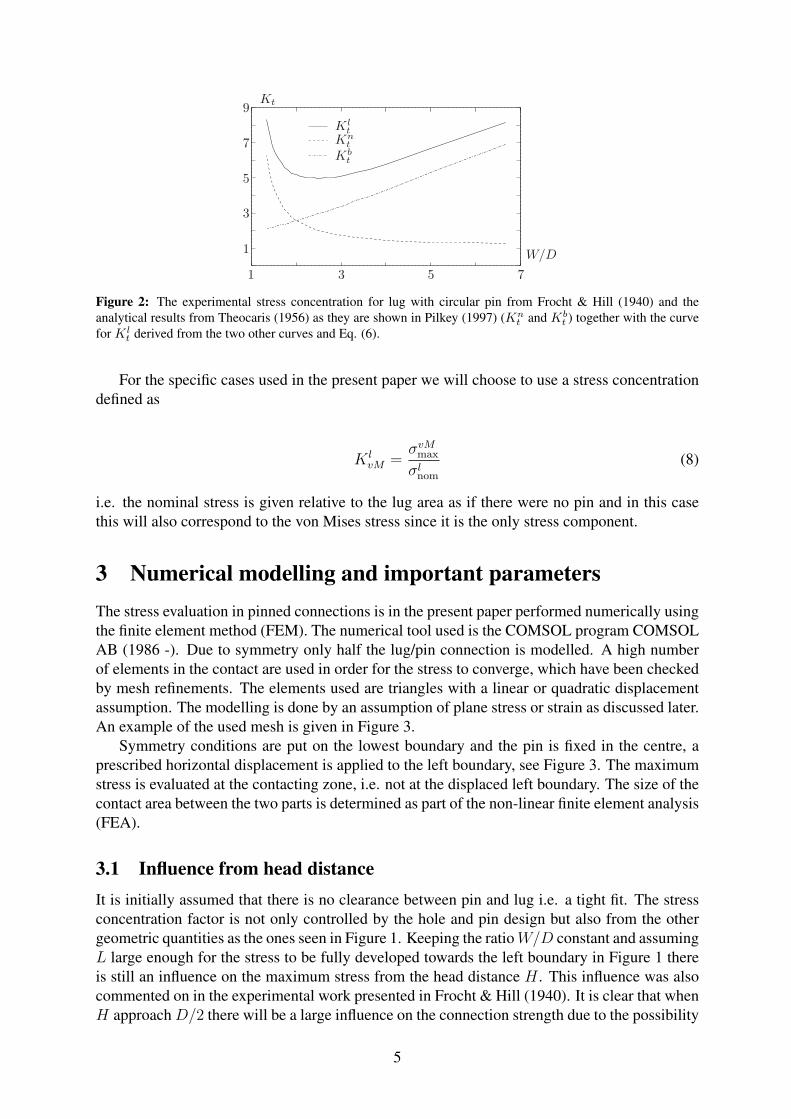
An example of the used mesh is given in Figure 3.
Symmetry conditions are put on the lowest boundary and the pin is fixed in the centre, a
prescribed horizontal displacement is applied to the left boundary, see Figure 3. The maximum
stress is evaluated at the contacting zone, i.e. not at the displaced left boundary. The size of the
contact area between the two parts is determined as part of the non-linear finite element analysis
(FEA).
3.1 Influence from head distance
It is initially assumed that there is no clearance between pin and lug i.e. a tight fit. The stress
concentration factor is not only controlled by the hole and pin design but also from the other
geometric quantities as the ones seen in Figure 1. Keeping the ratioW/D constant and assuming
L large enough for the stress to be fully developed towards the left boundary in Figure 1 there
is still an influence on the maximum stress from the head distance H . This influence was also
commented on in the experimental work presented in Frocht & Hill (1940). It is clear that when
H approachD/2 there will be a large influence on the connection strength due to the possibility
5
a)
b) c)
Figure 3: Mesh used for analysis. a) Full mesh, the left boundary is seen to have a fine mesh in order to evaluate
the force. The boundary on the bottom is the symmetry line. b) Zoom of pin, the small cut at the centre of the pin
is where the constraint is applied. The contact zone is shown to have a fine mesh. c) Zoom of part of contact zone
close to point B in Figure 1.
of pulling out the pin. For large values of H where a fully developed stress field is found in the
head (in front of pin) there is no influence on the stress concentration by a further increase in
H , however the influence from reducing the size of H to the somewhat intuitive choice
H =W
2(9)
is large.
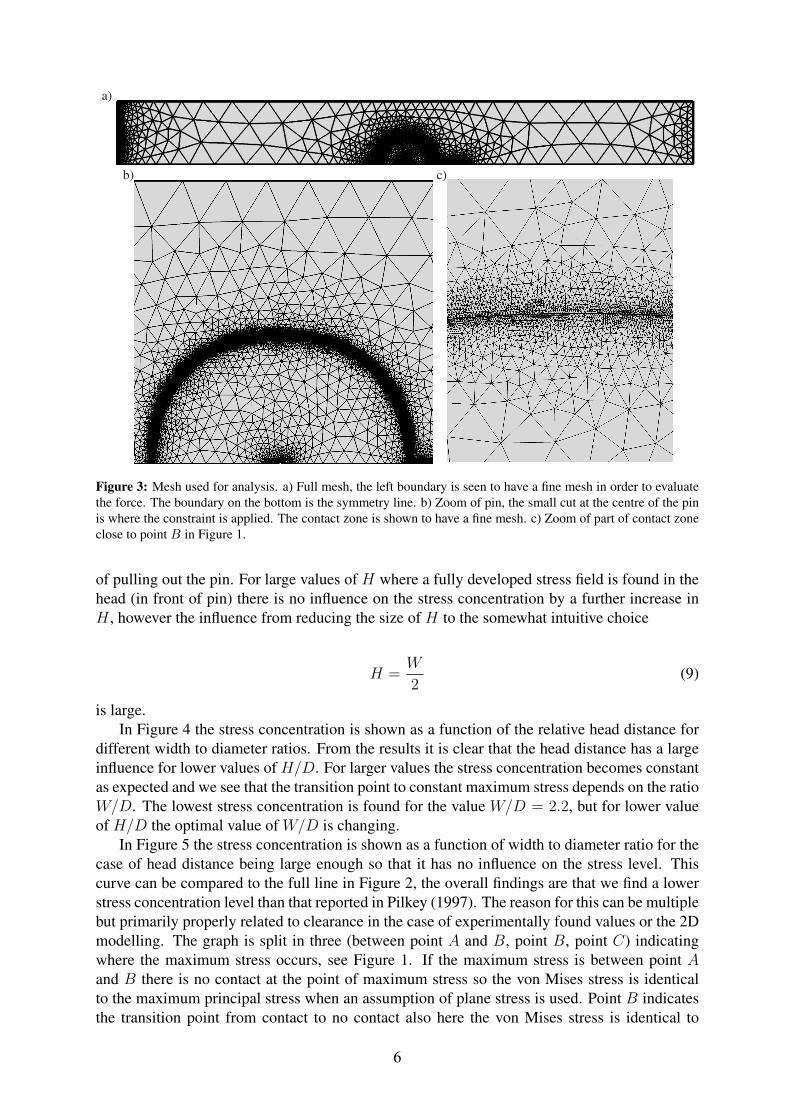
In Figure 4 the stress concentration is shown as a function of the relative head distance for
different width to diameter ratios. From the results it is clear that the head distance has a large
influence for lower values of H/D. For larger values the stress concentration becomes constant
as expected and we see that the transition point to constant maximum stress depends on the ratio
W/D. The lowest stress concentration is found for the value W/D = 2.2, but for lower value
of H/D the optimal value of W/D is changing.
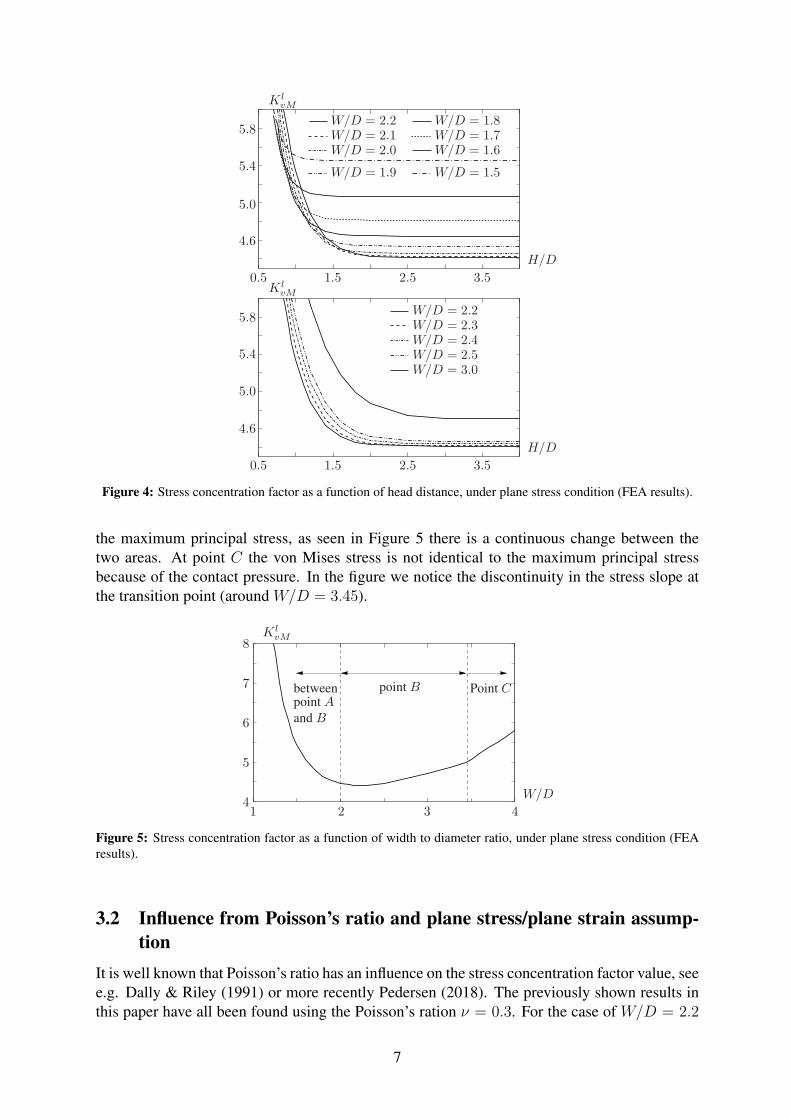
In Figure 5 the stress concentration is shown as a function of width to diameter ratio for the
case of head distance being large enough so that it has no influence on the stress level. This
curve can be compared to the full line in Figure 2, the overall findings are that we find a lower
stress concentration level than that reported in Pilkey (1997). The reason for this can be multiple
but primarily properly related to clearance in the case of experimentally found values or the 2D
modelling. The graph is split in three (between point A and B, point B, point C) indicating
where the maximum stress occurs, see Figure 1. If the maximum stress is between point Aand B there is no contact at the point of maximum stress so the von Mises stress is identical
to the maximum principal stress when an assumption of plane stress is used. Point B indicates
the transition point from contact to no contact also here the von Mises stress is identical to
6
0.5 1.5 2.5 3.5
4.6
5.0
5.4
5.8
Kl
vM
H/D
W/D = 2.2W/D = 2.1W/D = 2.0
W/D = 1.9
W/D = 1.8W/D = 1.7W/D = 1.6
W/D = 1.5
0.5 1.5 2.5 3.5
4.6
5.0
5.4
5.8
Kl
vM
H/D
W/D = 2.2W/D = 2.3W/D = 2.4W/D = 2.5W/D = 3.0
Figure 4: Stress concentration factor as a function of head distance, under plane stress condition (FEA results).
the maximum principal stress, as seen in Figure 5 there is a continuous change between the
two areas. At point C the von Mises stress is not identical to the maximum principal stress
because of the contact pressure. In the figure we notice the discontinuity in the stress slope at
the transition point (around W/D = 3.45).
1 2 3 44
5
6
7
8Kl
vM
W/D
betweenpoint Aand B
point B Point C
Figure 5: Stress concentration factor as a function of width to diameter ratio, under plane stress condition (FEA
results).
3.2 Influence from Poisson’s ratio and plane stress/plane strain assump-
tion
It is well known that Poisson’s ratio has an influence on the stress concentration factor value, see
e.g. Dally & Riley (1991) or more recently Pedersen (2018). The previously shown results in
this paper have all been found using the Poisson’s ration ν = 0.3. For the case of W/D = 2.2
7
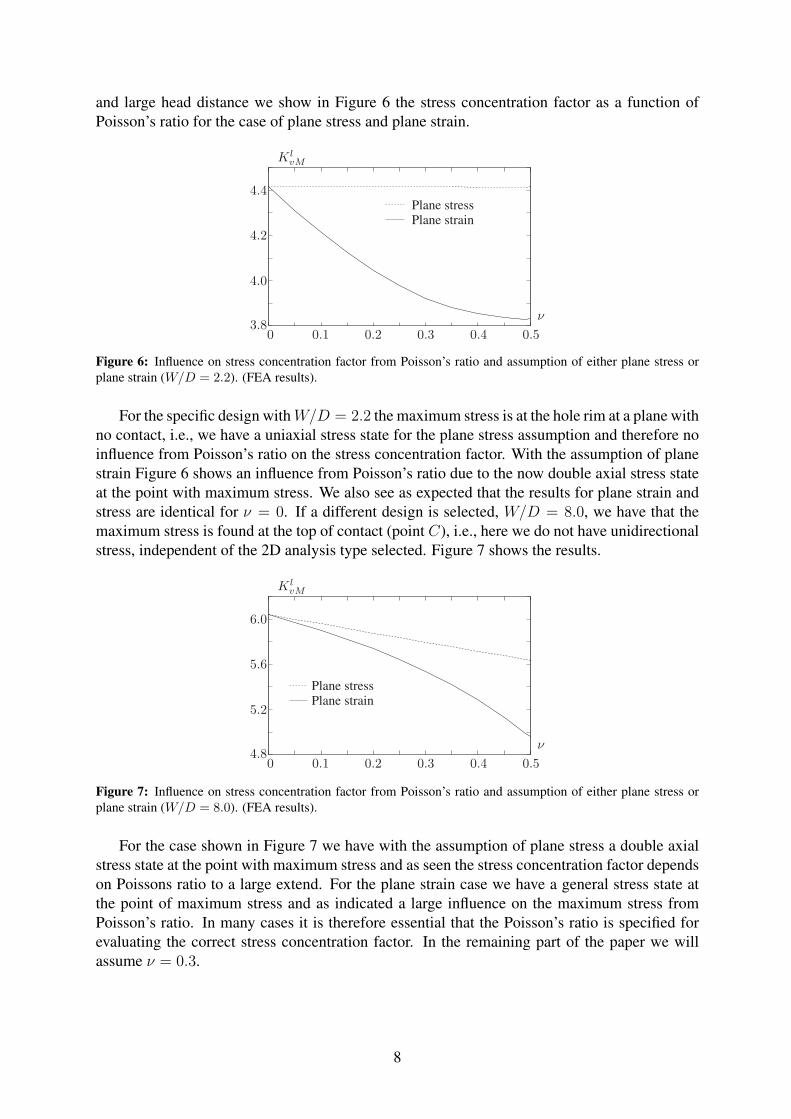
and large head distance we show in Figure 6 the stress concentration factor as a function of
Poisson’s ratio for the case of plane stress and plane strain.
0 0.1 0.2 0.3 0.4 0.53.8
4.0
4.2
4.4
Kl
vM
ν
Plane stressPlane strain
Figure 6: Influence on stress concentration factor from Poisson’s ratio and assumption of either plane stress or
plane strain (W/D = 2.2). (FEA results).
For the specific design withW/D = 2.2 the maximum stress is at the hole rim at a plane with
no contact, i.e., we have a uniaxial stress state for the plane stress assumption and therefore no
influence from Poisson’s ratio on the stress concentration factor. With the assumption of plane
strain Figure 6 shows an influence from Poisson’s ratio due to the now double axial stress state
at the point with maximum stress. We also see as expected that the results for plane strain and
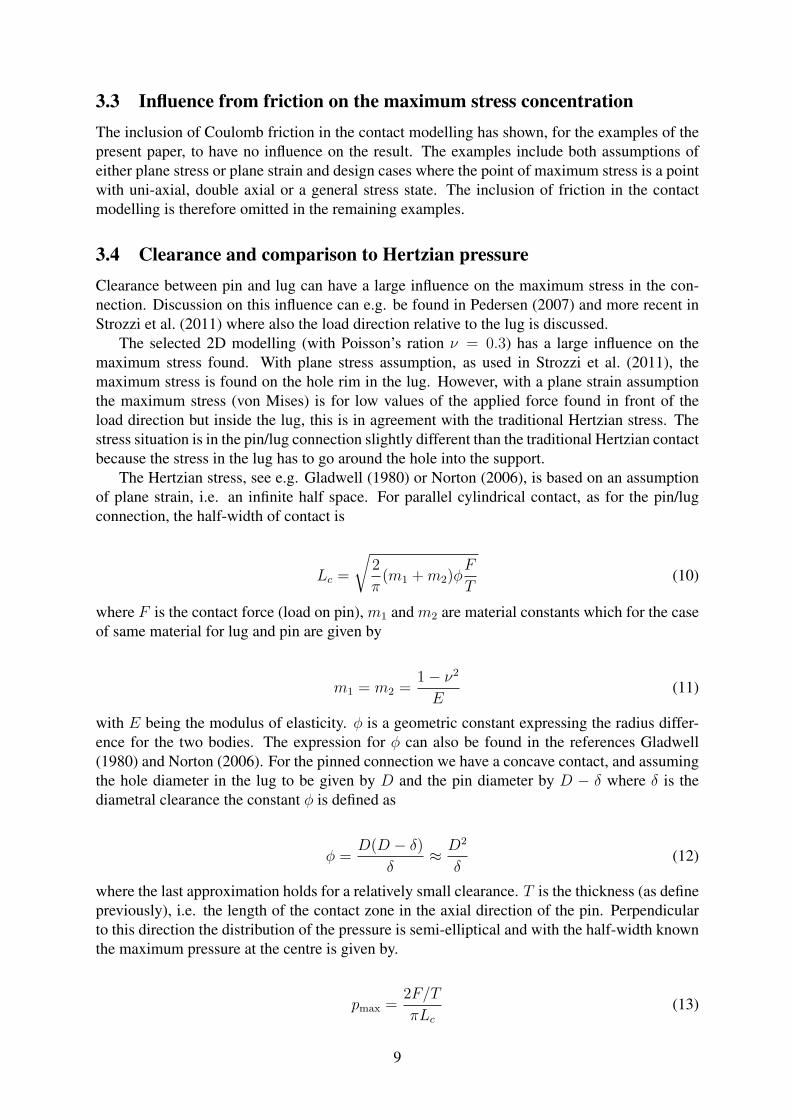
stress are identical for ν = 0. If a different design is selected, W/D = 8.0, we have that the
maximum stress is found at the top of contact (point C), i.e., here we do not have unidirectional
stress, independent of the 2D analysis type selected. Figure 7 shows the results.
0 0.1 0.2 0.3 0.4 0.54.8
5.2
5.6
6.0
Kl
vM
ν
Plane stressPlane strain
Figure 7: Influence on stress concentration factor from Poisson’s ratio and assumption of either plane stress or
plane strain (W/D = 8.0). (FEA results).
For the case shown in Figure 7 we have with the assumption of plane stress a double axial
stress state at the point with maximum stress and as seen the stress concentration factor depends
on Poissons ratio to a large extend. For the plane strain case we have a general stress state at
the point of maximum stress and as indicated a large influence on the maximum stress from
Poisson’s ratio. In many cases it is therefore essential that the Poisson’s ratio is specified for
evaluating the correct stress concentration factor. In the remaining part of the paper we will
assume ν = 0.3.
8
3.3 Influence from friction on the maximum stress concentration
The inclusion of Coulomb friction in the contact modelling has shown, for the examples of the
present paper, to have no influence on the result. The examples include both assumptions of
either plane stress or plane strain and design cases where the point of maximum stress is a point
with uni-axial, double axial or a general stress state. The inclusion of friction in the contact
modelling is therefore omitted in the remaining examples.
3.4 Clearance and comparison to Hertzian pressure
Clearance between pin and lug can have a large influence on the maximum stress in the con-
nection. Discussion on this influence can e.g. be found in Pedersen (2007) and more recent in
Strozzi et al. (2011) where also the load direction relative to the lug is discussed.
The selected 2D modelling (with Poisson’s ration ν = 0.3) has a large influence on the
maximum stress found. With plane stress assumption, as used in Strozzi et al. (2011), the
maximum stress is found on the hole rim in the lug. However, with a plane strain assumption
the maximum stress (von Mises) is for low values of the applied force found in front of the
load direction but inside the lug, this is in agreement with the traditional Hertzian stress. The
stress situation is in the pin/lug connection slightly different than the traditional Hertzian contact
because the stress in the lug has to go around the hole into the support.
The Hertzian stress, see e.g. Gladwell (1980) or Norton (2006), is based on an assumption
of plane strain, i.e. an infinite half space. For parallel cylindrical contact, as for the pin/lug
connection, the half-width of contact is
Lc =
√
2
π(m1 +m2)φ
F
T(10)
where F is the contact force (load on pin), m1 and m2 are material constants which for the case
of same material for lug and pin are given by
m1 = m2 =1− ν2
E(11)
with E being the modulus of elasticity. φ is a geometric constant expressing the radius differ-
ence for the two bodies. The expression for φ can also be found in the references Gladwell
(1980) and Norton (2006). For the pinned connection we have a concave contact, and assuming
the hole diameter in the lug to be given by D and the pin diameter by D − δ where δ is the
diametral clearance the constant φ is defined as
φ =D(D − δ)
δ≈D2
δ(12)
where the last approximation holds for a relatively small clearance. T is the thickness (as define
previously), i.e. the length of the contact zone in the axial direction of the pin. Perpendicular
to this direction the distribution of the pressure is semi-elliptical and with the half-width known
the maximum pressure at the centre is given by.
pmax =2F/T
πLc
(13)
9
The point of maximum stress depends on the value of Poisson’s ration. With ν = 0.3 the max-
imum von Mises stress is found approximately 0.704Lc below the point of maximum pressure
and is given by (the principal stresses are given in the appendix).
σvMmax ≈ 0.558pmax (14)
Two primary geometric factors control the stress concentration factor size, firstly the shape
locally at the point of maximum stress and secondly the amount of load that is transferred to
the point of maximum stress. The second factor is controlled by geometric quantities not at the
point of maximum stress. In Strozzi et al. (2011) and references therein, the stress concentration
factors for lug/pin connections are given as a function of a defined load factor. In the present
paper we use the inverse ratio of the load factor and the diametral clearance instead of the radial
clearance. The corresponding load factor is here defined as
ψ =Eδ
F/T(15)
The use of this load factor is under the assumption that the load level at the point of maxi-
mum stress is given, i.e. the external dimensions of the lug/pin connection is given, and secondly
that the nominal shape at the contact is similar. These two points are in agreement with the two
primary geometric factors described before. If we define the stress concentration from Hertzian
stress we get
σvMmax ≈ 0.558
1√
π(1− ν2)D(D − δ)
√
Eδ · F/T (16)
(17)
and with the definition (6) we have
K lvM,Hertz ≈
0.558√
π(1− ν2)
W
D
√
Eδ
F/T(18)
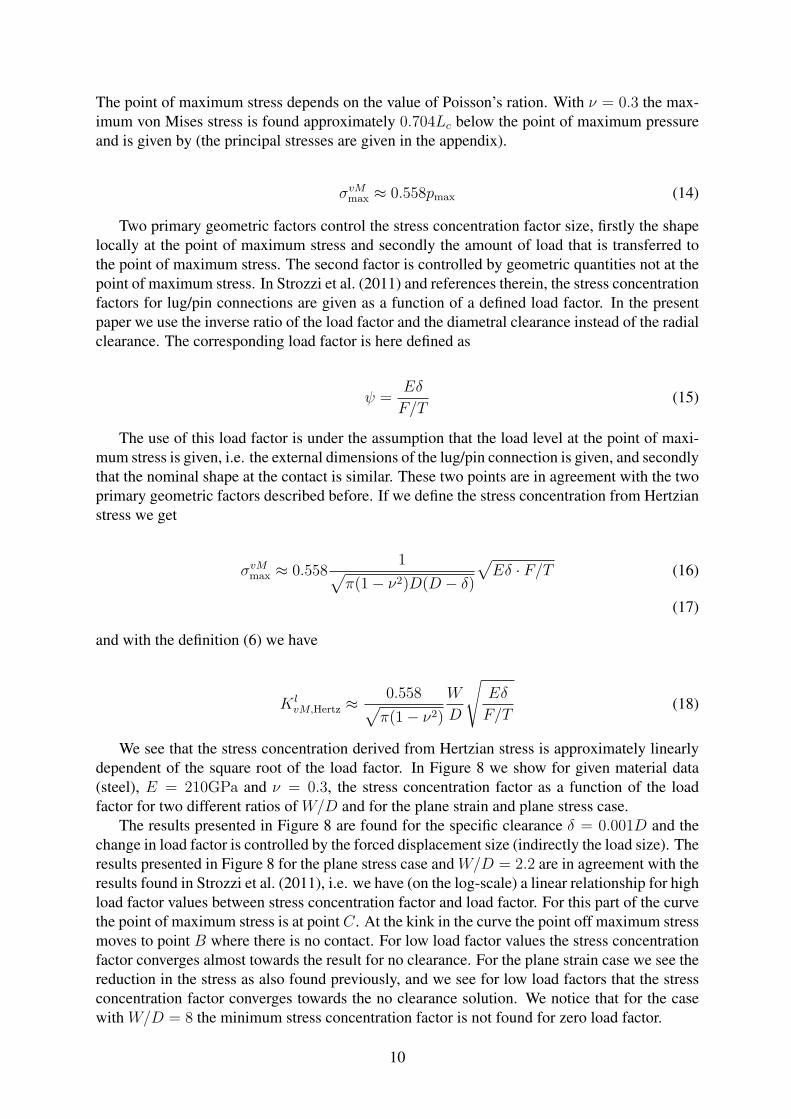
We see that the stress concentration derived from Hertzian stress is approximately linearly
dependent of the square root of the load factor. In Figure 8 we show for given material data
(steel), E = 210GPa and ν = 0.3, the stress concentration factor as a function of the load
factor for two different ratios of W/D and for the plane strain and plane stress case.
The results presented in Figure 8 are found for the specific clearance δ = 0.001D and the
change in load factor is controlled by the forced displacement size (indirectly the load size). The
results presented in Figure 8 for the plane stress case and W/D = 2.2 are in agreement with the
results found in Strozzi et al. (2011), i.e. we have (on the log-scale) a linear relationship for high
load factor values between stress concentration factor and load factor. For this part of the curve
the point of maximum stress is at point C. At the kink in the curve the point off maximum stress
moves to point B where there is no contact. For low load factor values the stress concentration
factor converges almost towards the result for no clearance. For the plane strain case we see the
reduction in the stress as also found previously, and we see for low load factors that the stress
concentration factor converges towards the no clearance solution. We notice that for the case
with W/D = 8 the minimum stress concentration factor is not found for zero load factor.
10
0.1 1 10 100 1000
5
10
50
Kl
vM
ψ
Plane stress W/D = 8 (FEA)
Plane strain W/D = 8 (FEA)
Eq. (18)
Plane stress W/D = 2.2 (FEA)
Plane strain W/D = 2.2 (FEA)
Eq. (18
Figure 8: Stress concentration factor as a function of load factor ψ (log-scale).
1 10 100 1000
10
20
30
40
50
Kl
vM
ψ
E = 210GPa, ν = 0.3,δ = 0.001d (FEA)
E = 70GPa, ν = 0.3,δ = 0.001d (FEA)
E = 210GPa, ν = 0.3,δ = 0.01d (FEA)
E = 70GPa, ν = 0.33,δ = 0.001d (FEA)
Eq. (18), ν = 0.3
Figure 9: Stress concentration factor as a function of load factor ψ (log-scale) for different material and geometric
parameters but with W/D = 8.
To verify the use of the load factor ψ we show in Figure 9 different curves for the plane
strain case.
Overall the numerical results of the present paper support the use of the load factor, ψ, but
from Figure 9 some caution is suggested. The caution is primarily related to the low load factor
(ψ < 10) values. The value of Modulus of elasticity has no influence on the stress concentration
factor, the dotted line in Figure 9 lies on top of the full line. The clearance size has an influence
on the stress concentration factor and for larger relative clearance the result will not converge
towards the no clearance result for ψ = 0. The influence on the result is also noted for even
smaller changes in Poisson’s ratio.
The relevance of the stress concentration curves in Figures 8 and 9 should also be seen
relative to the overall stress level when we design in relation to fatigue failure. If we assume
normal production tolerances then we can expect the clearance to be less than δ = 0.002Dfor D > 10mm. For this size of clearance the stress concentration of interest is before the
kink in Figure 8, i.e. it is the low stress concentration value that is of interest and here the
stress concentration is more or less constant. The modelling and the stress concentration evalu-
ation can therefore be made without including clearance. This observation is important for the
optimization performed in the next section.
11
4 Shape optimization of pin/lug connection
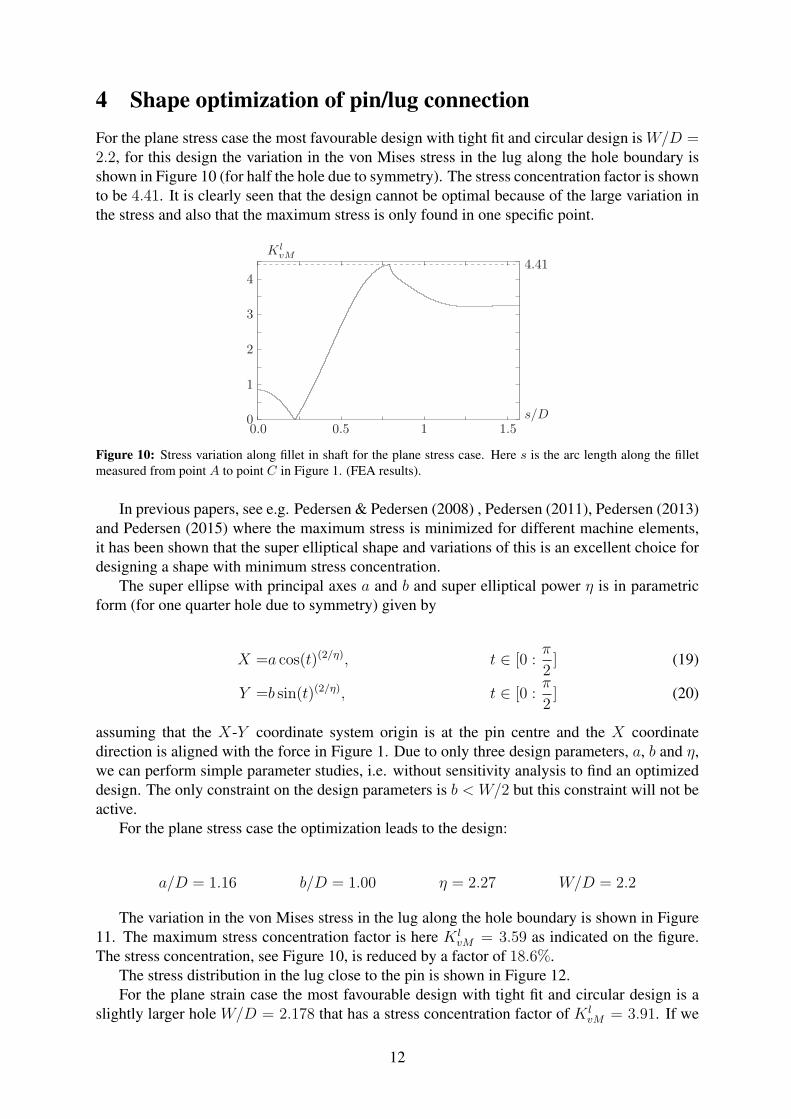
For the plane stress case the most favourable design with tight fit and circular design is W/D =2.2, for this design the variation in the von Mises stress in the lug along the hole boundary is
shown in Figure 10 (for half the hole due to symmetry). The stress concentration factor is shown
to be 4.41. It is clearly seen that the design cannot be optimal because of the large variation in
the stress and also that the maximum stress is only found in one specific point.
0.0 0.5 1 1.50
1
2
3
4
Kl
vM
s/D
4.41
Figure 10: Stress variation along fillet in shaft for the plane stress case. Here s is the arc length along the fillet
measured from point A to point C in Figure 1. (FEA results).
In previous papers, see e.g. Pedersen & Pedersen (2008) , Pedersen (2011), Pedersen (2013)
and Pedersen (2015) where the maximum stress is minimized for different machine elements,
it has been shown that the super elliptical shape and variations of this is an excellent choice for
designing a shape with minimum stress concentration.
The super ellipse with principal axes a and b and super elliptical power η is in parametric
form (for one quarter hole due to symmetry) given by
X =a cos(t)(2/η), t ∈ [0 :π
2] (19)
Y =b sin(t)(2/η), t ∈ [0 :π
2] (20)
assuming that the X-Y coordinate system origin is at the pin centre and the X coordinate
direction is aligned with the force in Figure 1. Due to only three design parameters, a, b and η,
we can perform simple parameter studies, i.e. without sensitivity analysis to find an optimized
design. The only constraint on the design parameters is b < W/2 but this constraint will not be
active.
For the plane stress case the optimization leads to the design:
a/D = 1.16 b/D = 1.00 η = 2.27 W/D = 2.2
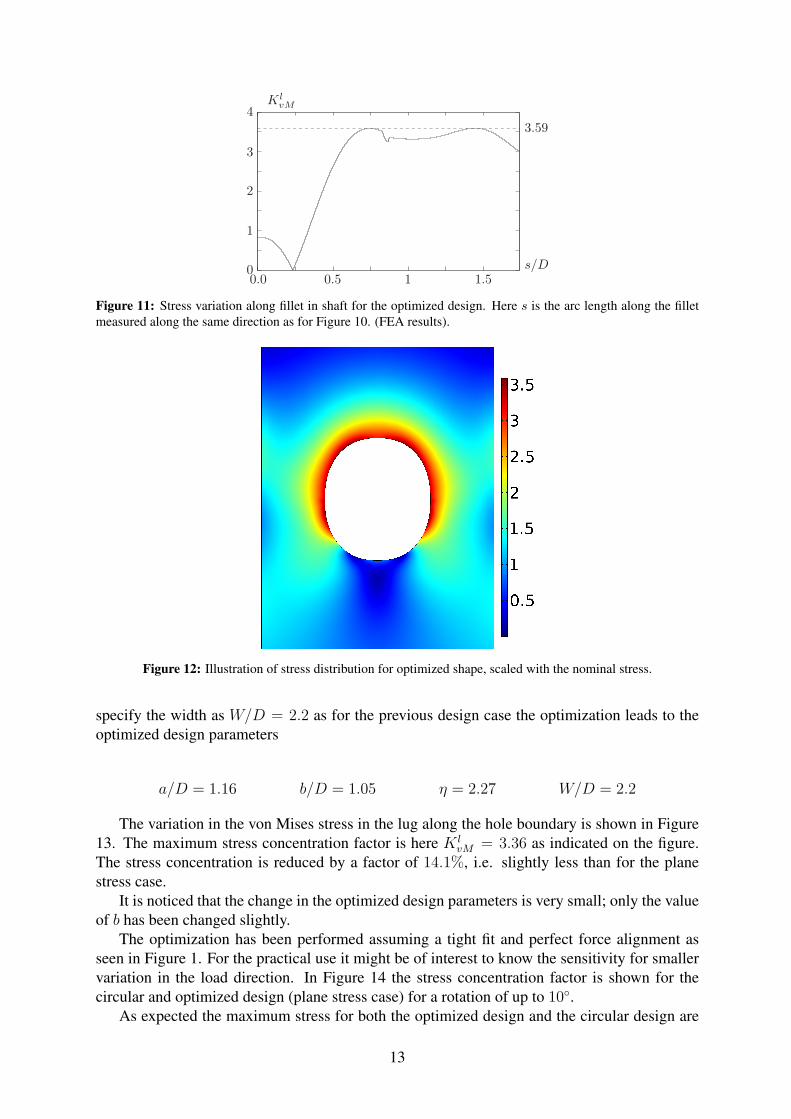
The variation in the von Mises stress in the lug along the hole boundary is shown in Figure
11. The maximum stress concentration factor is here K lvM = 3.59 as indicated on the figure.
The stress concentration, see Figure 10, is reduced by a factor of 18.6%.
The stress distribution in the lug close to the pin is shown in Figure 12.
For the plane strain case the most favourable design with tight fit and circular design is a
slightly larger hole W/D = 2.178 that has a stress concentration factor of K lvM = 3.91. If we
12
0.0 0.5 1 1.50
1
2
3
4
Kl
vM
s/D
3.59
Figure 11: Stress variation along fillet in shaft for the optimized design. Here s is the arc length along the fillet
measured along the same direction as for Figure 10. (FEA results).
Figure 12: Illustration of stress distribution for optimized shape, scaled with the nominal stress.
specify the width as W/D = 2.2 as for the previous design case the optimization leads to the
optimized design parameters
a/D = 1.16 b/D = 1.05 η = 2.27 W/D = 2.2
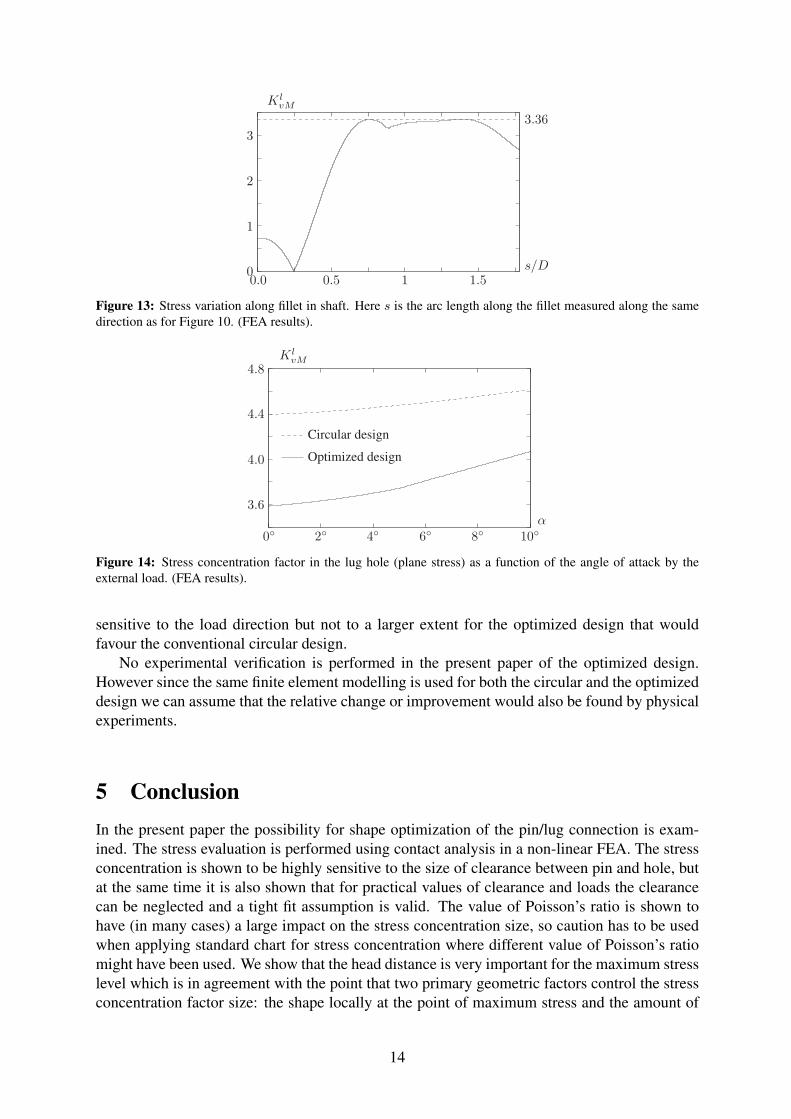
The variation in the von Mises stress in the lug along the hole boundary is shown in Figure
13. The maximum stress concentration factor is here K lvM = 3.36 as indicated on the figure.
The stress concentration is reduced by a factor of 14.1%, i.e. slightly less than for the plane
stress case.
It is noticed that the change in the optimized design parameters is very small; only the value
of b has been changed slightly.
The optimization has been performed assuming a tight fit and perfect force alignment as
seen in Figure 1. For the practical use it might be of interest to know the sensitivity for smaller
variation in the load direction. In Figure 14 the stress concentration factor is shown for the
circular and optimized design (plane stress case) for a rotation of up to 10◦.
As expected the maximum stress for both the optimized design and the circular design are
13
0.0 0.5 1 1.50
1
2
3
Kl
vM
s/D
3.36
Figure 13: Stress variation along fillet in shaft. Here s is the arc length along the fillet measured along the same
direction as for Figure 10. (FEA results).
0◦
2◦
4◦
6◦
8◦
10◦
3.6
4.0
4.4
4.8Kl
vM
α
Circular design
Optimized design
Figure 14: Stress concentration factor in the lug hole (plane stress) as a function of the angle of attack by the
external load. (FEA results).
sensitive to the load direction but not to a larger extent for the optimized design that would
favour the conventional circular design.
No experimental verification is performed in the present paper of the optimized design.
However since the same finite element modelling is used for both the circular and the optimized
design we can assume that the relative change or improvement would also be found by physical
experiments.
5 Conclusion
In the present paper the possibility for shape optimization of the pin/lug connection is exam-
ined. The stress evaluation is performed using contact analysis in a non-linear FEA. The stress
concentration is shown to be highly sensitive to the size of clearance between pin and hole, but
at the same time it is also shown that for practical values of clearance and loads the clearance
can be neglected and a tight fit assumption is valid. The value of Poisson’s ratio is shown to
have (in many cases) a large impact on the stress concentration size, so caution has to be used
when applying standard chart for stress concentration where different value of Poisson’s ratio
might have been used. We show that the head distance is very important for the maximum stress
level which is in agreement with the point that two primary geometric factors control the stress
concentration factor size: the shape locally at the point of maximum stress and the amount of
14
load that is transferred to the point of maximum stress. The head distance contributes to the
second point. For the tight fitted pin it is found that the inclusion of friction in the contact mod-
elling can be avoided, the assumption of either plane stress or plane strain has however a large
influence on the maximum stress level found.
Using the simple analytical super elliptical shape we show that a 18.6% reduction of the
maximum stress is possible and this reduction is relative to the most preferable circular design.
The maximum stress value is sensitive to the load direction for the optimized design but not to
a greater extent than the conventional design.
Acknowledgment
For discussions and suggestions I wish to thank Prof. Peder Klit and Prof. Pauli Pedersen.
A Hertzian stresses for cylinders in contact
The principal stresses for cylindrical contact (with aligned axis) are according to Hertzian the-
ory, as it may be found in Johnson (1987), given by
σx = −pmax(2z2 + 1√z2 + 1
− 2z) (21)
σz = −pmax1
√z2 + 1
(22)
σy = ν(σx + σz) (23)
where z = z/Lc is the non-dimensional depth below the centre of contact. The principal stress
σy follows from the assumption of plane strain. The point of maximum von Mises stress is
therefore a function of Poisson’s ratio.
References
COMSOL AB (1986 -), Stockholm, Sweden, www.comsol.com.
Dally, J. & Riley, W. (1991), Experimental stress analysis, McGraw-Hill,.
Ding, Y. (1986), ‘Shape optimization of structures: A literature survey’, Computers and Struc-
tures 24(6), 985–1004.
DS/EN ISO 2338 (1998), ‘Parallel pins, of unhardened steel and austenitic stainless steel’.
Frocht, M. & Hill, H. (1940), ‘Stress-concentration factors around central circular hole in plate
loaded through pin in hole’, American Society of Mechanical Engineers – Transactions –
Journal of the Applied Mechanics 7(1), A–5–A–9.
Gladwell, G. M. L. (1980), Contact problems in the classical theory of elasticity, Sijthoff &
Noordhoff.
Johnson, K. L. (1987), Contact mechanics, Cambridge University Press,.
Norton, R. L. (2006), Machine design: An integrated Approach, third edition, Pearson education
Inc., Upper Saddle River, N.J. 07458. 984 pages.
15
Pedersen, N. L. (2011), ‘Optimization of straight-sided spline design’, Archive of Applied Me-
chanics 81(10), 1393–1407.
Pedersen, N. L. (2013), ‘Overall bolt stress optimization’, Journal of Strain Analysis for Engi-
neering Design 48(3), 155–165.
Pedersen, N. L. (2015), ‘Minimizing tooth bending stress in spur gears with simplified shapes
of fillet and tool shape determination’, Engineering optimization 47(6), 805–824.
Pedersen, N. L. (2016), ‘On optimization of interference fit assembly’, Structural and Multidis-
ciplinary Optimization 54(2), 349–359.
Pedersen, N. L. (2018), ‘Aspects of stress in optimal shaft shoulder fillet’, Journal of Strain
Analysis for Engineering Design 53(5), 285–294.
Pedersen, N. L. & Pedersen, P. (2008), ‘Design of notches and grooves by means of elliptical
shapes’, Journal of Strain Analysis for Engineering Design 43(1), 1–14.
Pedersen, P. (2007), ‘On the influence of clearance in orthotropic disc-pin contacts’, Composite
Structures 79(4), 554–561.
Pilkey, W. D. (1997), Peterson’s Stress Concentration Factors, 2nd edn, John Wiley and Sons,
New York, USA. 508 p.
Strozzi, A., Baldini, A. & Nascimbeni, M. (2006), ‘Maximum equivalent stress in a pin-
loaded lug subject to inclined loading’, Journal of Strain Analysis for Engineering Design
41(4), 297–309.
Strozzi, A., Baldini, A., Giacopini, M., Bertocchi, E. & Bertocchi, L. (2011), ‘Maximum equiv-
alent stress in a pin-loaded lug in the presence of initial clearance’, Journal of Strain Anal-
ysis for Engineering Design 46(8), 760–771.
Theocaris, P. (1956), ‘Stress distribution in strip loaded in tension by means of central pin’,
American Society of Mechanical Engineers – Transactions – Journal of Applied Mechan-
ics 23(1), 85–90.
Wang, G. S. (1994), ‘Stress analysis for a lug under various conditions’, Journal of Strain


![Pinned sites in ie9 [beta]](https://static.documents.pub/doc/80x56/5554bdb8b4c90503388b4c9b/pinned-sites-in-ie9-beta.jpg)


