Structural analysis of mylonitic rocks in the Cougar Creek Complex, Oregon–Idaho using the porphyroclast hyperbolic distribution method, and potential use of SC 0 -type extensional shear bands as quantitative vorticity indicators Gene A. Kurz * , Clyde J. Northrup Department of Geosciences, Boise State University,1910 University Drive, Boise, ID 83725, USA article info Article history: Received 7 February 2007 Received in revised form 2 April 2008 Accepted 6 April 2008 Available online 18 April 2008 Keywords: Vorticity Shear Bands Mylonites Blue Mountains Arc Terranes Cougar Creek Complex Oregon abstract Mylonitic rocks of the Cougar Creek Complex of northeastern Oregon and west-central Idaho provide an opportunity to document the deformational structures produced during general non-coaxial shear within quartz-feldspar mylonites and to explore the potential role of SC 0 -type extensional shear bands in vorticity analysis. Well-developed feldspar porphyroclasts within six mylonite zones were utilized to estimate bulk kinematic vorticity (W k ) using the porphyroclast hyperbolic distribution (PHD) method. W k values for the Cougar Creek mylonites range from W k ¼ 0.26 to W k ¼ 0.37. Synthetic and antithetic shear band inclinations were measured relative to observed shear zone boundaries within five mylonite zones with estimated W k values and compared to the non-coaxial flow field geometries and eigenvector orientations. In each mylonite zone, synthetic SC 0 -type shear band populations exhibit a range of in- clination with maximum inclination lying approximately parallel to the acute bisector (AB) of the ei- genvectors. Similarly, antithetic shear band populations show a range of inclination near the obtuse bisector (OB) of the eigenvectors. We infer that SC 0 -type extensional shear bands form initially parallel to AB and OB and rotate towards the flow plane with progressive deformation, decreasing their inclination relative to the shear zone boundary. AB and OB have significance in the strain field in that they represent orientations of maximum angular strain rate. Thus, planes perpendicular to AB and OB are mechanically favorable for small zones of localized simple shear (shear bands) within the heterogeneous bulk strain of the mylonite. Orientation analysis of populations of SC 0 -type shear bands may provide a direct, quan- titative means of estimating W k . Ó 2008 Elsevier Ltd. All rights reserved. 1. Introduction Quantitative structural analysis may provide valuable in- formation regarding the kinematic vorticity of deformation within mylonitic rocks (e.g., Passchier and Simpson, 1986; Passchier, 1987; De Paor, 1988; Wallis, 1995; Beam and Fisher, 1999; Klepeis et al., 1999; Bailey and Eyster, 2003; Giorgis et al., 2003; Law et al., 2004). The relative contributions of the pure and simple shear end- members present during general non-coaxial progressive de- formation may be inferred by utilizing the porphyroclast hyperbolic distribution (PHD) method (Simpson and De Paor, 1993, 1997). In addition, the orientations of SC 0 -type extensional shear bands, measured oblique to the shear zone boundary (Passchier and Trouw, 1998, p. 111), may provide a method of determining bulk kinematic vorticity. The geometric relationship between SC 0 -type shear bands and their associated flow field has been described differently in the past. Some previous workers have observed and interpreted SC 0 -type shear band orientations as being coincidental with the direction of maximum angular shear strain rate (i.e., bisecting the acute and obtuse angles between eigenvectors; Simpson and De Paor, 1993,1997; Klepeis et al., 1999; Law et al., 2004). Conversely, SC 0 -type shear bands have been interpreted as being oriented parallel to the inclined or unstable eigenvector (Bobyarchick, 1986). Ductile shear zones within the Cougar Creek Complex (CCC) in the Blue Mountains Province (BMP) of northeastern Oregon and west-central Idaho (Fig. 1) provide an opportunity to evaluate the structural development of quartz-feldspar rocks at mid-crustal levels of the Wallowa island arc system. Mylonitic rocks from the CCC exhibit characteristics which make them suitable for PHD analysis: (1) simple mineralogy; and (2) well-developed and easily recognized deformational textures and fabrics (i.e., the presence of * Corresponding author. E-mail address: [email protected](G.A. Kurz). Contents lists available at ScienceDirect Journal of Structural Geology journal homepage: www.elsevier.com/locate/jsg 0191-8141/$ – see front matter Ó 2008 Elsevier Ltd. All rights reserved. doi:10.1016/j.jsg.2008.04.003 Journal of Structural Geology 30 (2008) 1005–1012
Transcript
lable at ScienceDirect
Journal of Structural Geology 30 (2008) 1005–1012
Contents lists avai
Journal of Structural Geology
journal homepage: www.elsevier .com/locate/ jsg
Structural analysis of mylonitic rocks in the Cougar Creek Complex,Oregon–Idaho using the porphyroclast hyperbolic distribution method,and potential use of SC0-type extensional shear bands as quantitativevorticity indicators
Gene A. Kurz*, Clyde J. NorthrupDepartment of Geosciences, Boise State University, 1910 University Drive, Boise, ID 83725, USA
a r t i c l e i n f o
Article history:Received 7 February 2007Received in revised form 2 April 2008Accepted 6 April 2008Available online 18 April 2008
Keywords:VorticityShear BandsMylonitesBlue MountainsArc TerranesCougar Creek ComplexOregon
0191-8141/$ – see front matter � 2008 Elsevier Ltd. Adoi:10.1016/j.jsg.2008.04.003
a b s t r a c t
Mylonitic rocks of the Cougar Creek Complex of northeastern Oregon and west-central Idaho provide anopportunity to document the deformational structures produced during general non-coaxial shearwithin quartz-feldspar mylonites and to explore the potential role of SC0-type extensional shear bands invorticity analysis. Well-developed feldspar porphyroclasts within six mylonite zones were utilized toestimate bulk kinematic vorticity (Wk) using the porphyroclast hyperbolic distribution (PHD) method.Wk values for the Cougar Creek mylonites range from Wk ¼ 0.26 to Wk ¼ 0.37. Synthetic and antitheticshear band inclinations were measured relative to observed shear zone boundaries within five mylonitezones with estimated Wk values and compared to the non-coaxial flow field geometries and eigenvectororientations. In each mylonite zone, synthetic SC0-type shear band populations exhibit a range of in-clination with maximum inclination lying approximately parallel to the acute bisector (AB) of the ei-genvectors. Similarly, antithetic shear band populations show a range of inclination near the obtusebisector (OB) of the eigenvectors. We infer that SC0-type extensional shear bands form initially parallel toAB and OB and rotate towards the flow plane with progressive deformation, decreasing their inclinationrelative to the shear zone boundary. AB and OB have significance in the strain field in that they representorientations of maximum angular strain rate. Thus, planes perpendicular to AB and OB are mechanicallyfavorable for small zones of localized simple shear (shear bands) within the heterogeneous bulk strain ofthe mylonite. Orientation analysis of populations of SC0-type shear bands may provide a direct, quan-titative means of estimating Wk.
� 2008 Elsevier Ltd. All rights reserved.
1. Introduction
Quantitative structural analysis may provide valuable in-formation regarding the kinematic vorticity of deformation withinmylonitic rocks (e.g., Passchier and Simpson, 1986; Passchier, 1987;De Paor, 1988; Wallis, 1995; Beam and Fisher, 1999; Klepeis et al.,1999; Bailey and Eyster, 2003; Giorgis et al., 2003; Law et al., 2004).The relative contributions of the pure and simple shear end-members present during general non-coaxial progressive de-formation may be inferred by utilizing the porphyroclast hyperbolicdistribution (PHD) method (Simpson and De Paor, 1993, 1997). Inaddition, the orientations of SC0-type extensional shear bands,measured oblique to the shear zone boundary (Passchier andTrouw, 1998, p. 111), may provide a method of determining bulk
. Kurz).
ll rights reserved.
kinematic vorticity. The geometric relationship between SC0-typeshear bands and their associated flow field has been describeddifferently in the past. Some previous workers have observed andinterpreted SC0-type shear band orientations as being coincidentalwith the direction of maximum angular shear strain rate (i.e.,bisecting the acute and obtuse angles between eigenvectors;Simpson and De Paor, 1993, 1997; Klepeis et al., 1999; Law et al.,2004). Conversely, SC0-type shear bands have been interpreted asbeing oriented parallel to the inclined or unstable eigenvector(Bobyarchick, 1986).
Ductile shear zones within the Cougar Creek Complex (CCC) inthe Blue Mountains Province (BMP) of northeastern Oregon andwest-central Idaho (Fig. 1) provide an opportunity to evaluate thestructural development of quartz-feldspar rocks at mid-crustallevels of the Wallowa island arc system. Mylonitic rocks from theCCC exhibit characteristics which make them suitable for PHDanalysis: (1) simple mineralogy; and (2) well-developed and easilyrecognized deformational textures and fabrics (i.e., the presence of
Fig. 1. Blue Mountains province terrane map.Regional geologic map of the Blue Mountains Province, northeastern Oregon, west-central Idaho, and southeastern Washington(After Vallier, 1995).
G.A. Kurz, C.J. Northrup / Journal of Structural Geology 30 (2008) 1005–10121006
well-developed porphyroclasts and SC0-type extensional shearbands.
2. Regional geologic context
The CCC is one of five basement complexes within the BMP, andis exposed along a 10-km section of the Snake River within Hells
Canyon, between Temperence Creek, Oregon and Pittsburg Land-ing, Idaho. Similar igneous complexes are located in several parts ofthe Salmon and Snake River canyons, including: (1) along the SnakeRiver near Oxbow, Oregon, (the Oxbow Complex); (2) near theconfluence of the Snake and Salmon rivers (the Wolf Creek–DeepCreek and Imnaha Plutonic Complex); and (3) along the SalmonRiver between Lucile and White Bird, Idaho (Fig. 1).
G.A. Kurz, C.J. Northrup / Journal of Structural Geology 30 (2008) 1005–1012 1007
Igneous rocks of the CCC are composed of dikes and small stockswith a wide range of bulk compositions, including gabbro, diorite,quartz diorite, tonalite, trondhjemite, and their metamorphosedand deformed equivalents (Vallier, 1995; Kurz, 2001). The CCC isinterpreted as the mid-crustal expression of the axial zone relatedto the Wallowa island arc (Vallier, 1995; Kurz, 2001). Similar igne-ous complexes have also been documented in the KlamathMountains of northern California (McFadden et al., 2006).
The CCC is structurally complex and penetratively deformed.Ductile shear zones exhibiting both dextral and sinistral senses ofshear were generated within a transpressional tectonic environ-ment experiencing predominant strike-slip to oblique-slip kine-matic conditions (Kurz, 2001). Individual shear zones range fromone centimeter to several meters in width, strike northeast-southwest, and dip moderately to steeply to both the northwestand southeast. Stretching lineations are sub-horizontal to gentlyplunging to the southwest and northeast (Kurz, 2001). Mineralassemblages and recrystallization textures within mylonitic rocksindicate greenschist facies conditions of metamorphism at the timeof deformation.
3. Methods
3.1. Porphyroclast hyperbolic distribution (PHD) analysis
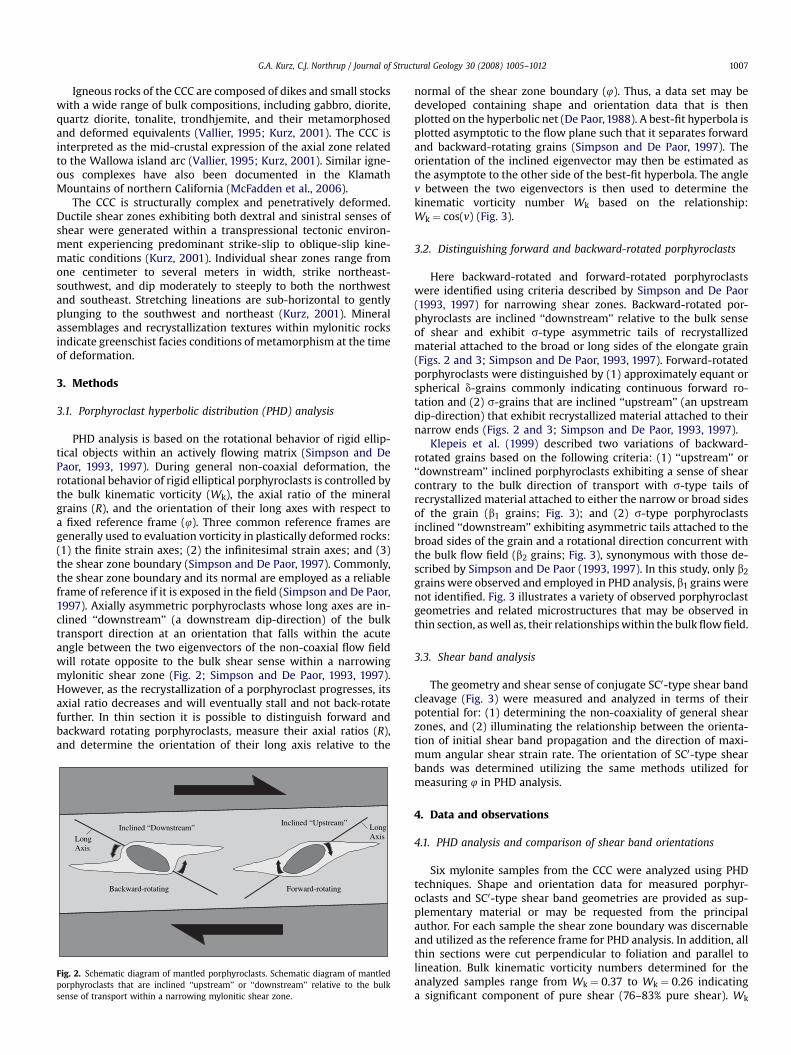
PHD analysis is based on the rotational behavior of rigid ellip-tical objects within an actively flowing matrix (Simpson and DePaor, 1993, 1997). During general non-coaxial deformation, therotational behavior of rigid elliptical porphyroclasts is controlled bythe bulk kinematic vorticity (Wk), the axial ratio of the mineralgrains (R), and the orientation of their long axes with respect toa fixed reference frame (4). Three common reference frames aregenerally used to evaluation vorticity in plastically deformed rocks:(1) the finite strain axes; (2) the infinitesimal strain axes; and (3)the shear zone boundary (Simpson and De Paor, 1997). Commonly,the shear zone boundary and its normal are employed as a reliableframe of reference if it is exposed in the field (Simpson and De Paor,1997). Axially asymmetric porphyroclasts whose long axes are in-clined ‘‘downstream’’ (a downstream dip-direction) of the bulktransport direction at an orientation that falls within the acuteangle between the two eigenvectors of the non-coaxial flow fieldwill rotate opposite to the bulk shear sense within a narrowingmylonitic shear zone (Fig. 2; Simpson and De Paor, 1993, 1997).However, as the recrystallization of a porphyroclast progresses, itsaxial ratio decreases and will eventually stall and not back-rotatefurther. In thin section it is possible to distinguish forward andbackward rotating porphyroclasts, measure their axial ratios (R),and determine the orientation of their long axis relative to the
Inclined “Upstream”
Forward-rotatingBackward-rotating
Inclined “Downstream”LongAxis
LongAxis
Fig. 2. Schematic diagram of mantled porphyroclasts. Schematic diagram of mantledporphyroclasts that are inclined ‘‘upstream’’ or ‘‘downstream’’ relative to the bulksense of transport within a narrowing mylonitic shear zone.
normal of the shear zone boundary (4). Thus, a data set may bedeveloped containing shape and orientation data that is thenplotted on the hyperbolic net (De Paor, 1988). A best-fit hyperbola isplotted asymptotic to the flow plane such that it separates forwardand backward-rotating grains (Simpson and De Paor, 1997). Theorientation of the inclined eigenvector may then be estimated asthe asymptote to the other side of the best-fit hyperbola. The anglev between the two eigenvectors is then used to determine thekinematic vorticity number Wk based on the relationship:Wk ¼ cos(v) (Fig. 3).
3.2. Distinguishing forward and backward-rotated porphyroclasts
Here backward-rotated and forward-rotated porphyroclastswere identified using criteria described by Simpson and De Paor(1993, 1997) for narrowing shear zones. Backward-rotated por-phyroclasts are inclined ‘‘downstream’’ relative to the bulk senseof shear and exhibit s-type asymmetric tails of recrystallizedmaterial attached to the broad or long sides of the elongate grain(Figs. 2 and 3; Simpson and De Paor, 1993, 1997). Forward-rotatedporphyroclasts were distinguished by (1) approximately equant orspherical d-grains commonly indicating continuous forward ro-tation and (2) s-grains that are inclined ‘‘upstream’’ (an upstreamdip-direction) that exhibit recrystallized material attached to theirnarrow ends (Figs. 2 and 3; Simpson and De Paor, 1993, 1997).
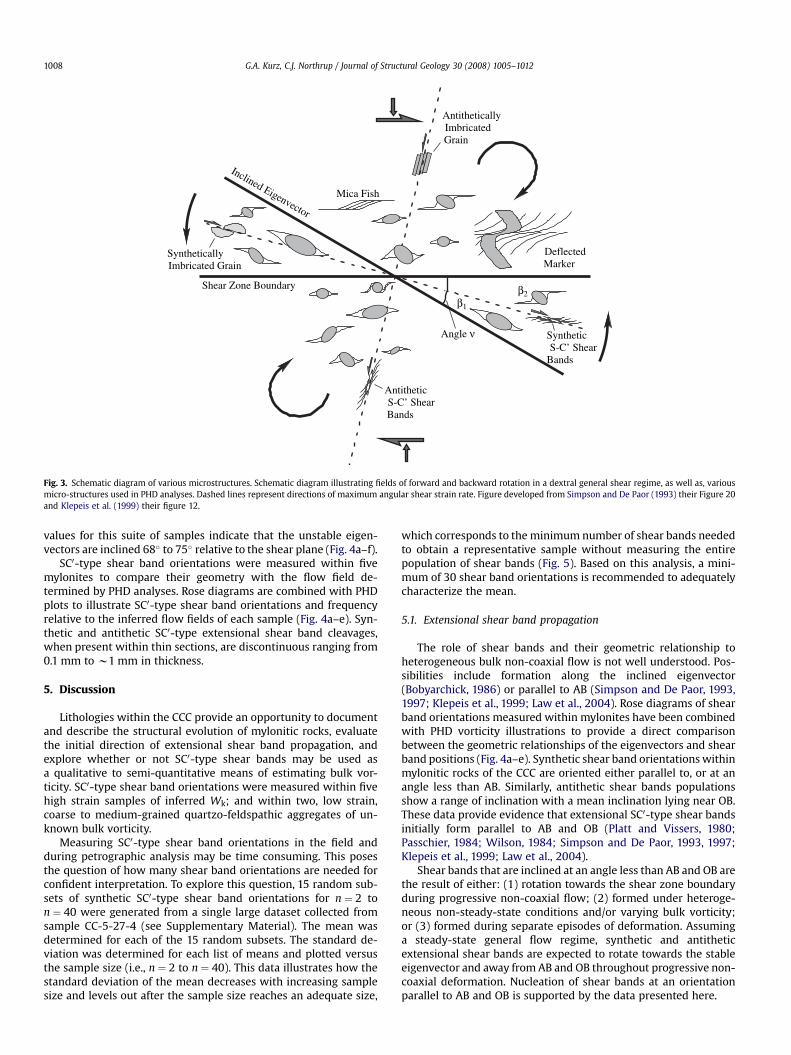
Klepeis et al. (1999) described two variations of backward-rotated grains based on the following criteria: (1) ‘‘upstream’’ or‘‘downstream’’ inclined porphyroclasts exhibiting a sense of shearcontrary to the bulk direction of transport with s-type tails ofrecrystallized material attached to either the narrow or broad sidesof the grain (b1 grains; Fig. 3); and (2) s-type porphyroclastsinclined ‘‘downstream’’ exhibiting asymmetric tails attached to thebroad sides of the grain and a rotational direction concurrent withthe bulk flow field (b2 grains; Fig. 3), synonymous with those de-scribed by Simpson and De Paor (1993, 1997). In this study, only b2
grains were observed and employed in PHD analysis, b1 grains werenot identified. Fig. 3 illustrates a variety of observed porphyroclastgeometries and related microstructures that may be observed inthin section, as well as, their relationships within the bulk flow field.
3.3. Shear band analysis
The geometry and shear sense of conjugate SC0-type shear bandcleavage (Fig. 3) were measured and analyzed in terms of theirpotential for: (1) determining the non-coaxiality of general shearzones, and (2) illuminating the relationship between the orienta-tion of initial shear band propagation and the direction of maxi-mum angular shear strain rate. The orientation of SC0-type shearbands was determined utilizing the same methods utilized formeasuring 4 in PHD analysis.
4. Data and observations
4.1. PHD analysis and comparison of shear band orientations
Six mylonite samples from the CCC were analyzed using PHDtechniques. Shape and orientation data for measured porphyr-oclasts and SC0-type shear band geometries are provided as sup-plementary material or may be requested from the principalauthor. For each sample the shear zone boundary was discernableand utilized as the reference frame for PHD analysis. In addition, allthin sections were cut perpendicular to foliation and parallel tolineation. Bulk kinematic vorticity numbers determined for theanalyzed samples range from Wk ¼ 0.37 to Wk ¼ 0.26 indicatinga significant component of pure shear (76–83% pure shear). Wk
Inclined Eigenvector
Shear Zone Boundary
DeflectedMarker
β2β1
Mica Fish
SyntheticS-C’ Shear
Bands
AntitheticallyImbricatedGrain
SyntheticallyImbricated Grain
AntitheticS-C’ ShearBands
Angle ν
Fig. 3. Schematic diagram of various microstructures. Schematic diagram illustrating fields of forward and backward rotation in a dextral general shear regime, as well as, variousmicro-structures used in PHD analyses. Dashed lines represent directions of maximum angular shear strain rate. Figure developed from Simpson and De Paor (1993) their Figure 20and Klepeis et al. (1999) their figure 12.
G.A. Kurz, C.J. Northrup / Journal of Structural Geology 30 (2008) 1005–10121008
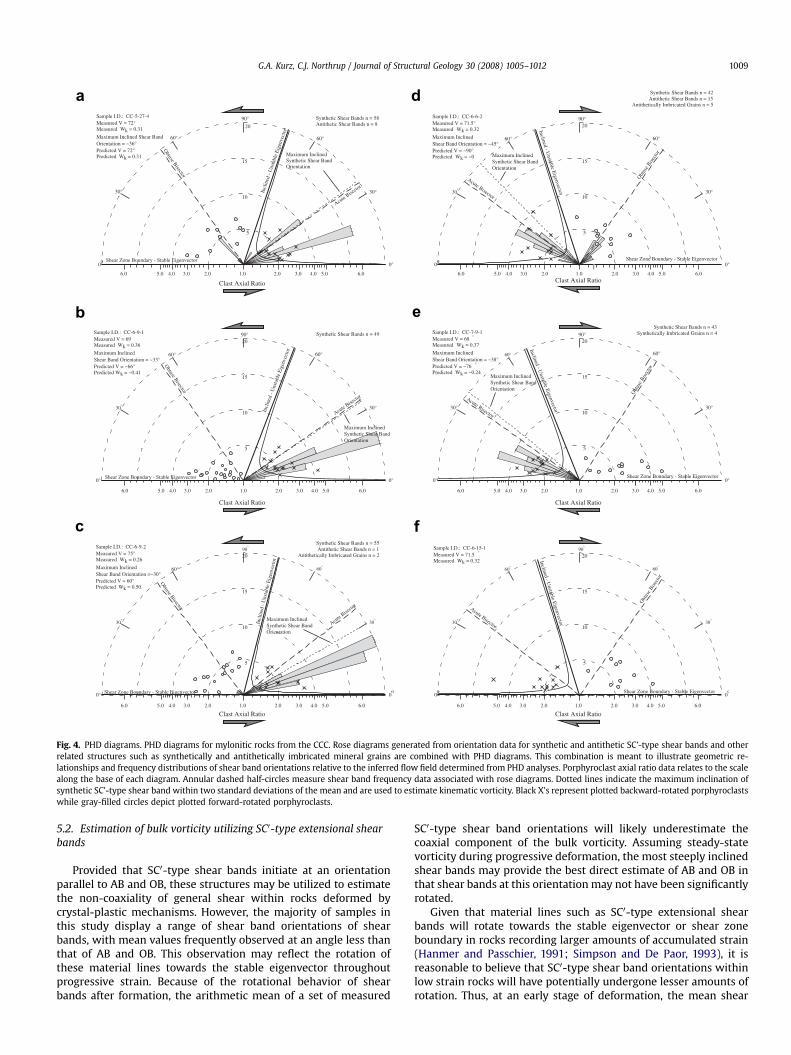
values for this suite of samples indicate that the unstable eigen-vectors are inclined 68� to 75� relative to the shear plane (Fig. 4a–f).
SC0-type shear band orientations were measured within fivemylonites to compare their geometry with the flow field de-termined by PHD analyses. Rose diagrams are combined with PHDplots to illustrate SC0-type shear band orientations and frequencyrelative to the inferred flow fields of each sample (Fig. 4a–e). Syn-thetic and antithetic SC0-type extensional shear band cleavages,when present within thin sections, are discontinuous ranging from0.1 mm to w1 mm in thickness.
5. Discussion
Lithologies within the CCC provide an opportunity to documentand describe the structural evolution of mylonitic rocks, evaluatethe initial direction of extensional shear band propagation, andexplore whether or not SC0-type shear bands may be used asa qualitative to semi-quantitative means of estimating bulk vor-ticity. SC0-type shear band orientations were measured within fivehigh strain samples of inferred Wk; and within two, low strain,coarse to medium-grained quartzo-feldspathic aggregates of un-known bulk vorticity.
Measuring SC0-type shear band orientations in the field andduring petrographic analysis may be time consuming. This posesthe question of how many shear band orientations are needed forconfident interpretation. To explore this question, 15 random sub-sets of synthetic SC0-type shear band orientations for n ¼ 2 ton ¼ 40 were generated from a single large dataset collected fromsample CC-5-27-4 (see Supplementary Material). The mean wasdetermined for each of the 15 random subsets. The standard de-viation was determined for each list of means and plotted versusthe sample size (i.e., n ¼ 2 to n ¼ 40). This data illustrates how thestandard deviation of the mean decreases with increasing samplesize and levels out after the sample size reaches an adequate size,
which corresponds to the minimum number of shear bands neededto obtain a representative sample without measuring the entirepopulation of shear bands (Fig. 5). Based on this analysis, a mini-mum of 30 shear band orientations is recommended to adequatelycharacterize the mean.
5.1. Extensional shear band propagation
The role of shear bands and their geometric relationship toheterogeneous bulk non-coaxial flow is not well understood. Pos-sibilities include formation along the inclined eigenvector(Bobyarchick, 1986) or parallel to AB (Simpson and De Paor, 1993,1997; Klepeis et al., 1999; Law et al., 2004). Rose diagrams of shearband orientations measured within mylonites have been combinedwith PHD vorticity illustrations to provide a direct comparisonbetween the geometric relationships of the eigenvectors and shearband positions (Fig. 4a–e). Synthetic shear band orientations withinmylonitic rocks of the CCC are oriented either parallel to, or at anangle less than AB. Similarly, antithetic shear bands populationsshow a range of inclination with a mean inclination lying near OB.These data provide evidence that extensional SC0-type shear bandsinitially form parallel to AB and OB (Platt and Vissers, 1980;Passchier, 1984; Wilson, 1984; Simpson and De Paor, 1993, 1997;Klepeis et al., 1999; Law et al., 2004).
Shear bands that are inclined at an angle less than AB and OB arethe result of either: (1) rotation towards the shear zone boundaryduring progressive non-coaxial flow; (2) formed under heteroge-neous non-steady-state conditions and/or varying bulk vorticity;or (3) formed during separate episodes of deformation. Assuminga steady-state general flow regime, synthetic and antitheticextensional shear bands are expected to rotate towards the stableeigenvector and away from AB and OB throughout progressive non-coaxial deformation. Nucleation of shear bands at an orientationparallel to AB and OB is supported by the data presented here.
a
b
c
d
e
f
Fig. 4. PHD diagrams. PHD diagrams for mylonitic rocks from the CCC. Rose diagrams generated from orientation data for synthetic and antithetic SC’-type shear bands and otherrelated structures such as synthetically and antithetically imbricated mineral grains are combined with PHD diagrams. This combination is meant to illustrate geometric re-lationships and frequency distributions of shear band orientations relative to the inferred flow field determined from PHD analyses. Porphyroclast axial ratio data relates to the scalealong the base of each diagram. Annular dashed half-circles measure shear band frequency data associated with rose diagrams. Dotted lines indicate the maximum inclination ofsynthetic SC’-type shear band within two standard deviations of the mean and are used to estimate kinematic vorticity. Black X’s represent plotted backward-rotated porphyroclastswhile gray-filled circles depict plotted forward-rotated porphyroclasts.
G.A. Kurz, C.J. Northrup / Journal of Structural Geology 30 (2008) 1005–1012 1009
5.2. Estimation of bulk vorticity utilizing SC0-type extensional shearbands
Provided that SC0-type shear bands initiate at an orientationparallel to AB and OB, these structures may be utilized to estimatethe non-coaxiality of general shear within rocks deformed bycrystal-plastic mechanisms. However, the majority of samples inthis study display a range of shear band orientations of shearbands, with mean values frequently observed at an angle less thanthat of AB and OB. This observation may reflect the rotation ofthese material lines towards the stable eigenvector throughoutprogressive strain. Because of the rotational behavior of shearbands after formation, the arithmetic mean of a set of measured
SC0-type shear band orientations will likely underestimate thecoaxial component of the bulk vorticity. Assuming steady-statevorticity during progressive deformation, the most steeply inclinedshear bands may provide the best direct estimate of AB and OB inthat shear bands at this orientation may not have been significantlyrotated.
Given that material lines such as SC0-type extensional shearbands will rotate towards the stable eigenvector or shear zoneboundary in rocks recording larger amounts of accumulated strain(Hanmer and Passchier, 1991; Simpson and De Paor, 1993), it isreasonable to believe that SC0-type shear band orientations withinlow strain rocks will have potentially undergone lesser amounts ofrotation. Thus, at an early stage of deformation, the mean shear
0
1
2
3
4
5
6
0 10 20 30 40 50
Stan
dard
D
eviatio
n (D
eg
rees)
Sample Size
Sample Size -vs- Standard Deviation
Fig. 5. Sample size versus standard deviation. Sample size versus standard deviationillustrates how the standard deviation of a mean shear band orientation decreaseswith increasing sample size. An optimum sample size was chosen where the slope ofthe curve begins to flatten near n ¼ 30 to 40.
Hypothetical Distribution of Shear
Freq
uen
cy
Shear Band Ori
Mean = Acute Bisector andObtuse Bisector
Decreasing φ A
Hypothetical Distribution of She
Freq
uen
cy
Shear Band
Mean < Acute Bisector andObtuse Bisector
Decreasing φ
a
b
Fig. 6. Distribution of shear band orientations. (a) Schematic distribution of shear band oformation shear bands have not accumulated enough strain to rotate away from AB and Oestimate of the bulk vorticity. (b) Distribution of shear band orientations after accumulatedaway from AB and OB. Here, the most steeply inclined shear band orientation may provide thunder steady-state general noncoaxial flow.
G.A. Kurz, C.J. Northrup / Journal of Structural Geology 30 (2008) 1005–10121010
band orientation within a low strain rock will be more represen-tative of the initial position in which they formed (Fig. 6).
Mylonites from the CCC may provide an example of this be-havior. SC0-type shear band orientations were used to estimate Wk
from five mylonites from the CCC, estimated values were thencompared with Wk values inferred from PHD analysis. Estimatedvalues for bulk vorticity within high strain rocks were determinedby utilizing the most steeply inclined shear band orientation within� two standard deviations of the mean in order to eliminate out-liers. Generally, the most steeply inclined shear band orientationoverestimated the coaxial component of bulk vorticity as comparedto values discerned from PHD analysis (Fig. 4a–e). Two samplesoverestimated the pure shear component relative to inferred Wk
values (Fig. 4d and e), however, shear bands from two other samplesgave estimates for the angle v within w3� of their graphically de-termined v angles (Fig. 4a and b). Shear band cleavage orientationsfrom a fifth mylonite underestimated Wk (Fig. 4c). Estimated bulkvorticity derived from shear band analysis range from Wk z 0.50 toWk z 0. These estimates corresponding to a range of v angles of 60�
to 90� which relate to pure shear components of z67% to z100%.
5.3. Estimating bulk vorticity in lower strain rocks
Petrographic investigation of deformational textures and fabricsin two coarse to medium-grained quartz-feldspar aggregates fromthe CCC of unknown vorticity indicate a lesser amount of dynamic
Bands at Initial Stages of Deformation
entation
ngle
ar Bands after Accumulated Strain
Orientation
Angle
rientation which have undergone only a small amount of strain. At this stage of de-B. The arithmetic mean of a set of measured shear bands may provide a reasonablestrain (Dark Gray). Notice that the mean of this sample has been skewed to the right,
e best direct estimate of bulk vorticity of a rock mass that has been plastically deformed
SSSS
SS
SS
SS
SS
SS
SS
SSSS
SS
SS SS
SS
SS
ML
ML
ML ML F
FF
F
F
F
F
F
F
F
F
F
F
F
F
F
F
F
F
F
F
FF
F
F F
F
FF
F
SS
F
F
F
F
F
F
0 2mm
ML
MLML
ML ML
ML
ML
SSSS
SS
SS
SS
ML
ML
ML
ML
MLML
ML
ML
MLML
SS
MLMLML
ML
MLF
F
F
F
FF
F F
F
F
FF
F
F
FF
FF
F
F
F
F
F
0 3mm
a
b
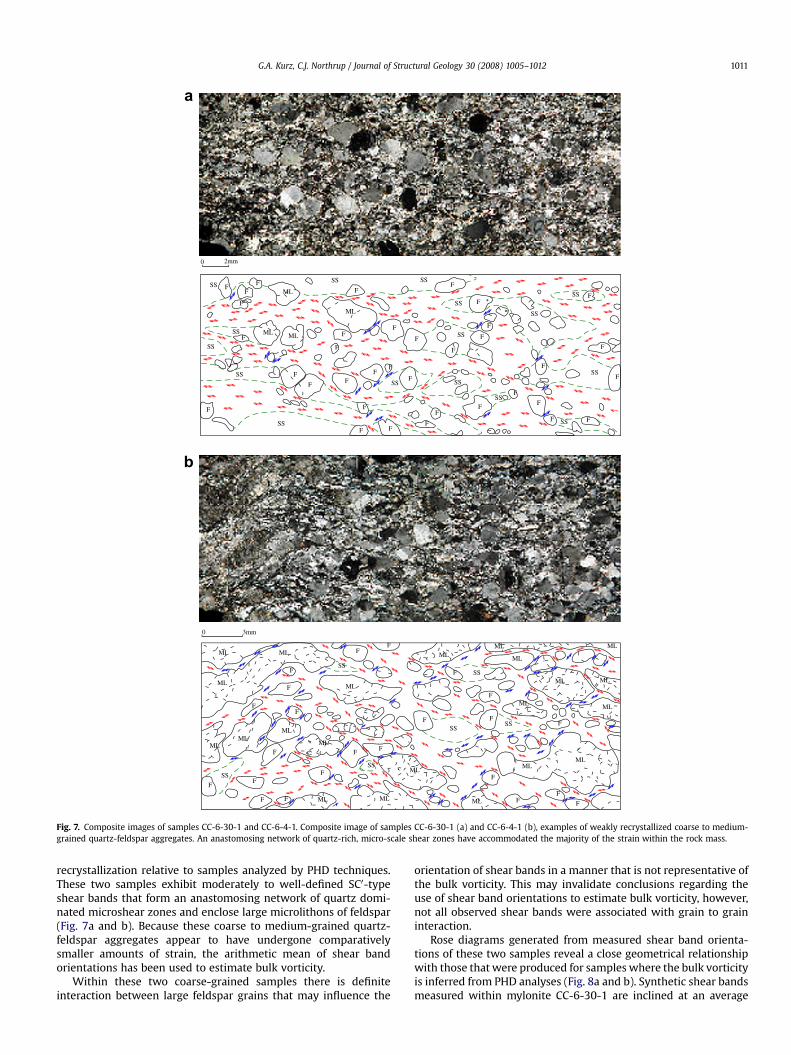
Fig. 7. Composite images of samples CC-6-30-1 and CC-6-4-1. Composite image of samples CC-6-30-1 (a) and CC-6-4-1 (b), examples of weakly recrystallized coarse to medium-grained quartz-feldspar aggregates. An anastomosing network of quartz-rich, micro-scale shear zones have accommodated the majority of the strain within the rock mass.
G.A. Kurz, C.J. Northrup / Journal of Structural Geology 30 (2008) 1005–1012 1011
recrystallization relative to samples analyzed by PHD techniques.These two samples exhibit moderately to well-defined SC0-typeshear bands that form an anastomosing network of quartz domi-nated microshear zones and enclose large microlithons of feldspar(Fig. 7a and b). Because these coarse to medium-grained quartz-feldspar aggregates appear to have undergone comparativelysmaller amounts of strain, the arithmetic mean of shear bandorientations has been used to estimate bulk vorticity.
Within these two coarse-grained samples there is definiteinteraction between large feldspar grains that may influence the
orientation of shear bands in a manner that is not representative ofthe bulk vorticity. This may invalidate conclusions regarding theuse of shear band orientations to estimate bulk vorticity, however,not all observed shear bands were associated with grain to graininteraction.
Rose diagrams generated from measured shear band orienta-tions of these two samples reveal a close geometrical relationshipwith those that were produced for samples where the bulk vorticityis inferred from PHD analyses (Fig. 8a and b). Synthetic shear bandsmeasured within mylonite CC-6-30-1 are inclined at an average
5
Shear Zone Boundary - Stable Eigenvector
10
15
20
0°
30°
60°
90°
60°
30°
0°
Estimated Inclined - U
nstable Eigenvector
Sample I.D.: CC-6-30-1
Mean Shear Band Orientation = ~30°
Estimated V = ~60°Estimated Wk = ~0.50
Synthetic Shear Bands n = 26Antithetic Shear Bands n = 17
Mean SyntheticShear Band Orientation
Estimated Acute Bisector
5
Shear Zone Boundary - Stable Eigenvector
10
15
20
0°
30°
60°
90°
60°
30°
0°
Estim
ated Inclined - Unstable E
igenvector
Sample I.D.: CC-6-4-1
Mean Shear Band Orientation = ~40°
Estimated V = ~80Estimated Wk = ~0.17
Synthetic Shear Bands n = 33Antithetic Shear Bands n = 34
Mean SyntheticShear Band Orientation
Estimated Acute Bisector
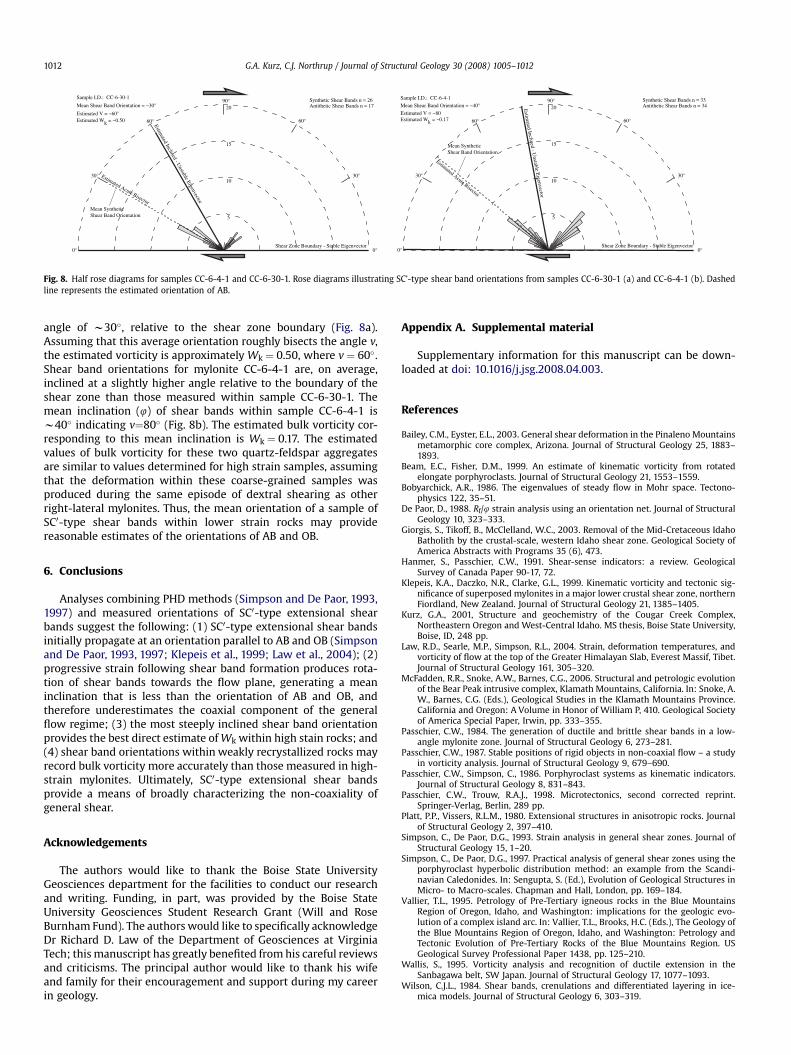
Fig. 8. Half rose diagrams for samples CC-6-4-1 and CC-6-30-1. Rose diagrams illustrating SC’-type shear band orientations from samples CC-6-30-1 (a) and CC-6-4-1 (b). Dashedline represents the estimated orientation of AB.
G.A. Kurz, C.J. Northrup / Journal of Structural Geology 30 (2008) 1005–10121012
angle of w30�, relative to the shear zone boundary (Fig. 8a).Assuming that this average orientation roughly bisects the angle v,the estimated vorticity is approximately Wk ¼ 0.50, where v ¼ 60�.Shear band orientations for mylonite CC-6-4-1 are, on average,inclined at a slightly higher angle relative to the boundary of theshear zone than those measured within sample CC-6-30-1. Themean inclination (4) of shear bands within sample CC-6-4-1 isw40� indicating v¼80� (Fig. 8b). The estimated bulk vorticity cor-responding to this mean inclination is Wk ¼ 0.17. The estimatedvalues of bulk vorticity for these two quartz-feldspar aggregatesare similar to values determined for high strain samples, assumingthat the deformation within these coarse-grained samples wasproduced during the same episode of dextral shearing as otherright-lateral mylonites. Thus, the mean orientation of a sample ofSC0-type shear bands within lower strain rocks may providereasonable estimates of the orientations of AB and OB.
6. Conclusions
Analyses combining PHD methods (Simpson and De Paor, 1993,1997) and measured orientations of SC0-type extensional shearbands suggest the following: (1) SC0-type extensional shear bandsinitially propagate at an orientation parallel to AB and OB (Simpsonand De Paor, 1993, 1997; Klepeis et al., 1999; Law et al., 2004); (2)progressive strain following shear band formation produces rota-tion of shear bands towards the flow plane, generating a meaninclination that is less than the orientation of AB and OB, andtherefore underestimates the coaxial component of the generalflow regime; (3) the most steeply inclined shear band orientationprovides the best direct estimate of Wk within high stain rocks; and(4) shear band orientations within weakly recrystallized rocks mayrecord bulk vorticity more accurately than those measured in high-strain mylonites. Ultimately, SC0-type extensional shear bandsprovide a means of broadly characterizing the non-coaxiality ofgeneral shear.
Acknowledgements
The authors would like to thank the Boise State UniversityGeosciences department for the facilities to conduct our researchand writing. Funding, in part, was provided by the Boise StateUniversity Geosciences Student Research Grant (Will and RoseBurnham Fund). The authors would like to specifically acknowledgeDr Richard D. Law of the Department of Geosciences at VirginiaTech; this manuscript has greatly benefited from his careful reviewsand criticisms. The principal author would like to thank his wifeand family for their encouragement and support during my careerin geology.
Appendix A. Supplemental material
Supplementary information for this manuscript can be down-loaded at doi: 10.1016/j.jsg.2008.04.003.
References
Bailey, C.M., Eyster, E.L., 2003. General shear deformation in the Pinaleno Mountainsmetamorphic core complex, Arizona. Journal of Structural Geology 25, 1883–1893.
Beam, E.C., Fisher, D.M., 1999. An estimate of kinematic vorticity from rotatedelongate porphyroclasts. Journal of Structural Geology 21, 1553–1559.
Bobyarchick, A.R., 1986. The eigenvalues of steady flow in Mohr space. Tectono-physics 122, 35–51.
De Paor, D., 1988. Rf/4 strain analysis using an orientation net. Journal of StructuralGeology 10, 323–333.
Giorgis, S., Tikoff, B., McClelland, W.C., 2003. Removal of the Mid-Cretaceous IdahoBatholith by the crustal-scale, western Idaho shear zone. Geological Society ofAmerica Abstracts with Programs 35 (6), 473.
Hanmer, S., Passchier, C.W., 1991. Shear-sense indicators: a review. GeologicalSurvey of Canada Paper 90-17, 72.
Klepeis, K.A., Daczko, N.R., Clarke, G.L., 1999. Kinematic vorticity and tectonic sig-nificance of superposed mylonites in a major lower crustal shear zone, northernFiordland, New Zealand. Journal of Structural Geology 21, 1385–1405.
Kurz, G.A., 2001, Structure and geochemistry of the Cougar Creek Complex,Northeastern Oregon and West-Central Idaho. MS thesis, Boise State University,Boise, ID, 248 pp.
Law, R.D., Searle, M.P., Simpson, R.L., 2004. Strain, deformation temperatures, andvorticity of flow at the top of the Greater Himalayan Slab, Everest Massif, Tibet.Journal of Structural Geology 161, 305–320.
McFadden, R.R., Snoke, A.W., Barnes, C.G., 2006. Structural and petrologic evolutionof the Bear Peak intrusive complex, Klamath Mountains, California. In: Snoke, A.W., Barnes, C.G. (Eds.), Geological Studies in the Klamath Mountains Province.California and Oregon: A Volume in Honor of William P, 410. Geological Societyof America Special Paper, Irwin, pp. 333–355.
Passchier, C.W., 1984. The generation of ductile and brittle shear bands in a low-angle mylonite zone. Journal of Structural Geology 6, 273–281.
Passchier, C.W., 1987. Stable positions of rigid objects in non-coaxial flow – a studyin vorticity analysis. Journal of Structural Geology 9, 679–690.
Passchier, C.W., Simpson, C., 1986. Porphyroclast systems as kinematic indicators.Journal of Structural Geology 8, 831–843.
Passchier, C.W., Trouw, R.A.J., 1998. Microtectonics, second corrected reprint.Springer-Verlag, Berlin, 289 pp.
Simpson, C., De Paor, D.G., 1993. Strain analysis in general shear zones. Journal ofStructural Geology 15, 1–20.
Simpson, C., De Paor, D.G., 1997. Practical analysis of general shear zones using theporphyroclast hyperbolic distribution method: an example from the Scandi-navian Caledonides. In: Sengupta, S. (Ed.), Evolution of Geological Structures inMicro- to Macro-scales. Chapman and Hall, London, pp. 169–184.
Vallier, T.L., 1995. Petrology of Pre-Tertiary igneous rocks in the Blue MountainsRegion of Oregon, Idaho, and Washington: implications for the geologic evo-lution of a complex island arc. In: Vallier, T.L., Brooks, H.C. (Eds.), The Geology ofthe Blue Mountains Region of Oregon, Idaho, and Washington: Petrology andTectonic Evolution of Pre-Tertiary Rocks of the Blue Mountains Region. USGeological Survey Professional Paper 1438, pp. 125–210.
Wallis, S., 1995. Vorticity analysis and recognition of ductile extension in theSanbagawa belt, SW Japan. Journal of Structural Geology 17, 1077–1093.
Wilson, C.J.L., 1984. Shear bands, crenulations and differentiated layering in ice-mica models. Journal of Structural Geology 6, 303–319.