+ All Categories
Home > Documents > Stuart Briers - Undergraduate Research Paper

Stuart Briers - Undergraduate Research Paper

Date post: 12-Apr-2017
Category:
Upload: stuart-briers
View: 23 times
Download: 1 times
Share this document with a friend
20
Stuart Briers, 40040306, Size: The most important leverage determinant? 1 Queen’s University Management School, Queen’s University Belfast Size: The most important leverage determinant? An empirical analysis of the U.S. Financial Crisis 2007-2009 Stuart Briers 40040306 BSc Finance John Turner Wed, 14 th May 2014 Abstract The Financial Crisis of 2007-2009 was the worst since the 1929 Great Depression and forced firms to reassess their capital structure and exposure to the market. Through this study of the top 1,200 U.S. firms during the period, firm size is assessed as the most important component in dictating leverage. The Pecking Order Theory is tested and analysed as the underlying reason why firm size affects leverage when considering retained earnings and debt. Existing evidence is compared on firm size and the Pecking Order Theory, with conclusions and future areas of research given based on the results of the sample. Previous studies in capital structure have been “hampered by a lack of consistent accounting and market information outside the United States” according to Rajan and Zingales (1995). Therefore, this paper will review capital structure changes in the U.S.A. in order to gain a broad understanding of how firms are structured; allowing inferences to be drawn on the effect firm size has on leverage. The U.S.A. is an ideal country to analyse due to its access to capital markets and as Myers (2001) points out; firms have the “broadest menu of financing choices”.
Transcript

Stuart Briers, 40040306, Size: The most important leverage determinant?

1

Queen’s University Management School,

Queen’s University Belfast

Size: The most important leverage determinant?

An empirical analysis of the

U.S. Financial Crisis 2007-2009

Stuart Briers

40040306

BSc Finance

John Turner

Wed, 14th May 2014

Abstract

The Financial Crisis of 2007-2009 was the worst since the 1929 Great Depression and

forced firms to reassess their capital structure and exposure to the market. Through

this study of the top 1,200 U.S. firms during the period, firm size is assessed as the most

important component in dictating leverage. The Pecking Order Theory is tested and

analysed as the underlying reason why firm size affects leverage when considering

retained earnings and debt. Existing evidence is compared on firm size and the Pecking

Order Theory, with conclusions and future areas of research given based on the results

of the sample.

Previous studies in capital structure have been “hampered by a lack of consistent accounting

and market information outside the United States” according to Rajan and Zingales (1995).

Therefore, this paper will review capital structure changes in the U.S.A. in order to gain a

broad understanding of how firms are structured; allowing inferences to be drawn on the

effect firm size has on leverage. The U.S.A. is an ideal country to analyse due to its access to

capital markets and as Myers (2001) points out; firms have the “broadest menu of financing

choices”.

Stuart Briers, 40040306, Size: The most important leverage determinant?

2

This paper investigates if firm size is the most important component in dictating

leverage and if it is positively correlated to it due to the Pecking Order Theory. This theory,

which was first introduced by Donaldson (1961) and modified by Myers and Majluf (1984),

states that firms use retained earnings until depleted, at which point they issue debt. Equity

will only be used when it is not feasible or sensible to issue more debt. The paper will analyse

if the Pecking Order Theory is relevant in the Financial Crisis or if other theories can be used,

such as the Trade-off Theory (Kraus and Litzenberger 1973), where the firm chooses its

mixture of debt and equity as a function of the present value of both tax shields and

bankruptcy costs. Most researchers in capital structure have acknowledged firm size as a

significant factor affecting leverage, but few have called it the most important leverage

determinant. This paper will analyse evidence to attempt to prove this thesis.

Other factors will also be considered including tangibility of assets, market-to-book

value and profitability. The Financial Crisis of 2007-2009 has been described as the worst

since the Great Depression by the IMF1, but due to publishing lags, little is known about how

firm size affected capital structure during this time. Miglo (2013) points out its importance as

the crisis “forced financial economists to look critically at capital structure theory because the

problems faced by many companies stemmed from their financing policies”. This paper will

attempt to fill this gap in literature by showing that the size of a firm has the effect to

significantly reduce investment (i.e. leverage see fig. 7a) during a crisis when financial

institutions cut lending. This theory is very clear in the 2007-2009 Financial Crisis.

After the abstract and introduction, the following section discusses existing literature

on firm size and its importance in determining leverage. Reasons for its effect on leverage are

given by different researchers and also existing evidence on the strength of the Pecking Order

Theory. Other variables are also considered.

1 The Guardian: see http://www.theguardian.com/business/2008/apr/10/useconomy.subprimecrisis

Stuart Briers, 40040306, Size: The most important leverage determinant?

3

In the data section, the regressions to be investigated are listed along with important

points and omissions, such as excluding financial firms. Each variable is defined here

because no standardised approach exists to measure the variables, especially leverage.

In the results section, the Pecking Order Theory is shown to exist as when retained

earnings fell, leverage rose for each of the three periods. However it cannot explain why in

2009, the top 500 firms on average continued to accumulate retained earnings yet increase

their leverage ratios. In this scenario, bankruptcies more than doubled since 2007 (fig. 6) and

credit was severely restricted by lenders (fig. 7). Potentially, the trade-off theory is evident

here due to higher financial distress costs in the economy, lending increased to the very top

firms. These firms can select their leverage ratios as they see fit. The results also show that in

8/10 quintiles leverage has increased in 2012 beyond pre-crisis levels. This is a worrying sign

because the advent of cheap credit fuelled a boom in securitisation which in turn gave birth to

the crisis. Financial institutions and lawmakers must therefore ensure sound regulation exists

to avert another crisis so soon (a double-dip recession is still possible). Firm size has a greater

impact on leverage for smaller firms and an insignificant impact on the largest 200, showing

that other variables need to be considered. Tangibility of assets and market-to-book value are

highly significant for all periods, with beta and profitability being significant in only 2012.

The conclusion gives important results obtained by the analysis of the sample. In

particular, firm size is important depending on the industry, the stage of the business cycle

and its importance in the economy when analysing leverage. More research is required based

on the 2007-2009 Financial Crisis because researchers have yet to discover the majority of

the variables affecting capital structure, as measured by R2.

I) Literature review

Many factors have been argued to affect capital structure and leverage since the initial

work of Modigliani and Miller in 1958. This literature review will focus on the importance of

Stuart Briers, 40040306, Size: The most important leverage determinant?

4

firm size and other major factors’ relationship with leverage, as well as analysing the strength

of the Pecking Order Theory in determining capital structure.

Rajan and Zingales looked at G7 countries during the late 1980s and found that firm

size was highly significant and positive as “informational asymmetries between insiders in a

firm and the capital markets are lower for large firms”. Marsh (1982) considered the U.K. (a

similar common-law economy) and agreed on the significance of firm size between debt and

equity issuers adding “smaller companies, those with few fixed assets [low tangibility of

assets], and those with greater bankruptcy risk are more likely to issue equity”. Chaplinsky

and Niehaus (1993) found firm size to be the only significant variable.

Opinions of researchers have been divided on the direction of the sign in the firm

size to leverage relationship. Friend and Hasbrouck (1988) find a positive relationship on

the grounds that larger firms have better access to credit markets, whilst Chaplinsky and

Niehaus find a negative relationship. The small firm effect is in existence according to

Titman and Wessels (1988), who state that small firms pay more than large firms to issue

equity and hence would prefer debt [a negative relationship]. Another reason could possibly

be due to “high transaction costs small firms face when issuing long-term financial

instruments”. The “size effect, if it exists, affects mainly the very small firms”. It should be

noted that some researchers find no significant difference for firm size, for example Kester’s

(1986) 1982-83 U.S. study.

Many analysts advocate other significant variables. Rajan and Zingales found that

firms moved towards debt financing and away from capital gains (retained earnings) due to

the tax advantage that debt has. The U.S. has the highest corporation tax rates in the world2.

Whilst Harris and Raviv (1991) found the effect of management-friendly bankruptcy laws to

be important; when there is a high probability of bankruptcy, firm leverage will decrease. In

2 See http://www.kpmg.com/global/en/services/tax/tax-tools-and-resources/pages/corporate-tax-rates-table.aspx

Stuart Briers, 40040306, Size: The most important leverage determinant?

5

relation to U.S.A, it is harder for firms to go bankrupt due to Chapter 11 (U.S. Code),

allowing these firms to take on more leverage with softer penalties. The U.S.A. has highly

diffuse ownership, as shown by La Porta et al. (1997). Therefore, according to Zwiebel

(1996), managers will take on debt to commit to paying out future cash flows, making the

firm unattractive to raiders in relation to the takeover market. He makes the important point

that “for debt to restrict managers credibly … cash in hand must not be large enough to pay

off debt when a bad investment is undertaken”. Myers (1997) has pointed out that growth

(market-to-book value) is an important factor; “highly levered companies are more likely to

pass up investment opportunities”, believing a correlation exists between growth rates and

equity financing (in turn decreasing leverage). Titman and Wessels note “firms with high

market values relative to their book values have higher borrowing capacities and hence have

higher debt levels relative to their book values.” Profitability has been suggested by Myers

and Majluf (1984) as imperative “because firms will prefer to finance with internal funds

rather than debt”, suggesting a negative relationship between leverage and profitability. This

is disputed by Jensen (1986), who finds a positive relationship determined by an effective

market for corporate control “which forces firms to commit to paying out cash by levering

up.”

Much debate has ensued about the extent and relevance of the Pecking Order

Theory in recent times. In a study by Myers (1984) on non-financials from 1973-1982,

“internally generated cash [retained earnings] covered on average 62% of capital

expenditures and net new stock issues were never more than 6% of external financing”. This

shows a clear reliance on internal finance and debt, supporting the theory. Managerial

capitalists agree, stating “firms’ reliance on internal finance as a by-product of the separation

of ownership and control” (Myers 1984). Berle and Means add professional managers do not

wish to be subject to the discipline of capital markets. Titman and Wessels find “increases in

Stuart Briers, 40040306, Size: The most important leverage determinant?

6

the market value of equity, due to an increase in operating income, are not completely offset

by an increase in the firm’s borrowing” [showing reluctance to go external]. The modified

Pecking Order Theory recognises “as the firm goes up pecking order: it faces higher odds of

incurring costs of financial distress, and higher odds that future positive-NPV projects will be

passed by because the firm will be unwilling to finance them by issuing common stock”

(Myers, 1984). In Chaplinsky and Niehaus’ study, leverage is found to decrease as internal

funds increase [in favour of Pecking Order Theory as retained earnings are used to finance

capital expenditure prior to leverage]. Myers and Majluf (1984) also advocate the theory;

citing firms prefer internally generated projects when managers have greater information to

investors due to under-pricing new issues. Using internal funds decreases leverage by

increasing the value of existing equity; “thus, the pecking order hypothesis predicts a

negative relation between leverage and the availability of internal funds, ceteris paribus.”

Korajczyk et al. (1990) look at how equity issues affect stock prices but find no proof

of the pecking order theory. The theory suggests “one might expect the debt/equity ratio to

rise before an equity issue” [as debt is cheaper than equity], but Korajczyk et al. find that “the

debt/equity ratio, however measured, falls or remains constant in the two years prior to an

equity issue”. Myers criticises the theory in his 2001 paper citing the agency problem, as it

assumes managers act in the interests of existing shareholders to maximise the value of

existing shares. This does not always occur due to managers’ selfish gains and pet projects.

An alternative theory is the Trade-off Theory, which argues that leverage depends on

the present value of both non-debt tax shields and bankruptcy costs. “DeAngelo and Masulis

(1980) argue that the greater the level of non-debt tax shields, the lower is the tax benefit of

additional leverage. Thus, [ceteris paribus] firms with higher non-debt tax shields are

expected to receive lower tax benefits from issuing debt”.

Stuart Briers, 40040306, Size: The most important leverage determinant?

7

II) Data

The data has been sourced from Thomson One Banker using a sample at three time

periods: 2006 (pre-crisis), 2009 (mid-crisis) and 2012 (post-crisis). The rationale behind this

is to analyse how firm size and other variables influence leverage levels. The first two

regressions are leverage = β0 + β1(firm size) and leverage = β0 + β1(weight of debt)

respectively. To analyse other variables, three OLS regressions are used (one for each sample

period), defined as: leverage = β0 + β1(market β) + β2(tangibility of assets) + β3(market-to-

book value) + β4(firm size) + β5(profitability). This regression is similar to the Rajan and

Zingales regression. The data will be analysed using Microsoft Excel and Stata. Many other

variables appear to affect capital structure (for example, see Baxter and Cragg’s (1970) model

which examined over 14 independent variables) but a balance must be found between data-

mining and not omitting relevant variables. Before proceeding further, the variables need to

be defined due to non-standardised approaches of measurement. This is shown in Table I:

Table I: Variables & Measurement

Variable Definition Measure

Leverage Ratio of firm’s total debt to its total assets 𝑇𝑜𝑡𝑎𝑙 𝐷𝑒𝑏𝑡

𝑇𝑜𝑡𝑎𝑙 𝐴𝑠𝑠𝑒𝑡𝑠

Market

Beta

A measure of the sensitivity of a stock’s price

to the movement of S&P 500 β of regression:

y = α + βx

Tangibility

of Assets

Assets that have a physical form 𝑇𝑜𝑡𝑎𝑙 𝐹𝑖𝑥𝑒𝑑 𝐴𝑠𝑠𝑒𝑡𝑠

𝑇𝑜𝑡𝑎𝑙 𝐴𝑠𝑠𝑒𝑡𝑠

Market-to-

Book Value

A proxy for investment: under/overvalued

firm. Higher MtB = investor expectation of

higher value creation of assets

𝑀𝑎𝑟𝑘𝑒𝑡 𝑐𝑎𝑝𝑖𝑡𝑎𝑙𝑖𝑠𝑎𝑡𝑖𝑜𝑛

𝑇𝑜𝑡𝑎𝑙 𝐴𝑠𝑠𝑒𝑡𝑠 − 𝑑𝑒𝑝𝑟𝑒𝑐𝑖𝑎𝑡𝑖𝑜𝑛

Firm Size Ln of net sales (proxy for firm size) Natural Log of Net Sales

Profitability Return on Assets 𝑁𝑒𝑡 𝐼𝑛𝑐𝑜𝑚𝑒

𝑇𝑜𝑡𝑎𝑙 𝐴𝑠𝑠𝑒𝑡𝑠

Source: Thomson One Banker

Many different measures of leverage exist, making it difficult to compare studies. For

example, Crutchley and Hansen (1989) measure leverage as long-term debt relative to outside

funds, whereas Friend and Hasbrouck use total debt divided by total assets, which this paper

Stuart Briers, 40040306, Size: The most important leverage determinant?

8

will use (where it is assumed assets are not offset by non-debt liabilities as Rajan and

Zingales note). The definition of leverage is so important that Rajan and Zingales devote an

entire section analysing it.

The sample is of the 1,200 largest U.S. firms ranked by market capitalization. An

important omission from the data is financial institutions (which have been excluded via their

GICS code – see A1), due to the existence of investor insurance schemes such as deposit

insurance (Rajan and Zingales) which would artificially distort the figures towards debt

prudence (also excluded by Friend & Hasbrouck). Bank bailouts would also have distorted

the figures. The sample considers the largest firms, so any statistical inferences may not be

relevant to the whole economy.

The sample data is limited as it does not distinguish between equity built through

retained earnings and equity obtained through stock offerings (used by Rajan and Zingales).

Thomson One Banker uses book values when market values may have been more suitable in

the sample. Titman and Wessels also encountered this problem. Bowman, however, has

demonstrated that “the misspecification due to book values is probably fairly small” so this

limitation is ignored. Rajan and Zingales find consolidated balance sheets are reported by

large firms to conceal debts in subsidiaries when they need to raise external finance. This

could indicate why it is easier for these firms to raise debt. A constant beta is assumed due to

data limitations.

The first hypothesis test asks if a positive relationship exists between firm size and

leverage. A regression between the two will be used to test this, with the significance and

sign direction being important factors. As shown in the literature review, empirical

researchers have had conflicting evidence on this.

Stuart Briers, 40040306, Size: The most important leverage determinant?

9

The second hypothesis test is that large companies have more debt than smaller

companies because they have lower information asymmetries. This will be tested by the

relationship between the weight of debt against firm size.

The final hypothesis investigates if the small firm effect exists in the data. Titman and

Wessels argue small firms prefer debt due to cost of equity. This will be tested using the top

200 firms in the same versus the bottom 200 firms. Finally, the effect of other variables and

industry will be examined.

III) Results & Analysis

Before the data is regressed, heteroskedasticity will need to be eliminated due to the

OLS assumption of constant variance. This is achieved by running robust regressions.

A. Summarising the Data

Table II: Summary Statistics (All 1,200 firms)

Variable Measure 2006 2009 2012

Leverage Mean 0.17 0.17 0.19

Minimum 0.00 0.00 0.00

Top 25% 0.01 0.00 0.02

Median 0.15 0.15 0.18

Top 75% 0.26 0.28 0.30

Maximum 0.80 0.76 0.79

Standard Deviation 0.15 0.16 0.16

Log Sales Mean 7.19 6.99 7.49

Minimum 0.00 2.18 2.46

Top 25% 6.06 5.72 6.39

Median 7.14 7.02 7.41

Top 75% 8.28 8.20 8.49

Maximum 12.76 12.92 12.95

Standard Deviation 1.69 1.81 1.55

Table II shows summary statistics for the data. Across the sample, leverage is similar

for 2006 and 2009, although post-crisis on average it increases. The standard deviation for all

three periods is essentially unchanged, meaning that the overall market is moving together

with leverage shifts, according to the mean and median figures. As is expected, at the height

of the crisis the mean of log sales falls then recovers post-crisis as the market recovers. It

Stuart Briers, 40040306, Size: The most important leverage determinant?

10

should be noted that firm leverage exceeds 2006 levels upon recovery, potentially showing

that investors demand safer securities as a result of a lack of market confidence and possible

contagion. These safer securities would be the top firms by market capitalisation (i.e. firms in

this sample) and would be expected to have lower return.

B. The Relationship between Firm Size and Leverage

Table III: Hypothesis 1: Robust Regression of Log Sales with Leverage

2006 2009 2012

Leverage Leverage Leverage

Log Sales 0.017*** 0.025*** 0.020***

(0.002) (0.002) (0.003)

Constant 0.045*** -0.005 0.035

(0.017) (0.016) (0.022)

Observations 1,200 1,200 1,200

R-squared 0.036 0.078 0.038

The first hypothesis shown in table III confirms a positive relationship exists between

firm size and leverage and is shown above. In this regression, it is assumed no other variables

affect leverage purely to isolate the effect of firm size. Inevitably a low R2 exists but each

coefficient of log sales is significant. The relationship is strongest in 2009 showing as log

sales increased by a unit, leverage increased by 0.025 on average. During the crisis, larger

firms may have taken on more leverage potentially because of greater availability of debt

when cheaper credit was available, coming from risk-averse investors. Large firms may also

conceal debts in subsidiaries, making it easier to raise debt compared to small firms. After

confirming the null of the first hypothesis, the second hypothesis tests log sales with weight

of debt. In particular, the question is asked if larger firms will have a greater proportion of

debt relative to smaller companies.

C. Comparing Firm Size with Weight of Debt

Table IV: Hypothesis 2: Robust Regression of Log Sales with Weight of Debt

2006 2009 2012

Weight of Debt Weight of Debt Weight of Debt

Log Sales 0.039*** 0.044*** 0.048***

(0.003) (0.003) (0.004)

Constant -0.002 -0.035 -0.054

(0.025) (0.025) (0.033)

Stuart Briers, 40040306, Size: The most important leverage determinant?

11

Observations 1,200 1,200 1,200

R-squared 0.084 0.114 0.094

Once again log sales are highly significant across all three periods explaining around

10% on average of the variation of the weight of debt. The null hypothesis here is that firm

size and weight of debt should be significant and positively correlated. This indeed occurs in

all three periods indicating that the largest firms do take on greater debt. The main reason for

this is down to lower information asymmetries (and greater risk for smaller firms). Despite

being statistically significant, this relationship, however, may not be practically significant as

Apple (the largest sample firm) actually has no debt! Hypothesis 3 deconstructs firm size into

the top 200 and bottom 200 firms in the sample using to leverage as the dependent variable.

D. A Closer Analysis of Firm Size

Table V: Hypothesis 3: Robust Regression of Log Sales and Leverage at Extreme Points

2006 2009 2012

Top 200 Bottom 200 Top 200 Bottom 200 Top 200 Bottom 200

Leverage Leverage Leverage

Log Sales -0.006 0.039*** 0.005 0.042*** -0.004 0.040***

(0.008) (0.007) (0.007) (0.012) (0.009) (0.013)

Constant 0.225*** -0.067* 0.143** -0.079 0.247*** -0.080

(0.074) (0.039) (0.065) (0.052) (0.086) (0.078)

Observations 200 200 200 200 200 200

R-squared 0.005 0.107 0.003 0.082 0.001 0.044

The new regression segregating larger and smaller firms yields very different results.

Firm size is statistically insignificant for the top 200 firms and extremely significant for firms

ranked 1000-1200 in the sample. For large firms, their size plays no real part in determining

leverage. Titman and Wessels argue smaller firms face higher transaction costs when issuing

equity so would prefer debt which occurs here as the coefficients are much higher for small

firms in each period also indicating the existence of the small firm effect. Incidentally, firm

size plays essentially no role in determining leverage for the top 200 firms as seen by the R2

which is a major finding.

E. Incorporating Industry Differences with Firm Size

Stuart Briers, 40040306, Size: The most important leverage determinant?

12

Table VI: Robust Regression of Log Sales with Leverage according to Industry

2006 2009 2012 2006 2009 2012

Leverage

GICS Codes Energy (10) Consumer Staples (30)

Log Sales -0.001 0.000 -0.012 0.012 0.029*** 0.011

(0.007) (0.007) (0.008) (0.008) (0.006) (0.012)

Constant 0.195*** 0.165*** 0.321*** 0.091 -0.020 0.124

(0.054) (0.061) (0.067) (0.071) (0.049) (0.101)

Observations 104 74 99 73 80 78

R-squared 0.000 0.000 0.026 0.023 0.170 0.015

GICS Codes Healthcare (35) Information Technology (45)

Log Sales 0.024*** 0.025*** 0.037*** 0.012*** 0.021*** 0.020***

(0.005) (0.005) (0.009) (0.004) (0.004) (0.005)

Constant -0.030 -0.022 -0.081 0.007 -0.056** -0.05

(0.033) (0.035) (0.061) (0.028) (0.025) (0.031)

Observations 112 151 133 219 218 239

R-squared 0.122 0.116 0.125 0.020 0.085 0.061

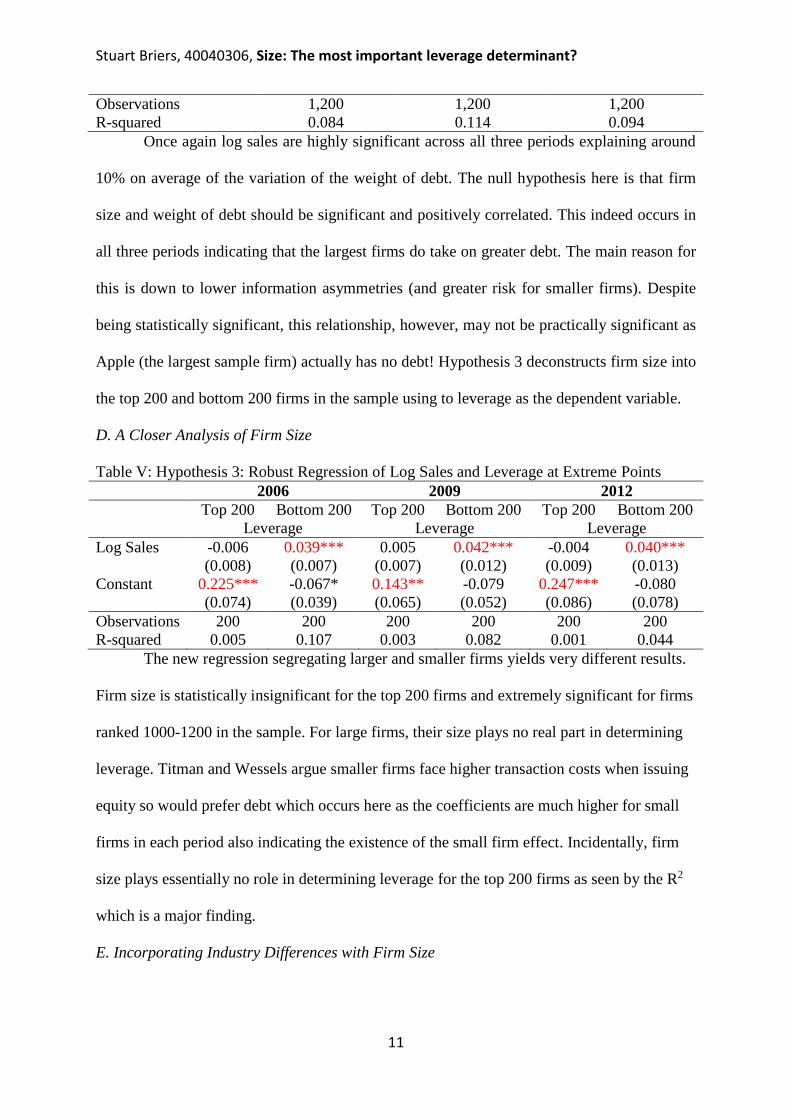
In the above regressions leverage is once again regressed with log sales. Only half of

the industries are reported purely to show industry differences. The number of observations

differs because the sample selects the largest firms each year, so some firms may fall out or

fall in to the sample. Firm size plays an extremely insignificant role in the Energy sector

possibly because they are typically large multinationals proving hypothesis 3 that large firms’

leverage are not influenced by firm size. This is compared to the Healthcare and IT sectors

where it is highly significant. Consumer Staples is a potential area for more investigation as

firm size is insignificant outside the crisis, but played a significant role in leverage during it.

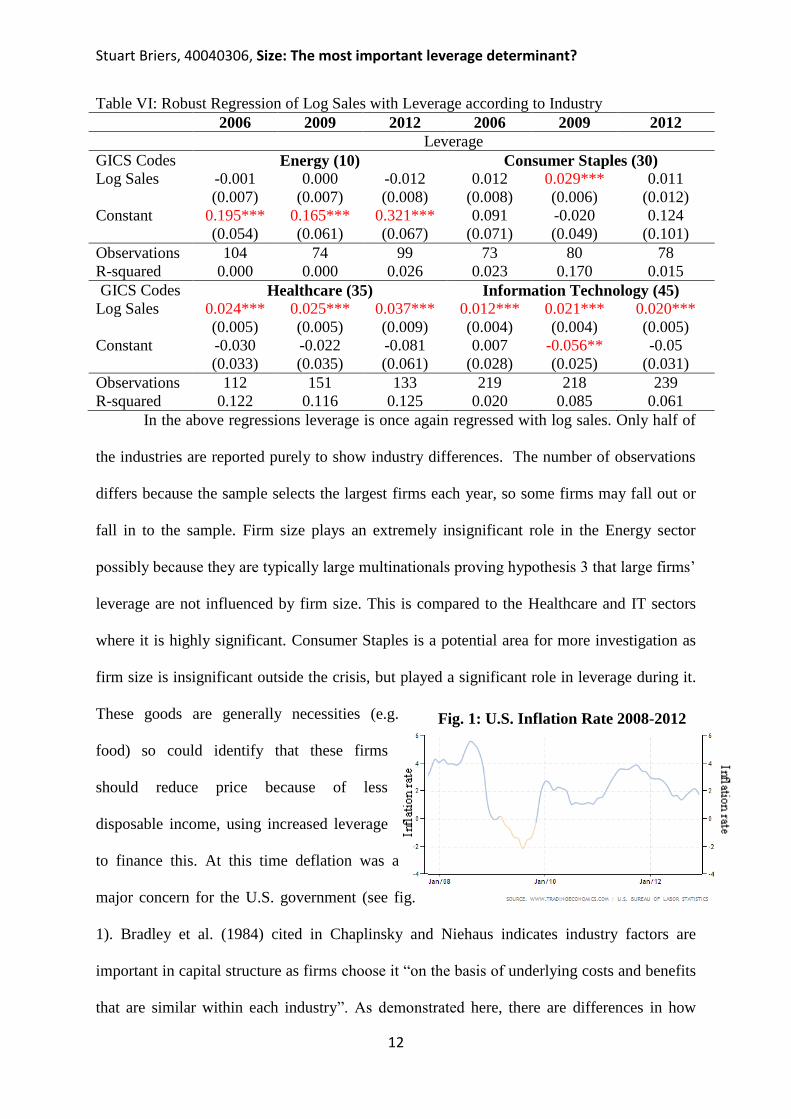
These goods are generally necessities (e.g.

food) so could identify that these firms

should reduce price because of less

disposable income, using increased leverage

to finance this. At this time deflation was a

major concern for the U.S. government (see fig.

1). Bradley et al. (1984) cited in Chaplinsky and Niehaus indicates industry factors are

important in capital structure as firms choose it “on the basis of underlying costs and benefits

that are similar within each industry”. As demonstrated here, there are differences in how

Fig. 1: U.S. Inflation Rate 2008-2012

Stuart Briers, 40040306, Size: The most important leverage determinant?

13

firm size affects capital structure depending on industry.

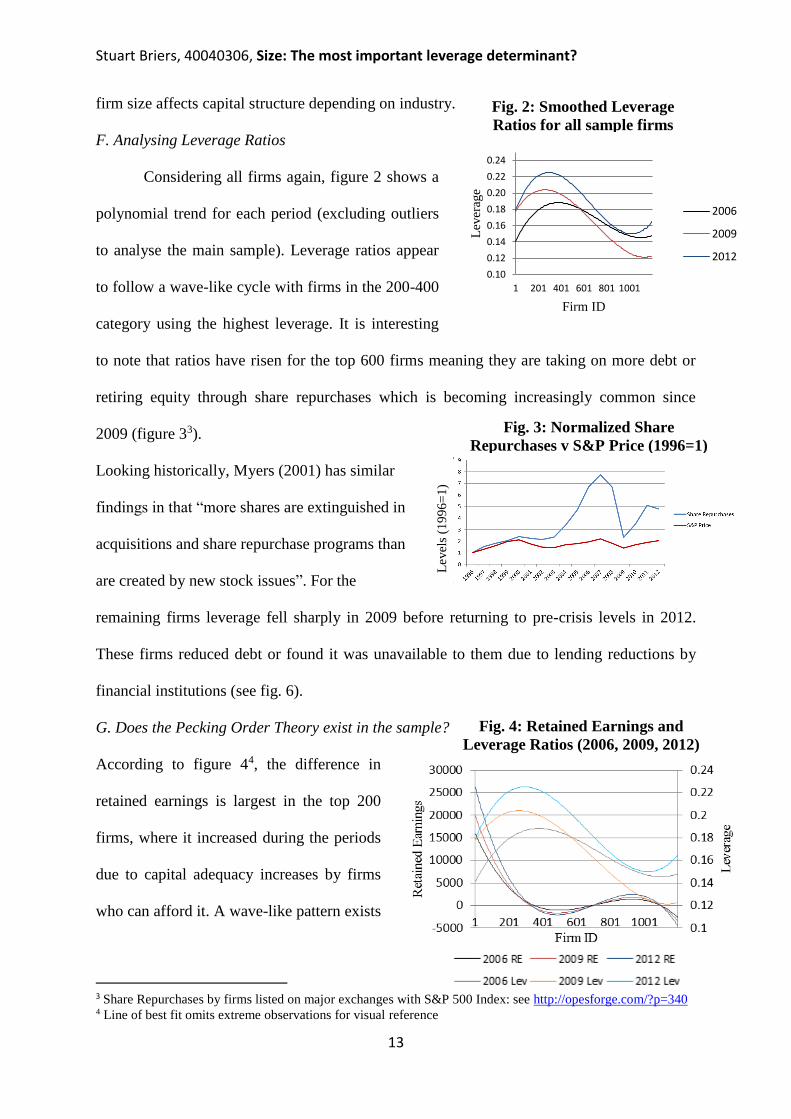
F. Analysing Leverage Ratios

Considering all firms again, figure 2 shows a

polynomial trend for each period (excluding outliers

to analyse the main sample). Leverage ratios appear

to follow a wave-like cycle with firms in the 200-400

category using the highest leverage. It is interesting

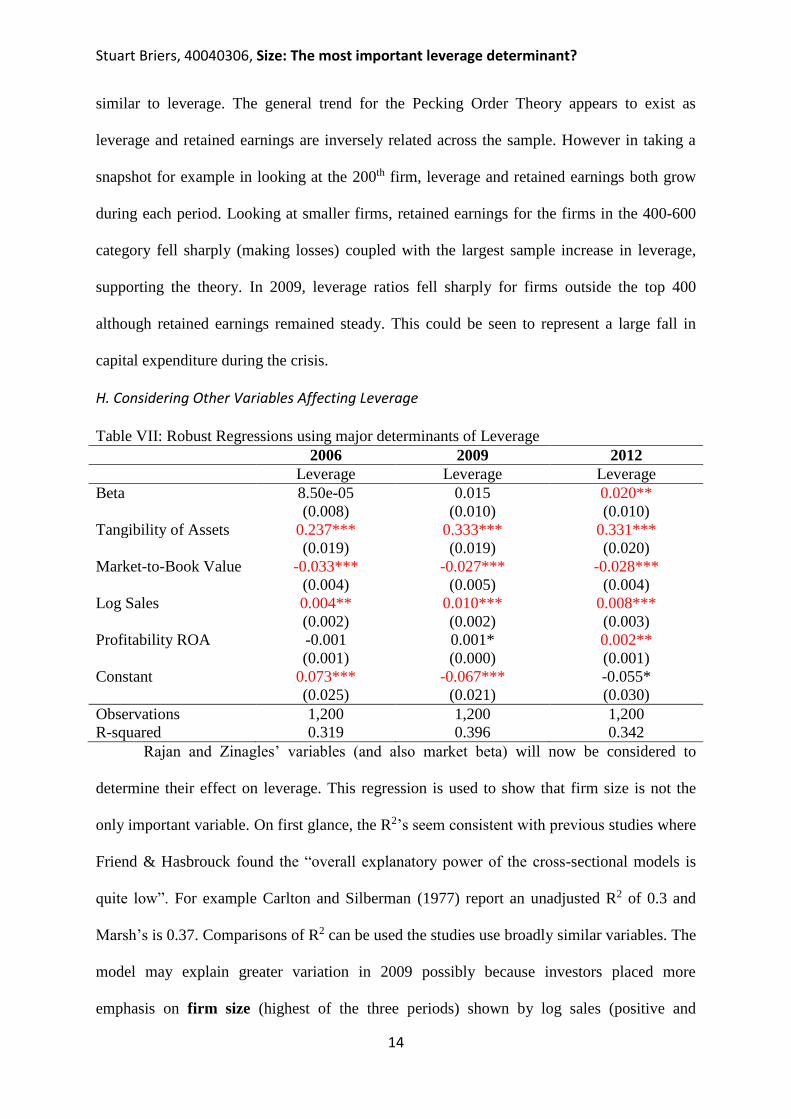
to note that ratios have risen for the top 600 firms meaning they are taking on more debt or

retiring equity through share repurchases which is becoming increasingly common since

2009 (figure 33).

Looking historically, Myers (2001) has similar

findings in that “more shares are extinguished in

acquisitions and share repurchase programs than

are created by new stock issues”. For the

remaining firms leverage fell sharply in 2009 before returning to pre-crisis levels in 2012.

These firms reduced debt or found it was unavailable to them due to lending reductions by

financial institutions (see fig. 6).

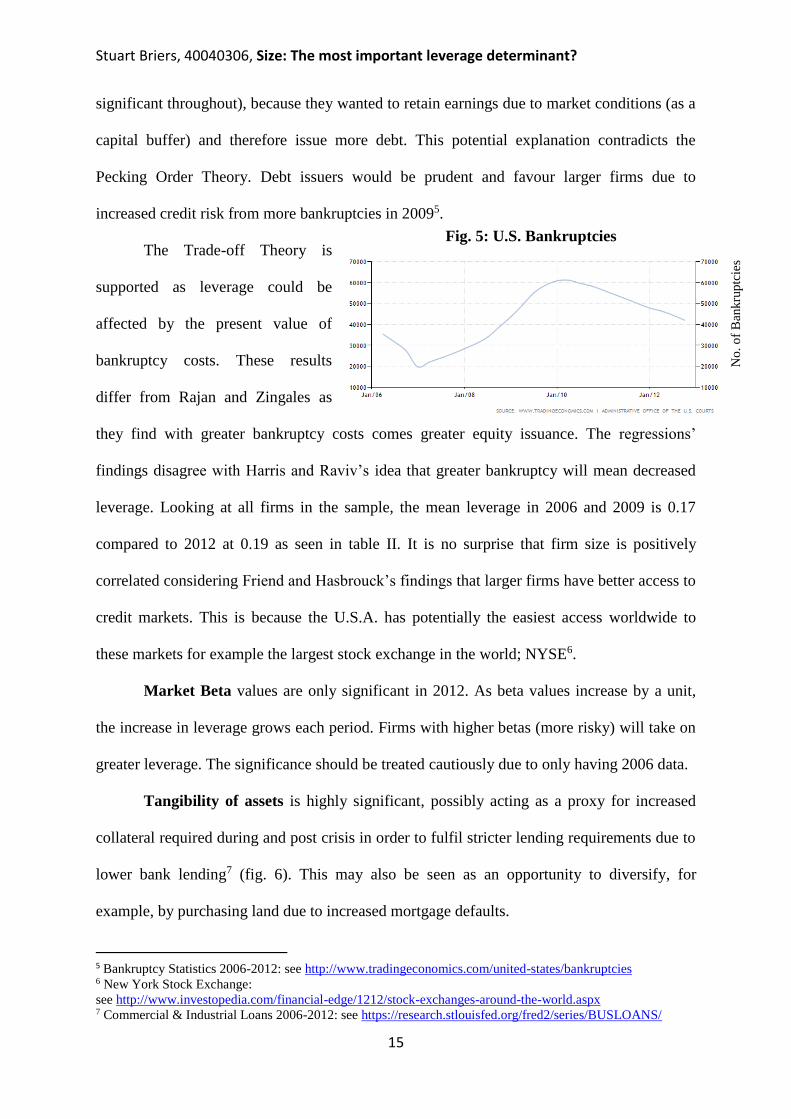
G. Does the Pecking Order Theory exist in the sample?

According to figure 44, the difference in

retained earnings is largest in the top 200

firms, where it increased during the periods

due to capital adequacy increases by firms

who can afford it. A wave-like pattern exists

3 Share Repurchases by firms listed on major exchanges with S&P 500 Index: see http://opesforge.com/?p=340 4 Line of best fit omits extreme observations for visual reference

Fig. 2: Smoothed Leverage

Ratios for all sample firms

Fig. 3: Normalized Share

Repurchases v S&P Price (1996=1)

Fig. 4: Retained Earnings and

Leverage Ratios (2006, 2009, 2012)

0.10

0.12

0.14

0.16

0.18

0.20

0.22

0.24

1 201 401 601 801 1001

Lev

erag

e

Firm ID

2006

2009

2012

Level

s (1

99

6=

1)

Stuart Briers, 40040306, Size: The most important leverage determinant?

14

similar to leverage. The general trend for the Pecking Order Theory appears to exist as

leverage and retained earnings are inversely related across the sample. However in taking a

snapshot for example in looking at the 200th firm, leverage and retained earnings both grow

during each period. Looking at smaller firms, retained earnings for the firms in the 400-600

category fell sharply (making losses) coupled with the largest sample increase in leverage,

supporting the theory. In 2009, leverage ratios fell sharply for firms outside the top 400

although retained earnings remained steady. This could be seen to represent a large fall in

capital expenditure during the crisis.

H. Considering Other Variables Affecting Leverage

Table VII: Robust Regressions using major determinants of Leverage

2006 2009 2012

Leverage Leverage Leverage

Beta 8.50e-05 0.015 0.020**

(0.008) (0.010) (0.010)

Tangibility of Assets 0.237*** 0.333*** 0.331***

(0.019) (0.019) (0.020)

Market-to-Book Value -0.033*** -0.027*** -0.028***

(0.004) (0.005) (0.004)

Log Sales 0.004** 0.010*** 0.008***

(0.002) (0.002) (0.003)

Profitability ROA -0.001 0.001* 0.002**

(0.001) (0.000) (0.001)

Constant 0.073*** -0.067*** -0.055*

(0.025) (0.021) (0.030)

Observations 1,200 1,200 1,200

R-squared 0.319 0.396 0.342

Rajan and Zinagles’ variables (and also market beta) will now be considered to

determine their effect on leverage. This regression is used to show that firm size is not the

only important variable. On first glance, the R2’s seem consistent with previous studies where

Friend & Hasbrouck found the “overall explanatory power of the cross-sectional models is

quite low”. For example Carlton and Silberman (1977) report an unadjusted R2 of 0.3 and

Marsh’s is 0.37. Comparisons of R2 can be used the studies use broadly similar variables. The

model may explain greater variation in 2009 possibly because investors placed more

emphasis on firm size (highest of the three periods) shown by log sales (positive and

Stuart Briers, 40040306, Size: The most important leverage determinant?

15

significant throughout), because they wanted to retain earnings due to market conditions (as a

capital buffer) and therefore issue more debt. This potential explanation contradicts the

Pecking Order Theory. Debt issuers would be prudent and favour larger firms due to

increased credit risk from more bankruptcies in 20095.

The Trade-off Theory is

supported as leverage could be

affected by the present value of

bankruptcy costs. These results

differ from Rajan and Zingales as

they find with greater bankruptcy costs comes greater equity issuance. The regressions’

findings disagree with Harris and Raviv’s idea that greater bankruptcy will mean decreased

leverage. Looking at all firms in the sample, the mean leverage in 2006 and 2009 is 0.17

compared to 2012 at 0.19 as seen in table II. It is no surprise that firm size is positively

correlated considering Friend and Hasbrouck’s findings that larger firms have better access to

credit markets. This is because the U.S.A. has potentially the easiest access worldwide to

these markets for example the largest stock exchange in the world; NYSE6.

Market Beta values are only significant in 2012. As beta values increase by a unit,

the increase in leverage grows each period. Firms with higher betas (more risky) will take on

greater leverage. The significance should be treated cautiously due to only having 2006 data.

Tangibility of assets is highly significant, possibly acting as a proxy for increased

collateral required during and post crisis in order to fulfil stricter lending requirements due to

lower bank lending7 (fig. 6). This may also be seen as an opportunity to diversify, for

example, by purchasing land due to increased mortgage defaults.

5 Bankruptcy Statistics 2006-2012: see http://www.tradingeconomics.com/united-states/bankruptcies 6 New York Stock Exchange:

see http://www.investopedia.com/financial-edge/1212/stock-exchanges-around-the-world.aspx 7 Commercial & Industrial Loans 2006-2012: see https://research.stlouisfed.org/fred2/series/BUSLOANS/

Fig. 5: U.S. Bankruptcies

No

. o

f B

ankru

ptc

ies

Stuart Briers, 40040306, Size: The most important leverage determinant?

16

Market-to-book values are consistently

significant and negative adding to the argument that

“highly levered companies are more likely to pass up

investment opportunities” as noted earlier by Myers.

These firms may have high market values in some cases

and hence higher borrowing capacities (Titman and Wessels) but the restricted lending during

the crisis by financial institutions may have meant debt levels did not rise accordingly.

The effect of profitability on leverage is somewhat ambiguous, because pre-crisis it

is insignificant and negative compared to post-crisis being significant and positive. Myers

and Majluf found a negative relationship suggesting firms prefer to use retained earnings

before debt however like Jensen a positive relationship exists in this sample although it is

quite small.

I. Visual Analysis of Main Leverage Determinants8

Fig. 7a-f: Variables from Table VII in graphical form

Fig. 7a: Leverage Fig. 7b: Beta

Fig. 7c: Tangibility of Assets Fig. 7d: Market-to-Book Value

8 Figure Title is the vertical axis label and Firm ID Decile (Largest to Smallest) is the horizontal axis label

0

0.05

0.1

0.15

0.2

0.25

1 2 3 4 5 6 7 8 9 10

0

0.2

0.4

0.6

0.8

1

1.2

1.4

1 2 3 4 5 6 7 8 9 10

0

0.2

0.4

0.6

0.8

1 2 3 4 5 6 7 8 9 100

0.5

1

1.5

2

2.5

1 2 3 4 5 6 7 8 9 10

Fig. 6: U.S. Commercial and Industrial Loans

Stuart Briers, 40040306, Size: The most important leverage determinant?

17

Fig. 7e: Firm Size (Log Sales) Fig. 7f: Profitability (ROE9)

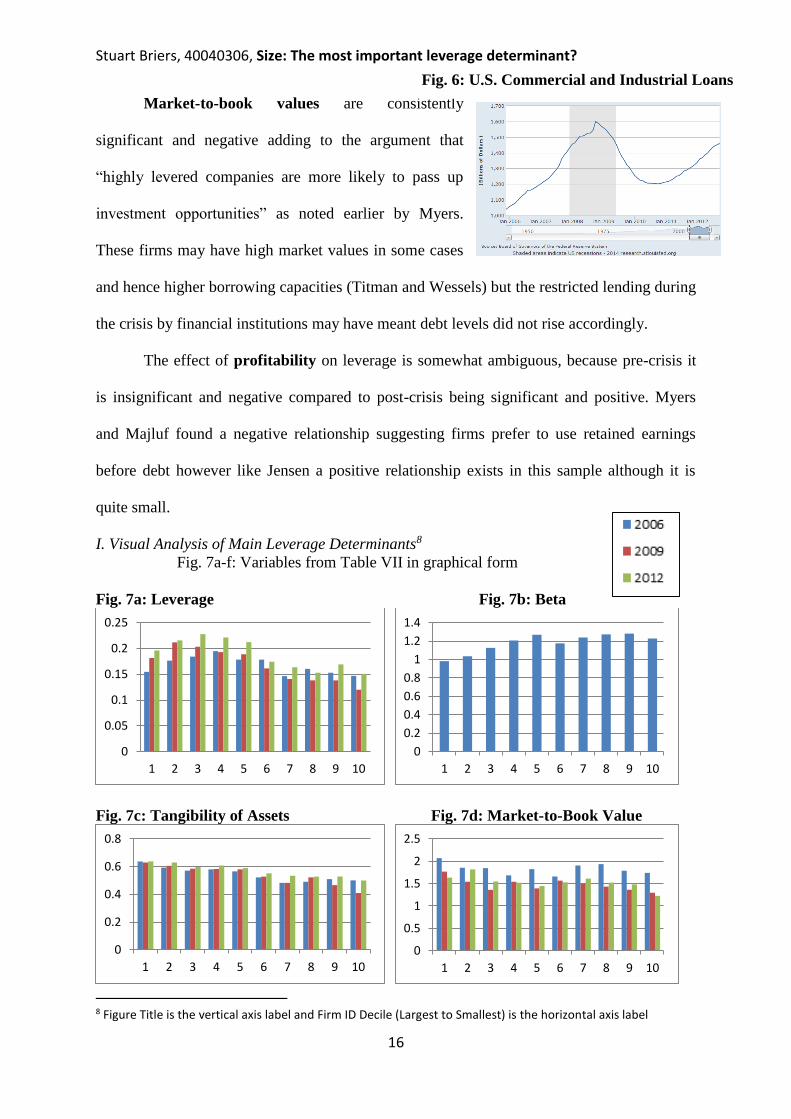
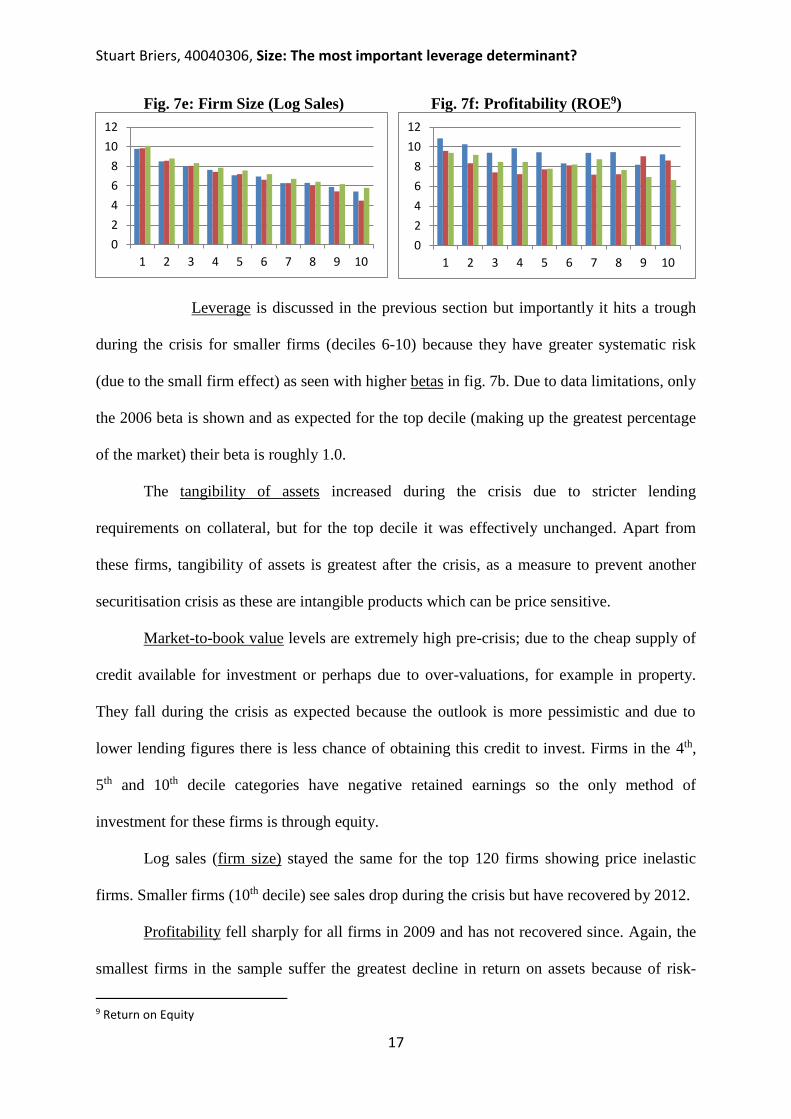
Leverage is discussed in the previous section but importantly it hits a trough

during the crisis for smaller firms (deciles 6-10) because they have greater systematic risk

(due to the small firm effect) as seen with higher betas in fig. 7b. Due to data limitations, only

the 2006 beta is shown and as expected for the top decile (making up the greatest percentage

of the market) their beta is roughly 1.0.

The tangibility of assets increased during the crisis due to stricter lending

requirements on collateral, but for the top decile it was effectively unchanged. Apart from

these firms, tangibility of assets is greatest after the crisis, as a measure to prevent another

securitisation crisis as these are intangible products which can be price sensitive.

Market-to-book value levels are extremely high pre-crisis; due to the cheap supply of

credit available for investment or perhaps due to over-valuations, for example in property.

They fall during the crisis as expected because the outlook is more pessimistic and due to

lower lending figures there is less chance of obtaining this credit to invest. Firms in the 4th,

5th and 10th decile categories have negative retained earnings so the only method of

investment for these firms is through equity.

Log sales (firm size) stayed the same for the top 120 firms showing price inelastic

firms. Smaller firms (10th decile) see sales drop during the crisis but have recovered by 2012.

Profitability fell sharply for all firms in 2009 and has not recovered since. Again, the

smallest firms in the sample suffer the greatest decline in return on assets because of risk-

9 Return on Equity

0

2

4

6

8

10

12

1 2 3 4 5 6 7 8 9 100

2

4

6

8

10

12

1 2 3 4 5 6 7 8 9 10

Stuart Briers, 40040306, Size: The most important leverage determinant?

18

averse investors who favour safer (larger) firms; although due to financial amnesia10 the

situation will probably soon return to pre-crisis levels. Zwiebel finds firms with better

investment opportunities (high market-to-book values) and high profitability to have less

leverage due to requiring less debt to avert a takeover. This generally occurs in this sample

particularly towards the top firms.

IV) Conclusion

The results show that firm size is the most important leverage determinant however it

depends on market capitalisation and industry ranking. Firm size was found to be positively

correlated with leverage and the weight of debt, in each case being highly significant. Log

sales were relatively sticky during the three periods for the top decile showing price inelastic

firms. Smaller firms (10th decile) seen log sales drop during the crisis but recovering by 2012.

The firm needs to be considered within its relative placing in the economy as the very top

firms find firm size is insignificant in affecting leverage, whereas the bottom firms of the

sample find firm size plays a highly significant role in affecting leverage.

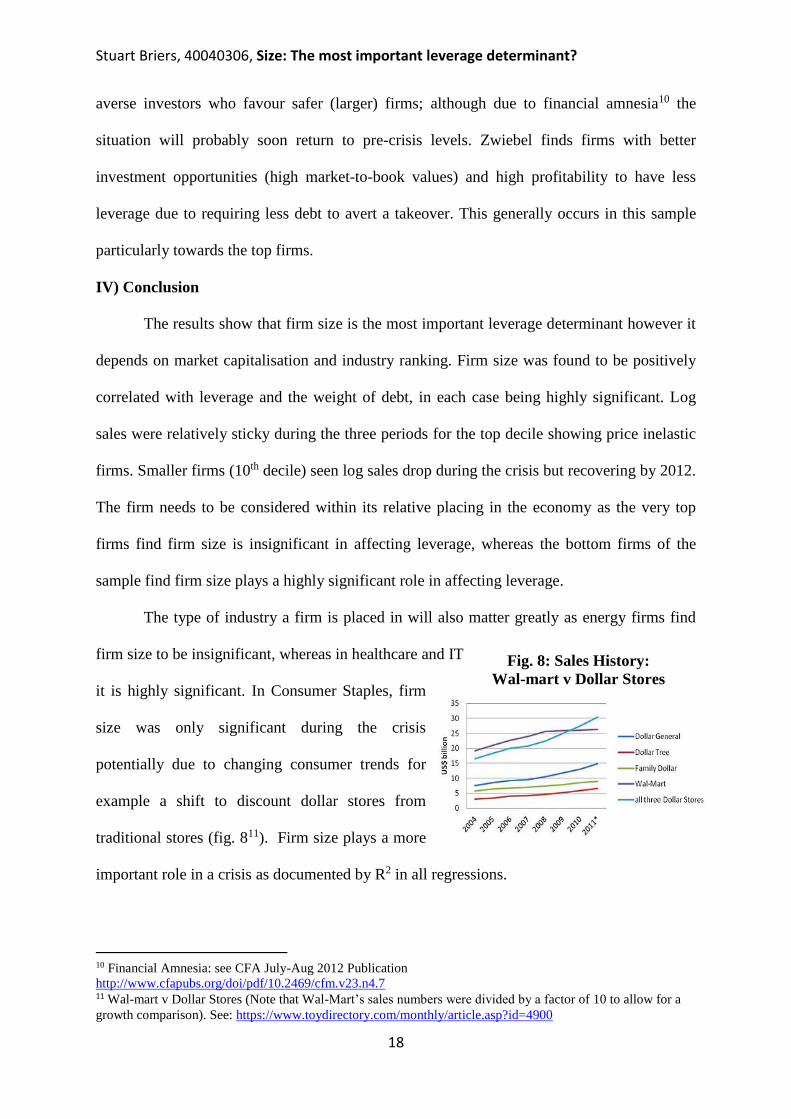
The type of industry a firm is placed in will also matter greatly as energy firms find

firm size to be insignificant, whereas in healthcare and IT

it is highly significant. In Consumer Staples, firm

size was only significant during the crisis

potentially due to changing consumer trends for

example a shift to discount dollar stores from

traditional stores (fig. 811). Firm size plays a more

important role in a crisis as documented by R2 in all regressions.

10 Financial Amnesia: see CFA July-Aug 2012 Publication

http://www.cfapubs.org/doi/pdf/10.2469/cfm.v23.n4.7 11 Wal-mart v Dollar Stores (Note that Wal-Mart’s sales numbers were divided by a factor of 10 to allow for a

growth comparison). See: https://www.toydirectory.com/monthly/article.asp?id=4900

Fig. 8: Sales History:

Wal-mart v Dollar Stores

Stuart Briers, 40040306, Size: The most important leverage determinant?

19

The Pecking Order Theory holds in that for the top 400 firms, retained earnings and leverage

are inversely related. However for smaller firms the

pattern is less clear including some firms who have

negative retained earnings (made losses) and are therefore

forced to use debt. Other variables such as market-to-book

values are significant and are high pre-crisis showing

strong investment but dropped during the crisis, showing a

pessimistic view for firms in the smallest quintile as lending decreased12 (fig. 9) coupled with

increased bankruptcies during crisis. Leverage ratios on the whole have increased since the

crisis but fell sharply during the crisis for smaller firms as the availability of credit dried up.

Greater research is required on this matter due to the low explanatory power of

empirical models so potential inclusions for future models could be research and

development, availability of internal funds (both which Chaplinsky and Niehaus found

significant), bank lending and also use of bankruptcy statistics.

V) Appendix

A1. GICS Codes

GICS Code Industry GICS Code Industry

10 Energy 35 Healthcare

15 Material 40 Financials

20 Industrials 45 Information Technology

25 Consumer Discretionary 50 Telecommunications Services

30 Consumer Staples 55 Utilities

A2. Notations

NB: In all regressions, coefficients are listed on the top line followed by Standard Errors

(in brackets) below. Statistically significant values denoted by P-values as follows:

*** p<0.01, ** p<0.05, * p<0.1. Those coefficients with p-values of <0.05 are coloured in

red.

Firm ID: Sample firms ranked from 1-1,200 from highest to lowest market capitalization

12 Lending Gap (in billions $): see http://www.cnbc.com/id/101009116

Fig. 9: 2007-2012 Lending Gap

Stuart Briers, 40040306, Size: The most important leverage determinant?

20

VI) References Baxter, N. and Cragg, J. (1970) 'The Issuing of Corporate Securities', Journal of Political Economy, 78(6), pp. 1310-1324.

Berle, A. and Means, G. (1932) The Modern Corporation and Private Property, New York: Harcourt, Brace & World.

Bradley, M., Jarrell, G and Kim, E. (1984) 'On The Existence of an Optimal Capital Structure: Theory and

Evidence', Journal of Finance, 39(3), pp. 857-878.

Bowman, J. (1980) 'The Importance of a Market Value Measurement of Debt in Assessing Leverage', Journal of Accounting

Research, 18(1), pp. 242-254.

Carlton, W. and Silberman, I. (1977) 'Joint Determination of Rate of Return and Capital Structure: An Econometric

Analysis', Journal of Finance, 32(3), pp. 811-821.

Chaplinsky, S. and Niehaus, G. (1993) 'Do Inside Ownership and Leverage Share Common Determinants?', Quarterly

Journal of Business and Economics, 32(4), pp. 51-65.

Crutchley, C. and Hansen, R. (1989) 'A Test of the Agency Theory of Managerial Ownership, Corporate Leverage, and

Corporate Dividends', Financial Management,18(4), pp. 36-46.

Donaldson, G. (1961) Corporate Debt Capacity, Boston: Harvard Graduate School of Business Administration.

DeAngelo, H. and Masulis, R. (1980) ‘Optimal Capital Structure under Corporate and Personal Taxation,’ Journal of

Financial Economics, 8, pp. 3-29.

Friend, I. and Hasbrouck, J. (1988) 'Determinants of Capital Structure', Working Paper, University of Pennsylvania

Harris, M. and Raviv, A. (1991) 'The Theory of Capital Structure', Journal of Finance,46(1), pp. 297-355.

Jensen, M. (1986) 'Agency Cost of Free Cash Flow, Corporate Finance and Takeovers', American Economic Review, 76(2),

pp. 323-329.

Kester, W. (1986) 'Capital and Ownership Structure: A Comparison of United States and Japanese Manufacturing

Corporations', Financial Management, 15(1), pp. 5-16.

Korajczyk, R., Lucas, D. and McDonald, R. (1990) 'Understanding Stock Price Behavior around the Time of Equity Issues',

in Asymmetric Information, Corporate Finance, and Investment. Chicago: University of Chicago Press, pp. 257-278.

Kraus, A. and Litzenberger, R. (1973) 'A State-Preference Model of Optimal Financial Leverage', Journal of Finance, 28(4),

pp. 911-922.

La Porta, R., Lopez-de-Silanes, F., Shleifer, A. and Vishny, R. (1997) 'Legal Determinants of External Finance', Journal of

Finance, 52(3), pp. 1131-50.

Marsh, P. (1982) 'The Choice Between Equity and Debt: An Empirical Study', Journal of Finance, 37(1), pp. 121-144.

Miglo, A. (2013) 'The Capital Structure Theory: Where Do We Stand After Crisis?', Journal of Capital Structure and

Financing, 1(1), pp. 1-32 [Online]. Available

at:https://scholasticahq.com/supporting_files/51009/attachment_versions/51242 (Accessed: 17th April 2014).

Modigliani, F. and Miller, M. (1958) 'The Cost of Capital, Corporation Finance and the Theory of Investment', American

Economic Review, 48(3), pp. 261-297.

Myers, S. (2001) 'Capital Structure', Journal of Economic Perspectives, 15(2), pp. 81-102.

----------- (1984) 'The Capital Structure Puzzle', Journal of Finance, 39(3), pp. 575-592.

----------- and Majluf, N. (1984) 'Corporate Financing and Investment Decisions When Firms Have Information That

Investors Do Not Have', Journal of Financial Economics,13(), pp. 187-221.

Rajan, R. and Zingales, L. (1995) 'What Do We Know about Capital Structure? Some Evidence from International

Data', Journal of Finance, 50(5), pp. 1421-1460.

Titman, S. and Wessels, R. (1988) 'The Determinants of Capital Structure Choice', Journal of Finance, 43(1), pp. 1-19.

Zwiebel, J. (1996) 'Dynamic Capital Structure under Managerial Entrenchment', American Economic Review, 86(5), pp.

1197-1215.


Recommended