58
Study of Assam Tea Value Chains Research Report OCTOBER 2019 Credit : Female workers at a tea Garden of Assam, Wikimedia Commons/Picasa
Study of Assam Tea Value Chains
Research Report
OCTOBER 2019
Cre
dit
: Fe
mal
e w
ork
ers
at
a t
ea G
ard
en o
f A
ssa
m, W
ikim
edia
Co
mm
ons/
Pica
sa
Study of Assam tea value chains Page 2
Acknowledgements
This report has been commissioned by Oxfam Germany and supported by Oxfam Germany and the
German Ministry for Economic Cooperation and Development (BMZ).
It has been authored by the Bureau for the Analysis of Societal Impacts for Citizen information (BASIC).
Study of Assam tea value chains Page 3
1. Introduction
Tea is the second most consumed beverage after water at the global level. Today, world tea consumption
is estimated at 5.5 million tonnes and expands at an average rate of 4.5% per year1. In Europe, the tea
market is mature and per capita consumption has declined over the past decade as competition from
other beverages has intensified (particularly bottled water and soft drinks). In contrast, demand has
increased significantly in most emerging economies, underpinned by the rapid growth in income levels
and the promotion of tea for its health benefits.
India is at the same time the 2nd biggest consumer market with 1.05 million tonnes per year (20% of
global sales)2, the 2nd largest producer with a production of 1.27 million tonnes per year and the 4th
largest exporter of tea in the world3. Assam is the largest tea producing state of India and the largest tea
producing region of the world (producing approximately 51% of India’s tea, and nearly 11% of the world’s
tea) 4. The sector is structured by private tea plantations which have pursued the working system put in
place by the British colonials, with a high degree of inequality and little qualitative change in the working
and the living condition of the millions of workers employed. This situation is further associated with a
highly unequal distribution of value along the tea chain, from workers in plantations down to consumers
in the different markets. However, the opacity and lack of objective numbers on the distribution of value
prevents from understanding the economic dynamics between tea plantations, exporters, importers,
brands and supermarkets, and the correlation with the pressure exercised on workers at the beginning of
the chain.
In this context, this investigation conducted by BASIC (www.lebasic.com/en/) aims at examining how value
is shared along the tea value chain, more specifically estimating historical and projected share of value
received by tea workers in Assam compared to the other actors along the value chain (down to the
consumer) in major foreign consumer markets, with comparisons with the domestic Indian market.
1 FAO, Intergovernmental Group on Tea, Current market situation and medium term outlook, 2018 2 Ibid. 3 Ibid. 4 http://www.teaboard.gov.in/pdf/Press_Release_on_Exports_pdf9752.pdf accessed on 28 March 2019
Study of Assam tea value chains Page 4
Table of contents
1. Introduction 3 2. Global tea value chains 5
a) The global tea market 6 Tea consumption and production 6
b) The global tea value chains 8 3. Assam tea value chains in India 12
a) Tea production in Assam 12 The Indian Tea industry 12 Specificities of the Tea sector in Assam 18
b) Domestic Tea value chains 23 Indian food retail sector 23 Tea consumption in India 24 Distribution of value from production in Assam to consumption in India 25 Leverage for paying living wages/income in the Indian tea sector 28
c) Exported tea value chains 29 Indian tea export market 29 Distribution of value from production in Assam to export from India 29
4. International Assam tea value chains 31 a) Germany 31
German Food retail sector 31 Tea consumption and imports in Germany 32 Distribution of value from production in Assam to consumption in Germany 33 Leverage for paying living wages/income in the German tea sector 35
b) Netherlands 36 Dutch Food retail sector 36 Tea consumption and imports in the Netherlands 37 Distribution of value from production in Assam to consumption in the Netherlands 37 Leverage for paying living wages/income in the Dutch tea sector 39
c) United Kingdom 40 UK Food retail sector 40 Tea consumption in the UK 41 Distribution of value from production in Assam to consumption in the UK 42 Leverage for paying living wages/income in the UK tea sector 44
d) France 45 French Food retail sector 45 Tea consumption in France 46 Distribution of value from production in Assam to consumption in France 47 Leverage for paying living wages/income in the French tea sector 48
e) USA 49 US Food retail sector 49 Tea consumption in the US 50 Distribution of value from production in Assam to consumption in the US 51 Leverage for paying living wages/income in the US tea sector 53
5. Appendix: Objectives, perimeter & methodology 54 a) Objectives 54 b) Research questions & countries 54 c) Methodological approach 54
Conceptual framework 54 Operational framework 56
d) Limitations 57 e) Reading guide for estimates 58
Study of Assam tea value chains Page 5
Abbreviations
APPL Amalgamated Plantations Private Limited
BLF Bought leaf factory
CTC Cut, Tear and Curl
GBP Great Britain Pound Sterling
Ha Hectare
HUL Hindustan Lever Limited
ITA Indian Tea Association
STG Small Tea Grower
TBI Tea Board of India
USD United States Dollar
Study of Assam tea value chains Page 6
2. Global tea value chains
a) The global tea market
Tea consumption and production
Tea drinking originated in China and can be traced back to the mythical Chinese emperor Shen Nung who
supposedly discovered the plant in 2737 BC (and the use was spread during the 3 Kingdoms epoch in 222
AD)5. The Japanese discovered it in the 8th century and it only reached Europe as late as the 16th
century6. Breaking the Chinese monopoly on tea, the British and the Dutch established tea plantations
respectively in India & Sri Lanka, and on Java and Sumatra.7
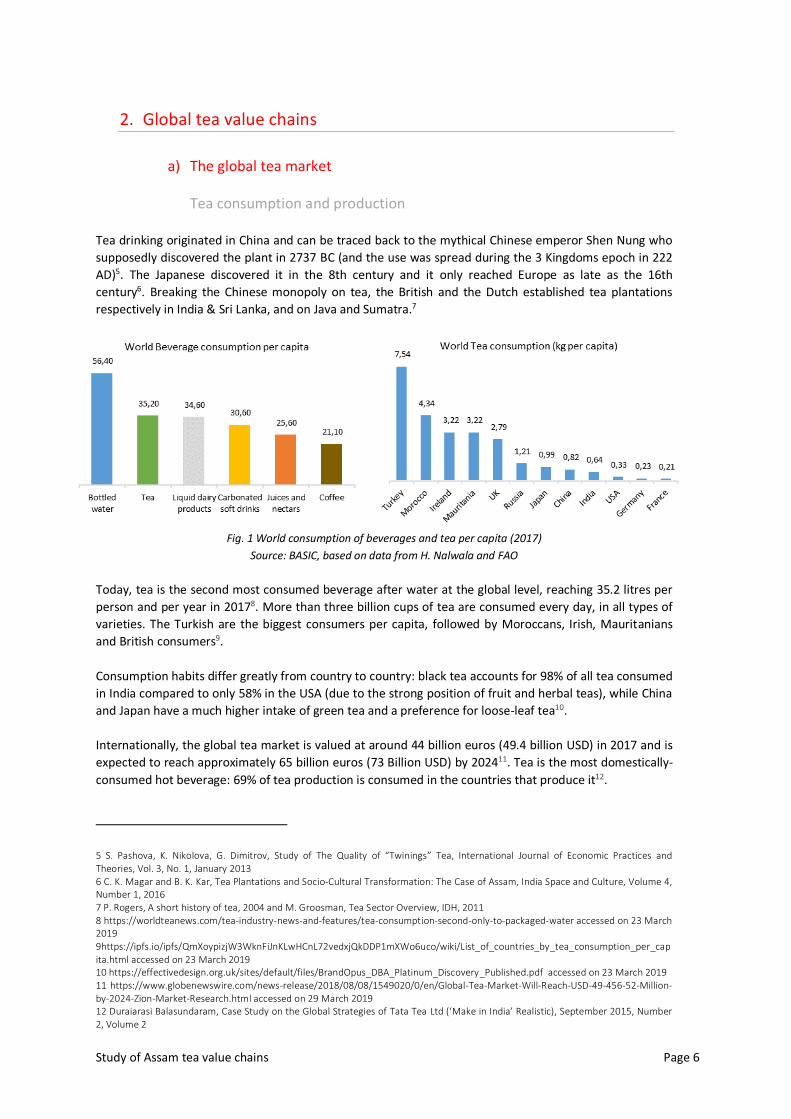
Fig. 1 World consumption of beverages and tea per capita (2017)
Source: BASIC, based on data from H. Nalwala and FAO
Today, tea is the second most consumed beverage after water at the global level, reaching 35.2 litres per
person and per year in 20178. More than three billion cups of tea are consumed every day, in all types of
varieties. The Turkish are the biggest consumers per capita, followed by Moroccans, Irish, Mauritanians
and British consumers9.
Consumption habits differ greatly from country to country: black tea accounts for 98% of all tea consumed
in India compared to only 58% in the USA (due to the strong position of fruit and herbal teas), while China
and Japan have a much higher intake of green tea and a preference for loose-leaf tea10.
Internationally, the global tea market is valued at around 44 billion euros (49.4 billion USD) in 2017 and is
expected to reach approximately 65 billion euros (73 Billion USD) by 202411. Tea is the most domestically-
consumed hot beverage: 69% of tea production is consumed in the countries that produce it12.
5 S. Pashova, K. Nikolova, G. Dimitrov, Study of The Quality of “Twinings” Tea, International Journal of Economic Practices and Theories, Vol. 3, No. 1, January 2013 6 C. K. Magar and B. K. Kar, Tea Plantations and Socio-Cultural Transformation: The Case of Assam, India Space and Culture, Volume 4, Number 1, 2016 7 P. Rogers, A short history of tea, 2004 and M. Groosman, Tea Sector Overview, IDH, 2011 8 https://worldteanews.com/tea-industry-news-and-features/tea-consumption-second-only-to-packaged-water accessed on 23 March 2019 9https://ipfs.io/ipfs/QmXoypizjW3WknFiJnKLwHCnL72vedxjQkDDP1mXWo6uco/wiki/List_of_countries_by_tea_consumption_per_capita.html accessed on 23 March 2019 10 https://effectivedesign.org.uk/sites/default/files/BrandOpus_DBA_Platinum_Discovery_Published.pdf accessed on 23 March 2019 11 https://www.globenewswire.com/news-release/2018/08/08/1549020/0/en/Global-Tea-Market-Will-Reach-USD-49-456-52-Million-by-2024-Zion-Market-Research.html accessed on 29 March 2019 12 Duraiarasi Balasundaram, Case Study on the Global Strategies of Tata Tea Ltd (‘Make in India’ Realistic), September 2015, Number 2, Volume 2
Study of Assam tea value chains Page 7
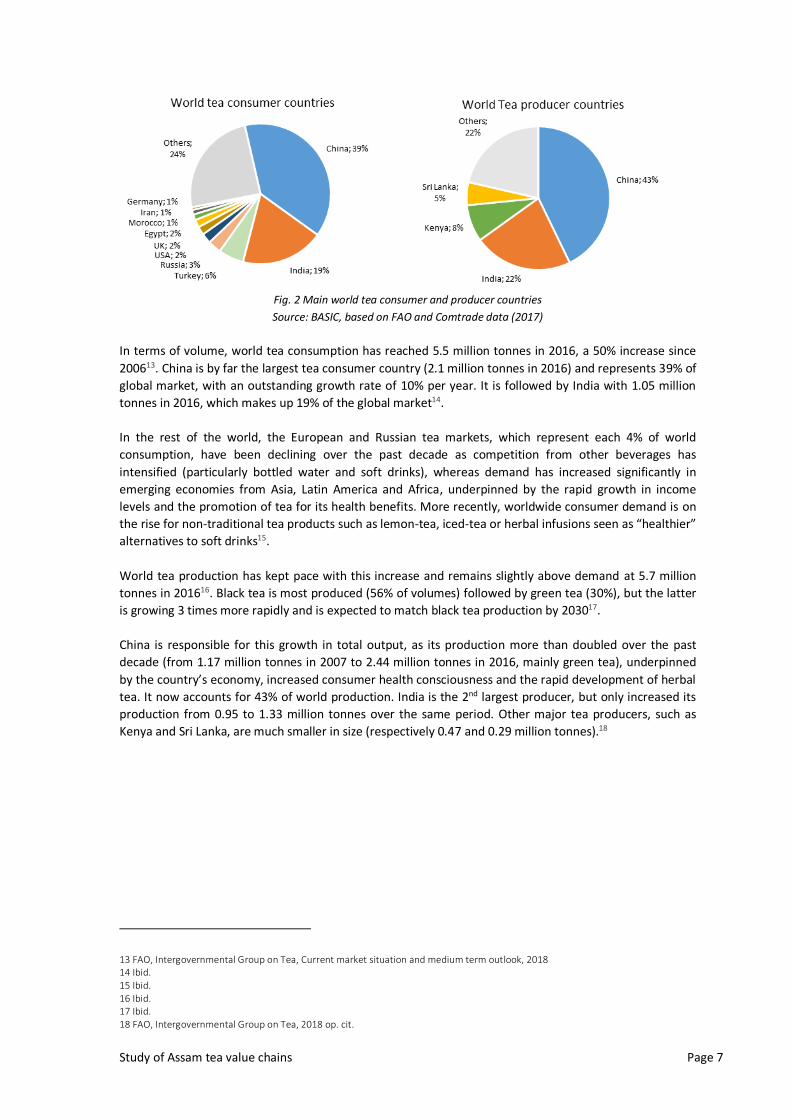
Fig. 2 Main world tea consumer and producer countries
Source: BASIC, based on FAO and Comtrade data (2017)
In terms of volume, world tea consumption has reached 5.5 million tonnes in 2016, a 50% increase since
200613. China is by far the largest tea consumer country (2.1 million tonnes in 2016) and represents 39% of
global market, with an outstanding growth rate of 10% per year. It is followed by India with 1.05 million
tonnes in 2016, which makes up 19% of the global market14.
In the rest of the world, the European and Russian tea markets, which represent each 4% of world
consumption, have been declining over the past decade as competition from other beverages has
intensified (particularly bottled water and soft drinks), whereas demand has increased significantly in
emerging economies from Asia, Latin America and Africa, underpinned by the rapid growth in income
levels and the promotion of tea for its health benefits. More recently, worldwide consumer demand is on
the rise for non-traditional tea products such as lemon-tea, iced-tea or herbal infusions seen as “healthier”
alternatives to soft drinks15.
World tea production has kept pace with this increase and remains slightly above demand at 5.7 million
tonnes in 201616. Black tea is most produced (56% of volumes) followed by green tea (30%), but the latter
is growing 3 times more rapidly and is expected to match black tea production by 203017.
China is responsible for this growth in total output, as its production more than doubled over the past
decade (from 1.17 million tonnes in 2007 to 2.44 million tonnes in 2016, mainly green tea), underpinned
by the country’s economy, increased consumer health consciousness and the rapid development of herbal
tea. It now accounts for 43% of world production. India is the 2nd largest producer, but only increased its
production from 0.95 to 1.33 million tonnes over the same period. Other major tea producers, such as
Kenya and Sri Lanka, are much smaller in size (respectively 0.47 and 0.29 million tonnes).18
13 FAO, Intergovernmental Group on Tea, Current market situation and medium term outlook, 2018 14 Ibid. 15 Ibid. 16 Ibid. 17 Ibid. 18 FAO, Intergovernmental Group on Tea, 2018 op. cit.
Study of Assam tea value chains Page 8
Tea exports and imports
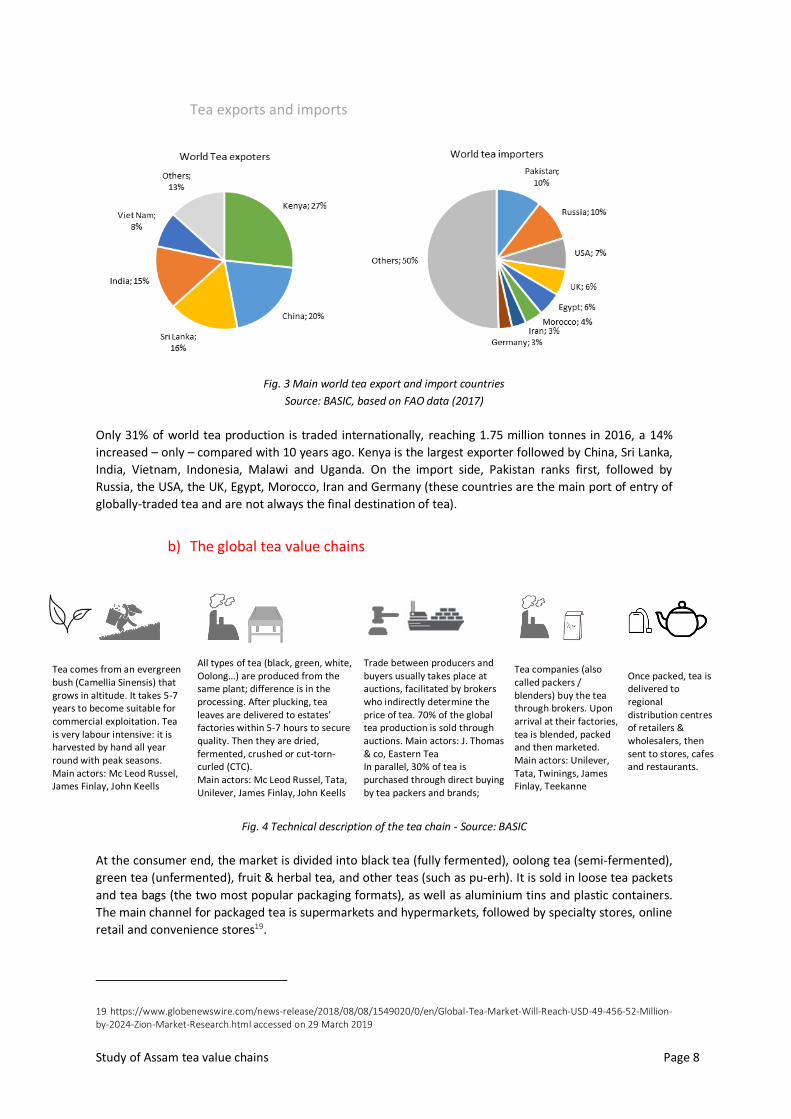
Fig. 3 Main world tea export and import countries
Source: BASIC, based on FAO data (2017)
Only 31% of world tea production is traded internationally, reaching 1.75 million tonnes in 2016, a 14%
increased – only – compared with 10 years ago. Kenya is the largest exporter followed by China, Sri Lanka,
India, Vietnam, Indonesia, Malawi and Uganda. On the import side, Pakistan ranks first, followed by
Russia, the USA, the UK, Egypt, Morocco, Iran and Germany (these countries are the main port of entry of
globally-traded tea and are not always the final destination of tea).
b) The global tea value chains
Tea comes from an evergreen bush (Camellia Sinensis) that grows in altitude. It takes 5-7 years to become suitable for commercial exploitation. Tea is very labour intensive: it is harvested by hand all year round with peak seasons. Main actors: Mc Leod Russel, James Finlay, John Keells
All types of tea (black, green, white, Oolong…) are produced from the same plant; difference is in the processing. After plucking, tea leaves are delivered to estates’ factories within 5-7 hours to secure quality. Then they are dried, fermented, crushed or cut-torn-curled (CTC). Main actors: Mc Leod Russel, Tata, Unilever, James Finlay, John Keells
Trade between producers and buyers usually takes place at auctions, facilitated by brokers who indirectly determine the price of tea. 70% of the global tea production is sold through auctions. Main actors: J. Thomas & co, Eastern Tea In parallel, 30% of tea is purchased through direct buying by tea packers and brands;
Tea companies (also called packers / blenders) buy the tea through brokers. Upon arrival at their factories, tea is blended, packed and then marketed. Main actors: Unilever, Tata, Twinings, James Finlay, Teekanne
Once packed, tea is delivered to regional distribution centres of retailers & wholesalers, then sent to stores, cafes and restaurants.
Fig. 4 Technical description of the tea chain - Source: BASIC
At the consumer end, the market is divided into black tea (fully fermented), oolong tea (semi-fermented),
green tea (unfermented), fruit & herbal tea, and other teas (such as pu-erh). It is sold in loose tea packets
and tea bags (the two most popular packaging formats), as well as aluminium tins and plastic containers.
The main channel for packaged tea is supermarkets and hypermarkets, followed by specialty stores, online
retail and convenience stores19.
19 https://www.globenewswire.com/news-release/2018/08/08/1549020/0/en/Global-Tea-Market-Will-Reach-USD-49-456-52-Million-by-2024-Zion-Market-Research.html accessed on 29 March 2019
Study of Assam tea value chains Page 9
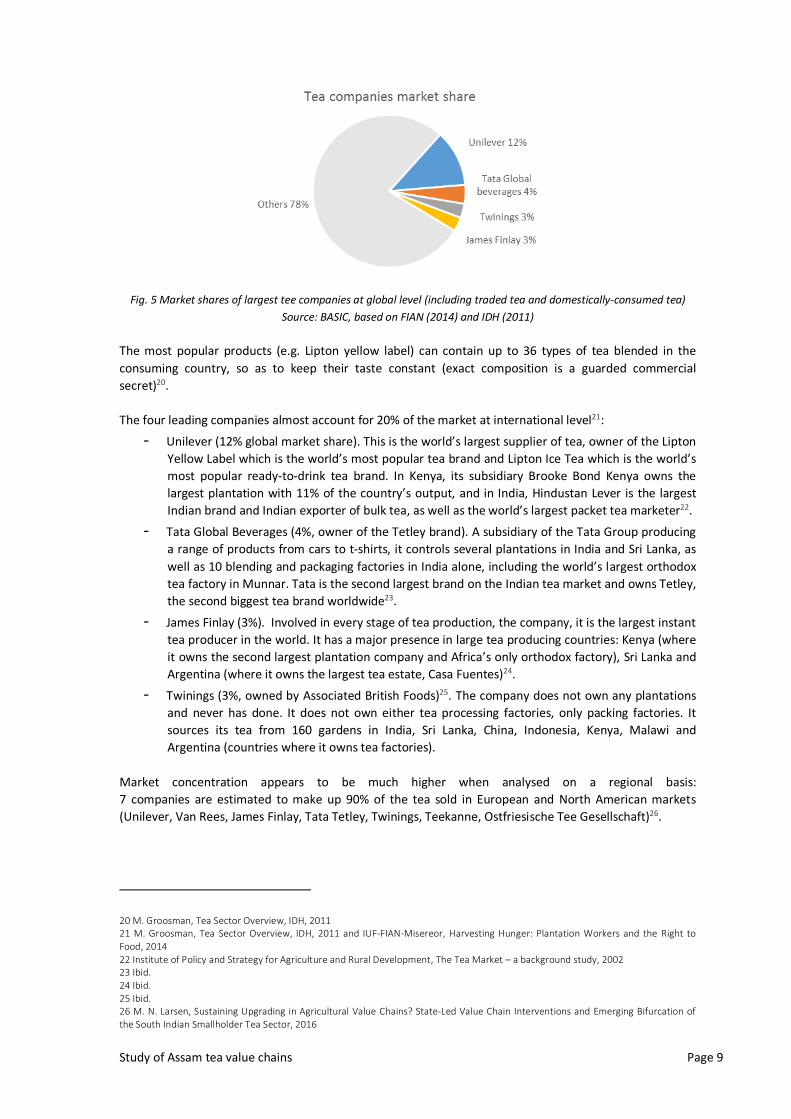
Fig. 5 Market shares of largest tee companies at global level (including traded tea and domestically-consumed tea)
Source: BASIC, based on FIAN (2014) and IDH (2011)
The most popular products (e.g. Lipton yellow label) can contain up to 36 types of tea blended in the
consuming country, so as to keep their taste constant (exact composition is a guarded commercial
secret)20.
The four leading companies almost account for 20% of the market at international level21:
- Unilever (12% global market share). This is the world’s largest supplier of tea, owner of the Lipton
Yellow Label which is the world’s most popular tea brand and Lipton Ice Tea which is the world’s
most popular ready-to-drink tea brand. In Kenya, its subsidiary Brooke Bond Kenya owns the
largest plantation with 11% of the country’s output, and in India, Hindustan Lever is the largest
Indian brand and Indian exporter of bulk tea, as well as the world’s largest packet tea marketer22.
- Tata Global Beverages (4%, owner of the Tetley brand). A subsidiary of the Tata Group producing
a range of products from cars to t-shirts, it controls several plantations in India and Sri Lanka, as
well as 10 blending and packaging factories in India alone, including the world’s largest orthodox
tea factory in Munnar. Tata is the second largest brand on the Indian tea market and owns Tetley,
the second biggest tea brand worldwide23.
- James Finlay (3%). Involved in every stage of tea production, the company, it is the largest instant
tea producer in the world. It has a major presence in large tea producing countries: Kenya (where
it owns the second largest plantation company and Africa’s only orthodox factory), Sri Lanka and
Argentina (where it owns the largest tea estate, Casa Fuentes)24.
- Twinings (3%, owned by Associated British Foods)25. The company does not own any plantations
and never has done. It does not own either tea processing factories, only packing factories. It
sources its tea from 160 gardens in India, Sri Lanka, China, Indonesia, Kenya, Malawi and
Argentina (countries where it owns tea factories).
Market concentration appears to be much higher when analysed on a regional basis:
7 companies are estimated to make up 90% of the tea sold in European and North American markets
(Unilever, Van Rees, James Finlay, Tata Tetley, Twinings, Teekanne, Ostfriesische Tee Gesellschaft)26.
20 M. Groosman, Tea Sector Overview, IDH, 2011 21 M. Groosman, Tea Sector Overview, IDH, 2011 and IUF-FIAN-Misereor, Harvesting Hunger: Plantation Workers and the Right to Food, 2014 22 Institute of Policy and Strategy for Agriculture and Rural Development, The Tea Market – a background study, 2002 23 Ibid. 24 Ibid. 25 Ibid. 26 M. N. Larsen, Sustaining Upgrading in Agricultural Value Chains? State-Led Value Chain Interventions and Emerging Bifurcation of the South Indian Smallholder Tea Sector, 2016
Study of Assam tea value chains Page 10
In Hamburg, which has been the main European entry point for tea since the 19th century and which
accounts today for 70% of the Europe-wide traded tea27, the German companies specialized in tea
blending, flavouring and packaging have a strong presence28. The two biggest players, Ostfriesische Tee
Gesellschaft and Teekanne, hold a combined share of 42%, followed by Hälssen & Lyon, Teekante, J Fr
Scheibler GbmH, and H & S Tee-Gesellschaft29. These actors re-export tea to the rest of Europe supplying
all types of actors, from small specialized tea brands to retailers (for their private label tea) and
international brands30.
Historically, the supply chains of leading global brands have been vertically integrated from their own tea
plantations all the way to the branded tea on the retailers’ shelves. In recent years, they have started to
outsource part of their production and processing capacity to focus instead on downstream activities,
notably blending, packing, marketing and product innovation which are the most lucrative parts of the tea
value chain31.
Unlike for other major agricultural commodities, there is no stock or futures market for tea. Almost 70% of
global tea harvest is sold through auctions, the 3 biggest centres being the major references for the world
market price (Kolkata, India; Colombo, Sri Lanka; Mombasa, Kenya). In all producing countries, local
auction centres are key nodes in the chain. They enable producers to receive payment faster and to lower
the uncertainty of prices and sales, while guaranteeing faster delivery and quality test for buyers32.
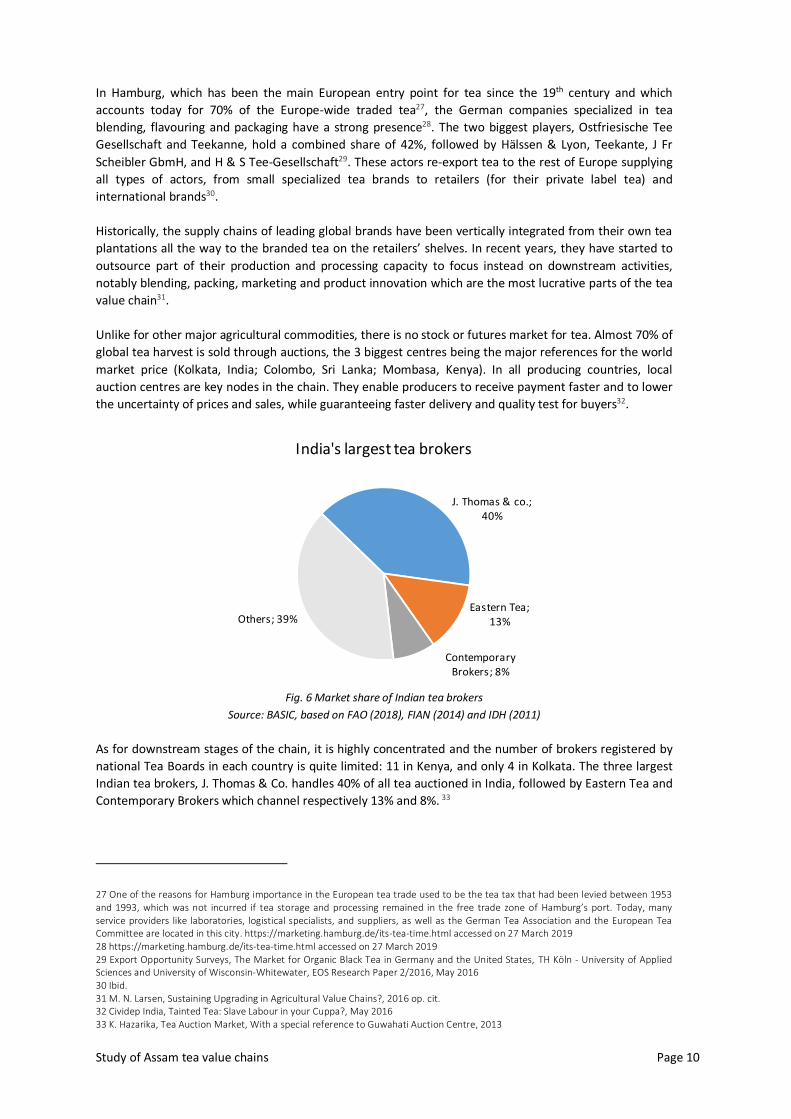
J. Thomas & co.; 40%
Eastern Tea; 13%
Contemporary Brokers; 8%
Others; 39%
India's largest tea brokers
Fig. 6 Market share of Indian tea brokers
Source: BASIC, based on FAO (2018), FIAN (2014) and IDH (2011)
As for downstream stages of the chain, it is highly concentrated and the number of brokers registered by
national Tea Boards in each country is quite limited: 11 in Kenya, and only 4 in Kolkata. The three largest
Indian tea brokers, J. Thomas & Co. handles 40% of all tea auctioned in India, followed by Eastern Tea and
Contemporary Brokers which channel respectively 13% and 8%. 33
27 One of the reasons for Hamburg importance in the European tea trade used to be the tea tax that had been levied between 1953 and 1993, which was not incurred if tea storage and processing remained in the free trade zone of Hamburg’s port. Today, many service providers like laboratories, logistical specialists, and suppliers, as well as the German Tea Association and the European Tea Committee are located in this city. https://marketing.hamburg.de/its-tea-time.html accessed on 27 March 2019 28 https://marketing.hamburg.de/its-tea-time.html accessed on 27 March 2019 29 Export Opportunity Surveys, The Market for Organic Black Tea in Germany and the United States, TH Köln - University of Applied Sciences and University of Wisconsin-Whitewater, EOS Research Paper 2/2016, May 2016 30 Ibid. 31 M. N. Larsen, Sustaining Upgrading in Agricultural Value Chains?, 2016 op. cit. 32 Cividep India, Tainted Tea: Slave Labour in your Cuppa?, May 2016 33 K. Hazarika, Tea Auction Market, With a special reference to Guwahati Auction Centre, 2013
Study of Assam tea value chains Page 11
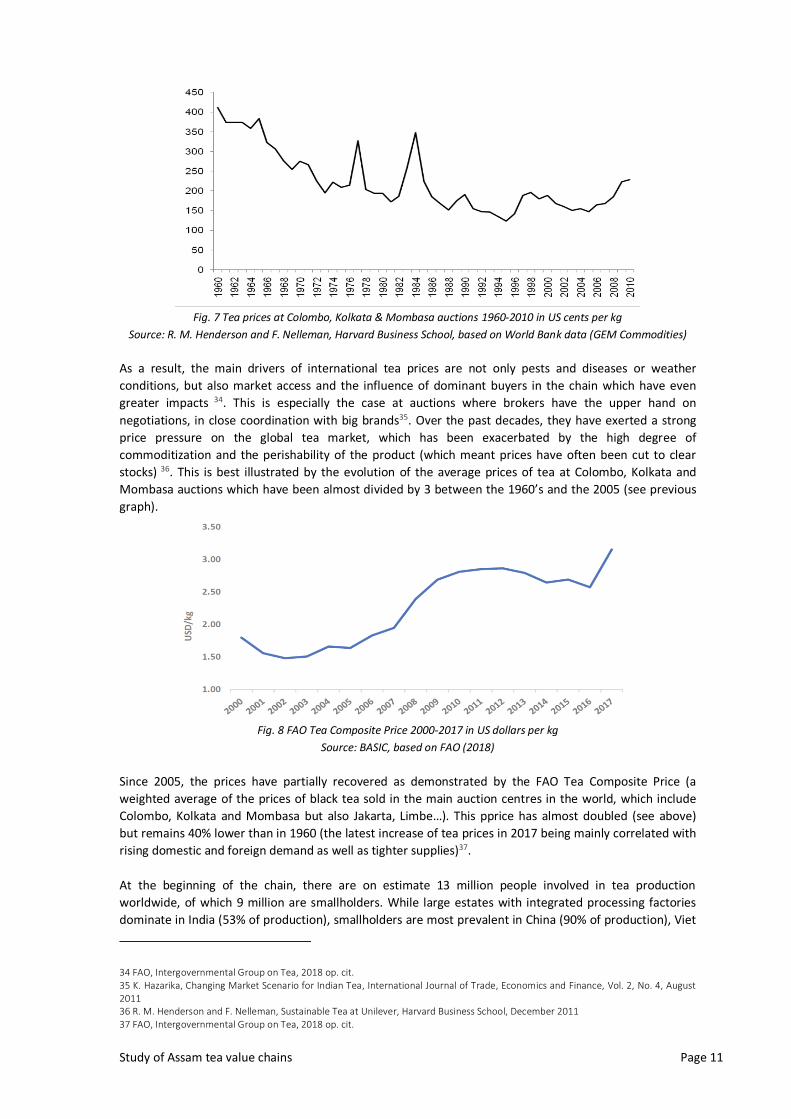
Fig. 7 Tea prices at Colombo, Kolkata & Mombasa auctions 1960-2010 in US cents per kg
Source: R. M. Henderson and F. Nelleman, Harvard Business School, based on World Bank data (GEM Commodities)
As a result, the main drivers of international tea prices are not only pests and diseases or weather
conditions, but also market access and the influence of dominant buyers in the chain which have even
greater impacts 34. This is especially the case at auctions where brokers have the upper hand on
negotiations, in close coordination with big brands35. Over the past decades, they have exerted a strong
price pressure on the global tea market, which has been exacerbated by the high degree of
commoditization and the perishability of the product (which meant prices have often been cut to clear
stocks) 36. This is best illustrated by the evolution of the average prices of tea at Colombo, Kolkata and
Mombasa auctions which have been almost divided by 3 between the 1960’s and the 2005 (see previous
graph).
Fig. 8 FAO Tea Composite Price 2000-2017 in US dollars per kg
Source: BASIC, based on FAO (2018)
Since 2005, the prices have partially recovered as demonstrated by the FAO Tea Composite Price (a
weighted average of the prices of black tea sold in the main auction centres in the world, which include
Colombo, Kolkata and Mombasa but also Jakarta, Limbe…). This pprice has almost doubled (see above)
but remains 40% lower than in 1960 (the latest increase of tea prices in 2017 being mainly correlated with
rising domestic and foreign demand as well as tighter supplies)37.
At the beginning of the chain, there are on estimate 13 million people involved in tea production
worldwide, of which 9 million are smallholders. While large estates with integrated processing factories
dominate in India (53% of production), smallholders are most prevalent in China (90% of production), Viet
34 FAO, Intergovernmental Group on Tea, 2018 op. cit. 35 K. Hazarika, Changing Market Scenario for Indian Tea, International Journal of Trade, Economics and Finance, Vol. 2, No. 4, August 2011 36 R. M. Henderson and F. Nelleman, Sustainable Tea at Unilever, Harvard Business School, December 2011 37 FAO, Intergovernmental Group on Tea, 2018 op. cit.
Study of Assam tea value chains Page 12
Nam (80%), Kenya and Sri Lanka (close to 70%)38. Since processing has to start within 5-7 hours after
harvesting, small growers are in a very weak bargaining position vis-à-vis the nearby processing units of
independent Bought Leaf Factories (BLFs) and tea estates which purchase their green leaves. The major
players at this stage: Mc Leod Russel which belongs to the Williamson Magor Group, the biggest owner of
tea estates in the world (100 000 tonnes of annual production capacity), James Finlay, Tata Tea, Unilever
and John Keells.39
3. Assam tea value chains in India
a) Tea production in Assam
The Indian Tea industry
History and current status of the Indian Tea industry
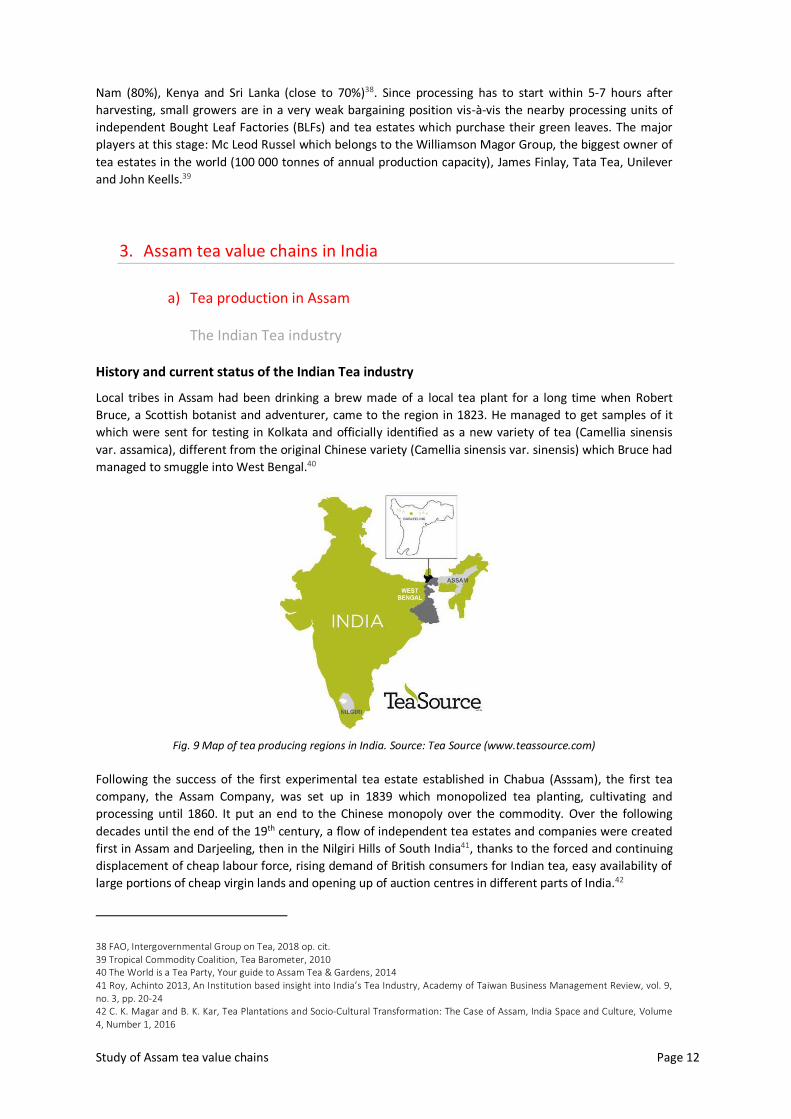
Local tribes in Assam had been drinking a brew made of a local tea plant for a long time when Robert
Bruce, a Scottish botanist and adventurer, came to the region in 1823. He managed to get samples of it
which were sent for testing in Kolkata and officially identified as a new variety of tea (Camellia sinensis
var. assamica), different from the original Chinese variety (Camellia sinensis var. sinensis) which Bruce had
managed to smuggle into West Bengal.40
Fig. 9 Map of tea producing regions in India. Source: Tea Source (www.teassource.com)
Following the success of the first experimental tea estate established in Chabua (Asssam), the first tea
company, the Assam Company, was set up in 1839 which monopolized tea planting, cultivating and
processing until 1860. It put an end to the Chinese monopoly over the commodity. Over the following
decades until the end of the 19th century, a flow of independent tea estates and companies were created
first in Assam and Darjeeling, then in the Nilgiri Hills of South India41, thanks to the forced and continuing
displacement of cheap labour force, rising demand of British consumers for Indian tea, easy availability of
large portions of cheap virgin lands and opening up of auction centres in different parts of India.42
38 FAO, Intergovernmental Group on Tea, 2018 op. cit. 39 Tropical Commodity Coalition, Tea Barometer, 2010 40 The World is a Tea Party, Your guide to Assam Tea & Gardens, 2014 41 Roy, Achinto 2013, An Institution based insight into India’s Tea Industry, Academy of Taiwan Business Management Review, vol. 9, no. 3, pp. 20-24 42 C. K. Magar and B. K. Kar, Tea Plantations and Socio-Cultural Transformation: The Case of Assam, India Space and Culture, Volume 4, Number 1, 2016
Study of Assam tea value chains Page 13
A new (export-oriented) industry was born out of strong and forceful intervention of the British
administration, which in turn created a chain of activities that involved planting, plucking, withering,
fermenting, curing, processing, packing, transporting and auctioning of tea controlled by British companies
that continued to operate even after India gained independence in 194743. During this period, tea drinking
was promoted in Great Britain by the nascent tea industry, highlighting the health benefits of consuming
tea through promotional campaigns that have left a permanent mark for generations of tea drinkers in
both countries that continue to provide a market for the industry even today44.
After independence, the Indian government realised the potential of tea, both in terms of domestic
market and export earnings, but also that this potential could not be realised since the industry was
largely in the hands of British companies and agents. As a result, the government subjected the industry to
heavy regulations through the creation of the “Tea Board of India”. It is a statutory body set up under the
Tea Act, 1953, to promote the Indian tea industry which comes under the administrative control of the
Ministry of Commerce and Industry, Department of Commerce. It comprises of 31 members drawn from
parliamentarians, planters, tea companies, exporters and trade union representatives. It has certain
regulatory functions such as issue of Exporters’ License, Tea Waste License and Tea Warehousing License.
The Tea Board takes many initiatives to promote tea market, tea production and improve the quality of
green leaves and made tea, including through subsidies to tea cultivation. 45
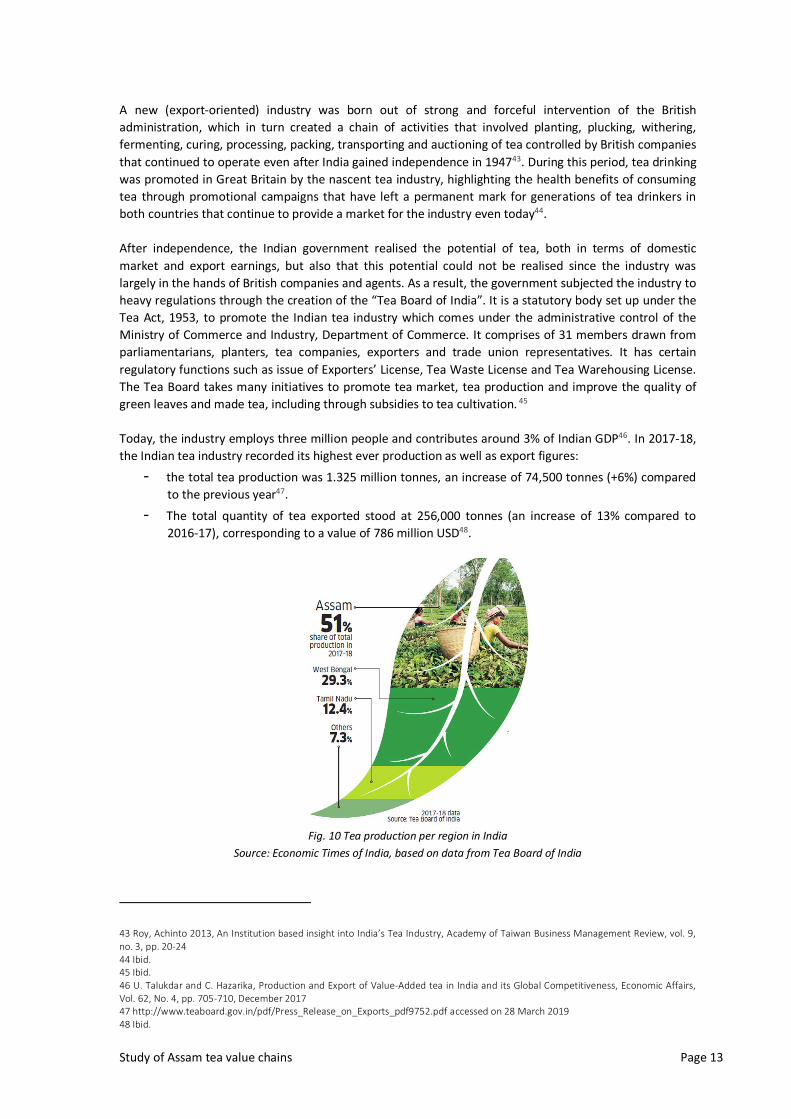
Today, the industry employs three million people and contributes around 3% of Indian GDP46. In 2017-18,
the Indian tea industry recorded its highest ever production as well as export figures:
- the total tea production was 1.325 million tonnes, an increase of 74,500 tonnes (+6%) compared
to the previous year47.
- The total quantity of tea exported stood at 256,000 tonnes (an increase of 13% compared to
2016-17), corresponding to a value of 786 million USD48.
Fig. 10 Tea production per region in India
Source: Economic Times of India, based on data from Tea Board of India
43 Roy, Achinto 2013, An Institution based insight into India’s Tea Industry, Academy of Taiwan Business Management Review, vol. 9, no. 3, pp. 20-24 44 Ibid. 45 Ibid. 46 U. Talukdar and C. Hazarika, Production and Export of Value-Added tea in India and its Global Competitiveness, Economic Affairs, Vol. 62, No. 4, pp. 705-710, December 2017 47 http://www.teaboard.gov.in/pdf/Press_Release_on_Exports_pdf9752.pdf accessed on 28 March 2019 48 Ibid.
Study of Assam tea value chains Page 14
India produces some of the world’s finest teas thanks to the diversity of its microclimates. Due to soil and
climatic requirements, tea cultivation is confined to certain parts of the country, mainly in the states of
Assam, West Bengal, Tamil Nadu and Kerala (80% of total harvest is accounted by Assam & West Bengal).
In these regions, tea farm ownership is fragmented: large-size plantations account for roughly 20% of the
total number of tea producers while some 80% of the farms have less than 8 hectares49. These small tea
growers have seen their contribution rising in recent years: between 2014-15 and 2017-18, their share of
India’s tea production has risen from 34% to 47%50.
The plantation sector (all privately owned) takes its roots in the British colonial period and constitutes a
strong network of capital assets. It relies on the Plantation Labour Act for its operation and regulation.
Each plantation manages internally on its own the quality of green leaves, the production of ‘made tea’, as
well as its economic and social responsibilities towards workers in the field51. The sector comprises both:
- large branded tea companies such as Hindustan Lever and Tata Global Beverages, who used to
vertically integrate the whole chain, from owned estates to branding, packaging and marketing.
In recent years, they have decided to focus on downstream activities and sell their plantations to
large groups which focus on tea cultivation and first processing such as Mc Leod Russel. 52
- medium-size, independent tea plantations who have historically been excluded from compulsory
sale through the auction system and allowed to trade their tea “under the garden name” directly
to the buyers’ blending and packing factories in consuming countries. 53
The rest of the production is made by small tea growers who have been operating in India since the 1970s,
thanks to government programmes encouraging smallholders to convert from vegetable production for
domestic markets to tea cultivation especially for export. But it is the crisis of tea prices on the world
market in the 2000’s that has spurred their development54. The resulting development of new value
chains involving small tea growers selling to Bought Leaf Factories (BLF) is one of the most important
changes in the history of the tea industry in India. Their integration into tea markets through a loosely
coordinated value chain of the “arm’s length” kind has started to create a new paradigm by putting
forward low cost of production in terms of workforce and technology55.
In parallel, the old colonial model of production has been called into question following the crisis of tea
prices in 2005, and the failure of tea estates to meet yield targets and maintain the quality of produced
tea,: some estates were closed and abandoned, triggering a withdrawal of major companies from tea
production, and their concentration on downstream market operations56. In particular, Tata and
Hindustan Lever who used to be among the largest owners of tea plantations in India sold most of their
estates in North India – especially in Assam - to McLeod Russel which became the largest tea producer in
the world57 (it currently owns 32 estates in India, following a strong move of disinvestment whereby it
sold 20 estates in the year 201858). As a consequence, it is estimated that Tata and Hindustan laid off
24,000 and 12,000 workers respectively who lost their jobs59. In parallel to this transformation, a specific
participatory management in tea cultivation was put in place in South India60.
49 K. B. Vijaybhai, P. D. Jayeshkumar et al., Analysis on Indian Tea Industry, V.M.Patel Institute of Management. Ganpat Univ., 2014 50 https://economictimes.indiatimes.com/industry/cons-products/food/indias-tea-industry-is-struggling-to-move-up-the-value-chain/articleshow/65456045.cms?from=mdr accessed on 30 March 2019 51 Saji M Kadavil, Indian Tea Research, 2007 52 Marianne Nylandsted Larsen, Sustaining Upgrading in Agricultural Value Chains? State-Led Value Chain Interventions and Emerging Bifurcation of the South Indian Smallholder Tea Sector, Sustainability 2016, 8, 1102 53 Ibid. 54 Saji M Kadavil, Indian Tea Research, 2007 55 Marianne Nylandsted Larsen, Sustaining Upgrading in Agricultural Value Chains? State-Led Value Chain Interventions and Emerging Bifurcation of the South Indian Smallholder Tea Sector, Sustainability 2016, 8, 1102 56 Ibid. 57 Ibid. 58 https://www.thehindubusinessline.com/companies/after-selling-6-tea-estates-for-23232-crore-mcleod-russel-halts-its-asset-sale-plan/article25030751.ece accessed on 30 March 2019 59 M. Groosman, Tea Sector Overview, IDH, 2011 and IUF-FIAN-Misereor, Harvesting Hunger: Plantation Workers and the Right to Food, 2014 60 Saji M Kadavil, Indian Tea Research, 2007
Study of Assam tea value chains Page 15
At the processing stage, the 2 main operators are Hindustan Lever (subsidiary of Unilever) and Tata Global
Beverages Ltd (TGBL) which both account for almost 60% of all tea sales in the country. As disposable
incomes have risen in both urban and rural parts, more Indian consumers were able to make the switch
from unbranded products to the brands owned by these two operators: Tata, Brooke Bond and Lipton. 61
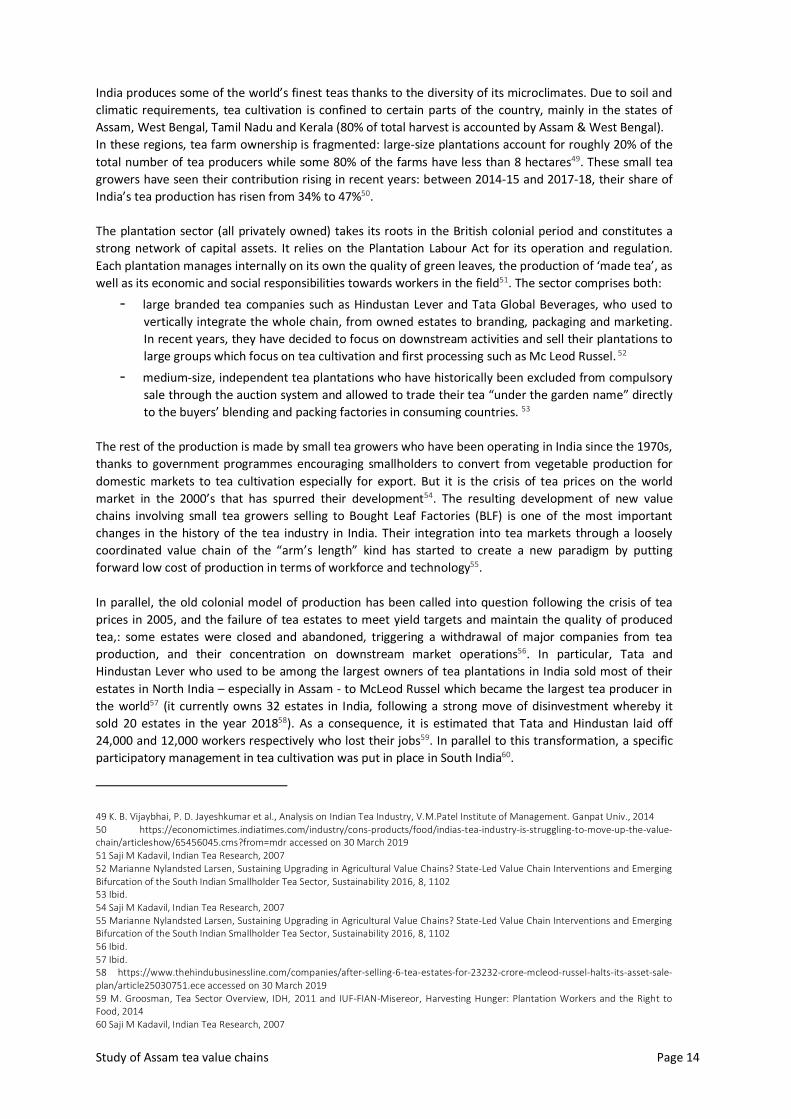
Fig. 11 Tea production per grade of processing.
Source: Economic Times of India, based on data from Tea Board of India
The bulk of today’s Indian manufactured tea is of granular grade: 90% is made through the machine-based
Crush-Tear-Curl (CTC) process62. The tea obtained from this CTC manufacturing is less costly to process
and sold in the mass market. It has a stronger flavour tending toward the bitter side and is usually
consumed with milk63. On the higher end, the more expensive Orthodox varieties are whole-leaf teas
which are hand-processed to wither and roll tea leaves which account only for 8.4% of Indian
production64. Teas of such higher grades emanate more subtle and multi-layered flavours are usually had
without adding milk65. The rest of Indian production is green tea, which represents a mere 1.5% of the
volume produced.66
Prices vary greatly, depending on the grade of tea and region of production: Assam CTC tea is only valued
at around Rs 150 per kg while Orthodox tea from Assam can on an average fetch at Rs 500 per kg, and
prime Darjeeling orthodox commands prices that can reach three times higher, i.e. Rs 1500 per kg and
above.67
Trade and labour relations in the India tea sector, and related challenges
The British colonial tea plantation model has been established based on scientific and economic devised
methods for the ‘improvement’ of India’s landscapes and populations68. Calculating and translating labour
costs across space were central to this colonial project. The Indian tea plantation complex was thus
61 https://economictimes.indiatimes.com/industry/cons-products/food/now-more-indians-prefer-to-have-tea-with-small-brands-like-wagh-bakri-amar-tea/articleshow/59260789.cms?from=mdr accessed on 28 March 2019 62 https://economictimes.indiatimes.com/industry/cons-products/food/indias-tea-industry-is-struggling-to-move-up-the-value-chain/articleshow/65456045.cms?from=mdr accessed on 30 March 2019 63 Ibid. 64 https://economictimes.indiatimes.com/industry/cons-products/food/indias-tea-industry-is-struggling-to-move-up-the-value-chain/articleshow/65456045.cms?from=mdr accessed on 30 March 2019 65 Ibid. 66 https://economictimes.indiatimes.com/industry/cons-products/food/indias-tea-industry-is-struggling-to-move-up-the-value-chain/articleshow/65456045.cms?from=mdr accessed on 30 March 2019 67 https://economictimes.indiatimes.com/industry/cons-products/food/indias-tea-industry-is-struggling-to-move-up-the-value-chain/articleshow/65456045.cms?from=mdr accessed on 23 March 2019 68 Sarah Besky, Tea as Hero Crop? Embodied Algorithms and Industrial, Reform in India, Science as Culture, 2016
Study of Assam tea value chains Page 16
developed through the careful classification of people, plants, taste and landscapes into neat and
supposedly natural categories, represented in numbers69.
The creation of these standardized systems was paralleled by the establishment of brokerage procedures
in centralized auctions which channel 2/3 of Indian tea production70. Their functioning is based on a
complex method for preparing, smelling, touching, and tasting tea: from weighting tea samples with a
bronze balance to arranging ceramic cups on long, narrow, tea-stained tables, then smelling each tea with
the nose before tasting the tea through partial ingestion and finally describing the tea’s qualities using a
pre-set array of adjectives not unlike those used by wine sommeliers71. Each broker has a tasting specialty.
Some focus on malty Assams, others on muscatel Darjeelings, and others on the tannic cut–tear–curl teas
produced throughout the Northeast and drunk across Indian homes72.
But regardless of region, the embodied method for tea’s valuation takes the same form. These brokers are
very concentrated as they must be registered with the Tea Board which has historically limited the
number of auction houses where tea can be sold. This is best illustrated by the 4 registered brokers at
Calcutta: J. Thomas & Co. (the world’s largest tea broker, which handles 40% of all tea auctioned in India),
Contemporary Brokers and Eastern Tea73. As a result of this concentration, there is a strong assumption
that brokers often push down the price in the auction, in coordination with large buyers (tea
manufacturers and brands) 74.
Whereas the work of determining price is one of product differentiation, the work of determining labour
costs on tea plantations has always been one of standardization75. Labour costs include:
- workers’ daily monetary wages, which are a matter of state-by-state concern. They are
determined through tripartite negotiations (and sometimes bipartite in the past) between
workers (represented by unions), planters (represented by guild-like regional associations), and
the government (represented by the Labour Department of each Indian state). By law, planters
cannot pay less than the state-set wage. 76
- the ‘social costs’ associated with tea production as outlined in the national-level Plantations
Labour Act of 1951, which include housing, food rations, medical facilities, latrines, and primary
schooling for laborers’ children. 77
Through the combination of these monetary and in-kind payments, the living condition of each worker is
thus accounted for in a uniform fashion, although brokers and tasters at auctions make fine gradations
between flavours, ages, and provenances of the tea they produce. 78
Whereas tea has played a vital role in the national economy, providing sectoral employment in remote
and poor rural areas, yet tea plantation labour wages are the lowest of the organised sector in the
country79. Cash wages are still typically determined based on piece-rates, i.e. calculated by the amount
plucked, instead of working time (with a minimum volume to be picked which is related to a defined daily
wage). In addition, most tea workers are not employed upon a long-term labour contract, but on less
stable conditions: to a large degree, casual work is the norm in tea production today (on estimate, about
69 Ibid. 70 Ibid. 71 Ibid. 72 Ibid. 73 https://web.facebook.com/236193093072118/posts/j-thomas-courl-wwwjthomasindiacomif-you-look-up-the-internet-or-read-about-jthom/1106178979406854/?_rdc=1&_rdr and https://finalstepmarketing.com/wp-content/uploads/2015/07/UK_TEA_market.pdf accessed on 24 March 2019 74 Saji M Kadavil, Indian Tea Research, 2007 75 Sarah Besky, Tea as Hero Crop? Embodied Algorithms and Industrial, Reform in India, Science as Culture, 2016 76 Ibid. 77 Ibid. 78 Ibid. 79 E. M. Biggs et al., The tea landscape of Assam: Multi-stakeholder insights into sustainable livelihoods under a changing climate, Environmental Science and Policy 82 (2018) 9–18
Study of Assam tea value chains Page 17
50% of workers are casual in the Indian tea sector)80. The majority of these employees are women
(harvesting, generally referred to as plucking, is carried out almost exclusively by female workers, while
male workers are employed for pruning, applying agrochemicals and hauling heavy loads)81, because
women are perceived as more able to engage in “quality” picking of tea leaves and have historically be
seen as central to the need to “populate” the tea plantation workforce82.
Furthermore, tea plantations are not just economic production units, but rather social institutions,
controlling the lives of their resident work force to a large extent. Low cash wages supplemented by
“social benefits” are one of the enduring legacies of the colonial system, which has defined many aspects
of plantation work and life83. 70 years after India’s independence, tea workers are still dependent on tea
plantations for their basic needs (food, water, housing…) as they live and work in an enclave84. Despite
generations having lived in the same estate and same house for generations, most tea workers have still
not been given any right to their homestead. They can be evicted at any moment by the management
from their houses if they protest about their conditions of work or wages85. Thus, while men may migrate
to better paid jobs, one or more of the women continue to work on the estate, just to retain possession of
the house, which can be described as bonded labour86.
Outside tea plantations, small tea growers which are on the rise. While a small minority of smallholders
has been integrated into high-margin markets through prominent BLFs, a mass of “others” lay outside
these opportunities, being trapped in tightly coordinated tea value chains87. They are most often
economically and socially vulnerable as they are marginal farmers, Dalits or from tribal communities.
Many of them do not possess rights over the land they cultivate88. Though the quantity of tea produced by
small tea growers has increased over time, the profit accruing to them is very limited, because of their
inability to access the market directly and their low price-realisation due to poor quality and inefficient
production structures89. In some states like Assam, a minimum price for green leaves has been defined per
district. It provides some sort of safety net to the small tea growers, but does not take into account the
costs of production and their evolution, as it is calculated as a percentage of the auctioned price
In this context, a new vision called “Tea 2030” has started to emerge, mainly promoted by major tea
brands and manufacturers such as Tata Global Beverages and Hindustan Lever90. They consider the
plantation and auction system as inefficient anachronisms and purport to replace this ‘linear supply chain’
(on which bodies are hierarchically arranged) with a ‘value network’ based on a model of worker
empowerment – especially women - in which workers become part-owners of plantations and
smallholders selling green leaf to centralized factories gradually become the norm91. However, the
capacity of this new dynamic to address the social challenges faced by the Indian tea industry is
questioned as it does not aim to balance the high asymmetries in negotiation power along the tea chain in
India which have been perpetuated since the creation of this industry in the country92.
80 IUF-FIAN-Misereor, Harvesting Hunger: Plantation Workers and the Right to Food, 2014 op. cit. 81 K. B. Vijaybhai, P. D. Jayeshkumar et al., Analysis on Indian Tea Industry, V.M.Patel Institute of Management. Ganpat University, 2014 82 Ibid. 83 IUF-FIAN-Misereor, Harvesting Hunger: Plantation Workers and the Right to Food, 2014 op. cit. 84 Global Network for the Right to Food and Nutrition, A life without dignity – the price of your cup of tea, Abuses and violations of human rights in tea plantations in India, Fact-finding mission report, May 2016 85 Ibid. 86 Ibid. 87 Marianne Nylandsted Larsen, Sustaining Upgrading in Agricultural Value Chains? State-Led Value Chain Interventions and Emerging Bifurcation of the South Indian Smallholder Tea Sector, Sustainability 2016, 8, 1102 88 Ibid. 89 Ibid. 90 Sarah Besky, Tea as Hero Crop? Embodied Algorithms and Industrial, Reform in India, Science as Culture, 2016 91 Ibid. 92 Ibid.
Study of Assam tea value chains Page 18
Specificities of the Tea sector in Assam
Tea production in Assam and related challenges
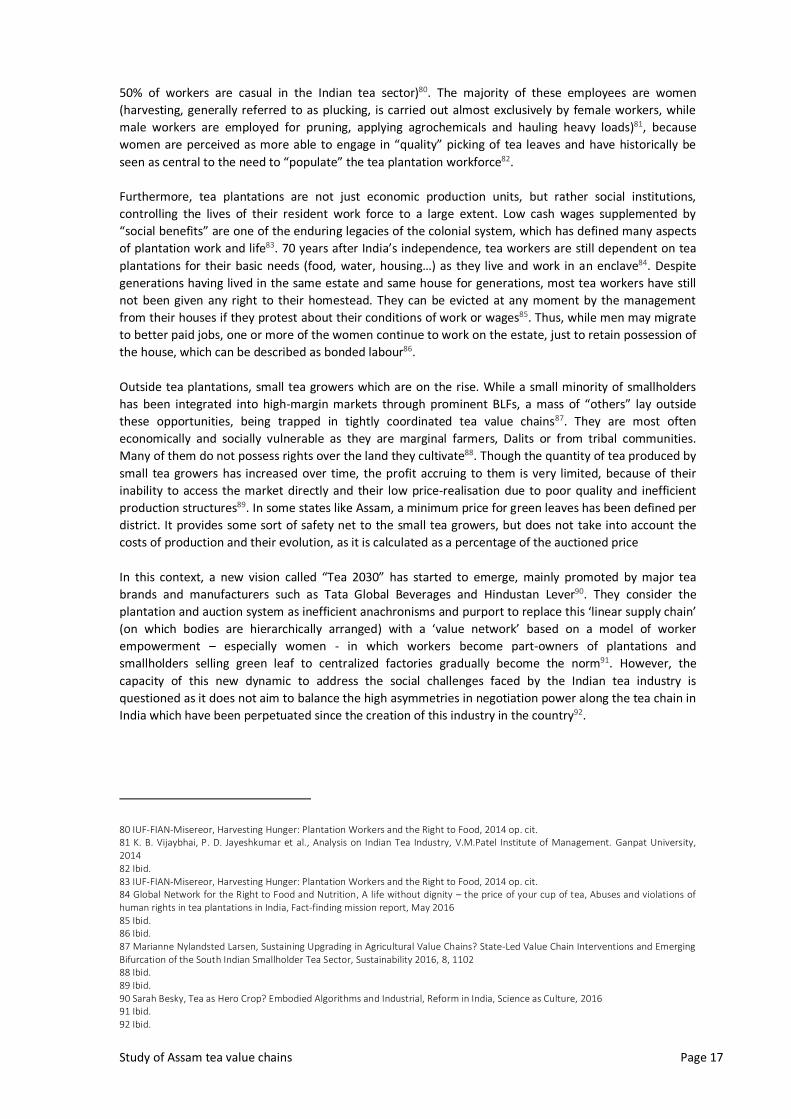
As described earlier, Assam is home to the Indian native variety of tea and is the largest tea producing
region in the country. The total area under tea cultivation is roughly 312, 000 hectares, mainly situated in
the regions of Cachar, North Bank, South Bank and Upper Assam (see map below) 93. The volume produced
was almost 676,000 tonnes in 2017-18, accounting for more than 50% of the total national production.
Fig. 12 Main tea producing regions in Assam
Source: J.M.A. Duncan et al. Observing climate impacts on tea yield in Assam, India, 2016
Assam is one of Indian’s states facing the biggest social challenges: it has a largely rural population (almost
86% of inhabitants) which suffers from a high unemployment rate of 12.6% (compared to roughly 4% at
national level) and a growing casualization of labour conditions94.
In this context, tea has always played a pivotal role in state livelihood security, particularly since the
industry is largely non-mechanized. Historically, tea plantations were very large (over 100 hectares in size)
and restricted only to British entrepreneurs, local Assamese people being forbidden from engaging in tea
cultivation, except as workers95. In the early 1970s, both the Government of India and the Assam State
Government abolished barriers to entry: Soneswar Bora (State Minister for Agriculture in 1978), is
credited with efforts to popularize small tea holdings to make use of the state’s fallow land and provide
employment opportunities for the rural youth96. Since then, the number of small tea growers – i.e. with
farms smaller than 10.2 Ha – has jumped from 657 in 1990 to over 84,000 today (compared to 850 tea
estates)97.
93 Global Network for the Right to Food and Nutrition, A life without dignity – the price of your cup of tea, May 2016 94 C. Idicheria, Okapi and Mercy Corps, Risk and resilience in Assam’s tea industry, October 2017 95 Ibid. 96 Ibid. 97 Global Network for the Right to Food and Nutrition, A life without dignity – the price of your cup of tea, May 2016 and C. Idicheria, Okapi and Mercy Corps, Risk and resilience in Assam’s tea industry, October 2017
Study of Assam tea value chains Page 19
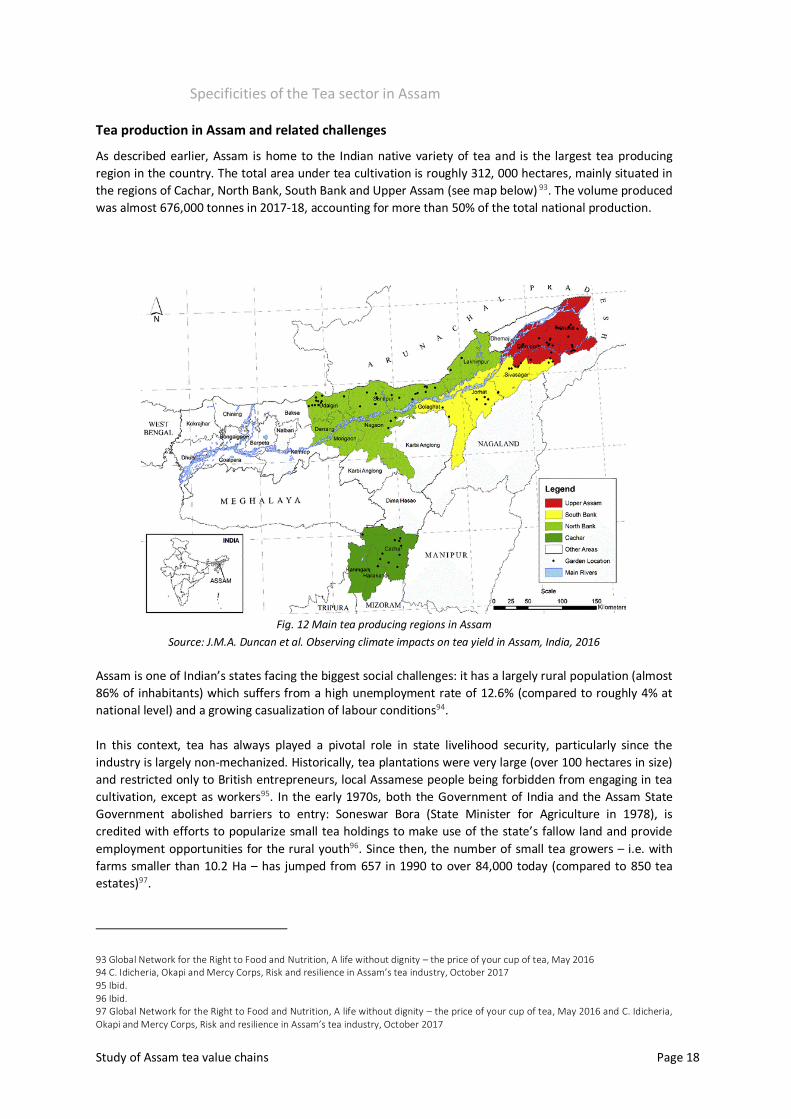
PROCESS
1. Tea planting
2. Plucking/harvesting
3. Collection/transport of green tea leaves
4. Processing
5. Sale or auction
Small Tea Growers
Large Tea Estates
Workers
Agents
Bought Leaf Factories
Brokers/intermediaries
ACTORS
Fig. 13 Tea production process in Assam
Source: C. Idicheria, Okapi and Mercy Corps, Risk and resilience in Assam’s tea industry, October 2017
The rapid emergence of small tea growers in Assam has transformed the ways in which the sector is
organized: processes that used to be exclusively housed in single large tea estates are now disaggregated
between small tea growers (STG) who supply green leaves through agents to “Bought Leaf Factories” (BLF)
and tea estates which consolidate volumes from a (large) number of STGs and take in charge the
processing and marketing of the product (see previous graph)98. Quality assurance is hard to control in this
process of mass collection and transportation, which has pushed several private institutions to develop
training programs to help small tea growers improve their cultivation practices and regulate the use of
chemicals to meet industry standards99.
In economic terms, the Assamese small tea growers (STGs) are significantly more exposed to the high
price fluctuations on the tea market, with severe consequences on the income and living conditions of
their families100. Indeed, only a few large estates have sufficient financial reserves to produce in-house
high-quality orthodox tea, leaving STGs as the main providers of green leaves for low-quality CTC-
processed tea which floods domestic markets at prices which are directly affected by those of CTC-tea
auctioned in Mombasa (Kenya) at much lower production costs (India exhibiting the highest costs of tea
production in the world)101. A worsening factor, auction and market prices of tea have not kept up with
the rising costs of inputs which have been hard for small tea growers to shoulder (Over the last 10 years,
they have increased at a compounded annual growth rate of more than 10%, while the price of tea has
only increased by 6 to 7%)102.
This profound transformation was further accelerated by the two leading players of the tea sector. In
2005, Hindustan Lever sold all of its plantations in Assam, primarily to McLeod Russel (making it the
largest producer of tea leaf in India but with no retail operation) 103. This sudden and distorted departure
highly questioned its main competitor, Tata Global Beverages which feared it would become
uncompetitive in the face of this move. The company also decided to leave the tea plantation sector, but
its reputational stakes didn’t allow it to cut down operations the way Unilever did104. Instead, Tata opted
for a “voluntary scheme” whereby it granted early retirement to part of the workers and transferred to
the remaining employees a partial ownership of plantations through the sale of shares105. As Tata
plantations in Assam were noticeably expensive and profitable, it brought outside investors to ensure the
viability of the restructuring106. As a result, 21 Tata estates were integrated in a new company called
Amalgamated Plantations Private Limited (APPL) of which Tata owns 19% of shares107.
98 C. Idicheria, Okapi and Mercy Corps, Risk and resilience in Assam’s tea industry, October 2017 99 Ibid. 100 Ibid. 101 Ibid. 102 Ibid. 103 Human Rights Institute of Columbia Law School, The More Things Change ..., January 2014 104 Ibid. 105 Ibid. 106 Ibid. 107 M. Rao, A Bitter Brew: Business Accountability for Human Rights Violations in the Assam Tea Supply Chain, Wageningen University, February 2018
Study of Assam tea value chains Page 20
Whereas these transformations have strongly impacted the business dynamics within the Assamese tea
sector, it made little difference to the situation of workers. Indeed, labour practices in Assam have
remained almost the same for the past two centuries108. Their origin lies in the British colonial times when
permanent tea workers were forcibly brought in Assam at the end of the 19th century from other states,
primarily from tribal communities in central India, because they posed fewer risks of conflicts to
employers than native Assamese workers109. They found themselves immobilized within the spatial
confines of plantation enclaves. As a result, today’s workers on large tea estates are mostly descendants
of these migrant families, and collectively referred to as “coolies” or members of “tea tribes” 110. This is
further combined with a strict hierarchy among employees based on ethnic, linguistic and caste
differences: workers are almost invariably Adivasi (indigenous who don’t get recognition nor entitlements
as per the Scheduled Tribes provisions as they were brought away from their original States), staff are
Ahom locals (upper caste), and managers come from outside the region (often West Bengal or Punjab)111.
In this context, numerous researches document the widespread nature of labour rights violations on tea
estates in Assam. In September 2015, a BBC investigation on Assamese tea estates revealed severe
working and living conditions on several of plantations, among which estates owned by McLeod Russel112.
On the research side, two recent extensive studies conducted in Assam, one by the Human Rights Institute
of Columbia Law School (published in 2014113) and another by the Global Network for the Right to Food
and Nutrition’s (published in 2016114) revealed the extent of rights violations on Assamese tea estates, as
reported by the hundreds of workers interviewed:
- Insecurity of tenure, housing and living conditions: cases of land dispossession by the management of tea estates, lack of access to electricity, lack of maintenance of living quarters, ceilings rotting and flooding of houses115
- Low wages and bas working conditions: cases of no resting time during working hours, time of travel not taken into account, increase of the quantity of tea to be picked to achieve the minimum wage, wage deductions, lack of equipment116
- Breach of maternity rights: infringement of maternity leave duration, inadequate prenatal and postnatal care as well as access to day-nurseries117
- Exposure to pesticides: absence of pesticide labels or instructions for use (all the more than most workers are illiterate), absence of storage precautions, absence of training on pesticides use apart from supervisors, absence, inadequacy and lack of repair of personal protective equipment, pesticide spillage, water pollution. These infringements were associated with health problems reported by workers: skin irritation, nausea, vomiting, headache, eye burns, muscle pain…118
- Lack of essential services: lack of access to quality health care throughout the sector (especially for temporary workers), high costs of medical services, low quality of education services, insufficient food rations, cases of malnutrition and anaemia among workers’ children, lack of drinkable water (quantity & quality), cases of diarrhoea and cholera…119
A worsening factor is the increasing incidence of informal or casual workers in an industry that has
historically been formal120. These informal workers do not receive the same legal entitlements, suffer from
irregular sources of income, face higher risks of being laid off and are less unionized, thereby widening
inequality gaps among workers who are engaged in the same tasks and have similar livelihood concerns121.
108 Human Rights Institute of Columbia Law School, The More Things Change ..., January 2014 109 M. Rao, A Bitter Brew: Business Accountability for Human Rights Violations in the Assam Tea Supply Chain, Wageningen Uni, 2018 110 Ibid. 111 Human Rights Institute of Columbia Law School, The More Things Change ..., January 2014 112 Cividep India, Tainted Tea: Slave Labour in your Cuppa?, May 2016 113 Human Rights Institute of Columbia Law School, The More Things Change ..., January 2014 114 Global Network for the Right to Food and Nutrition, A life without dignity – the price of your cup of tea, May 2016 115 Ibid. 116 Ibid. 117 Ibid. 118 Ibid. 119 Ibid. 120 C. Idicheria, Okapi and Mercy Corps, Risk and resilience in Assam’s tea industry, October 2017 121 Ibid.
Study of Assam tea value chains Page 21
Even the progressive initiative taken by Tata in partnership with the International Finance Corporation
(IFC, member of the World Bank Group) is not immune to these social challenges: the model of tea
plantation with shared-ownership of workers they installed through the creation of APPL has also been
the subject of serious allegations of wages below the minimum wage, inadequate living conditions,
obstruction to freedom of association and lack of risk prevention regarding the use of pesticides as
documented by the World Bank’s CAO (Office of the Compliance Advisor Ombudsman). 122
Finally, on the environmental side too, the stakes are high. Tea in Assam being closely linked to
environmental and climatic conditions, it is hence vulnerable to climate. According to the Tocklai Tea
Research Institute, Assam recorded a 1.3˚C increase in temperatures over the last century, and more
recently a steady increase in the number of days with temperatures above 30˚C, erratic rainfall patterns
and increased periods of drought123. These changes in climate creates conditions that usher in new pests
like Heliopeltis thievora or mosquito bugs which destroy tea shoots, and ultimately reduce crop
productivity. In recent years, tea gardens have reported an alarming increase in pest attacks, with existing
pesticides proving to be increasingly ineffective124. As a result, tea growing areas in Assam could drastically
reduce by 2050 if certain climate mitigation or adaptation strategies are not implemented (tea production
could decline of up to 40% by 2050 due to climate change)125.
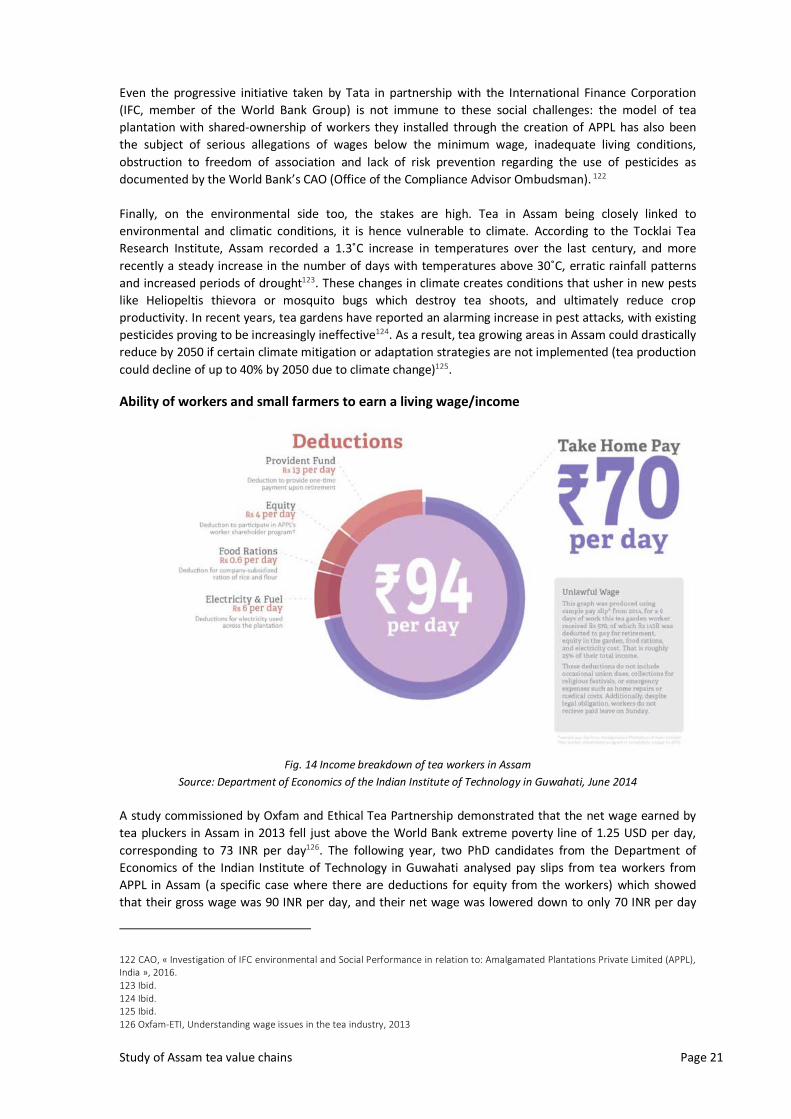
Ability of workers and small farmers to earn a living wage/income
Fig. 14 Income breakdown of tea workers in Assam
Source: Department of Economics of the Indian Institute of Technology in Guwahati, June 2014
A study commissioned by Oxfam and Ethical Tea Partnership demonstrated that the net wage earned by
tea pluckers in Assam in 2013 fell just above the World Bank extreme poverty line of 1.25 USD per day,
corresponding to 73 INR per day126. The following year, two PhD candidates from the Department of
Economics of the Indian Institute of Technology in Guwahati analysed pay slips from tea workers from
APPL in Assam (a specific case where there are deductions for equity from the workers) which showed
that their gross wage was 90 INR per day, and their net wage was lowered down to only 70 INR per day
122 CAO, « Investigation of IFC environmental and Social Performance in relation to: Amalgamated Plantations Private Limited (APPL), India », 2016. 123 Ibid. 124 Ibid. 125 Ibid. 126 Oxfam-ETI, Understanding wage issues in the tea industry, 2013
Study of Assam tea value chains Page 22
after company deductions for electricity and fuel, food rations, equity and provident fund127. This salary is
significantly below the minimum wage of 177 INR per day (2.67 USD), a situation which has been
challenged in court by tea growers’ associations. According to the study commissioned by Oxfam, workers
also receive additional in-kind benefits128 that equal to roughly 80% of the net cash wage they receive129.
Based on this work of the Department of Economics of the Indian Institute of Technology, we consider
that a conservative estimate of the total wage earned by workers in Assam is 126 INR per day in 2013,
including both cash pay and in-kind entitlements. This corresponds to 153 INR per day in 2017 when
taking into account the Indian inflation since 2013.
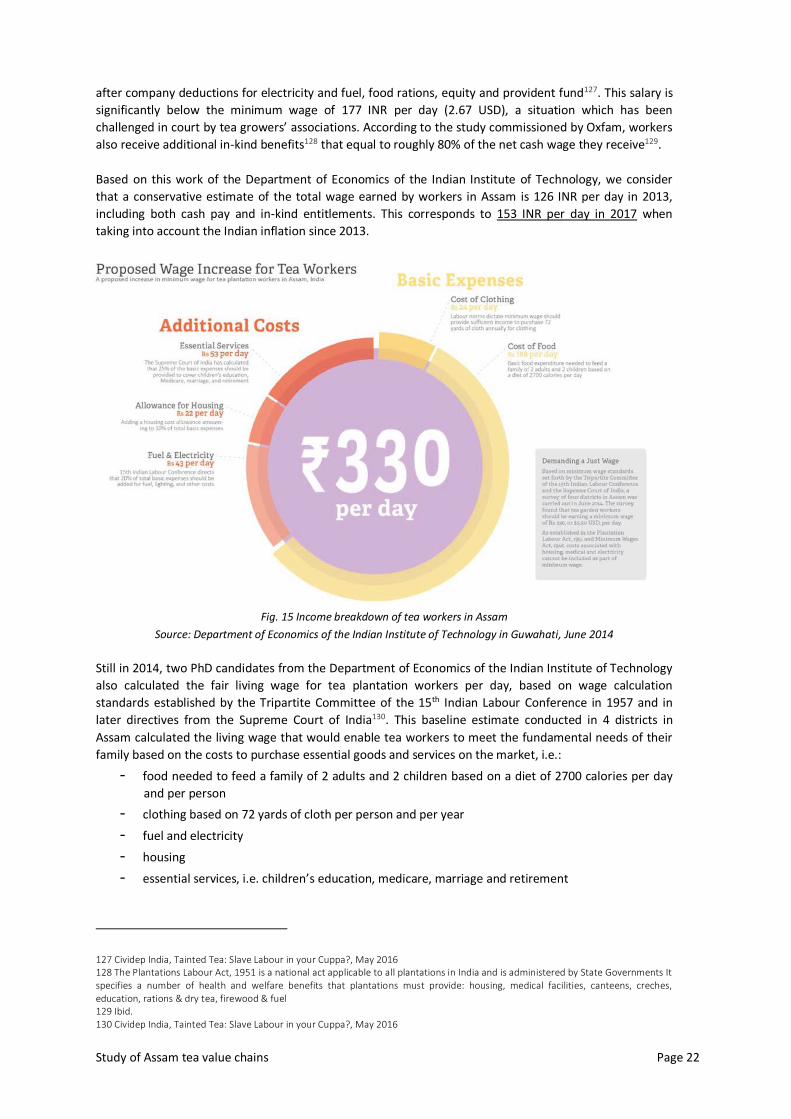
Fig. 15 Income breakdown of tea workers in Assam
Source: Department of Economics of the Indian Institute of Technology in Guwahati, June 2014
Still in 2014, two PhD candidates from the Department of Economics of the Indian Institute of Technology
also calculated the fair living wage for tea plantation workers per day, based on wage calculation
standards established by the Tripartite Committee of the 15th Indian Labour Conference in 1957 and in
later directives from the Supreme Court of India130. This baseline estimate conducted in 4 districts in
Assam calculated the living wage that would enable tea workers to meet the fundamental needs of their
family based on the costs to purchase essential goods and services on the market, i.e.:
- food needed to feed a family of 2 adults and 2 children based on a diet of 2700 calories per day
and per person
- clothing based on 72 yards of cloth per person and per year
- fuel and electricity
- housing
- essential services, i.e. children’s education, medicare, marriage and retirement
127 Cividep India, Tainted Tea: Slave Labour in your Cuppa?, May 2016 128 The Plantations Labour Act, 1951 is a national act applicable to all plantations in India and is administered by State Governments It specifies a number of health and welfare benefits that plantations must provide: housing, medical facilities, canteens, creches, education, rations & dry tea, firewood & fuel 129 Ibid. 130 Cividep India, Tainted Tea: Slave Labour in your Cuppa?, May 2016
Study of Assam tea value chains Page 23
The resulting living wage for tea workers would be 330 INR per day (5.50 USD) in 2014 or
400 INR per day in 2017, i.e. a multiplication by 2.6 of the current wages. This result is very much aligned
with the study conducted by K. Mamkoottam and N. Kaicker for the Global Living Wage Coalition, based
on a similar methodology developed by Richard and Marta Anker131, which estimated the living wage in
rural India at 345 INR per day in 2015132.
b) Domestic Tea value chains
Indian food retail sector
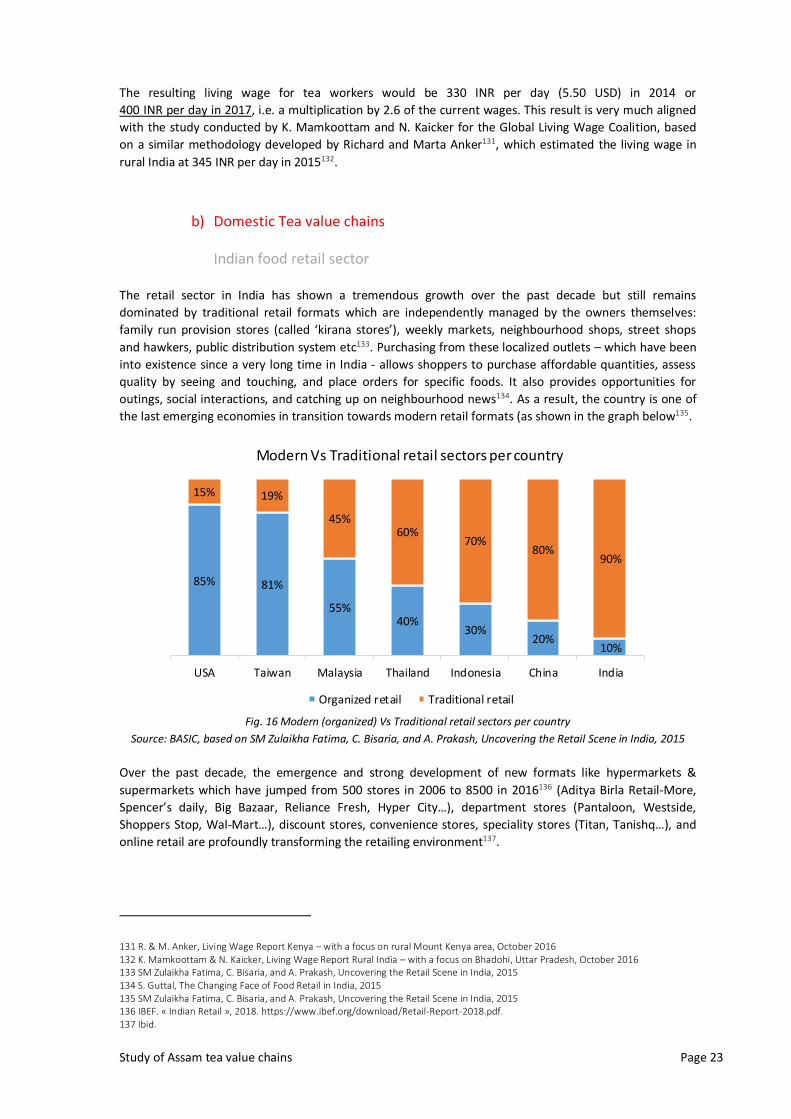
The retail sector in India has shown a tremendous growth over the past decade but still remains
dominated by traditional retail formats which are independently managed by the owners themselves:
family run provision stores (called ‘kirana stores’), weekly markets, neighbourhood shops, street shops
and hawkers, public distribution system etc133. Purchasing from these localized outlets – which have been
into existence since a very long time in India - allows shoppers to purchase affordable quantities, assess
quality by seeing and touching, and place orders for specific foods. It also provides opportunities for
outings, social interactions, and catching up on neighbourhood news134. As a result, the country is one of
the last emerging economies in transition towards modern retail formats (as shown in the graph below135.
85% 81%
55%40%
30%20%
10%
15% 19%
45%60%
70%80%
90%
USA Taiwan Malaysia Thailand Indonesia China India
Modern Vs Traditional retail sectors per country
Organized retail Traditional retail
Fig. 16 Modern (organized) Vs Traditional retail sectors per country
Source: BASIC, based on SM Zulaikha Fatima, C. Bisaria, and A. Prakash, Uncovering the Retail Scene in India, 2015
Over the past decade, the emergence and strong development of new formats like hypermarkets &
supermarkets which have jumped from 500 stores in 2006 to 8500 in 2016136 (Aditya Birla Retail-More,
Spencer’s daily, Big Bazaar, Reliance Fresh, Hyper City…), department stores (Pantaloon, Westside,
Shoppers Stop, Wal-Mart…), discount stores, convenience stores, speciality stores (Titan, Tanishq…), and
online retail are profoundly transforming the retailing environment137.
131 R. & M. Anker, Living Wage Report Kenya – with a focus on rural Mount Kenya area, October 2016 132 K. Mamkoottam & N. Kaicker, Living Wage Report Rural India – with a focus on Bhadohi, Uttar Pradesh, October 2016 133 SM Zulaikha Fatima, C. Bisaria, and A. Prakash, Uncovering the Retail Scene in India, 2015 134 S. Guttal, The Changing Face of Food Retail in India, 2015 135 SM Zulaikha Fatima, C. Bisaria, and A. Prakash, Uncovering the Retail Scene in India, 2015 136 IBEF. « Indian Retail », 2018. https://www.ibef.org/download/Retail-Report-2018.pdf. 137 Ibid.
Study of Assam tea value chains Page 24
In 2016, all these modern retail formats (grouped under the name ‘organized retail’) have generated a
turnover of 70 billion USD, accounting for 10% of the total retail market - to be compared with the 672
billion USD sales generated the same year by traditional retail (90% of the market) 138.
In the short term, the strong development of the ‘organized retail’ sector (20% growth per year) is
expected to give birth to a true retail industry in India, enabling the total retail market to reach 1.1 trillion
USD by 2020139.
Currently, the most successful players of this trend are:
- the Landmark group, with an estimated annual revenue of 6 billion USD and more than 2200
stores in India & beyond140.
- RPG which owns 100 stores in India (Foodworld, Music world, Giants, Health & Glow) and is
strongly influencing the retail scene in India thanks to the launch of its largest supermarket chain
under the brand name Spencer’s141.
- K Rahega group which started in Mumbai and owns dozens of Shoppers Stop and HyperCity
stores throughout the country142.
- The Tata group, which has very recently decided to focus on expanding its hypermarket (food and
grocery) and lifestyle business by entering into joint venture with UK- based Tesco, in order to
open more stores of different sizes and formats all over the country143.
Until recently, the Indian retail sector was dominated by Indian corporations. This is changing gradually as
the Government of India started to open the sector to Foreign Direct Investment in a bid to attract foreign
capital144.
Food & Grocery segment is the backbone of the Indian retail sector: it is the biggest segment, accounting
for 2/3 of India’s total retail market, with expected annual growth of 15% over the next decade, due to
income growth, urbanization, changes in demographic profile and socio-economic environment, in big
metropolis as well as in smaller cities throughout the country145.
Tea consumption in India
Close to 88% of the total households in India report consuming tea, with hardly any significant difference
between socio-economic classes, since tea is a traditional drink and is considered one of the most
affordable beverages146. Over 80% of the people consume tea either before breakfast or with breakfast,
essentially milk tea with sugar, which is one of the reasons behind the high in-home consumption of
tea147.
In recent years, close to 80% of the households in both urban and rural India have shifted to buying packet
tea instead of loose tea, because of its perceived quality and better storage options. Neighbourhood
kirana stores are the most common place for tea purchase for more than 70% of the households, while
modern retail is emerging as the 2nd biggest channel for purchasing of tea due to the increasing preference
for packet tea, and the growing penetration of modern retail in India148.
138 IBEF. « Indian Retail », 2018. https://www.ibef.org/download/Retail-Report-2018.pdf. 139 IBEF. « Indian Retail », 2018. https://www.ibef.org/download/Retail-Report-2018.pdf 140 SM Zulaikha Fatima, C. Bisaria, and A. Prakash, Uncovering the Retail Scene in India, 2015 141 Ibid. 142 Ibid. 143 Ibid. 144 S. Guttal, The Changing Face of Food Retail in India, 2015 145 SM Zulaikha Fatima, C. Bisaria, and A. Prakash, Uncovering the Retail Scene in India, 2015 146 Tea Board of India, Executive Summary of Study on Domestic Consumption of Tea in India, 2008 147 Ibid. 148 Ibid.
Study of Assam tea value chains Page 25
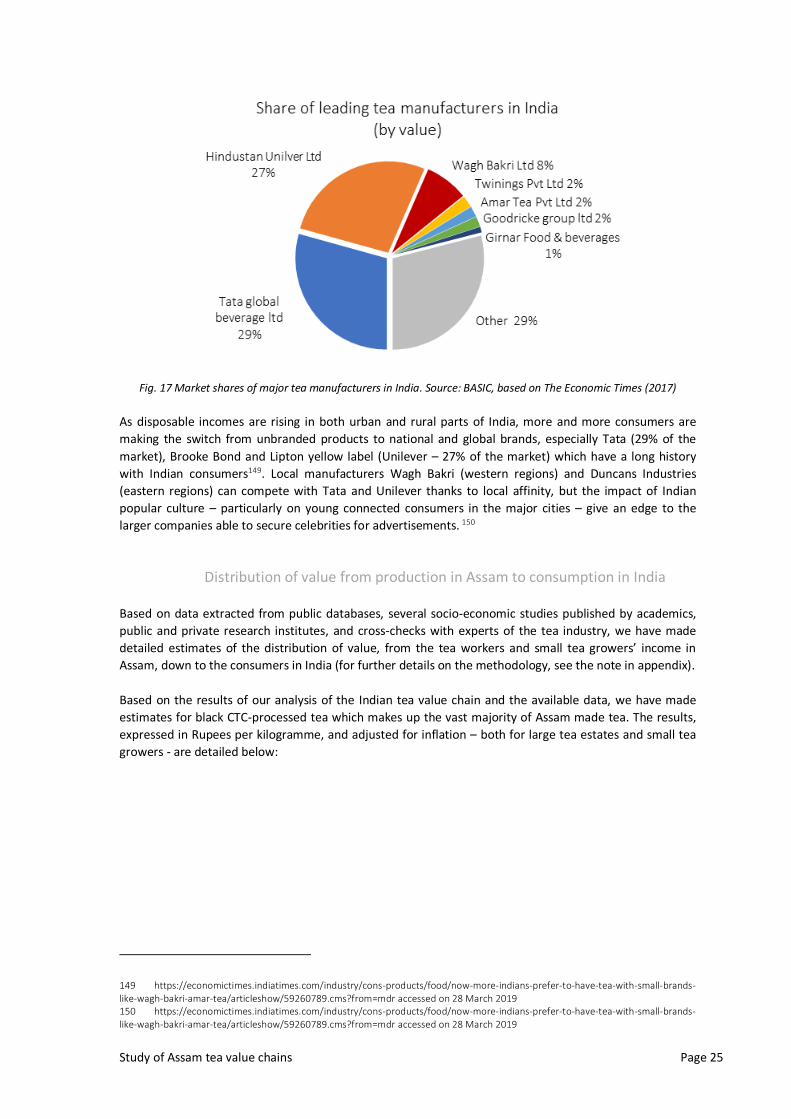
Fig. 17 Market shares of major tea manufacturers in India. Source: BASIC, based on The Economic Times (2017)
As disposable incomes are rising in both urban and rural parts of India, more and more consumers are
making the switch from unbranded products to national and global brands, especially Tata (29% of the
market), Brooke Bond and Lipton yellow label (Unilever – 27% of the market) which have a long history
with Indian consumers149. Local manufacturers Wagh Bakri (western regions) and Duncans Industries
(eastern regions) can compete with Tata and Unilever thanks to local affinity, but the impact of Indian
popular culture – particularly on young connected consumers in the major cities – give an edge to the
larger companies able to secure celebrities for advertisements. 150
Distribution of value from production in Assam to consumption in India
Based on data extracted from public databases, several socio-economic studies published by academics,
public and private research institutes, and cross-checks with experts of the tea industry, we have made
detailed estimates of the distribution of value, from the tea workers and small tea growers’ income in
Assam, down to the consumers in India (for further details on the methodology, see the note in appendix).
Based on the results of our analysis of the Indian tea value chain and the available data, we have made
estimates for black CTC-processed tea which makes up the vast majority of Assam made tea. The results,
expressed in Rupees per kilogramme, and adjusted for inflation – both for large tea estates and small tea
growers - are detailed below:
149 https://economictimes.indiatimes.com/industry/cons-products/food/now-more-indians-prefer-to-have-tea-with-small-brands-like-wagh-bakri-amar-tea/articleshow/59260789.cms?from=mdr accessed on 28 March 2019 150 https://economictimes.indiatimes.com/industry/cons-products/food/now-more-indians-prefer-to-have-tea-with-small-brands-like-wagh-bakri-amar-tea/articleshow/59260789.cms?from=mdr accessed on 28 March 2019
Study of Assam tea value chains Page 26
-
50,00
100,00
150,00
200,00
250,00
300,00
350,00
400,00
450,00
500,00
2003 2004 2005 2006 2007 2008 2009 2010 2011 2012 2013 2014 2015 2016 2017
Tea Value ChainAssam, India to India
Estate productionRs/kg - India inflation
India Retail Price Black Tea Loose
Retail price Tea Loose NORTH-EASTZONE
Retail price Tea Loose NORTH ZONE
Retail price Tea Loose All India Average
Wholesale Tea loose price Average AllIndia
Average Auctions price North India
Production cost fresh tea (Plantation)/-
Plucking cost (Plantation)
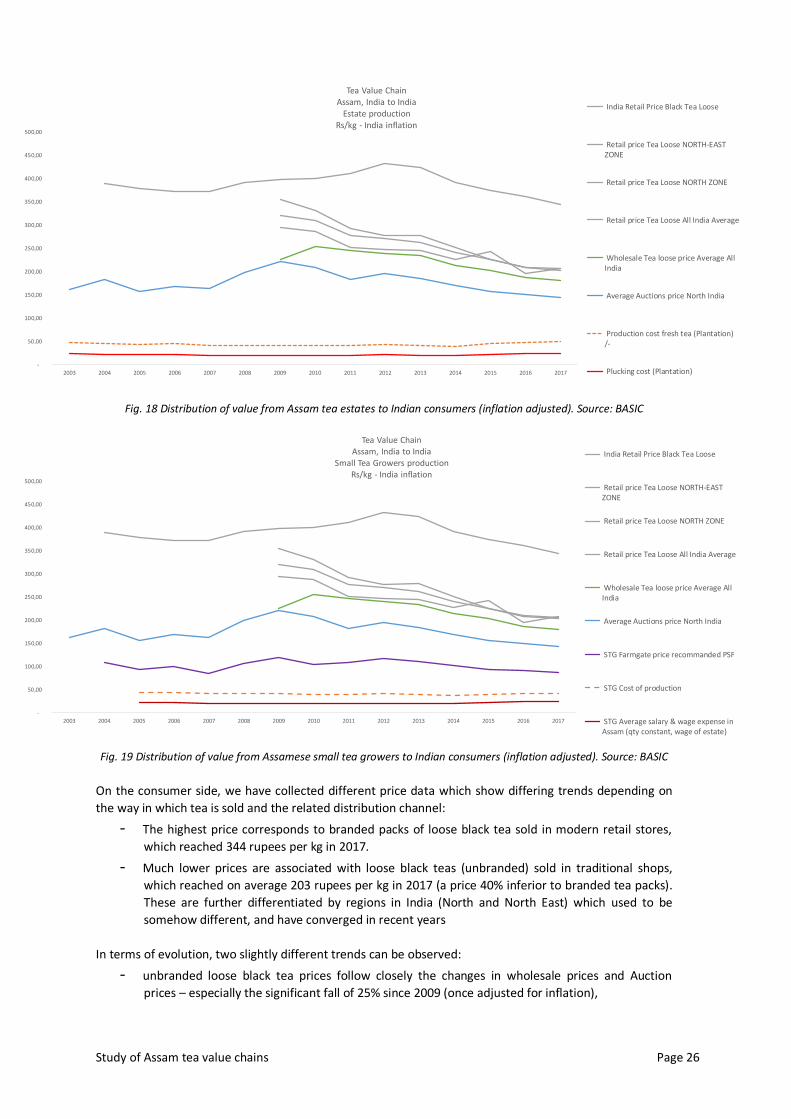
Fig. 18 Distribution of value from Assam tea estates to Indian consumers (inflation adjusted). Source: BASIC
-
50,00
100,00
150,00
200,00
250,00
300,00
350,00
400,00
450,00
500,00
2003 2004 2005 2006 2007 2008 2009 2010 2011 2012 2013 2014 2015 2016 2017
Tea Value ChainAssam, India to India
Small Tea Growers productionRs/kg - India inflation
India Retail Price Black Tea Loose
Retail price Tea Loose NORTH-EASTZONE
Retail price Tea Loose NORTH ZONE
Retail price Tea Loose All India Average
Wholesale Tea loose price Average AllIndia
Average Auctions price North India
STG Farmgate price recommanded PSF
STG Cost of production
STG Average salary & wage expense inAssam (qty constant, wage of estate)
Fig. 19 Distribution of value from Assamese small tea growers to Indian consumers (inflation adjusted). Source: BASIC
On the consumer side, we have collected different price data which show differing trends depending on
the way in which tea is sold and the related distribution channel:
- The highest price corresponds to branded packs of loose black tea sold in modern retail stores,
which reached 344 rupees per kg in 2017.
- Much lower prices are associated with loose black teas (unbranded) sold in traditional shops,
which reached on average 203 rupees per kg in 2017 (a price 40% inferior to branded tea packs).
These are further differentiated by regions in India (North and North East) which used to be
somehow different, and have converged in recent years
In terms of evolution, two slightly different trends can be observed:
- unbranded loose black tea prices follow closely the changes in wholesale prices and Auction
prices – especially the significant fall of 25% since 2009 (once adjusted for inflation),
Study of Assam tea value chains Page 27
- the retail price of branded packs has increased up until 2012, and then started to lower down at
the same pace as unbranded tea.
As shown in the above diagrams, the difference between branded and unbranded tea has strongly
increased over the last decade: whereas branded tea was only 12% more expensive than unbranded tea in
2009, it was 70% more expensive in 2017. A possible reason for such a difference is likely to be the
leveraging of brand awareness. As a matter of illustration, both Tata and Unilever brands have tapped
Bollywood actors to promote their tea products as premium and healthy alternatives to other beverages.
These marketing campaigns are particularly important because brand names play a large role in regional
preferences151. Furthermore, as higher income Indian consumers diversify their beverage choices, the
ability to provide multiple packaging formats and flavour variants has helped create more value, as
demonstrated by Tata’s Kanan Devan and Unilever’s Taj Mahal Tea’s various premium tea blends 152. Over
the past 5 years, these leverages seem to have reached certain limits as the price of branded black tea in
modern supermarkets has been lowering down at the same pace as loose tea in traditional shops. A
possible assumption is that this may illustrate a dynamics of price wars between brands and supermarket
chains, in a similar way as it has happened in the more mature European and North American markets.
In addition, the parallel relationship between the auction prices and the retail prices - especially for
branded tea in modern retail outlets - is quite striking. Given the significant concentration of negotiation
power at auction level and the long-standing relations between large brokers and big brands – in
particular Tata and Unilever – a possible assumption is that the tea brands, especially the leading ones,
may have managed to exert price pressure down in the chain upon auction prices in order to keep their
margins stable (as observed in our estimates). In order to prove that it is not the opposite (i.e. tea brands
adapting their consumer prices to the price level at auctions), further investigations would be required.
Looking at the costs in Assam tea estates, the most striking observation is the stagnation of workers’
wages – which correspond to the line “plucking costs” on the graph. According to our estimates, after
adjustment for inflation, the costs related to workers’ wages have gone from 23.60 rupees per kg in 2003
to 24.68 rupees per kg in 2017, i.e. an increase of 4.5% in 14 years. This increase does not necessarily
mean that the wages of the workers, especially the low-paid women, has increased over the period as the
plucking costs have been pushed up mainly by eroding yields in tea estates. In 2017, tea workers appear to
be suffering from the same low wages as 14 years ago, when taking into account inflation.
The case of small tea growers does not look any better according to our estimates: the price they receive
for their fresh green leaves is a fraction of the Auction price, following similar downward trend when there
is price pressure on the tea market, but not benefiting from increases when the tea market prices are up.
This most probably illustrates the lack of negotiation power of small tea growers who are forced to sell
their fresh tea to Bought Leaf Factories within 4 hours after there are plucked, giving the latter the upper
hand on price discussions.
As a result, the income generated by small tea growers, after deduction of input costs and wages of
temporary workers can be estimated at only 45.30 rupees per kg in 2017, to be compared with 78.45
rupees per kg in 2009, hence a fall of 42% of their income over the past 8 years. In the vast majority of
cases, this important decrease is not compensated by higher yields due to the stagnation of productivity,
in particular because of the growing adverse impacts of climate change on tea production in Assam (see
the chapter on the Assamese tea sector for further details).
Further investigations would be required in order to fully demonstrate the assumptions made in our
analysis, and understand in more details the relationships between the prices at the different stages of the
151 https://economictimes.indiatimes.com/industry/cons-products/food/now-more-indians-prefer-to-have-tea-with-small-brands-like-wagh-bakri-amar-tea/articleshow/59260789.cms?from=mdr accessed on 28 March 2019 152 https://economictimes.indiatimes.com/industry/cons-products/food/now-more-indians-prefer-to-have-tea-with-small-brands-like-wagh-bakri-amar-tea/articleshow/59260789.cms?from=mdr accessed on 28 March 2019
Study of Assam tea value chains Page 28
chain, and issues such as quality grades, packaging formats, growing concentration of buyers, changes in
public regulations/policies and competition from foreign tea producers (amongst others).
Leverage for paying living wages/income in the Indian tea sector
As described in the chapter on the tea industry in Assam, the current wages of tea workers – most of all
women – is much below what can be considered as a living wage. According to academic estimates, their
wage (cash and in-kind) should be multiplied by 2.6 in order to achieve sustainable living conditions (cf.
section 3a).
-
20,00
40,00
60,00
80,00
100,00
120,00
2003 2004 2005 2006 2007 2008 2009 2010 2011 2012 2013 2014 2015 2016 2017
Tea Value ChainAssam, India to India
Estate productionPercent share
India Retail Price Black Tea Loose
Retail price Tea Loose NORTH-EASTZONE
Retail price Tea Loose NORTH ZONE
Retail price Tea Loose All India Average
Wholesale Tea loose price Average AllIndia
Average Auctions price North India
Production cost fresh tea (Plantation)/-
Plucking cost (Plantation)
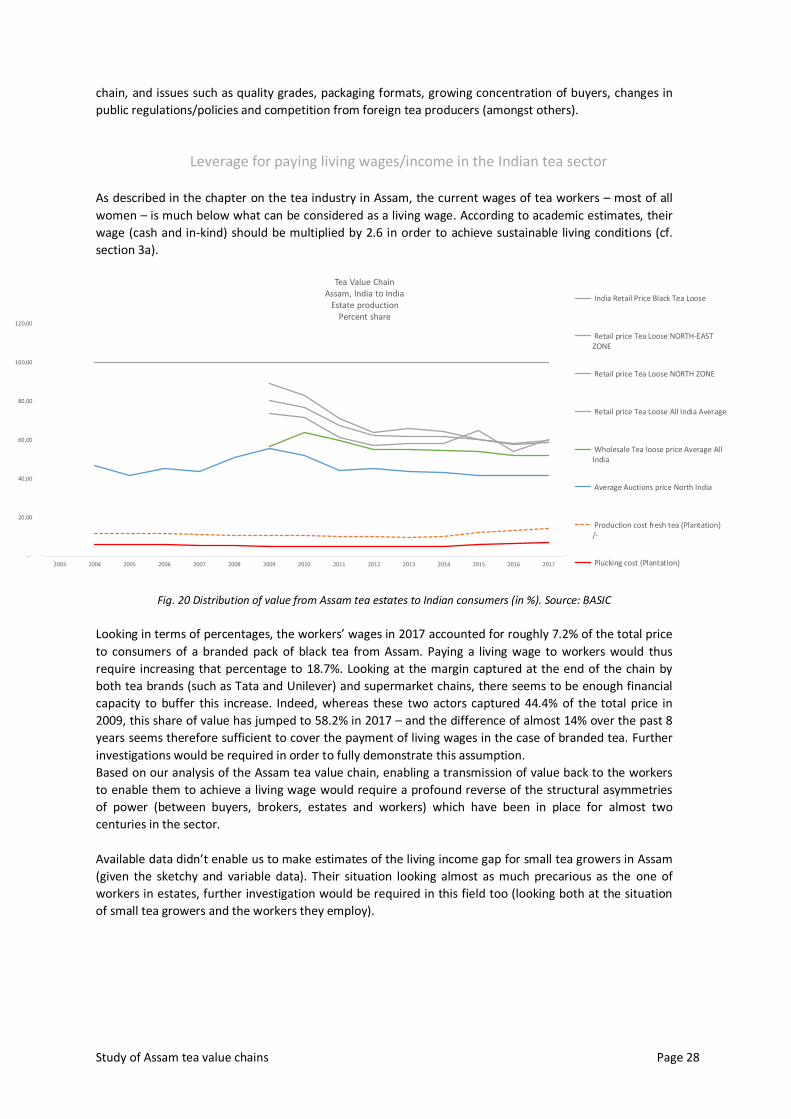
Fig. 20 Distribution of value from Assam tea estates to Indian consumers (in %). Source: BASIC
Looking in terms of percentages, the workers’ wages in 2017 accounted for roughly 7.2% of the total price
to consumers of a branded pack of black tea from Assam. Paying a living wage to workers would thus
require increasing that percentage to 18.7%. Looking at the margin captured at the end of the chain by
both tea brands (such as Tata and Unilever) and supermarket chains, there seems to be enough financial
capacity to buffer this increase. Indeed, whereas these two actors captured 44.4% of the total price in
2009, this share of value has jumped to 58.2% in 2017 – and the difference of almost 14% over the past 8
years seems therefore sufficient to cover the payment of living wages in the case of branded tea. Further
investigations would be required in order to fully demonstrate this assumption.
Based on our analysis of the Assam tea value chain, enabling a transmission of value back to the workers
to enable them to achieve a living wage would require a profound reverse of the structural asymmetries
of power (between buyers, brokers, estates and workers) which have been in place for almost two
centuries in the sector.
Available data didn’t enable us to make estimates of the living income gap for small tea growers in Assam
(given the sketchy and variable data). Their situation looking almost as much precarious as the one of
workers in estates, further investigation would be required in this field too (looking both at the situation
of small tea growers and the workers they employ).
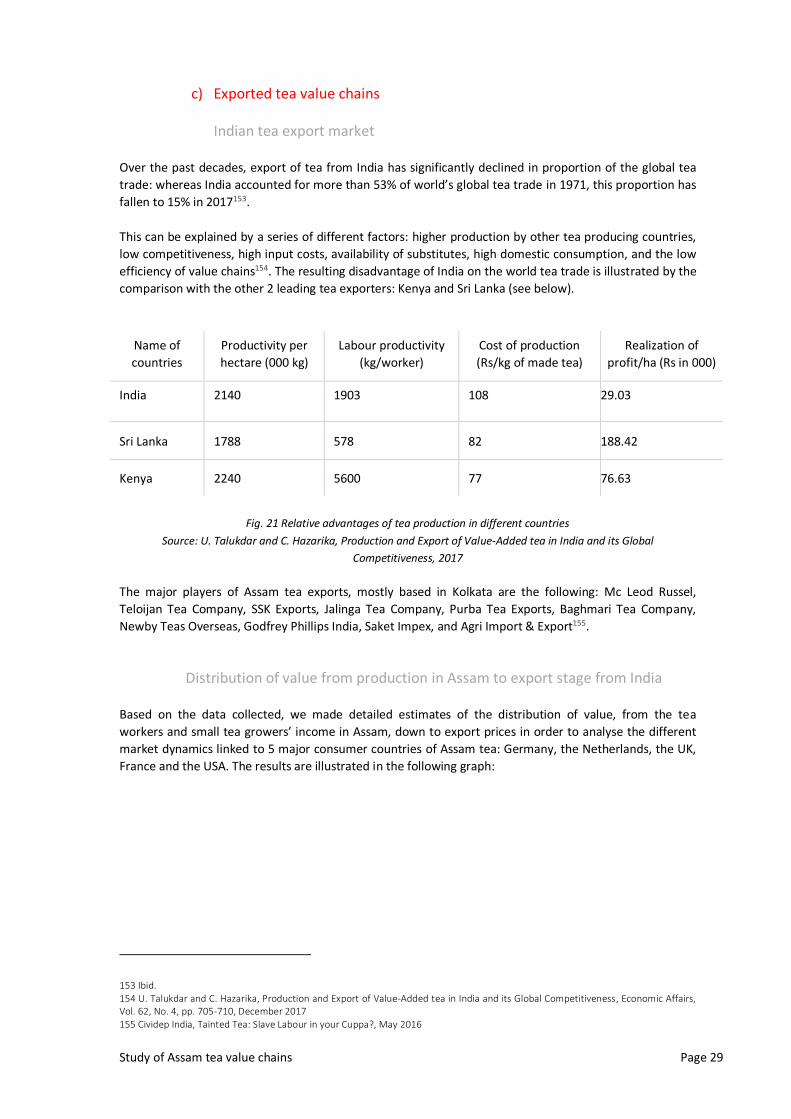
Study of Assam tea value chains Page 29
c) Exported tea value chains
Indian tea export market
Over the past decades, export of tea from India has significantly declined in proportion of the global tea
trade: whereas India accounted for more than 53% of world’s global tea trade in 1971, this proportion has
fallen to 15% in 2017153.
This can be explained by a series of different factors: higher production by other tea producing countries,
low competitiveness, high input costs, availability of substitutes, high domestic consumption, and the low
efficiency of value chains154. The resulting disadvantage of India on the world tea trade is illustrated by the
comparison with the other 2 leading tea exporters: Kenya and Sri Lanka (see below).
Name of
countries
Productivity per
hectare (000 kg)
Labour productivity
(kg/worker)
Cost of production
(Rs/kg of made tea)
Realization of
profit/ha (Rs in 000)
India 2140 1903 108 29.03
Sri Lanka 1788 578 82 188.42
Kenya 2240 5600 77 76.63
Fig. 21 Relative advantages of tea production in different countries
Source: U. Talukdar and C. Hazarika, Production and Export of Value-Added tea in India and its Global
Competitiveness, 2017
The major players of Assam tea exports, mostly based in Kolkata are the following: Mc Leod Russel,
Teloijan Tea Company, SSK Exports, Jalinga Tea Company, Purba Tea Exports, Baghmari Tea Company,
Newby Teas Overseas, Godfrey Phillips India, Saket Impex, and Agri Import & Export155.
Distribution of value from production in Assam to export stage from India
Based on the data collected, we made detailed estimates of the distribution of value, from the tea
workers and small tea growers’ income in Assam, down to export prices in order to analyse the different
market dynamics linked to 5 major consumer countries of Assam tea: Germany, the Netherlands, the UK,
France and the USA. The results are illustrated in the following graph:
153 Ibid. 154 U. Talukdar and C. Hazarika, Production and Export of Value-Added tea in India and its Global Competitiveness, Economic Affairs, Vol. 62, No. 4, pp. 705-710, December 2017 155 Cividep India, Tainted Tea: Slave Labour in your Cuppa?, May 2016
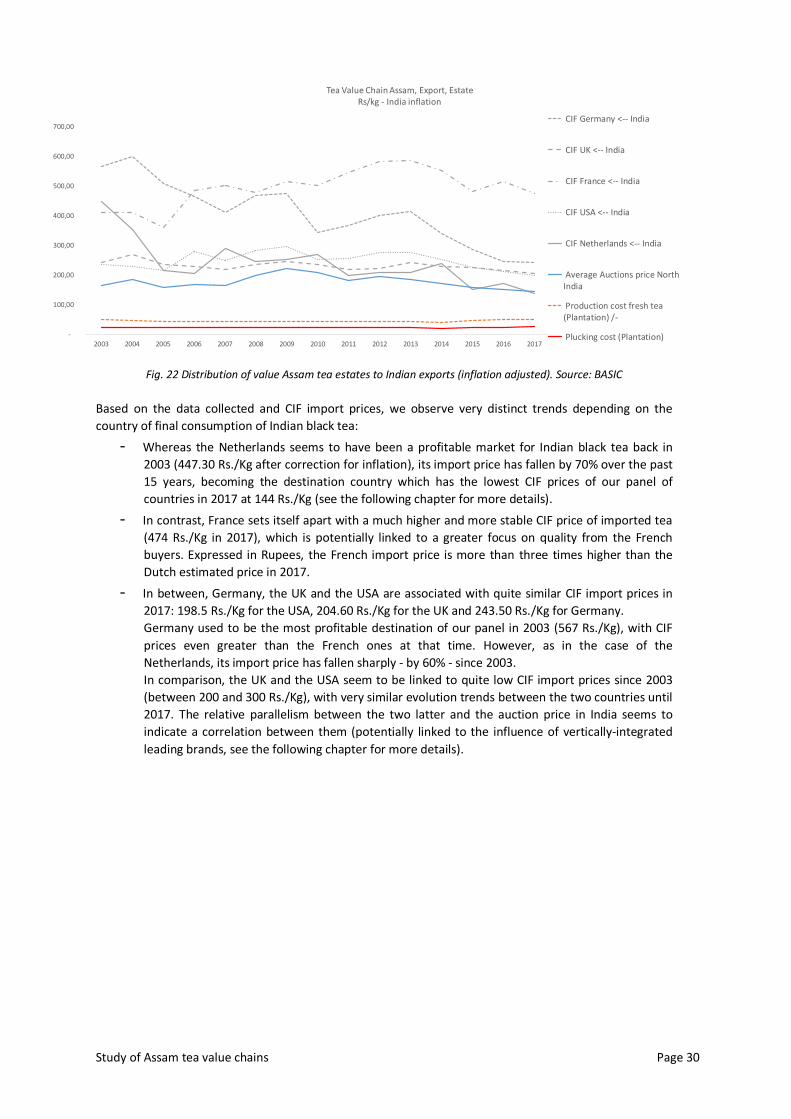
Study of Assam tea value chains Page 30
-
100,00
200,00
300,00
400,00
500,00
600,00
700,00
2003 2004 2005 2006 2007 2008 2009 2010 2011 2012 2013 2014 2015 2016 2017
Tea Value Chain Assam, Export, EstateRs/kg - India inflation
CIF Germany <-- India
CIF UK <-- India
CIF France <-- India
CIF USA <-- India
CIF Netherlands <-- India
Average Auctions price NorthIndia
Production cost fresh tea(Plantation) /-
Plucking cost (Plantation)
Fig. 22 Distribution of value Assam tea estates to Indian exports (inflation adjusted). Source: BASIC
Based on the data collected and CIF import prices, we observe very distinct trends depending on the
country of final consumption of Indian black tea:
- Whereas the Netherlands seems to have been a profitable market for Indian black tea back in
2003 (447.30 Rs./Kg after correction for inflation), its import price has fallen by 70% over the past
15 years, becoming the destination country which has the lowest CIF prices of our panel of
countries in 2017 at 144 Rs./Kg (see the following chapter for more details).
- In contrast, France sets itself apart with a much higher and more stable CIF price of imported tea
(474 Rs./Kg in 2017), which is potentially linked to a greater focus on quality from the French
buyers. Expressed in Rupees, the French import price is more than three times higher than the
Dutch estimated price in 2017.
- In between, Germany, the UK and the USA are associated with quite similar CIF import prices in
2017: 198.5 Rs./Kg for the USA, 204.60 Rs./Kg for the UK and 243.50 Rs./Kg for Germany.
Germany used to be the most profitable destination of our panel in 2003 (567 Rs./Kg), with CIF
prices even greater than the French ones at that time. However, as in the case of the
Netherlands, its import price has fallen sharply - by 60% - since 2003.
In comparison, the UK and the USA seem to be linked to quite low CIF import prices since 2003
(between 200 and 300 Rs./Kg), with very similar evolution trends between the two countries until
2017. The relative parallelism between the two latter and the auction price in India seems to
indicate a correlation between them (potentially linked to the influence of vertically-integrated
leading brands, see the following chapter for more details).
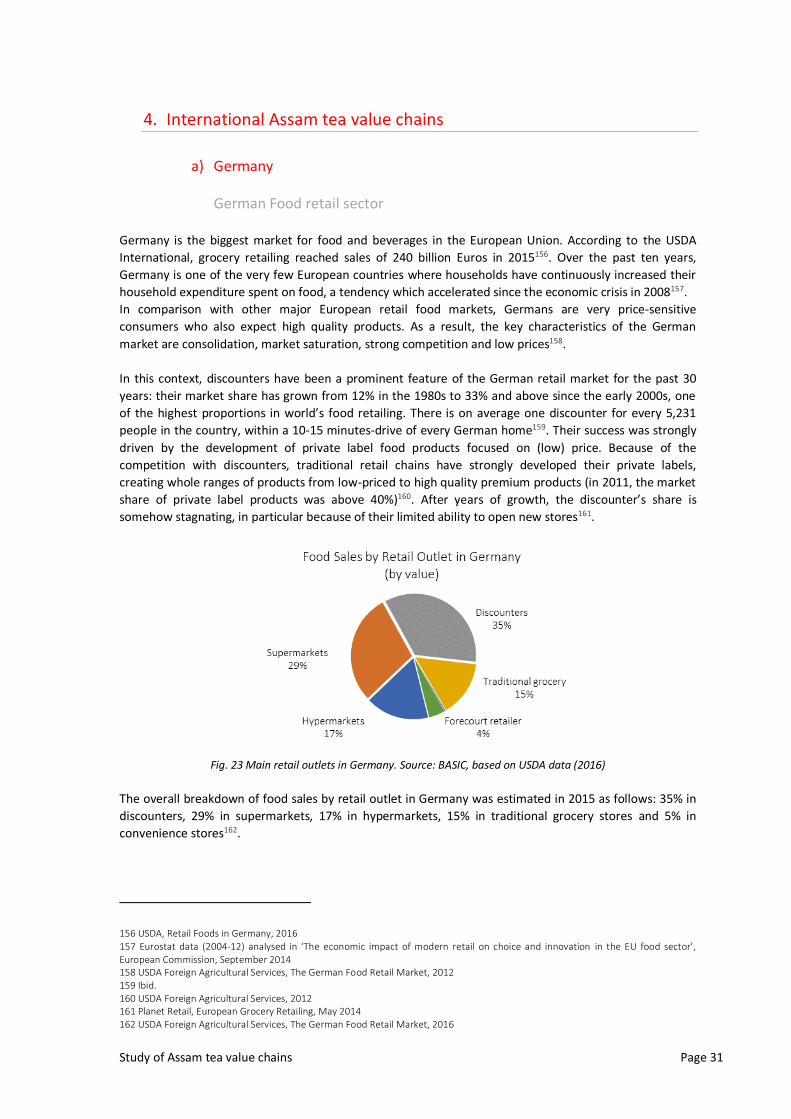
Study of Assam tea value chains Page 31
4. International Assam tea value chains
a) Germany
German Food retail sector
Germany is the biggest market for food and beverages in the European Union. According to the USDA
International, grocery retailing reached sales of 240 billion Euros in 2015156. Over the past ten years,
Germany is one of the very few European countries where households have continuously increased their
household expenditure spent on food, a tendency which accelerated since the economic crisis in 2008157.
In comparison with other major European retail food markets, Germans are very price-sensitive
consumers who also expect high quality products. As a result, the key characteristics of the German
market are consolidation, market saturation, strong competition and low prices158.
In this context, discounters have been a prominent feature of the German retail market for the past 30
years: their market share has grown from 12% in the 1980s to 33% and above since the early 2000s, one
of the highest proportions in world’s food retailing. There is on average one discounter for every 5,231
people in the country, within a 10-15 minutes-drive of every German home159. Their success was strongly
driven by the development of private label food products focused on (low) price. Because of the
competition with discounters, traditional retail chains have strongly developed their private labels,
creating whole ranges of products from low-priced to high quality premium products (in 2011, the market
share of private label products was above 40%)160. After years of growth, the discounter’s share is
somehow stagnating, in particular because of their limited ability to open new stores161.
Fig. 23 Main retail outlets in Germany. Source: BASIC, based on USDA data (2016)
The overall breakdown of food sales by retail outlet in Germany was estimated in 2015 as follows: 35% in
discounters, 29% in supermarkets, 17% in hypermarkets, 15% in traditional grocery stores and 5% in
convenience stores162.
156 USDA, Retail Foods in Germany, 2016 157 Eurostat data (2004-12) analysed in ‘The economic impact of modern retail on choice and innovation in the EU food sector’, European Commission, September 2014 158 USDA Foreign Agricultural Services, The German Food Retail Market, 2012 159 Ibid. 160 USDA Foreign Agricultural Services, 2012 161 Planet Retail, European Grocery Retailing, May 2014 162 USDA Foreign Agricultural Services, The German Food Retail Market, 2016
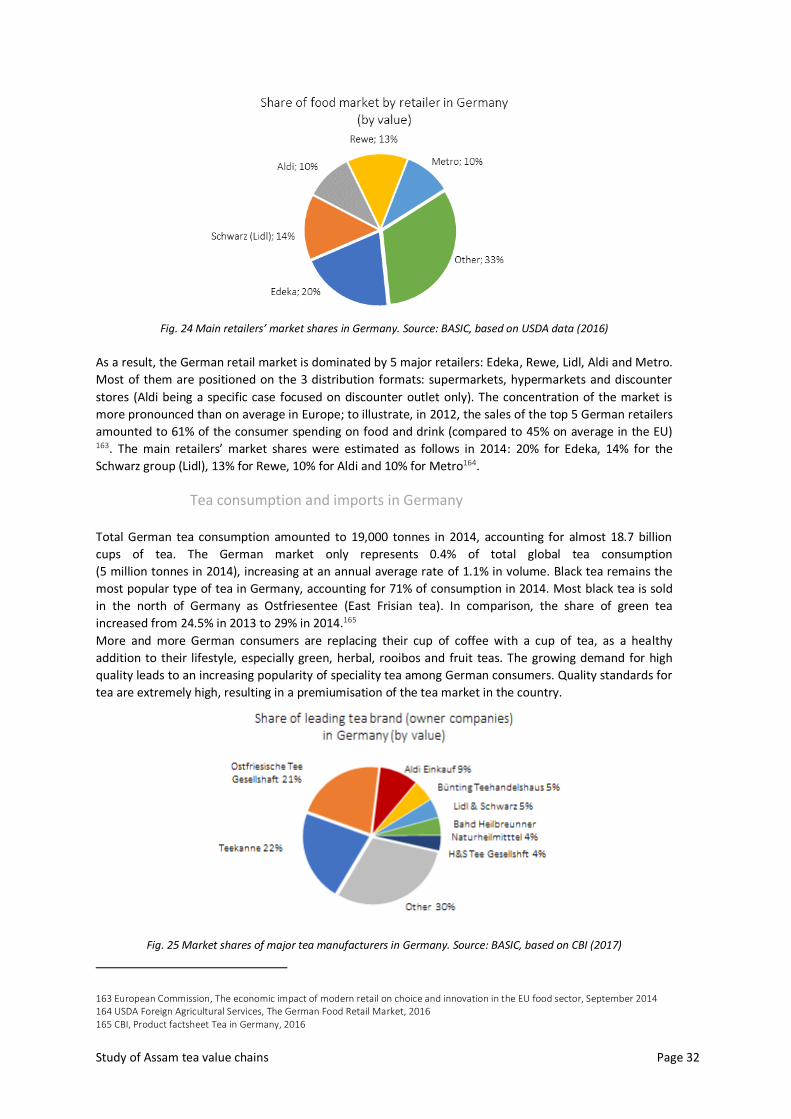
Study of Assam tea value chains Page 32
Fig. 24 Main retailers’ market shares in Germany. Source: BASIC, based on USDA data (2016)
As a result, the German retail market is dominated by 5 major retailers: Edeka, Rewe, Lidl, Aldi and Metro.
Most of them are positioned on the 3 distribution formats: supermarkets, hypermarkets and discounter
stores (Aldi being a specific case focused on discounter outlet only). The concentration of the market is
more pronounced than on average in Europe; to illustrate, in 2012, the sales of the top 5 German retailers
amounted to 61% of the consumer spending on food and drink (compared to 45% on average in the EU)
163. The main retailers’ market shares were estimated as follows in 2014: 20% for Edeka, 14% for the
Schwarz group (Lidl), 13% for Rewe, 10% for Aldi and 10% for Metro164.
Tea consumption and imports in Germany
Total German tea consumption amounted to 19,000 tonnes in 2014, accounting for almost 18.7 billion
cups of tea. The German market only represents 0.4% of total global tea consumption
(5 million tonnes in 2014), increasing at an annual average rate of 1.1% in volume. Black tea remains the
most popular type of tea in Germany, accounting for 71% of consumption in 2014. Most black tea is sold
in the north of Germany as Ostfriesentee (East Frisian tea). In comparison, the share of green tea
increased from 24.5% in 2013 to 29% in 2014.165
More and more German consumers are replacing their cup of coffee with a cup of tea, as a healthy
addition to their lifestyle, especially green, herbal, rooibos and fruit teas. The growing demand for high
quality leads to an increasing popularity of speciality tea among German consumers. Quality standards for
tea are extremely high, resulting in a premiumisation of the tea market in the country.
Fig. 25 Market shares of major tea manufacturers in Germany. Source: BASIC, based on CBI (2017)
163 European Commission, The economic impact of modern retail on choice and innovation in the EU food sector, September 2014 164 USDA Foreign Agricultural Services, The German Food Retail Market, 2016 165 CBI, Product factsheet Tea in Germany, 2016
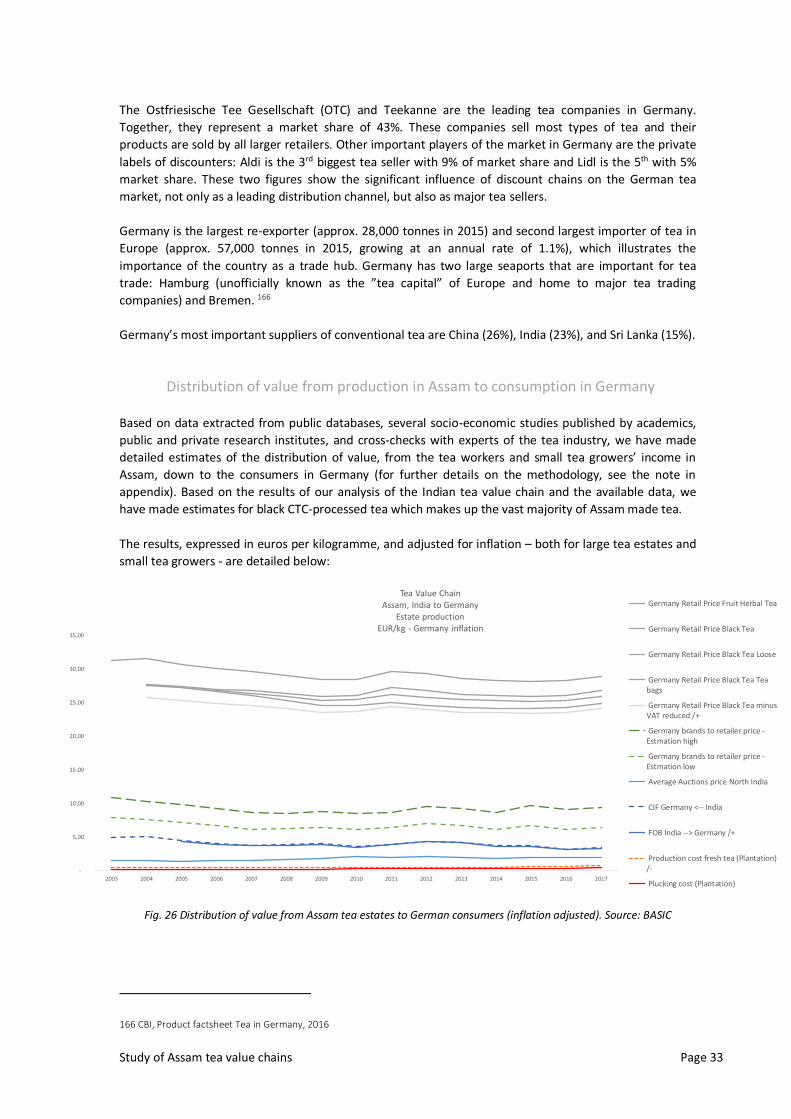
Study of Assam tea value chains Page 33
The Ostfriesische Tee Gesellschaft (OTC) and Teekanne are the leading tea companies in Germany.
Together, they represent a market share of 43%. These companies sell most types of tea and their
products are sold by all larger retailers. Other important players of the market in Germany are the private
labels of discounters: Aldi is the 3rd biggest tea seller with 9% of market share and Lidl is the 5th with 5%
market share. These two figures show the significant influence of discount chains on the German tea
market, not only as a leading distribution channel, but also as major tea sellers.
Germany is the largest re-exporter (approx. 28,000 tonnes in 2015) and second largest importer of tea in
Europe (approx. 57,000 tonnes in 2015, growing at an annual rate of 1.1%), which illustrates the
importance of the country as a trade hub. Germany has two large seaports that are important for tea
trade: Hamburg (unofficially known as the ”tea capital” of Europe and home to major tea trading
companies) and Bremen. 166
Germany’s most important suppliers of conventional tea are China (26%), India (23%), and Sri Lanka (15%).
Distribution of value from production in Assam to consumption in Germany
Based on data extracted from public databases, several socio-economic studies published by academics,
public and private research institutes, and cross-checks with experts of the tea industry, we have made
detailed estimates of the distribution of value, from the tea workers and small tea growers’ income in
Assam, down to the consumers in Germany (for further details on the methodology, see the note in
appendix). Based on the results of our analysis of the Indian tea value chain and the available data, we
have made estimates for black CTC-processed tea which makes up the vast majority of Assam made tea.
The results, expressed in euros per kilogramme, and adjusted for inflation – both for large tea estates and
small tea growers - are detailed below:
-
5,00
10,00
15,00
20,00
25,00
30,00
35,00
2003 2004 2005 2006 2007 2008 2009 2010 2011 2012 2013 2014 2015 2016 2017
Tea Value ChainAssam, India to Germany
Estate productionEUR/kg - Germany inflation
Germany Retail Price Fruit Herbal Tea
Germany Retail Price Black Tea
Germany Retail Price Black Tea Loose
Germany Retail Price Black Tea Teabags
Germany Retail Price Black Tea minusVAT reduced /+
Germany brands to retailer price -Estmation high
Germany brands to retailer price -Estmation low
Average Auctions price North India
CIF Germany <-- India
FOB India --> Germany /+
Production cost fresh tea (Plantation)/-
Plucking cost (Plantation)
Fig. 26 Distribution of value from Assam tea estates to German consumers (inflation adjusted). Source: BASIC
166 CBI, Product factsheet Tea in Germany, 2016
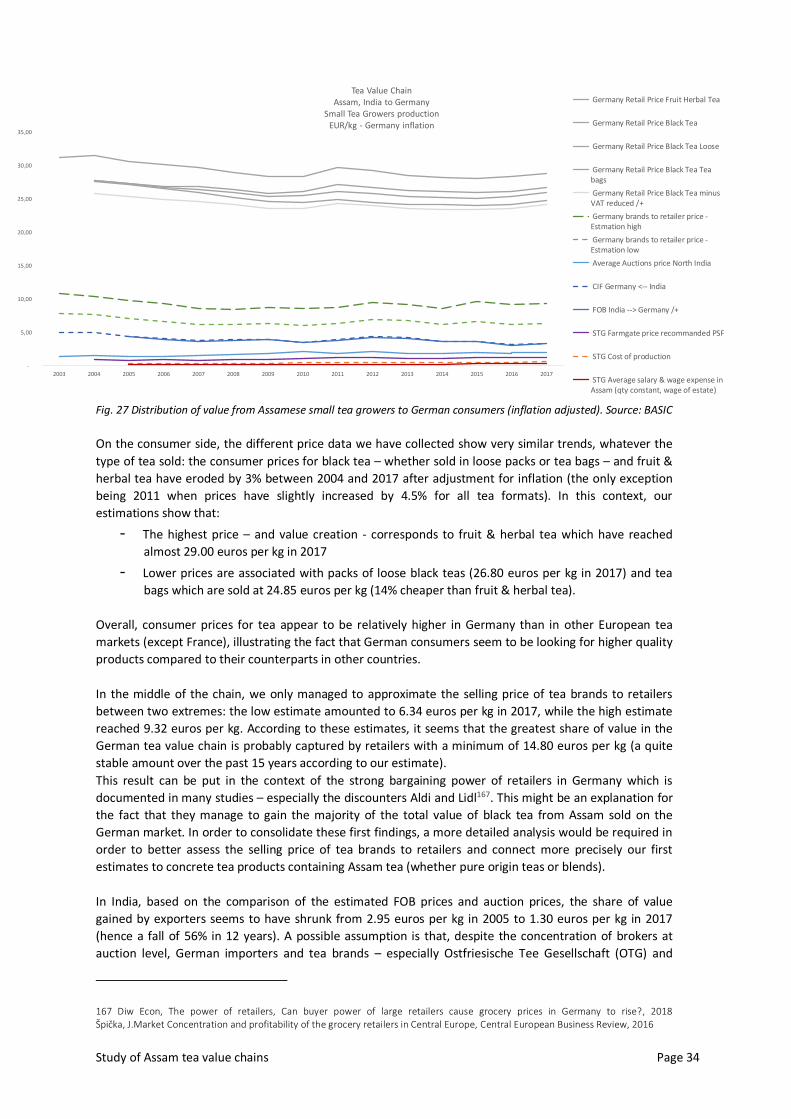
Study of Assam tea value chains Page 34
-
5,00
10,00
15,00
20,00
25,00
30,00
35,00
2003 2004 2005 2006 2007 2008 2009 2010 2011 2012 2013 2014 2015 2016 2017
Tea Value ChainAssam, India to Germany
Small Tea Growers productionEUR/kg - Germany inflation
Germany Retail Price Fruit Herbal Tea
Germany Retail Price Black Tea
Germany Retail Price Black Tea Loose
Germany Retail Price Black Tea Teabags
Germany Retail Price Black Tea minusVAT reduced /+
Germany brands to retailer price -Estmation high
Germany brands to retailer price -Estmation low
Average Auctions price North India
CIF Germany <-- India
FOB India --> Germany /+
STG Farmgate price recommanded PSF
STG Cost of production
STG Average salary & wage expense inAssam (qty constant, wage of estate)
Fig. 27 Distribution of value from Assamese small tea growers to German consumers (inflation adjusted). Source: BASIC
On the consumer side, the different price data we have collected show very similar trends, whatever the
type of tea sold: the consumer prices for black tea – whether sold in loose packs or tea bags – and fruit &
herbal tea have eroded by 3% between 2004 and 2017 after adjustment for inflation (the only exception
being 2011 when prices have slightly increased by 4.5% for all tea formats). In this context, our
estimations show that:
- The highest price – and value creation - corresponds to fruit & herbal tea which have reached
almost 29.00 euros per kg in 2017
- Lower prices are associated with packs of loose black teas (26.80 euros per kg in 2017) and tea
bags which are sold at 24.85 euros per kg (14% cheaper than fruit & herbal tea).
Overall, consumer prices for tea appear to be relatively higher in Germany than in other European tea
markets (except France), illustrating the fact that German consumers seem to be looking for higher quality
products compared to their counterparts in other countries.
In the middle of the chain, we only managed to approximate the selling price of tea brands to retailers
between two extremes: the low estimate amounted to 6.34 euros per kg in 2017, while the high estimate
reached 9.32 euros per kg. According to these estimates, it seems that the greatest share of value in the
German tea value chain is probably captured by retailers with a minimum of 14.80 euros per kg (a quite
stable amount over the past 15 years according to our estimate).
This result can be put in the context of the strong bargaining power of retailers in Germany which is
documented in many studies – especially the discounters Aldi and Lidl167. This might be an explanation for
the fact that they manage to gain the majority of the total value of black tea from Assam sold on the
German market. In order to consolidate these first findings, a more detailed analysis would be required in
order to better assess the selling price of tea brands to retailers and connect more precisely our first
estimates to concrete tea products containing Assam tea (whether pure origin teas or blends).
In India, based on the comparison of the estimated FOB prices and auction prices, the share of value
gained by exporters seems to have shrunk from 2.95 euros per kg in 2005 to 1.30 euros per kg in 2017
(hence a fall of 56% in 12 years). A possible assumption is that, despite the concentration of brokers at
auction level, German importers and tea brands – especially Ostfriesische Tee Gesellschaft (OTG) and
167 Diw Econ, The power of retailers, Can buyer power of large retailers cause grocery prices in Germany to rise?, 2018 Špička, J.Market Concentration and profitability of the grocery retailers in Central Europe, Central European Business Review, 2016
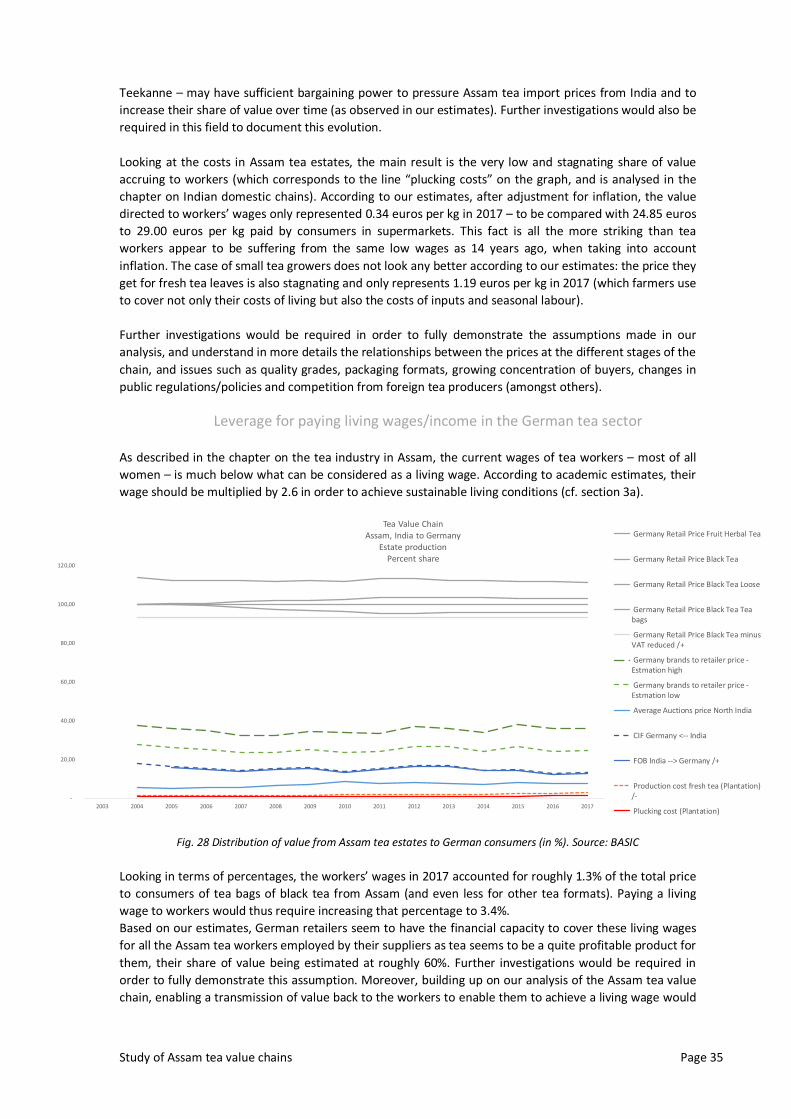
Study of Assam tea value chains Page 35
Teekanne – may have sufficient bargaining power to pressure Assam tea import prices from India and to
increase their share of value over time (as observed in our estimates). Further investigations would also be
required in this field to document this evolution.
Looking at the costs in Assam tea estates, the main result is the very low and stagnating share of value
accruing to workers (which corresponds to the line “plucking costs” on the graph, and is analysed in the
chapter on Indian domestic chains). According to our estimates, after adjustment for inflation, the value
directed to workers’ wages only represented 0.34 euros per kg in 2017 – to be compared with 24.85 euros
to 29.00 euros per kg paid by consumers in supermarkets. This fact is all the more striking than tea
workers appear to be suffering from the same low wages as 14 years ago, when taking into account
inflation. The case of small tea growers does not look any better according to our estimates: the price they
get for fresh tea leaves is also stagnating and only represents 1.19 euros per kg in 2017 (which farmers use
to cover not only their costs of living but also the costs of inputs and seasonal labour).
Further investigations would be required in order to fully demonstrate the assumptions made in our
analysis, and understand in more details the relationships between the prices at the different stages of the
chain, and issues such as quality grades, packaging formats, growing concentration of buyers, changes in
public regulations/policies and competition from foreign tea producers (amongst others).
Leverage for paying living wages/income in the German tea sector
As described in the chapter on the tea industry in Assam, the current wages of tea workers – most of all
women – is much below what can be considered as a living wage. According to academic estimates, their
wage should be multiplied by 2.6 in order to achieve sustainable living conditions (cf. section 3a).
-
20,00
40,00
60,00
80,00
100,00
120,00
2003 2004 2005 2006 2007 2008 2009 2010 2011 2012 2013 2014 2015 2016 2017
Tea Value ChainAssam, India to Germany
Estate productionPercent share
Germany Retail Price Fruit Herbal Tea
Germany Retail Price Black Tea
Germany Retail Price Black Tea Loose
Germany Retail Price Black Tea Teabags
Germany Retail Price Black Tea minusVAT reduced /+
Germany brands to retailer price -Estmation high
Germany brands to retailer price -Estmation low
Average Auctions price North India
CIF Germany <-- India
FOB India --> Germany /+
Production cost fresh tea (Plantation)/-
Plucking cost (Plantation)
Fig. 28 Distribution of value from Assam tea estates to German consumers (in %). Source: BASIC
Looking in terms of percentages, the workers’ wages in 2017 accounted for roughly 1.3% of the total price
to consumers of tea bags of black tea from Assam (and even less for other tea formats). Paying a living
wage to workers would thus require increasing that percentage to 3.4%.
Based on our estimates, German retailers seem to have the financial capacity to cover these living wages
for all the Assam tea workers employed by their suppliers as tea seems to be a quite profitable product for
them, their share of value being estimated at roughly 60%. Further investigations would be required in
order to fully demonstrate this assumption. Moreover, building up on our analysis of the Assam tea value
chain, enabling a transmission of value back to the workers to enable them to achieve a living wage would
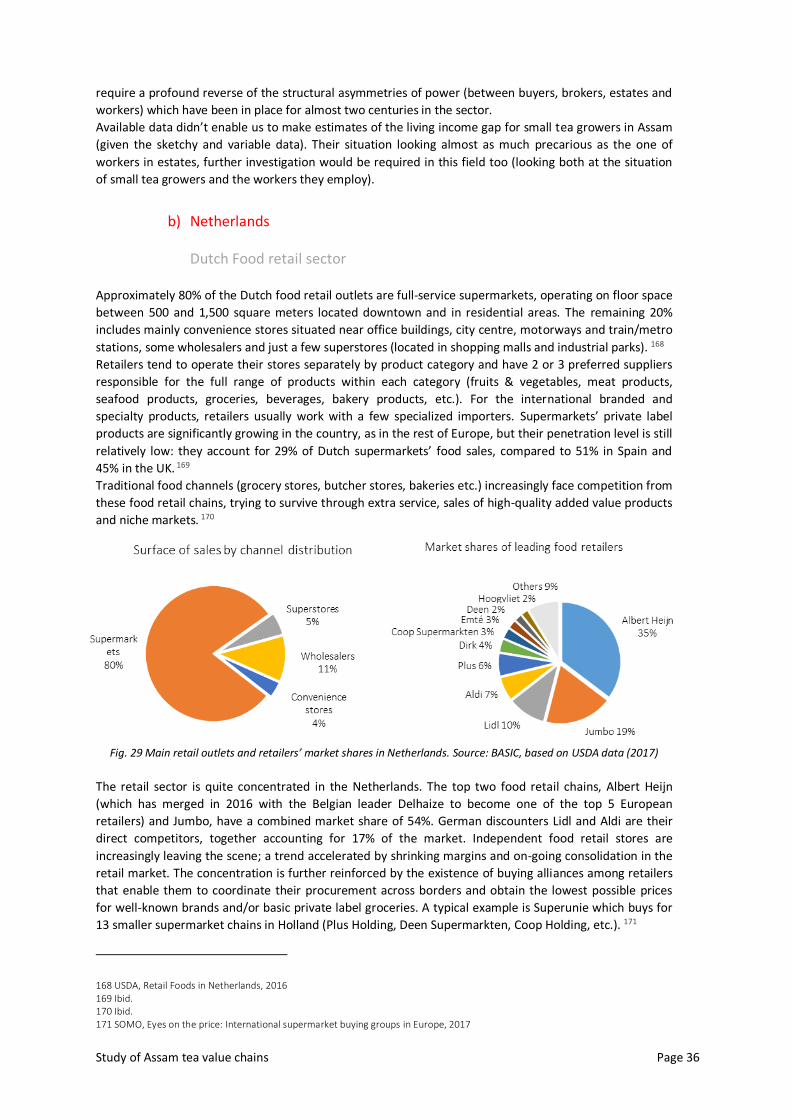
Study of Assam tea value chains Page 36
require a profound reverse of the structural asymmetries of power (between buyers, brokers, estates and
workers) which have been in place for almost two centuries in the sector.
Available data didn’t enable us to make estimates of the living income gap for small tea growers in Assam
(given the sketchy and variable data). Their situation looking almost as much precarious as the one of
workers in estates, further investigation would be required in this field too (looking both at the situation
of small tea growers and the workers they employ).
b) Netherlands
Dutch Food retail sector
Approximately 80% of the Dutch food retail outlets are full-service supermarkets, operating on floor space
between 500 and 1,500 square meters located downtown and in residential areas. The remaining 20%
includes mainly convenience stores situated near office buildings, city centre, motorways and train/metro
stations, some wholesalers and just a few superstores (located in shopping malls and industrial parks). 168
Retailers tend to operate their stores separately by product category and have 2 or 3 preferred suppliers
responsible for the full range of products within each category (fruits & vegetables, meat products,
seafood products, groceries, beverages, bakery products, etc.). For the international branded and
specialty products, retailers usually work with a few specialized importers. Supermarkets’ private label
products are significantly growing in the country, as in the rest of Europe, but their penetration level is still
relatively low: they account for 29% of Dutch supermarkets’ food sales, compared to 51% in Spain and
45% in the UK. 169
Traditional food channels (grocery stores, butcher stores, bakeries etc.) increasingly face competition from
these food retail chains, trying to survive through extra service, sales of high-quality added value products
and niche markets. 170
Fig. 29 Main retail outlets and retailers’ market shares in Netherlands. Source: BASIC, based on USDA data (2017)
The retail sector is quite concentrated in the Netherlands. The top two food retail chains, Albert Heijn
(which has merged in 2016 with the Belgian leader Delhaize to become one of the top 5 European
retailers) and Jumbo, have a combined market share of 54%. German discounters Lidl and Aldi are their
direct competitors, together accounting for 17% of the market. Independent food retail stores are
increasingly leaving the scene; a trend accelerated by shrinking margins and on-going consolidation in the
retail market. The concentration is further reinforced by the existence of buying alliances among retailers
that enable them to coordinate their procurement across borders and obtain the lowest possible prices
for well-known brands and/or basic private label groceries. A typical example is Superunie which buys for
13 smaller supermarket chains in Holland (Plus Holding, Deen Supermarkten, Coop Holding, etc.). 171
168 USDA, Retail Foods in Netherlands, 2016 169 Ibid. 170 Ibid. 171 SOMO, Eyes on the price: International supermarket buying groups in Europe, 2017
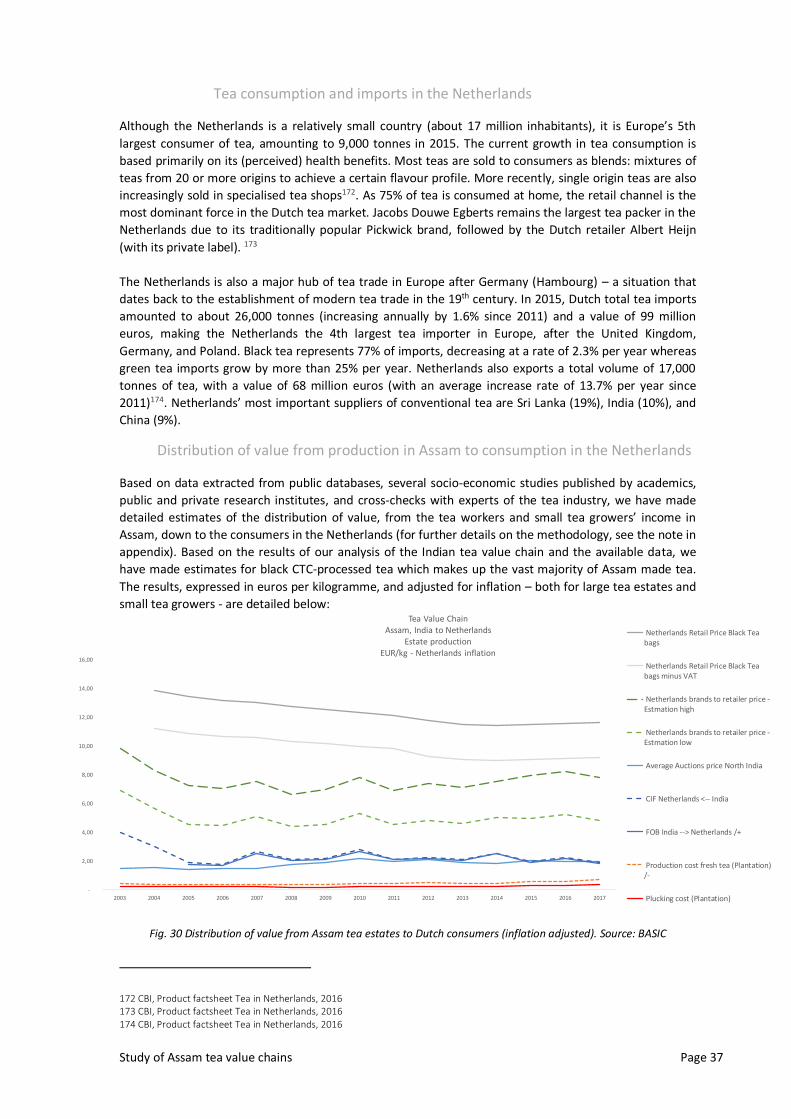
Study of Assam tea value chains Page 37
Tea consumption and imports in the Netherlands
Although the Netherlands is a relatively small country (about 17 million inhabitants), it is Europe’s 5th
largest consumer of tea, amounting to 9,000 tonnes in 2015. The current growth in tea consumption is
based primarily on its (perceived) health benefits. Most teas are sold to consumers as blends: mixtures of
teas from 20 or more origins to achieve a certain flavour profile. More recently, single origin teas are also
increasingly sold in specialised tea shops172. As 75% of tea is consumed at home, the retail channel is the
most dominant force in the Dutch tea market. Jacobs Douwe Egberts remains the largest tea packer in the
Netherlands due to its traditionally popular Pickwick brand, followed by the Dutch retailer Albert Heijn
(with its private label). 173
The Netherlands is also a major hub of tea trade in Europe after Germany (Hambourg) – a situation that
dates back to the establishment of modern tea trade in the 19th century. In 2015, Dutch total tea imports
amounted to about 26,000 tonnes (increasing annually by 1.6% since 2011) and a value of 99 million
euros, making the Netherlands the 4th largest tea importer in Europe, after the United Kingdom,
Germany, and Poland. Black tea represents 77% of imports, decreasing at a rate of 2.3% per year whereas
green tea imports grow by more than 25% per year. Netherlands also exports a total volume of 17,000
tonnes of tea, with a value of 68 million euros (with an average increase rate of 13.7% per year since
2011)174. Netherlands’ most important suppliers of conventional tea are Sri Lanka (19%), India (10%), and
China (9%).
Distribution of value from production in Assam to consumption in the Netherlands
Based on data extracted from public databases, several socio-economic studies published by academics,
public and private research institutes, and cross-checks with experts of the tea industry, we have made
detailed estimates of the distribution of value, from the tea workers and small tea growers’ income in
Assam, down to the consumers in the Netherlands (for further details on the methodology, see the note in
appendix). Based on the results of our analysis of the Indian tea value chain and the available data, we
have made estimates for black CTC-processed tea which makes up the vast majority of Assam made tea.
The results, expressed in euros per kilogramme, and adjusted for inflation – both for large tea estates and
small tea growers - are detailed below:
-
2,00
4,00
6,00
8,00
10,00
12,00
14,00
16,00
2003 2004 2005 2006 2007 2008 2009 2010 2011 2012 2013 2014 2015 2016 2017
Tea Value ChainAssam, India to Netherlands
Estate productionEUR/kg - Netherlands inflation
Netherlands Retail Price Black Teabags
Netherlands Retail Price Black Teabags minus VAT
Netherlands brands to retailer price -Estmation high
Netherlands brands to retailer price -Estmation low
Average Auctions price North India
CIF Netherlands <-- India
FOB India --> Netherlands /+
Production cost fresh tea (Plantation)/-
Plucking cost (Plantation)
Fig. 30 Distribution of value from Assam tea estates to Dutch consumers (inflation adjusted). Source: BASIC
172 CBI, Product factsheet Tea in Netherlands, 2016 173 CBI, Product factsheet Tea in Netherlands, 2016 174 CBI, Product factsheet Tea in Netherlands, 2016
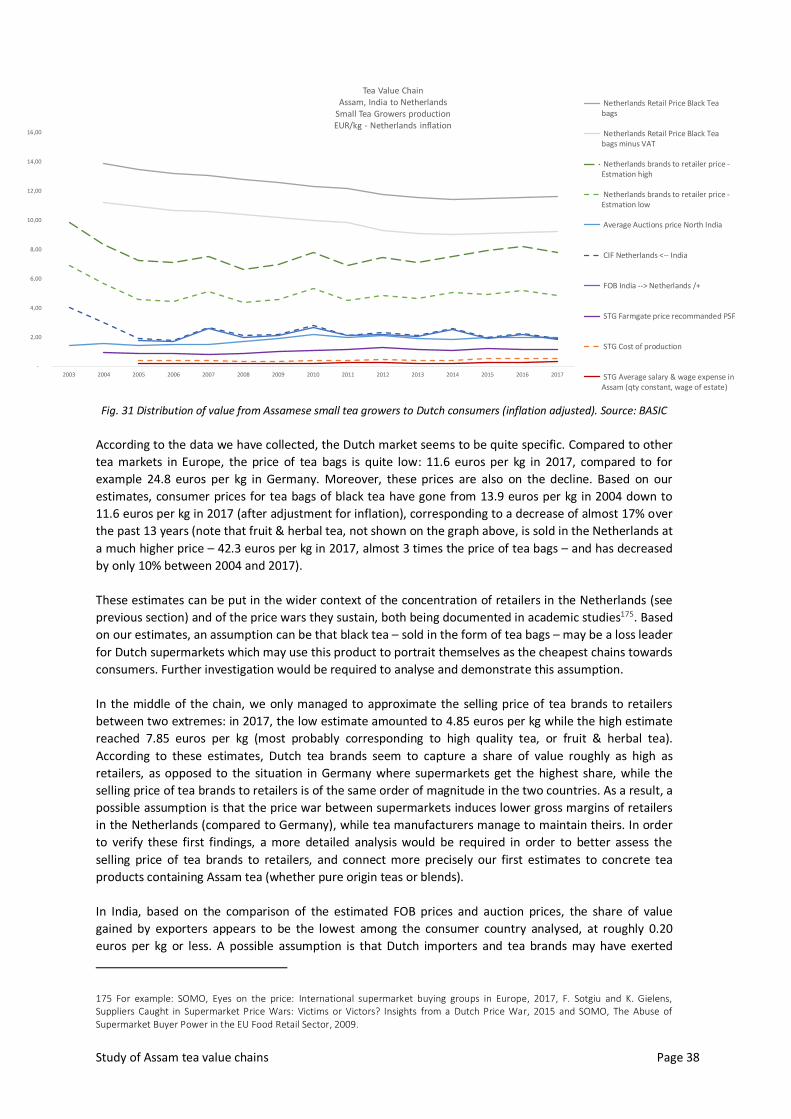
Study of Assam tea value chains Page 38
-
2,00
4,00
6,00
8,00
10,00
12,00
14,00
16,00
2003 2004 2005 2006 2007 2008 2009 2010 2011 2012 2013 2014 2015 2016 2017
Tea Value ChainAssam, India to Netherlands
Small Tea Growers productionEUR/kg - Netherlands inflation
Netherlands Retail Price Black Teabags
Netherlands Retail Price Black Teabags minus VAT
Netherlands brands to retailer price -Estmation high
Netherlands brands to retailer price -Estmation low
Average Auctions price North India
CIF Netherlands <-- India
FOB India --> Netherlands /+
STG Farmgate price recommanded PSF
STG Cost of production
STG Average salary & wage expense inAssam (qty constant, wage of estate)
Fig. 31 Distribution of value from Assamese small tea growers to Dutch consumers (inflation adjusted). Source: BASIC
According to the data we have collected, the Dutch market seems to be quite specific. Compared to other
tea markets in Europe, the price of tea bags is quite low: 11.6 euros per kg in 2017, compared to for
example 24.8 euros per kg in Germany. Moreover, these prices are also on the decline. Based on our
estimates, consumer prices for tea bags of black tea have gone from 13.9 euros per kg in 2004 down to
11.6 euros per kg in 2017 (after adjustment for inflation), corresponding to a decrease of almost 17% over
the past 13 years (note that fruit & herbal tea, not shown on the graph above, is sold in the Netherlands at
a much higher price – 42.3 euros per kg in 2017, almost 3 times the price of tea bags – and has decreased
by only 10% between 2004 and 2017).
These estimates can be put in the wider context of the concentration of retailers in the Netherlands (see
previous section) and of the price wars they sustain, both being documented in academic studies175. Based
on our estimates, an assumption can be that black tea – sold in the form of tea bags – may be a loss leader
for Dutch supermarkets which may use this product to portrait themselves as the cheapest chains towards
consumers. Further investigation would be required to analyse and demonstrate this assumption.
In the middle of the chain, we only managed to approximate the selling price of tea brands to retailers
between two extremes: in 2017, the low estimate amounted to 4.85 euros per kg while the high estimate
reached 7.85 euros per kg (most probably corresponding to high quality tea, or fruit & herbal tea).
According to these estimates, Dutch tea brands seem to capture a share of value roughly as high as
retailers, as opposed to the situation in Germany where supermarkets get the highest share, while the
selling price of tea brands to retailers is of the same order of magnitude in the two countries. As a result, a
possible assumption is that the price war between supermarkets induces lower gross margins of retailers
in the Netherlands (compared to Germany), while tea manufacturers manage to maintain theirs. In order
to verify these first findings, a more detailed analysis would be required in order to better assess the
selling price of tea brands to retailers, and connect more precisely our first estimates to concrete tea
products containing Assam tea (whether pure origin teas or blends).
In India, based on the comparison of the estimated FOB prices and auction prices, the share of value
gained by exporters appears to be the lowest among the consumer country analysed, at roughly 0.20
euros per kg or less. A possible assumption is that Dutch importers and tea brands may have exerted
175 For example: SOMO, Eyes on the price: International supermarket buying groups in Europe, 2017, F. Sotgiu and K. Gielens, Suppliers Caught in Supermarket Price Wars: Victims or Victors? Insights from a Dutch Price War, 2015 and SOMO, The Abuse of Supermarket Buyer Power in the EU Food Retail Sector, 2009.
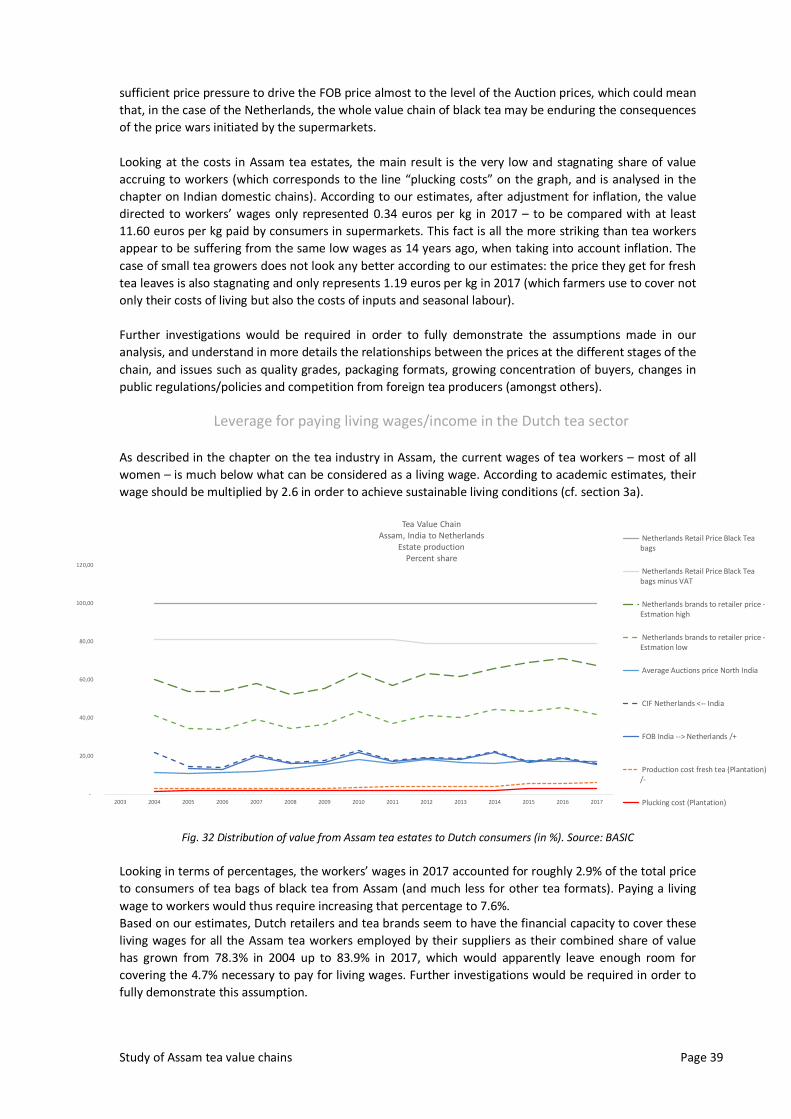
Study of Assam tea value chains Page 39
sufficient price pressure to drive the FOB price almost to the level of the Auction prices, which could mean
that, in the case of the Netherlands, the whole value chain of black tea may be enduring the consequences
of the price wars initiated by the supermarkets.
Looking at the costs in Assam tea estates, the main result is the very low and stagnating share of value
accruing to workers (which corresponds to the line “plucking costs” on the graph, and is analysed in the
chapter on Indian domestic chains). According to our estimates, after adjustment for inflation, the value
directed to workers’ wages only represented 0.34 euros per kg in 2017 – to be compared with at least
11.60 euros per kg paid by consumers in supermarkets. This fact is all the more striking than tea workers
appear to be suffering from the same low wages as 14 years ago, when taking into account inflation. The
case of small tea growers does not look any better according to our estimates: the price they get for fresh
tea leaves is also stagnating and only represents 1.19 euros per kg in 2017 (which farmers use to cover not
only their costs of living but also the costs of inputs and seasonal labour).
Further investigations would be required in order to fully demonstrate the assumptions made in our
analysis, and understand in more details the relationships between the prices at the different stages of the
chain, and issues such as quality grades, packaging formats, growing concentration of buyers, changes in
public regulations/policies and competition from foreign tea producers (amongst others).
Leverage for paying living wages/income in the Dutch tea sector
As described in the chapter on the tea industry in Assam, the current wages of tea workers – most of all
women – is much below what can be considered as a living wage. According to academic estimates, their
wage should be multiplied by 2.6 in order to achieve sustainable living conditions (cf. section 3a).
-
20,00
40,00
60,00
80,00
100,00
120,00
2003 2004 2005 2006 2007 2008 2009 2010 2011 2012 2013 2014 2015 2016 2017
Tea Value ChainAssam, India to Netherlands
Estate productionPercent share
Netherlands Retail Price Black Teabags
Netherlands Retail Price Black Teabags minus VAT
Netherlands brands to retailer price -Estmation high
Netherlands brands to retailer price -Estmation low
Average Auctions price North India
CIF Netherlands <-- India
FOB India --> Netherlands /+
Production cost fresh tea (Plantation)/-
Plucking cost (Plantation)
Fig. 32 Distribution of value from Assam tea estates to Dutch consumers (in %). Source: BASIC
Looking in terms of percentages, the workers’ wages in 2017 accounted for roughly 2.9% of the total price
to consumers of tea bags of black tea from Assam (and much less for other tea formats). Paying a living
wage to workers would thus require increasing that percentage to 7.6%.
Based on our estimates, Dutch retailers and tea brands seem to have the financial capacity to cover these
living wages for all the Assam tea workers employed by their suppliers as their combined share of value
has grown from 78.3% in 2004 up to 83.9% in 2017, which would apparently leave enough room for
covering the 4.7% necessary to pay for living wages. Further investigations would be required in order to
fully demonstrate this assumption.
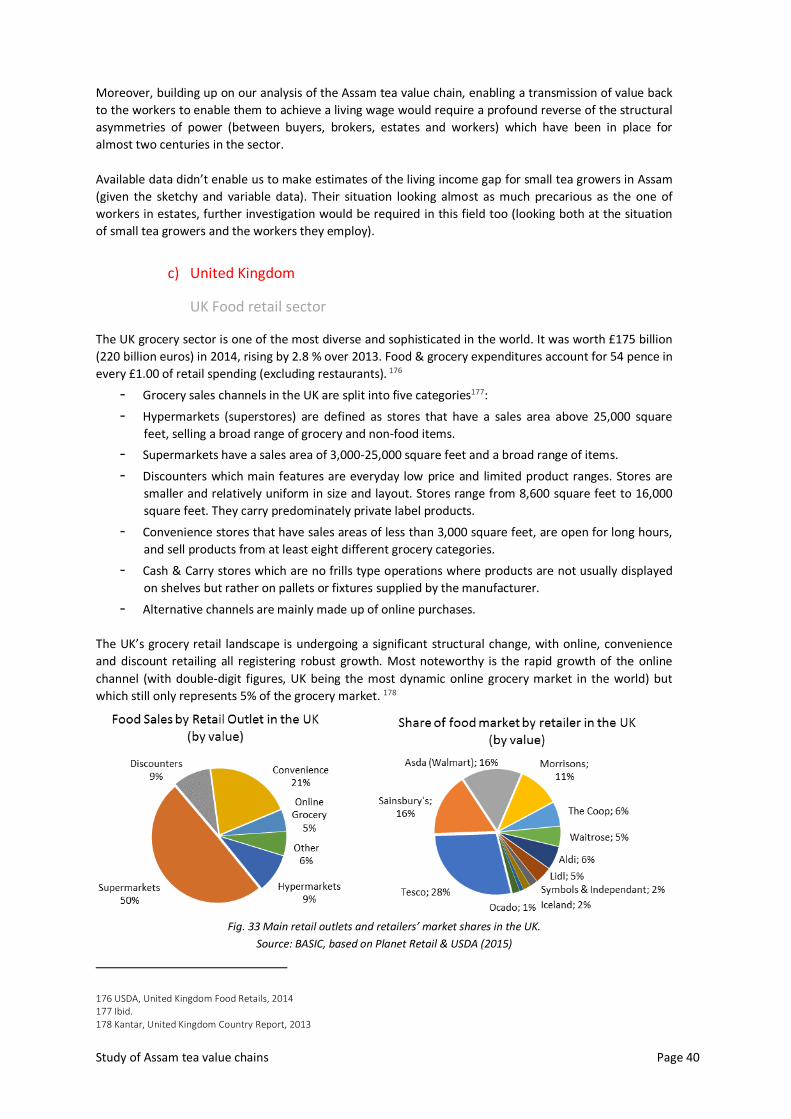
Study of Assam tea value chains Page 40
Moreover, building up on our analysis of the Assam tea value chain, enabling a transmission of value back
to the workers to enable them to achieve a living wage would require a profound reverse of the structural
asymmetries of power (between buyers, brokers, estates and workers) which have been in place for
almost two centuries in the sector.
Available data didn’t enable us to make estimates of the living income gap for small tea growers in Assam
(given the sketchy and variable data). Their situation looking almost as much precarious as the one of
workers in estates, further investigation would be required in this field too (looking both at the situation
of small tea growers and the workers they employ).
c) United Kingdom
UK Food retail sector
The UK grocery sector is one of the most diverse and sophisticated in the world. It was worth £175 billion
(220 billion euros) in 2014, rising by 2.8 % over 2013. Food & grocery expenditures account for 54 pence in
every £1.00 of retail spending (excluding restaurants). 176
- Grocery sales channels in the UK are split into five categories177:
- Hypermarkets (superstores) are defined as stores that have a sales area above 25,000 square
feet, selling a broad range of grocery and non-food items.
- Supermarkets have a sales area of 3,000-25,000 square feet and a broad range of items.
- Discounters which main features are everyday low price and limited product ranges. Stores are
smaller and relatively uniform in size and layout. Stores range from 8,600 square feet to 16,000
square feet. They carry predominately private label products.
- Convenience stores that have sales areas of less than 3,000 square feet, are open for long hours,
and sell products from at least eight different grocery categories.
- Cash & Carry stores which are no frills type operations where products are not usually displayed
on shelves but rather on pallets or fixtures supplied by the manufacturer.
- Alternative channels are mainly made up of online purchases.
The UK’s grocery retail landscape is undergoing a significant structural change, with online, convenience
and discount retailing all registering robust growth. Most noteworthy is the rapid growth of the online
channel (with double-digit figures, UK being the most dynamic online grocery market in the world) but
which still only represents 5% of the grocery market. 178
Fig. 33 Main retail outlets and retailers’ market shares in the UK.
Source: BASIC, based on Planet Retail & USDA (2015)
176 USDA, United Kingdom Food Retails, 2014 177 Ibid. 178 Kantar, United Kingdom Country Report, 2013
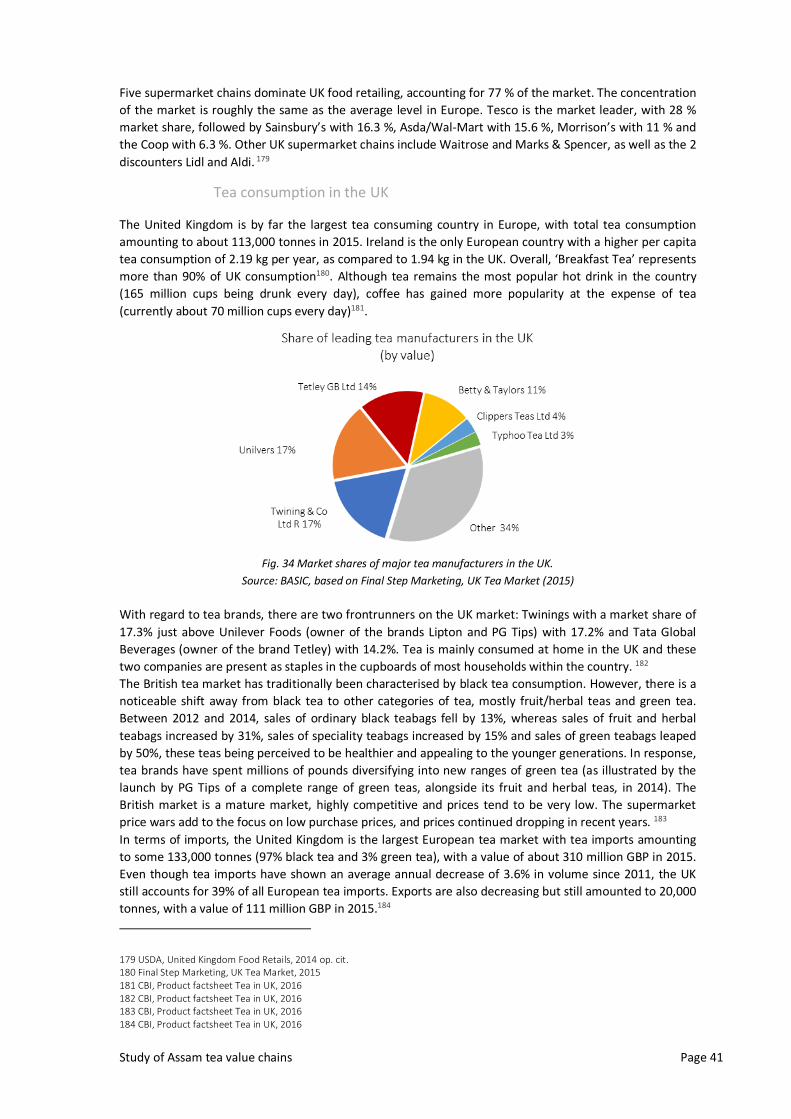
Study of Assam tea value chains Page 41
Five supermarket chains dominate UK food retailing, accounting for 77 % of the market. The concentration
of the market is roughly the same as the average level in Europe. Tesco is the market leader, with 28 %
market share, followed by Sainsbury’s with 16.3 %, Asda/Wal-Mart with 15.6 %, Morrison’s with 11 % and
the Coop with 6.3 %. Other UK supermarket chains include Waitrose and Marks & Spencer, as well as the 2
discounters Lidl and Aldi. 179
Tea consumption in the UK
The United Kingdom is by far the largest tea consuming country in Europe, with total tea consumption
amounting to about 113,000 tonnes in 2015. Ireland is the only European country with a higher per capita
tea consumption of 2.19 kg per year, as compared to 1.94 kg in the UK. Overall, ‘Breakfast Tea’ represents
more than 90% of UK consumption180. Although tea remains the most popular hot drink in the country
(165 million cups being drunk every day), coffee has gained more popularity at the expense of tea
(currently about 70 million cups every day)181.
Fig. 34 Market shares of major tea manufacturers in the UK.
Source: BASIC, based on Final Step Marketing, UK Tea Market (2015)
With regard to tea brands, there are two frontrunners on the UK market: Twinings with a market share of
17.3% just above Unilever Foods (owner of the brands Lipton and PG Tips) with 17.2% and Tata Global
Beverages (owner of the brand Tetley) with 14.2%. Tea is mainly consumed at home in the UK and these
two companies are present as staples in the cupboards of most households within the country. 182
The British tea market has traditionally been characterised by black tea consumption. However, there is a
noticeable shift away from black tea to other categories of tea, mostly fruit/herbal teas and green tea.
Between 2012 and 2014, sales of ordinary black teabags fell by 13%, whereas sales of fruit and herbal
teabags increased by 31%, sales of speciality teabags increased by 15% and sales of green teabags leaped
by 50%, these teas being perceived to be healthier and appealing to the younger generations. In response,
tea brands have spent millions of pounds diversifying into new ranges of green tea (as illustrated by the
launch by PG Tips of a complete range of green teas, alongside its fruit and herbal teas, in 2014). The
British market is a mature market, highly competitive and prices tend to be very low. The supermarket
price wars add to the focus on low purchase prices, and prices continued dropping in recent years. 183
In terms of imports, the United Kingdom is the largest European tea market with tea imports amounting
to some 133,000 tonnes (97% black tea and 3% green tea), with a value of about 310 million GBP in 2015.
Even though tea imports have shown an average annual decrease of 3.6% in volume since 2011, the UK
still accounts for 39% of all European tea imports. Exports are also decreasing but still amounted to 20,000
tonnes, with a value of 111 million GBP in 2015.184
179 USDA, United Kingdom Food Retails, 2014 op. cit. 180 Final Step Marketing, UK Tea Market, 2015 181 CBI, Product factsheet Tea in UK, 2016 182 CBI, Product factsheet Tea in UK, 2016 183 CBI, Product factsheet Tea in UK, 2016 184 CBI, Product factsheet Tea in UK, 2016
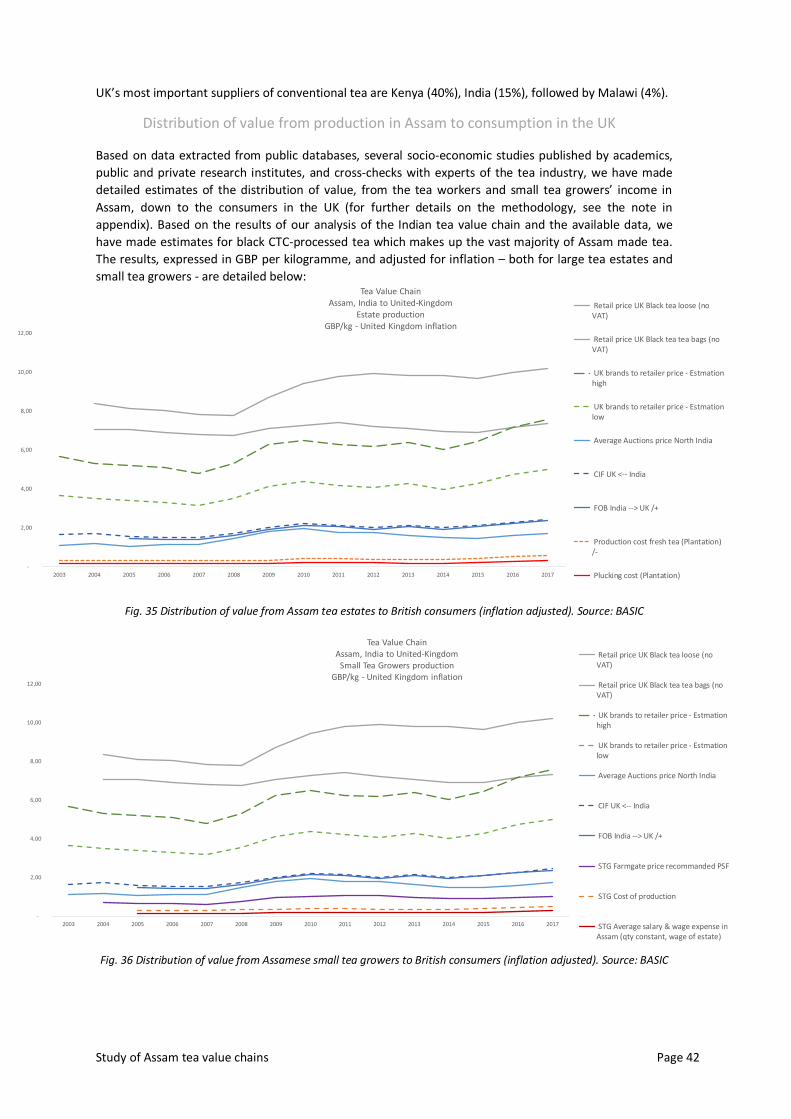
Study of Assam tea value chains Page 42
UK’s most important suppliers of conventional tea are Kenya (40%), India (15%), followed by Malawi (4%).
Distribution of value from production in Assam to consumption in the UK
Based on data extracted from public databases, several socio-economic studies published by academics,
public and private research institutes, and cross-checks with experts of the tea industry, we have made
detailed estimates of the distribution of value, from the tea workers and small tea growers’ income in
Assam, down to the consumers in the UK (for further details on the methodology, see the note in
appendix). Based on the results of our analysis of the Indian tea value chain and the available data, we
have made estimates for black CTC-processed tea which makes up the vast majority of Assam made tea.
The results, expressed in GBP per kilogramme, and adjusted for inflation – both for large tea estates and
small tea growers - are detailed below:
-
2,00
4,00
6,00
8,00
10,00
12,00
2003 2004 2005 2006 2007 2008 2009 2010 2011 2012 2013 2014 2015 2016 2017
Tea Value ChainAssam, India to United-Kingdom
Estate productionGBP/kg - United Kingdom inflation
Retail price UK Black tea loose (noVAT)
Retail price UK Black tea tea bags (noVAT)
UK brands to retailer price - Estmationhigh
UK brands to retailer price - Estmationlow
Average Auctions price North India
CIF UK <-- India
FOB India --> UK /+
Production cost fresh tea (Plantation)/-
Plucking cost (Plantation)
Fig. 35 Distribution of value from Assam tea estates to British consumers (inflation adjusted). Source: BASIC
-
2,00
4,00
6,00
8,00
10,00
12,00
2003 2004 2005 2006 2007 2008 2009 2010 2011 2012 2013 2014 2015 2016 2017
Tea Value ChainAssam, India to United-Kingdom
Small Tea Growers productionGBP/kg - United Kingdom inflation
Retail price UK Black tea loose (noVAT)
Retail price UK Black tea tea bags (noVAT)
UK brands to retailer price - Estmationhigh
UK brands to retailer price - Estmationlow
Average Auctions price North India
CIF UK <-- India
FOB India --> UK /+
STG Farmgate price recommanded PSF
STG Cost of production
STG Average salary & wage expense inAssam (qty constant, wage of estate)
Fig. 36 Distribution of value from Assamese small tea growers to British consumers (inflation adjusted). Source: BASIC
Study of Assam tea value chains Page 43
According to the data we have collected, the UK market is quite specific compared to other tea markets in
Europe: the price of tea bags – which account for 95% of consumption185 – is the lowest among the 5
countries analysed, reaching 7.50 GBP per kg in 2017 (equivalent to 8.70 euros per kg, compared to 11.60
euros in the Netherlands, the second cheapest market included in our study). This price has been
somehow stagnating over the past 10 to 15 years, after adjustment for inflation. By contrast, the
consumer price of loose black tea sold in branded packs is not only higher but also on the rise: it has
jumped from 8.35 GPB per kg in 2004 up to 10.20 GBP per kg in 2017 (an increase of 22% after adjustment
for inflation). As for other countries, fruit & herbal tea (not shown on the graph above) is sold at a much
higher price – 36.70 GBP per kg in 2017 – which equals more than 4 times the consumer price of tea bags.
As for Germany and the Netherlands, these estimates can be put in the wider context of the concentration
of retailers in the UK, and of the intense price competition on the UK tea market which is described in
several studies186. An assumption can be that black tea – sold in the form of tea bags – may be a key
product used by UK supermarkets to portrait themselves as the cheapest towards consumers. Further
investigation would be required to analyse and demonstrate this assumption.
In the middle of the chain, we only managed to approximate the selling price of tea brands to retailers
between two extremes: in 2017, the low estimate amounted to 5.00 GBP per kg (most probably linked to
cheaper tea bags), while the high estimate reached 7.60 GBP per kg (most probably linked to loose tea
sold in packs). According to these estimates, UK tea brands seem to capture a share of value roughly as
high as retailers, as opposed to the situation in Germany where supermarkets get the highest share, while
the selling price of tea brands to retailers is of the same order of magnitude in the two countries.
A possible assumption is that the price competition in the UK may induce lower gross margins of retailers
(compared to Germany) while tea manufacturers manage to maintain theirs. In order to verify these first
findings, a more detailed analysis would be required in order to better assess the selling price of tea
brands to retailers, and connect more precisely our first estimates to concrete tea products containing
Assam tea (whether pure origin teas or blends).
In India, based on the comparison of the estimated FOB prices and auction prices, the share of value
gained by exporters seems to have increased over the past decade: from 0.42 BGP per kg in 2005 to 0.65
GBP per kg in 2017. A possible assumption is that the leading tea brands on the UK market (in particular
the largest ones Unilever and Tata Beverage Group) which have vertically integrated the exporting stage
of the chain, may have been able to maintain a certain price pressure on Indian brokers so as to keep their
supply costs stable, thereby transmitting the pressure of UK retailers. Further investigations would also be
required in this field to counter-verify this assumption.
Looking at the costs in Assam tea estates, the main result is the very low and stagnating share of value
accruing to workers (which corresponds to the line “plucking costs” on the graph, and is analysed in the
chapter on Indian domestic chains). According to our estimates, after adjustment for inflation, the value
directed to workers’ wages only represented 0.29 GBP per kg in 2017, to be compared with 7.50 GBP per
kg for teabags paid by consumers in supermarkets. This fact is all the more striking than tea workers
appear to be suffering from the same low wages as 14 years ago, when taking into account inflation. The
case of small tea growers does not look any better according to our estimates: the price they get for fresh
tea leaves is also stagnating and only represents 1.03 GBP per kg in 2017 (which farmers use to cover not
only their costs of living but also the costs of inputs and seasonal labour).
Further investigations would be required in order to fully demonstrate the assumptions made in our
analysis, and understand in more details the relationships between the prices at the different stages of the
185 Final Step Marketing, UK Tea Market, 2015 186 Final Step Marketing, UK Tea Market, 2015 and https://www.ft.com/content/0e432650-1a6e-11e5-8201-cbdb03d71480, https://www.theguardian.com/business/2019/mar/05/long-read-aldi-discount-supermarket-changed-britain-shopping and https://www.mirror.co.uk/money/asda-sparks-supermarket-price-war-11824889 accessed on June 19th 2019
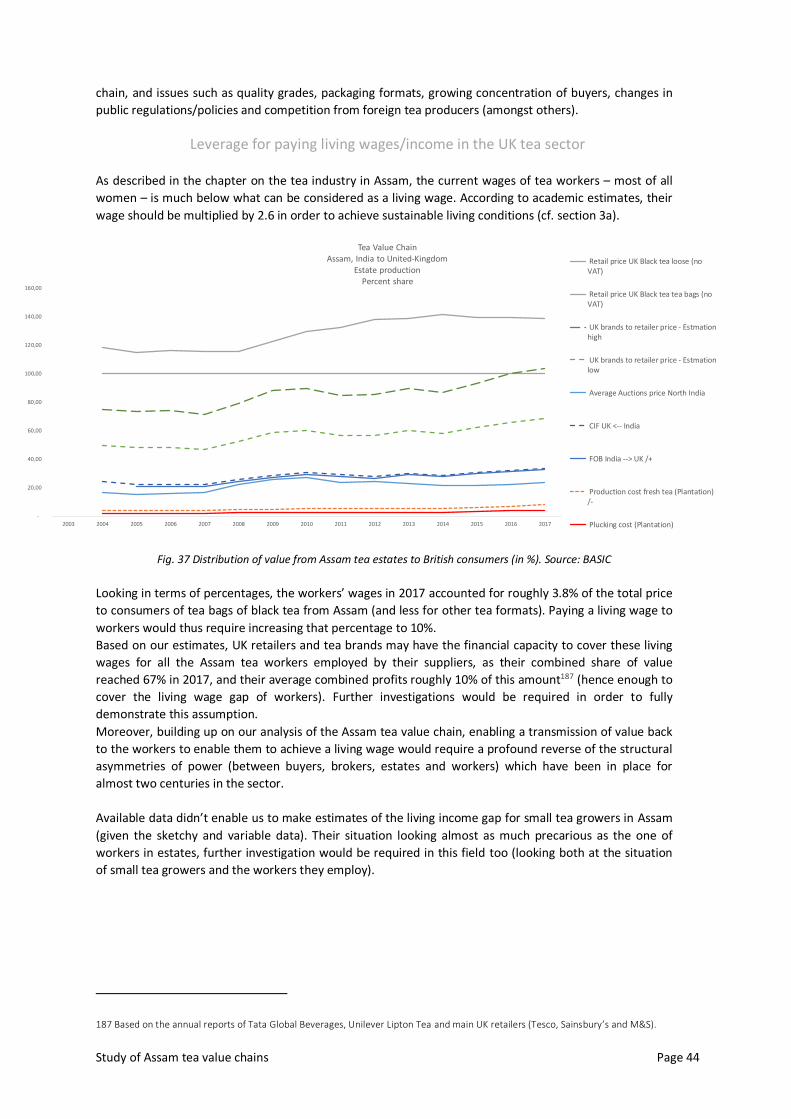
Study of Assam tea value chains Page 44
chain, and issues such as quality grades, packaging formats, growing concentration of buyers, changes in
public regulations/policies and competition from foreign tea producers (amongst others).
Leverage for paying living wages/income in the UK tea sector
As described in the chapter on the tea industry in Assam, the current wages of tea workers – most of all
women – is much below what can be considered as a living wage. According to academic estimates, their
wage should be multiplied by 2.6 in order to achieve sustainable living conditions (cf. section 3a).
-
20,00
40,00
60,00
80,00
100,00
120,00
140,00
160,00
2003 2004 2005 2006 2007 2008 2009 2010 2011 2012 2013 2014 2015 2016 2017
Tea Value ChainAssam, India to United-Kingdom
Estate productionPercent share
Retail price UK Black tea loose (noVAT)
Retail price UK Black tea tea bags (noVAT)
UK brands to retailer price - Estmationhigh
UK brands to retailer price - Estmationlow
Average Auctions price North India
CIF UK <-- India
FOB India --> UK /+
Production cost fresh tea (Plantation)/-
Plucking cost (Plantation)
Fig. 37 Distribution of value from Assam tea estates to British consumers (in %). Source: BASIC
Looking in terms of percentages, the workers’ wages in 2017 accounted for roughly 3.8% of the total price
to consumers of tea bags of black tea from Assam (and less for other tea formats). Paying a living wage to
workers would thus require increasing that percentage to 10%.
Based on our estimates, UK retailers and tea brands may have the financial capacity to cover these living
wages for all the Assam tea workers employed by their suppliers, as their combined share of value
reached 67% in 2017, and their average combined profits roughly 10% of this amount187 (hence enough to
cover the living wage gap of workers). Further investigations would be required in order to fully
demonstrate this assumption.
Moreover, building up on our analysis of the Assam tea value chain, enabling a transmission of value back
to the workers to enable them to achieve a living wage would require a profound reverse of the structural
asymmetries of power (between buyers, brokers, estates and workers) which have been in place for
almost two centuries in the sector.
Available data didn’t enable us to make estimates of the living income gap for small tea growers in Assam
(given the sketchy and variable data). Their situation looking almost as much precarious as the one of
workers in estates, further investigation would be required in this field too (looking both at the situation
of small tea growers and the workers they employ).
187 Based on the annual reports of Tata Global Beverages, Unilever Lipton Tea and main UK retailers (Tesco, Sainsbury’s and M&S).
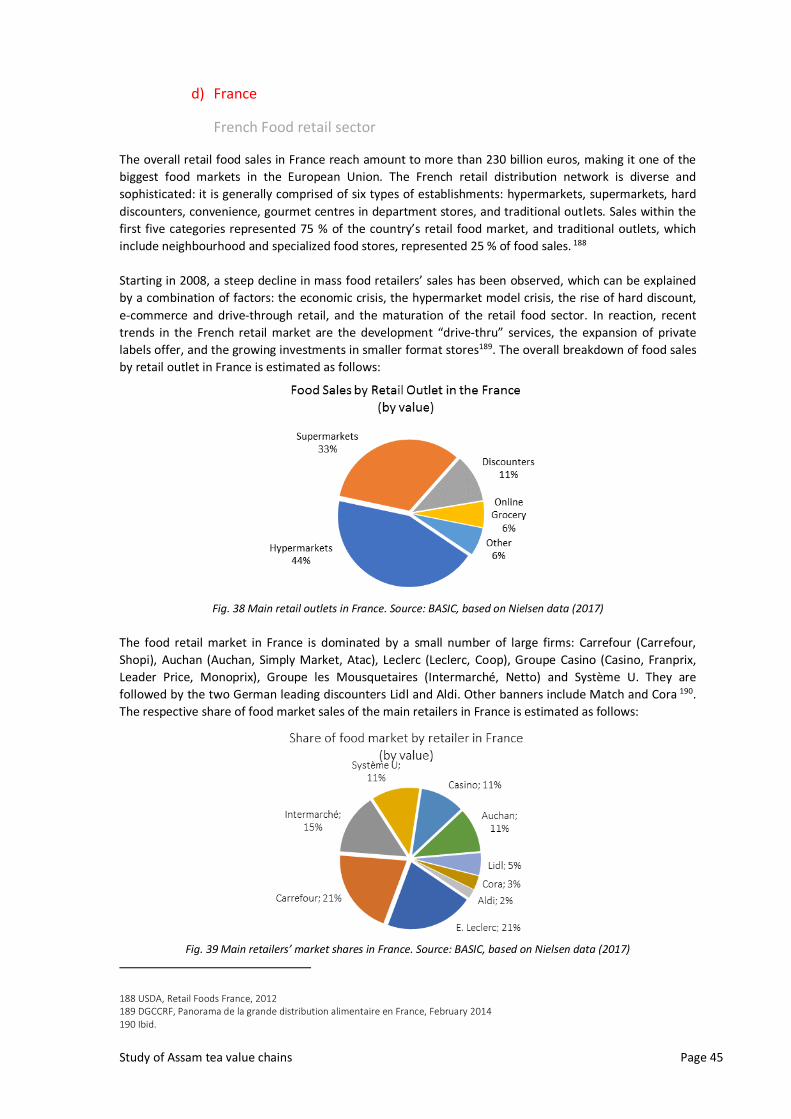
Study of Assam tea value chains Page 45
d) France
French Food retail sector
The overall retail food sales in France reach amount to more than 230 billion euros, making it one of the
biggest food markets in the European Union. The French retail distribution network is diverse and
sophisticated: it is generally comprised of six types of establishments: hypermarkets, supermarkets, hard
discounters, convenience, gourmet centres in department stores, and traditional outlets. Sales within the
first five categories represented 75 % of the country’s retail food market, and traditional outlets, which
include neighbourhood and specialized food stores, represented 25 % of food sales. 188
Starting in 2008, a steep decline in mass food retailers’ sales has been observed, which can be explained
by a combination of factors: the economic crisis, the hypermarket model crisis, the rise of hard discount,
e-commerce and drive-through retail, and the maturation of the retail food sector. In reaction, recent
trends in the French retail market are the development “drive-thru” services, the expansion of private
labels offer, and the growing investments in smaller format stores189. The overall breakdown of food sales
by retail outlet in France is estimated as follows:
Fig. 38 Main retail outlets in France. Source: BASIC, based on Nielsen data (2017)
The food retail market in France is dominated by a small number of large firms: Carrefour (Carrefour,
Shopi), Auchan (Auchan, Simply Market, Atac), Leclerc (Leclerc, Coop), Groupe Casino (Casino, Franprix,
Leader Price, Monoprix), Groupe les Mousquetaires (Intermarché, Netto) and Système U. They are
followed by the two German leading discounters Lidl and Aldi. Other banners include Match and Cora 190.
The respective share of food market sales of the main retailers in France is estimated as follows:
Fig. 39 Main retailers’ market shares in France. Source: BASIC, based on Nielsen data (2017)
188 USDA, Retail Foods France, 2012 189 DGCCRF, Panorama de la grande distribution alimentaire en France, February 2014 190 Ibid.
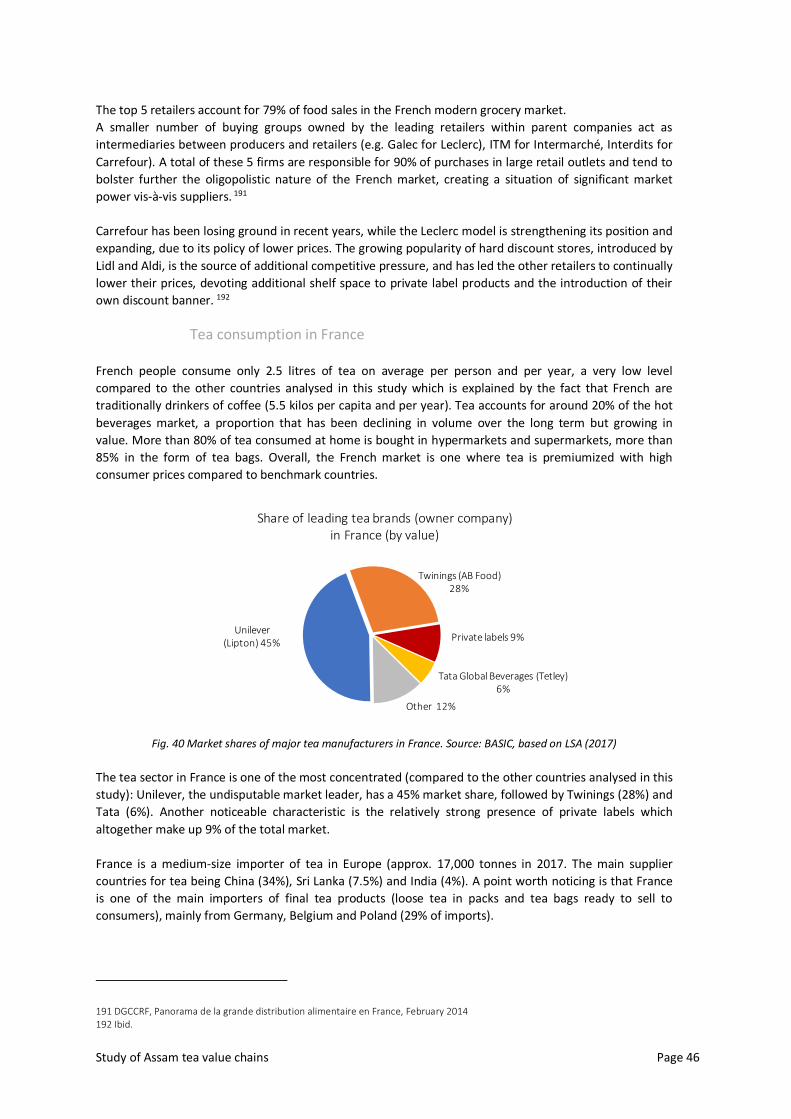
Study of Assam tea value chains Page 46
The top 5 retailers account for 79% of food sales in the French modern grocery market.
A smaller number of buying groups owned by the leading retailers within parent companies act as
intermediaries between producers and retailers (e.g. Galec for Leclerc), ITM for Intermarché, Interdits for
Carrefour). A total of these 5 firms are responsible for 90% of purchases in large retail outlets and tend to
bolster further the oligopolistic nature of the French market, creating a situation of significant market
power vis-à-vis suppliers. 191
Carrefour has been losing ground in recent years, while the Leclerc model is strengthening its position and
expanding, due to its policy of lower prices. The growing popularity of hard discount stores, introduced by
Lidl and Aldi, is the source of additional competitive pressure, and has led the other retailers to continually
lower their prices, devoting additional shelf space to private label products and the introduction of their
own discount banner. 192
Tea consumption in France
French people consume only 2.5 litres of tea on average per person and per year, a very low level
compared to the other countries analysed in this study which is explained by the fact that French are
traditionally drinkers of coffee (5.5 kilos per capita and per year). Tea accounts for around 20% of the hot
beverages market, a proportion that has been declining in volume over the long term but growing in
value. More than 80% of tea consumed at home is bought in hypermarkets and supermarkets, more than
85% in the form of tea bags. Overall, the French market is one where tea is premiumized with high
consumer prices compared to benchmark countries.
Unilever (Lipton) 45%
Twinings (AB Food)28%
Private labels 9%
Tata Global Beverages (Tetley)6%
Other 12%
Share of leading tea brands (owner company) in France (by value)
Fig. 40 Market shares of major tea manufacturers in France. Source: BASIC, based on LSA (2017)
The tea sector in France is one of the most concentrated (compared to the other countries analysed in this
study): Unilever, the undisputable market leader, has a 45% market share, followed by Twinings (28%) and
Tata (6%). Another noticeable characteristic is the relatively strong presence of private labels which
altogether make up 9% of the total market.
France is a medium-size importer of tea in Europe (approx. 17,000 tonnes in 2017. The main supplier
countries for tea being China (34%), Sri Lanka (7.5%) and India (4%). A point worth noticing is that France
is one of the main importers of final tea products (loose tea in packs and tea bags ready to sell to
consumers), mainly from Germany, Belgium and Poland (29% of imports).
191 DGCCRF, Panorama de la grande distribution alimentaire en France, February 2014 192 Ibid.
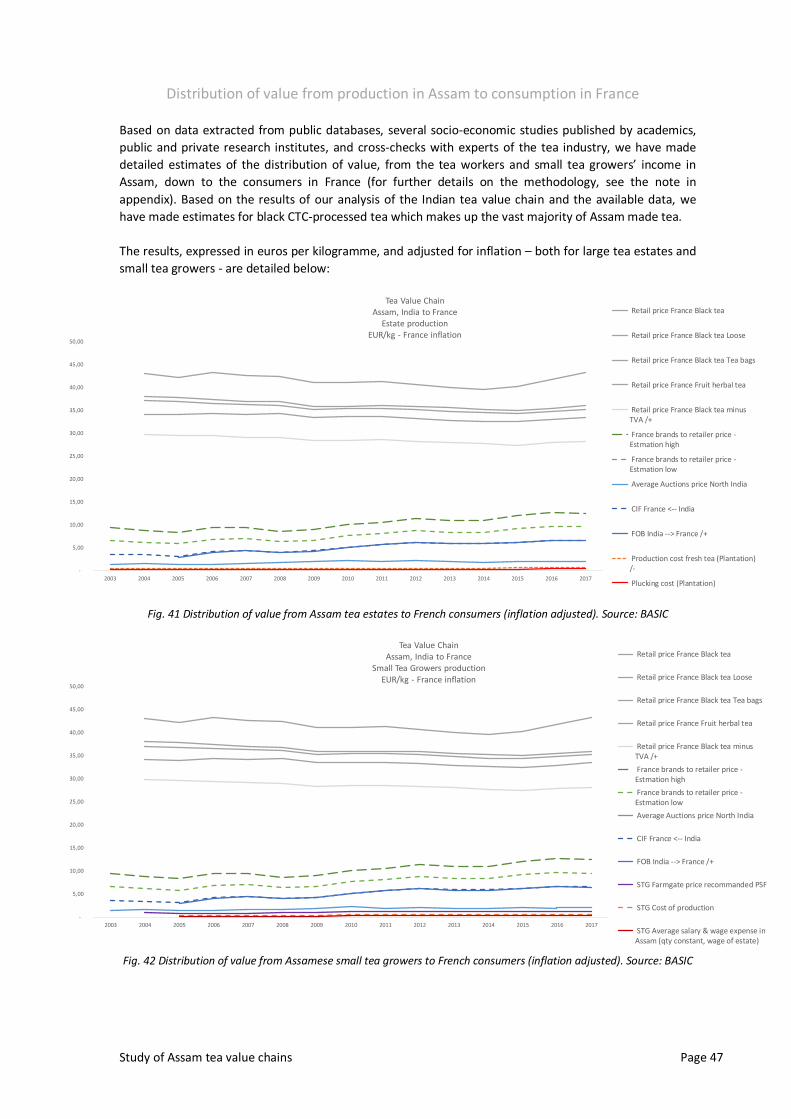
Study of Assam tea value chains Page 47
Distribution of value from production in Assam to consumption in France
Based on data extracted from public databases, several socio-economic studies published by academics,
public and private research institutes, and cross-checks with experts of the tea industry, we have made
detailed estimates of the distribution of value, from the tea workers and small tea growers’ income in
Assam, down to the consumers in France (for further details on the methodology, see the note in
appendix). Based on the results of our analysis of the Indian tea value chain and the available data, we
have made estimates for black CTC-processed tea which makes up the vast majority of Assam made tea.
The results, expressed in euros per kilogramme, and adjusted for inflation – both for large tea estates and
small tea growers - are detailed below:
-
5,00
10,00
15,00
20,00
25,00
30,00
35,00
40,00
45,00
50,00
2003 2004 2005 2006 2007 2008 2009 2010 2011 2012 2013 2014 2015 2016 2017
Tea Value ChainAssam, India to France
Estate productionEUR/kg - France inflation
Retail price France Black tea
Retail price France Black tea Loose
Retail price France Black tea Tea bags
Retail price France Fruit herbal tea
Retail price France Black tea minusTVA /+
France brands to retailer price -Estmation high
France brands to retailer price -Estmation low
Average Auctions price North India
CIF France <-- India
FOB India --> France /+
Production cost fresh tea (Plantation)/-
Plucking cost (Plantation)
Fig. 41 Distribution of value from Assam tea estates to French consumers (inflation adjusted). Source: BASIC
-
5,00
10,00
15,00
20,00
25,00
30,00
35,00
40,00
45,00
50,00
2003 2004 2005 2006 2007 2008 2009 2010 2011 2012 2013 2014 2015 2016 2017
Tea Value ChainAssam, India to France
Small Tea Growers productionEUR/kg - France inflation
Retail price France Black tea
Retail price France Black tea Loose
Retail price France Black tea Tea bags
Retail price France Fruit herbal tea
Retail price France Black tea minusTVA /+
France brands to retailer price -Estmation high
France brands to retailer price -Estmation low
Average Auctions price North India
CIF France <-- India
FOB India --> France /+
STG Farmgate price recommanded PSF
STG Cost of production
STG Average salary & wage expense inAssam (qty constant, wage of estate)
Fig. 42 Distribution of value from Assamese small tea growers to French consumers (inflation adjusted). Source: BASIC
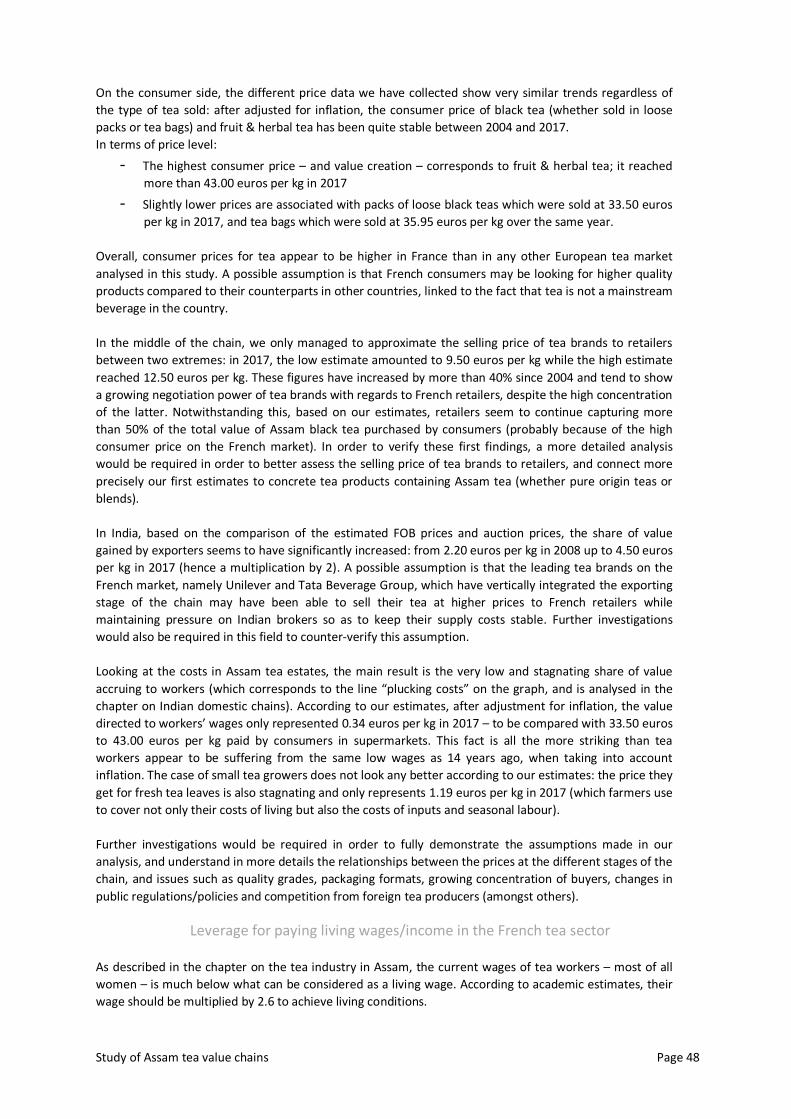
Study of Assam tea value chains Page 48
On the consumer side, the different price data we have collected show very similar trends regardless of
the type of tea sold: after adjusted for inflation, the consumer price of black tea (whether sold in loose
packs or tea bags) and fruit & herbal tea has been quite stable between 2004 and 2017.
In terms of price level:
- The highest consumer price – and value creation – corresponds to fruit & herbal tea; it reached
more than 43.00 euros per kg in 2017
- Slightly lower prices are associated with packs of loose black teas which were sold at 33.50 euros
per kg in 2017, and tea bags which were sold at 35.95 euros per kg over the same year.
Overall, consumer prices for tea appear to be higher in France than in any other European tea market
analysed in this study. A possible assumption is that French consumers may be looking for higher quality
products compared to their counterparts in other countries, linked to the fact that tea is not a mainstream
beverage in the country.
In the middle of the chain, we only managed to approximate the selling price of tea brands to retailers
between two extremes: in 2017, the low estimate amounted to 9.50 euros per kg while the high estimate
reached 12.50 euros per kg. These figures have increased by more than 40% since 2004 and tend to show
a growing negotiation power of tea brands with regards to French retailers, despite the high concentration
of the latter. Notwithstanding this, based on our estimates, retailers seem to continue capturing more
than 50% of the total value of Assam black tea purchased by consumers (probably because of the high
consumer price on the French market). In order to verify these first findings, a more detailed analysis
would be required in order to better assess the selling price of tea brands to retailers, and connect more
precisely our first estimates to concrete tea products containing Assam tea (whether pure origin teas or
blends).
In India, based on the comparison of the estimated FOB prices and auction prices, the share of value
gained by exporters seems to have significantly increased: from 2.20 euros per kg in 2008 up to 4.50 euros
per kg in 2017 (hence a multiplication by 2). A possible assumption is that the leading tea brands on the
French market, namely Unilever and Tata Beverage Group, which have vertically integrated the exporting
stage of the chain may have been able to sell their tea at higher prices to French retailers while
maintaining pressure on Indian brokers so as to keep their supply costs stable. Further investigations
would also be required in this field to counter-verify this assumption.
Looking at the costs in Assam tea estates, the main result is the very low and stagnating share of value
accruing to workers (which corresponds to the line “plucking costs” on the graph, and is analysed in the
chapter on Indian domestic chains). According to our estimates, after adjustment for inflation, the value
directed to workers’ wages only represented 0.34 euros per kg in 2017 – to be compared with 33.50 euros
to 43.00 euros per kg paid by consumers in supermarkets. This fact is all the more striking than tea
workers appear to be suffering from the same low wages as 14 years ago, when taking into account
inflation. The case of small tea growers does not look any better according to our estimates: the price they
get for fresh tea leaves is also stagnating and only represents 1.19 euros per kg in 2017 (which farmers use
to cover not only their costs of living but also the costs of inputs and seasonal labour).
Further investigations would be required in order to fully demonstrate the assumptions made in our
analysis, and understand in more details the relationships between the prices at the different stages of the
chain, and issues such as quality grades, packaging formats, growing concentration of buyers, changes in
public regulations/policies and competition from foreign tea producers (amongst others).
Leverage for paying living wages/income in the French tea sector
As described in the chapter on the tea industry in Assam, the current wages of tea workers – most of all
women – is much below what can be considered as a living wage. According to academic estimates, their
wage should be multiplied by 2.6 to achieve living conditions.
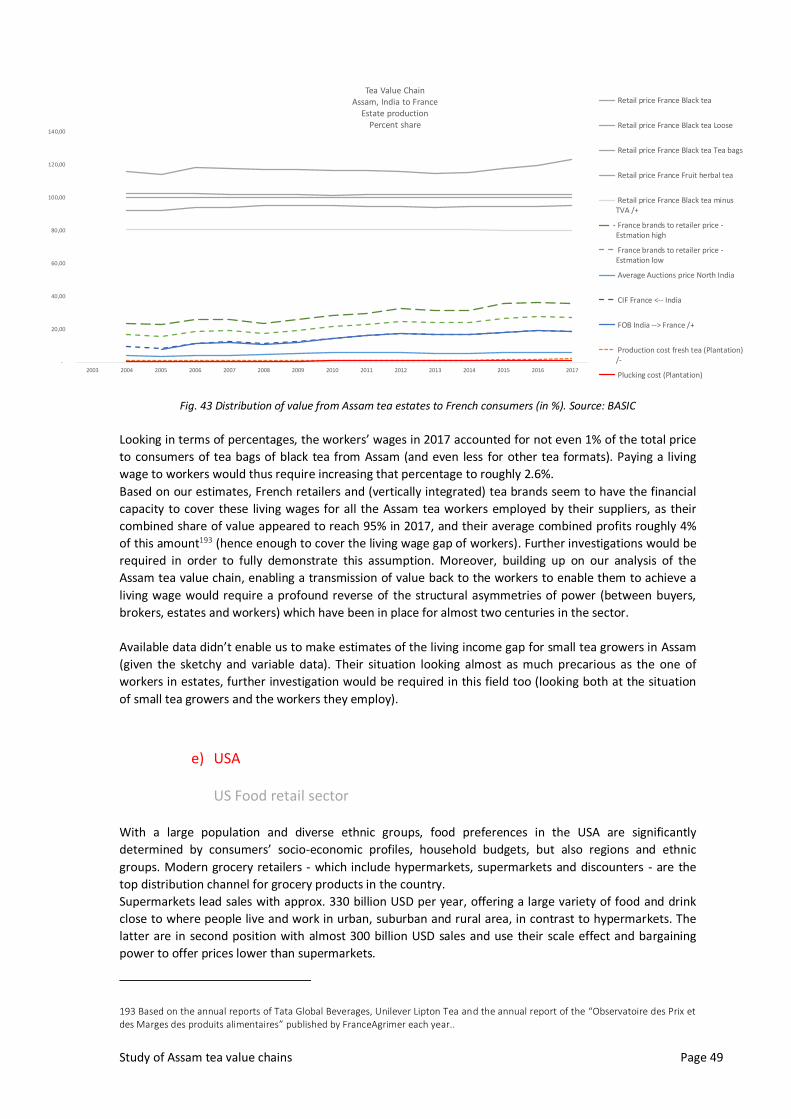
Study of Assam tea value chains Page 49
-
20,00
40,00
60,00
80,00
100,00
120,00
140,00
2003 2004 2005 2006 2007 2008 2009 2010 2011 2012 2013 2014 2015 2016 2017
Tea Value ChainAssam, India to France
Estate productionPercent share
Retail price France Black tea
Retail price France Black tea Loose
Retail price France Black tea Tea bags
Retail price France Fruit herbal tea
Retail price France Black tea minusTVA /+
France brands to retailer price -Estmation high
France brands to retailer price -Estmation low
Average Auctions price North India
CIF France <-- India
FOB India --> France /+
Production cost fresh tea (Plantation)/-
Plucking cost (Plantation)
Fig. 43 Distribution of value from Assam tea estates to French consumers (in %). Source: BASIC
Looking in terms of percentages, the workers’ wages in 2017 accounted for not even 1% of the total price
to consumers of tea bags of black tea from Assam (and even less for other tea formats). Paying a living
wage to workers would thus require increasing that percentage to roughly 2.6%.
Based on our estimates, French retailers and (vertically integrated) tea brands seem to have the financial
capacity to cover these living wages for all the Assam tea workers employed by their suppliers, as their
combined share of value appeared to reach 95% in 2017, and their average combined profits roughly 4%
of this amount193 (hence enough to cover the living wage gap of workers). Further investigations would be
required in order to fully demonstrate this assumption. Moreover, building up on our analysis of the
Assam tea value chain, enabling a transmission of value back to the workers to enable them to achieve a
living wage would require a profound reverse of the structural asymmetries of power (between buyers,
brokers, estates and workers) which have been in place for almost two centuries in the sector.
Available data didn’t enable us to make estimates of the living income gap for small tea growers in Assam
(given the sketchy and variable data). Their situation looking almost as much precarious as the one of
workers in estates, further investigation would be required in this field too (looking both at the situation
of small tea growers and the workers they employ).
e) USA
US Food retail sector
With a large population and diverse ethnic groups, food preferences in the USA are significantly
determined by consumers’ socio-economic profiles, household budgets, but also regions and ethnic
groups. Modern grocery retailers - which include hypermarkets, supermarkets and discounters - are the
top distribution channel for grocery products in the country.
Supermarkets lead sales with approx. 330 billion USD per year, offering a large variety of food and drink
close to where people live and work in urban, suburban and rural area, in contrast to hypermarkets. The
latter are in second position with almost 300 billion USD sales and use their scale effect and bargaining
power to offer prices lower than supermarkets.
193 Based on the annual reports of Tata Global Beverages, Unilever Lipton Tea and the annual report of the “Observatoire des Prix et des Marges des produits alimentaires” published by FranceAgrimer each year..
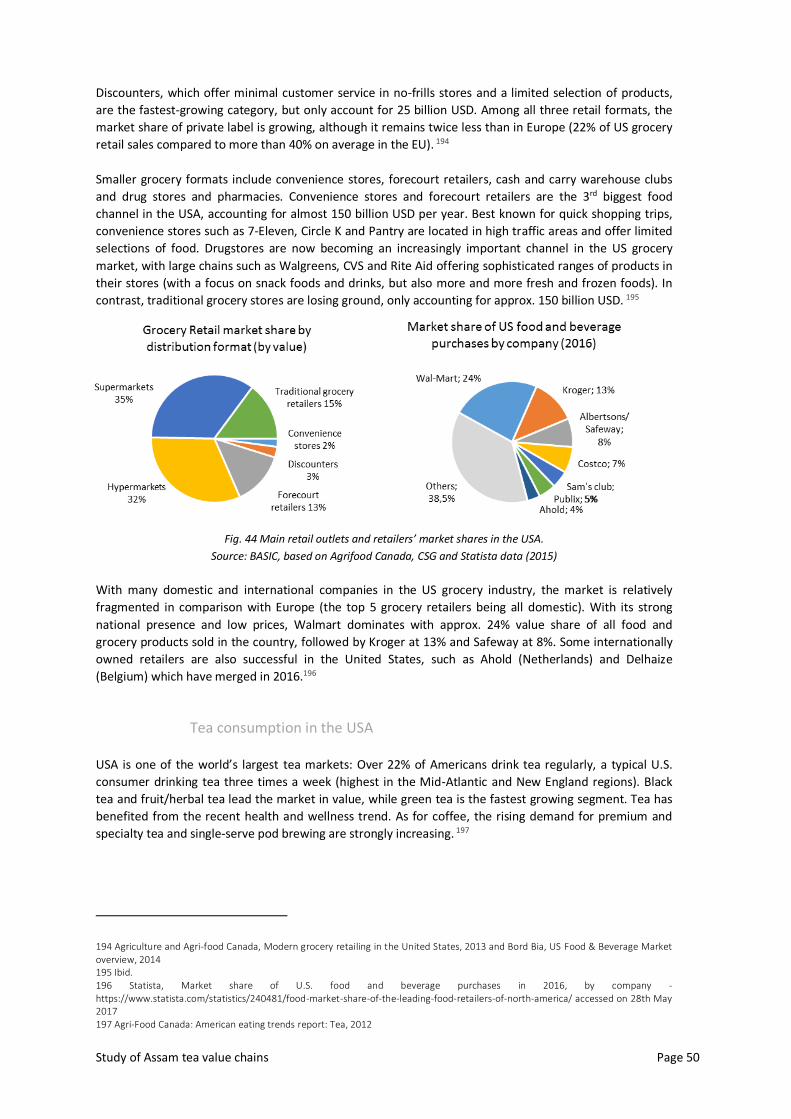
Study of Assam tea value chains Page 50
Discounters, which offer minimal customer service in no-frills stores and a limited selection of products,
are the fastest-growing category, but only account for 25 billion USD. Among all three retail formats, the
market share of private label is growing, although it remains twice less than in Europe (22% of US grocery
retail sales compared to more than 40% on average in the EU). 194
Smaller grocery formats include convenience stores, forecourt retailers, cash and carry warehouse clubs
and drug stores and pharmacies. Convenience stores and forecourt retailers are the 3rd biggest food
channel in the USA, accounting for almost 150 billion USD per year. Best known for quick shopping trips,
convenience stores such as 7-Eleven, Circle K and Pantry are located in high traffic areas and offer limited
selections of food. Drugstores are now becoming an increasingly important channel in the US grocery
market, with large chains such as Walgreens, CVS and Rite Aid offering sophisticated ranges of products in
their stores (with a focus on snack foods and drinks, but also more and more fresh and frozen foods). In
contrast, traditional grocery stores are losing ground, only accounting for approx. 150 billion USD. 195
Fig. 44 Main retail outlets and retailers’ market shares in the USA.
Source: BASIC, based on Agrifood Canada, CSG and Statista data (2015)
With many domestic and international companies in the US grocery industry, the market is relatively
fragmented in comparison with Europe (the top 5 grocery retailers being all domestic). With its strong
national presence and low prices, Walmart dominates with approx. 24% value share of all food and
grocery products sold in the country, followed by Kroger at 13% and Safeway at 8%. Some internationally
owned retailers are also successful in the United States, such as Ahold (Netherlands) and Delhaize
(Belgium) which have merged in 2016.196
Tea consumption in the USA
USA is one of the world’s largest tea markets: Over 22% of Americans drink tea regularly, a typical U.S.
consumer drinking tea three times a week (highest in the Mid-Atlantic and New England regions). Black
tea and fruit/herbal tea lead the market in value, while green tea is the fastest growing segment. Tea has
benefited from the recent health and wellness trend. As for coffee, the rising demand for premium and
specialty tea and single-serve pod brewing are strongly increasing. 197
194 Agriculture and Agri-food Canada, Modern grocery retailing in the United States, 2013 and Bord Bia, US Food & Beverage Market overview, 2014 195 Ibid. 196 Statista, Market share of U.S. food and beverage purchases in 2016, by company - https://www.statista.com/statistics/240481/food-market-share-of-the-leading-food-retailers-of-north-america/ accessed on 28th May 2017 197 Agri-Food Canada: American eating trends report: Tea, 2012
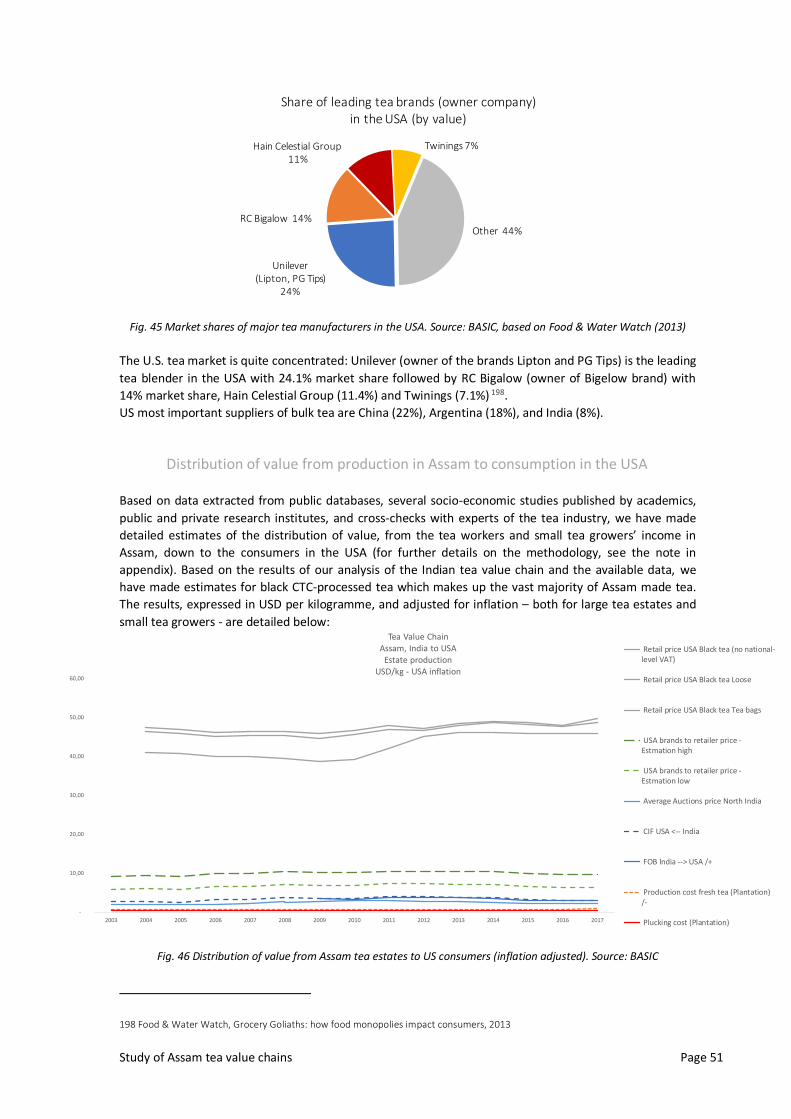
Study of Assam tea value chains Page 51
Unilever (Lipton, PG Tips)
24%
RC Bigalow 14%
Hain Celestial Group 11%
Twinings 7%
Other 44%
Share of leading tea brands (owner company) in the USA (by value)
Fig. 45 Market shares of major tea manufacturers in the USA. Source: BASIC, based on Food & Water Watch (2013)
The U.S. tea market is quite concentrated: Unilever (owner of the brands Lipton and PG Tips) is the leading
tea blender in the USA with 24.1% market share followed by RC Bigalow (owner of Bigelow brand) with
14% market share, Hain Celestial Group (11.4%) and Twinings (7.1%) 198.
US most important suppliers of bulk tea are China (22%), Argentina (18%), and India (8%).
Distribution of value from production in Assam to consumption in the USA
Based on data extracted from public databases, several socio-economic studies published by academics,
public and private research institutes, and cross-checks with experts of the tea industry, we have made
detailed estimates of the distribution of value, from the tea workers and small tea growers’ income in
Assam, down to the consumers in the USA (for further details on the methodology, see the note in
appendix). Based on the results of our analysis of the Indian tea value chain and the available data, we
have made estimates for black CTC-processed tea which makes up the vast majority of Assam made tea.
The results, expressed in USD per kilogramme, and adjusted for inflation – both for large tea estates and
small tea growers - are detailed below:
-
10,00
20,00
30,00
40,00
50,00
60,00
2003 2004 2005 2006 2007 2008 2009 2010 2011 2012 2013 2014 2015 2016 2017
Tea Value ChainAssam, India to USA
Estate productionUSD/kg - USA inflation
Retail price USA Black tea (no national-level VAT)
Retail price USA Black tea Loose
Retail price USA Black tea Tea bags
USA brands to retailer price -Estmation high
USA brands to retailer price -Estmation low
Average Auctions price North India
CIF USA <-- India
FOB India --> USA /+
Production cost fresh tea (Plantation)/-
Plucking cost (Plantation)
Fig. 46 Distribution of value from Assam tea estates to US consumers (inflation adjusted). Source: BASIC
198 Food & Water Watch, Grocery Goliaths: how food monopolies impact consumers, 2013
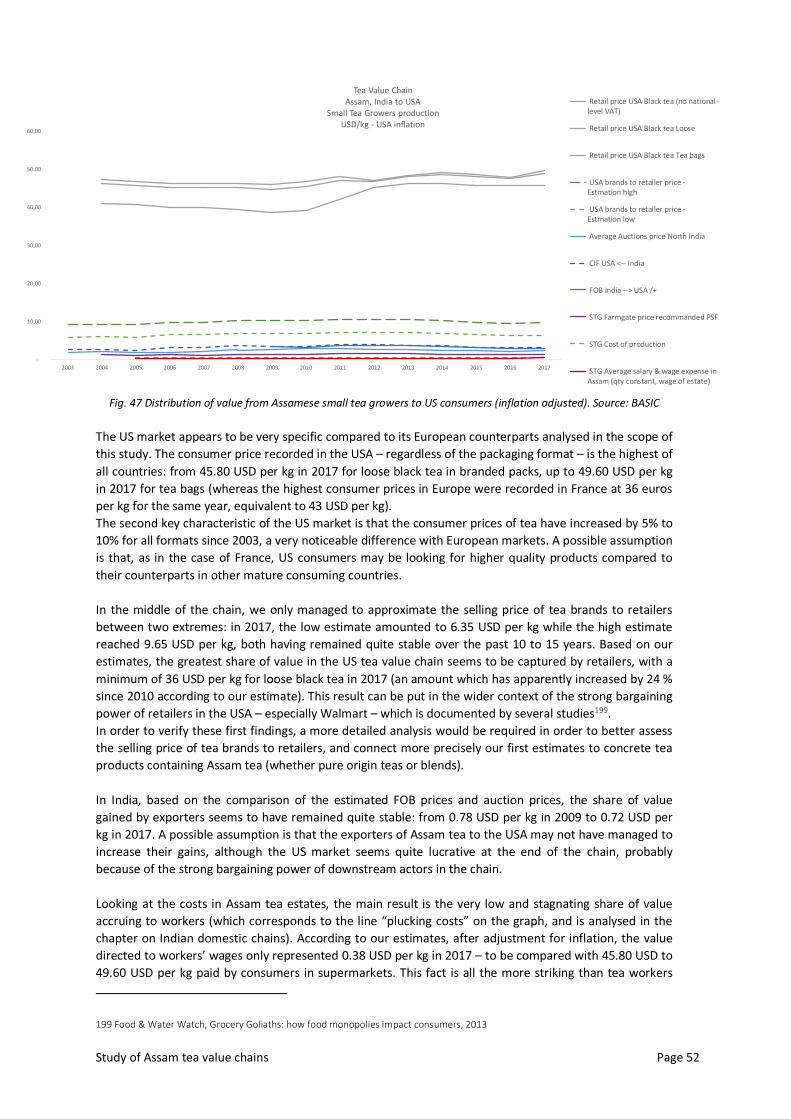
Study of Assam tea value chains Page 52
-
10,00
20,00
30,00
40,00
50,00
60,00
2003 2004 2005 2006 2007 2008 2009 2010 2011 2012 2013 2014 2015 2016 2017
Tea Value ChainAssam, India to USA
Small Tea Growers productionUSD/kg - USA inflation
Retail price USA Black tea (no national-level VAT)
Retail price USA Black tea Loose
Retail price USA Black tea Tea bags
USA brands to retailer price -Estmation high
USA brands to retailer price -Estmation low
Average Auctions price North India
CIF USA <-- India
FOB India --> USA /+
STG Farmgate price recommanded PSF
STG Cost of production
STG Average salary & wage expense inAssam (qty constant, wage of estate)
Fig. 47 Distribution of value from Assamese small tea growers to US consumers (inflation adjusted). Source: BASIC
The US market appears to be very specific compared to its European counterparts analysed in the scope of
this study. The consumer price recorded in the USA – regardless of the packaging format – is the highest of
all countries: from 45.80 USD per kg in 2017 for loose black tea in branded packs, up to 49.60 USD per kg
in 2017 for tea bags (whereas the highest consumer prices in Europe were recorded in France at 36 euros
per kg for the same year, equivalent to 43 USD per kg).
The second key characteristic of the US market is that the consumer prices of tea have increased by 5% to
10% for all formats since 2003, a very noticeable difference with European markets. A possible assumption
is that, as in the case of France, US consumers may be looking for higher quality products compared to
their counterparts in other mature consuming countries.
In the middle of the chain, we only managed to approximate the selling price of tea brands to retailers
between two extremes: in 2017, the low estimate amounted to 6.35 USD per kg while the high estimate
reached 9.65 USD per kg, both having remained quite stable over the past 10 to 15 years. Based on our
estimates, the greatest share of value in the US tea value chain seems to be captured by retailers, with a
minimum of 36 USD per kg for loose black tea in 2017 (an amount which has apparently increased by 24 %
since 2010 according to our estimate). This result can be put in the wider context of the strong bargaining
power of retailers in the USA – especially Walmart – which is documented by several studies199.
In order to verify these first findings, a more detailed analysis would be required in order to better assess
the selling price of tea brands to retailers, and connect more precisely our first estimates to concrete tea
products containing Assam tea (whether pure origin teas or blends).
In India, based on the comparison of the estimated FOB prices and auction prices, the share of value
gained by exporters seems to have remained quite stable: from 0.78 USD per kg in 2009 to 0.72 USD per
kg in 2017. A possible assumption is that the exporters of Assam tea to the USA may not have managed to
increase their gains, although the US market seems quite lucrative at the end of the chain, probably
because of the strong bargaining power of downstream actors in the chain.
Looking at the costs in Assam tea estates, the main result is the very low and stagnating share of value
accruing to workers (which corresponds to the line “plucking costs” on the graph, and is analysed in the
chapter on Indian domestic chains). According to our estimates, after adjustment for inflation, the value
directed to workers’ wages only represented 0.38 USD per kg in 2017 – to be compared with 45.80 USD to
49.60 USD per kg paid by consumers in supermarkets. This fact is all the more striking than tea workers
199 Food & Water Watch, Grocery Goliaths: how food monopolies impact consumers, 2013
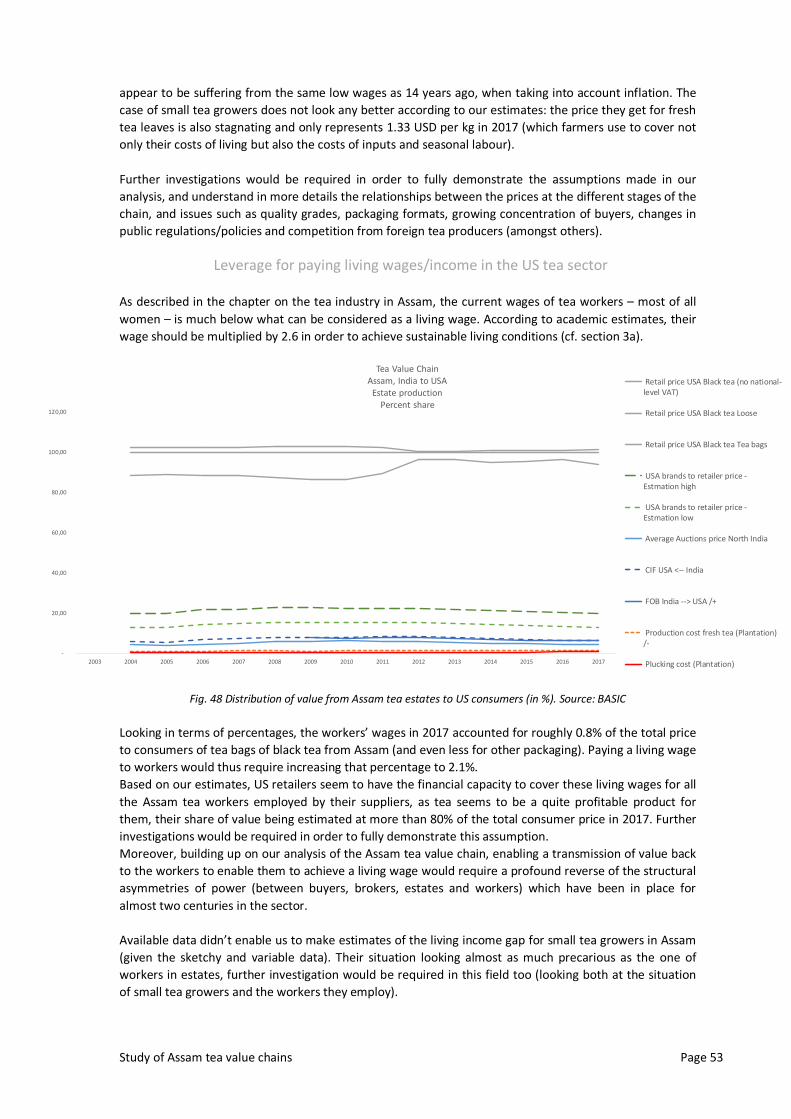
Study of Assam tea value chains Page 53
appear to be suffering from the same low wages as 14 years ago, when taking into account inflation. The
case of small tea growers does not look any better according to our estimates: the price they get for fresh
tea leaves is also stagnating and only represents 1.33 USD per kg in 2017 (which farmers use to cover not
only their costs of living but also the costs of inputs and seasonal labour).
Further investigations would be required in order to fully demonstrate the assumptions made in our
analysis, and understand in more details the relationships between the prices at the different stages of the
chain, and issues such as quality grades, packaging formats, growing concentration of buyers, changes in
public regulations/policies and competition from foreign tea producers (amongst others).
Leverage for paying living wages/income in the US tea sector
As described in the chapter on the tea industry in Assam, the current wages of tea workers – most of all
women – is much below what can be considered as a living wage. According to academic estimates, their
wage should be multiplied by 2.6 in order to achieve sustainable living conditions (cf. section 3a).
-
20,00
40,00
60,00
80,00
100,00
120,00
2003 2004 2005 2006 2007 2008 2009 2010 2011 2012 2013 2014 2015 2016 2017
Tea Value ChainAssam, India to USA
Estate productionPercent share
Retail price USA Black tea (no national-level VAT)
Retail price USA Black tea Loose
Retail price USA Black tea Tea bags
USA brands to retailer price -Estmation high
USA brands to retailer price -Estmation low
Average Auctions price North India
CIF USA <-- India
FOB India --> USA /+
Production cost fresh tea (Plantation)/-
Plucking cost (Plantation)
Fig. 48 Distribution of value from Assam tea estates to US consumers (in %). Source: BASIC
Looking in terms of percentages, the workers’ wages in 2017 accounted for roughly 0.8% of the total price
to consumers of tea bags of black tea from Assam (and even less for other packaging). Paying a living wage
to workers would thus require increasing that percentage to 2.1%.
Based on our estimates, US retailers seem to have the financial capacity to cover these living wages for all
the Assam tea workers employed by their suppliers, as tea seems to be a quite profitable product for
them, their share of value being estimated at more than 80% of the total consumer price in 2017. Further
investigations would be required in order to fully demonstrate this assumption.
Moreover, building up on our analysis of the Assam tea value chain, enabling a transmission of value back
to the workers to enable them to achieve a living wage would require a profound reverse of the structural
asymmetries of power (between buyers, brokers, estates and workers) which have been in place for
almost two centuries in the sector.
Available data didn’t enable us to make estimates of the living income gap for small tea growers in Assam
(given the sketchy and variable data). Their situation looking almost as much precarious as the one of
workers in estates, further investigation would be required in this field too (looking both at the situation
of small tea growers and the workers they employ).
Study of Assam tea value chains Page 54
5. Appendix: Objectives, perimeter & methodology
a) Objectives
While there has been significant reporting on the issues in Assam tea plantations, it is hard to get access to
granular data; especially the data on the transition of value happening at each step of the Tea value chain
in the domestic and the international market.
In the current scenario, the available data on value transition along the tea value chain is discrete and
inadequate to connect the dots and understand the percentage of margins earned by each stakeholder for
every cup of tea consumed by a consumer in the domestic and the international market.
Without specific data on value share, pricing, the supply chain remains very opaque. This opaqueness
limits the ability of civil society to campaign, advocate and demand specific actions. The objective of this
study commissioned by Oxfam and conducted by BASIC is to unpack the pricing of Assam tea and the
distribution of value share across the whole supply chain, from large tea estates (plantations) and small
tea growers in Assam to consumers in 6 different countries.
b) Research questions & countries
The central research question is: “How has the distribution of value along tea value chains changed over
the last 10-20 years, and why?”, in particular:
- How do consumer prices compare today with 10-20 years ago, and what factors could account for
any change?
- How does the proportion of the value captured by intermediaries and/or retailers compare today
with 10-20 years ago, and what accounts for any change?
- How does the proportion of the final consumer price reaching producers/workers compare today
with 10-20 years ago, and what accounts for any change?
- How do the costs of production and costs of living of the producers & workers in tea value chains
compare today with 10-20 years ago, and what accounts for any change? What
increase/redistribution of value would be needed to enable famers to reach a living wage?
The study focuses on tea value chains in the following countries:
Country Consumer markets
India (Assam) Export markets
Germany
United Kingdom
France
Netherlands
USA
Domestic market India
c) Methodological approach
Conceptual framework
Our analysis of value chains is both quantitative and qualitative, based on the conceptual frameworks of
Global Value Chains and Global Production Networks.
Study of Assam tea value chains Page 55
The concept of Global Value Chains (GVCs) derives from the world systems theory developed by Immanuel
Wallerstein in the 1970’s. He introduced the concept of global commodity chains (GCCs) defined as
‘networks of labour and production processes whose end result is a finished commodity’200. In 1994,
Gereffi and Korzeniewicz revived the concept in order to better understand the impacts of growing trade
liberalisation, focusing on the strategies and actions of lead firms conceived as the core actors in a
globalised economy201. In 2005, Gereffi, Humphrey and Sturgeon consolidated the global commodity
approach with the theory of Global Value Chains (GVC)202 .
More recently, the related conceptual framework of Global Production Networks (GPN) has been
developed by the Manchester school of geography, as a multi-dimensional approach to understand the
structuring of value chains with a particular focus on “value generation/capture”, “power” (corporate,
collective and institutional) and “embeddedness” (territorial and network).
In comparison with other approaches, the theories of Global Value Chains and Global Production
Networks provide a radically new view on international trade203:
They enable to analyse the whole set of economic activities and actors ranging from the production of raw
materials up to the end consumption of final products, whereas traditional economic trade theory only
focuses on supply and demand.
They offer a framework to investigate the interactions between the configuration of global chains (input-
output, key nodes, territories, governance and institutions….) and their economic determinants (supply
and demand, value and cost breakdown, price dynamics, income distribution…)
They focus on the institutional context of power relations in which trade is embedded, the characteristics
of economic governance and share of value, with key agents setting the rules of the game, while economic
trade theory assumes that ‘buyers and sellers in different markets meet each other as independent
agents’.
Over the past 20 years, Global Value Chain and Global Production Network analysis have been flourishing
approaches used for studying the dynamics of globalisation and economic governance. Widely adopted by
sociologists and geographers, it has also attracted growing interest from economists, anthropologists and
historians to analyse the international organization of industries such as food, clothing and electronics204.
More recently, a number of international agencies such as the World Bank, the OECD, the ILO and the FAO
have also started to use Global Value Chain analysis to investigate industrial upgrading and poverty
alleviation.
200 Hopkins and Wallerstein (1986: 159) - https://www.jstor.org/stable/40241052 accessed on 12th November 2018 201 Gereffi and Korzeniewicz, Commodity Chains and Global Capitalism, 1994 - https://edisciplinas.usp.br/pluginfile.php/4209363/mod_folder/content/0/Gary%20Gereffi%20Commodity%20Chains%20and%20Global%20Introdu%C3%A7%C3%A3o.pdf?forcedownload=1 accessed on 12th November 2018 202 Gary Gereffi, John Humphrey, and Timothy Sturgeon. “The Governance of Global Value Chains.” Review of International Political Economy 12, no. 1 (February 2005): 78–104 - http://www.fao.org/fileadmin/user_upload/fisheries/docs/GVC_Governance.pdf accessed on 12th November 2018 203 Gibbon, Bair and Ponte (2008) “Governing Global Value Chains: An Introduction,” Economy and Society, Vol. 37, No. 3, pp. 315-338 - https://research-api.cbs.dk/ws/portalfiles/portal/46585232/stefano_ponte_governing_global_value_chains_postprint.pdf accessed on 12th November 2018 204 The Global Value Chains approach initiated a wave of interdisciplinary literature which investigated the ways in which organizationally fragmented and geographically dispersed processes of production have been a critical feature of economic globalization: fresh fruit and vegetables (Raynolds; Dolan et al.), tropical commodities such as coffee, cocoa, cotton, sugar, rubber, tobacco, etc. (Ponte, Raynolds, Fold, Gibbon, Daviron, Gwynne, Barrientos), exports of apparel from East Asia, Mexico and the Caribbean (Gereffi, Palpacuer), electronics (Kenney and Florida), automobile industry (Hill; Doner; Barnes, Kaplinsky and Morris), semi-conductors (Henderson), tourism (Clancy), services (Rabach & Kim)…
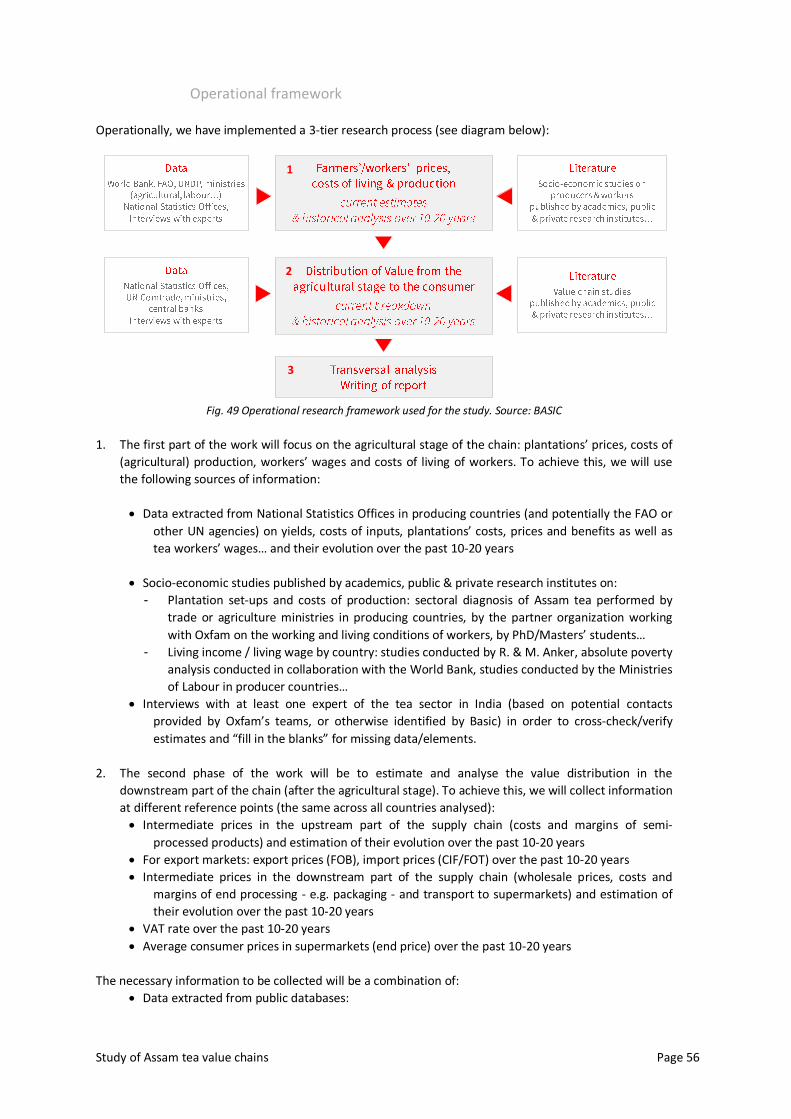
Study of Assam tea value chains Page 56
Operational framework
Operationally, we have implemented a 3-tier research process (see diagram below):
2
1
3
Fig. 49 Operational research framework used for the study. Source: BASIC
1. The first part of the work will focus on the agricultural stage of the chain: plantations’ prices, costs of
(agricultural) production, workers’ wages and costs of living of workers. To achieve this, we will use
the following sources of information:
• Data extracted from National Statistics Offices in producing countries (and potentially the FAO or
other UN agencies) on yields, costs of inputs, plantations’ costs, prices and benefits as well as
tea workers’ wages… and their evolution over the past 10-20 years
• Socio-economic studies published by academics, public & private research institutes on:
- Plantation set-ups and costs of production: sectoral diagnosis of Assam tea performed by
trade or agriculture ministries in producing countries, by the partner organization working
with Oxfam on the working and living conditions of workers, by PhD/Masters’ students…
- Living income / living wage by country: studies conducted by R. & M. Anker, absolute poverty
analysis conducted in collaboration with the World Bank, studies conducted by the Ministries
of Labour in producer countries…
• Interviews with at least one expert of the tea sector in India (based on potential contacts
provided by Oxfam’s teams, or otherwise identified by Basic) in order to cross-check/verify
estimates and “fill in the blanks” for missing data/elements.
2. The second phase of the work will be to estimate and analyse the value distribution in the
downstream part of the chain (after the agricultural stage). To achieve this, we will collect information
at different reference points (the same across all countries analysed):
• Intermediate prices in the upstream part of the supply chain (costs and margins of semi-
processed products) and estimation of their evolution over the past 10-20 years
• For export markets: export prices (FOB), import prices (CIF/FOT) over the past 10-20 years
• Intermediate prices in the downstream part of the supply chain (wholesale prices, costs and
margins of end processing - e.g. packaging - and transport to supermarkets) and estimation of
their evolution over the past 10-20 years
• VAT rate over the past 10-20 years
• Average consumer prices in supermarkets (end price) over the past 10-20 years
The necessary information to be collected will be a combination of:
• Data extracted from public databases:
Study of Assam tea value chains Page 57
- National Statistics Offices, ministries (economy…) and/or central banks of the different
countries under investigation for data on consumer prices, intermediate prices (when
available) and processing costs.
- World Bank & National Statistics Offices for indices enabling to estimate the evolution of
prices & costs over the past 10-20 years
- for import and export: UN Comtrade data
• Literature review: value chain analysis (published by academics, public & private institutions) will
be identified and analysed for each country under investigation in order to collect
complementary data, in particular on intermediate prices which are most often lacking in public
databases.
• Interviews with at least one expert of the tea sector in India (based on potential contacts
provided by Oxfam’s teams, or otherwise identified by Basic) in order to cross-check/verify
estimates and “fill in the blanks” for missing data/elements.
3. Based on these, and using Basic’s methodological framework, we will conduct a quantitative and
qualitative analysis of the distribution of value in Assam tea chains, and its evolution over the last 10
to 20 years. In addition, we will provide estimates and an analysis of the evolution of the costs of
production and costs of living vis-à-vis the evolution of the value left for the workers analysed in the
previous stage.
d) Limitations
The main challenge of the study will be to collect detailed and credible data along value chains from
producers up to retailers. Indeed, prices, costs and margins fluctuate and are the most confidential
information in business, very difficult to access and to counter-verify from the outside.
To address this issue, the Basic’s approach is to:
- collect and analyse quantitative data from public and private databases (UN Comtrade, World
Bank, research institutes, ministries in producing countries…) through an internal dedicated IT
system
- combine this quantitative data with the qualitative analysis emerging from literature through
different angles of investigation (economic, sociologic…),
- cross-check and enrich this information/analysis through at least one or two experts of the tea
sector in each country analysed (based on potential contacts provided by Oxfam’s teams, or
otherwise identified by Basic).
The modelled value chains only provide quantitative estimates/orders of magnitude for the most common
set of actors and operations from agricultural cultivation by small farmers and workers, up to the
consumer purchases in retail shops. A wide variety of other organisational frameworks can be found in
reality for each product analysed, leading to potential variations in the value distribution estimates.
However, the prices and costs levels and trends calculated in this study provide a first comprehensive
evaluation and a sound basis for discussion among actors and stakeholders of each of the value chain
analysed.
Regarding the calculation of “living income/wage”, the proposed approach will give a first estimate. Given
the objectives of the study, and the time & resource constraints, using the average costs of essential
goods & services for a typical family will provide enough details and credibility to the analysis. To achieve
this, we will collect the most recent studies conducted on this subject in the countries under investigation
(in particular the ones developed by the Global Living wage Coalition and WageIndicator).
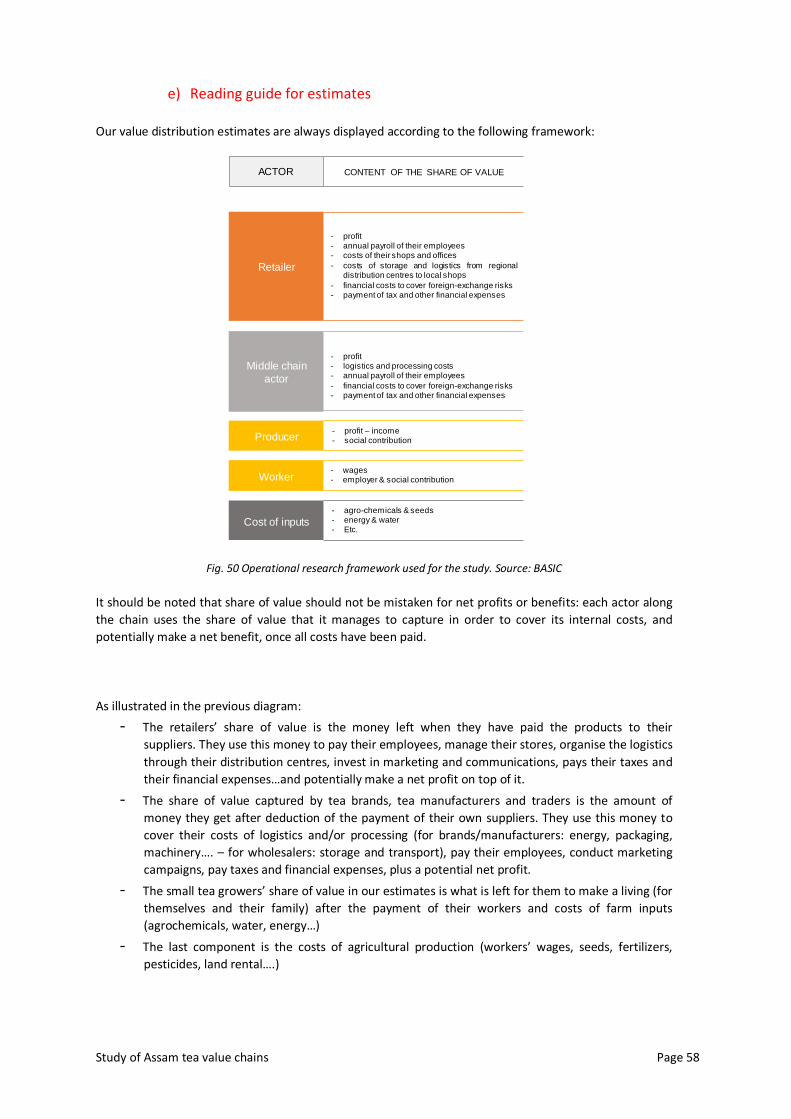
Study of Assam tea value chains Page 58
e) Reading guide for estimates
Our value distribution estimates are always displayed according to the following framework:
- profit- annual payroll of their employees- costs of their shops and offices
- costs of storage and logistics from regionaldistribution centres to local shops
- financial costs to cover foreign-exchange risks- payment of tax and other financial expenses
- profit – income- social contribution
- wages- employer & social contribution
- agro-chemicals & seeds- energy & water- Etc.
- profit- logistics and processing costs- annual payroll of their employees
- financial costs to cover foreign-exchange risks- payment of tax and other financial expenses
Retailer
Middle chain
actor
Producer
Worker
Cost of inputs
ACTOR CONTENT OF THE SHARE OF VALUE
Fig. 50 Operational research framework used for the study. Source: BASIC
It should be noted that share of value should not be mistaken for net profits or benefits: each actor along
the chain uses the share of value that it manages to capture in order to cover its internal costs, and
potentially make a net benefit, once all costs have been paid.
As illustrated in the previous diagram:
- The retailers’ share of value is the money left when they have paid the products to their
suppliers. They use this money to pay their employees, manage their stores, organise the logistics
through their distribution centres, invest in marketing and communications, pays their taxes and
their financial expenses…and potentially make a net profit on top of it.
- The share of value captured by tea brands, tea manufacturers and traders is the amount of
money they get after deduction of the payment of their own suppliers. They use this money to
cover their costs of logistics and/or processing (for brands/manufacturers: energy, packaging,
machinery…. – for wholesalers: storage and transport), pay their employees, conduct marketing
campaigns, pay taxes and financial expenses, plus a potential net profit.
- The small tea growers’ share of value in our estimates is what is left for them to make a living (for
themselves and their family) after the payment of their workers and costs of farm inputs
(agrochemicals, water, energy…)
- The last component is the costs of agricultural production (workers’ wages, seeds, fertilizers,
pesticides, land rental….)


![Productivity Improvement of Black Tea Production: A Case …...pattern of discovery of tea in Assam, the first tea growing region of India. Nizara [2] studied the development profile](https://static.documents.pub/doc/80x56/609da15034df3f69f32eb615/productivity-improvement-of-black-tea-production-a-case-pattern-of-discovery.jpg)


