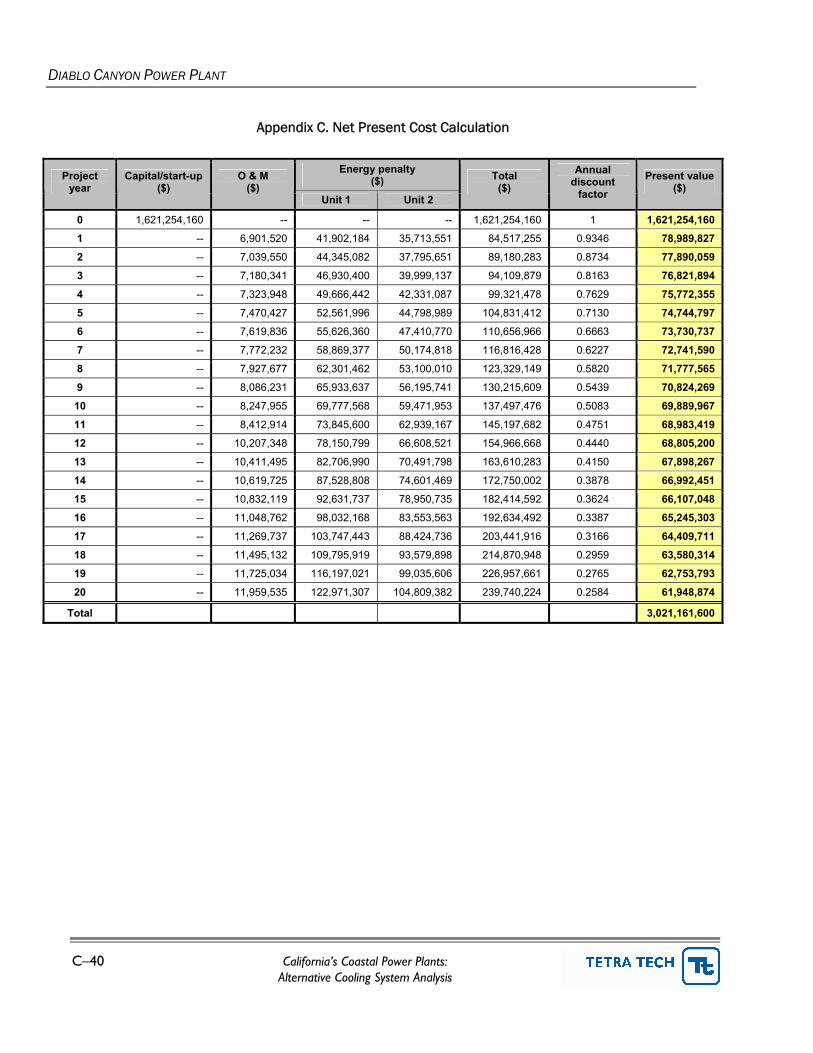
Appendices Appendix A. Once-Through and Closed-Cycle Thermal Performance................................................... C–36 Appendix B. Itemized Capital Costs ....................................................................................................... C–37 Appendix C. Net Present Cost Calculation............................................................................................. C–40
DIABLO CANYON POWER PLANT
California’s Coastal Power Plants: C–1 Alternative Cooling System Analysis
1.0 GENERAL SUMMARY Retrofitting the existing once-through cooling system at Diablo Canyon Power Plant (DCPP) with closed-cycle wet cooling towers is technically and logistically feasible based on this study’s design criteria, and will reduce cooling water withdrawals from the Pacific Ocean by approximately 96 percent. Impingement and entrainment impacts would be reduced by a similar proportion.
The preferred option selected for DCPP includes 2 conventional wet cooling towers (without plume abatement), with individual cells arranged in a back-to-back configuration to accommodate limited space at the site. Sufficient area does not exist at the site to accommodate plume-abated towers.
The location of the DCPP site along a narrow coastal terrace at the foot of the Irish Hills combined with the layout of existing structures at the facility complicates the identification of suitable areas in which to place cooling towers. Any retrofit project that incorporates a closed-cycle system requires the relocation of various support structures—employee parking areas, warehouses, and maintenance facilities—to other areas that do not appear to be available within the portion of the property that is zoned for industrial development. Off-site relocation of parking areas and support services, if feasible, would increase project costs and are beyond the scope of this study.
Construction-related shutdowns are estimated to take approximately 8 months for both units (concurrent). As a baseload facility, DCPP would incur a substantial financial loss as a result. The configuration of DCPP does not enable a staggered retrofit (one unit at a time). As a nuclear facility, DCPP is subject to the Nuclear Regulatory Commission’s (NRC) oversight and approval for substantial changes to the existing system operations as described in this chapter. It is unclear how the NRC’s review and approval process might affect any downtime estimates.
The cooling tower configuration designed under the preferred option complies with all identified local use restrictions and includes necessary mitigation measures, where applicable.
1.1 COST
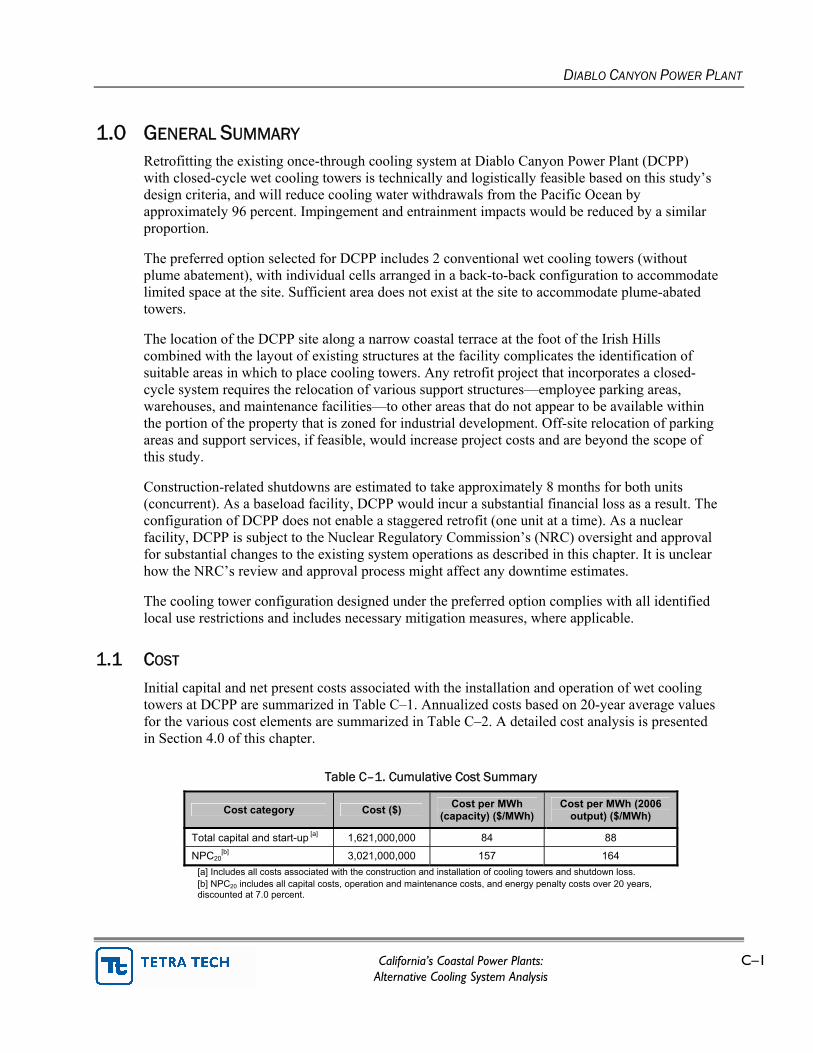
Initial capital and net present costs associated with the installation and operation of wet cooling towers at DCPP are summarized in Table C–1. Annualized costs based on 20-year average values for the various cost elements are summarized in Table C–2. A detailed cost analysis is presented in Section 4.0 of this chapter.
Table C–1. Cumulative Cost Summary
Cost category Cost ($) Cost per MWh (capacity) ($/MWh)
Cost per MWh (2006 output) ($/MWh)
Total capital and start-up [a]
1,621,000,000 84 88
NPC20[b]
3,021,000,000 157 164 [a] Includes all costs associated with the construction and installation of cooling towers and shutdown loss. [b] NPC20 includes all capital costs, operation and maintenance costs, and energy penalty costs over 20 years, discounted at 7.0 percent.
DIABLO CANYON POWER PLANT
C–2 California’s Coastal Power Plants: Alternative Cooling System Analysis
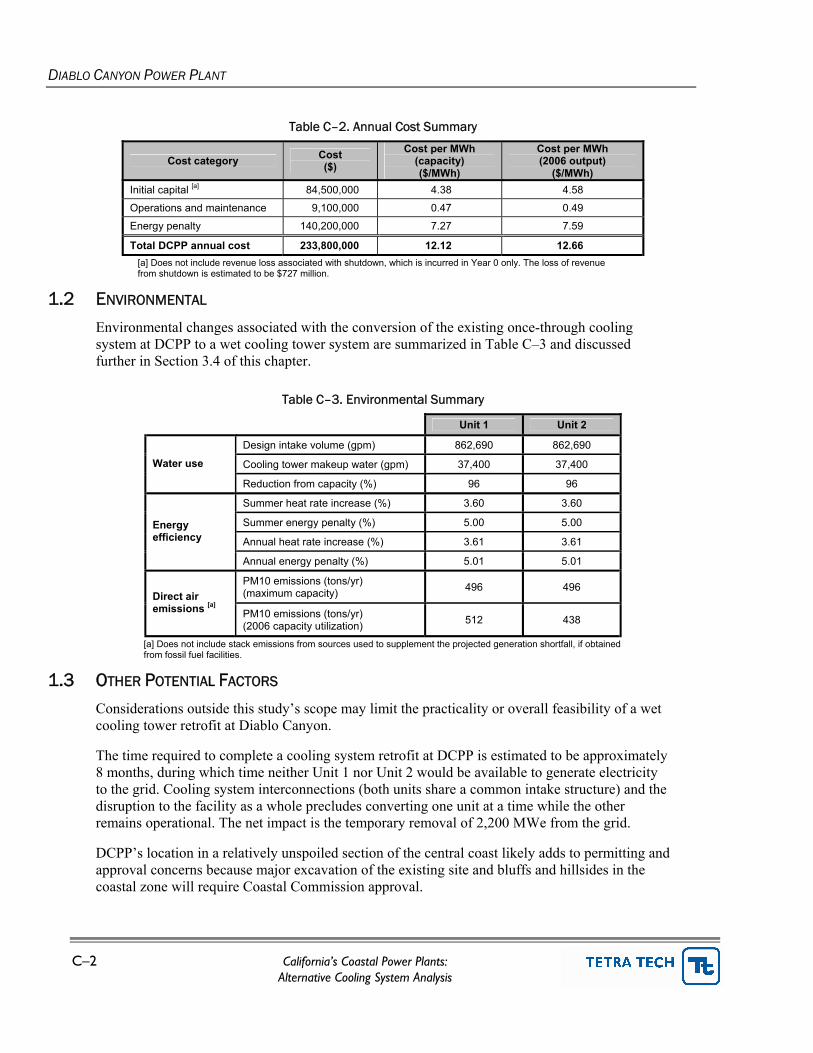
Table C–2. Annual Cost Summary
Cost category Cost ($)
Cost per MWh (capacity) ($/MWh)
Cost per MWh (2006 output)
($/MWh) Initial capital [a] 84,500,000 4.38 4.58
Operations and maintenance 9,100,000 0.47 0.49
Energy penalty 140,200,000 7.27 7.59
Total DCPP annual cost 233,800,000 12.12 12.66 [a] Does not include revenue loss associated with shutdown, which is incurred in Year 0 only. The loss of revenue from shutdown is estimated to be $727 million.
1.2 ENVIRONMENTAL
Environmental changes associated with the conversion of the existing once-through cooling system at DCPP to a wet cooling tower system are summarized in Table C–3 and discussed further in Section 3.4 of this chapter.
Table C–3. Environmental Summary
Unit 1 Unit 2
Design intake volume (gpm) 862,690 862,690
Cooling tower makeup water (gpm) 37,400 37,400 Water use
Reduction from capacity (%) 96 96
Summer heat rate increase (%) 3.60 3.60
Summer energy penalty (%) 5.00 5.00
Annual heat rate increase (%) 3.61 3.61 Energy efficiency
[a] Does not include stack emissions from sources used to supplement the projected generation shortfall, if obtained from fossil fuel facilities.
1.3 OTHER POTENTIAL FACTORS
Considerations outside this study’s scope may limit the practicality or overall feasibility of a wet cooling tower retrofit at Diablo Canyon.
The time required to complete a cooling system retrofit at DCPP is estimated to be approximately 8 months, during which time neither Unit 1 nor Unit 2 would be available to generate electricity to the grid. Cooling system interconnections (both units share a common intake structure) and the disruption to the facility as a whole precludes converting one unit at a time while the other remains operational. The net impact is the temporary removal of 2,200 MWe from the grid.
DCPP’s location in a relatively unspoiled section of the central coast likely adds to permitting and approval concerns because major excavation of the existing site and bluffs and hillsides in the coastal zone will require Coastal Commission approval.
DIABLO CANYON POWER PLANT
California’s Coastal Power Plants: C–3 Alternative Cooling System Analysis
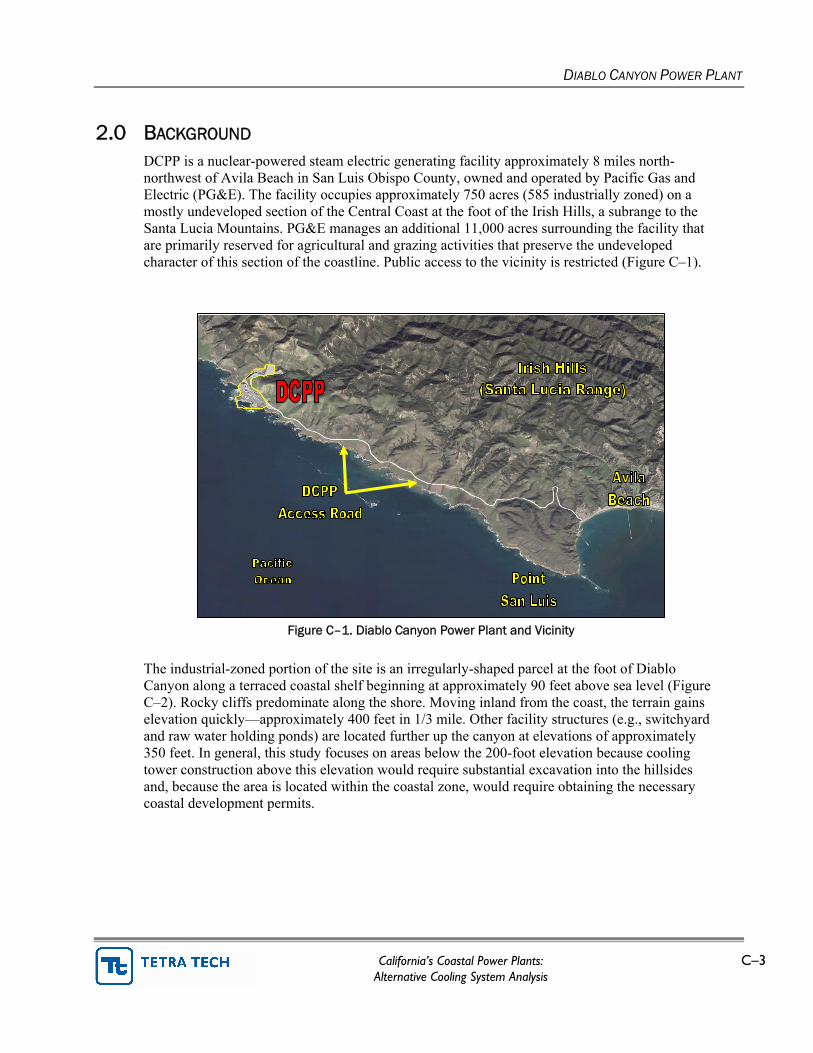
2.0 BACKGROUND DCPP is a nuclear-powered steam electric generating facility approximately 8 miles north-northwest of Avila Beach in San Luis Obispo County, owned and operated by Pacific Gas and Electric (PG&E). The facility occupies approximately 750 acres (585 industrially zoned) on a mostly undeveloped section of the Central Coast at the foot of the Irish Hills, a subrange to the Santa Lucia Mountains. PG&E manages an additional 11,000 acres surrounding the facility that are primarily reserved for agricultural and grazing activities that preserve the undeveloped character of this section of the coastline. Public access to the vicinity is restricted (Figure C–1).
Figure C–1. Diablo Canyon Power Plant and Vicinity
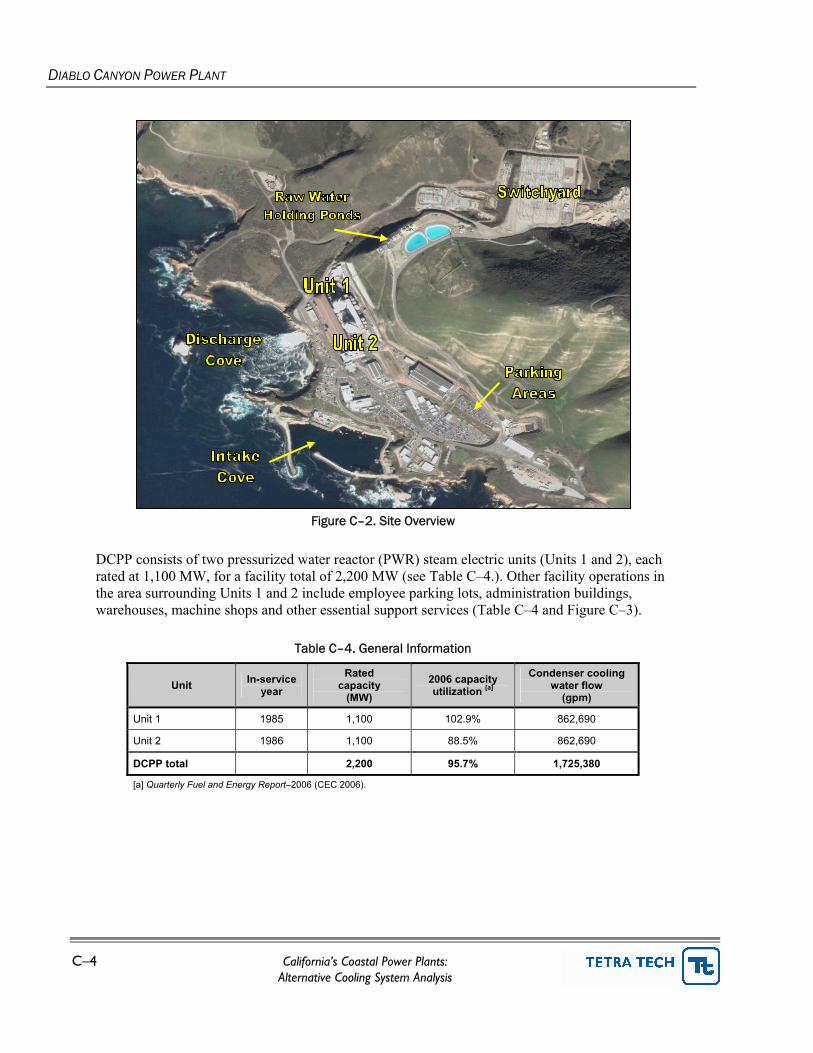
The industrial-zoned portion of the site is an irregularly-shaped parcel at the foot of Diablo Canyon along a terraced coastal shelf beginning at approximately 90 feet above sea level (Figure C–2). Rocky cliffs predominate along the shore. Moving inland from the coast, the terrain gains elevation quickly—approximately 400 feet in 1/3 mile. Other facility structures (e.g., switchyard and raw water holding ponds) are located further up the canyon at elevations of approximately 350 feet. In general, this study focuses on areas below the 200-foot elevation because cooling tower construction above this elevation would require substantial excavation into the hillsides and, because the area is located within the coastal zone, would require obtaining the necessary coastal development permits.
DIABLO CANYON POWER PLANT
C–4 California’s Coastal Power Plants: Alternative Cooling System Analysis
Figure C–2. Site Overview
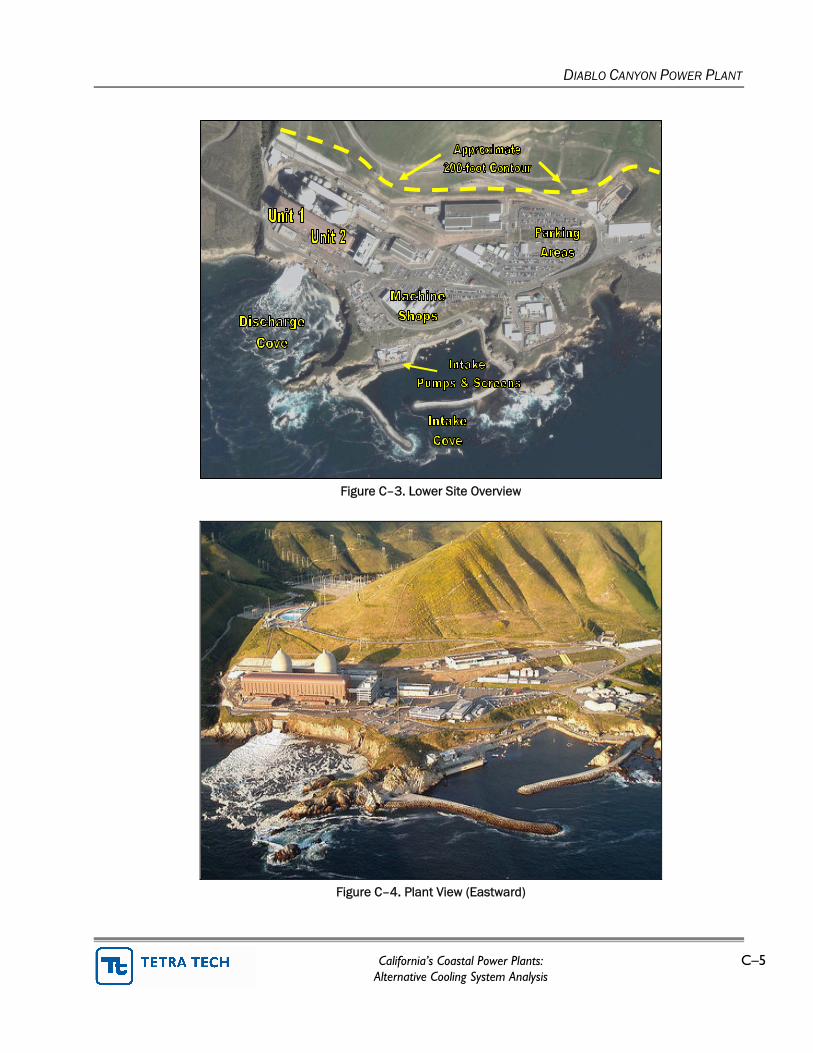
DCPP consists of two pressurized water reactor (PWR) steam electric units (Units 1 and 2), each rated at 1,100 MW, for a facility total of 2,200 MW (see Table C–4.). Other facility operations in the area surrounding Units 1 and 2 include employee parking lots, administration buildings, warehouses, machine shops and other essential support services (Table C–4 and Figure C–3).
Table C–4. General Information
Unit In-service year
Rated capacity
(MW)
2006 capacity utilization [a]
Condenser cooling water flow
(gpm)
Unit 1 1985 1,100 102.9% 862,690
Unit 2 1986 1,100 88.5% 862,690
DCPP total 2,200 95.7% 1,725,380
[a] Quarterly Fuel and Energy Report–2006 (CEC 2006).
DIABLO CANYON POWER PLANT
California’s Coastal Power Plants: C–5 Alternative Cooling System Analysis
Figure C–3. Lower Site Overview
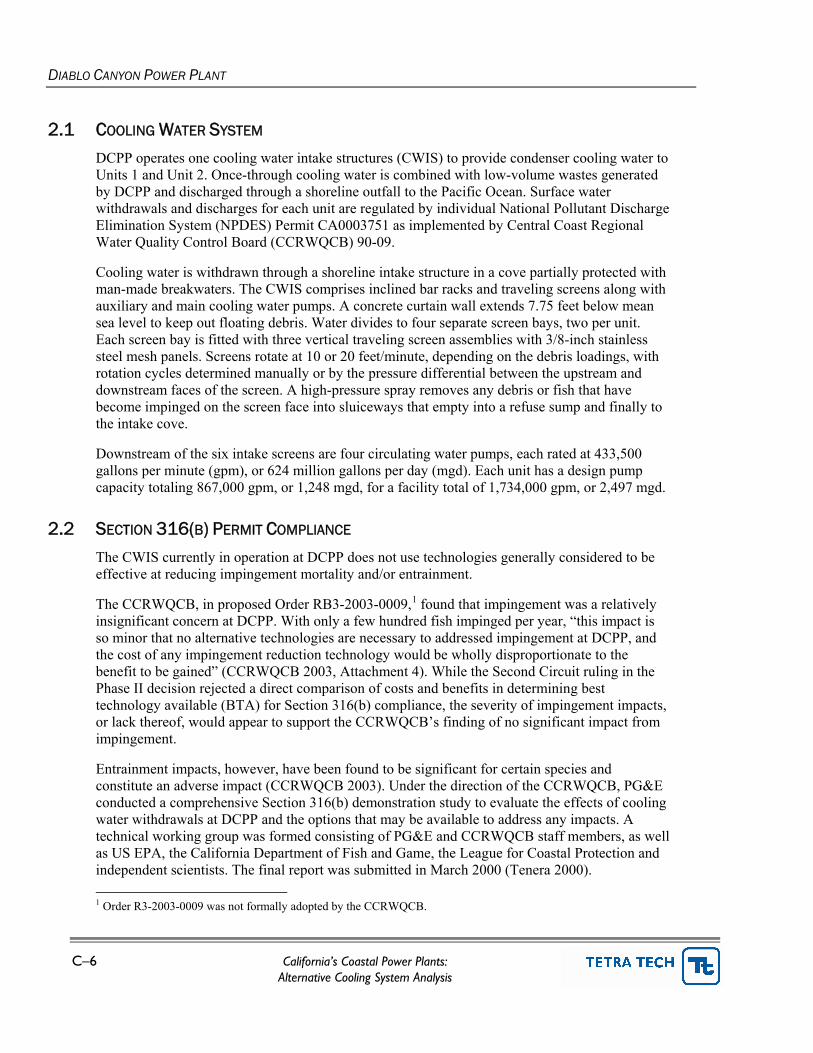
Figure C–4. Plant View (Eastward)
DIABLO CANYON POWER PLANT
C–6 California’s Coastal Power Plants: Alternative Cooling System Analysis
2.1 COOLING WATER SYSTEM
DCPP operates one cooling water intake structures (CWIS) to provide condenser cooling water to Units 1 and Unit 2. Once-through cooling water is combined with low-volume wastes generated by DCPP and discharged through a shoreline outfall to the Pacific Ocean. Surface water withdrawals and discharges for each unit are regulated by individual National Pollutant Discharge Elimination System (NPDES) Permit CA0003751 as implemented by Central Coast Regional Water Quality Control Board (CCRWQCB) 90-09.
Cooling water is withdrawn through a shoreline intake structure in a cove partially protected with man-made breakwaters. The CWIS comprises inclined bar racks and traveling screens along with auxiliary and main cooling water pumps. A concrete curtain wall extends 7.75 feet below mean sea level to keep out floating debris. Water divides to four separate screen bays, two per unit. Each screen bay is fitted with three vertical traveling screen assemblies with 3/8-inch stainless steel mesh panels. Screens rotate at 10 or 20 feet/minute, depending on the debris loadings, with rotation cycles determined manually or by the pressure differential between the upstream and downstream faces of the screen. A high-pressure spray removes any debris or fish that have become impinged on the screen face into sluiceways that empty into a refuse sump and finally to the intake cove.
Downstream of the six intake screens are four circulating water pumps, each rated at 433,500 gallons per minute (gpm), or 624 million gallons per day (mgd). Each unit has a design pump capacity totaling 867,000 gpm, or 1,248 mgd, for a facility total of 1,734,000 gpm, or 2,497 mgd.
2.2 SECTION 316(B) PERMIT COMPLIANCE
The CWIS currently in operation at DCPP does not use technologies generally considered to be effective at reducing impingement mortality and/or entrainment.
The CCRWQCB, in proposed Order RB3-2003-0009,1 found that impingement was a relatively insignificant concern at DCPP. With only a few hundred fish impinged per year, “this impact is so minor that no alternative technologies are necessary to addressed impingement at DCPP, and the cost of any impingement reduction technology would be wholly disproportionate to the benefit to be gained” (CCRWQCB 2003, Attachment 4). While the Second Circuit ruling in the Phase II decision rejected a direct comparison of costs and benefits in determining best technology available (BTA) for Section 316(b) compliance, the severity of impingement impacts, or lack thereof, would appear to support the CCRWQCB’s finding of no significant impact from impingement.
Entrainment impacts, however, have been found to be significant for certain species and constitute an adverse impact (CCRWQCB 2003). Under the direction of the CCRWQCB, PG&E conducted a comprehensive Section 316(b) demonstration study to evaluate the effects of cooling water withdrawals at DCPP and the options that may be available to address any impacts. A technical working group was formed consisting of PG&E and CCRWQCB staff members, as well as US EPA, the California Department of Fish and Game, the League for Coastal Protection and independent scientists. The final report was submitted in March 2000 (Tenera 2000). 1 Order R3-2003-0009 was not formally adopted by the CCRWQCB.
DIABLO CANYON POWER PLANT
California’s Coastal Power Plants: C–7 Alternative Cooling System Analysis
In 2002, the CCRWQCB retained Tetra Tech to perform an evaluation of the feasibility and general cost of different technologies that could minimize entrainment impacts at DCPP. Tetra Tech’s study reviewed closed-cycle technologies, both dry and wet, as well as fine-mesh screening systems and aquatic filtration barriers (AFBs). Dry cooling towers, freshwater cooling towers, fine-mesh screens and AFBs were all determined to be infeasible for application at DCPP because of the limited space, the effects on plant performance and extremes in ocean currents and weather that frequent the area during winter storms. Mechanical draft saltwater cooling towers were considered potentially feasible provided certain assumptions made regarding the relocation of facility structures were viable. The 2002 Tetra Tech report estimated the NPC of a wet cooling tower retrofit at DCPP, including annual operations and maintenance (O&M) costs and energy penalty costs, at $1,300 million.2
Based on the 2002 Tetra Tech report, benefits evaluations performed by other contractors, information provided by PG&E, and its own analysis, the CCRWQCB noted in the proposed order that the cost of saltwater wet cooling towers was wholly disproportionate to the monetized environmental benefit that could be gained (CCRWQCB 2003, Attachment 4). The Second Circuit’s Phase II ruling rejected the direct comparison of costs to benefits when evaluating acceptable technology-based solutions to meet CWA 316(b). It is not clear how this ruling will affect similar determinations in future permit proceedings.
2 Burns Engineering Services, Inc. (BES), on behalf of PG&E, addressed several areas that either were not evaluated in the 2002 Tetra Tech report or evaluated using different criteria and assumptions, including the availability of certain locations and additional costs related to condenser modifications and the energy penalty. This study addresses some of the differences between the two reports.
DIABLO CANYON POWER PLANT
C–8 California’s Coastal Power Plants: Alternative Cooling System Analysis
3.0 WET COOLING SYSTEM RETROFIT
3.1 OVERVIEW
This study evaluates the use of saltwater wet cooling towers at DCPP, with the current source water (Pacific Ocean) continuing to provide makeup water to the facility. Conversion of the existing once-through cooling system to wet cooling towers will reduce the facility’s current intake capacity by approximately 96 percent; rates of impingement and entrainment will decline by a similar proportion. Use of reclaimed water was considered for DCPP but not analyzed in detail because the available volume of water is insufficient to replace the current once-through cooling volume withdrawn from the Pacific Ocean.
As a makeup water source, reclaimed water may be an attractive alternative when considering additional benefits its use may provide, such as avoidance of conflicts with effluent limitations or air emission standards. Securing a sufficient volume of makeup water from secondary or reclaimed sources in the vicinity (45 to 50 mgd in a freshwater configuration) is unlikely, however. Any wet cooling tower constructed at DCPP would have to use sea water for makeup water unless freshwater were produced onsite. Use of reclaimed water is discussed further in Section 3.4.4, below.
The configuration of the wet cooling towers—their size and location—was based on best professional judgment (BPJ) using the criteria outlined in Chapter 5 and designed to meet the performance benchmarks in the most cost-effective manner.
Previous analyses of wet cooling towers at DCPP have been conducted and include the following:
• Assessment of Alternatives to the Existing Cooling Water System (DCPP). Tera Corporation (Tera) for PG&E. 1982.
• Evaluation of Cooling System Alternatives: Diablo Canyon Power Plant. Tetra Tech for CCRWQCB. 2002.
• Feasibility of Retrofitting Cooling Towers at Diablo Canyon Power Plant Units 1 & 2. Burns Engineering Services (BES) for PG&E. 2003.
Based on a review of information provided by these reports and obtained from public records, installing wet cooling towers at DCPP as a retrofit of the existing once-through cooling system faces significant logistical obstacles regarding the placement of the towers themselves as well as the relocation of existing structures to obtain sufficient space. The compact and irregular shape of the DCPP site combined with the complexities of a nuclear power plant would necessarily require significant disruption to the facility’s operations for 8 months or more.
This study developed a conceptual design of wet cooling towers assuming conflicts over the availability of certain locations could be resolved. As designed, the towers are sufficient to meet the cooling demand for DCPP’s two units without exceeding the turbine’s design tolerances. Cost estimates are based on vendor quotes developed using the available information and the various design constraints identified at DCPP.
DIABLO CANYON POWER PLANT
California’s Coastal Power Plants: C–9 Alternative Cooling System Analysis
Converting to a wet cooling towers system will reduce the facility’s available output by an annual average of 5.01 percent (approximately 110 MW). This is likely to be a major consideration if such a project moves forward. The overall practicality of retrofitting the Units 1 and 2 will require an evaluation of factors outside the scope of this study, such as the projected life span of the generating units and their role in the overall reliability of electricity production and transmission in California, particularly the Central Coast and Los Angeles regions.
3.2 DESIGN BASIS
3.2.1 CONDENSER SPECIFICATIONS
For this study, the conceptual design of the cooling towers selected for DCPP is based on the assumption that the condenser flow rate and thermal load will remain unchanged from the current system. Although no provision is included to re-optimize the condenser performance for service with a cooling tower, some modifications to the condenser (tube sheet and water box reinforcement) may be necessary to handle the increased water pressures that will result from the increased total pump head required to raise water to the elevation of the cooling tower riser.3
Additional costs associated with condenser modifications are included in the discussion of capital expenditures (Section 4.3).
If wet cooling towers were installed, DCPP, as a facility with a projected remaining life span of 15 years or more (currently licensed to operate through 2024 and 2025 for Units 1 and 2), would likely pursue an overall strategy that included re-optimizing the condenser to minimize performance losses resulting from a conversion. Re-optimization would require extensive demolition and excavation of the existing site to gain access to the existing condensers (on the lower level of the turbine building) and reconfigure the tubes and supply and return lines connecting to the water boxes.
Because of the complexity and level of detail required to develop an accurate estimate of a condenser re-optimization for DCPP, no attempt is made to characterize the cost or impact on facility downtime during construction in this study. The 2003 BES report notes this type of modification may increase the construction-related downtime for the facility, although it is unclear how much of the condenser modification process would overlap with other cooling tower activities (BES 2003).
Data describing the DCPP’s thermal performance and existing cooling system were obtained from the studies noted in Section 3.1 and publicly-available sources.
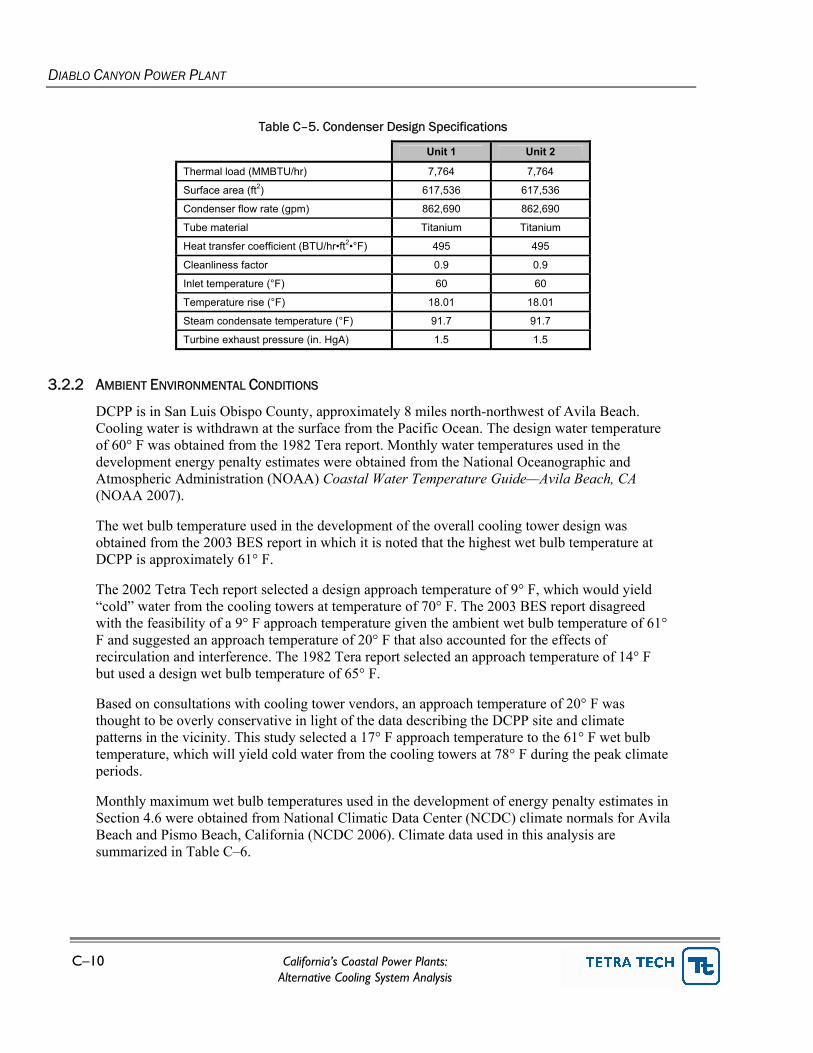
Table C–5 summarizes the condenser design specifications for Units 1 and 2 used in this study.
3 In this context, re-optimization refers to a comprehensive overhaul of the condenser, such as re-tubing or converting the flow from single to multiple passes. Modifications are generally limited to reinforcement measures to enable the condenser to withstand the increased pressures.
DIABLO CANYON POWER PLANT
C–10 California’s Coastal Power Plants: Alternative Cooling System Analysis
Table C–5. Condenser Design Specifications
Unit 1 Unit 2
Thermal load (MMBTU/hr) 7,764 7,764
Surface area (ft2) 617,536 617,536
Condenser flow rate (gpm) 862,690 862,690
Tube material Titanium Titanium
Heat transfer coefficient (BTU/hr•ft2•°F) 495 495
Cleanliness factor 0.9 0.9
Inlet temperature (°F) 60 60
Temperature rise (°F) 18.01 18.01
Steam condensate temperature (°F) 91.7 91.7
Turbine exhaust pressure (in. HgA) 1.5 1.5
3.2.2 AMBIENT ENVIRONMENTAL CONDITIONS
DCPP is in San Luis Obispo County, approximately 8 miles north-northwest of Avila Beach. Cooling water is withdrawn at the surface from the Pacific Ocean. The design water temperature of 60° F was obtained from the 1982 Tera report. Monthly water temperatures used in the development energy penalty estimates were obtained from the National Oceanographic and Atmospheric Administration (NOAA) Coastal Water Temperature Guide—Avila Beach, CA (NOAA 2007).
The wet bulb temperature used in the development of the overall cooling tower design was obtained from the 2003 BES report in which it is noted that the highest wet bulb temperature at DCPP is approximately 61° F.
The 2002 Tetra Tech report selected a design approach temperature of 9° F, which would yield “cold” water from the cooling towers at temperature of 70° F. The 2003 BES report disagreed with the feasibility of a 9° F approach temperature given the ambient wet bulb temperature of 61° F and suggested an approach temperature of 20° F that also accounted for the effects of recirculation and interference. The 1982 Tera report selected an approach temperature of 14° F but used a design wet bulb temperature of 65° F.
Based on consultations with cooling tower vendors, an approach temperature of 20° F was thought to be overly conservative in light of the data describing the DCPP site and climate patterns in the vicinity. This study selected a 17° F approach temperature to the 61° F wet bulb temperature, which will yield cold water from the cooling towers at 78° F during the peak climate periods.
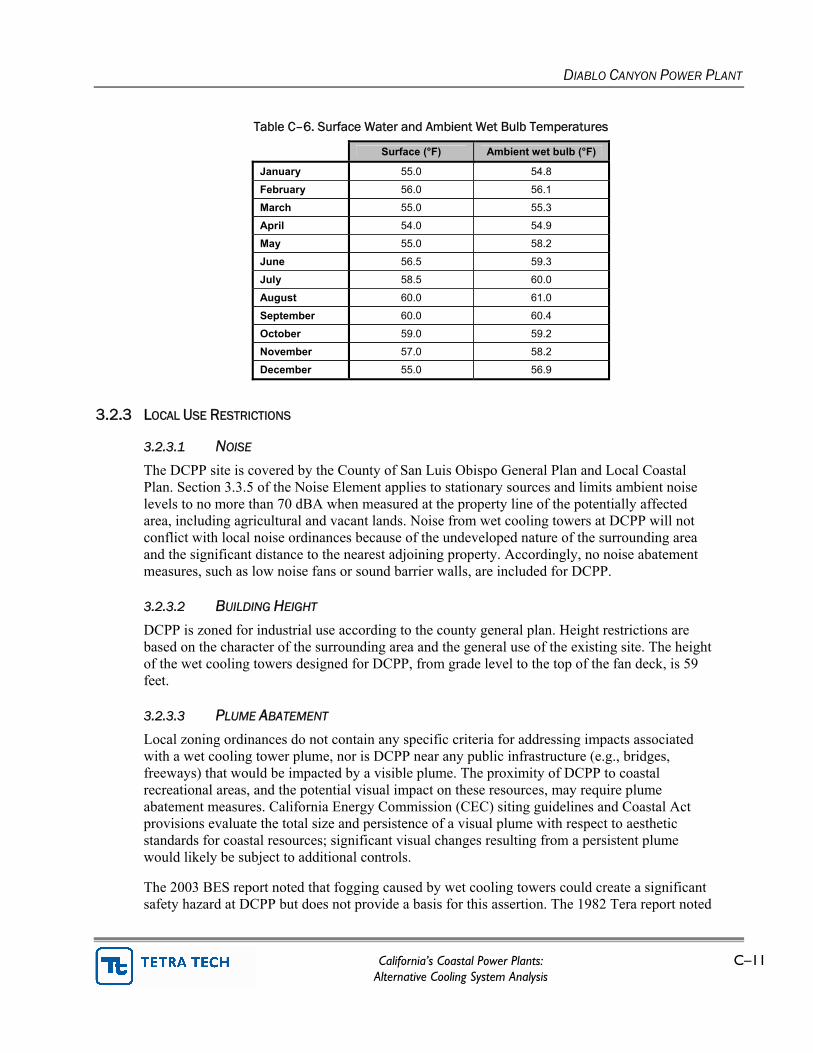
Monthly maximum wet bulb temperatures used in the development of energy penalty estimates in Section 4.6 were obtained from National Climatic Data Center (NCDC) climate normals for Avila Beach and Pismo Beach, California (NCDC 2006). Climate data used in this analysis are summarized in Table C–6.
DIABLO CANYON POWER PLANT
California’s Coastal Power Plants: C–11 Alternative Cooling System Analysis
Table C–6. Surface Water and Ambient Wet Bulb Temperatures
Surface (°F) Ambient wet bulb (°F)
January 55.0 54.8
February 56.0 56.1
March 55.0 55.3
April 54.0 54.9
May 55.0 58.2
June 56.5 59.3
July 58.5 60.0
August 60.0 61.0
September 60.0 60.4
October 59.0 59.2
November 57.0 58.2
December 55.0 56.9
3.2.3 LOCAL USE RESTRICTIONS
3.2.3.1 NOISE The DCPP site is covered by the County of San Luis Obispo General Plan and Local Coastal Plan. Section 3.3.5 of the Noise Element applies to stationary sources and limits ambient noise levels to no more than 70 dBA when measured at the property line of the potentially affected area, including agricultural and vacant lands. Noise from wet cooling towers at DCPP will not conflict with local noise ordinances because of the undeveloped nature of the surrounding area and the significant distance to the nearest adjoining property. Accordingly, no noise abatement measures, such as low noise fans or sound barrier walls, are included for DCPP.
3.2.3.2 BUILDING HEIGHT DCPP is zoned for industrial use according to the county general plan. Height restrictions are based on the character of the surrounding area and the general use of the existing site. The height of the wet cooling towers designed for DCPP, from grade level to the top of the fan deck, is 59 feet.
3.2.3.3 PLUME ABATEMENT Local zoning ordinances do not contain any specific criteria for addressing impacts associated with a wet cooling tower plume, nor is DCPP near any public infrastructure (e.g., bridges, freeways) that would be impacted by a visible plume. The proximity of DCPP to coastal recreational areas, and the potential visual impact on these resources, may require plume abatement measures. California Energy Commission (CEC) siting guidelines and Coastal Act provisions evaluate the total size and persistence of a visual plume with respect to aesthetic standards for coastal resources; significant visual changes resulting from a persistent plume would likely be subject to additional controls.
The 2003 BES report noted that fogging caused by wet cooling towers could create a significant safety hazard at DCPP but does not provide a basis for this assertion. The 1982 Tera report noted
DIABLO CANYON POWER PLANT
C–12 California’s Coastal Power Plants: Alternative Cooling System Analysis
that wet mechanical draft cooling towers at DCPP would increase fog incidence at the facility by 38 hours per year. An evaluation of 4 years of climate data for the area showed that the natural fog incidence averaged 318 hours per year. Wet cooling towers would be expected to increase natural fog incidence by 12 percent to 356 hours per year total. This translates to an annual fog incidence of 4 percent (Tera 1982).
Plume-abated towers are not included in the design for DCPP. If they are required for other reasons, plume-abated towers could not be sited at the existing facility because they would require an available area that is substantially greater than what is currently available at the site.
3.2.3.4 DRIFT AND PARTICULATE EMISSIONS Drift elimination measures that are considered best available control technology (BACT) are required for all cooling towers evaluated in this study, regardless of their location. State-of-the-art drift eliminators are included for each cooling tower cell at DCPP, with an accepted efficiency of 0.0005 percent. Because cooling tower PM10 emissions are a function of the rate of drift, drift eliminators are also considered BACT for PM10 emissions from wet cooling towers.
This efficiency can be verified by a proper in situ test, which accounts for site-specific climate, water, and operating conditions. Testing based on the Isokinetic Drift Test Code, published by the Cooling Tower Institute, is only required at initial start-up on one representative cell of each tower for an approximate cost of $120,000 (CTI 1994). This cost is not itemized in the final analysis and is instead included as part of the indirect cost estimate (Section 4.3).
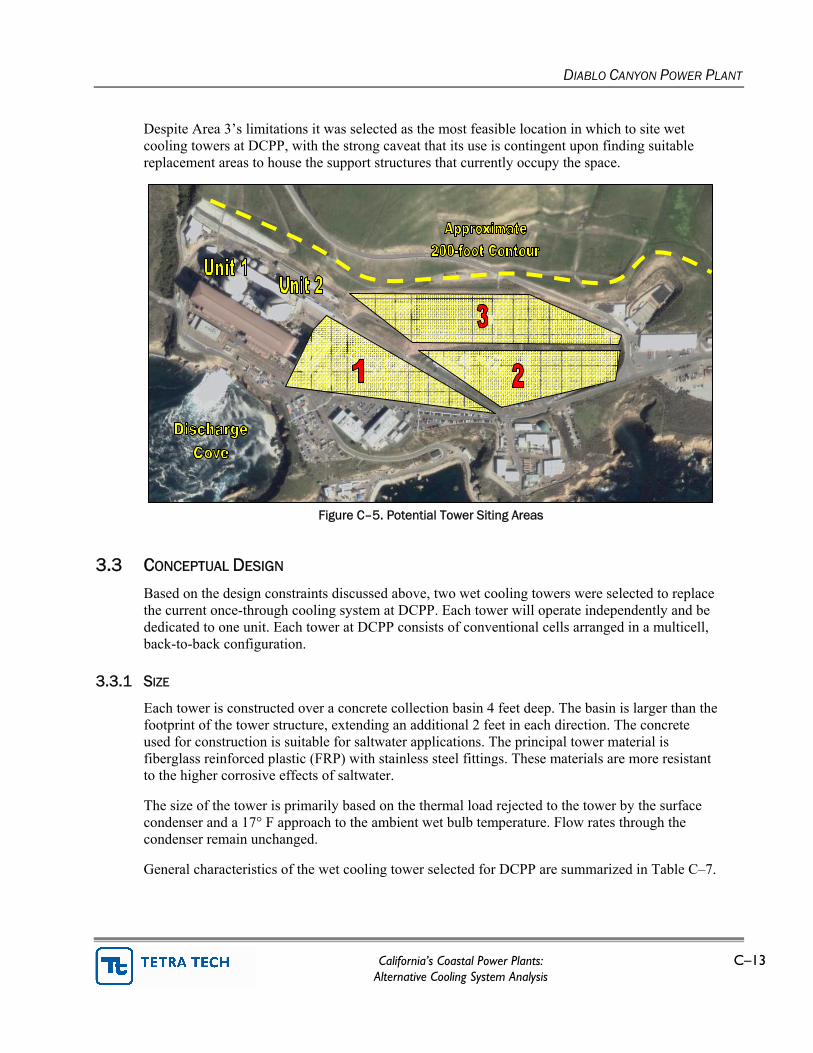
3.2.3.5 FACILITY CONFIGURATION AND AREA CONSTRAINTS The limited space available at DCPP, combined with the topography and existing uses of the site, creates significant challenges for identifying sufficient area to accommodate the large cooling towers that will be necessary to serve Units 1 and 2. Much of the main area below the 200-foot contour is currently occupied by the power blocks, various support structures, parking areas, and maintenance buildings. Placement of wet cooling towers at DCPP will require removal and/or relocation of some of these structures (Figure C–5).
Area 1 is occupied by the administration building, security offices, and cold machine shop. The cumulative size of this area (approximately 200,000 square feet) could accommodate the cooling tower for either Unit 1 or Unit 2, but not both. Use of this area would require relocating the administration building and would interfere with necessary access roads to and from the reactor buildings.
Area 2 is occupied by parking lots and temporary buildings. The irregular shape and total size (approximately 220,000 square feet) of this area does not allow for placement of the large back-to-back cooling towers that are required for DCPP without interfering with the main access road.
Area 3 is occupied by employee parking lots and the main warehouse, which is approximately 100,000 square feet. To install wet cooling towers in this area, suitable relocation spots for the main warehouse and parking areas must be identified. None are identified within the current boundaries of the PG&E property’s industrially-zoned section.
DIABLO CANYON POWER PLANT
California’s Coastal Power Plants: C–13 Alternative Cooling System Analysis
Despite Area 3’s limitations it was selected as the most feasible location in which to site wet cooling towers at DCPP, with the strong caveat that its use is contingent upon finding suitable replacement areas to house the support structures that currently occupy the space.
Figure C–5. Potential Tower Siting Areas
3.3 CONCEPTUAL DESIGN
Based on the design constraints discussed above, two wet cooling towers were selected to replace the current once-through cooling system at DCPP. Each tower will operate independently and be dedicated to one unit. Each tower at DCPP consists of conventional cells arranged in a multicell, back-to-back configuration.
3.3.1 SIZE
Each tower is constructed over a concrete collection basin 4 feet deep. The basin is larger than the footprint of the tower structure, extending an additional 2 feet in each direction. The concrete used for construction is suitable for saltwater applications. The principal tower material is fiberglass reinforced plastic (FRP) with stainless steel fittings. These materials are more resistant to the higher corrosive effects of saltwater.
The size of the tower is primarily based on the thermal load rejected to the tower by the surface condenser and a 17° F approach to the ambient wet bulb temperature. Flow rates through the condenser remain unchanged.
General characteristics of the wet cooling tower selected for DCPP are summarized in Table C–7.
DIABLO CANYON POWER PLANT
C–14 California’s Coastal Power Plants: Alternative Cooling System Analysis
Tower dimensions (l x w x h) (ft) 1404 x 108 x 59 1404 x 108 x 59
Tower footprint with basin (l x w) (ft) 1408 x 112 1408 x 112
3.3.2 LOCATION
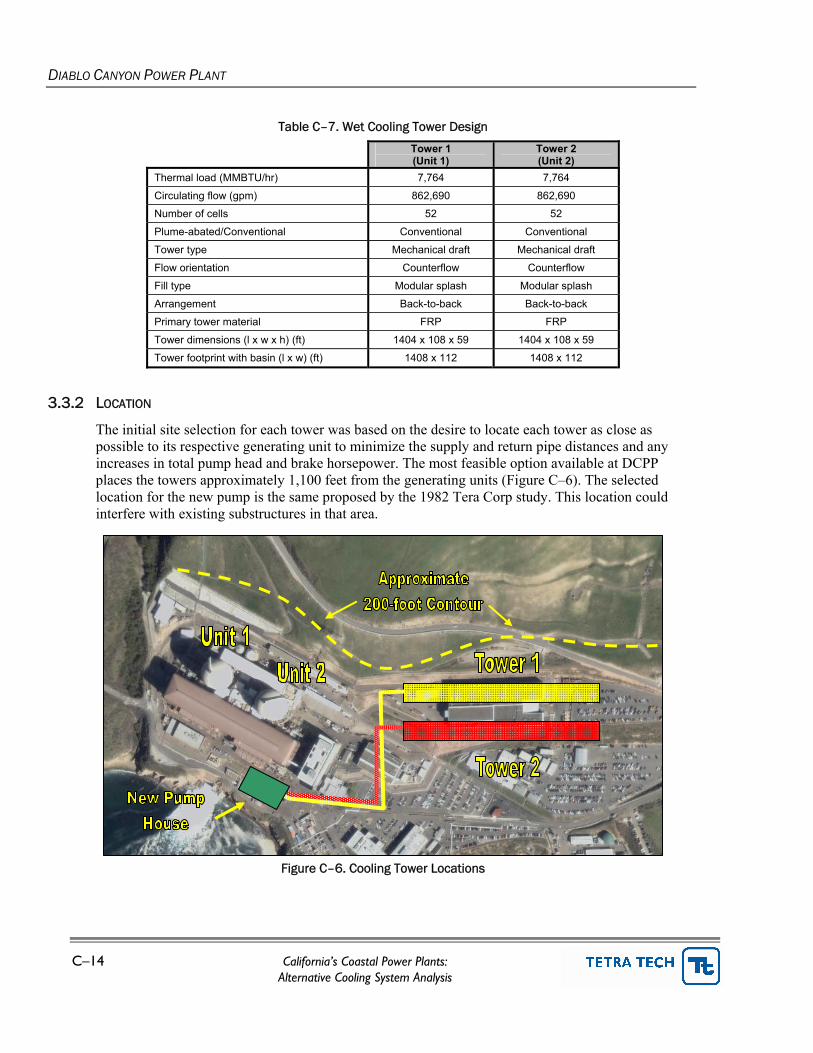
The initial site selection for each tower was based on the desire to locate each tower as close as possible to its respective generating unit to minimize the supply and return pipe distances and any increases in total pump head and brake horsepower. The most feasible option available at DCPP places the towers approximately 1,100 feet from the generating units (Figure C–6). The selected location for the new pump is the same proposed by the 1982 Tera Corp study. This location could interfere with existing substructures in that area.
Figure C–6. Cooling Tower Locations
DIABLO CANYON POWER PLANT
California’s Coastal Power Plants: C–15 Alternative Cooling System Analysis
3.3.3 PIPING
All supply and return pipes are made of prestressed concrete cylinder pipe (PCCP) suitable for saltwater applications. Main pipes are 144” in diameter.
All riser piping (extending from the foot of the tower to the level of water distribution) is constructed of FRP.
Potential interference with underground obstacles and infrastructure is a concern, particularly at existing sites that are several decades old and have been substantially modified or rebuilt in the interim. Avoidance of these obstacles is considered to the degree practical in this study. Associated costs are included in the contingency estimate and are generally higher than similar estimates for new facilities (Section 4.3).
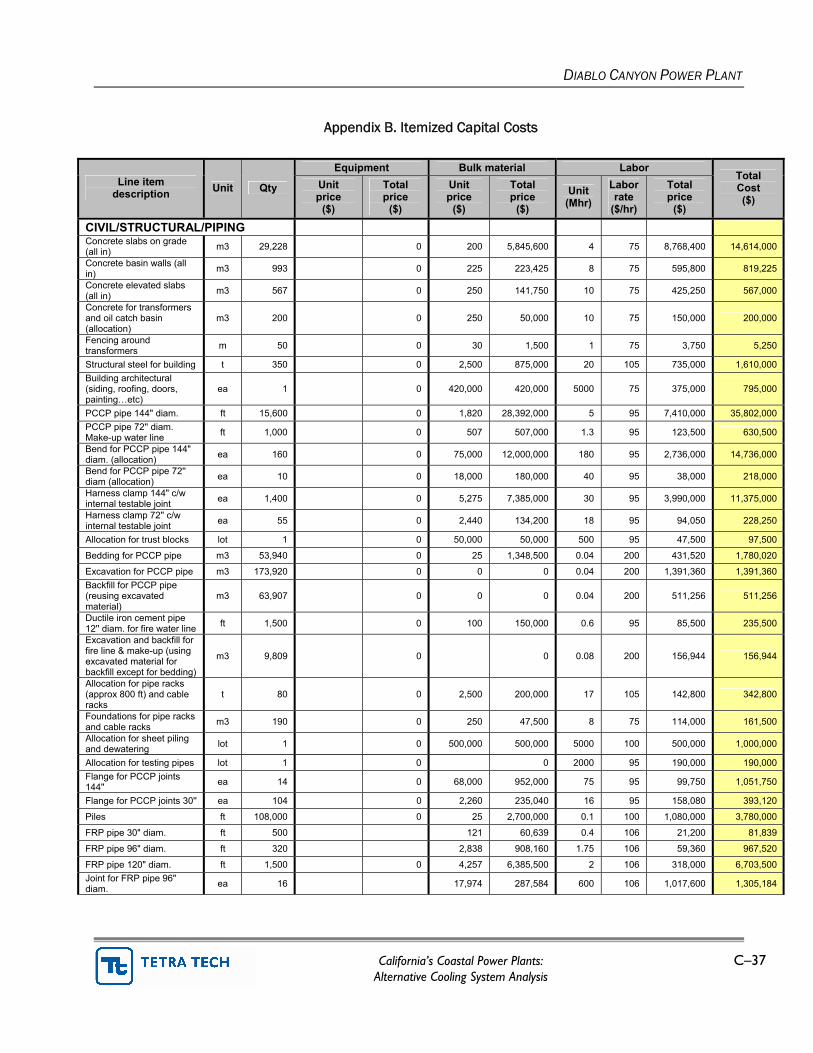
Appendix B details the total quantity of each pipe size and type for DCPP.
3.3.4 FANS AND PUMPS
Each tower cell uses an independent single-speed fan. The fan size and motor power are the same for each cell in both towers.
This analysis includes new pumps to circulate water between the condensers and cooling tower. Pumps are sized according to the flow rate for the tower, the relative distance between the tower and condenser, and the total head required to deliver water to the top of the cooling tower riser. A single multilevel pump house is constructed to serve both cooling towers and is sized to accommodate the motor control centers (MCCs) and appropriate electrical switchgear. The electrical installation includes all necessary transformers, cabling, cable trays, lighting, and lightning protection. A 50-ton overhead crane is also included to allow for pump servicing.
Water flows by gravity from the cooling tower basins to the pump house.
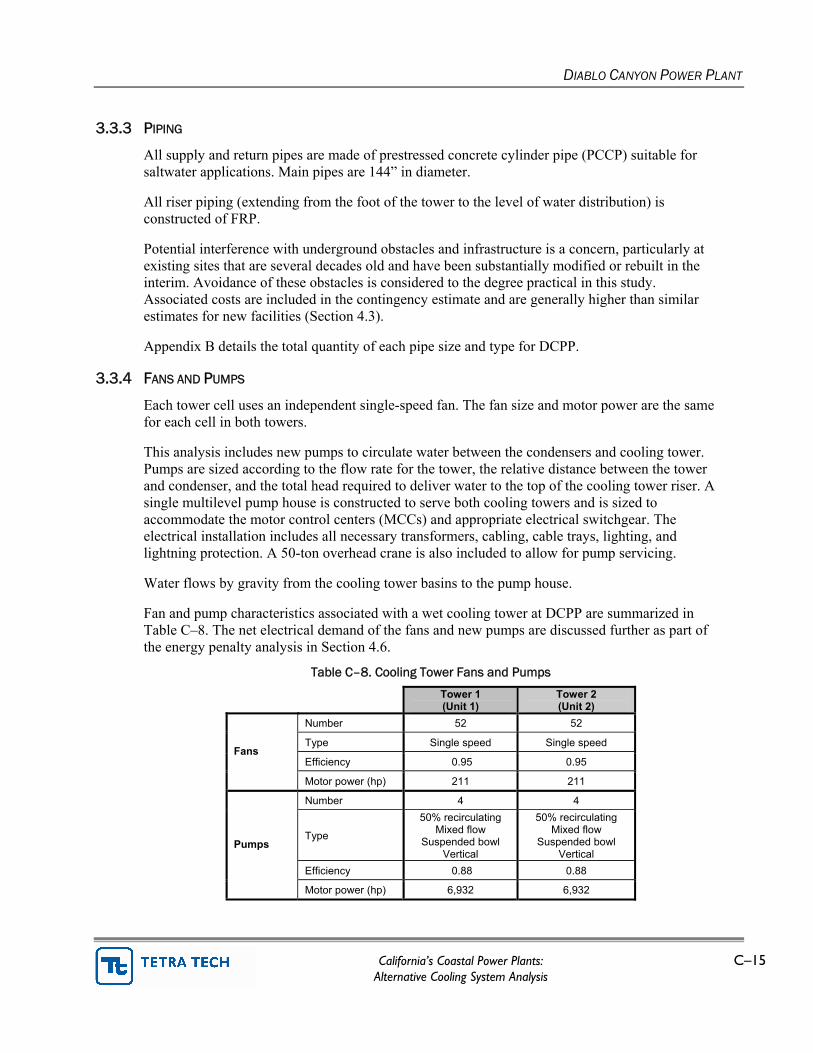
Fan and pump characteristics associated with a wet cooling tower at DCPP are summarized in Table C–8. The net electrical demand of the fans and new pumps are discussed further as part of the energy penalty analysis in Section 4.6.
Table C–8. Cooling Tower Fans and Pumps
Tower 1 (Unit 1)
Tower 2 (Unit 2)
Number 52 52
Type Single speed Single speed
Efficiency 0.95 0.95 Fans
Motor power (hp) 211 211
Number 4 4
Type
50% recirculating Mixed flow
Suspended bowl Vertical
50% recirculating Mixed flow
Suspended bowl Vertical
Efficiency 0.88 0.88
Pumps
Motor power (hp) 6,932 6,932
DIABLO CANYON POWER PLANT
C–16 California’s Coastal Power Plants: Alternative Cooling System Analysis
3.4 ENVIRONMENTAL EFFECTS
Converting the existing once-through cooling system at DCPP to wet cooling towers will significantly reduce the intake of seawater from the Pacific Ocean and will presumably reduce impingement and entrainment by a similar proportion. Because closed-cycle systems will almost always result in condenser cooling water temperatures higher than those found in a comparable once-through system, wet towers will increase the operating heat rates at Units 1 and 2, thereby decreasing the facility’s overall efficiency. Additional power will also be consumed by the tower fans and circulating pumps.
As a PWR facility, DCPP is generally limited in how it can respond to these changes. While fossil fuel facilities may be able to increase the amount of fuel consumed to compensate for any shortfall, the complexities of a nuclear-fueled steam-generating unit and the inherent safety precautions that govern its operation generally preclude DCPP from increasing the thermal input to the system. Thus, any compensation for the reduced output must be obtained from other facilities on the grid.
Depending on the fuel source and efficiency of the facility providing the additional electricity, emissions for pollutants such as PM10, SOx, and NOx may increase. The towers themselves will constitute a new source of PM10 emissions and require DCPP to obtain the necessary permits from the local AQMD/APCD. The annual mass of PM10 emissions will largely depend on the utilization capacity of the generating units the tower serves, but would likely approach their maximum values because DCPP is a baseload facility.
If DCPP retains its NPDES permit to discharge wastewater to the Pacific Ocean with a wet cooling tower system, it may have to address revised effluent limitations resulting from the substantial change in the quantity and characteristics of the discharge. Impacts from the discharge of elevated-temperature wastes associated with the current once-through system, if any, will be minimized by using a wet cooling system.
3.4.1 AIR EMISSIONS
Drift volumes from wet cooling towers are expected to be within the range of 0.5 gallons for every 100,000 gallons of circulating water in the towers. At DCPP, this corresponds to a rate of approximately 8.6 gpm based on the maximum combined flow in the two towers. The relative distances of the wet cooling towers from most facility structures (Figure C–6) do not appear to create any immediate concern over the effects of salt deposition on the switchyard or other sensitive equipment. Depending on the relocation of parking areas and other structures, drift is likely to be considered more of a nuisance rather than a threat to public health or safety, and will manifest itself as a whitish coating on exposed surfaces.
Total PM10 emissions from the DCPP cooling towers are a function of the number of hours in operation, overall water quality in the tower, and the evaporation rate of drift droplets prior to deposition on the ground. Makeup water at DCPP will be obtained from the same source currently used for once-through cooling water (Pacific Ocean). At 1.5 cycles of concentration and assuming an initial Total Dissolved Solids (TDS) value of 35 parts per thousand (ppt), the water within the cooling towers will reach a maximum TDS level of roughly 53 ppt. Any drift droplets exiting the tower will have the same TDS concentration.
DIABLO CANYON POWER PLANT
California’s Coastal Power Plants: C–17 Alternative Cooling System Analysis
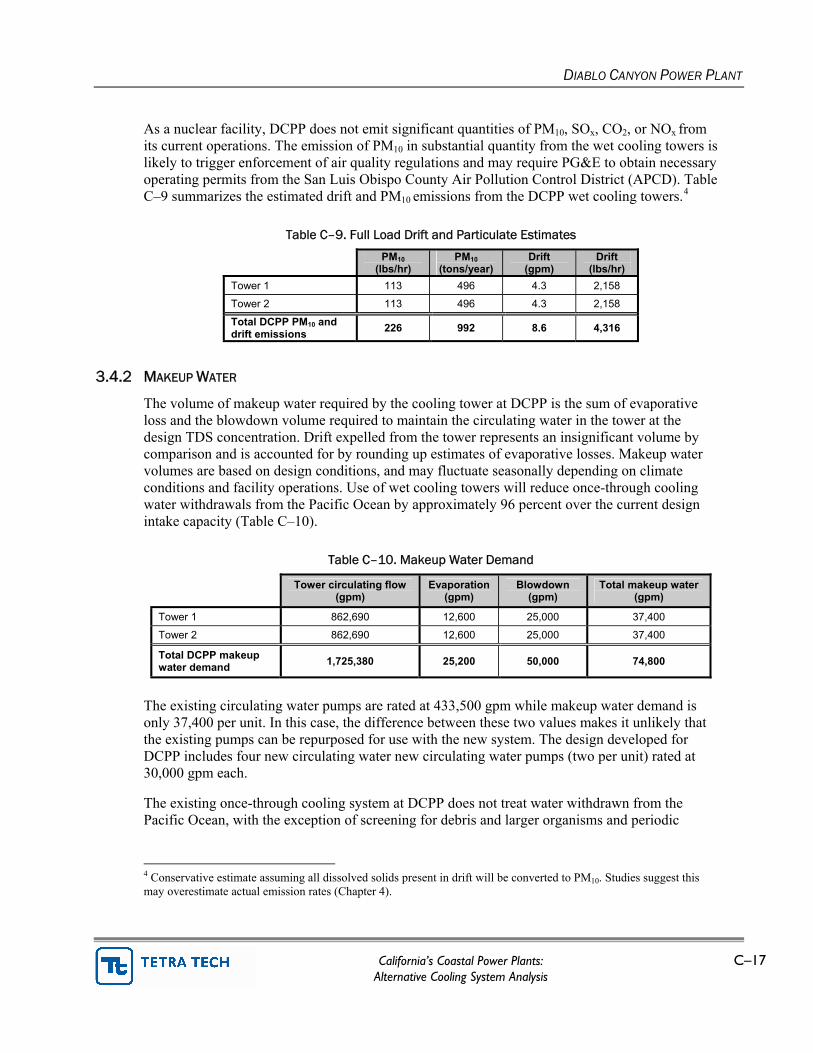
As a nuclear facility, DCPP does not emit significant quantities of PM10, SOx, CO2, or NOx from its current operations. The emission of PM10 in substantial quantity from the wet cooling towers is likely to trigger enforcement of air quality regulations and may require PG&E to obtain necessary operating permits from the San Luis Obispo County Air Pollution Control District (APCD). Table C–9 summarizes the estimated drift and PM10 emissions from the DCPP wet cooling towers.4
Table C–9. Full Load Drift and Particulate Estimates
PM10 (lbs/hr)
PM10 (tons/year)
Drift (gpm)
Drift (lbs/hr)
Tower 1 113 496 4.3 2,158
Tower 2 113 496 4.3 2,158
Total DCPP PM10 and drift emissions 226 992 8.6 4,316
3.4.2 MAKEUP WATER
The volume of makeup water required by the cooling tower at DCPP is the sum of evaporative loss and the blowdown volume required to maintain the circulating water in the tower at the design TDS concentration. Drift expelled from the tower represents an insignificant volume by comparison and is accounted for by rounding up estimates of evaporative losses. Makeup water volumes are based on design conditions, and may fluctuate seasonally depending on climate conditions and facility operations. Use of wet cooling towers will reduce once-through cooling water withdrawals from the Pacific Ocean by approximately 96 percent over the current design intake capacity (Table C–10).
Table C–10. Makeup Water Demand
Tower circulating flow (gpm)
Evaporation (gpm)
Blowdown (gpm)
Total makeup water (gpm)
Tower 1 862,690 12,600 25,000 37,400
Tower 2 862,690 12,600 25,000 37,400
Total DCPP makeup water demand 1,725,380 25,200 50,000 74,800
The existing circulating water pumps are rated at 433,500 gpm while makeup water demand is only 37,400 per unit. In this case, the difference between these two values makes it unlikely that the existing pumps can be repurposed for use with the new system. The design developed for DCPP includes four new circulating water new circulating water pumps (two per unit) rated at 30,000 gpm each.
The existing once-through cooling system at DCPP does not treat water withdrawn from the Pacific Ocean, with the exception of screening for debris and larger organisms and periodic
4 Conservative estimate assuming all dissolved solids present in drift will be converted to PM10. Studies suggest this may overestimate actual emission rates (Chapter 4).
DIABLO CANYON POWER PLANT
C–18 California’s Coastal Power Plants: Alternative Cooling System Analysis
chlorination to control biofouling in the condenser tubes. Conversion to a wet cooling tower system will not interfere with chlorination operations.
Makeup water will continue to be withdrawn from the Pacific Ocean.
The wet cooling tower system proposed for DCPP includes water treatment for standard operational measures, i.e., fouling and corrosion control. Chemical treatment allowances are included in annual O&M costs. It is assumed that the current once-through cooling water quality will be acceptable for use in a seawater cooling tower (with continued screening and chlorination) and will not require any pretreatment to enable its use.
3.4.3 NPDES PERMIT COMPLIANCE
At maximum operation, wet cooling towers at DCPP will result in an effluent discharge of approximately 72 mgd of blowdown in addition to other in-plant waste streams, such as regeneration wastes, boiler blowdown, and treated sanitary wastes. These low-volume wastes may add an additional 20 mgd to the total discharge flow from the facility. Unless an alternative discharge is considered, DCPP will be required to modify its existing individual wastewater discharge (NPDES) permit.
Current effluent limitations for conventional and priority pollutants, as well as thermal discharge limitations, are contained in NPDES permit CA0003751 as implemented by CCRWQCB Order 90-09.5
DCPP will be required to meet technology-based effluent limitations for cooling tower blowdown established under the Effluent Limitation Guidelines (ELGs) for Steam Electric Facilities (40 CFR 423.13(d)(1)). These ELGs set numeric limitations for chromium and zinc (0.2 mg/L and 1.0 mg/L, respectively) while establishing narrative criteria for priority pollutants (no detectable quantity). Because ELGs are technology-based limitations, mixing zones or dilution factors are not applicable when determining compliance; limits must be met at the point of discharge from the cooling tower prior to commingling with any other waste stream. ELGs for cooling tower blowdown target priority pollutants that are contributed by maintenance chemicals and do not apply when limits may be exceeded as a result of background concentrations or other sources. Further discussion can be found in Chapter 4, Section 3.6.
Conversion to wet cooling towers will alter the volume and composition of a facility’s wastewater discharge because wet towers concentrate certain pollutants in the effluent waste stream. The cooling towers designed for DCPP operate at 1.5 cycles of concentration, i.e., the blowdown discharge will contain a dissolved solids concentration 50 percent higher than the makeup water.
Changes to discharge composition may affect compliance with water quality objectives included in the Ocean Plan. If compliance with these objectives becomes problematic, alternative treatment or discharge methods may be necessary. Compliance may be achieved by altering the discharge configuration in such a way as to increase dilution (e.g., diffuser ports), or by seeking a mixing zone and dilution credits as permissible under the Ocean Plan. Alternately, some low volume
5 Order 90-09 has been administratively continued pending adoption of a new order.
DIABLO CANYON POWER PLANT
California’s Coastal Power Plants: C–19 Alternative Cooling System Analysis
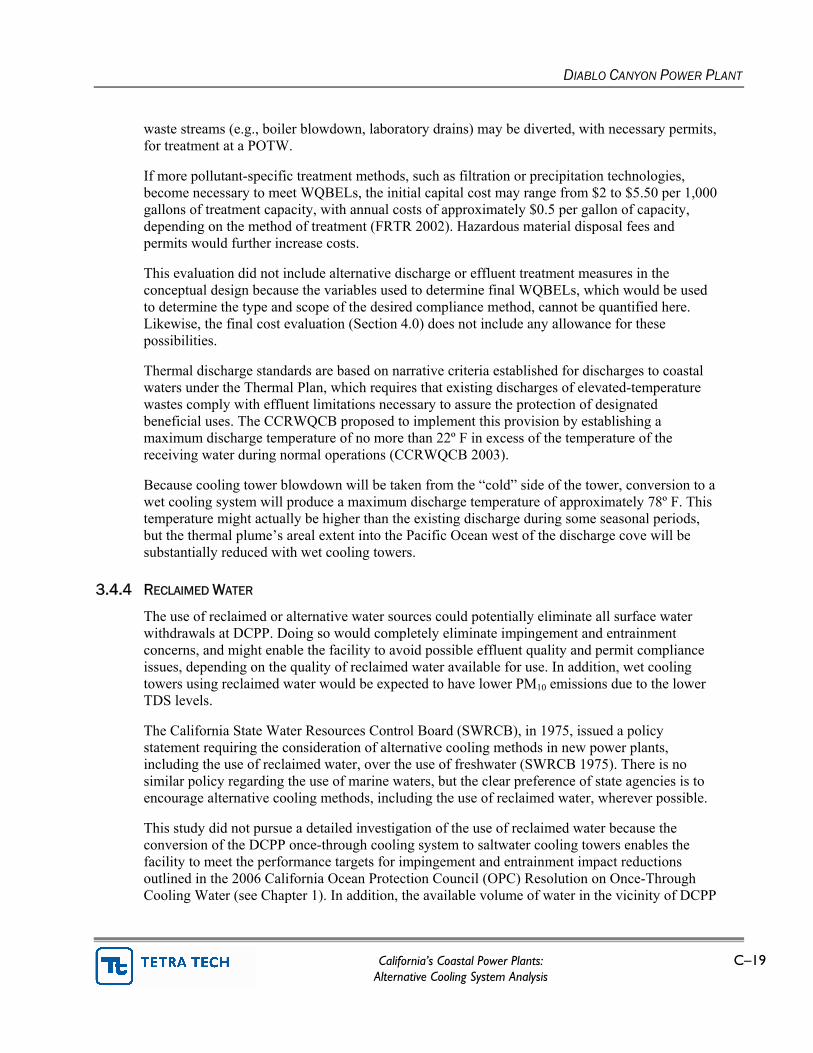
waste streams (e.g., boiler blowdown, laboratory drains) may be diverted, with necessary permits, for treatment at a POTW.
If more pollutant-specific treatment methods, such as filtration or precipitation technologies, become necessary to meet WQBELs, the initial capital cost may range from $2 to $5.50 per 1,000 gallons of treatment capacity, with annual costs of approximately $0.5 per gallon of capacity, depending on the method of treatment (FRTR 2002). Hazardous material disposal fees and permits would further increase costs.
This evaluation did not include alternative discharge or effluent treatment measures in the conceptual design because the variables used to determine final WQBELs, which would be used to determine the type and scope of the desired compliance method, cannot be quantified here. Likewise, the final cost evaluation (Section 4.0) does not include any allowance for these possibilities.
Thermal discharge standards are based on narrative criteria established for discharges to coastal waters under the Thermal Plan, which requires that existing discharges of elevated-temperature wastes comply with effluent limitations necessary to assure the protection of designated beneficial uses. The CCRWQCB proposed to implement this provision by establishing a maximum discharge temperature of no more than 22º F in excess of the temperature of the receiving water during normal operations (CCRWQCB 2003).
Because cooling tower blowdown will be taken from the “cold” side of the tower, conversion to a wet cooling system will produce a maximum discharge temperature of approximately 78º F. This temperature might actually be higher than the existing discharge during some seasonal periods, but the thermal plume’s areal extent into the Pacific Ocean west of the discharge cove will be substantially reduced with wet cooling towers.
3.4.4 RECLAIMED WATER
The use of reclaimed or alternative water sources could potentially eliminate all surface water withdrawals at DCPP. Doing so would completely eliminate impingement and entrainment concerns, and might enable the facility to avoid possible effluent quality and permit compliance issues, depending on the quality of reclaimed water available for use. In addition, wet cooling towers using reclaimed water would be expected to have lower PM10 emissions due to the lower TDS levels.
The California State Water Resources Control Board (SWRCB), in 1975, issued a policy statement requiring the consideration of alternative cooling methods in new power plants, including the use of reclaimed water, over the use of freshwater (SWRCB 1975). There is no similar policy regarding the use of marine waters, but the clear preference of state agencies is to encourage alternative cooling methods, including the use of reclaimed water, wherever possible.
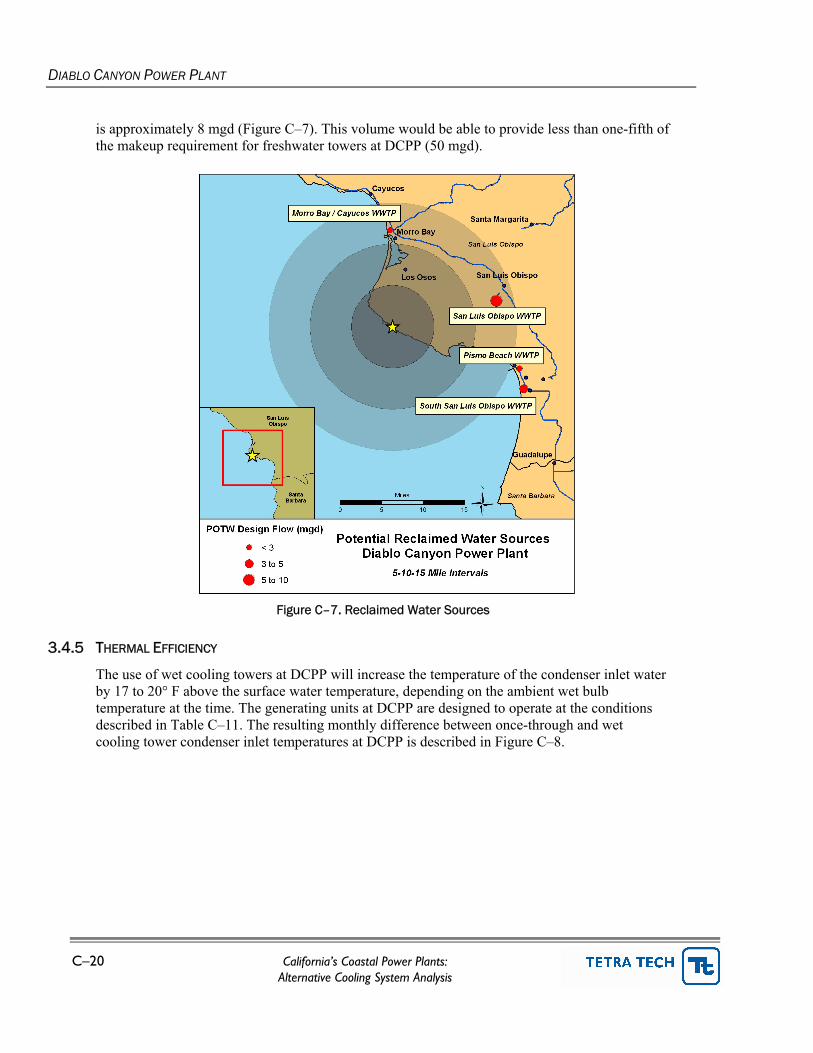
This study did not pursue a detailed investigation of the use of reclaimed water because the conversion of the DCPP once-through cooling system to saltwater cooling towers enables the facility to meet the performance targets for impingement and entrainment impact reductions outlined in the 2006 California Ocean Protection Council (OPC) Resolution on Once-Through Cooling Water (see Chapter 1). In addition, the available volume of water in the vicinity of DCPP
DIABLO CANYON POWER PLANT
C–20 California’s Coastal Power Plants: Alternative Cooling System Analysis
is approximately 8 mgd (Figure C–7). This volume would be able to provide less than one-fifth of the makeup requirement for freshwater towers at DCPP (50 mgd).
Figure C–7. Reclaimed Water Sources
3.4.5 THERMAL EFFICIENCY
The use of wet cooling towers at DCPP will increase the temperature of the condenser inlet water by 17 to 20° F above the surface water temperature, depending on the ambient wet bulb temperature at the time. The generating units at DCPP are designed to operate at the conditions described in Table C–11. The resulting monthly difference between once-through and wet cooling tower condenser inlet temperatures at DCPP is described in Figure C–8.
DIABLO CANYON POWER PLANT
California’s Coastal Power Plants: C–21 Alternative Cooling System Analysis
Table C–11. Design Thermal Conditions
Unit 1 Unit 2
Design backpressure (in. HgA) 1.5 1.5
Design water temperature (°F) 60 60
Turbine inlet temp (°F) [a] 520 520
Turbine inlet pressure (psia) [a] 800 800
Full load heat rate (BTU/kWh) 10,000 10,000 [a] CEC 2006b.
50
55
60
65
70
75
80
85
January
Februa
ryMarc
hApril
May June July
August
Septem
ber
October
November
December
Degr
ees
F
Once-through Wet Cooling Tower
Figure C–8. Condenser Inlet Temperatures
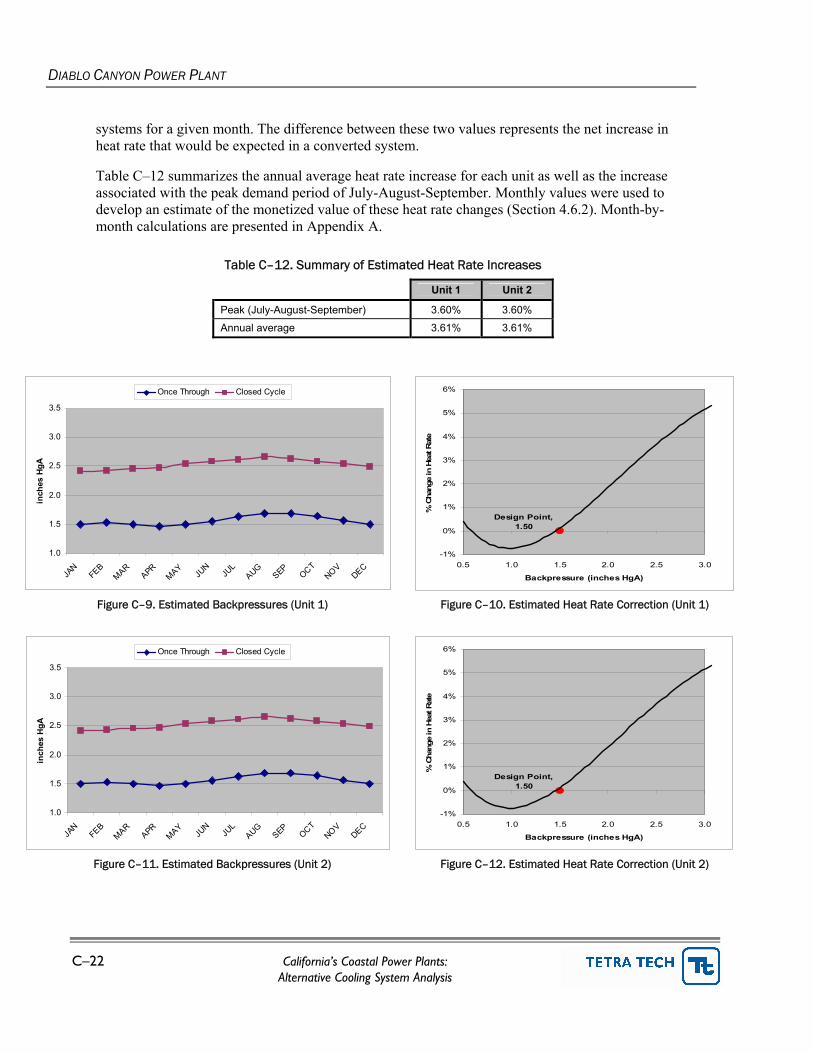
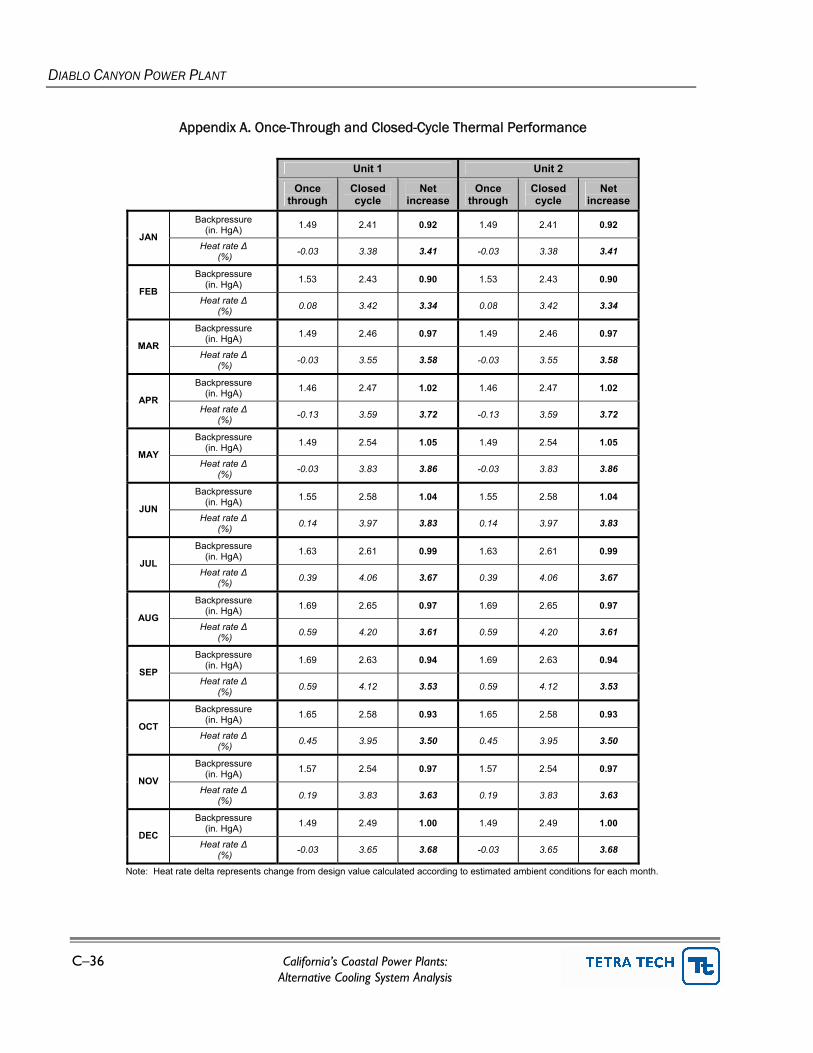
Backpressures for the once-through and wet cooling tower configurations were calculated using the design criteria described in the sections above on a monthly basis using ambient climate data. In general, backpressures associated with the wet cooling tower were elevated by 0.90 to 1.05 inches HgA compared with the current once-through system (Figure C–9 and Figure C–11).
Heat rate adjustments were calculated by comparing the theoretical change in available energy that occurs at different turbine exhaust backpressures, assuming the thermal load and turbine inlet pressure remain constant, i.e., at the maximum load rating.6 The relative change at different backpressures was compared with the value calculated for the design conditions (i.e., at design turbine inlet and exhaust backpressures) and plotted as a percentage of the maximum operating heat rate (Table C–11) to develop estimated correction curves (Figure C–10 and Figure C–12). A comparison was then made between the relative heat rates of the once-through and wet cooling
6 Changes in thermal efficiency estimated for DCPP are based on the design specifications provided by the facility or obtained from other studies. This may not reflect system modifications that influence actual performance. In addition, the operating protocols used by DCPP or other restrictions may result in different conclusions.
DIABLO CANYON POWER PLANT
C–22 California’s Coastal Power Plants: Alternative Cooling System Analysis
systems for a given month. The difference between these two values represents the net increase in heat rate that would be expected in a converted system.
Table C–12 summarizes the annual average heat rate increase for each unit as well as the increase associated with the peak demand period of July-August-September. Monthly values were used to develop an estimate of the monetized value of these heat rate changes (Section 4.6.2). Month-by-month calculations are presented in Appendix A.
Table C–12. Summary of Estimated Heat Rate Increases
California’s Coastal Power Plants: C–23 Alternative Cooling System Analysis
4.0 RETROFIT COST ANALYSIS The wet cooling system retrofit estimate for DCPP is based on incorporating conventional wet cooling towers as a replacement for the existing once-through system. Standard cost elements for this project include the following:
• Direct (cooling tower installation, civil/structural, mechanical, piping, electrical, and demolition)
• Indirect (smaller project costs not itemized)
• Contingency (allowance for unknown project variables)
• Operations and maintenance (non–energy related cooling tower operations)
• Energy penalty (includes increased parasitic use from fans and pumps as well as decreased thermal efficiency)
• Revenue loss from shutdown (net loss in revenue during construction phase)
The methodology used to develop cost estimates is discussed in Chapter 5.
4.1 COOLING TOWER INSTALLATION
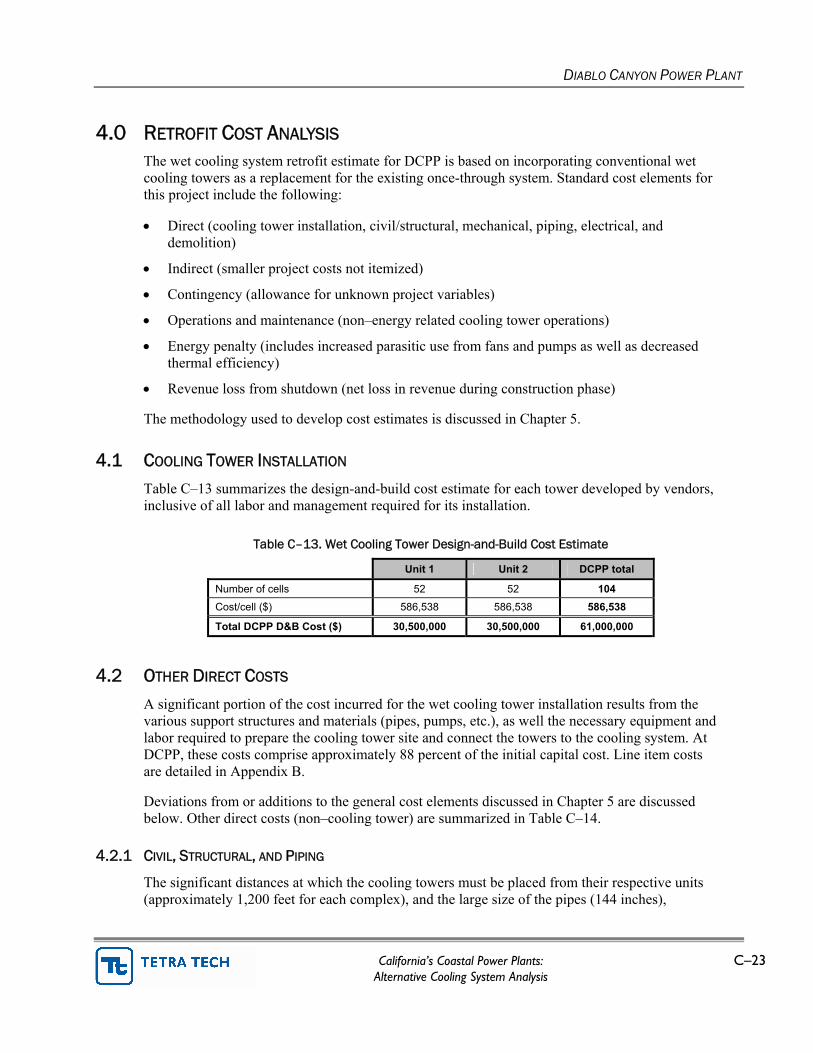
Table C–13 summarizes the design-and-build cost estimate for each tower developed by vendors, inclusive of all labor and management required for its installation.
Number of cells 52 52 104 Cost/cell ($) 586,538 586,538 586,538
Total DCPP D&B Cost ($) 30,500,000 30,500,000 61,000,000
4.2 OTHER DIRECT COSTS
A significant portion of the cost incurred for the wet cooling tower installation results from the various support structures and materials (pipes, pumps, etc.), as well the necessary equipment and labor required to prepare the cooling tower site and connect the towers to the cooling system. At DCPP, these costs comprise approximately 88 percent of the initial capital cost. Line item costs are detailed in Appendix B.
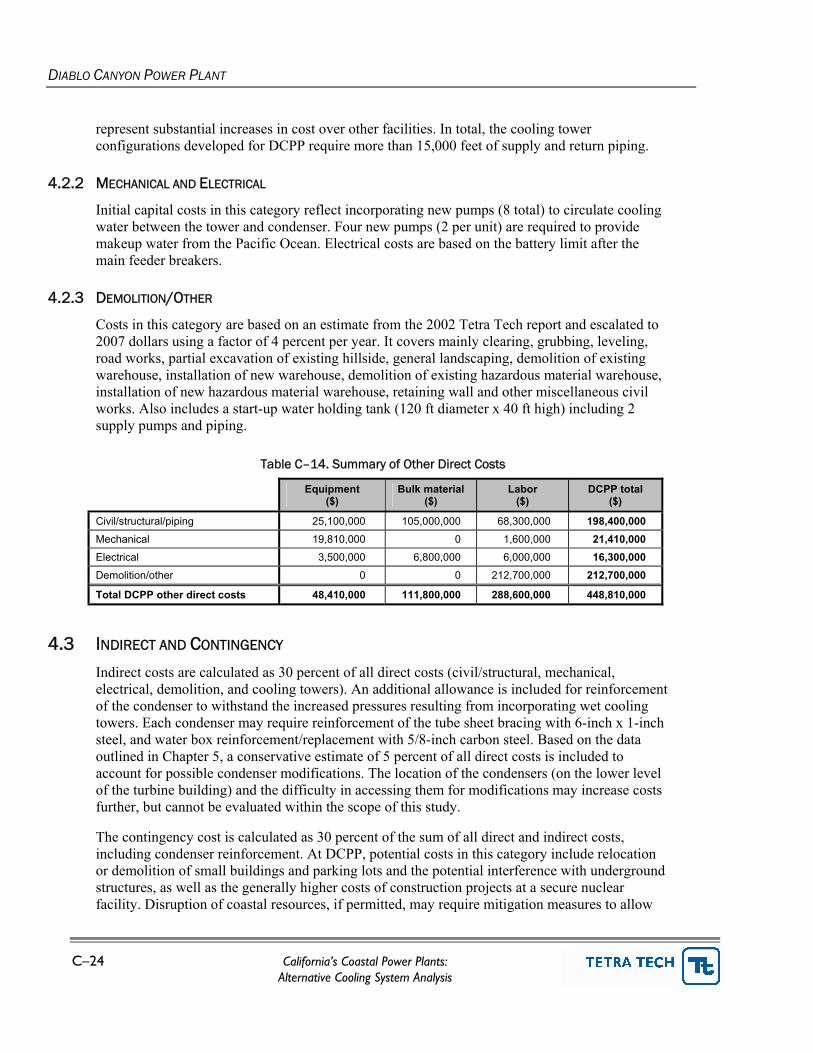
Deviations from or additions to the general cost elements discussed in Chapter 5 are discussed below. Other direct costs (non–cooling tower) are summarized in Table C–14.
4.2.1 CIVIL, STRUCTURAL, AND PIPING
The significant distances at which the cooling towers must be placed from their respective units (approximately 1,200 feet for each complex), and the large size of the pipes (144 inches),
DIABLO CANYON POWER PLANT
C–24 California’s Coastal Power Plants: Alternative Cooling System Analysis
represent substantial increases in cost over other facilities. In total, the cooling tower configurations developed for DCPP require more than 15,000 feet of supply and return piping.
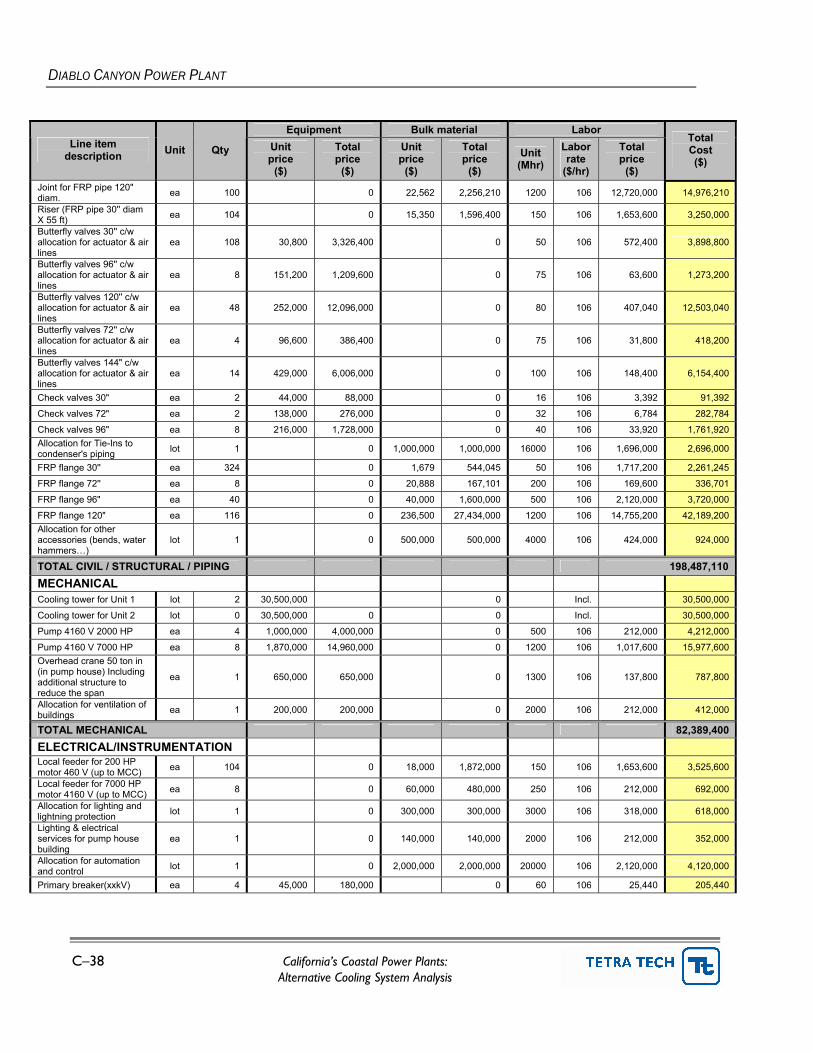
4.2.2 MECHANICAL AND ELECTRICAL
Initial capital costs in this category reflect incorporating new pumps (8 total) to circulate cooling water between the tower and condenser. Four new pumps (2 per unit) are required to provide makeup water from the Pacific Ocean. Electrical costs are based on the battery limit after the main feeder breakers.
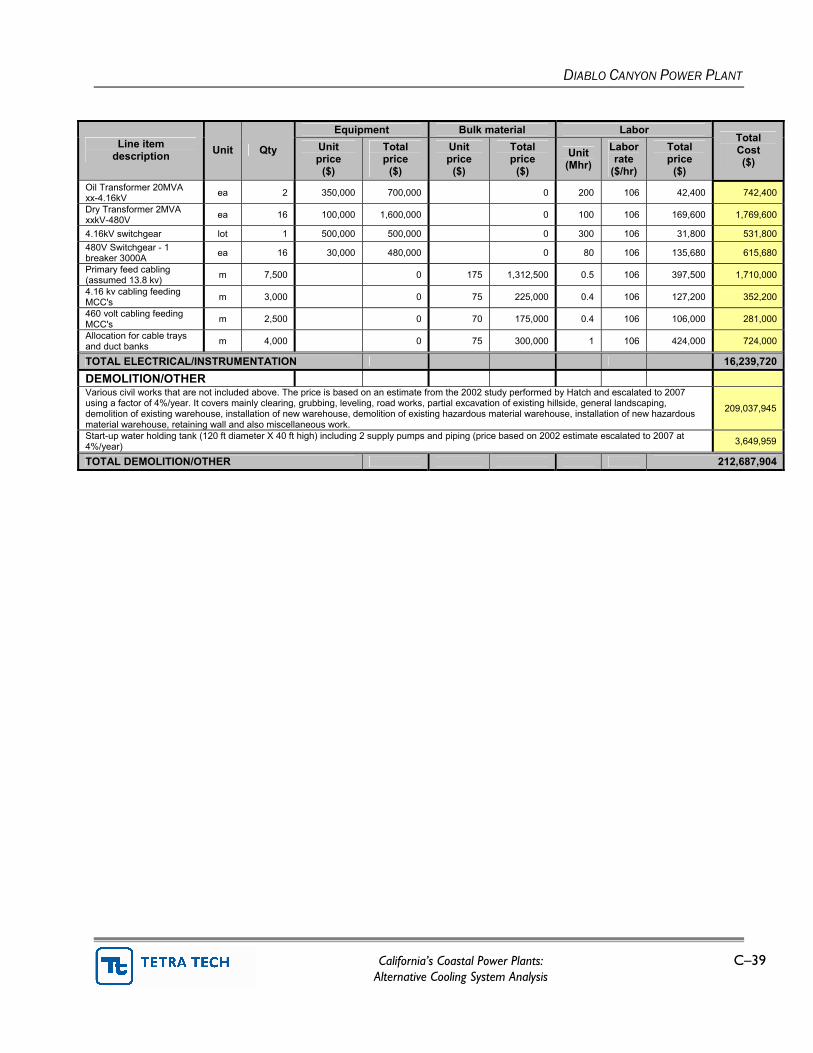
4.2.3 DEMOLITION/OTHER
Costs in this category are based on an estimate from the 2002 Tetra Tech report and escalated to 2007 dollars using a factor of 4 percent per year. It covers mainly clearing, grubbing, leveling, road works, partial excavation of existing hillside, general landscaping, demolition of existing warehouse, installation of new warehouse, demolition of existing hazardous material warehouse, installation of new hazardous material warehouse, retaining wall and other miscellaneous civil works. Also includes a start-up water holding tank (120 ft diameter x 40 ft high) including 2 supply pumps and piping.
Total DCPP other direct costs 48,410,000 111,800,000 288,600,000 448,810,000
4.3 INDIRECT AND CONTINGENCY
Indirect costs are calculated as 30 percent of all direct costs (civil/structural, mechanical, electrical, demolition, and cooling towers). An additional allowance is included for reinforcement of the condenser to withstand the increased pressures resulting from incorporating wet cooling towers. Each condenser may require reinforcement of the tube sheet bracing with 6-inch x 1-inch steel, and water box reinforcement/replacement with 5/8-inch carbon steel. Based on the data outlined in Chapter 5, a conservative estimate of 5 percent of all direct costs is included to account for possible condenser modifications. The location of the condensers (on the lower level of the turbine building) and the difficulty in accessing them for modifications may increase costs further, but cannot be evaluated within the scope of this study.
The contingency cost is calculated as 30 percent of the sum of all direct and indirect costs, including condenser reinforcement. At DCPP, potential costs in this category include relocation or demolition of small buildings and parking lots and the potential interference with underground structures, as well as the generally higher costs of construction projects at a secure nuclear facility. Disruption of coastal resources, if permitted, may require mitigation measures to allow
DIABLO CANYON POWER PLANT
California’s Coastal Power Plants: C–25 Alternative Cooling System Analysis
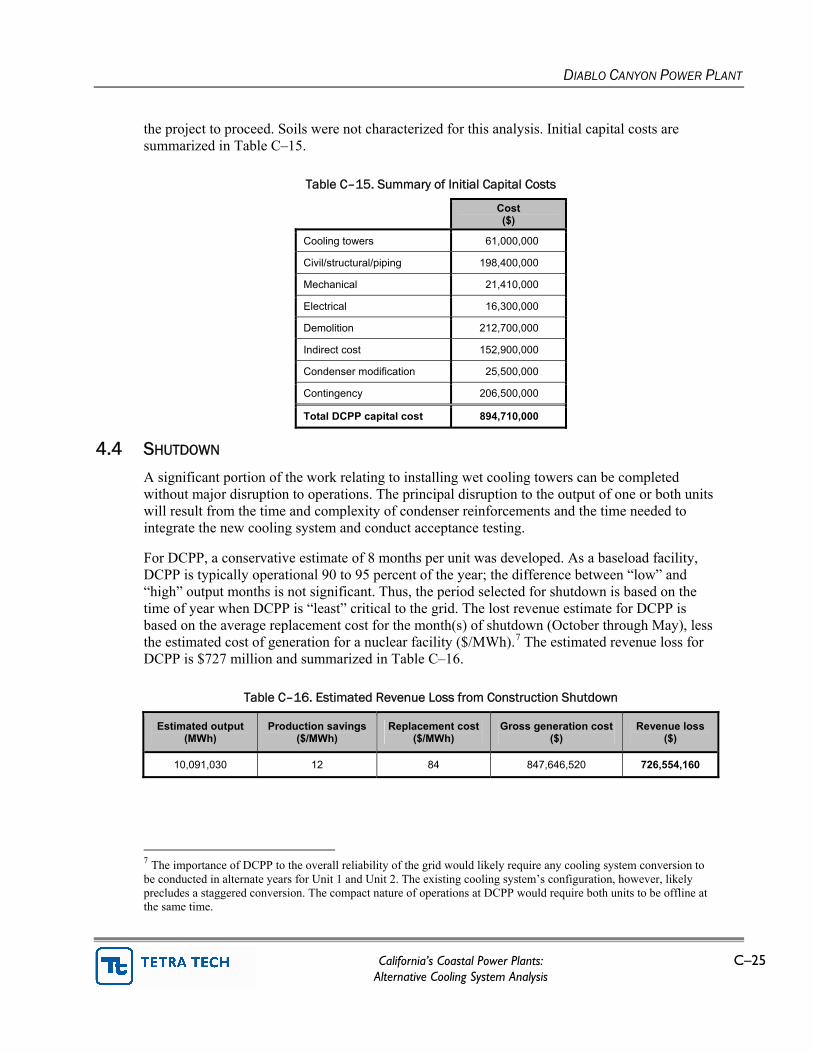
the project to proceed. Soils were not characterized for this analysis. Initial capital costs are summarized in Table C–15.
Table C–15. Summary of Initial Capital Costs
Cost ($)
Cooling towers 61,000,000
Civil/structural/piping 198,400,000
Mechanical 21,410,000
Electrical 16,300,000
Demolition 212,700,000
Indirect cost 152,900,000
Condenser modification 25,500,000
Contingency 206,500,000
Total DCPP capital cost 894,710,000
4.4 SHUTDOWN
A significant portion of the work relating to installing wet cooling towers can be completed without major disruption to operations. The principal disruption to the output of one or both units will result from the time and complexity of condenser reinforcements and the time needed to integrate the new cooling system and conduct acceptance testing.
For DCPP, a conservative estimate of 8 months per unit was developed. As a baseload facility, DCPP is typically operational 90 to 95 percent of the year; the difference between “low” and “high” output months is not significant. Thus, the period selected for shutdown is based on the time of year when DCPP is “least” critical to the grid. The lost revenue estimate for DCPP is based on the average replacement cost for the month(s) of shutdown (October through May), less the estimated cost of generation for a nuclear facility ($/MWh).7 The estimated revenue loss for DCPP is $727 million and summarized in Table C–16.
Table C–16. Estimated Revenue Loss from Construction Shutdown
Estimated output (MWh)
Production savings ($/MWh)
Replacement cost ($/MWh)
Gross generation cost ($)
Revenue loss ($)
10,091,030 12 84 847,646,520 726,554,160
7 The importance of DCPP to the overall reliability of the grid would likely require any cooling system conversion to be conducted in alternate years for Unit 1 and Unit 2. The existing cooling system’s configuration, however, likely precludes a staggered conversion. The compact nature of operations at DCPP would require both units to be offline at the same time.
DIABLO CANYON POWER PLANT
C–26 California’s Coastal Power Plants: Alternative Cooling System Analysis
This analysis did not consider shutdown with respect to the required availability of a particular generating unit, nor can it automatically be assumed that the generating profile for 2006 will be the same in each subsequent year. Net output data from 2006 may not reflect any contractual obligations that mandate a particular unit’s availability during a given time period.
4.5 OPERATIONS AND MAINTENANCE
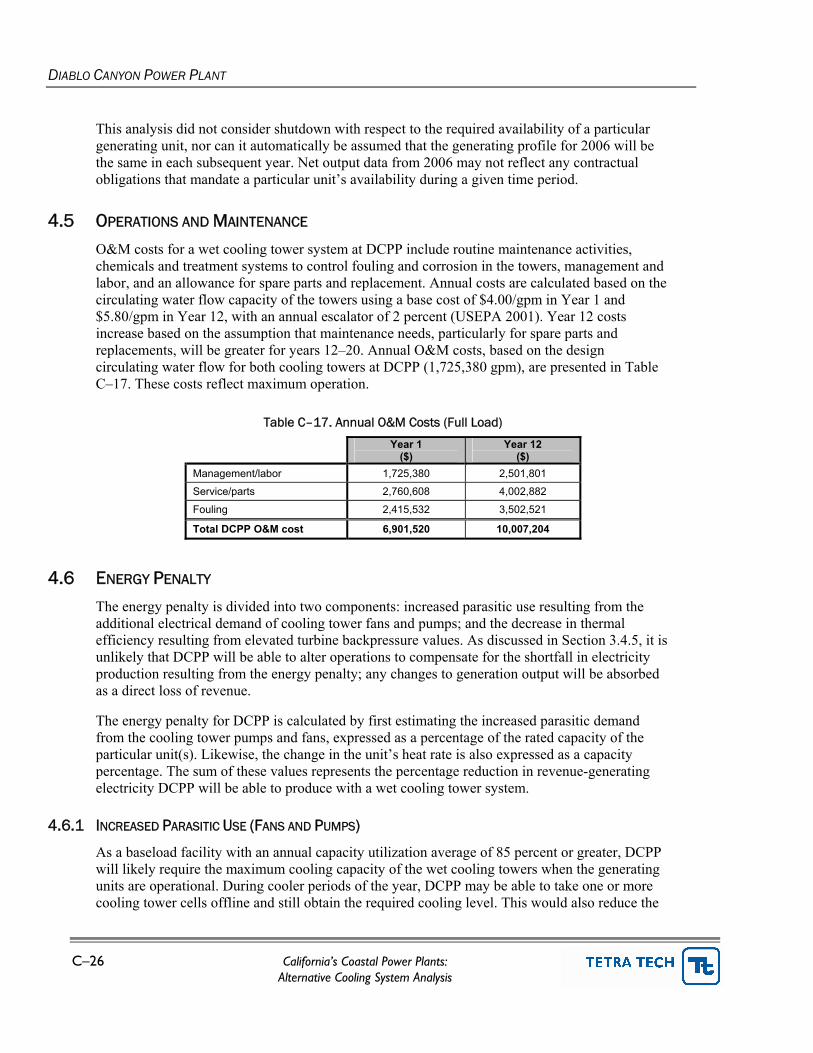
O&M costs for a wet cooling tower system at DCPP include routine maintenance activities, chemicals and treatment systems to control fouling and corrosion in the towers, management and labor, and an allowance for spare parts and replacement. Annual costs are calculated based on the circulating water flow capacity of the towers using a base cost of $4.00/gpm in Year 1 and $5.80/gpm in Year 12, with an annual escalator of 2 percent (USEPA 2001). Year 12 costs increase based on the assumption that maintenance needs, particularly for spare parts and replacements, will be greater for years 12–20. Annual O&M costs, based on the design circulating water flow for both cooling towers at DCPP (1,725,380 gpm), are presented in Table C–17. These costs reflect maximum operation.
Table C–17. Annual O&M Costs (Full Load)
Year 1 ($)
Year 12 ($)
Management/labor 1,725,380 2,501,801
Service/parts 2,760,608 4,002,882
Fouling 2,415,532 3,502,521
Total DCPP O&M cost 6,901,520 10,007,204
4.6 ENERGY PENALTY
The energy penalty is divided into two components: increased parasitic use resulting from the additional electrical demand of cooling tower fans and pumps; and the decrease in thermal efficiency resulting from elevated turbine backpressure values. As discussed in Section 3.4.5, it is unlikely that DCPP will be able to alter operations to compensate for the shortfall in electricity production resulting from the energy penalty; any changes to generation output will be absorbed as a direct loss of revenue.
The energy penalty for DCPP is calculated by first estimating the increased parasitic demand from the cooling tower pumps and fans, expressed as a percentage of the rated capacity of the particular unit(s). Likewise, the change in the unit’s heat rate is also expressed as a capacity percentage. The sum of these values represents the percentage reduction in revenue-generating electricity DCPP will be able to produce with a wet cooling tower system.
4.6.1 INCREASED PARASITIC USE (FANS AND PUMPS)
As a baseload facility with an annual capacity utilization average of 85 percent or greater, DCPP will likely require the maximum cooling capacity of the wet cooling towers when the generating units are operational. During cooler periods of the year, DCPP may be able to take one or more cooling tower cells offline and still obtain the required cooling level. This would also reduce the
DIABLO CANYON POWER PLANT
California’s Coastal Power Plants: C–27 Alternative Cooling System Analysis
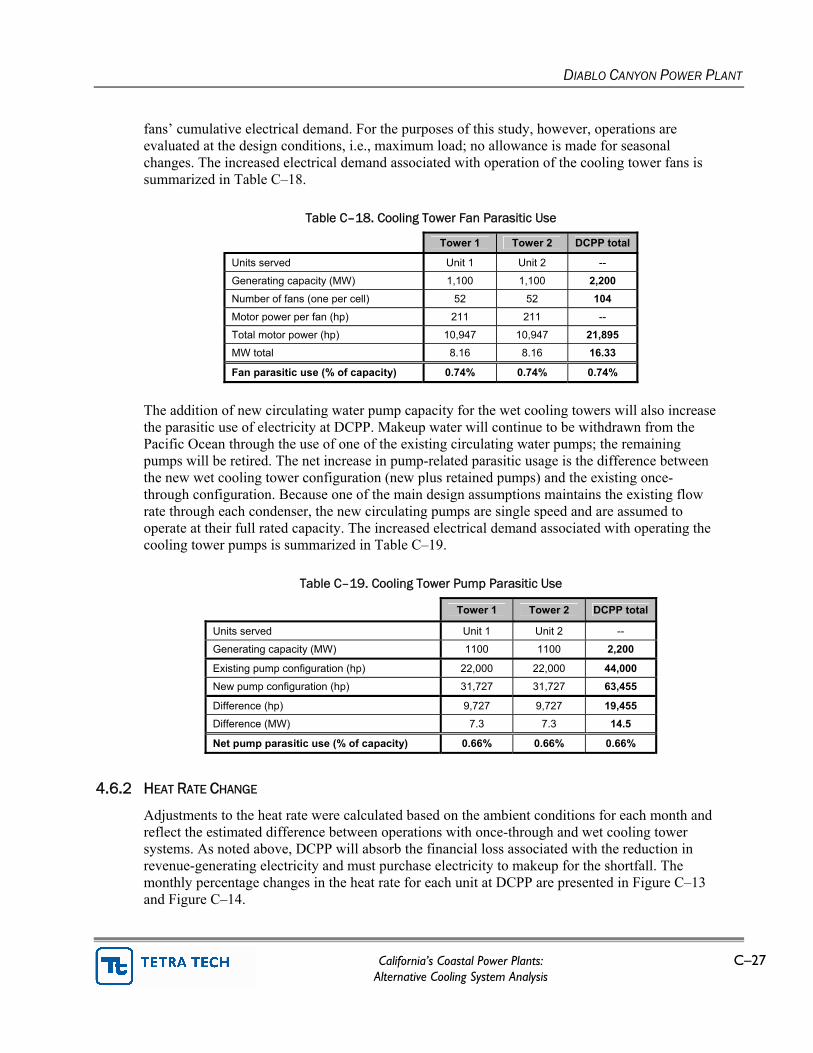
fans’ cumulative electrical demand. For the purposes of this study, however, operations are evaluated at the design conditions, i.e., maximum load; no allowance is made for seasonal changes. The increased electrical demand associated with operation of the cooling tower fans is summarized in Table C–18.
Table C–18. Cooling Tower Fan Parasitic Use
Tower 1 Tower 2 DCPP total
Units served Unit 1 Unit 2 --
Generating capacity (MW) 1,100 1,100 2,200 Number of fans (one per cell) 52 52 104 Motor power per fan (hp) 211 211 --
Total motor power (hp) 10,947 10,947 21,895 MW total 8.16 8.16 16.33
Fan parasitic use (% of capacity) 0.74% 0.74% 0.74%
The addition of new circulating water pump capacity for the wet cooling towers will also increase the parasitic use of electricity at DCPP. Makeup water will continue to be withdrawn from the Pacific Ocean through the use of one of the existing circulating water pumps; the remaining pumps will be retired. The net increase in pump-related parasitic usage is the difference between the new wet cooling tower configuration (new plus retained pumps) and the existing once-through configuration. Because one of the main design assumptions maintains the existing flow rate through each condenser, the new circulating pumps are single speed and are assumed to operate at their full rated capacity. The increased electrical demand associated with operating the cooling tower pumps is summarized in Table C–19.
Net pump parasitic use (% of capacity) 0.66% 0.66% 0.66%
4.6.2 HEAT RATE CHANGE
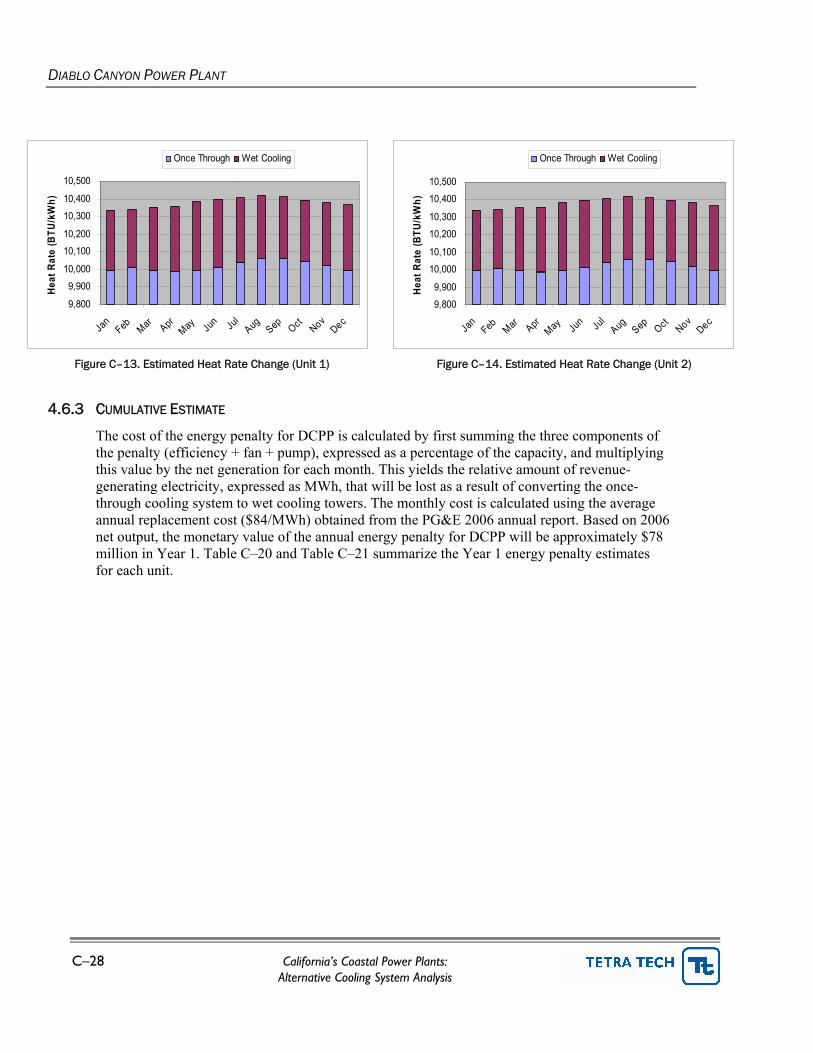
Adjustments to the heat rate were calculated based on the ambient conditions for each month and reflect the estimated difference between operations with once-through and wet cooling tower systems. As noted above, DCPP will absorb the financial loss associated with the reduction in revenue-generating electricity and must purchase electricity to makeup for the shortfall. The monthly percentage changes in the heat rate for each unit at DCPP are presented in Figure C–13 and Figure C–14.
DIABLO CANYON POWER PLANT
C–28 California’s Coastal Power Plants: Alternative Cooling System Analysis
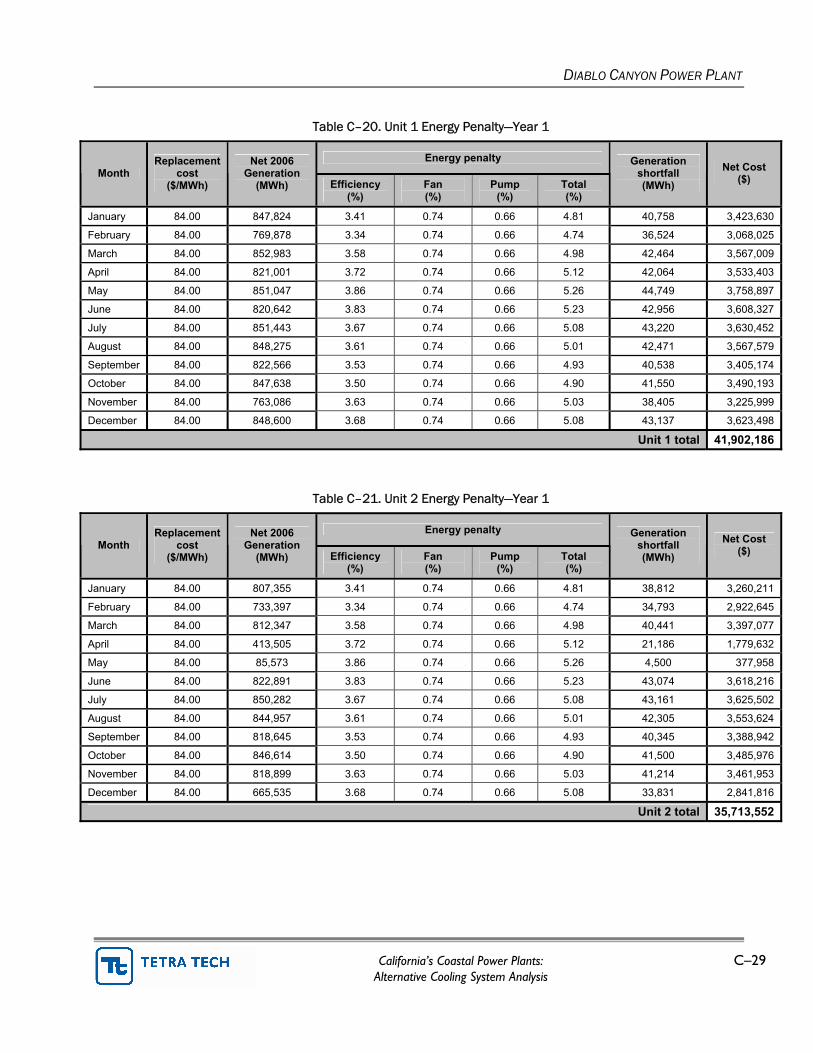
The cost of the energy penalty for DCPP is calculated by first summing the three components of the penalty (efficiency + fan + pump), expressed as a percentage of the capacity, and multiplying this value by the net generation for each month. This yields the relative amount of revenue- generating electricity, expressed as MWh, that will be lost as a result of converting the once-through cooling system to wet cooling towers. The monthly cost is calculated using the average annual replacement cost ($84/MWh) obtained from the PG&E 2006 annual report. Based on 2006 net output, the monetary value of the annual energy penalty for DCPP will be approximately $78 million in Year 1. Table C–20 and Table C–21 summarize the Year 1 energy penalty estimates for each unit.
DIABLO CANYON POWER PLANT
California’s Coastal Power Plants: C–29 Alternative Cooling System Analysis
Table C–20. Unit 1 Energy Penalty—Year 1
Energy penalty Month
Replacement cost
($/MWh)
Net 2006 Generation
(MWh) Efficiency (%)
Fan (%)
Pump (%)
Total (%)
Generation shortfall (MWh)
Net Cost ($)
January 84.00 847,824 3.41 0.74 0.66 4.81 40,758 3,423,630
February 84.00 769,878 3.34 0.74 0.66 4.74 36,524 3,068,025
March 84.00 852,983 3.58 0.74 0.66 4.98 42,464 3,567,009
April 84.00 821,001 3.72 0.74 0.66 5.12 42,064 3,533,403
May 84.00 851,047 3.86 0.74 0.66 5.26 44,749 3,758,897
June 84.00 820,642 3.83 0.74 0.66 5.23 42,956 3,608,327
July 84.00 851,443 3.67 0.74 0.66 5.08 43,220 3,630,452
August 84.00 848,275 3.61 0.74 0.66 5.01 42,471 3,567,579
September 84.00 822,566 3.53 0.74 0.66 4.93 40,538 3,405,174
October 84.00 847,638 3.50 0.74 0.66 4.90 41,550 3,490,193
November 84.00 763,086 3.63 0.74 0.66 5.03 38,405 3,225,999
December 84.00 848,600 3.68 0.74 0.66 5.08 43,137 3,623,498
Unit 1 total 41,902,186
Table C–21. Unit 2 Energy Penalty—Year 1
Energy penalty Month
Replacement cost
($/MWh)
Net 2006 Generation
(MWh) Efficiency (%)
Fan (%)
Pump (%)
Total (%)
Generation shortfall (MWh)
Net Cost ($)
January 84.00 807,355 3.41 0.74 0.66 4.81 38,812 3,260,211
February 84.00 733,397 3.34 0.74 0.66 4.74 34,793 2,922,645
March 84.00 812,347 3.58 0.74 0.66 4.98 40,441 3,397,077
April 84.00 413,505 3.72 0.74 0.66 5.12 21,186 1,779,632
May 84.00 85,573 3.86 0.74 0.66 5.26 4,500 377,958
June 84.00 822,891 3.83 0.74 0.66 5.23 43,074 3,618,216
July 84.00 850,282 3.67 0.74 0.66 5.08 43,161 3,625,502
August 84.00 844,957 3.61 0.74 0.66 5.01 42,305 3,553,624
September 84.00 818,645 3.53 0.74 0.66 4.93 40,345 3,388,942
October 84.00 846,614 3.50 0.74 0.66 4.90 41,500 3,485,976
November 84.00 818,899 3.63 0.74 0.66 5.03 41,214 3,461,953
December 84.00 665,535 3.68 0.74 0.66 5.08 33,831 2,841,816
Unit 2 total 35,713,552
DIABLO CANYON POWER PLANT
C–30 California’s Coastal Power Plants: Alternative Cooling System Analysis
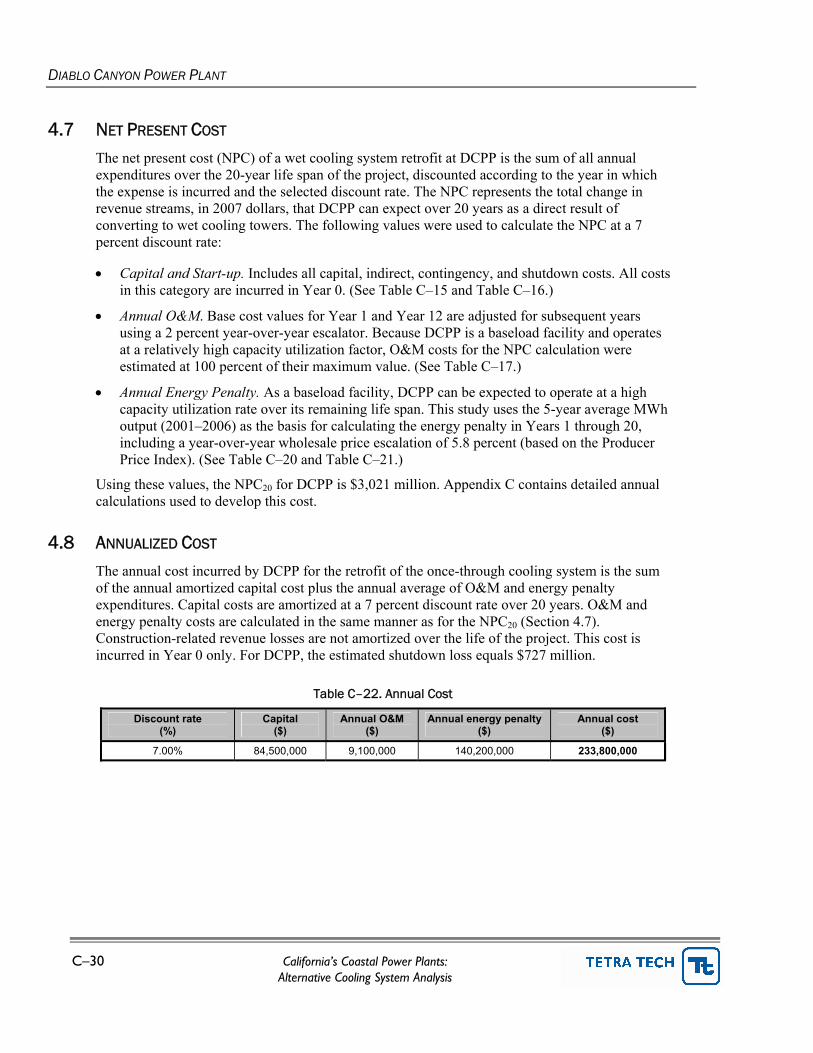
4.7 NET PRESENT COST
The net present cost (NPC) of a wet cooling system retrofit at DCPP is the sum of all annual expenditures over the 20-year life span of the project, discounted according to the year in which the expense is incurred and the selected discount rate. The NPC represents the total change in revenue streams, in 2007 dollars, that DCPP can expect over 20 years as a direct result of converting to wet cooling towers. The following values were used to calculate the NPC at a 7 percent discount rate:
• Capital and Start-up. Includes all capital, indirect, contingency, and shutdown costs. All costs in this category are incurred in Year 0. (See Table C–15 and Table C–16.)
• Annual O&M. Base cost values for Year 1 and Year 12 are adjusted for subsequent years using a 2 percent year-over-year escalator. Because DCPP is a baseload facility and operates at a relatively high capacity utilization factor, O&M costs for the NPC calculation were estimated at 100 percent of their maximum value. (See Table C–17.)
• Annual Energy Penalty. As a baseload facility, DCPP can be expected to operate at a high capacity utilization rate over its remaining life span. This study uses the 5-year average MWh output (2001–2006) as the basis for calculating the energy penalty in Years 1 through 20, including a year-over-year wholesale price escalation of 5.8 percent (based on the Producer Price Index). (See Table C–20 and Table C–21.)
Using these values, the NPC20 for DCPP is $3,021 million. Appendix C contains detailed annual calculations used to develop this cost.
4.8 ANNUALIZED COST
The annual cost incurred by DCPP for the retrofit of the once-through cooling system is the sum of the annual amortized capital cost plus the annual average of O&M and energy penalty expenditures. Capital costs are amortized at a 7 percent discount rate over 20 years. O&M and energy penalty costs are calculated in the same manner as for the NPC20 (Section 4.7). Construction-related revenue losses are not amortized over the life of the project. This cost is incurred in Year 0 only. For DCPP, the estimated shutdown loss equals $727 million.
California’s Coastal Power Plants: C–31 Alternative Cooling System Analysis
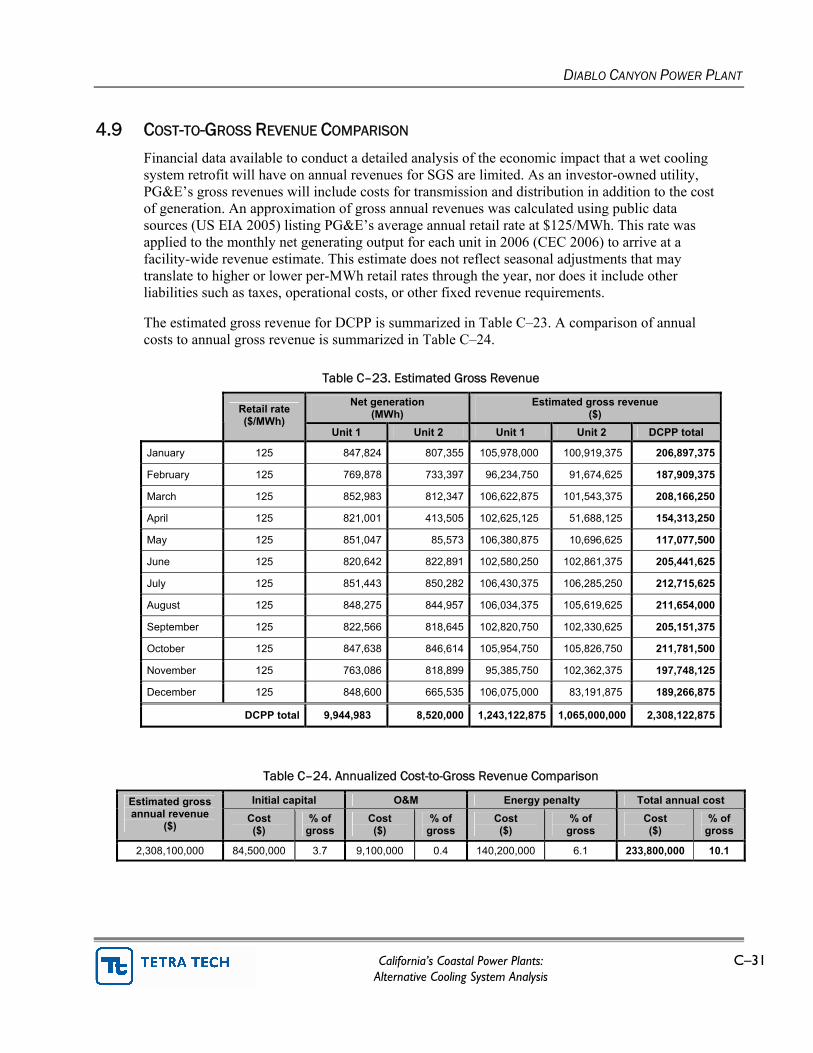
4.9 COST-TO-GROSS REVENUE COMPARISON
Financial data available to conduct a detailed analysis of the economic impact that a wet cooling system retrofit will have on annual revenues for SGS are limited. As an investor-owned utility, PG&E’s gross revenues will include costs for transmission and distribution in addition to the cost of generation. An approximation of gross annual revenues was calculated using public data sources (US EIA 2005) listing PG&E’s average annual retail rate at $125/MWh. This rate was applied to the monthly net generating output for each unit in 2006 (CEC 2006) to arrive at a facility-wide revenue estimate. This estimate does not reflect seasonal adjustments that may translate to higher or lower per-MWh retail rates through the year, nor does it include other liabilities such as taxes, operational costs, or other fixed revenue requirements.
The estimated gross revenue for DCPP is summarized in Table C–23. A comparison of annual costs to annual gross revenue is summarized in Table C–24.
Table C–23. Estimated Gross Revenue
Net generation (MWh)
Estimated gross revenue ($)
Retail rate ($/MWh)
Unit 1 Unit 2 Unit 1 Unit 2 DCPP total
January 125 847,824 807,355 105,978,000 100,919,375 206,897,375
February 125 769,878 733,397 96,234,750 91,674,625 187,909,375
March 125 852,983 812,347 106,622,875 101,543,375 208,166,250
April 125 821,001 413,505 102,625,125 51,688,125 154,313,250
May 125 851,047 85,573 106,380,875 10,696,625 117,077,500
June 125 820,642 822,891 102,580,250 102,861,375 205,441,625
July 125 851,443 850,282 106,430,375 106,285,250 212,715,625
August 125 848,275 844,957 106,034,375 105,619,625 211,654,000
September 125 822,566 818,645 102,820,750 102,330,625 205,151,375
October 125 847,638 846,614 105,954,750 105,826,750 211,781,500
November 125 763,086 818,899 95,385,750 102,362,375 197,748,125
December 125 848,600 665,535 106,075,000 83,191,875 189,266,875
DCPP total 9,944,983 8,520,000 1,243,122,875 1,065,000,000 2,308,122,875
C–32 California’s Coastal Power Plants: Alternative Cooling System Analysis
5.0 OTHER TECHNOLOGIES Within the scope of this study, and using the OPC resolution’s stated goal of reducing impingement and entrainment by 90–95 percent as a benchmark, the effectiveness of other technologies commonly used to address such impacts could not be conclusively determined for use at DCPP. As with many existing facilities, the location and configuration of the site complicates the use of some technologies that might be used successfully elsewhere. A more detailed analysis that also comprises a biological evaluation may determine the applicability of one or more of these technologies to DCPP. A brief summary of the applicability of these technologies follows.
5.1 MODIFIED RISTROPH SCREENS—FINE MESH
The principal concern with this technology is the successful return of viable organisms captured on the screens to the source water body. The 2002 Tetra Tech report evaluated the feasibility of fine-mesh traveling screens at DCPP and noted the limited performance data available from studies at other facilities. The performance data that do exist show a high degree of variability that reflects the site and species-specific nature of this technology. Because fine-mesh screens have a smaller total open area per square foot than coarse-mesh screens, significant modifications to the screenhouse would be necessary to accommodate the larger screen assemblies. Tetra Tech estimated that these modifications would require the shutdown of both generating units for 13 months.
In proposed Order RB3-2003-009, the CCRWQCB considered fine-mesh screens to be an experimental technology, particularly at facilities with very large intake volumes. Further, the order states “the only way to determine the effectiveness of a screening technology at DCPP is to conduct site-specific research” (CCRWQCB 2003).
5.2 BARRIER NETS
Barrier nets are unproven in an open ocean environment. As noted above, the CCRWQCB does not consider impingement impacts to be significant enough to warrant installing control measures to reduce impingement mortality.
5.3 AQUATIC FILTRATION BARRIERS
Aquatic filtration barriers (AFBs) are unproven in an open ocean environment. The 2002 Tetra Tech report evaluated AFBs at DCPP but concluded that they are infeasible due to the heavy surf that can occur during winter storms (20 to 30 foot swells) and the massive size of the AFB necessary to screen the volume of water at DCPP. At DCPP, a barrier encompassing approximately 4 acres in surface area would be deployed in the open ocean. With an average depth of 20 feet, the AFB would be approximately 8,000 feet long.
DIABLO CANYON POWER PLANT
California’s Coastal Power Plants: C–33 Alternative Cooling System Analysis
5.4 VARIABLE SPEED DRIVES
Variable speed drives (VSDs) were not considered for this analysis because DCPP, as a baseload facility, would not be able to realize any significant flow reduction through their use.
5.5 CYLINDRICAL FINE-MESH WEDGEWIRE
Fine-mesh cylindrical wedgewire screens have not been deployed or evaluated at open coastal facilities for applications as large as required at DCPP (approximately 2,500 mgd). To function as intended, cylindrical wedgewire screens must be submerged in a water body with a consistent ambient current of 0.5 fps. Ideally, this current would be unidirectional so that screens may be oriented properly and any debris impinged on the screens will be carried downstream when the airburst cleaning system is activated.
Placement of intake screens in the existing intake cove is impractical because the available area and ambient currents are insufficient for the 30 to 35 screen assemblies that would be required for DCPP, depending on the screen diameter and mesh size. Locating the screens offshore, if a relatively close area could be identified, would leave the screens vulnerable to damage from winter storms. For these reasons, combined with the rocky and steeply sloping bathymetry offshore, fine-mesh wedgewire screens are impractical for use at DCPP.
DIABLO CANYON POWER PLANT
C–34 California’s Coastal Power Plants: Alternative Cooling System Analysis
6.0 REFERENCES BES (Burns Engineering Services, Inc.). 2003. Feasibility of Retrofitting Cooling Towers at
Diablo Canyon Units 1 and 2. Burns Engineering Services, Inc., Topsfield, MA.
CCRWQCB (Central Coast Regional Water Quality Control Board). 2003. Order RB3-20030009. Central Coast Regional Water Quality Control Board, San Luis Obispo, CA.
CEC (California Energy Commission). 2006. Quarterly Fuel and Energy Report (QFER). California Energy Commission, Sacramento, CA.
—. 2006b. Inventory of Coastal Power Plants—Draft. California Energy Commission, Sacramento, CA.
CTI (Cooling Tower Institute). 1994. Isokinetic Drift Test Code. Cooling Tower Institute, Houston, TX.
NCDC (National Climatic Data Center). 2006. Climate Normals—Avila Beach and Pismo Beach, CA. National Climatic Data Center, Asheville, NC.
NOAA (National Oceanographic and Atmospheric Administration). 2007. National Oceanographic Data Center—Coastal Water Temperature Guide, Avila Beach. National Oceanographic and Atmospheric Administration, Washington, DC. <http://www.nodc.noaa.gov/dsdt/cwtg/index.html>. Accessed April 1, 2007.
SWRCB (California State Water Resources Control Board). 1972. Water Quality Control Plan for Control of Temperature in the Coastal and Interstate Waters and Enclosed Bays and Estuaries of California. California State Water Resources Control Board, Sacramento, CA.
—. 1975. Water Quality Control Policy on the Use and Disposal of Inland Waters Used for Power Plant Cooling. Resolution 75-58. California State Water Resources Control Board, Sacramento, CA.
Tenera Environmental Service. 2000. Diablo Canyon 316(b) Demonstration Report. Prepared for Pacific Gas and Electric, San Francisco, CA.
DIABLO CANYON POWER PLANT
California’s Coastal Power Plants: C–35 Alternative Cooling System Analysis
Tera Corporation. 1982. Assessment of Alternatives to the Existing Cooling Water System (DCPP). Prepared for Pacific Gas and Electric, San Francisco, CA.
Tetra Tech, Inc. 2002. Evaluation of Cooling System Alternatives: Diablo Canyon Power Plant. Prepared for CCRWQCB, San Luis Obispo, CA.
USEPA (U.S. Environmental Protection Agency). 2001. Technical Development Document for the Final Regulations Addressing Cooling Water Intake Structures for New Facilities. EPA-821-R-01-036. U.S. Environmental Protection Agency, Washington, DC.
DIABLO CANYON POWER PLANT
C–36 California’s Coastal Power Plants: Alternative Cooling System Analysis
Appendix A. Once-Through and Closed-Cycle Thermal Performance
FRP flange 120" ea 116 0 236,500 27,434,000 1200 106 14,755,200 42,189,200 Allocation for other accessories (bends, water hammers…)
lot 1 0 500,000 500,000 4000 106 424,000 924,000
TOTAL CIVIL / STRUCTURAL / PIPING 198,487,110 MECHANICAL Cooling tower for Unit 1 lot 2 30,500,000 0 Incl. 30,500,000
Cooling tower for Unit 2 lot 0 30,500,000 0 0 Incl. 30,500,000
Pump 4160 V 2000 HP ea 4 1,000,000 4,000,000 0 500 106 212,000 4,212,000
Pump 4160 V 7000 HP ea 8 1,870,000 14,960,000 0 1200 106 1,017,600 15,977,600 Overhead crane 50 ton in (in pump house) Including additional structure to reduce the span
ea 1 650,000 650,000 0 1300 106 137,800 787,800
Allocation for ventilation of buildings ea 1 200,000 200,000 0 2000 106 212,000 412,000
TOTAL MECHANICAL 82,389,400ELECTRICAL/INSTRUMENTATION Local feeder for 200 HP motor 460 V (up to MCC) ea 104 0 18,000 1,872,000 150 106 1,653,600 3,525,600
Local feeder for 7000 HP motor 4160 V (up to MCC) ea 8 0 60,000 480,000 250 106 212,000 692,000
Allocation for lighting and lightning protection lot 1 0 300,000 300,000 3000 106 318,000 618,000
Lighting & electrical services for pump house building
ea 1 0 140,000 140,000 2000 106 212,000 352,000
Allocation for automation and control lot 1 0 2,000,000 2,000,000 20000 106 2,120,000 4,120,000
460 volt cabling feeding MCC's m 2,500 0 70 175,000 0.4 106 106,000 281,000
Allocation for cable trays and duct banks m 4,000 0 75 300,000 1 106 424,000 724,000
TOTAL ELECTRICAL/INSTRUMENTATION 16,239,720DEMOLITION/OTHER Various civil works that are not included above. The price is based on an estimate from the 2002 study performed by Hatch and escalated to 2007 using a factor of 4%/year. It covers mainly clearing, grubbing, leveling, road works, partial excavation of existing hillside, general landscaping, demolition of existing warehouse, installation of new warehouse, demolition of existing hazardous material warehouse, installation of new hazardous material warehouse, retaining wall and also miscellaneous work.
209,037,945
Start-up water holding tank (120 ft diameter X 40 ft high) including 2 supply pumps and piping (price based on 2002 estimate escalated to 2007 at 4%/year) 3,649,959
TOTAL DEMOLITION/OTHER 212,687,904
DIABLO CANYON POWER PLANT
C–40 California’s Coastal Power Plants: Alternative Cooling System Analysis