50
Report Sunnyside Canal Improvement Project 2009/2010 Check Structures Geotechnical Data Report Prepared for Sunnyside Valley Irrigation District July 2009 Boise, Idaho

R e p o r t
Sunnyside Canal Improvement Project
2009/2010 Check Structures Geotechnical Data Report
Prepared for
Sunnyside Valley Irrigation District
July 2009
Boise, Idaho

BOI082750019.DOC/KM iii
Contents
Section Page
Introduction..........................................................................................................................................1 Limitations............................................................................................................................................1 Subsurface Exploration and Conditions .........................................................................................1
Drilling Program......................................................................................................................1 Laboratory Testing Program..................................................................................................2 Subsurface Conditions............................................................................................................3
Geologic Setting..........................................................................................................3 MP 14.27 (Drop 8).......................................................................................................4 MP 15.40 (Drop 9).......................................................................................................4 MP 16.95 (Drop 10).....................................................................................................4 MP 18.06 (Drop 11).....................................................................................................4 MP 19.77 (Drop 12).....................................................................................................4
Groundwater Conditions .......................................................................................................5 Corrosion Potential .................................................................................................................5
Field Electrical Resistivity Measurements ..............................................................6 Laboratory Measurements (Resistivity, pH, Sulfates and Chlorides).................8
Seismic Conditions .............................................................................................................................8
Seismic Hazards.......................................................................................................................8 Area Seismicity ........................................................................................................................8 Site-Specific Seismic Design Parameters ..............................................................................9 Liquefaction Potential .............................................................................................................9
Geotechnical Recommendations ....................................................................................................10
Structural Design Parameters ..............................................................................................10 Foundation Subgrade Preparation......................................................................................11 Earthwork and Grading .......................................................................................................11 Allowable Bearing Pressures ...............................................................................................11 Seepage and Uplift Pressure Analysis................................................................................11
Analysis by Flow Net Method................................................................................12 Lateral Earth Pressure...........................................................................................................13 Coefficient of Friction............................................................................................................14 Recommended Corrosion Protection..................................................................................15
Other Construction Considerations...............................................................................................15
Dewatering .............................................................................................................................15 Sheet Pile Driving..................................................................................................................16

CONTENTS, CONTINUED
BOI082750019.DOC/KM iv
Section Page
Construction Access ..............................................................................................................16 Stockpile and Staging Areas ................................................................................................16 Waste Area .............................................................................................................................16
References ...........................................................................................................................................16
Appendixes
A Site Plans B Boring Logs C Laboratory Results
Tables Page
1 CH2M HILL Soil Boring Summary....................................................................................... 2 2 Summary of Laboratory Test Results ................................................................................... 3 3 Borehole Groundwater Measurements ................................................................................ 5 4 In-Situ Soil Resistivity Data.................................................................................................... 7 5 Seismic Design Parameters .................................................................................................. 10 6 Calculated Exit Gradients and Uplift Pressures................................................................ 12 7 Imported Backfill—Lateral Earth Pressure Summary...................................................... 14 8 Native Silt Backfill—Lateral Earth Pressure Summary.................................................... 14 9 Coefficients of Friction on Native Soil ................................................................................ 15

BOI082750019.DOC/KM 1
Introduction As part of the Sunnyside Canal Improvement Project in FY 2009, five new canal check structures are proposed at Milepost (MP) 14.27, 15.40, 16.95, 18.06, and 19.77. These canal check structures are also known as Drops 8, 9, 10, 11, and 12 on the Sunnyside Canal system. Existing check structures at these locations will be replaced by new check structures. A field exploration program was conducted in May 2009 to evaluate subsurface conditions and provide design recommendations for the proposed check structures. This report describes the field exploration program, summarizes the subsurface conditions, and presents the laboratory and field test data to be used in designing the check structures.
Limitations This report has been prepared for the exclusive use of the Sunnyside Valley Irrigation District—for specific application to the FY 2009 Check Structures project—in accordance with generally accepted geotechnical engineering practice. No other warranty, express or implied, is made.
The information and findings presented in this report are based on data obtained from soil borings and resistivity surveys conducted in May 2009 by CH2M HILL and subcontractors. Soil borings and resistivity data indicate subsurface conditions only at specific locations and times, and only to the depths penetrated. They do not necessarily reflect strata and water level variations that may exist between exploration locations or over time. If variations in subsurface conditions from those described are noted during construction, CH2M HILL should be notified and given an opportunity to review the design assumptions. In the event that any changes in the nature, design, or location of the components of this project are planned, the findings contained in this report should not be considered valid unless the changes are reviewed and conclusions of this report modified or verified in writing by CH2M HILL.
CH2M HILL is not responsible for any claims, damages, or liability associated with interpretation of subsurface data or for the reuse of subsurface data, without the express written authorization of CH2M HILL.
Subsurface Exploration and Conditions This section summarizes the exploration program including the drilling program, site-specific subsurface soil conditions, and groundwater conditions.
Drilling Program The subsurface exploration program consisted of drilling five borings on May 5 and 6, 2009, to depths of 41.5 feet below ground surface (ft bgs). The borings were drilled along the canal access road near the locations of each proposed check structure (see Site Plans in Appendix A). Drilling was conducted by Haz-Tech Drilling of Meridian, Idaho, under subcontract to CH2M HILL. A CME-75 truck-mounted rig with a 140-pound autohammer advanced the borings, using hollow-stem auger drilling techniques and split-spoon SPT

BOI082750019.DOC/KM 2
sampling. The boring logs are included in Appendix B. The borings are summarized in Table 1.
TABLE 1 CH2M HILL Soil Boring Summary
Boring ID Location
Depth Drilled (ft bgs) Easting Northing
Approximate Elevation
(ft)
CDB-14.27 On canal access road upstream from existing check structure at MP 14.27
41.5 1,701,014 396,056 878.2
CDB-15.40 On canal access road upstream from existing check structure at MP 15.40
41.5 1,700,916 391,978 875.5
CDB-16.95 On canal access road downstream from existing check structure at MP 16.95
41.5 1,703,323 389,501 874.5
CDB-18.06 On canal access road adjacent to existing check structure at MP 18.06
41.5 1,708,146 391,025 873.7
CDB-19.77 On canal access road downstream from existing check structure at MP 19.77
40.7 1,712,752 388,398 869.1
Note: Horizontal coordinates based on Washington State Plane Coordinates—Washington South. Elevations are based on NGVD 29 vertical datum, and shown on the Site Plan for each check structure.
One additional boring (GTB-1) was also advanced for the proposed radio tower at the Grandview location. This boring and results associated with that exploration were reported separately.
Laboratory Testing Program A limited laboratory testing program was performed to confirm field classifications, evaluate compaction characteristics, and evaluate corrosion properties. Laboratory tests performed on samples collected from the borings are as follows:
ASTM D2216, Standard Test Method for Laboratory Determination of Water (Moisture) Content of Soil and Rock
ASTM D4318, Standard Test Method for Liquid Limit, Plastic Limit, and Plasticity Index of Soils
ASTM D422, Standard Test Method for Particle-Size Analysis of Soils
ASTM D1140, Standard Test Method for Amount of Material in Soils Finer Than the No. 200 (75 m) Sieve
ASTM D1557, Standard Test Methods for Laboratory Compaction Characteristics of Soil Using Modified Effort (56,000 ft-lbf/ft3 (2,700 kN-m/m3))
AASHTO T-288,289 pH and Resistivity of Soils
Chloride and sulfates
A summary of the laboratory test results is provided in Table 2. The original laboratory test results are provided in Appendix C.

BOI082750019.DOC/KM 3
TABLE 2 Summary of Laboratory Test Results
Atterburg Limits (%)
Borehole/ Sample ID
Depth (ft)
Soil Type ASTM D2488
Moisture Content
(%) LL PL PI
Percent Passing
#200 pH Resistivity (ohm/cm)
Chloride (mg/kg)
Sulfate (mg/kg)
CDB-14.27 5-15 ML 21.9 78.1 <5.0 12.7
CDB-15.40 5 ML 20.8 NP NP NP 70.9
CDB-15.40 20-30 CL 26.0 27 20 7 7.0 2190 <5.0 7.5
CDB-16.95 15 ML 20.5 73.7
CDB-18.06 10-20 ML 25.3 89.5 6.9 2700 <5.0 8.5
CDB-19.77 5-15 ML 26.6 NP NP NP 63.4 <5.0 6.7
CDB-19.77 20-25 ML 27.7 6.8 2720 <5.0 6.4
Notes: NP = Non-plastic ML = Silt, Silt with Sand, and Sandy Silt CL = Lean Clay
Subsurface Conditions The subsurface materials observed during the field exploration varied somewhat between each proposed check structure location. Subsurface materials encountered during the investigation included sandy silts, silty sands, clay, and gravels. The subsurface conditions found at each proposed check structure are described below. Because the borings were drilled on the canal access road, the depths to the layers are below the elevation of the access road.
The boring logs are included in Appendix B. The site plan for each structure shows the locations of the borings relative to the proposed check structures.
Geologic Setting
Unconsolidated geologic deposits underlie the Sunnyside Canal between MP 14.27 and MP 19.77, and consist primarily of catastrophic outburst flood deposits. Schuster (1994) and Reidel and Fecht (1994) describe these deposits in more detail:
The outburst flood deposits consist primarily of silt, sand, and minor gravel. The outburst flood deposits were deposited by catastrophic floods from glacial Lake Missoula and other ice-margin lakes, and are found along the Snake, Columbia, and Yakima rivers. The mineralogy of these materials is predominantly quartz and feldspar, with basalt in coarser sands. Stratigraphic features include rhythmically bedded deposts with stringers of coarse sand and gravel, clastic dikes, small-scale cross-bedding, ice-rafted clasts, and ice-melt structures present locally. The sand-dominated facies are typically planar laminated and sporadic channel-fill sequences. The silt-dominated facies are planar laminated and ripple cross-laminated, commonly displaying normal graded rhythmites. Discrete ash and tephra layers are also common throughout the flood deposits.
BOI082750019.DOC/KM 4
Based on observations of local exposures and soil boring information, the flood deposits along this reach of the canal consist primarily of interbedded fine sandy silt to fine silty sand, with layers of lean clay, and poorly graded silty sand and occasional gravels. The thickness of these deposits along this reach of the canal is not known and is likely to vary. The site-specific subsurface conditions are described below.
MP 14.27 (Drop 8) Boring CDB-23.17 was drilled to a depth of 41.5 ft on the east side of the canal upstream from the existing check structure. The subsurface conditions encountered at CDB-14.27 included firm silt overlying loose silty sand, overlying dense gravel with clay, overlying hard lean clay to the bottom of the boring. The dense gravel layer was encountered from approximately 30 to 37 ft bgs at the boring. The upper silt layer, which is approximately 8 to 10 ft thick is material used to construct the canal berm.
MP 15.40 (Drop 9) Boring CDB-15.40 was drilled to a depth of 41.5 ft on the west side of the canal upstream from the existing check structure, and north of East Zillah Road. The subsurface conditions encountered at CDB-15.40 consisted of soft silt overlying very stiff silt to silt with sand, overlying very stiff lean clay to a depth of approximately 35 ft bgs. Below 35 ft bgs the material was weakly cemented and contained caliche. The upper soft silt layer, which is approximately 8 to 10 ft thick, is material used to construct the canal berm.
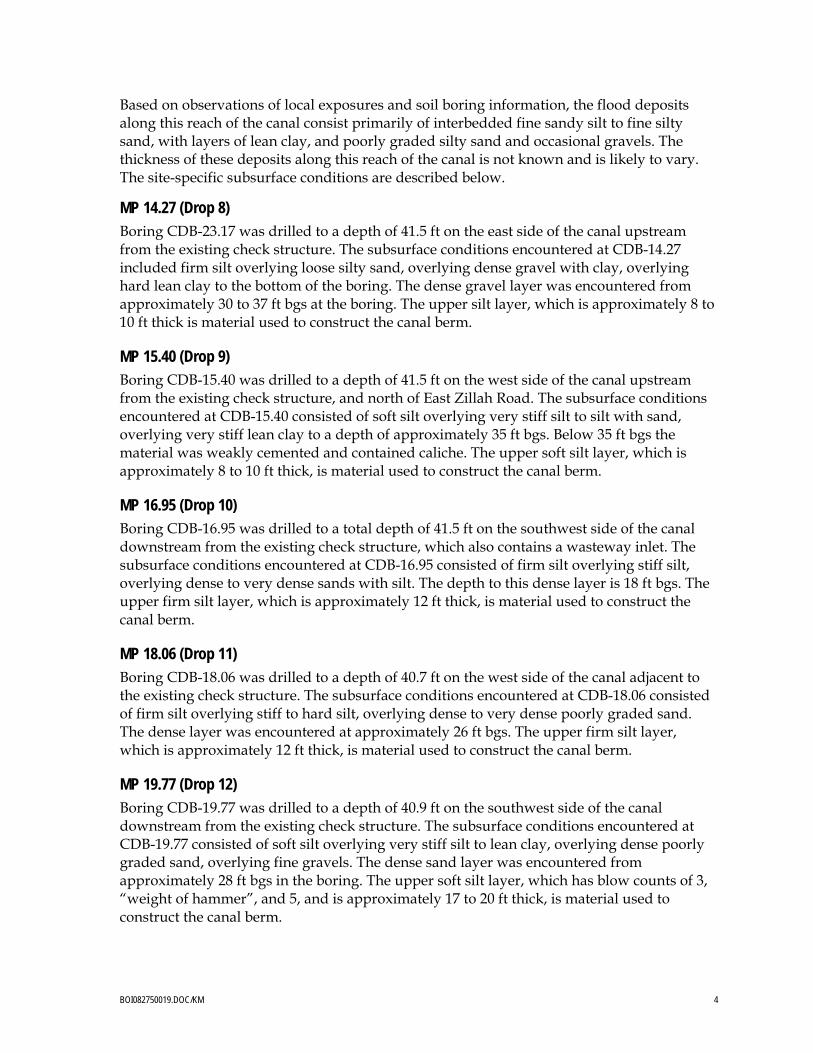
MP 16.95 (Drop 10) Boring CDB-16.95 was drilled to a total depth of 41.5 ft on the southwest side of the canal downstream from the existing check structure, which also contains a wasteway inlet. The subsurface conditions encountered at CDB-16.95 consisted of firm silt overlying stiff silt, overlying dense to very dense sands with silt. The depth to this dense layer is 18 ft bgs. The upper firm silt layer, which is approximately 12 ft thick, is material used to construct the canal berm.
MP 18.06 (Drop 11) Boring CDB-18.06 was drilled to a depth of 40.7 ft on the west side of the canal adjacent to the existing check structure. The subsurface conditions encountered at CDB-18.06 consisted of firm silt overlying stiff to hard silt, overlying dense to very dense poorly graded sand. The dense layer was encountered at approximately 26 ft bgs. The upper firm silt layer, which is approximately 12 ft thick, is material used to construct the canal berm.
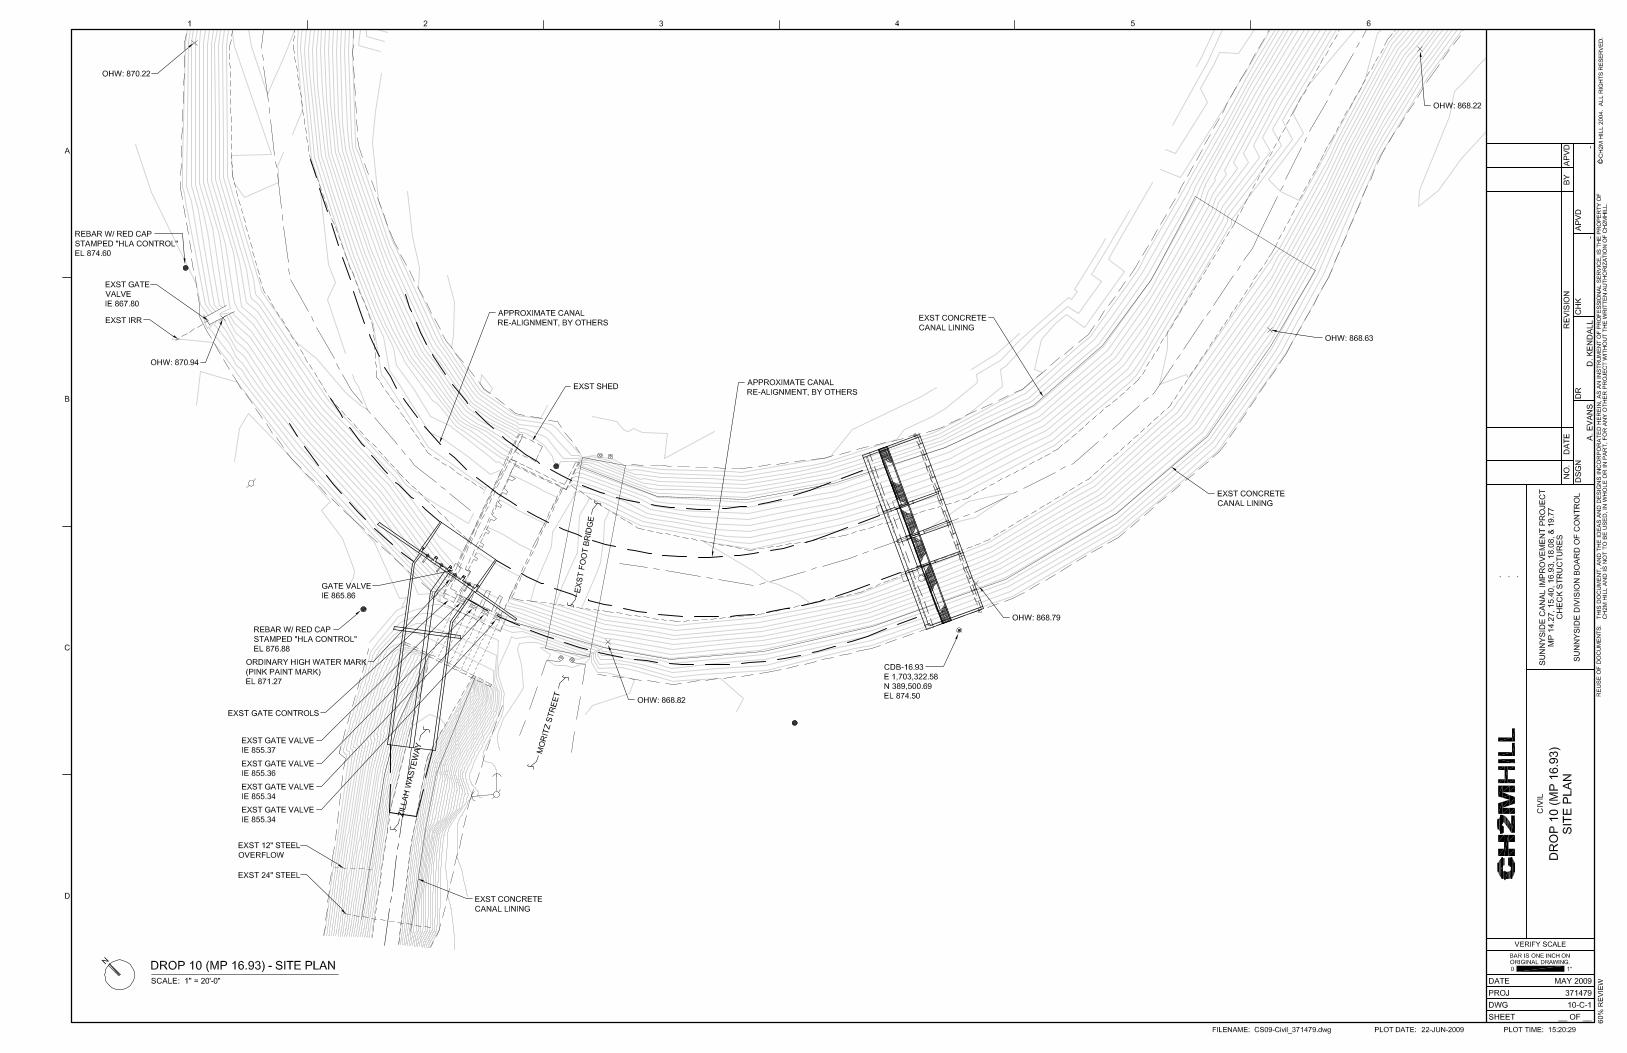
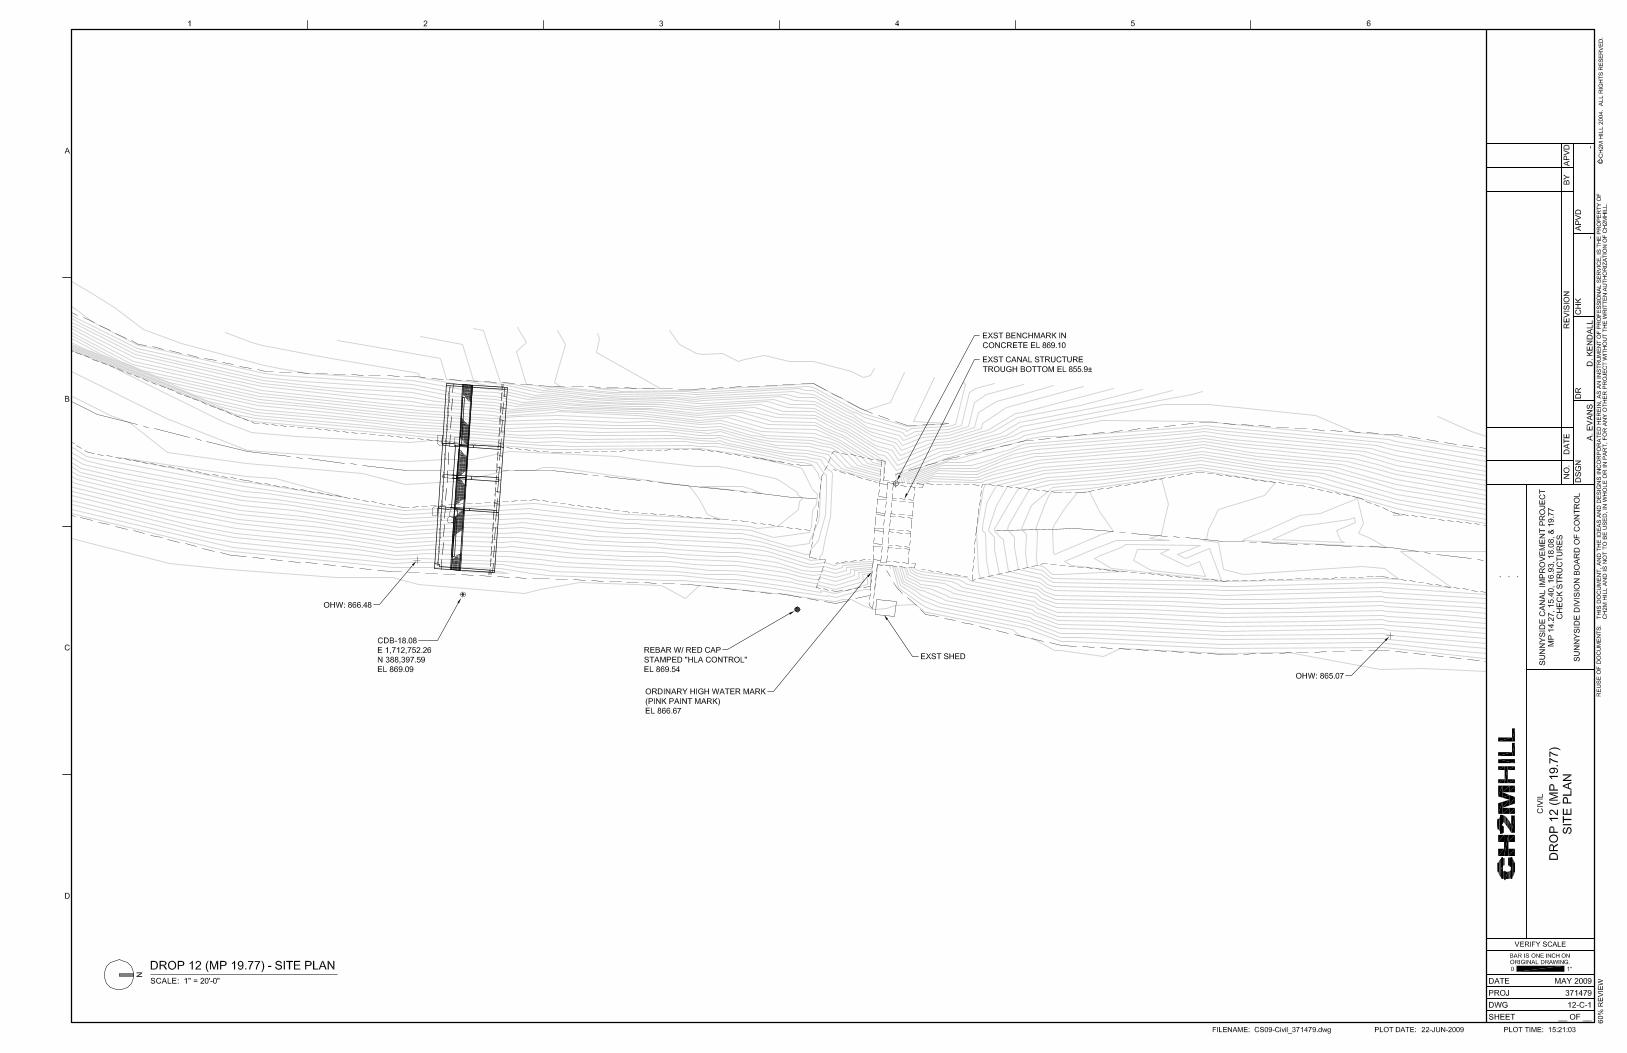
MP 19.77 (Drop 12) Boring CDB-19.77 was drilled to a depth of 40.9 ft on the southwest side of the canal downstream from the existing check structure. The subsurface conditions encountered at CDB-19.77 consisted of soft silt overlying very stiff silt to lean clay, overlying dense poorly graded sand, overlying fine gravels. The dense sand layer was encountered from approximately 28 ft bgs in the boring. The upper soft silt layer, which has blow counts of 3, “weight of hammer”, and 5, and is approximately 17 to 20 ft thick, is material used to construct the canal berm.

BOI082750019.DOC/KM 5
Groundwater Conditions No piezometers were installed in the borings to measure groundwater levels. However, groundwater was measured in the boreholes during drilling. These depths should only be regarded as preliminary information because water levels in boreholes can vary significantly from the static water level in the subsurface. Also, water levels vary at different times of year. At the time of the subsurface exploration, the canal was flowing, and therefore leakage from the canal may influence the groundwater level by recharging shallow groundwater. In addition, irrigation deep percolation in the vicinity is likely to have an influence on local shallow groundwater levels. In irrigated areas, groundwater levels typically rise with the onset of irrigation season and then fall during non-irrigated periods.
Groundwater measurements from the boreholes are summarized in Table 3.
TABLE 3 Borehole Groundwater Measurements
Boring I.D. Approximate
Ground Elevation* Depth to Water
(ft bgs)
Approximate Groundwater Elevation
(ft) Date
CDB-14.27 878.2 18.0 860.2 5/6/09
CDB-15.40 875.5 14.2 861.3 5/6/09
CDB-16.95 874.5 17.0 857.5 5/6/09
CDB-18.06 873.7 17.2 856.0 5/5/09
CDB-19.77 869.1 13.5 855.6 5/5/09
*Elevations are based on NGVD 29 vertical datum, and shown on the Site Plan for each check structure. Elevations were approximated from topographic mapping, for the location drilled.
Shallow groundwater may be present in the area as a result of irrigation from the adjacent canal, deep percolation, and canal leakage. In irrigated areas, typically groundwater levels rise with the onset of irrigation season, and then fall during non-irrigated periods.
Corrosion Potential Corrosion of buried concrete or steel usually results from an electrochemical reaction between the metal and water or moist soil. The reaction is referred to as electrochemical because electrical currents and chemical reactions occur simultaneously. Corrosion in the form of pitting or thinning of the metal surface occurs when atoms of solid metal ionize and dissolve in the environment. An electrical current flows between the anodic (corroding) areas and cathodic (non-corroding) areas. The probable intensity of corrosion can be estimated by measuring the electrical conductance of the soil.
The electrical conductance of the soil is commonly measured as its inverse, which is known as resistivity. Low resistivity values are interpreted as corrosive to exposed metal surfaces. In general, the relationship between soils and resistivity values are as follows:
Resistivity values less than 1,000 ohm-centimeters (ohm-cm) are considered severely corrosive.

BOI082750019.DOC/KM 6
Resistivity values between 1,000 and 3,000 ohm-cm are considered corrosive.
Resistivity values between 3,000 and 10,000 ohm-cm indicate moderate corrosivity.
Resistivity values greater than 10,000 ohm-cm indicate relatively noncorrosive conditions.
The pH value is a measure of the soil acidity. The corrosivity of the soil increases as the pH decreases. Low pH soils (less than 5) can be corrosive to cement mortar coatings. The potential for corrosion decreases as the soil pH increases (pH greater than 7).
The check structure sites were field and lab tested for soil resistivity and pH to evaluate corrosion potential—in particular to evaluate concerns of corrosion of the steel sheet pile cutoff walls that will be constructed as part of the check dams. The field resistivity tests were conducted using a Nilsson Model 400 4-Pin Soil Resistance Meter. The 4-pin method measures the voltage drop across a distance, and thus provides an average resistance at a depth based on the spacing of the pins. Results are given for average conditions between the ground surface and the test depth. The data can also be used to estimate resistivity of specific layers of soil within the overall test depths. The laboratory resistivity testing is conducted in a soil box in accordance with AASHTO-T-288.
Field Electrical Resistivity Measurements The site conditions at the time of the field investigation were good for field resistivity measurements. The canals were flowing at the time and therefore the measurements were typically made at the toe of the downstream canal berm in native soil, or uphill in native soils to mimic in-situ conditions. The only exception was at Check Structure MP 16.95, where there was no access at the toe of the berm or uphill; therefore, the measurements were conducted along the canal access road. In general, the underlying silty and sandy soils were moist, which helped to provide optimal contact between the pins and the soil. The field resistivity measurements were conducted by inserting the pins into the bottom of the canal at typical spacings of 5, 10, 15, and 20 ft. Using this spacing, the average resistivity values can be calculated from ground surface to the depth equal to the pin spacing, and also resistivity for individual 5-ft soil layers can be calculated. The field resistivity data and calculated results are shown in Table 4. Laboratory resistivity data was summarized in Table 2 and is discussed below.
The results of the field resistivity measurements indicate that the average soil resistivity in the upper 20 ft typically ranges from around 4,000 to 8,000 ohm-cm, which indicates the soils could be characterized as moderately corrosive. The resistivity of the individual 5-ft soil layers was relatively consistent throughout the depth of the soil profile, which is beneficial in reducing corrosion rates. The soil at MP 19.77 shows an increase in resistivity with depth, but higher resistivities are less corrosive.
The soil samples from the borings indicated moist to wet conditions. Leakage from the canals may saturate the underlying soils and increase the moisture content, which may further increase the corrosion potential.

BOI082750019.DOC/KM 7
TABLE 4 In-Situ Soil Resistivity Data
Check Structure
Pin Spacing (ft)
Resistance (Ω) Multiplier
Average Resistivity
(Ω-cm)a
Layer Depth
(ft)
Layer Resistivity
(Ω-cm) Notes
(substrate, moisture, contact of pins, etc.)
MP 14.27 5 4.5 1 4309 0 – 5 4,309 Native ground at toe of canal
10 2.8 1 5362 5 – 10 7,097 embankment, 7-8 ft below road
15 1.8 1 5171 10 – 15 4,826 silty moist brown soil, excellent
20 1.2 1 4596 15 – 20 3,447 pin contact
MP 15.40 5 3.8 1 3639 0 – 5 3,639 Up-side of canal in native soil,
10 2.0 1 3830 5 – 10 4,043 excellent pin contact in silty soil
15 1.3 1 3734 10 – 15 3,556
20 1.1 1 4213 15 – 20 6,846
MP 16.95 5 6.3 1 6032 0 – 5 6,032 Silty/gravelly canal bank, curved
10 2.8 1 5362 5 – 10 4,826 slightly, good contact; moved pins
15 2.0 1 5745 10 – 15 6,703 to top of canal bank to be better
20 1.5 1 5745 15 – 20 5,745 pin contact
MP 18.06 5 7.6 1 7277 0 – 5 7,277 Native ground at toe of canal
10 3.9 1 7469 5 – 10 7,670 embankment, 6-7 ft below road,
15 2.5 1 7181 10 – 15 6,668 silty brown soil, excellent contact
20 2.0 1 7660 15 – 20 9,575
MP 19.77 5 3.5 1 3351 0 – 5 3,351 Approx 8 ft below canal road on
10 2.9 1 5554 5 – 10 16,198 lower bank, tan dry silt, good
15 2.3 1 6607 10 – 15 10,644 contact of pins, water in canal
20 2.0 1 7660 15 – 20 14,682

BOI082750019.DOC/KM 8
Laboratory Measurements (Resistivity, pH, Sulfates and Chlorides) Three laboratory resistivity results ranged from 2,190 ohm-cm in lean clay, to 2,700 and 2,720 ohm-cm in silt. These laboratory values are in general agreement with the field results in which a lower field resistivity value was measured in the clayey material and somewhat higher resistivity values were measured in silty and sandy materials. Lab results can be lower than field results because of different measurement techniques (the soil resistivity is measured in a box, and thus the density and moisture content may vary from in-situ conditions). The pH of the soils ranged from 6.8 to 7.0. The pH indicates non-acidic soils (greater than 7), which is considered non-corrosive.
Sulfate and chloride test results indicate that the chloride content is less than 5.0 ppm in all five samples tested; the sulfate content ranged from 6.4 to 12.7 ppm (see Table 2 and Appendix C for complete results). These concentrations for sulfate and chloride are low and considered “negligible” for corrosivity.
Seismic Conditions This section provides a brief summary of the area seismicity for the check structure sites. This is a cursory summary and the reader is referred to the report titled, Geotechnical Canal Improvement Project, MP 59.29 Reservoir, by CH2M HILL (2004), which provides more detail of the regional seismic setting, historical seismicity, and seismic source zones for Central Washington.
Seismic Hazards Seismic hazard areas are defined by Washington State Department of Community, Trade and Economic Development (2003) as those that include areas subject to severe risk of damage as a result of earthquake-induced ground shaking, slope failure, settlement, soil liquefaction, or surface faulting. One indicator of potential for future earthquake damage is a record of earthquake damage in the past. In Washington, ground shaking is the primary cause of earthquake damage and the strength of ground shaking is primarily affected by the following:
The magnitude of an earthquake The distance from the source of an earthquake The type of thickness of geologic materials at the surface The type of subsurface geologic structure
Settlement and soil liquefaction conditions occur in areas underlain by cohesionless soils of low density, typically in association with a shallow groundwater table.
Area Seismicity The check structures are located in a region of relatively little historic seismic activity (CH2M HILL, 2004) with few earthquakes having occurred within a 100-kilometer (km) (62-mile) radius of Sunnyside. One moderate earthquake occurred within a 100-km radius of Sunnyside in 1893 (USGS, 2009a). It had a magnitude 4.7 and occurred near Umatilla, Oregon, which is located approximately 44 miles southeast of Sunnyside. An event with a

BOI082750019.DOC/KM 9
magnitude of 4.8 occurred in 1973 located approximately 56 miles northeast of Sunnyside near Othello, Washington. Earthquakes with a magnitude of 4.8 or greater have not been reported by USGS within a 100-km radius of Sunnyside since 1973.
The Yakima County Critical Areas Ordinance (CAO) reports that earthquake activity in Yakima County is mostly marked by low magnitude events and thus has a low seismic risk. The earthquake potential in Yakima County is considered low to moderate. One exception is an area along Toppenish Ridge where Holocene faulting may have produced earthquakes of as much as a magnitude of 7. The rest of the county is relatively low risk for earthquake related damage.
Design earthquake accelerations have been determined from the probabilistic seismic hazard modeling conducted by the United States Geologic Survey (USGS) (USGS, 2009b) and adopted by the Federal Emergency Management Agency (FEMA) (FEMA, 2001), and the International Building Code (IBC) (IBC, 2008). The modeling considers known seismic sources and the maximum credible earthquake and return interval associated with each source, including the Seattle Fault and subduction earthquakes similar to the Nisqually Earthquake.
Site-Specific Seismic Design Parameters The USGS probabilistic study indicates that the peak firm ground acceleration is 0.20 g for an earthquake with a probability of exceedance of 2 percent in 50 years (USGS 2002). The equivalent return period for this seismic event is approximately 2,500 years.
Ground motions at the site will be a function of both the firm-ground acceleration (given above) and the soil response. The soil site class consists of a weighted average of the soil properties (shear wave velocity or standard penetration resistance) in the upper 100 ft. Soils at the project locations were consistently classified as Site Class D, based on the individual subsurface conditions in the upper 100 ft at each site. This is based on the average Standard Penetration Resistance (N) of between 15 and 50 (the average N value in the borings ranges from 17 to 42).
The 2008 IBC provides spectral accelerations for an earthquake with a 2 percent probability of occurrence in 50 years or roughly a 2,500-year recurrence interval. The magnitude of acceleration associated with this event is needed for liquefaction analysis. The mean magnitude for short period accelerations during a 2,500-year earthquake is 6.1. The mean magnitude is based on a deaggregation of the PGA for a 2,500-year event taken from the USGS Web site (USGS, 2002).
Liquefaction Potential Liquefaction is a temporary loss of shear strength in soil that can occur during seismic events of sufficient magnitude to cause a significant increase in pore pressure. Liquefaction generally occurs in clean sandy or silty soils that are saturated and have a loose or very loose consistency. Because of the presence of sandy interbeds within the site soils, there may be areas within the canal levee that are susceptible to liquefy during a long-duration or high-magnitude event.

BOI082750019.DOC/KM 10
A detailed liquefaction analysis of the check structures was not performed as part of the scope of work. However, the liquefaction potential is anticipated to be low in most areas because of the high fines content in most soils (silts and clays). Many of the soils are not anticipated to be saturated year-round, except for locally and during the irrigation season. In addition, the Sunnyside Canal has performed well in the past and has not shown high potential for liquefaction or lateral movement given the area’s recent historical seismicity.
Geotechnical Recommendations This section provides the following geotechnical recommendations for the design and construction of the check structures for the Sunnyside Canal:
Structural Design Parameters Foundation Subgrade Preparation Earthwork and Grading Allowable Bearing Pressures Seepage and Uplift Pressure Analysis Lateral Earth Pressures for Buried Structures Coefficient of Friction Recommended Corrosion Protection
Structural Design Parameters Seismic design parameters were developed in accordance with the International Building Code (2008), as discussed above under the Area Seismicity section. For the current subsurface information available, the check structures should be designed for Site Class D (stiff soil profile), according to IBC requirements for a weighted average of the soil properties (shear wave velocity or standard penetration resistance) in the upper 100 ft. This is based on average Standard Penetration Resistance N values in the borings of 17 to 42 bpf (15≤N≤50 for Site Class D). The corresponding seismic design parameters are summarized in Table 5.
TABLE 5 Seismic Design Parameters
Site Class
Earthquake Magnitude
Peak Horizontal Ground Acceleration on Bedrock
Soil Amplification Factor, Fa
Peak Horizontal Ground Acceleration at Ground Surface
SD 6.1 0.20g 1.41 0.28g
g = The acceleration due to gravity.
The following additional parameters for the maximum considered earthquake (MCE) may be used for structural design:
Short period (0.2s) spectral acceleration, SS = 0.49g; Fa = 1.41 for Site Class SD. Short period (0.2s) spectral response acceleration, SMS = 0.70g for Site Class SD. 1-second period spectral acceleration, S1 = 0.15g; Fv = 2.19 for Site Class SD. 1-second period spectral response acceleration, SM1 = 0.34g for Site Class SD.

BOI082750019.DOC/KM 11
Foundation Subgrade Preparation The project site should be cleared prior to construction by removing riprap, concrete, debris, and removing all vegetation, organic soils, and any other deleterious materials.
Site subgrade material exposed will vary depending on location and depth of excavations. In general, concrete should be placed directly against native undisturbed earth. Soft areas should be excavated to firm bearing soils and replaced with suitable backfill material. Under the check structures, suitable backfill should ideally possess low permeability to help control seepage. If a cavity must be backfilled with soil, the zone should be backfilled with densely compacted native silt or clay soils having a minimum of 50 percent passing the No. 200 sieve size. However, this must be balanced against design needs for sliding friction, bearing capacity, material availability, and so forth, which are probably best met by granular backfill. Because some form of seepage cutoff wall will be installed at each check structure, the need for low permeability backfill is lessened.
Earthwork and Grading Grading or backfill under roads and utilities should consist of granular fill meeting the WSDOT Standard Specifications for Gravel Borrow, Section 9-03.14(1) with gradation altered to limit maximum particle size to 2 inches. The backfill should be placed in uniform layers not exceeding 10 inches in loose thickness. In areas where small hand compaction equipment is required, the backfill should be placed in lifts not exceeding 4 inches in loose thickness. The fill should be compacted to a minimum of 95 percent of the maximum dry density and within 2 percent of optimum moisture content, as determined according to ASTM D698, and should be non-yielding. It is important to note that although this relative compaction is typically easily achieved, it will be difficult if not impossible to achieve if fine-grained subgrade soils are not dewatered, as described below.
Allowable Bearing Pressures Allowable bearing pressures based on the soil types at the canal invert for the various check structure locations are derived from presumptive bearing pressures presented in NAVFAC DM-7.2 (1986) and engineering judgment. For silty soils with an in situ consistency of firm to very stiff, the recommended allowable bearing pressure is approximately 2,000 psf.
It is recommended that a geotechnical engineer observe foundation preparation activities and subgrade conditions. If actual subgrade conditions encountered during construction are different from those observed in the borings, the recommended bearing pressures may need to be revised. Areas of soft or otherwise unsuitable subgrade (that is, soft silt, which may be present at some locations within the canal levee) should be overexcavated and backfilled with suitable material.
Seepage and Uplift Pressure Analysis Seepage analysis is used to evaluate the potential for piping (internal erosion) of soils and possible undermining of the structures by seeping water. Estimated uplift pressures are required for the structural design of the structures.
The flow net method was used to analyze uplift pressures on the downstream sides of the check structures. The seepage analyses are based on design maximum water levels

BOI082750019.DOC/KM 12
upstream of the structures (as indicated on the preliminary drawings and design criteria) with the gates closed and a drained canal downstream. However, it should be noted that this condition is encountered infrequently and is expected to occur only in the rare event of a canal dike failure.
The predominant soil type encountered at the check structures is non-plastic silt with sand. Soil samples show that more than 65 percent of the material typically passes the No. 200 sieve size. This soil type is particularly susceptible to piping (erosion).
Analysis by Flow Net Method Flow nets were developed for the check structures using SLIDE, a two-dimensional finite element program for groundwater analysis by Rocscience, Inc. The flow nets were used to check the exit gradient and uplift pressures under the structures for several cutoff depths assuming full differential head across the structure.
Exit gradient is the gradient at the point where seepage water discharges from under the structure. If soil is unconfined or unprotected by properly graded filter material, piping and quick conditions can begin to develop at exit gradients of about 1.0. Table 6 shows a summary of calculated exit gradients for cutoff depths of 10, 15, and 20 ft for the check structures, along with uplift pressures as explained below.
TABLE 6 Calculated Exit Gradients and Uplift Pressures
Check Structure
Cutoff Depth (ft)
Exit Gradient
Maximum Uplift Pressure (psf) a
Minimum Uplift Pressure (psf) b
MP 14.27 10 1.27 477 37
15 1.20 440 37
20 0.92 367 37
MP 15.40 10 0.10 73 37
15 0.10 37 0
20 0.10 37 0
MP 16.95 10 2.62 428 2
15 2.46 389 2
20 2.21 350 2
MP 18.06 10 1.97 428 39
15 1.90 428 39
20 1.90 428 39
MP 19.77 10 0.61 409 34
15 0.60 409 34
20 0.60 375 34
a Maximum uplift pressure occurs at the point closest to the cutoff wall. b Minimum uplift pressure occurs at the point farthest from the cutoff wall.
An exit gradient of less than 0.5 is typically recommended and provides a factor of safety of 2. However, in the case of MP 16.95 and MP 18.06, the exit gradient with a 20-ft cutoff

BOI082750019.DOC/KM 13
wall is too high (factor of safety <1) and will require either additional cutoff depth, or additional protection measures at the toe of the floor slab. There are several factors to consider that make these estimates conservative. First, the full differential head condition is expected to rarely occur; it is not a long-term condition. Second, the hydraulic conductivity of silt soils is relatively low, and the seepage velocity is not sufficient to erode the soils at the exit point. Third, the flow net analysis assumes saturated, steady-state flow. The field exploration data indicate the subsurface soil profile is not saturated throughout the year. Although water infiltrating from the canal will create a seasonal shallow groundwater table, it may be perched and the entire soil column may not become saturated. In other words, the flow net is providing a conservative estimate of the exit gradient. Still, for structures with an exit gradient greater than 0.75, it is recommended that a riprap apron be placed at the toe of the floor slab of the check structure, to guard against localized piping. Based on the results of the analysis in Table 6, additional ballast (beyond compacted soil backfill) is recommended for check structures at MP 16.95 and MP 18.06. The erosion control measures performed by SVID crews include drilling dowels into the downstream edge of the check structure apron, pouring a 6-inch-thick concrete floor in the canal and applying 4 inches of shotcrete to the downstream embankments for 50 linear feet. These erosion control measures are adequate to act as the additional recommended ballast.
For the uplift pressures shown in Table 6, the pressures act on the bottom of the structures at each location. The pressure distribution varies from the cutoff wall to the downstream toe, and for design purposes a linear pressure distribution between the maximum and minimum can be assumed. The actual uplift pressure at the toe of the concrete apron for each structure will be zero. For all check structures, the pressure distribution in the canal sidewalls should be assumed to vary linearly from the bottom up the banks to zero at the design upstream water elevation.
Lateral Earth Pressure Belowgrade structures must be designed to resist lateral earth pressures. Three states of static soil pressure that can develop on structures, based in general on the amount of movement, include the following:
At-rest state—structures that are restrained from yielding at their tops
Active state—structures that are free to yield at their tops and that freely move away from the backfill (only when the structure is free to move by translation or rotation at least 0.002 times the height of the wall)
Passive state—structures that are free to yield at their tops and that can move toward the backfill (only when the structure is free to move by translation or rotation at least 0.02 times the height of the wall)
For compacted backfill, structures should be designed to resist the lateral earth pressures given as equivalent fluid pressures in psf per foot (psf/ft) of height (H) in either Tables 7 or 8, depending on backfill material type. Structures should be designed to resist surcharge loads of any nearby at-grade structures, material stockpiles, or vehicles. Lateral earth pressure coefficients and equivalent fluid pressures were estimated for imported clean, free-draining crushed rock, and for a silty sand backfill (assumed on-site material). Imported crushed rock was assumed to have a total unit weight of 135 pcf and a friction angle of

BOI082750019.DOC/KM 14
34 degrees. The silt (predominant native material) was assumed to have a unit weight of 115 pcf and a friction angle of 28 degrees.
TABLE 7 Imported Backfill—Lateral Earth Pressure Summary
Horizontal Ground Sloping Ground (2H:1V)
Condition Coefficient* Drained (psf/ft)
Undrained (psf/ft)
Drained (psf/ft)
Undrained (psf/ft)
At-rest 0.44/0.69 60 94 93 112
Active 0.28/0.45 38 83 61 95
Passive 3.54/2.20 478 320 297 222
* Coefficients are listed for horizontal ground/sloping ground. Rankine’s method was used to determine earth pressure coefficients.
TABLE 8 Native Silt Backfill—Lateral Earth Pressure Summary
Horizontal Ground Sloping Ground (2H:1V)
Condition Coefficient* Drained (psf/ft)
Undrained (psf/ft)
Drained (psf/ft)
Undrained (psf/ft)
At-rest 0.50/0.78 61 90 95 106
Active 0.33/0.60 42 81 83 100
Passive 3.0/1.67 318 208 159 135
* Coefficients are listed for horizontal ground/sloping ground. Rankine’s method was used to determine earth pressure coefficients.
Substantial movement must take place before the total available passive pressure is mobilized. A value of passive pressure one-third to one-half of the total passive pressure should be used when calculating resistance to thrust or sliding to limit the amount of movement required. The reduced value depends on the amount of movement allowed by the structural designer.
Coefficient of Friction For cast-in-place concrete bearing on compacted granular backfill (specified above), a friction coefficient of 0.55 should be used to calculate sliding resistance to lateral loads. For footings cast directly on compacted native soil, the friction coefficient is summarized in Table 9 by structure location.

BOI082750019.DOC/KM 15
TABLE 9 Coefficients of Friction on Native Soil
Check Structure Soil Type tan δ
MP 14.27 Silty Sand 0.45
MP 15.40 Silt 0.35
MP 16.95 Silt 0.35
MP 18.06 Silt 0.35
MP 19.77 Silt 0.35
At locations where the sliding friction is too low to resist forces, overexcavation of the silt or clay and backfill with granular soil may be preferable to improve the coefficient of friction and passive lateral resistance. If this approach is used in the design analysis, the potential for shearing and sliding along the granular backfill/native soil interface should be checked to ensure structural stability. An angle of internal friction of 26˚ may be assumed for analyzing shearing and sliding at the granular backfill/native soil interface.
Recommended Corrosion Protection Disturbed soils are known to be corrosive with resistivity values measured at the site. However, previous studies have shown that sheet piles driven into undisturbed soils do not experience significant corrosion, apparently because of more uniform corrosion conditions along the metal surface. Previous studies in similar conditions show corrosion rate of less than 1 mil/year (NBS Monograph 127, NBS Papers on Underground Corrosion of Steel Piling). These corrosion rates are usually associated with metal in the water table fluctuation zone, where oxygen is more frequently introduced to the metal surface. Surfaces below the water table exhibit even lower corrosion rates.
The design life of the check structures is 50 years. Given that the sheet piles will be approximately 3/4-inches thick (750 mils), and assuming a loss of 1 mil/year, this equals a loss of approximately 50 mils over the design life, or approximately 7 percent of the steel. Therefore, based on the findings from the field and laboratory resistivity and pH testing, and considering that the steel sheet piles will be driven into undisturbed soils and should experience minimal corrosion losses, corrosion protection of the sheet piles is not considered necessary.
Other Construction Considerations
Dewatering Dewatering of the construction zones is recommended at sites where saturated fine-grained soils, particularly silts, exist at or near the surface. Previous experience in the area has shown that fine-grained soils may be seasonally saturated and at a natural moisture content that is twice as much as the optimum moisture content for compaction. The soils are expected to be saturated with perched water for several weeks to months following the end

BOI082750019.DOC/KM 16
of irrigation season. If the soils are saturated or near saturation, the soils are expected to soften and “pump” when disturbed; trafficking and earthwork, particularly compaction, will become virtually impossible. To work on or in these saturated soils, they must first be dewatered, and possibly disced or dried before attempting to achieve compaction.
The least expensive method of dewatering the soils is by excavating dewatering trenches to a depth of 5 or 6 ft upstream and downstream of the work zone. If perched groundwater migrates into the work zone from the canal banks, additional trenches along the banks are recommended. It is recommended that these trenches be shown on the construction drawings to ensure the Contractor is aware of the need. If it turns out that the soils are not saturated at the time of construction, excavation of the dewatering trenches can be waived by the construction manager. The drawing notes or specifications should also require sufficient time (up to several weeks) in the construction schedule to allow the soils in the construction zone to drain.
Sheet Pile Driving Driving tips are recommended for driving sheet piles to construct the cut-off walls. Z-section sheet piles are recommended to prevent sheet pile damage during driving into the gravels. Some relatively thin layers of caliche were also encountered that may damage sheet piles. The determination of whether to drive the sheet piles with a vibratory hammer or an impact hammer, and selection of the appropriate sheet pile section for the subsurface conditions should be left up to the Contractor.
Construction Access Construction access to each of the check structures will be from the Sunnyside Canal road.
Stockpile and Staging Areas Stockpile and staging areas are available nearby each of the check structures. Additional staging areas should be identified if needed for construction.
Waste Area The Contractor will be responsible for locating suitable disposal sites as required to perform the work.
References
CH2M HILL. 2004. Geotechnical Design Report Sunnyside Canal Improvement Project, MP 59.29 Reservoir. Prepared for the Sunnyside Division Board of Control. August.
Federal Emergency Management Agency. 2001. NEHRP Recommended Provisions for Seismic Regulations for New Buildings and Other Structures. 2001 Edition.
International Building Code. 2008. Published by the International Code Council.
Reidel, S. P., and Fecht, K. R. 1994. Geologic Map of the Richland 1:100,000 Quadrangle, Washington. Washington Division of Geology and Earth Resources Open File Report 94-8.

BOI082750019.DOC/KM 17
Schuster, J. E. 1994. Geologic Map of the East Half of the Toppenish 1:100,000 Quadrangle, Washington. Washington Division of Geology and Earth Resources Open File Report 94-10.
United States Department of the Navy (NAVFAC). 1986. DM-7.02, Foundations and Earth Structures, Change 1. Naval Facilities Engineering Command. September.
U. S. Geological Survey. 2009b. National Seismic Hazard Mapping Project Home Page. http://eqhazmaps.usgs.gov/. Accessed May 2009.
U.S. Geological Survey. 2009a. Historical Worldwide Earthquake Database. http://neic.usgs.gov/seis/epic/. Earthquakes Hazards Program. Accessed May 2009.
Washington State Department of Community, Trade and Economic Development. 2003. Critical Areas Assistance Handbook: Protecting Critical Areas Within the Framework of the Washington Growth Management Act.

Appendix A
Site Plans


Appendix B
Boring Logs

Silty Sand (SM)brown, moist, very loose, with ~35-45% fines
Silty Sand (SM)brown, wet, very loose, with ~35-50% fines, rapidlydilatent
Silt With Sand (ML)brown, moist, firm, nonplastic, with ~10-15% very finesand
1.0
Silty Sand (SM)similar to SS-3
1.5
1.5
RECOVERY (ft)
SS-4
SS-3
SS-2
SS-1
2-2-2(4)
1-2-2(4)
CME Autohammer
3-2-3(5)
2-2-3(5)
5.0
21.5
20.0
16.5
15.0
11.5
6.5
Driller notes contact with gravel at 24.0'
Measured water in borehole at 18.0' bgs after~10 min. rest
PP = 2.5, 2.75 tsf
No liners used140# SPT
10.0
SOIL NAME, USCS GROUP SYMBOL, COLOR,MOISTURE CONTENT, RELATIVE DENSITY OR
CONSISTENCY, SOIL STRUCTURE, MINERALOGY
PROJECT : SVID Check Structures 2009
END : 5/6/2009START : 5/6/2009
BORING NUMBER:
1.0
LOGGER : J. Butler, P.E.WATER LEVELS : 18.0 ft bgs
SHEET 1 OF 2
DEPTH OF CASING, DRILLING RATE,DRILLING FLUID LOSS, TESTS, AND
INSTRUMENTATION
SOIL BORING LOG
878.2
873.2
868.2
863.2
858.2
SY
MB
OLI
C L
OG
5
10
15
20
25
SOIL DESCRIPTION
PROJECT NUMBER:
6"-6"-6"(N)
#TYPE
DRILLING EQUIPMENT AND METHOD : CME 75 Truck Rig, (8" O.D. HSA)
371479.06.02
INTERVAL (ft)
CDB-14.27
DEPTH BELOW EXISTING GRADE (ft)
ELEVATION : 878.2 ft
STANDARDPENETRATIONTEST RESULTS
LOCATION : (396056.0 N, 1701014.0 E)
DRILLING CONTRACTOR : Haz Tech Drilling (D. Gonzales)
COMMENTS

Lean Clay Layers interbedded with Sandy Clay (CL)light tan, moist, hard, low to medium plasticity
0.4
Bottom of Boring at 41.5 ft bgs on 5/6/2009
Poorly Graded Gravel With Clay And Sand (GP-GC)dark gray, wet, very dense, coarse grained, wellrounded, mixed lithology
Clayey Gravel With Sand (GC)dark gray, wet, dense, ~15-20% fines, 25% sand,gravel fine to coarse and well rounded [Alluvium]
Poorly Graded Sand With Gravel (SP)dark gray, wet, loose, fine to coarse grained, with ~30%fine rounded gravel [Alluvium]
1.2
RECOVERY (ft)
SS-8
SS-7
SS-6
SS-5
9-19-22(41)
Driller notes out of gravel at 37.0'
50/5(50/5")
2-22-27(49)
4-2-4(6)
30.0
0.4
41.5
40.0
36.5
31.5
SS-5 no sample retained26.5
25.0
Boring backfilled with 3/8" bentonite chip
PP = 3.5, 3.75 tsf
35.0
SOIL NAME, USCS GROUP SYMBOL, COLOR,MOISTURE CONTENT, RELATIVE DENSITY OR
CONSISTENCY, SOIL STRUCTURE, MINERALOGY
PROJECT : SVID Check Structures 2009
END : 5/6/2009START : 5/6/2009
BORING NUMBER:
1.5
LOGGER : J. Butler, P.E.WATER LEVELS : 18.0 ft bgs
SHEET 2 OF 2
DEPTH OF CASING, DRILLING RATE,DRILLING FLUID LOSS, TESTS, AND
INSTRUMENTATION
SOIL BORING LOG
853.2
848.2
843.2
838.2
833.2
SY
MB
OLI
C L
OG
30
35
40
45
50
SOIL DESCRIPTION
6"-6"-6"(N)
PROJECT NUMBER:
COMMENTS
DRILLING EQUIPMENT AND METHOD : CME 75 Truck Rig, (8" O.D. HSA)
CDB-14.27371479.06.02
ELEVATION : 878.2 ft
INTERVAL (ft)
DEPTH BELOW EXISTING GRADE (ft)
#TYPE
LOCATION : (396056.0 N, 1701014.0 E)
DRILLING CONTRACTOR : Haz Tech Drilling (D. Gonzales)
STANDARDPENETRATIONTEST RESULTS

Silt (ML)brown, slightly moist, soft, with ~10% fine sand
Silt With Sand (ML)20.0-20.5' - similar to SS-3, then20.5-21.5' - Lean Clay (CL), tan-brown, moist to wet,firm to stiff, low plasticity, homogeneous
1.5Silt (ML)brown, moist to wet, stiff to very stiff, low to no plasticity,homogeneous
Silt With Sand (ML)brown, wet, very stiff, nonplastic, with 15% very finesand, homogeneous
1.0
RECOVERY (ft)
SS-4
SS-3
SS-2
SS-1
21.5
5-10-11(21)
5-10-11(21)
CME Autohammer
4-5-9(14)
2-1-2(3)
PP = 1.75, 1.75, 1.75 tsf20.0
16.5
15.0
11.5
10.0
5.0
PP = 3.0, 2.75, 3.0 tsf
Measured water at 14.2' bgs in borehole after~10 min. pause in drilling
PP = 3.5, 3.0, 3.0 tsf
PP = 2.5, 3.0, 3.0 tsf
No sample liners140# SPT
6.5
SOIL NAME, USCS GROUP SYMBOL, COLOR,MOISTURE CONTENT, RELATIVE DENSITY OR
CONSISTENCY, SOIL STRUCTURE, MINERALOGY
PROJECT : SVID Check Structures 2009
END : 5/6/2009START : 5/6/2009
BORING NUMBER:
1.5
LOGGER : J. Butler, P.E.WATER LEVELS : 14.2 ft bgs
SHEET 1 OF 2
DEPTH OF CASING, DRILLING RATE,DRILLING FLUID LOSS, TESTS, AND
INSTRUMENTATION
SOIL BORING LOG
875.5
870.5
865.5
860.5
855.5
SY
MB
OLI
C L
OG
5
10
15
20
25
SOIL DESCRIPTION
PROJECT NUMBER:
6"-6"-6"(N)
1.5
#TYPE
DRILLING EQUIPMENT AND METHOD : CME 75 Truck Rig, (8" O.D. HSA)
371479.06.02
INTERVAL (ft)
CDB-15.40
DEPTH BELOW EXISTING GRADE (ft)
ELEVATION : 875.5 ft
STANDARDPENETRATIONTEST RESULTS
LOCATION : (391978.0 N, 1700916.0 E)
DRILLING CONTRACTOR : Haz Tech Drilling (D. Gonzales)
COMMENTS

Bottom of Boring at 41.5 ft bgs on 5/6/2009
1.5
SS-5
Lean Clay with Sand (CL) To Sandy Lean Clay (CL)grey and brown, moist, hard, nonplastic, with ~20-30%very fine sand, not calcified like SS-7, brittle
Caliche, As Lean Clay With Sand (CL)light white-tan, moist, hard
Lean Clay (CL)tan-brown, moist to wet, stiff, low to medium plasticity,homogeneous30.8-31.1 - Silt (ML), brown, wet, slow dilatancy
Lean Clay (CL)25.0-26.0' - similar to SS-4, then26.0-26.5' - Silt (ML), brown, wet, very stiff, nonplastic
1.5
1.5
RECOVERY (ft)
SS-8
SS-7
SS-6
10-20-40(60)
PP = 1.5, 1.5, 2.0 tsf
7-20-38(58)
4-6-11(17)
2-7-13(20)
31.5
1.5
41.5
40.0
35.0
PP = 1.75, 2.0, 2.5 tsf
30.0
26.5
25.0
Boring backfilled with 3/8" bentonite chip
36.5
SOIL NAME, USCS GROUP SYMBOL, COLOR,MOISTURE CONTENT, RELATIVE DENSITY OR
CONSISTENCY, SOIL STRUCTURE, MINERALOGY
PROJECT : SVID Check Structures 2009
END : 5/6/2009START : 5/6/2009 LOGGER : J. Butler, P.E.
BORING NUMBER:
SY
MB
OLI
C L
OG
WATER LEVELS : 14.2 ft bgs
SHEET 2 OF 2
DEPTH OF CASING, DRILLING RATE,DRILLING FLUID LOSS, TESTS, AND
INSTRUMENTATION
SOIL BORING LOG
30
35
40
45
50
850.5
845.5
840.5
835.5
830.5
PROJECT NUMBER:
INTERVAL (ft)
SOIL DESCRIPTION
ELEVATION : 875.5 ft
DRILLING EQUIPMENT AND METHOD : CME 75 Truck Rig, (8" O.D. HSA)
CDB-15.40
6"-6"-6"(N)
371479.06.02
COMMENTSDEPTH BELOW EXISTING GRADE (ft) STANDARDPENETRATIONTEST RESULTS
LOCATION : (391978.0 N, 1700916.0 E)
DRILLING CONTRACTOR : Haz Tech Drilling (D. Gonzales)
#TYPE

Silt To Silt With Sand (ML)brown, moist, firm, with ~5% very fine and coarse sand,homogeneous
Poorly Graded Sand With Silt (SP-SM)brown to orange-brown, moist to wet, very dense, with~5% fines and few fine gravels, also has a couple ashinclusions
1.5Silt To Silt With Sand (ML)Similar to SS-1 except brown, wet, firm, some zonesstiff, others soft and slowly dilatant, nonplastic
Silt With Sand (ML)tan-brown, moist to wet, stiff
1.2
RECOVERY (ft)
SS-4
SS-3
SS-2
SS-1
21.5
4-6-7(13)
17-35-30(65)
CME Autohammer
2-4-4(8)
4-3-4(7)
SS-4 has ~3" heave in top of spoon20.0
16.5
15.0
11.5
10.0
5.0
Driller notes slightly stiffer material at ~18.0'
Water at 17.0' after 10 minute pause
PP = 2.25, 2.25, 1.75 tsf
PP = 1.0, 2.0, 1.5 tsf
No sample liners140# SPT
6.5
SOIL NAME, USCS GROUP SYMBOL, COLOR,MOISTURE CONTENT, RELATIVE DENSITY OR
CONSISTENCY, SOIL STRUCTURE, MINERALOGY
PROJECT : SVID Check Structures 2009
END : 5/6/2009START : 5/6/2009
BORING NUMBER:
1.5
LOGGER : J. Butler, P.E.WATER LEVELS : 17.0 ft bgs
SHEET 1 OF 2
DEPTH OF CASING, DRILLING RATE,DRILLING FLUID LOSS, TESTS, AND
INSTRUMENTATION
SOIL BORING LOG
874.5
869.5
864.5
859.5
854.5
SY
MB
OLI
C L
OG
5
10
15
20
25
SOIL DESCRIPTION
PROJECT NUMBER:
6"-6"-6"(N)
1.3
#TYPE
DRILLING EQUIPMENT AND METHOD : CME 75 Truck Rig, (8" O.D. HSA)
371479.06.02
INTERVAL (ft)
CDB-16-95
DEPTH BELOW EXISTING GRADE (ft)
ELEVATION : 874.5 ft
STANDARDPENETRATIONTEST RESULTS
LOCATION : (389501.0 N, 1703323.0 E)
DRILLING CONTRACTOR : Haz Tech Drilling (D. Gonzales)
COMMENTS

Bottom of Boring at 41.5 ft bgs on 5/6/2009
SS-5
Poorly Graded Sand With Silt (SP-SM)Similar to SS-7
Poorly Graded Sand With Silt (SP-SM)Similar to SS-6
Poorly Graded Sand With Silt (SP-SM)orange-brown, moist to wet, dense, homogeneous,medium and coarse grained, ~5% fines
Poorly Graded Sand With Silt (SP-SM)Similar to SS-4 except homogeneous and little or nogravels
1.2
1.3
RECOVERY (ft)
1.0
SS-8
SS-7
SS-6
10-20-20(40)
SS-6, SS-7 and SS-8 combined
13-23-25(48)
18-19-20(39)
22-50/6(50/6")
35.0
41.5
36.5
1.431.5
30.0
26.5
25.0
Boring backfilled with 3/8" bentonite chip
40.0
SOIL NAME, USCS GROUP SYMBOL, COLOR,MOISTURE CONTENT, RELATIVE DENSITY OR
CONSISTENCY, SOIL STRUCTURE, MINERALOGY
PROJECT : SVID Check Structures 2009
END : 5/6/2009START : 5/6/2009 LOGGER : J. Butler, P.E.
BORING NUMBER:
SY
MB
OLI
C L
OG
WATER LEVELS : 17.0 ft bgs
SHEET 2 OF 2
DEPTH OF CASING, DRILLING RATE,DRILLING FLUID LOSS, TESTS, AND
INSTRUMENTATION
SOIL BORING LOG
30
35
40
45
50
849.5
844.5
839.5
834.5
829.5
PROJECT NUMBER:
INTERVAL (ft)
SOIL DESCRIPTION
ELEVATION : 874.5 ft
DRILLING EQUIPMENT AND METHOD : CME 75 Truck Rig, (8" O.D. HSA)
CDB-16-95
6"-6"-6"(N)
371479.06.02
COMMENTSDEPTH BELOW EXISTING GRADE (ft) STANDARDPENETRATIONTEST RESULTS
LOCATION : (389501.0 N, 1703323.0 E)
DRILLING CONTRACTOR : Haz Tech Drilling (D. Gonzales)
#TYPE

Silt (ML)brown, moist, firm, low to no plasticity
Silt (ML)tan-brown, moist to wet, stiff to very stiff, low plasticity,with ~5% very fine sand; very slightly micaceous,homogeneous
1.5Silt (ML)brown, wet, firm, low to no plasticity, with ~5% very finesand
Silt With Sand (ML)brown to tan-brown, wet, very stiff, with ~15% very finesand; some mica flakes (<5%)
1.5
RECOVERY (ft)
SS-4
SS-3
SS-2
SS-1
21.5
4-6-9(15)
1-3-12(15)
CME Autohammer
1-2-5(7)
2-3-4(7)
PP = 1.25, 1.0, 1.25 tsf20.0
16.5
15.0
11.5
10.0
5.0
Water in borehole at 17.2' after ~10 min.pause from drilling
PP = 1.25, 1.75, 1.75 tsf
PP = 0.75, 1.25 tsf
PP = 1.25, 1.0, 1.0 tsf
No liners used140# SPT
6.5
SOIL NAME, USCS GROUP SYMBOL, COLOR,MOISTURE CONTENT, RELATIVE DENSITY OR
CONSISTENCY, SOIL STRUCTURE, MINERALOGY
PROJECT : SVID Check Structures 2009
END : 5/5/2009START : 5/5/2009
BORING NUMBER:
1.5
LOGGER : J. Butler, P.E.WATER LEVELS : 17.2 ft bgs
SHEET 1 OF 2
DEPTH OF CASING, DRILLING RATE,DRILLING FLUID LOSS, TESTS, AND
INSTRUMENTATION
SOIL BORING LOG
873.7
868.7
863.7
858.7
853.7
SY
MB
OLI
C L
OG
5
10
15
20
25
SOIL DESCRIPTION
PROJECT NUMBER:
6"-6"-6"(N)
1.4
#TYPE
DRILLING EQUIPMENT AND METHOD : CME 75 Truck Rig, (8" O.D. HSA)
371479.06.02
INTERVAL (ft)
CDB-18.06
DEPTH BELOW EXISTING GRADE (ft)
ELEVATION : 873.7 ft
STANDARDPENETRATIONTEST RESULTS
LOCATION : (391025.0 N, 1708146.0 E)
DRILLING CONTRACTOR : Haz Tech Drilling (D. Gonzales)
COMMENTS

Bottom of Boring at 41.5 ft bgs on
0.5
SS-5
Mixed Gravely Alluviumprimarily well-rounded large (1-3") gravels, mixedlithology, except for basalt chip in bottom of shoe
Poorly Graded Sand (SP)Similar to SS-6 except for thin orange oxidation bands,~horizontally banded in sample every 1/4 to 1/2 inch
Poorly Graded Sand (SP)tan-brown, moist, dense, medium grained, <5% fines,homogeneous, except for one large rounded quartzitegravel in mid-sample
Silt (ML)25.0-26.1' - Similar to SS-426.1-26.5' - Silt (ML), hard, orange-brown, with fewfine gravel pieces (BASALT)
1.5
1.4
RECOVERY (ft)
SS-8
SS-7
SS-6
22-50/2(50/2")
Driller notes increasing gravel and harderbelow ~27 or 28'
7-22-27(49)
14-22-26(48)
3-10-18(28)
31.5
1.5
41.5
40.0
35.0
PP = 3.25, 1.0, 0.75-1.75 tsf
30.0
26.5
25.0
Boring backfilled with 3/8" bentonite chip
36.5
SOIL NAME, USCS GROUP SYMBOL, COLOR,MOISTURE CONTENT, RELATIVE DENSITY OR
CONSISTENCY, SOIL STRUCTURE, MINERALOGY
PROJECT : SVID Check Structures 2009
END : 5/5/2009START : 5/5/2009 LOGGER : J. Butler, P.E.
BORING NUMBER:
SY
MB
OLI
C L
OG
WATER LEVELS : 17.2 ft bgs
SHEET 2 OF 2
DEPTH OF CASING, DRILLING RATE,DRILLING FLUID LOSS, TESTS, AND
INSTRUMENTATION
SOIL BORING LOG
30
35
40
45
50
848.7
843.7
838.7
833.7
828.7
PROJECT NUMBER:
INTERVAL (ft)
SOIL DESCRIPTION
ELEVATION : 873.7 ft
DRILLING EQUIPMENT AND METHOD : CME 75 Truck Rig, (8" O.D. HSA)
CDB-18.06
6"-6"-6"(N)
371479.06.02
COMMENTSDEPTH BELOW EXISTING GRADE (ft) STANDARDPENETRATIONTEST RESULTS
LOCATION : (391025.0 N, 1708146.0 E)
DRILLING CONTRACTOR : Haz Tech Drilling (D. Gonzales)
#TYPE
6.5
21.5
20.0
16.5
15.0
140# SPT
10.0
5.0
1.75, 1.25, 075 tsf
PP = 1.0, 0.75, 1.0 tsf
Water measured in borehole at 13.6' after 10min. pause
PP = 0.5, 0.25, 0.5 tsf
11.5
Silt (ML)brown, wet, very soft, low plasticity, little or no sand,slow dilatancy, homogeneous
RECOVERY (ft)
Silt (ML)Similar to SS-2 except soft to firm, some zones (0.2-0.4'thick) are more plastic (still low plasticity) others lessand slow dilatancy
Silt (ML)brown, moist to wet, soft, low to no plasticity, 5 to 10%fine sand
CME Autohammer
Silt (ML)brown, moist to wet, stiff, low plasticity, little or no sand[native soils]
No sample liners
1.5
1.5
1.5
1.5
4-5-7(12)
1-2-3(5)
0-0-0(0)
1-1-2(3)
SOIL NAME, USCS GROUP SYMBOL, COLOR,MOISTURE CONTENT, RELATIVE DENSITY OR
CONSISTENCY, SOIL STRUCTURE, MINERALOGY
PROJECT : SVID Check Structures 2009
END : 5/5/2009START : 5/5/2009
BORING NUMBER:
LOGGER : J. Butler, P.E.WATER LEVELS : 13.5 ft bgs
SHEET 1 OF 2
DEPTH OF CASING, DRILLING RATE,DRILLING FLUID LOSS, TESTS, AND
INSTRUMENTATION
SOIL BORING LOG
869.1
864.1
859.1
854.1
849.1
SY
MB
OLI
C L
OG
5
10
15
20
25
SS-4
SS-3
SS-2
SOIL DESCRIPTION
PROJECT NUMBER:
6"-6"-6"(N)
LOCATION : (388398.0 N, 1712752.0 E)
DRILLING EQUIPMENT AND METHOD : CME 75 Truck Rig, (8" O.D. HSA)
CDB-19.77371479.06.02
ELEVATION : 869.1 ft
COMMENTSDEPTH BELOW EXISTING GRADE (ft) STANDARDPENETRATIONTEST RESULTSINTERVAL (ft)
DRILLING CONTRACTOR : Haz Tech Drilling (D. Gonzales)
SS-1
#TYPE

35.0
40.5
36.5
31.5
30.0
26.5
25.0
Boring backfilled with 3/8" bentonite chip
40.0
Bottom of Boring at 40.5 ft bgs on
RECOVERY (ft)
Mixed Alluviumconsisting of Poorly Graded Sand and Gravel, mixedlithology, oxidized, with ~10% fines
Poorly Graded Sand (SP)Similar to SS-6 except white-gray with some oxidizedorangish zones
Poorly Graded Sand (SP)orange-gray, moist, dense, medium to coarse grained,with one well rounded 1" gravel piece
Silt To Lean Clay (ML)brown to tan brown, moist to wet, stiff to very stiff, low tomedium plasticity, homogeneous
0.5
Driller notes gravel at 28.0'
1.4
1.4
1.5
50/5(50/5")
6-16-23(39)
10-20-17(37)
4-6-10(16)
2.0, 1.5, 1.25 tsf
SOIL NAME, USCS GROUP SYMBOL, COLOR,MOISTURE CONTENT, RELATIVE DENSITY OR
CONSISTENCY, SOIL STRUCTURE, MINERALOGY
PROJECT : SVID Check Structures 2009
END : 5/5/2009START : 5/5/2009 LOGGER : J. Butler, P.E.
SS-5
BORING NUMBER:
SY
MB
OLI
C L
OG
WATER LEVELS : 13.5 ft bgs
SHEET 2 OF 2
DEPTH OF CASING, DRILLING RATE,DRILLING FLUID LOSS, TESTS, AND
INSTRUMENTATION
SOIL BORING LOG
30
35
40
45
50
844.1
839.1
834.1
829.1
824.1
INTERVAL (ft)
SOIL DESCRIPTION
PROJECT NUMBER:
6"-6"-6"(N)
STANDARDPENETRATIONTEST RESULTS
DRILLING EQUIPMENT AND METHOD : CME 75 Truck Rig, (8" O.D. HSA)
CDB-19.77371479.06.02
ELEVATION : 869.1 ft
COMMENTS
#TYPE
SS-8
LOCATION : (388398.0 N, 1712752.0 E)
DRILLING CONTRACTOR : Haz Tech Drilling (D. Gonzales)
SS-6
SS-7
DEPTH BELOW EXISTING GRADE (ft)

Appendix C
Laboratory Results

Moisture Content and Percent Finer than No. 200 SieveASTM D 2216 and ASTM D 1140
Project Sunnyside Check Structures Date July 2, 2009
Work Order# 1500-ID1 Tech. J Peters
Client CH2M Hill
Laboratory Number 2186 2187 2188 2189 2190 2191 2192 2193
CDB 14.27 CDB 15.40 CDB 15.40 CDB 15.40 CDB 16.95 CDB 18.06 CDB 19.77 CDB 19.77
SS-1,2,3 SS-1 SS-4 SS-4,5,6 SS-3 SS-2,3,4 SS-1,2 SS-4,5
5' - 15' 5' 20' 20' - 30' 15' 10' - 20' 10' - 20' 20' - 25'
Sample Wet Mass 395.1 375.0 423.0 347.2 178.8 1883.3 370.5 1699.3
Sample Dry Mass 324.1 310.4 335.6 275.1 148.4 1502.7 292.7 1330.7
Dry Mass Before Wash 183.0 134.3 125.1 161.4 125.7
Dry Mass After Wash 38.9 36.8 32.1 16.4 45.8
Mass. Passing 200(Wash) Sieve 1.2 2.3 0.8 0.5 0.2
Mass Passing No. 200 142.9 95.2 92.2 144.5 79.7
Moisture Content (%) 21.9% 20.8% 26.0% 26.2% 20.5% 25.3% 26.6% 27.7%
Passing No. 200 (%) 78.1% 70.9% 73.7% 89.5% 63.4%
Laboratory Number 2194
GTB-1
SS-1,2,3
Location of Sample 5' - 15'
Sample Wet Mass 282.7
Sample Dry Mass 228.1
Dry Mass Before Wash 125.2
Dry Mass After Wash 38.0
Mass. Passing 200(Wash) Sieve 2.3
Mass Passing No. 200 84.9
Moisture Content (%) 23.9%
Passing No. 200 (%) 67.8%
Location of Sample
GeoTek, Inc. - Idaho


Project: Sunnyside Check Structures
Test Results
AASHTO T-288, T-289
09-0316 CDB 19.77 SS-4,5 2720 6.8 73.8
Reviewed By:
American Geotechnics5260 Chinden Blvd.Boise, Idaho 83714Phone:(208) 658-8700Fax: (208) 658-8703
Report to: Geotek Inc.Report Date: 7/2/09Project No.: 04B-M783.75
Material InformationDate Sampled: N.A.
Sampled By: GeotekDate Received: 7/1/09
Date Tested: 7/2/2009
Soil Resistivity and pH for Corrosion Testing
MinimumResistivity
Lab Number Sample ID Ohm/cm pH @ Temp, F°09-0314 CDB 15.40 SS-4,5,6 2190 7.0 73.5
09-0315 CDB 18.06 SS-2,3,4 2700 6.9 73.6
American Geotechnics 1 of 1


