S1
Supplementary Information
for
Synthesis, crystal structure from PXRD of a MnII(purp)2 complex, interaction
with DNA at different temperature, pH and lack of stimulated ROS formation
by the complex
Bitapi Mandal, Soumen Singha, Sanjay Kumar Dey, Swagata Mazumdar, Parimal
Karmakar, Tapan Kumar Mondal, Sanjay Kumar, Saurabh Das*
Experimental:
Determination of stoichiometry of the MnII complex of purpurin (LH3)
Mole-ratio method:
Concentration of MnII was constant while LH3 was varied and vice-versa. The change in
absorbance was measured at 513 nm and plotted against ratio of LH3 to MnII [Fig. S1(a)] and
ratio of MnII to LH3 [Fig. S1(b)]. Straight lines were obtained whose intersection helped to
determine stoichiometry of the complex formed in solution.
Job’s method of continuous variation:
Stoichiometry was also determined by continuously varying the concentrations of both ligand
and the metal ion [Fig. S1(c)].
Electronic Supplementary Material (ESI) for RSC Advances.This journal is © The Royal Society of Chemistry 2016
S2
Fig. S1: (a) and (b): Mole-ratio plot showing the interaction of MnII with purpurin in solution at
neutral pH; (c): Job’s plot of continuous variation showing the interaction of MnII with
purpurin at neutral pH. (d) Spectrophotometric titration of purpurin in the presence of
MnII in the ratio 2:1 as shown by the variation of absorbance at 513 nm; [NaNO3] = 100
mM, T = 298 K.
Both methods suggest the formation of a 1:2 metal-ligand complex at neutral pH.
43210
2
1.5
1
0.5
0
[TL/TM]TM
Abs o
rban
ce
1.210.80.60.40.20
0.32
0.24
0.16
0.08
(TM/TL)TL
Abso
rban
ce
108642
0.5
0.4
0.3
0.2
0.1
0
pH
Abso
rban
ce
4.543.532.52
1.6
1.4
1.2
1
0.8
Volume of purpurin
Abso
rban
ce
Volume of Mn(II) 3.0 2.5 2.0 1.5 1.0 0.5
S3
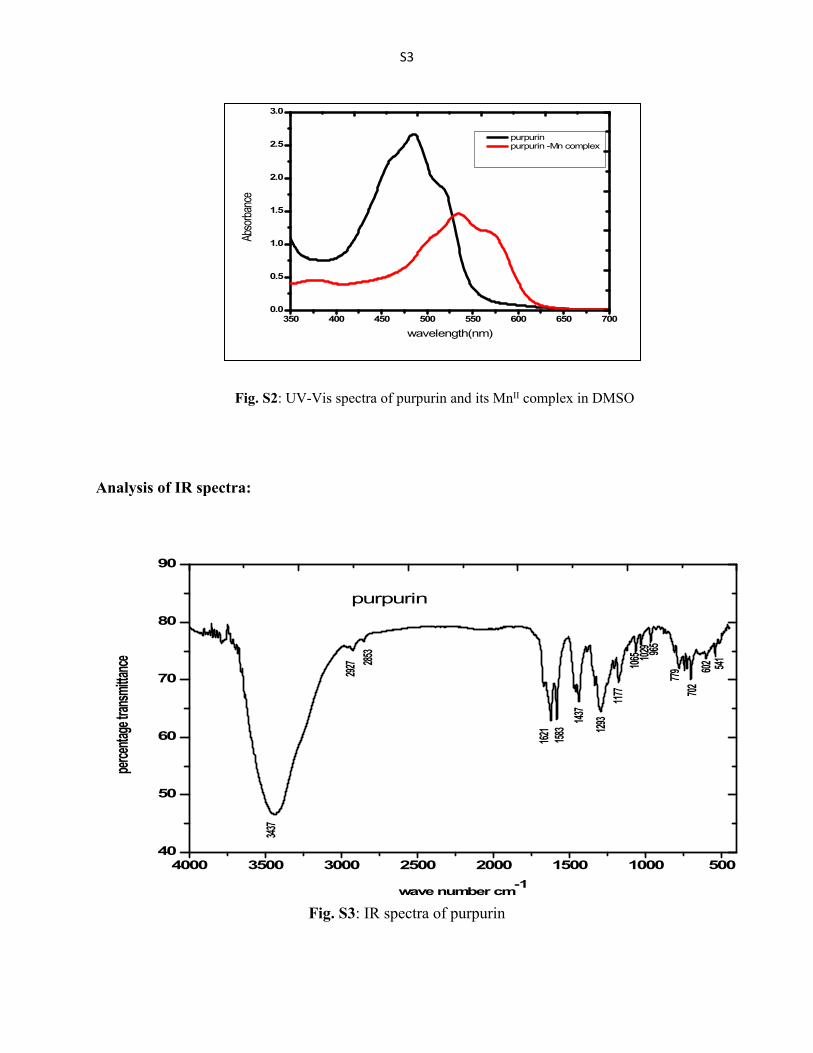
Fig. S2: UV-Vis spectra of purpurin and its MnII complex in DMSO
Analysis of IR spectra:
4000 3500 3000 2500 2000 1500 1000 50040
50
60
70
80
90
percen
tage tr
ansmit
tance
wave number cm-1
purpurin
3437
2927 285
3
1621
1583 143
7
1293
1177
1065 102
9 965
702779 602 541
Fig. S3: IR spectra of purpurin
350 400 450 500 550 600 650 7000.0
0.5
1.0
1.5
2.0
2.5
3.0
Abso
rbanc
e
wavelength(nm)
purpurin purpurin -Mn complex
S4
4000 3500 3000 2500 2000 1500 1000 500
40
50
60
70
80
90
100
percen
tage tr
ansmit
tance
wave number cm-1
Mn-purpurin complex
3418
1615
1563
1465
1323
1272
1220
1164 107
4103
0981
846777
701616
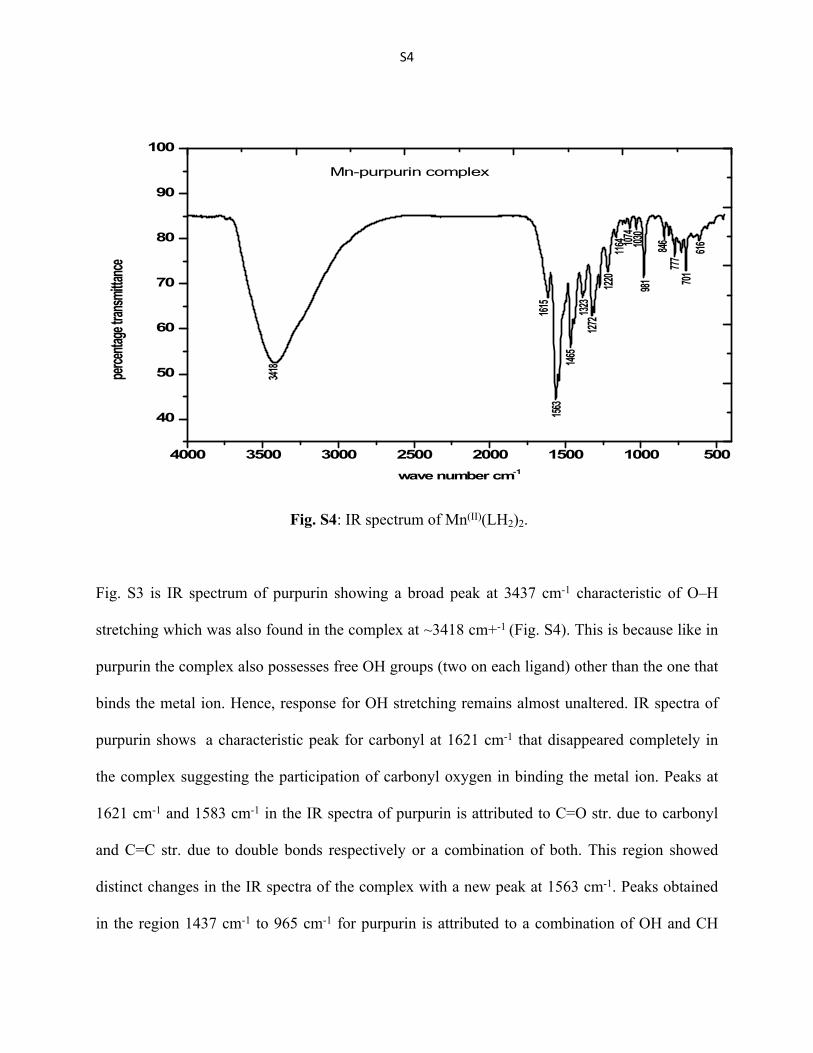
Fig. S4: IR spectrum of Mn(II)(LH2)2.
Fig. S3 is IR spectrum of purpurin showing a broad peak at 3437 cm-1 characteristic of O–H
stretching which was also found in the complex at ~3418 cm+-1 (Fig. S4). This is because like in
purpurin the complex also possesses free OH groups (two on each ligand) other than the one that
binds the metal ion. Hence, response for OH stretching remains almost unaltered. IR spectra of
purpurin shows a characteristic peak for carbonyl at 1621 cm-1 that disappeared completely in
the complex suggesting the participation of carbonyl oxygen in binding the metal ion. Peaks at
1621 cm-1 and 1583 cm-1 in the IR spectra of purpurin is attributed to C=O str. due to carbonyl
and C=C str. due to double bonds respectively or a combination of both. This region showed
distinct changes in the IR spectra of the complex with a new peak at 1563 cm-1. Peaks obtained
in the region 1437 cm-1 to 965 cm-1 for purpurin is attributed to a combination of OH and CH
S5
bending modes. Nature of peaks in this region is different in the complex. New peaks were found
at 981 cm-1 and 701 cm-1 indicating the formation of an Mn─O bond.
Mass Spectrum:
Fig. S5: Mass spectrum of Mn(II)(LH2)2
Analysis of Mass spectrum:
The molecular ion peak was detected at m/z = 565.88 and 566.89 (m/ztheo = 565.32). The peak
found at m/z = 485.19 corresponds to the fragment formed from the molecular ion by loss of a
butadiene unit (from anyone of the ligands), an OH group and an unbound carbonyl oxygen. The
peak at m/z = 413.18 corresponds to the fragment formed by loss of two butadiene units (one
from each ligand), three hydroxyl groups and four aromatic hydrogens from the molecular ion.
Elimination of two carbonyl oxygen along with a hydroxyl group from the molecular ion
provides a peak at m/z = 507.17 or 508.18. The peak at m/z = 256.98, is that of a purpurin that
S6
breaks away from the complex. The other portion i.e. MnII bound to only one purpurin was also
found at m/z = 311.3.
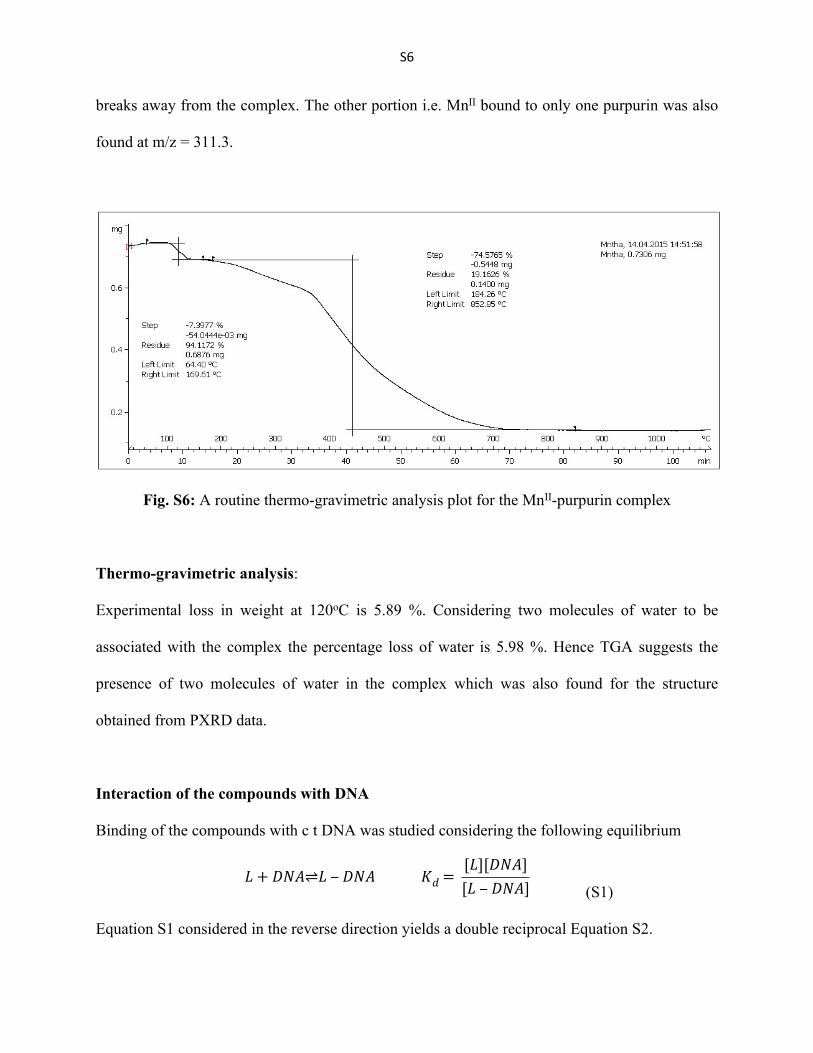
Fig. S6: A routine thermo-gravimetric analysis plot for the MnII-purpurin complex
Thermo-gravimetric analysis:
Experimental loss in weight at 120oC is 5.89 %. Considering two molecules of water to be
associated with the complex the percentage loss of water is 5.98 %. Hence TGA suggests the
presence of two molecules of water in the complex which was also found for the structure
obtained from PXRD data.
Interaction of the compounds with DNA
Binding of the compounds with c t DNA was studied considering the following equilibrium
(S1)𝐿 + 𝐷𝑁𝐴⇌𝐿 ‒ 𝐷𝑁𝐴 𝐾𝑑 =
[𝐿][𝐷𝑁𝐴][𝐿 ‒ 𝐷𝑁𝐴]
Equation S1 considered in the reverse direction yields a double reciprocal Equation S2.
S7
(S2)
1Δ𝐴
=1
Δ𝐴𝑚𝑎𝑥 +
𝐾𝑑
Δ𝐴𝑚𝑎𝑥(𝐶𝐷 ‒ 𝐶𝐿)
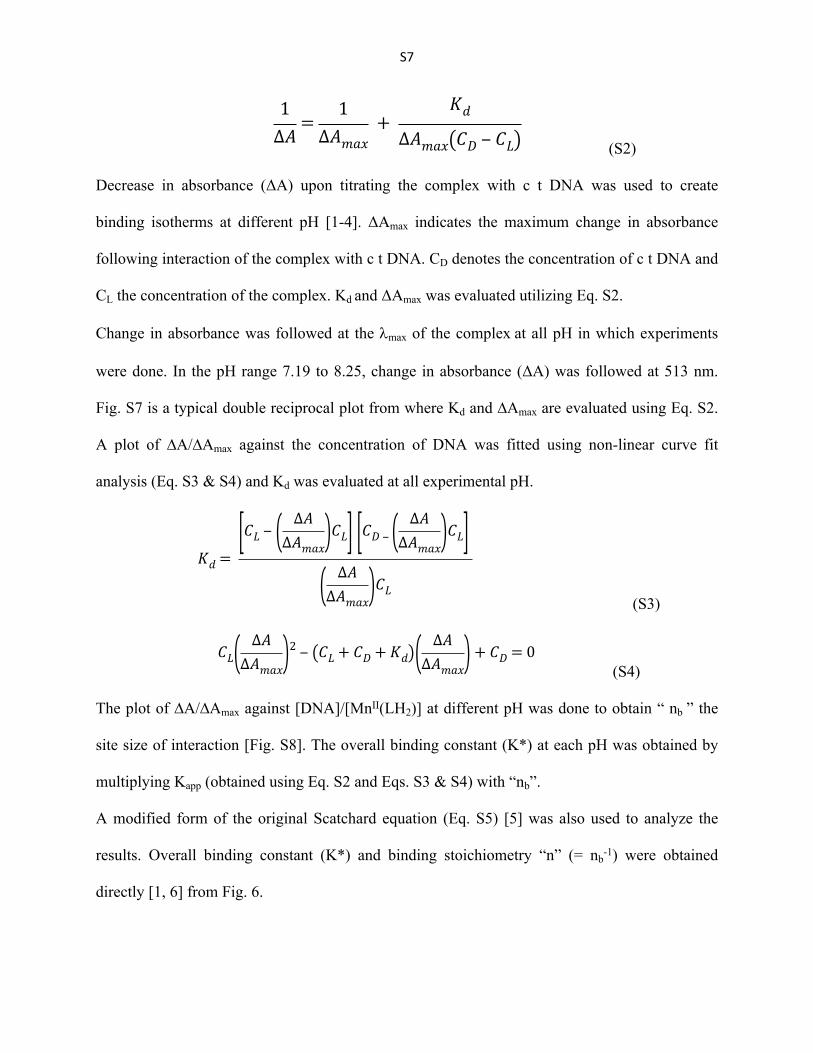
Decrease in absorbance (ΔA) upon titrating the complex with c t DNA was used to create
binding isotherms at different pH [1-4]. ΔAmax indicates the maximum change in absorbance
following interaction of the complex with c t DNA. CD denotes the concentration of c t DNA and
CL the concentration of the complex. Kd and ΔAmax was evaluated utilizing Eq. S2.
Change in absorbance was followed at the max of the complex at all pH in which experiments
were done. In the pH range 7.19 to 8.25, change in absorbance (ΔA) was followed at 513 nm.
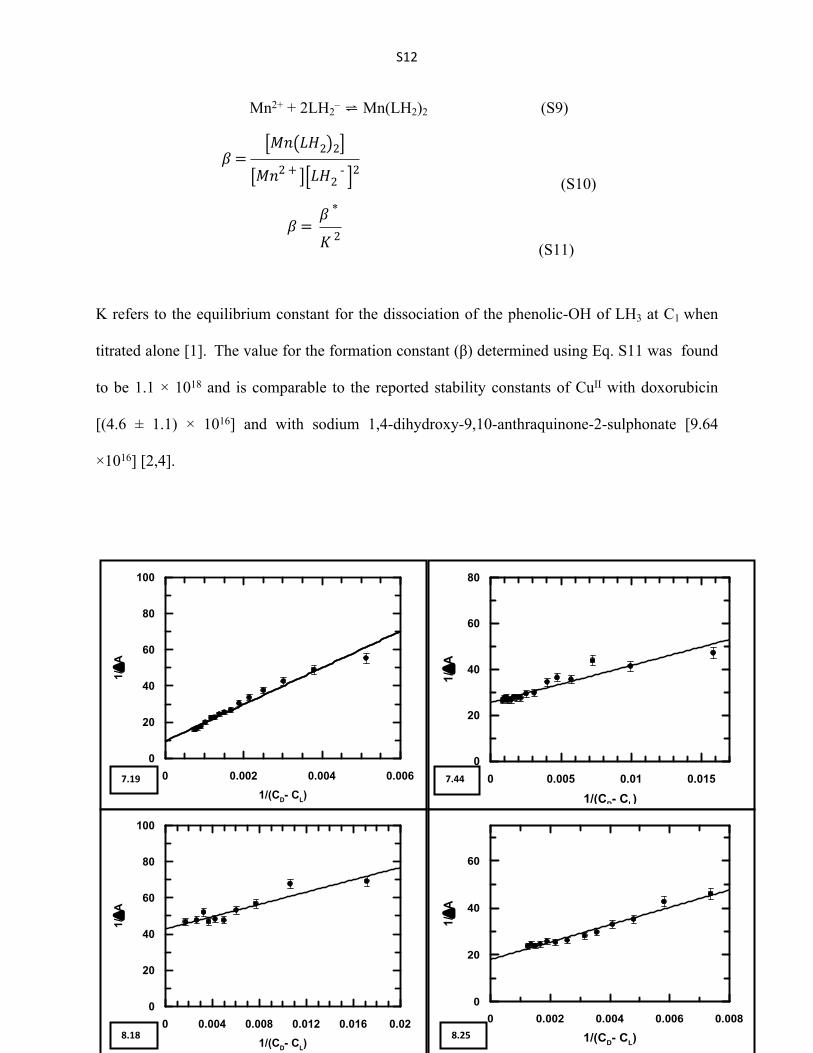
Fig. S7 is a typical double reciprocal plot from where Kd and ∆Amax are evaluated using Eq. S2.
A plot of ∆A/∆Amax against the concentration of DNA was fitted using non-linear curve fit
analysis (Eq. S3 & S4) and Kd was evaluated at all experimental pH.
(S3)
𝐾𝑑 = [𝐶𝐿 ‒ ( Δ𝐴
Δ𝐴𝑚𝑎𝑥)𝐶𝐿] [𝐶𝐷 ‒ ( Δ𝐴
Δ𝐴𝑚𝑎𝑥)𝐶𝐿]
( Δ𝐴Δ𝐴𝑚𝑎𝑥
)𝐶𝐿
(S4)𝐶𝐿( Δ𝐴
Δ𝐴𝑚𝑎𝑥)2 ‒ (𝐶𝐿 + 𝐶𝐷 + 𝐾𝑑)( Δ𝐴
Δ𝐴𝑚𝑎𝑥) + 𝐶𝐷 = 0
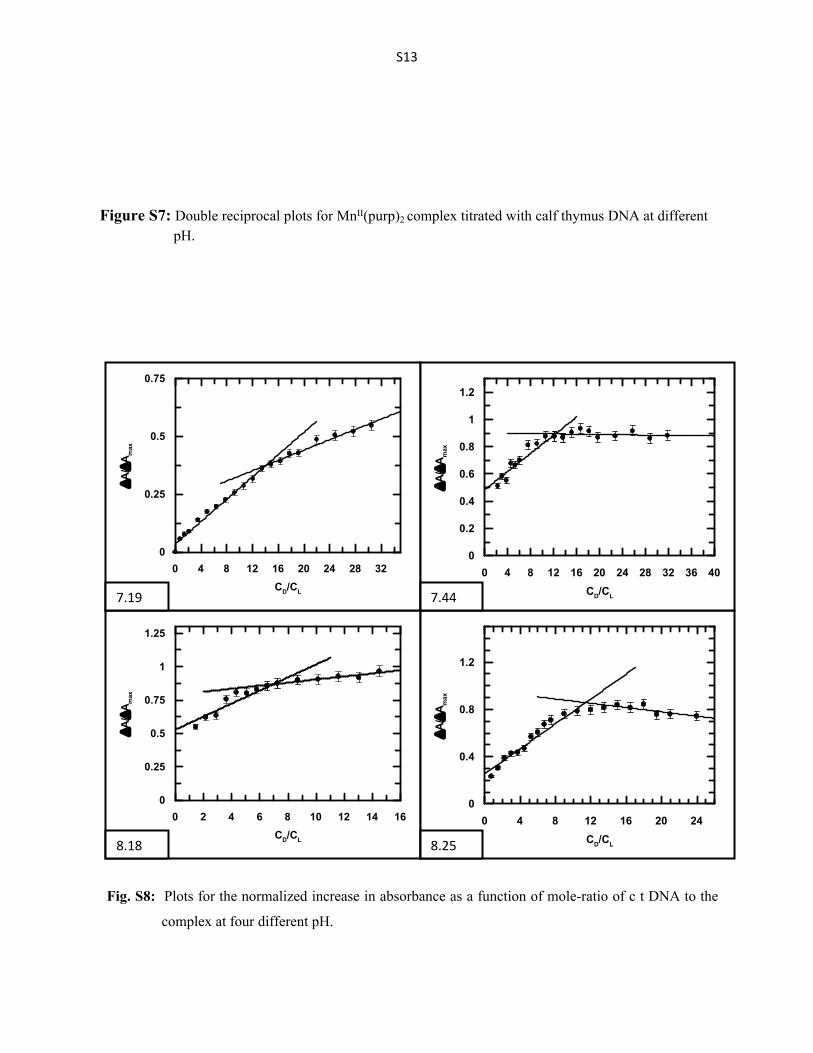
The plot of ∆A/∆Amax against [DNA]/[MnII(LH2)] at different pH was done to obtain “ nb ” the
site size of interaction [Fig. S8]. The overall binding constant (K*) at each pH was obtained by
multiplying Kapp (obtained using Eq. S2 and Eqs. S3 & S4) with “nb”.
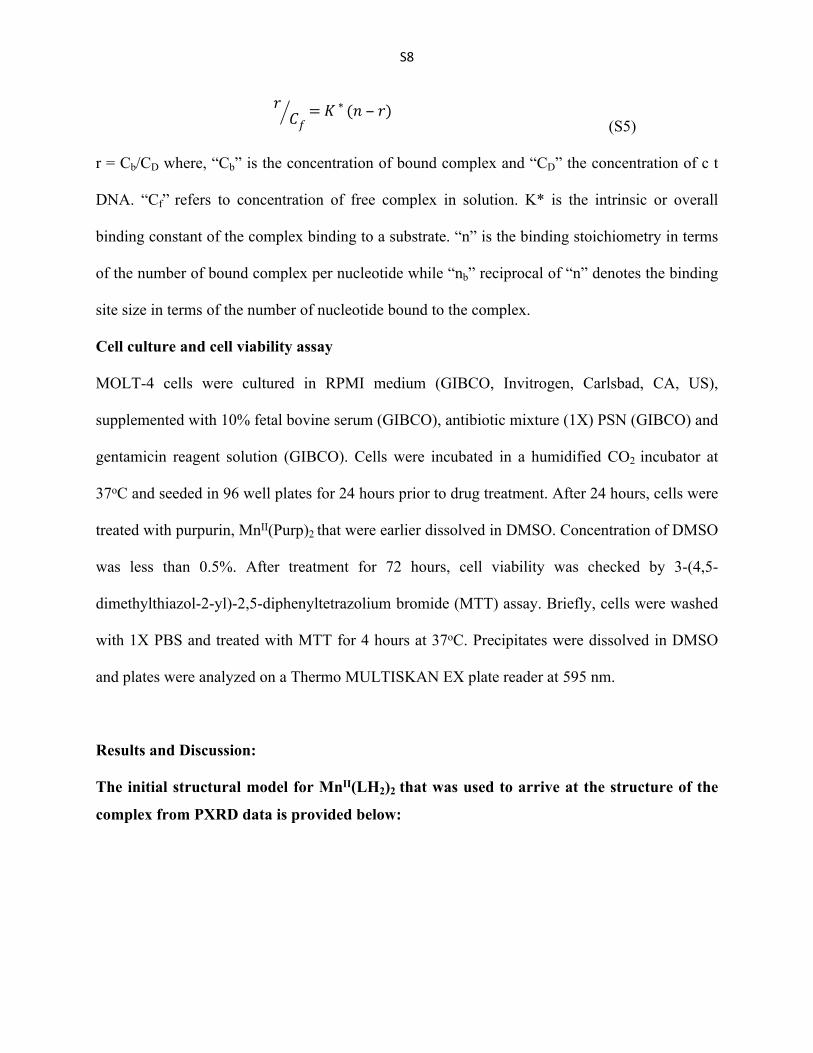
A modified form of the original Scatchard equation (Eq. S5) [5] was also used to analyze the
results. Overall binding constant (K*) and binding stoichiometry “n” (= nb-1) were obtained
directly [1, 6] from Fig. 6.
S8
(S5)𝑟
𝐶𝑓= 𝐾 ∗ (𝑛 ‒ 𝑟)
r = Cb/CD where, “Cb” is the concentration of bound complex and “CD” the concentration of c t
DNA. “Cf” refers to concentration of free complex in solution. K* is the intrinsic or overall
binding constant of the complex binding to a substrate. “n” is the binding stoichiometry in terms
of the number of bound complex per nucleotide while “nb” reciprocal of “n” denotes the binding
site size in terms of the number of nucleotide bound to the complex.
Cell culture and cell viability assay
MOLT-4 cells were cultured in RPMI medium (GIBCO, Invitrogen, Carlsbad, CA, US),
supplemented with 10% fetal bovine serum (GIBCO), antibiotic mixture (1X) PSN (GIBCO) and
gentamicin reagent solution (GIBCO). Cells were incubated in a humidified CO2 incubator at
37oC and seeded in 96 well plates for 24 hours prior to drug treatment. After 24 hours, cells were
treated with purpurin, MnII(Purp)2 that were earlier dissolved in DMSO. Concentration of DMSO
was less than 0.5%. After treatment for 72 hours, cell viability was checked by 3-(4,5-
dimethylthiazol-2-yl)-2,5-diphenyltetrazolium bromide (MTT) assay. Briefly, cells were washed
with 1X PBS and treated with MTT for 4 hours at 37oC. Precipitates were dissolved in DMSO
and plates were analyzed on a Thermo MULTISKAN EX plate reader at 595 nm.
Results and Discussion:
The initial structural model for MnII(LH2)2 that was used to arrive at the structure of the
complex from PXRD data is provided below:
S9
O O
HO
OH
O O O
O
OH
OHMn
HO
H
OH
H
O H
H
DFT computations were done to establish the structure of the complex. Ground state electronic
structure calculations were carried out using the DFT method [9]. Based on the optimized ground
state geometry, the absorption spectral properties in ethanol were calculated by time-dependent
density functional theory (TDDFT) method. All calculations were performed with Gaussian 09W
software package [10]. GaussSum 2.1 program was used to calculate the molecular orbital
contributions from groups or atoms.
Optimized structure in octahedral, high spin state (S = 5/2)
S10
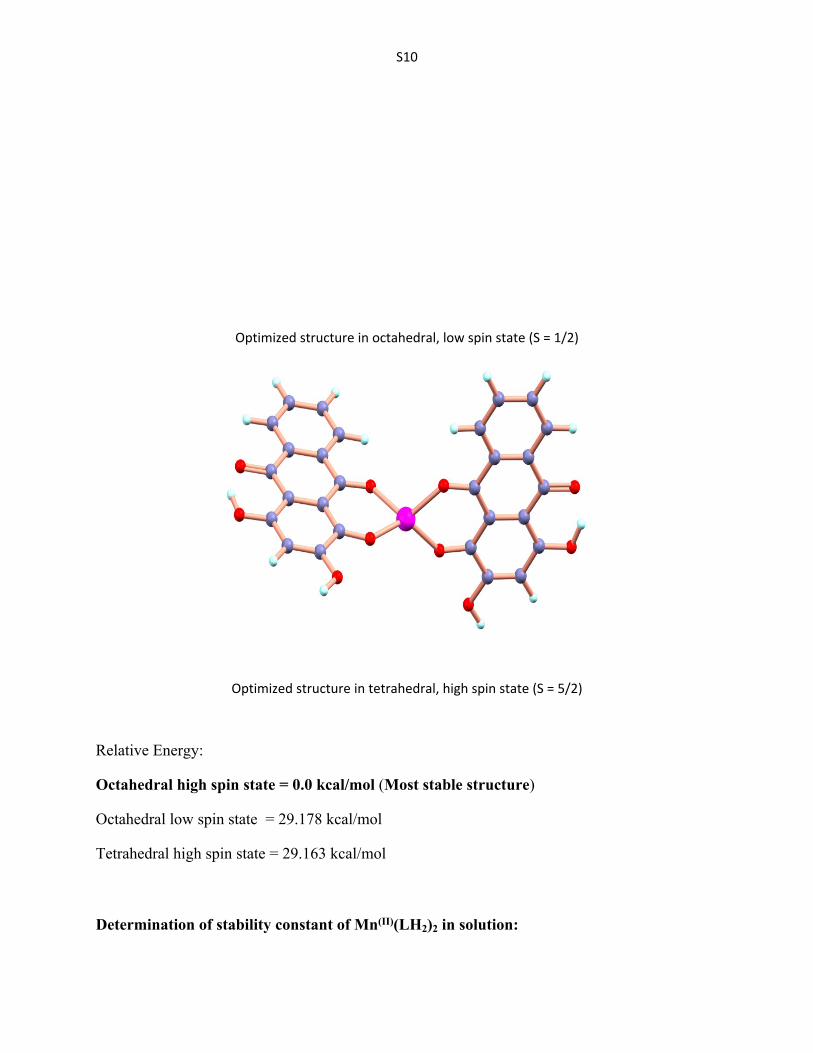
Optimized structure in octahedral, low spin state (S = 1/2)
Optimized structure in tetrahedral, high spin state (S = 5/2)
Relative Energy:
Octahedral high spin state = 0.0 kcal/mol (Most stable structure)
Octahedral low spin state = 29.178 kcal/mol
Tetrahedral high spin state = 29.163 kcal/mol
Determination of stability constant of Mn(II)(LH2)2 in solution:
S11
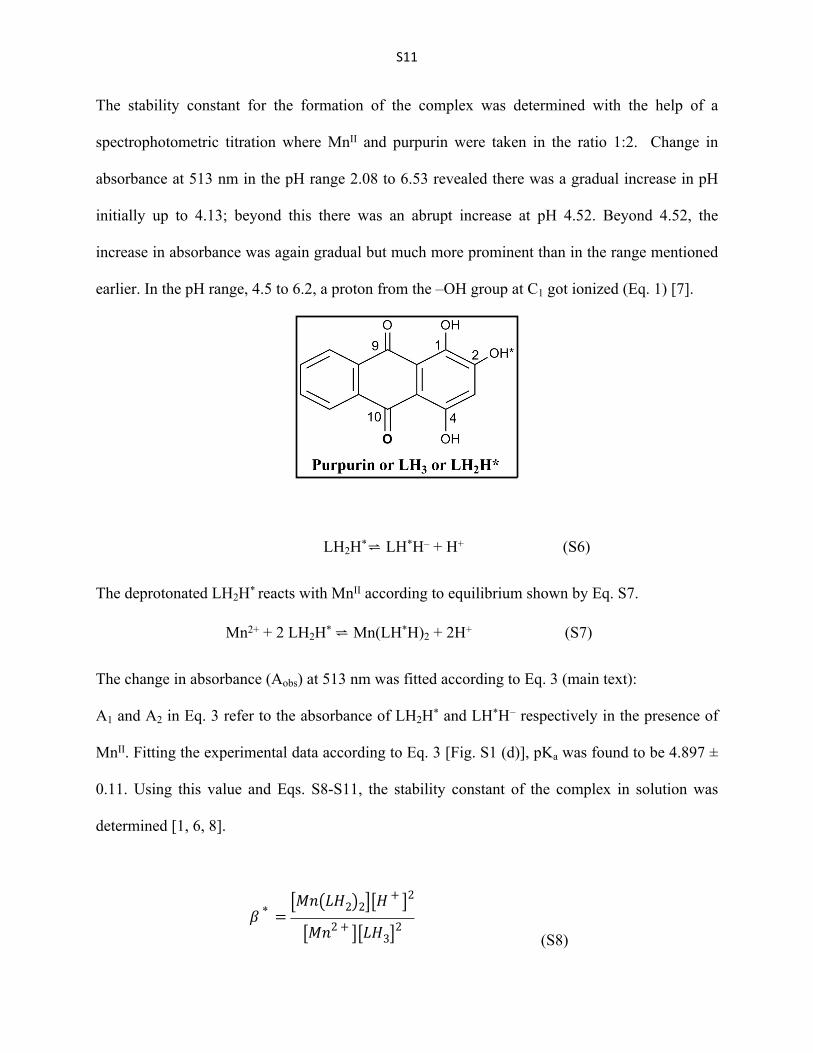
The stability constant for the formation of the complex was determined with the help of a
spectrophotometric titration where MnII and purpurin were taken in the ratio 1:2. Change in
absorbance at 513 nm in the pH range 2.08 to 6.53 revealed there was a gradual increase in pH
initially up to 4.13; beyond this there was an abrupt increase at pH 4.52. Beyond 4.52, the
increase in absorbance was again gradual but much more prominent than in the range mentioned
earlier. In the pH range, 4.5 to 6.2, a proton from the –OH group at C1 got ionized (Eq. 1) [7].
LH2H*⇌ LH*H– + H+ (S6)
The deprotonated LH2H* reacts with MnII according to equilibrium shown by Eq. S7.
Mn2+ + 2 LH2H* ⇌ Mn(LH*H)2 + 2H+ (S7)
The change in absorbance (Aobs) at 513 nm was fitted according to Eq. 3 (main text):
A1 and A2 in Eq. 3 refer to the absorbance of LH2H* and LH*H− respectively in the presence of
MnII. Fitting the experimental data according to Eq. 3 [Fig. S1 (d)], pKa was found to be 4.897 ±
0.11. Using this value and Eqs. S8-S11, the stability constant of the complex in solution was
determined [1, 6, 8].
(S8)𝛽 * =
[𝑀𝑛(𝐿𝐻2)2][𝐻 + ]2
[𝑀𝑛2 + ][𝐿𝐻3]2
S12
Mn2+ + 2LH2– ⇌ Mn(LH2)2 (S9)
(S10)𝛽 =
[𝑀𝑛(𝐿𝐻2)2][𝑀𝑛2 + ][𝐿𝐻2
- ]2
(S11)𝛽 =
𝛽 *
𝐾 2
K refers to the equilibrium constant for the dissociation of the phenolic-OH of LH3 at C1 when
titrated alone [1]. The value for the formation constant (β) determined using Eq. S11 was found
to be 1.1 × 10¹⁸ and is comparable to the reported stability constants of CuII with doxorubicin
[(4.6 ± 1.1) × 1016] and with sodium 1,4-dihydroxy-9,10-anthraquinone-2-sulphonate [9.64
×1016] [2,4].
0.0060.0040.0020
100
80
60
40
20
0
1/(CD- CL)
1/
A
0.0150.010.0050
80
60
40
20
0
1/(CD- CL)
1/
A
0.020.0160.0120.0080.0040
100
80
60
40
20
0
1/(CD- CL)
1/
A
0.0080.0060.0040.0020
60
40
20
0
1/(CD- CL)
1/A
7.44
8.25
7.19
8.18
S13
Figure S7: Double reciprocal plots for MnII(purp)2 complex titrated with calf thymus DNA at different pH.
Fig. S8: Plots for the normalized increase in absorbance as a function of mole-ratio of c t DNA to the
complex at four different pH.
1614121086420
1.25
1
0.75
0.5
0.25
0
CD/CL
A/
A max
24201612840
1.2
0.8
0.4
0
CD/CL
A/
A max
8.18 8.25
322824201612840
0.75
0.5
0.25
0
CD/CL
A/
A max
4036322824201612840
1.2
1
0.8
0.6
0.4
0.2
0
CD/CL
A/
A max
7.447.19
S14
Cell viability assay
The study revealed that the complex was slightly better in killing MOLT-4 cells having an IC50
value of 26.5 μM. The same for purpurin is 29.0 μM. The data suggests MnII(LH2)2 was
marginally more potent than purpurin (Fig. S9). Such a finding in favor of the complex is
interesting because it is observed in spite of decreased ROS generation by it suggesting that the
complex is able to maintain the performance of purpurin on MOLT-4 cells, rather improve things
slightly. Hence, the presence of the metal ion in the complex probably equips it to impair other
cellular processes making up for the disadvantage that it faces with regard to efficacy due to
decreased ROS formation due to it, in affecting cellular damage compared to purpurin.
50403020100
100
80
60
40
20
[Anthraquinones] (M)
Rel
ativ
e %
of c
ell v
i abi
lity
purpurin
Mn-purpurin
Fig. S9: Dose response curve for the effects of LH3 and MnII(LH2)2 on MOLT-4 cells. In
both cases, MOLT-4 cells were treated with the compounds for 72 hours and
MTT assay was performed.
References:
S15
1) P. S. Guin, S. Das, P. C. Mandal, J. Inorg. Biochem. 103 (2009) 1702.
2) S. Mukherjee, P. Das, S. Das, J. Phy.Org. Chem. 25 (2012) 385.
3) S. Roy, R. Banerjee, M. Sarkar, J. Inorg. Biochem. 100 (2006) 1320.
4) S. Chakraborti, B. Bhattacharyya, D. Dasgupta, J. Phys. Chem. B 106 (2002) 6947.
5) G. Scatchard, Ann. N. Y. Acad. Sci. 51 (1949) 660.
6) P. Das, P. S. Guin, P. C. Mandal, M. Paul, S. Paul, S. Das, J. Phy.Org. Chem. 24 (2011)
774.
7) S. Das, A. Saha, P. C. Mandal, Talanta 43 (1996) 95.
8) H. Beraldo, A. G. Suillerot, L. Tosi, Inorg. Chem. 22 (1983) 4117.
9) R.G. Parr, W. Yang, Density Functional Theory of Atoms and Molecules, Oxford
University Press, Oxford, 1989.
10) N. M. O’Boyle, A. L. Tenderholt, K. M. Langner, J. Comp. Chem., 2008, 29, 839.