A Backbone Lever-Arm Effect Enhances Polymer Mechanochemistry
Hope M. Klukovich; Tatiana B. Kouznetsova; Zachary S. Kean; Jeremy M. Lenhardt; Stephen L. Craig*
Department of Chemistry, Duke University, Durham, North Carolina 27708 E-mail: [email protected]
* To whom correspondence should be addressed. Email: [email protected]
Table of Contents General Procedures……………………………………………………………………….……………….S1 cis PNB Synthesis …………………………………………………………………………………..…….S2 trans PNB Synthesis……………………………………………………………………………….……...S3 gDBC Polymer Functionalization…………………………………………………………………………S4 gDCC Polymer Functionalization…………………………………………………………………………S7 Polymer Epoxidation………………………………………….…………………………………………..S9 Determination of Force-Free Rate Constants (ko)……………………………………………………….S11 Comparison of cis-gDCC PNB and cis-gDBC PB………………………………………………………S13 SMFS Fitting Analysis……………….…………………………………………………………………..S16 Ring Opening Force and !x‡ Comparison of Epoxidized cis-gDBC PB vs. Nascent cis-gDBC PB.…...S21 trans-gDHC PNB Functionalization……………………………………………………………………..S21 Theoretical % Extension Modeling…………………………………………………………………..….S22 CoGEF Calculation on the cis-gDCC PB Triad…………………………………………………………S32 CoGEF Calculation on the cis-gDCC PNB(1) Triad…………………………………………………….S33 CoGEF Calculation on the cis-gDCC PNB(2) Triad…………………………………………………….S34 Distortion of Central gDCC…………………………………………...…………………………………S35
General Procedures 98% cis-Polybutadiene (Item #181374, 200 kDa, PDI = 1.1), CHBr3, NaOH, CH3OH, cetyltrimethylammonium bromide (CTAB), dimethyl acetylenedicarboxylate (DMAD), diphenylether (DPE), norbornene, Grubbs Catalyst 1st Generation, chlorobenzene, ReCl5, mCPBA, methyl benzoate, toluene, and THF were purchased from Sigma-Aldrich, CHCl3 and CH2Cl2 were obtained from BDH, and CDCl3 was purchased from Cambridge Isotope Laboratories (D, 99.8 %). Coumarin–2,2,6,6-tetramethylpiperidine-1-oxyl (CT) was prepared according to published reports.2 #All reagents and solvents were used as received. All 1H NMR spectra were collected in CDCl3 on a 400 MHz Varian NMR and the residual solvent peak (CDCl3 " = 7.24) was used as an internal chemical shift reference. Gel permeation chromatography (GPC) was performed on a single column (Agilent Technology PL gel, #179911GP-504, 104 Å) using inhibitor-free THF as mobile phase at 0.5 mL min-1 at room temperature. The flow rate was set using a Varian Prostar Model 210 pump, and molecular weights were calculated using an inline Wyatt Dawn EOS multi-angle light scattering (MALS) detector, Wyatt quasi-electric light scattering (QELS), Wyatt Optilab DSP Interferometric Refractometer (RI), and Varian Prostar Model 320 UV-Vis detector. The dn dc-1 values for each polymer were determined by dividing the integrated RI signal by the known amount of polymer injected.
Standard MSNL silicon probes were ordered from Veeco (Santa Barbara, CA). All AFM studies were conducted in a solution of methyl benzoate (or toluene for cis-gDCC PB) at ambient temperature (~23 oC) using a homemade AFM controller system incorporated with a Digital Instruments scanning head. Our AFM instrument and its mode of operation are similar to the one described in detail previously.3 The force curves used for analysis were obtained with rectangular-shaped cantilevers (205 µm x 15 µm, nominal tip radius ~ 2 nm, nominal spring constant k ~ 0.02 N/m, frequency ~ 15 kHz). By using the MFP-3D system (Asylum Research Group Inc., Santa Barbara, CA), the spring constant of each AFM cantilever was calibrated in air after each force curve measurement, using the thermal noise method, based on the energy equipartition theorem as described previously.4 Multiple cantilever tips of the same type were used throughout the course of the experiments. The measured spring constants ranged from 0.019 – 0.024 N/m. The loading rates, derived from the actual force curves, immediately prior to the visible onset of the transition, were in the range of 2,000 – 5,000 pN/s, depending on the cantilever and polymer. Measurements were carried out in a closed fluid cell with scanning set for a series of retract/approach cycles. Cantilever tips were prepared by allowing each to soak in piranha solution for ~15 min at room temperature and silicon surfaces were prepared by first allowing each to soak for ~30 minutes in hot piranha solution (3:1 H2SO4:H2O2) then washed with DI-H2O and dried under a stream of nitrogen. The surface and cantilever were then placed in a UVO cleaner (ozone produced through UV light) for 15 minutes. After ozonolysis, the cantilever was mounted, and ~20 µL of a ~0.5 mg mL-1 polymer solution was added to the silicon surface and allowed to dry. Force curves were collected in dSPACE (dSPACE Inc., Wixom, MI) and analyzed using Matlab (The MathWorks, Inc., Natick, MA). All data were filtered during acquisition at 500 Hz. After acquisition, the data was calibrated and plotted by using homemade software written in Matlab language. cis-Polynorbornene (PNB) Synthesis
0.09 g of ReCl5 was dissolved in anhydrous chlorobenzene and stirred for two hours under nitrogen. 2.4 g of norbornene was dissolved in 5 mL of chlorobenzene, and then added to the ReCl5 solution. The solution became viscous after < 5 min. Once the solution became too viscous and stirring ceased (about 2 hours), methanol was added to the reaction flask. The polymer mass was broken up and stirred in methanol to rinse off the catalyst. The polymer was washed multiple times with methanol. The polymer was then dissolved in CHCl3 and re-precipitated 3 times with methanol. Finally, the polymer was dissolved in CHCl3 and passed through a plug of silica, re-precipitated with methanol, and dried under high vacuum. ReCl5 is known to produce polynorbornene with high cis content.5 The resulting cis content in our polymers was typically around 85%, as determined by the relative integration of the 1H NMR (Figure 1) carbon-carbon double bond peaks centered at " = 5.19 ppm (cis) and " = 5.32 ppm (trans).
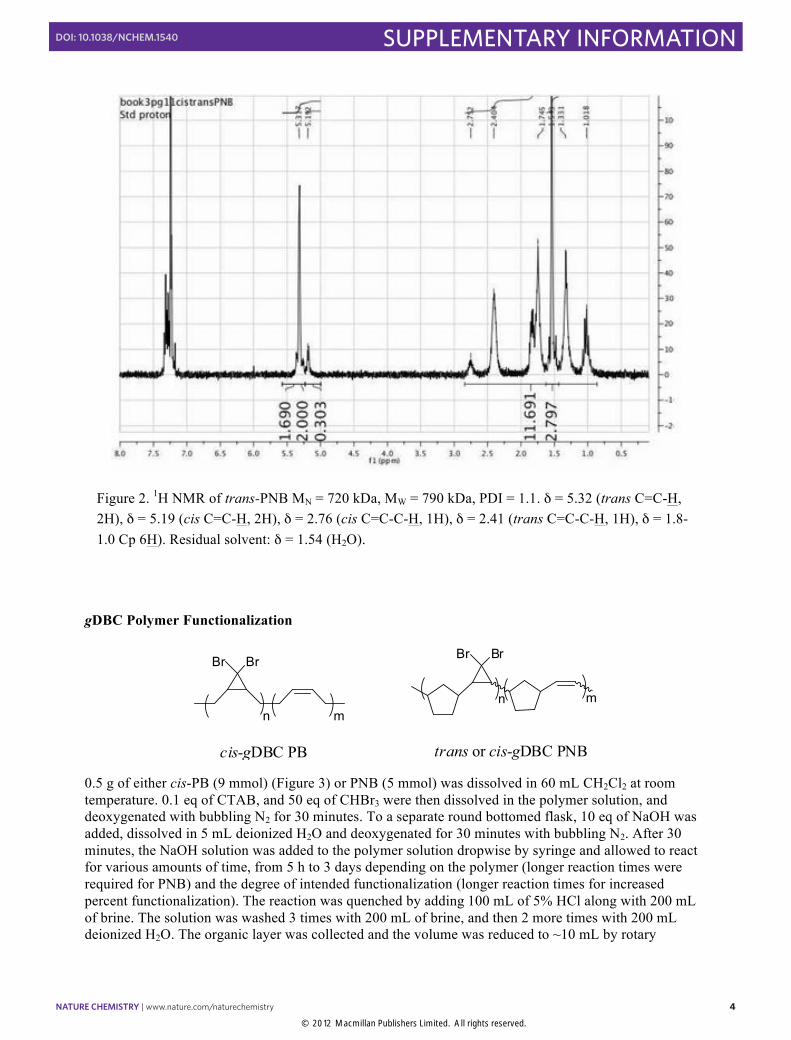
2.4 g of norbornene was dissolved in 30 mL of THF under nitrogen. A stock solution of Grubb’s Generation 1 catalyst was made by dissolving 7 mg of catalyst in 100 µL of THF. 50 µL of the stock solution was added quickly to the norbornene solution. In less than 1 min, the solution solidified. Methanol was added to the reaction flask. The polymer mass was broken up and stirred in methanol to rinse off the catalyst. The polymer was washed multiple times with methanol. The polymer was then dissolved in CHCl3 and re-precipitated 3 times with methanol. Finally, the polymer was dissolved in CHCl3 and passed through a plug of silica, re-precipitated with methanol and dried under high vacuum. The resulting trans content in our polymers was typically around 85%, as determined by the relative integration of the 1H NMR (Figure 2) carbon-carbon double bond peaks centered at " = 5.19 ppm (cis) and " = 5.32 ppm (trans).
0.5 g of either cis-PB (9 mmol) (Figure 3) or PNB (5 mmol) was dissolved in 60 mL CH2Cl2 at room temperature. 0.1 eq of CTAB, and 50 eq of CHBr3 were then dissolved in the polymer solution, and deoxygenated with bubbling N2 for 30 minutes. To a separate round bottomed flask, 10 eq of NaOH was added, dissolved in 5 mL deionized H2O and deoxygenated for 30 minutes with bubbling N2. After 30 minutes, the NaOH solution was added to the polymer solution dropwise by syringe and allowed to react for various amounts of time, from 5 h to 3 days depending on the polymer (longer reaction times were required for PNB) and the degree of intended functionalization (longer reaction times for increased percent functionalization). The reaction was quenched by adding 100 mL of 5% HCl along with 200 mL of brine. The solution was washed 3 times with 200 mL of brine, and then 2 more times with 200 mL deionized H2O. The organic layer was collected and the volume was reduced to ~10 mL by rotary
evaporation. The desired product was precipitated with ~ 20 mL of methanol. The polymer was reprecipitated twice more from CHCl3 with methanol and dried on high vacuum. Multiple polymer samples were used throughout this study with a range of MNs and degrees of functionalization.
A range of polymer batches were used throughout the study, in part because of limited stability in long-term storage and in part to test the robustness of the results. The extent of functionalization was determined using 1H NMR spectroscopy (Figure 4) as follows:
Where: Ivin PNB = integration from " = 5.5 to 5.0 Ivin PB = integration from " = 5.6 to 5.25 Ial PNB = integration from " = 3.0 to 0.8 Ial PB = integration from " = 3.1 to 1.4 When necessary, residual solvent water peaks were subtracted from the corresponding areas. The uncertainty in the percent functionalization is taken to be ± 5%, based on independent measurement of 5 different unfunctionalized polymers.
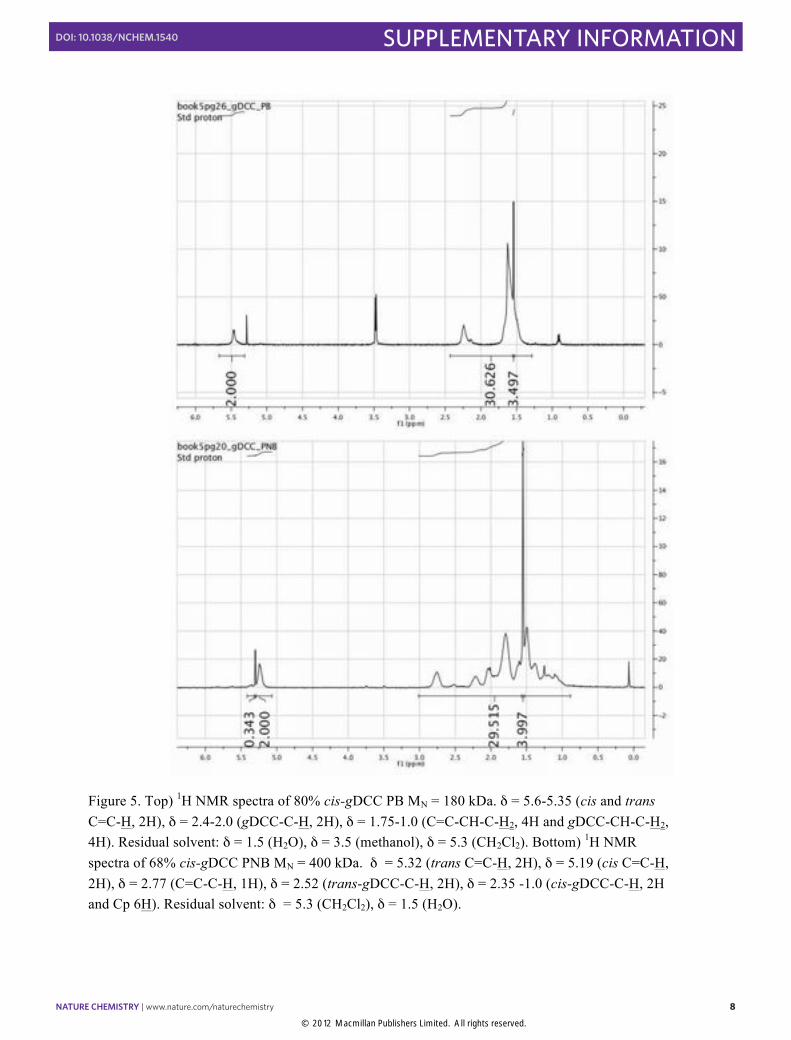
A similar procedure to the gDBC functionalization was used to functionalize both PB and PNB with gDCC, except that the solvent employed was CHCl3 rather than CH2Cl2, and no CHBr3 was added. The degree of functionalization was determined using the same procedure as gDBC functionalization (Figure 5).
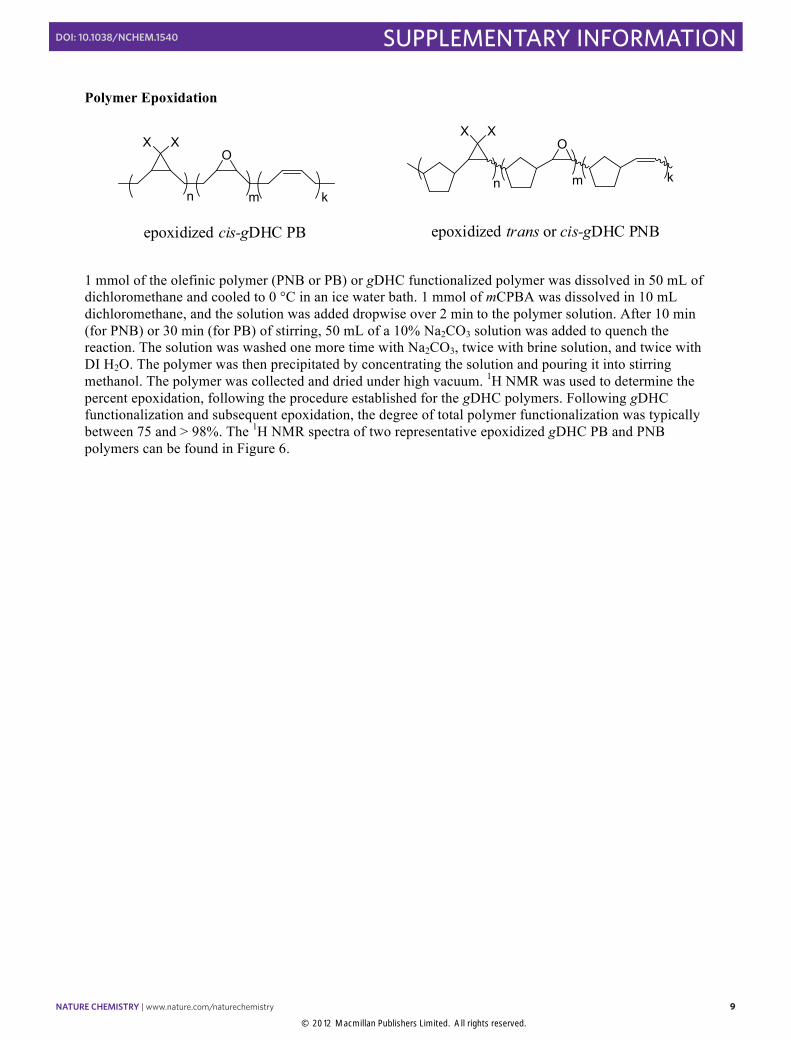
epoxidized cis-gDHC PB epoxidized trans or cis-gDHC PNB
OO
km k
##############################
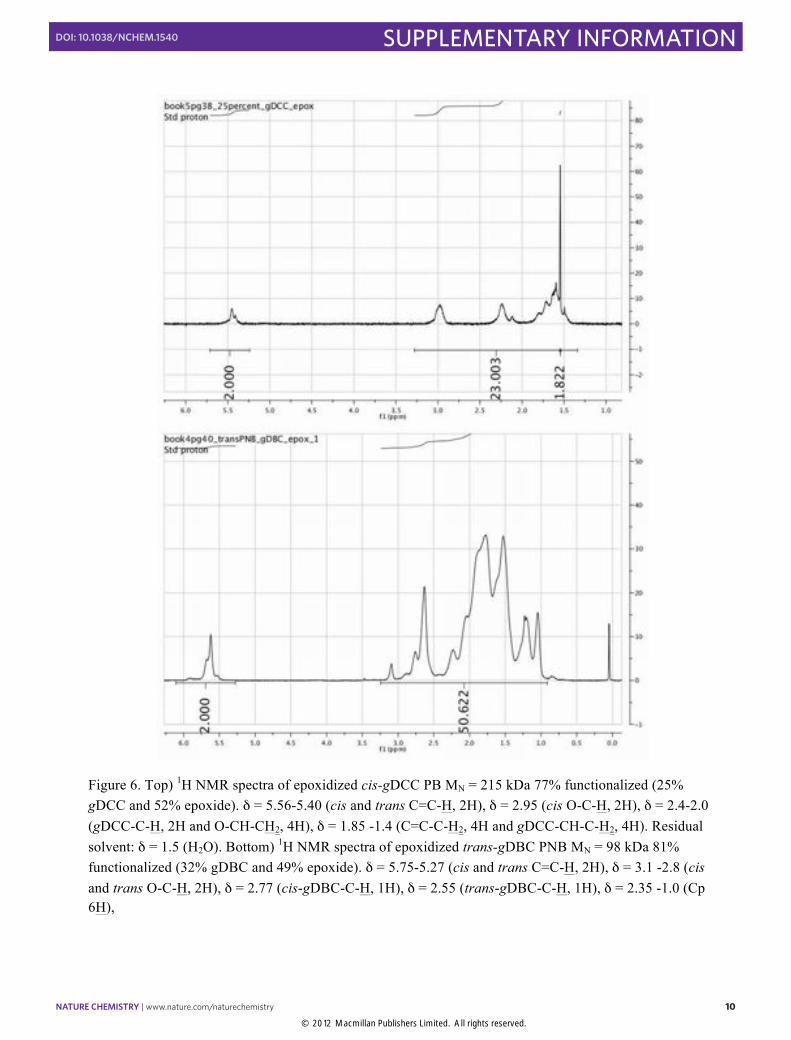
1 mmol of the olefinic polymer (PNB or PB) or gDHC functionalized polymer was dissolved in 50 mL of dichloromethane and cooled to 0 °C in an ice water bath. 1 mmol of mCPBA was dissolved in 10 mL dichloromethane, and the solution was added dropwise over 2 min to the polymer solution. After 10 min (for PNB) or 30 min (for PB) of stirring, 50 mL of a 10% Na2CO3 solution was added to quench the reaction. The solution was washed one more time with Na2CO3, twice with brine solution, and twice with DI H2O. The polymer was then precipitated by concentrating the solution and pouring it into stirring methanol. The polymer was collected and dried under high vacuum. 1H NMR was used to determine the percent epoxidation, following the procedure established for the gDHC polymers. Following gDHC functionalization and subsequent epoxidation, the degree of total polymer functionalization was typically between 75 and > 98%. The 1H NMR spectra of two representative epoxidized gDHC PB and PNB polymers can be found in Figure 6.
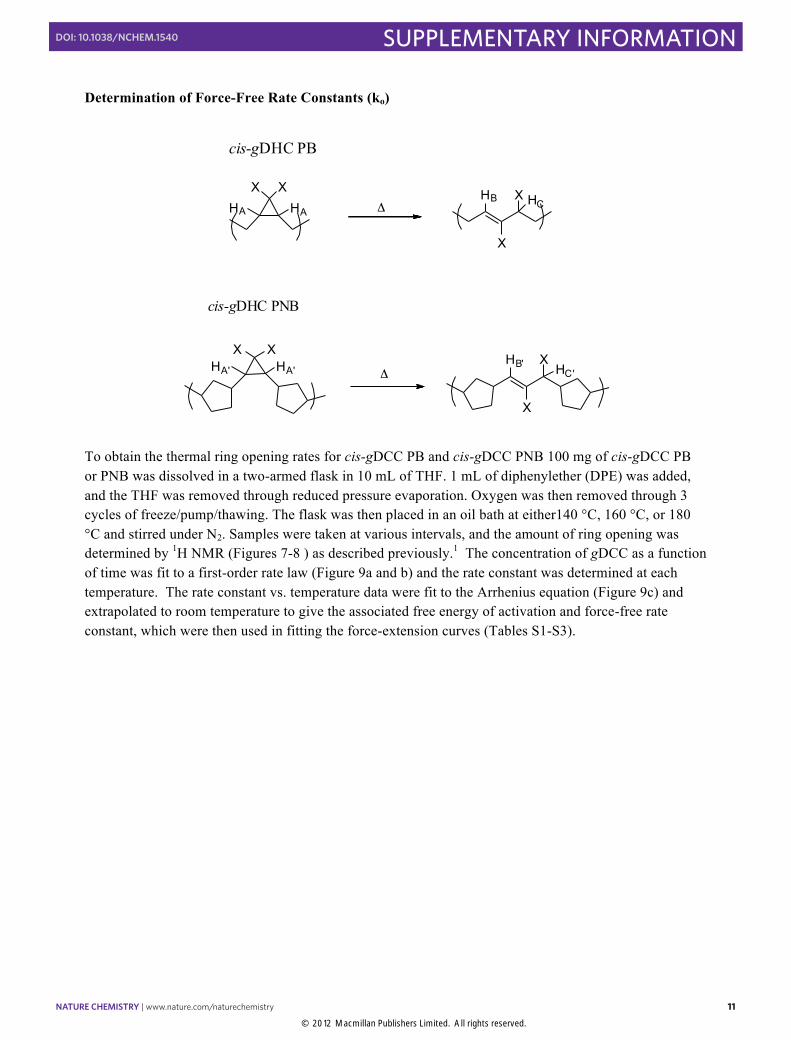
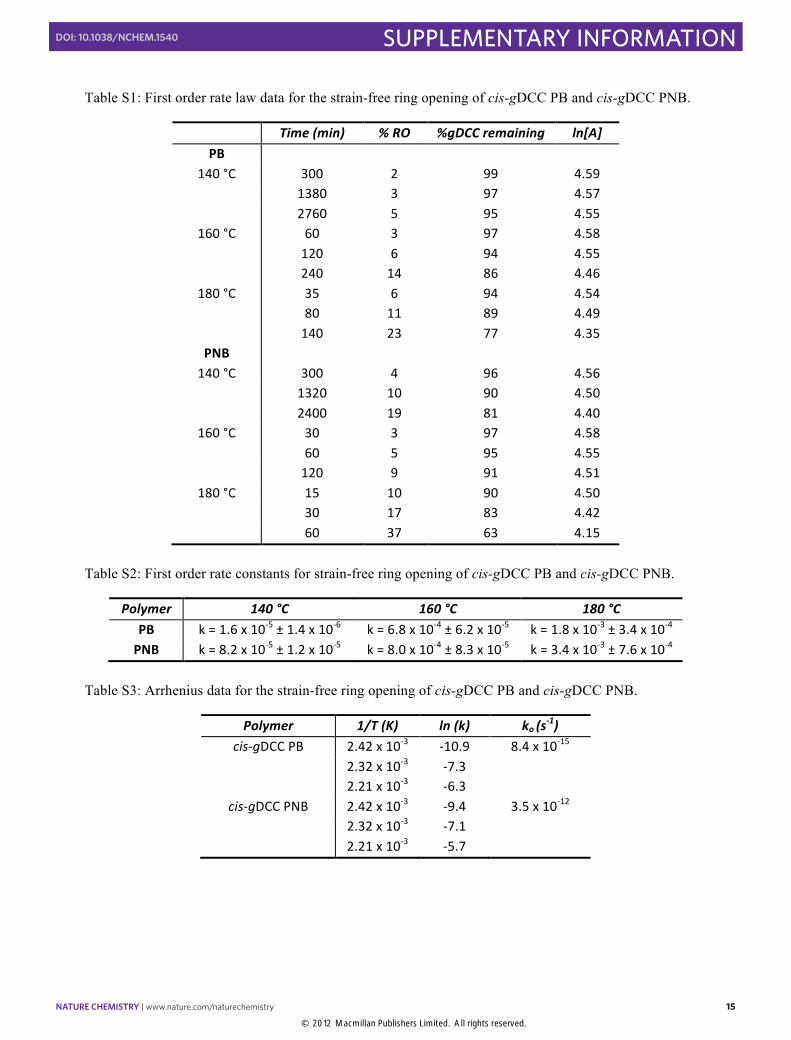
To obtain the thermal ring opening rates for cis-gDCC PB and cis-gDCC PNB 100 mg of cis-gDCC PB or PNB was dissolved in a two-armed flask in 10 mL of THF. 1 mL of diphenylether (DPE) was added, and the THF was removed through reduced pressure evaporation. Oxygen was then removed through 3 cycles of freeze/pump/thawing. The flask was then placed in an oil bath at either140 °C, 160 °C, or 180 °C and stirred under N2. Samples were taken at various intervals, and the amount of ring opening was determined by 1H NMR (Figures 7-8 ) as described previously.1 The concentration of gDCC as a function of time was fit to a first-order rate law (Figure 9a and b) and the rate constant was determined at each temperature. The rate constant vs. temperature data were fit to the Arrhenius equation (Figure 9c) and extrapolated to room temperature to give the associated free energy of activation and force-free rate constant, which were then used in fitting the force-extension curves (Tables S1-S3).
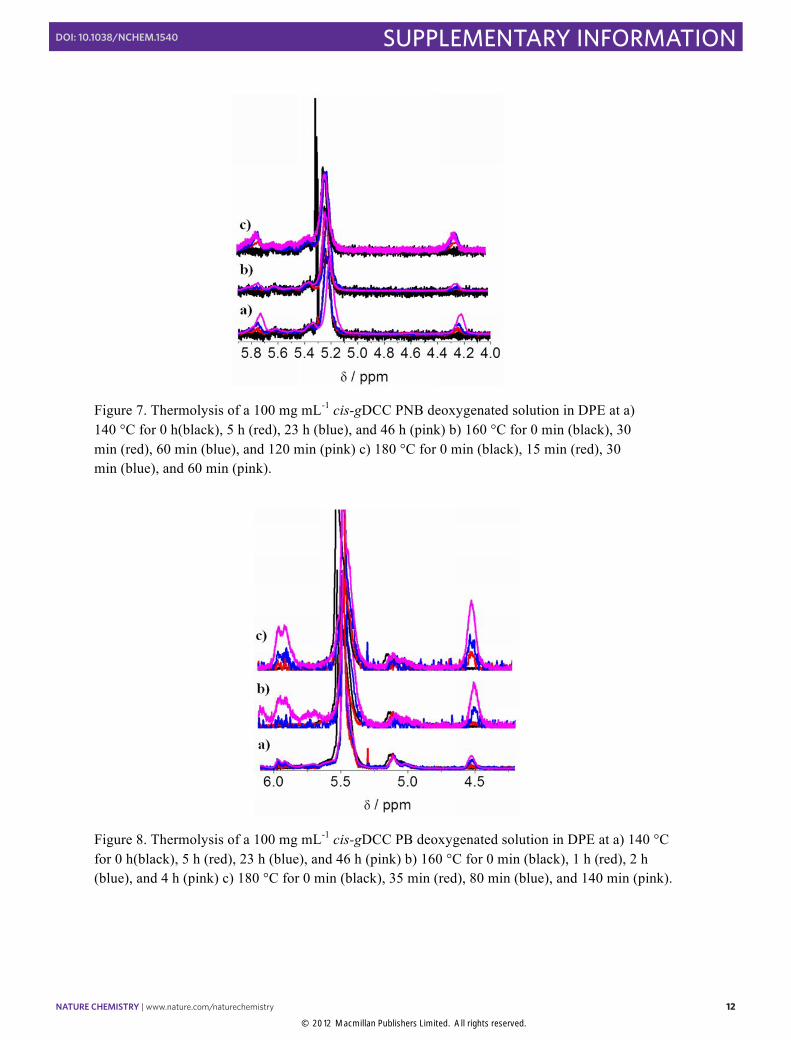
Figure 7. Thermolysis of a 100 mg mL-1 cis-gDCC PNB deoxygenated solution in DPE at a) 140 °C for 0 h(black), 5 h (red), 23 h (blue), and 46 h (pink) b) 160 °C for 0 min (black), 30 min (red), 60 min (blue), and 120 min (pink) c) 180 °C for 0 min (black), 15 min (red), 30 min (blue), and 60 min (pink).
#
Figure 8. Thermolysis of a 100 mg mL-1 cis-gDCC PB deoxygenated solution in DPE at a) 140 °C for 0 h(black), 5 h (red), 23 h (blue), and 46 h (pink) b) 160 °C for 0 min (black), 1 h (red), 2 h (blue), and 4 h (pink) c) 180 °C for 0 min (black), 35 min (red), 80 min (blue), and 140 min (pink).
Because the gDBC polymers had limited stability at elevated temperature, perhaps due to elimination of HBr from allylic bromide products,6 we were not able to complete similar thermolysis experiments to those of the gDCC polymers. Instead, the force-free rate constant for cis-gDBC PB was taken from published values,7-8 and given that rate constant, the force-free rate constant for cis-gDBC PNB was estimated based on the difference between ko of cis-gDBC PB and the ko of cis-gDCC PB.
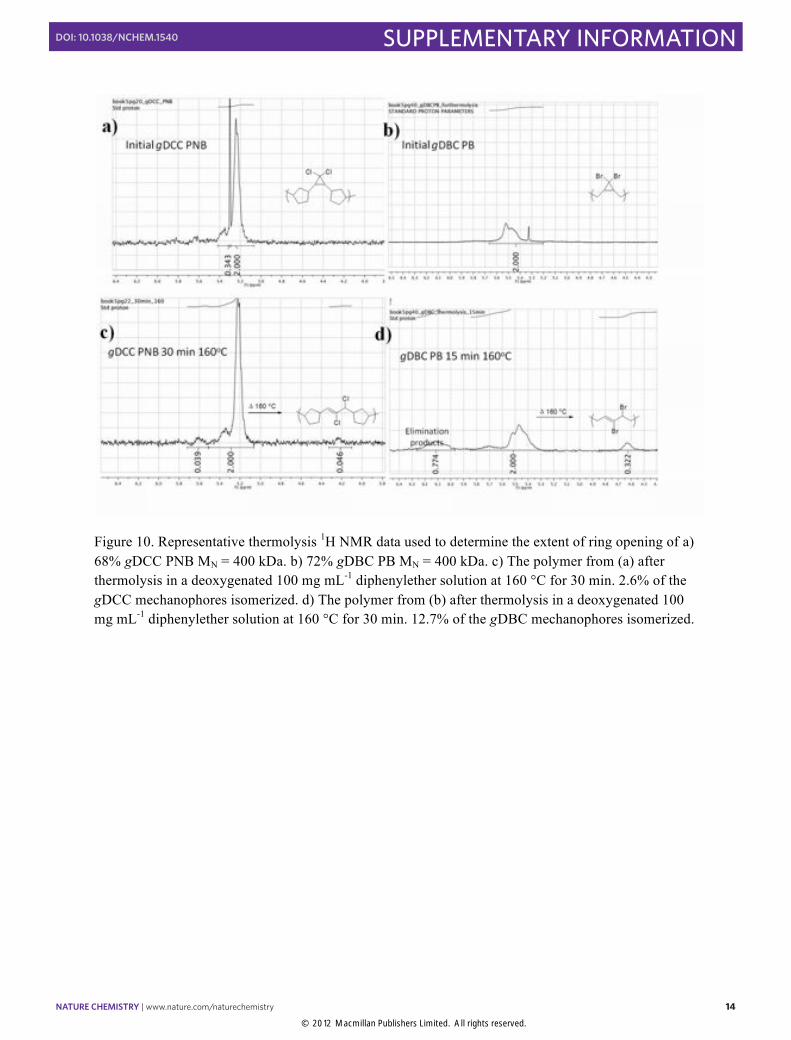
The relative strain-free reactivity of gDBC PB was compared to that of gDCC PNB at 160 °C. After 15 min of thermolysis, >12.5% of the gDBCs had isomerized, vs. < 3% of the gDCCs (Figure 10), supporting that the lower forces required for ring opening of gDCC PNB vs. gDBC PB is due not to greater intrinsic reactivity but to enhanced chemomechanical coupling.
#
Figure 9. a) First-order thermolysis reaction data for cis-gDCC PNB at 140 °C (black), 160 °C (red), and 180 °C (blue) b) First-order thermolysis reaction data for cis-gDCC PB at 140 °C (black), 160 °C (red), and 180 °C (blue) c) Arrhenius plot for cis-gDCC PNB (black) and cis-gDCC PB (red). Force-free rate constants (ko) were obtained by extrapolating to room temperature.
Figure 10. Representative thermolysis 1H NMR data used to determine the extent of ring opening of a) 68% gDCC PNB MN = 400 kDa. b) 72% gDBC PB MN = 400 kDa. c) The polymer from (a) after thermolysis in a deoxygenated 100 mg mL-1 diphenylether solution at 160 °C for 30 min. 2.6% of the gDCC mechanophores isomerized. d) The polymer from (b) after thermolysis in a deoxygenated 100 mg mL-1 diphenylether solution at 160 °C for 30 min. 12.7% of the gDBC mechanophores isomerized.
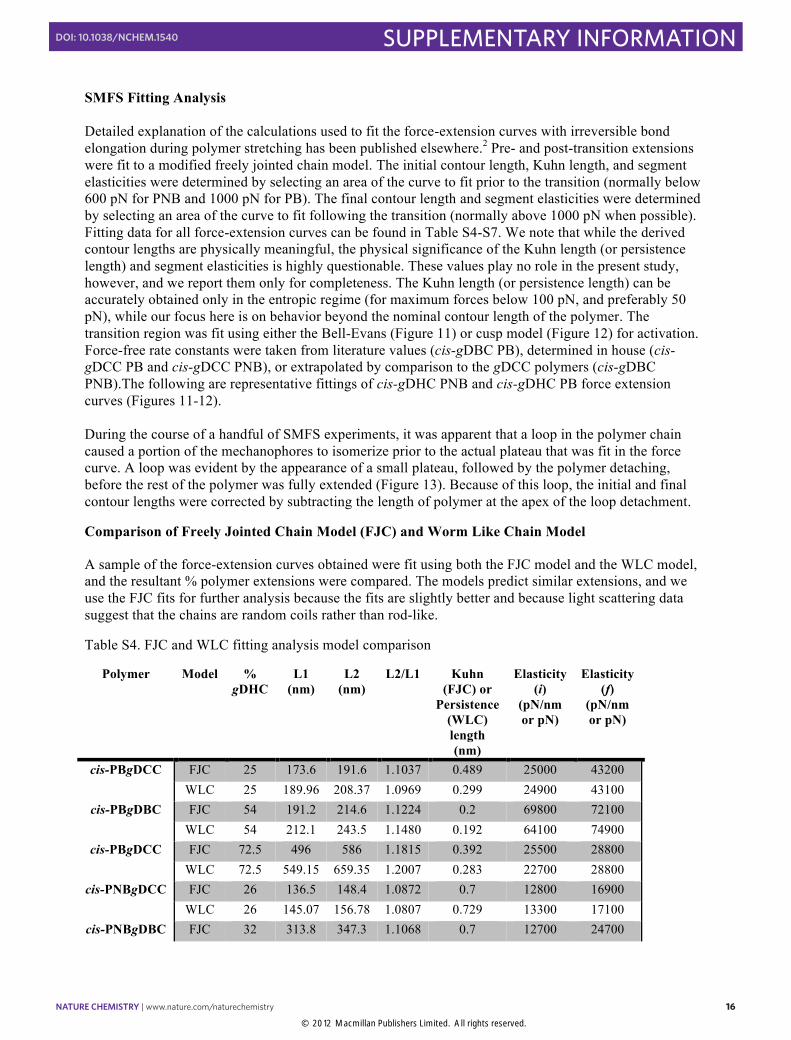
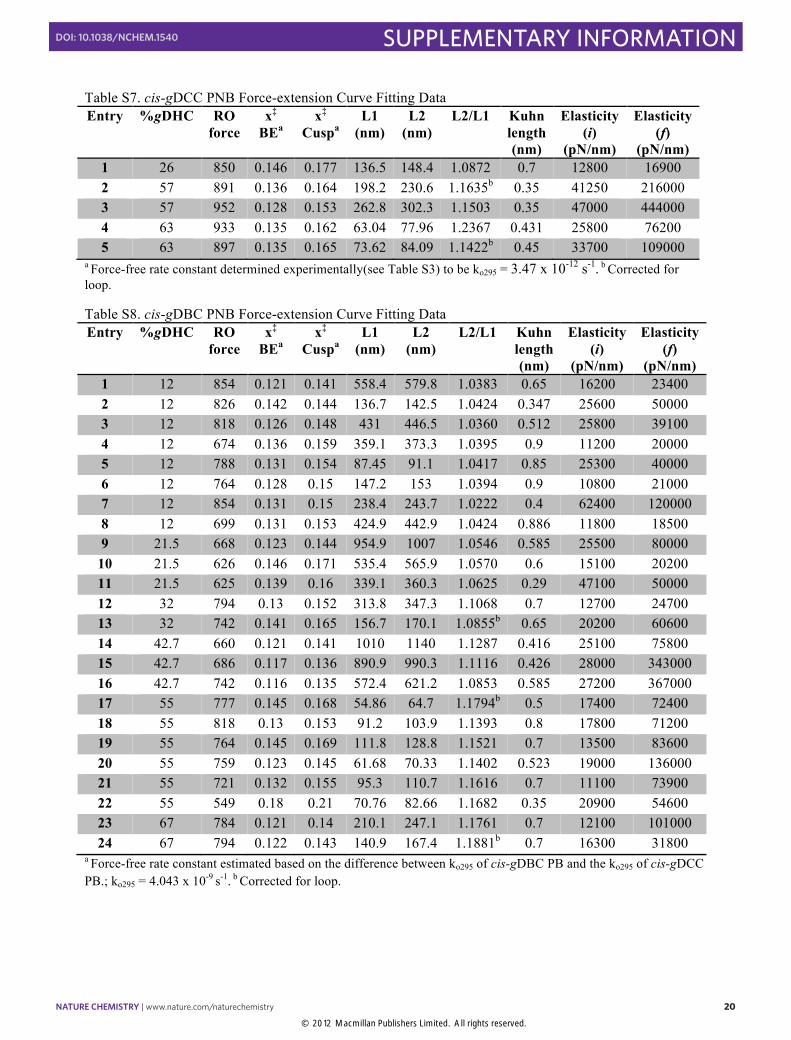
SMFS Fitting Analysis Detailed explanation of the calculations used to fit the force-extension curves with irreversible bond elongation during polymer stretching has been published elsewhere.2 Pre- and post-transition extensions were fit to a modified freely jointed chain model. The initial contour length, Kuhn length, and segment elasticities were determined by selecting an area of the curve to fit prior to the transition (normally below 600 pN for PNB and 1000 pN for PB). The final contour length and segment elasticities were determined by selecting an area of the curve to fit following the transition (normally above 1000 pN when possible). Fitting data for all force-extension curves can be found in Table S4-S7. We note that while the derived contour lengths are physically meaningful, the physical significance of the Kuhn length (or persistence length) and segment elasticities is highly questionable. These values play no role in the present study, however, and we report them only for completeness. The Kuhn length (or persistence length) can be accurately obtained only in the entropic regime (for maximum forces below 100 pN, and preferably 50 pN), while our focus here is on behavior beyond the nominal contour length of the polymer. The transition region was fit using either the Bell-Evans (Figure 11) or cusp model (Figure 12) for activation. Force-free rate constants were taken from literature values (cis-gDBC PB), determined in house (cis-gDCC PB and cis-gDCC PNB), or extrapolated by comparison to the gDCC polymers (cis-gDBC PNB).The following are representative fittings of cis-gDHC PNB and cis-gDHC PB force extension curves (Figures 11-12). During the course of a handful of SMFS experiments, it was apparent that a loop in the polymer chain caused a portion of the mechanophores to isomerize prior to the actual plateau that was fit in the force curve. A loop was evident by the appearance of a small plateau, followed by the polymer detaching, before the rest of the polymer was fully extended (Figure 13). Because of this loop, the initial and final contour lengths were corrected by subtracting the length of polymer at the apex of the loop detachment.
Comparison of Freely Jointed Chain Model (FJC) and Worm Like Chain Model
A sample of the force-extension curves obtained were fit using both the FJC model and the WLC model, and the resultant % polymer extensions were compared. The models predict similar extensions, and we use the FJC fits for further analysis because the fits are slightly better and because light scattering data suggest that the chains are random coils rather than rod-like.
Table S4. FJC and WLC fitting analysis model comparison
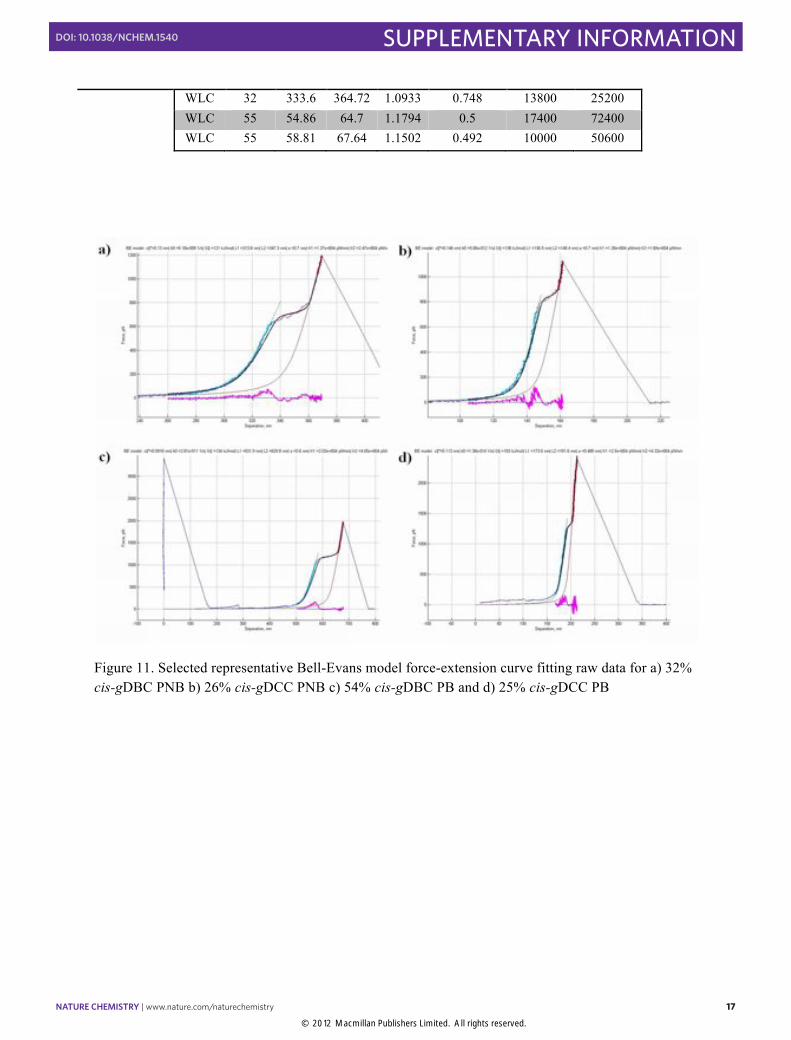
Figure 11. Selected representative Bell-Evans model force-extension curve fitting raw data for a) 32% cis-gDBC PNB b) 26% cis-gDCC PNB c) 54% cis-gDBC PB and d) 25% cis-gDCC PB
Figure 12. Selected representative Cusp model force-extension curve fitting raw data for a) 32% cis-gDBC PNB b) 26% cis-gDCC PNB c) 54% cis-gDBC PB and d) 25% cis-gDCC PB
#
#
Figure 13. Force-extension curve of 55% cis-gDBC PNB. An example of a force-extension curve depicting a loop in the polymer chain which the initial and final contour lengths were corrected for. The correction factor for this force-extension curve is 48 nm based on the apex of the loop extension.
a Force-free rate constant estimated based on the difference between ko295 of cis-gDBC PB and the ko295 of cis-gDCC PB.; ko295 = 4.043 x 10⁻⁹ s-1. b Corrected for loop.
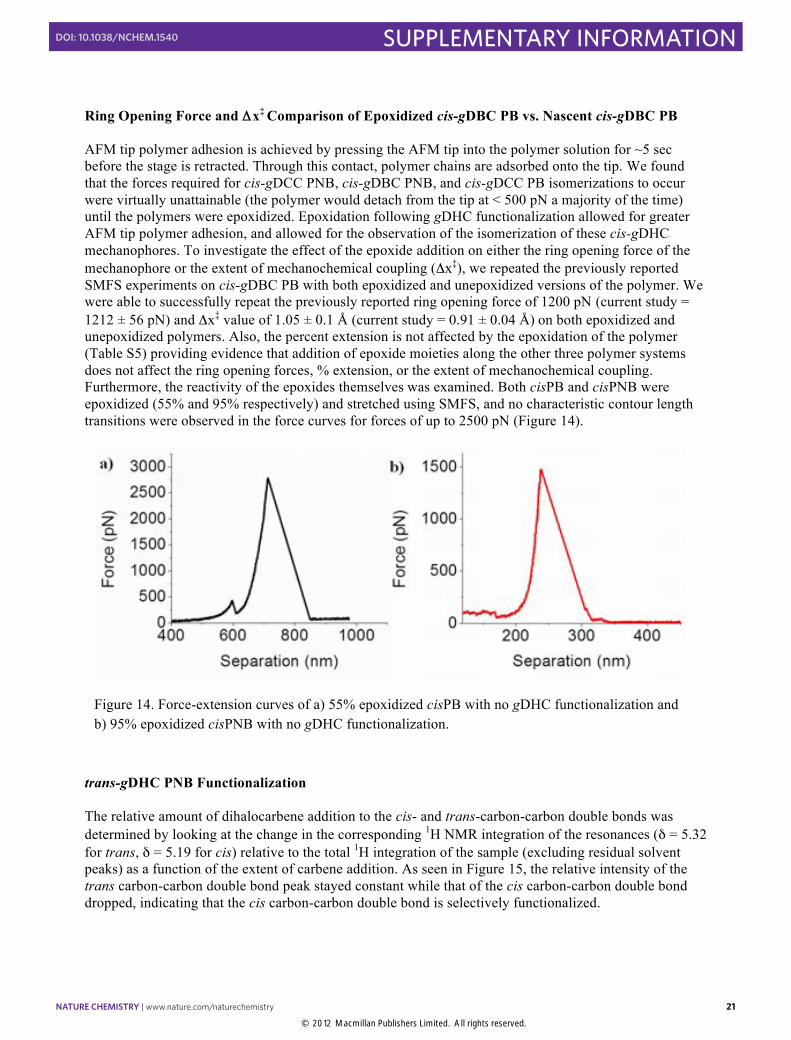
Ring Opening Force and !x‡ Comparison of Epoxidized cis-gDBC PB vs. Nascent cis-gDBC PB AFM tip polymer adhesion is achieved by pressing the AFM tip into the polymer solution for ~5 sec before the stage is retracted. Through this contact, polymer chains are adsorbed onto the tip. We found that the forces required for cis-gDCC PNB, cis-gDBC PNB, and cis-gDCC PB isomerizations to occur were virtually unattainable (the polymer would detach from the tip at < 500 pN a majority of the time) until the polymers were epoxidized. Epoxidation following gDHC functionalization allowed for greater AFM tip polymer adhesion, and allowed for the observation of the isomerization of these cis-gDHC mechanophores. To investigate the effect of the epoxide addition on either the ring opening force of the mechanophore or the extent of mechanochemical coupling (!x‡), we repeated the previously reported SMFS experiments on cis-gDBC PB with both epoxidized and unepoxidized versions of the polymer. We were able to successfully repeat the previously reported ring opening force of 1200 pN (current study = 1212 ± 56 pN) and !x‡ value of 1.05 ± 0.1 Å (current study = 0.91 ± 0.04 Å) on both epoxidized and unepoxidized polymers. Also, the percent extension is not affected by the epoxidation of the polymer (Table S5) providing evidence that addition of epoxide moieties along the other three polymer systems does not affect the ring opening forces, % extension, or the extent of mechanochemical coupling. Furthermore, the reactivity of the epoxides themselves was examined. Both cisPB and cisPNB were epoxidized (55% and 95% respectively) and stretched using SMFS, and no characteristic contour length transitions were observed in the force curves for forces of up to 2500 pN (Figure 14).
trans-gDHC PNB Functionalization The relative amount of dihalocarbene addition to the cis- and trans-carbon-carbon double bonds was determined by looking at the change in the corresponding 1H NMR integration of the resonances (" = 5.32 for trans, " = 5.19 for cis) relative to the total 1H integration of the sample (excluding residual solvent peaks) as a function of the extent of carbene addition. As seen in Figure 15, the relative intensity of the trans carbon-carbon double bond peak stayed constant while that of the cis carbon-carbon double bond dropped, indicating that the cis carbon-carbon double bond is selectively functionalized.
#
Figure 14. Force-extension curves of a) 55% epoxidized cisPB with no gDHC functionalization and b) 95% epoxidized cisPNB with no gDHC functionalization.
Modeling of the initial and final contour lengths for each of the four polymer systems studied were accomplished using Spartan® software. The equilibrium conformers of cisPNB, transPNB, cis-gDBC PNB, cis-gDCC PNB, ring opened cis-gDBC PNB, ring opened cis-gDCC PNB, cisPB, cis-gDBC PB, cis-gDCC PB, ring opened cis-gDBC PB, and ring opened cis-gDCC PB diads were minimized at the semiempirical AM1 level of theory. The two outer atoms of each diad were then constrained at fixed distances of increasing magnitude (0.2 nm) to simulate stretching, and the energy minimized structure was calculated at each constraining distance until the bonding geometries were noticeably distorted. CoGEF (constrained geometry simulates external force) plots of energy vs. displacement were then generated by contracting the constraint in 0.01 nm increments, and normalizing to an energy of 0 J for the equilibrium conformer.
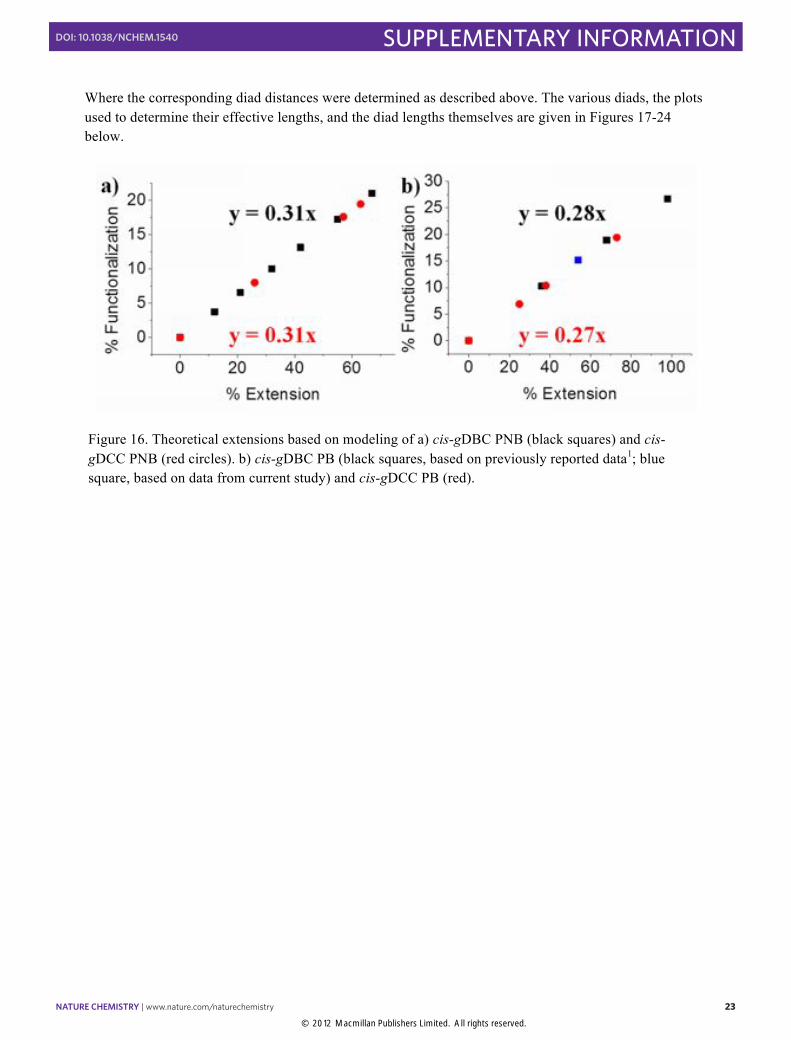
The energy vs. distance data were then fit to a quadratic function, and the derivative of that function was used to calculate a force vs. distance plot. Only the energy/distance data that fall within the range of forces obtained in the SMFS experiments (from 100 to 1900 pN) were used to determine the theoretical extensions. The length of each diad was calculated by extrapolating the force-distance curves to zero force (Figure 16), although no significant difference in calculated extensions was observed when different forces were used. Theoretical polymer contour lengths were calculated by a weighted average of the various diad lengths. For example, a 57% cis-gDCC PNB contains 57% cis-gDCC, 15% trans-PNB, and 28% cis-PNB, and so its contour length would be given by:
Figure 15. As the degree of gDHC PNB functionalization for cisPNB increases, the amount of cis olefins present decreases (black), but the amount of trans olefins remain relatively unchanged.
Where the corresponding diad distances were determined as described above. The various diads, the plots used to determine their effective lengths, and the diad lengths themselves are given in Figures 17-24 below.
#
#
Figure 16. Theoretical extensions based on modeling of a) cis-gDBC PNB (black squares) and cis-gDCC PNB (red circles). b) cis-gDBC PB (black squares, based on previously reported data1; blue square, based on data from current study) and cis-gDCC PB (red).
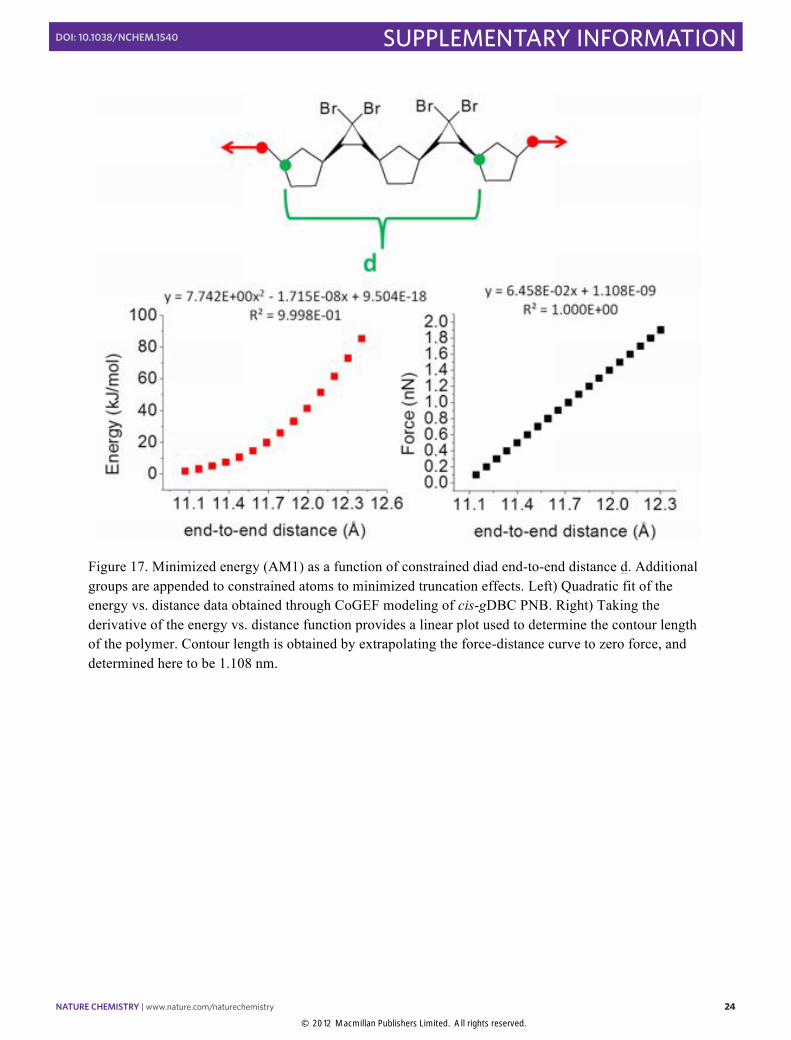
Figure 17. Minimized energy (AM1) as a function of constrained diad end-to-end distance d. Additional groups are appended to constrained atoms to minimized truncation effects. Left) Quadratic fit of the energy vs. distance data obtained through CoGEF modeling of cis-gDBC PNB. Right) Taking the derivative of the energy vs. distance function provides a linear plot used to determine the contour length of the polymer. Contour length is obtained by extrapolating the force-distance curve to zero force, and determined here to be 1.108 nm.
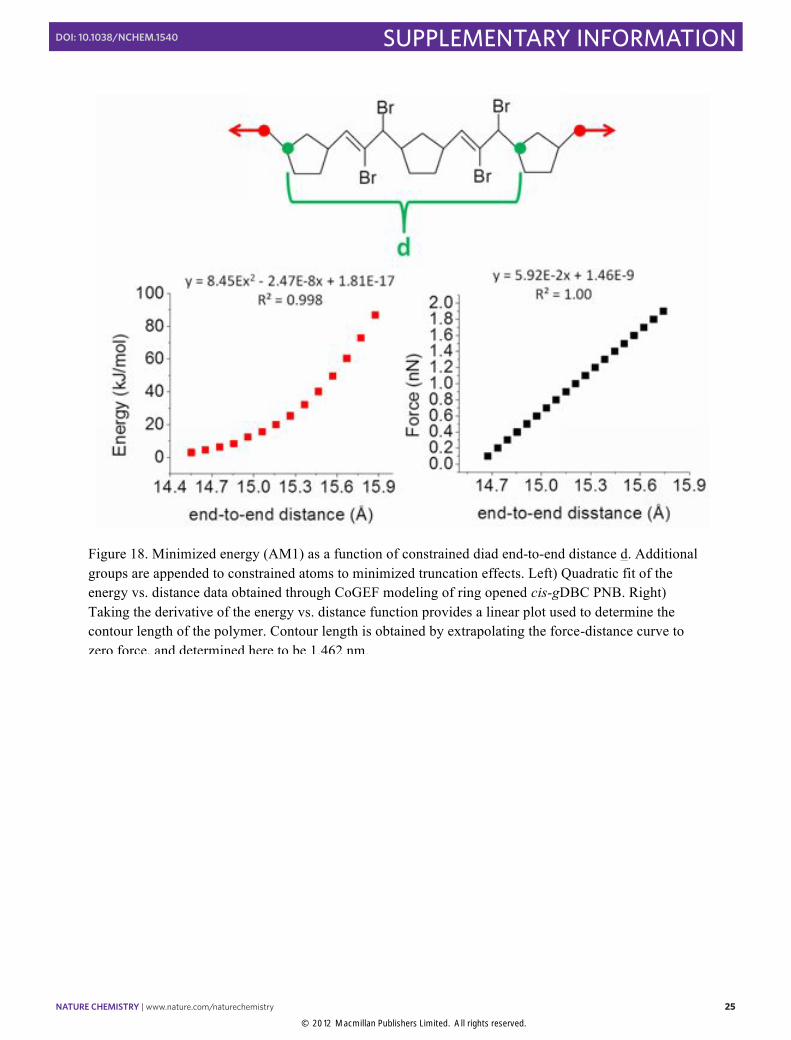
Figure 18. Minimized energy (AM1) as a function of constrained diad end-to-end distance d. Additional groups are appended to constrained atoms to minimized truncation effects. Left) Quadratic fit of the energy vs. distance data obtained through CoGEF modeling of ring opened cis-gDBC PNB. Right) Taking the derivative of the energy vs. distance function provides a linear plot used to determine the contour length of the polymer. Contour length is obtained by extrapolating the force-distance curve to zero force, and determined here to be 1.462 nm.
Figure 19. Minimized energy (AM1) as a function of constrained diad end-to-end distance d. Additional groups are appended to constrained atoms to minimized truncation effects. Left) Quadratic fit of the energy vs. distance data obtained through CoGEF modeling of cis-gDCC PNB. Right) Taking the derivative of the energy vs. distance function provides a linear plot used to determine the contour length of the polymer. Contour length is obtained by extrapolating the force-distance curve to zero force, and determined here to be 1.111 nm.
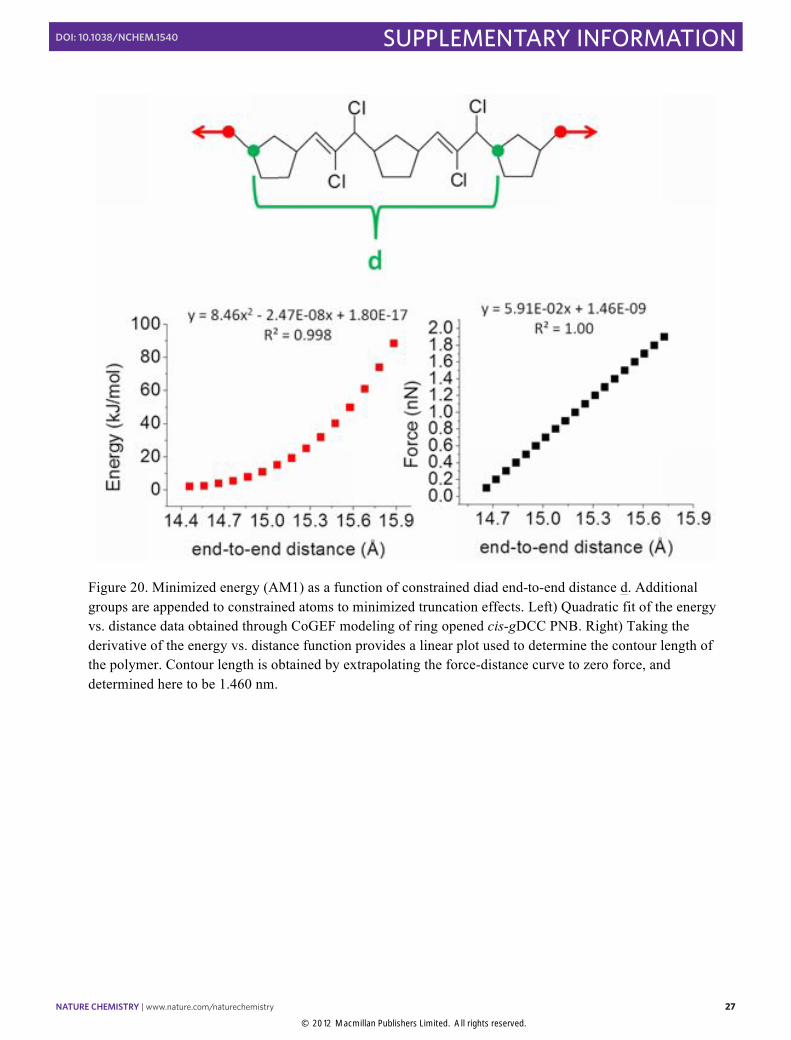
Figure 20. Minimized energy (AM1) as a function of constrained diad end-to-end distance d. Additional groups are appended to constrained atoms to minimized truncation effects. Left) Quadratic fit of the energy vs. distance data obtained through CoGEF modeling of ring opened cis-gDCC PNB. Right) Taking the derivative of the energy vs. distance function provides a linear plot used to determine the contour length of the polymer. Contour length is obtained by extrapolating the force-distance curve to zero force, and determined here to be 1.460 nm.
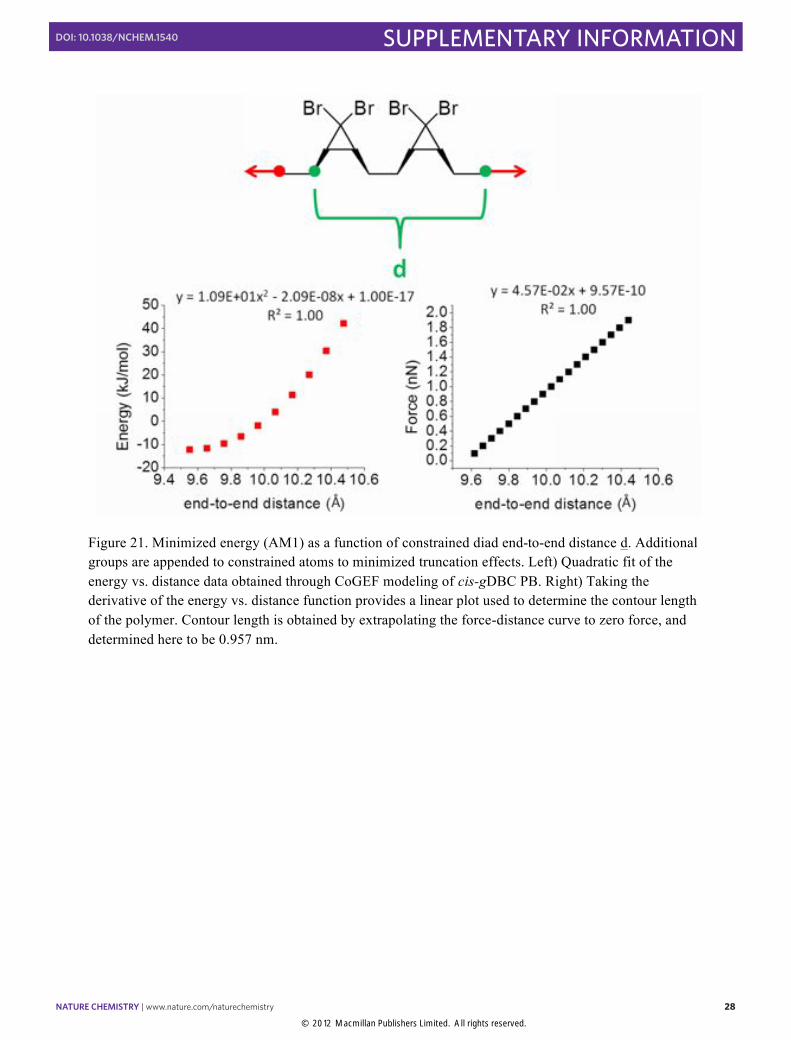
Figure 21. Minimized energy (AM1) as a function of constrained diad end-to-end distance d. Additional groups are appended to constrained atoms to minimized truncation effects. Left) Quadratic fit of the energy vs. distance data obtained through CoGEF modeling of cis-gDBC PB. Right) Taking the derivative of the energy vs. distance function provides a linear plot used to determine the contour length of the polymer. Contour length is obtained by extrapolating the force-distance curve to zero force, and determined here to be 0.957 nm.
Figure 22. Minimized energy (AM1) as a function of constrained diad end-to-end distance d. Additional groups are appended to constrained atoms to minimized truncation effects. Left) Quadratic fit of the energy vs. distance data obtained through CoGEF modeling of ring opened cis-gDCC PB. Right) Taking the derivative of the energy vs. distance function provides a linear plot used to determine the contour length of the polymer. Contour length is obtained by extrapolating the force-distance curve to zero force, and determined here to be 1.217 nm.
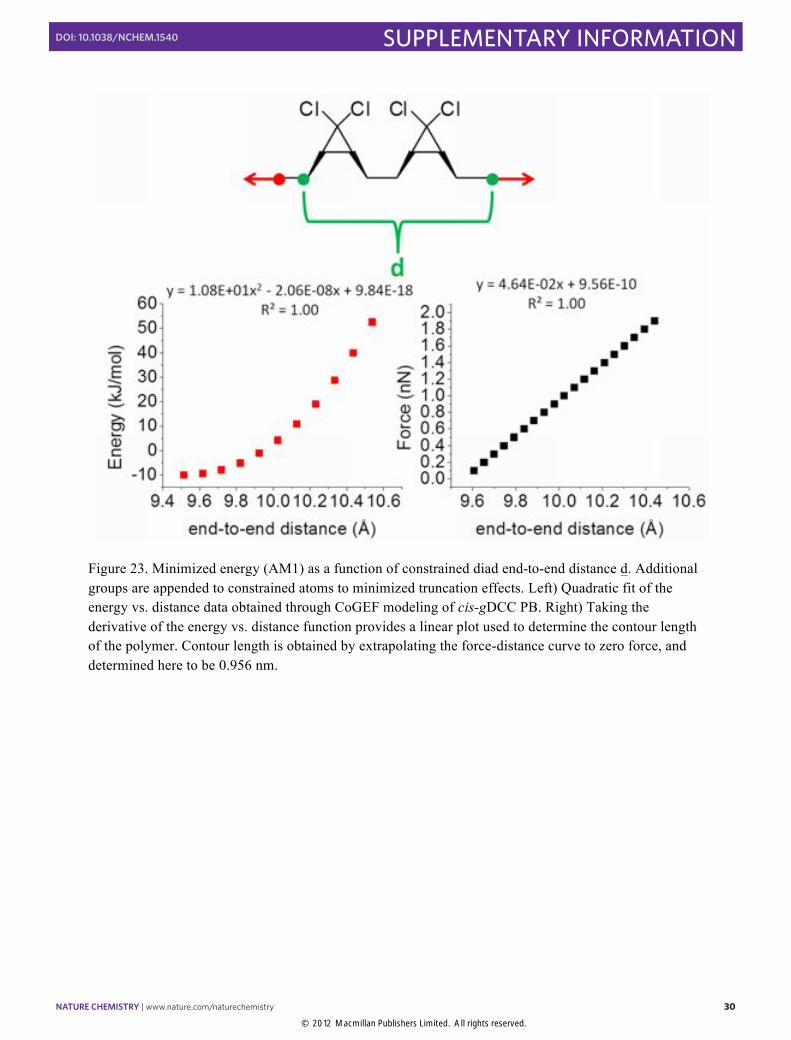
Figure 23. Minimized energy (AM1) as a function of constrained diad end-to-end distance d. Additional groups are appended to constrained atoms to minimized truncation effects. Left) Quadratic fit of the energy vs. distance data obtained through CoGEF modeling of cis-gDCC PB. Right) Taking the derivative of the energy vs. distance function provides a linear plot used to determine the contour length of the polymer. Contour length is obtained by extrapolating the force-distance curve to zero force, and determined here to be 0.956 nm.
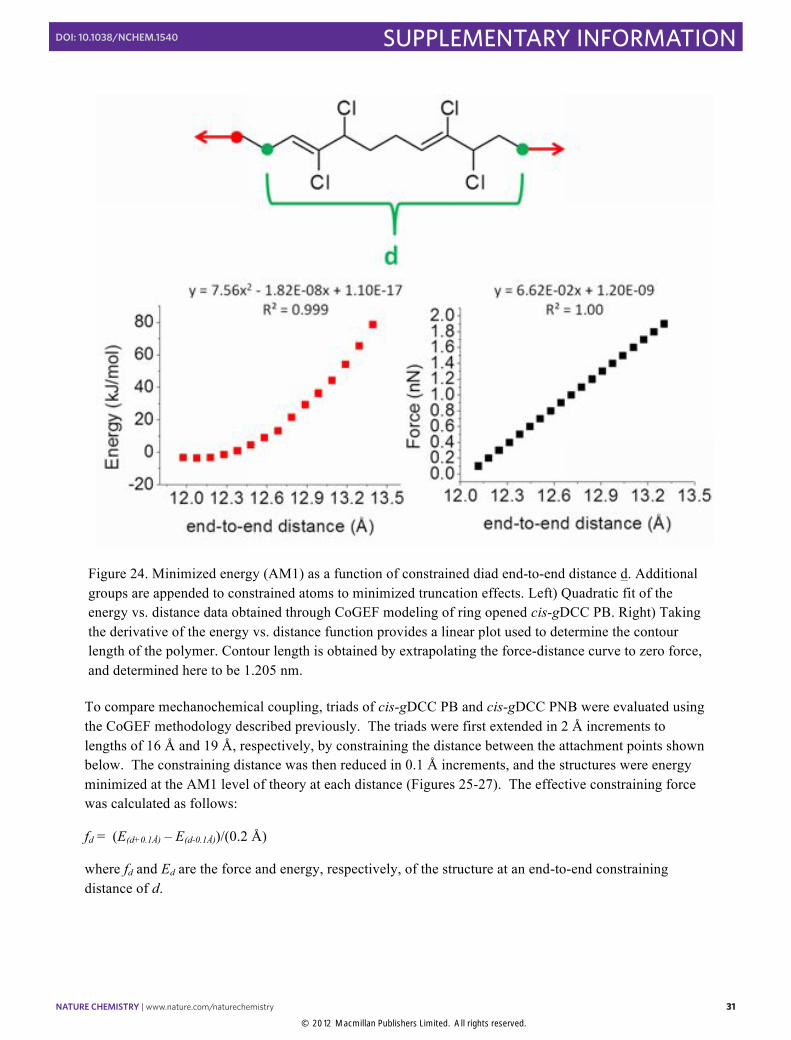
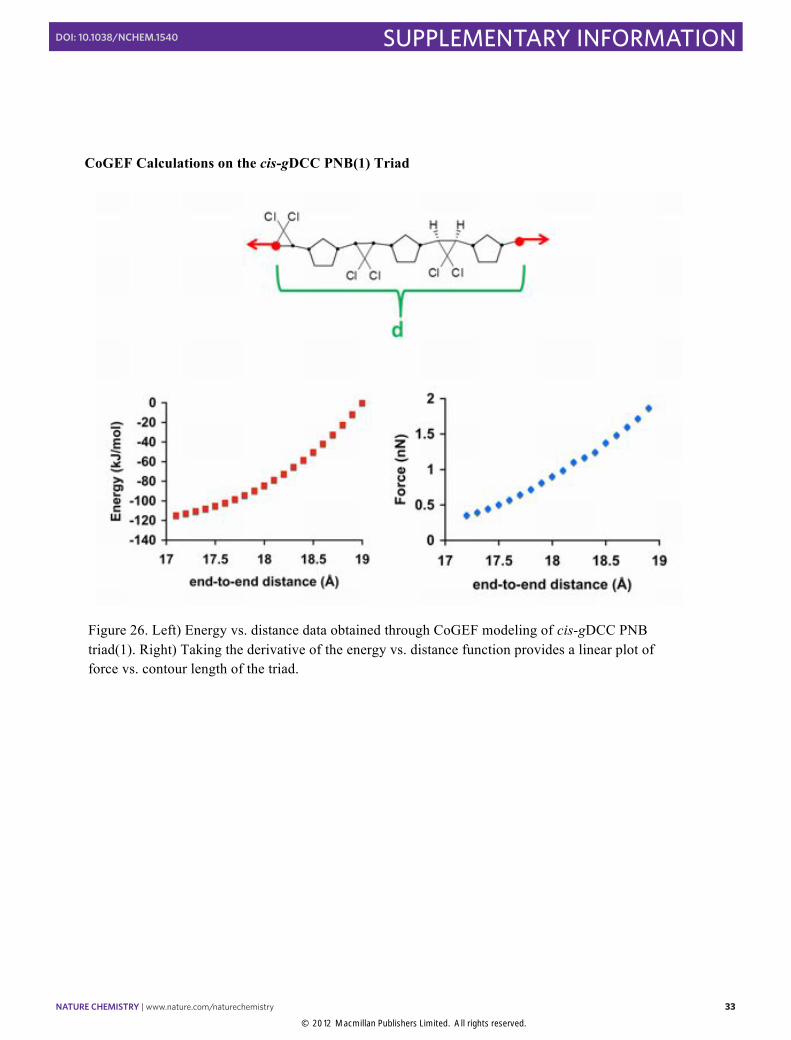
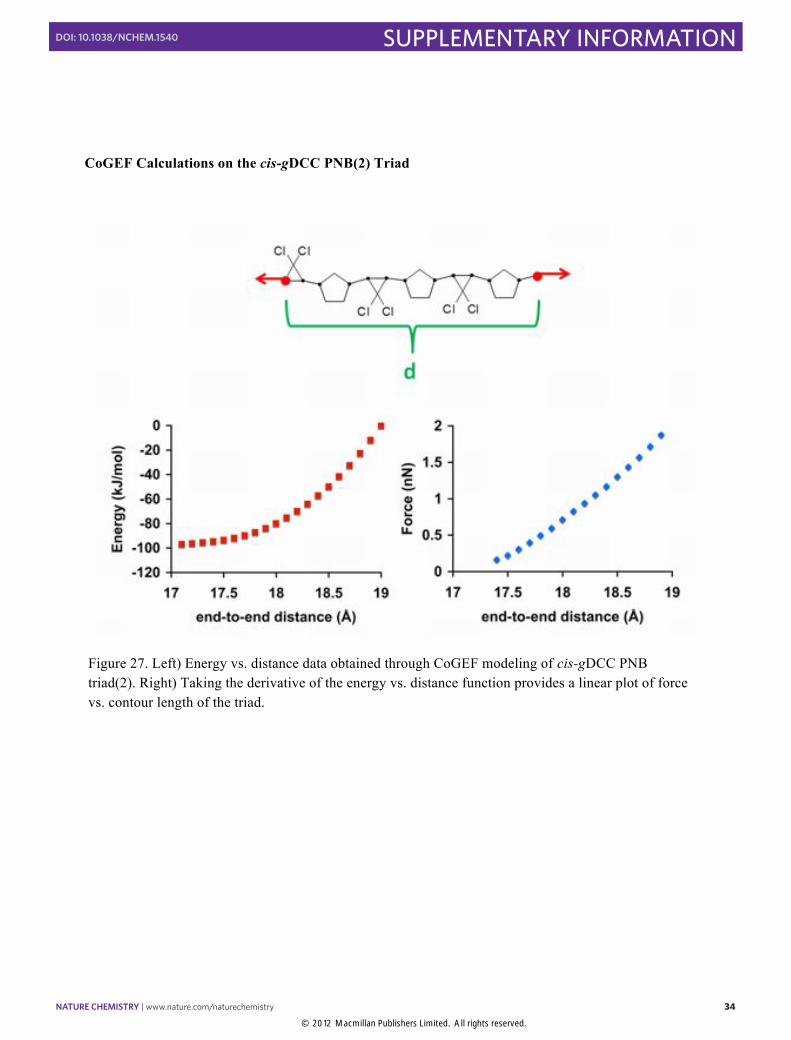
To compare mechanochemical coupling, triads of cis-gDCC PB and cis-gDCC PNB were evaluated using the CoGEF methodology described previously. The triads were first extended in 2 Å increments to lengths of 16 Å and 19 Å, respectively, by constraining the distance between the attachment points shown below. The constraining distance was then reduced in 0.1 Å increments, and the structures were energy minimized at the AM1 level of theory at each distance (Figures 25-27). The effective constraining force was calculated as follows:
fd = (E(d+0.1Å) – E(d-0.1Å))/(0.2 Å)
where fd and Ed are the force and energy, respectively, of the structure at an end-to-end constraining distance of d.
#
#
Figure 24. Minimized energy (AM1) as a function of constrained diad end-to-end distance d. Additional groups are appended to constrained atoms to minimized truncation effects. Left) Quadratic fit of the energy vs. distance data obtained through CoGEF modeling of ring opened cis-gDCC PB. Right) Taking the derivative of the energy vs. distance function provides a linear plot used to determine the contour length of the polymer. Contour length is obtained by extrapolating the force-distance curve to zero force, and determined here to be 1.205 nm.
Figure 25. Left) Energy vs. distance data obtained through CoGEF modeling of cis-gDCC PB triad. Right) Taking the derivative of the energy vs. distance function provides a linear plot of force vs. contour length of the triad.
Figure 26. Left) Energy vs. distance data obtained through CoGEF modeling of cis-gDCC PNB triad(1). Right) Taking the derivative of the energy vs. distance function provides a linear plot of force vs. contour length of the triad.
Figure 27. Left) Energy vs. distance data obtained through CoGEF modeling of cis-gDCC PNB triad(2). Right) Taking the derivative of the energy vs. distance function provides a linear plot of force vs. contour length of the triad.
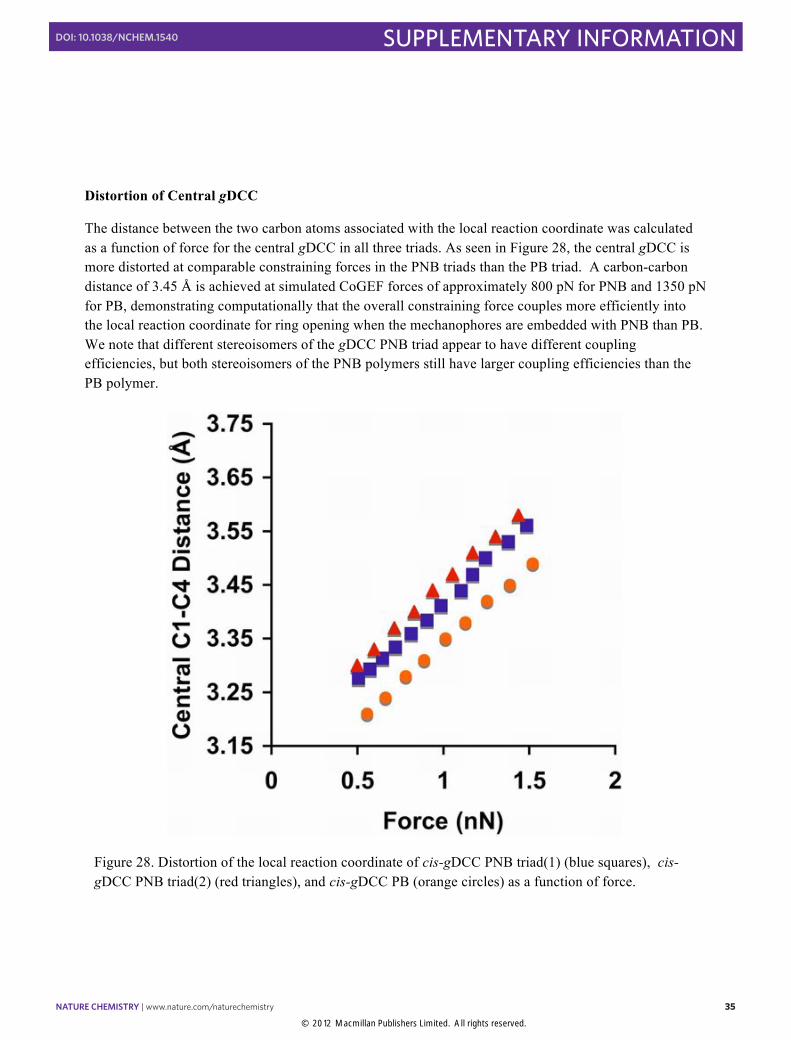
The distance between the two carbon atoms associated with the local reaction coordinate was calculated as a function of force for the central gDCC in all three triads. As seen in Figure 28, the central gDCC is more distorted at comparable constraining forces in the PNB triads than the PB triad. A carbon-carbon distance of 3.45 Å is achieved at simulated CoGEF forces of approximately 800 pN for PNB and 1350 pN for PB, demonstrating computationally that the overall constraining force couples more efficiently into the local reaction coordinate for ring opening when the mechanophores are embedded with PNB than PB. We note that different stereoisomers of the gDCC PNB triad appear to have different coupling efficiencies, but both stereoisomers of the PNB polymers still have larger coupling efficiencies than the PB polymer.
#
Figure 28. Distortion of the local reaction coordinate of cis-gDCC PNB triad(1) (blue squares), cis-gDCC PNB triad(2) (red triangles), and cis-gDCC PB (orange circles) as a function of force.
1. Lenhardt, J. M.; Black, A. L.; Craig, S. L. J. Am. Chem. Soc. 2009, 131, 10818-10819 2. Lenhardt, J. M.; Ong, M. T.; Choe, R.; Evenhuis, C. R.; Martinez, T. J.; Craig, S. L. Science 2010, 329, 1057-1060. 3. Oberhauser, A. F.; Marszalek, P. E.; Erickson, H. P.; Fernandez, J. M. Nature 1998, 393, 181-185. 4. Florin, E. L.; Rief, M.; Lehmann, H.; Ludwig, M.; Dornmair, C.; Moy, V. T.; Gaub, H. E. Biosens. Bioelectron. 1995, 10, 895-901. 5. Hamilton, J. G.; Ivin, K. J.; McCann, G. M.; Rooney, J. J. Makromol. Chem. 1985, 186, 1477-1494. 6. Lenhardt, J. M.; Black, A. L.; Beiermann, B. A.; Steinberg, B.; Rahman, F.; Samborski, T.; Elsakr, J.; Moore, J. S.; Sottos, N. R.; Craig, S. L. J. Mater. Chem. 2011, 21, 8454-8459. 7. Duffey, D. C.; Minyard, J. P.; Lane, R. H. J. Org. Chem. 1966, 31, 3865-3867. 8. Akbulatov, S.; Tian, Y.; Boulatov, R. J. Am. Chem. Soc. 2012, 134, 7620-7623.