Concerning the crystallisation of layered manganese thioantimonates, Engelke et al.
showed that two crystallisation mechanisms occur during the synthesis of Mn2Sb2S5 • DAP
(DAP=1,3-diaminopropane). With increasing temperature the mechanism changes from a
phase-boundary-controlled reaction (Avrami exponent nAE ≈ 1 for α < 0.75 at 130 °C) to a
diffusion-controlled reaction (Avrami exponent nAE ≈ 0.5 for α > 0.75 at 130 °C).
Furthermore, the presence of two crystalline intermediates could be detected at lower
temperatures. These are transformed to the final product after a short period of time in a
temperature range of 105-130 °C. Ahnfeldt et al.[9] investigated the kinetics of Al-MOFs like
CAU-1 and CAU-1-(OH)2 using conventional and microwave heating. In general, the
reaction and induction times are shortened when the temperature is increased.[14] Apart
from the fact that the microwave heating resulted in increased synthesis rates and thus in
smaller particles, the kinetic evaluation according to Avrami-Erofeev and Sharp-Hancock
revealed different crystallisation mechanisms comparing the microwave heating with
conventional heating. Whereas the microwave-heated reaction shows a diffusion-controlled
mechanism (Avrami exponent nAE ≈ 0.6-0.8), the conventional heating rather led to a
3
phase-boundary-controlled reaction (Avrami exponent nAE ≈ 1.0-1.1). The activation energy
was calculated to 131-136 kJ irrespective of the heat source.[9]
A classical nucleation-growth kinetic was also found by Millange et al. in a time-
resolved in situ diffraction study of HKUST-1.[11] In the quite fast formation of HKUST-1, no
induction time is detectable and the Avrami-Erofeev and Sharp-Hancock evaluation
revealed that the reaction is controlled by the formation of new nucleation sites (Avrami
exponent nAE ≈ 1.5). They further revealed that the crystallisation of MIL-53(Fe) occurs via a
metastable intermediate, the lifetime of which can be prolonged by decreasing the reaction
temperature.
Another MOF of the MIL family, Mn-MIL-100, does not show any intermediate
formation. Instead, the kinetic results indicate a two-stage reaction process with two
different reaction mechanisms. At the beginning of the reaction, the crystallisation is
nucleation-controlled with the Avrami exponent nAE ≈ 2 but changes to nAE ≈ 1 as the
reaction proceeds.[12] Recently, Ragon et al. investigated the crystallisation behaviour of the
Zr-MOF UiO-66 and found out that the addition of both water and hydrochloric acid leads to
faster crystallisation rates.[13] Since they discovered that only the presence of water seems
to be the cause for this acceleration, these results are in good agreement with this work and
our previous observations.[15]
Although the traditional Avrami-Erofeev-based mode of evaluation is well-
established, the procedure proposed by Gualtieri in 2001 is becoming more and more
popular. Millange et al. used this evaluation and pointed out that the Avrami-Erofeev
method shows severe limitation since it had been developed for a specific solid-solid
reaction. They emphasise that the fitting parameters are not applicable for heterogeneous
crystallisation of a solid from a liquid. For that reason, the Gualtieri evaluation was applied
for the investigation of the crystallisation of MOF-14. It was discovered that this reaction is
nucleation rate-determined, because the calculated values for kN were in all cases smaller
than kG.[16]
A combined evaluation using Avrami-Erofeev and Sharp-Hancock as well as the
Gualtieri model was applied by Cravillon et al.[10] In this work the formate-modulated
synthesis of ZIF-8 was investigated by using time-resolved in situ X-ray diffraction. On the
one hand, the results of the Avrami-Erofeev and Sharp-Hancock evaluation revealed that
the modulated synthesis of ZIF-8 is rate-limited by a phase-boundary reaction (Avrami
exponent nAE ≈ 1.0-1.3). On the other hand, by applying the Gualtieri evaluation, kN was in
all cases smaller than kG, so that the calculations resulted in a nucleation-controlled
4
reaction rate. This work illustrates the divergence of the different models and demands a
sensitive judgement concerning the evaluation of kinetic data on the formation of a solid.
Given the uncertainties in the interpretation of kinetic data obtained with the Avrami-
based evaluation, especially with regard to the meaning of different Avrami exponents
nAE[17] and to the fact that this equation was originally compiled for the description of a solid-
solid crystallisation,[1,2,3] we preferred to present our results as obtained by the evaluation
using the Gualtieri equation.[18] The fact that this equation contains two different terms for
nucleation and crystal growth fits well to the investigated reactions. In fact, it allows us in
some cases to obtain a deeper interpretation of the kinetic data, for example when it is
found that the activation energies for nucleation and growth are very similar, indicating that
the same basic process is concerned in the corresponding rate-determining steps.
In contrast, the evaluation methods according to Avrami-Erofeev as well as to Sharp
and Hancock (effectively a linearization of the Avrami-Erofeev equation) do not contain
separate terms for the nucleation and growth. However, in order to be able to compare our
kinetic investigations to studies of MOF formation reactions where the data were evaluated
by applying the Avrami-Erofeev and Sharp-Hancock equations, we here present the results
of the analysis of our data when these formalisms are used.
5
S1.1 Variation of the modulator concentration in the water-based synthesis
Figure S1. Extent of crystallisation α plotted against time t (blue circles) and the corresponding Gualtieri fitting (blue curve) as well as the probability for nucleation PN (red curve) for varied amounts of modulator in water. The reactions studied here were carried out at 43 °C with molar ratios ZrCl4/H2fum/formic acid/H2O of 1:3:x:1074.
6
Figure S2. Extent of crystallisation α plotted against time t (blue circles) and the corresponding Avrami-Erofeev fitting (blue curve) for varied amounts of modulator in water. The reactions studied here were carried out at 43 °C with molar ratios ZrCl4/H2fum/formic acid/H2O of 1:3:x:1074.
Figure S3. Sharp-Hancock plots for varied amounts of modulator in water. The reactions studied here were carried out at 43 °C with molar ratios ZrCl4/H2fum/formic acid/H2O of 1:3:x:1074.
7
Table S1. Kinetic parameters obtained by fitting of the crystallisation curves with the Avrami-Erofeev and Sharp-Hancock equation. Crystallisation curves were measured for syntheses of Zr-fum MOF in water-based systems under variation of the concentration (x equivalents) of the modulator formic acid (ZrCl4/H2fum/formic acid/water 1:3:x:1074, 43 °C).
x nAE kAE / min1 nSH kSH / min1
70 3.3(4) 0.067(1) 0.79(5) 0.242(1)
100 4.4(2) 0.031(1) 1.40(5) 0.088(1)
150 3.9(1) 0.007(1) 1.45(1) 0.017(1)
S1.2 Variation of the temperature in the DMF-based synthesis
Figure S4. Extent of crystallisation α plotted against time t (blue circles) and the corresponding Gualtieri fitting (blue curve) as well as the probability for nucleation PN (red curve) for varied temperatures. The reactions studied here were carried out in DMF with molar ratios ZrCl4/H2fum/formic acid/DMF of 1:3:70:500.
8
Figure S5. Extent of crystallisation α plotted against time t (blue circles) and the corresponding Avrami-Erofeev fitting (blue curve) for varied temperatures. The reactions studied here were carried out in DMF with molar ratios ZrCl4/H2fum/formic acid/DMF of 1:3:70:500.
Figure S6. Sharp-Hancock plots for varied temperatures. The reactions studied here were carried out in DMF with molar ratios ZrCl4/H2fum/formic acid/DMF of 1:3:70:500.
9
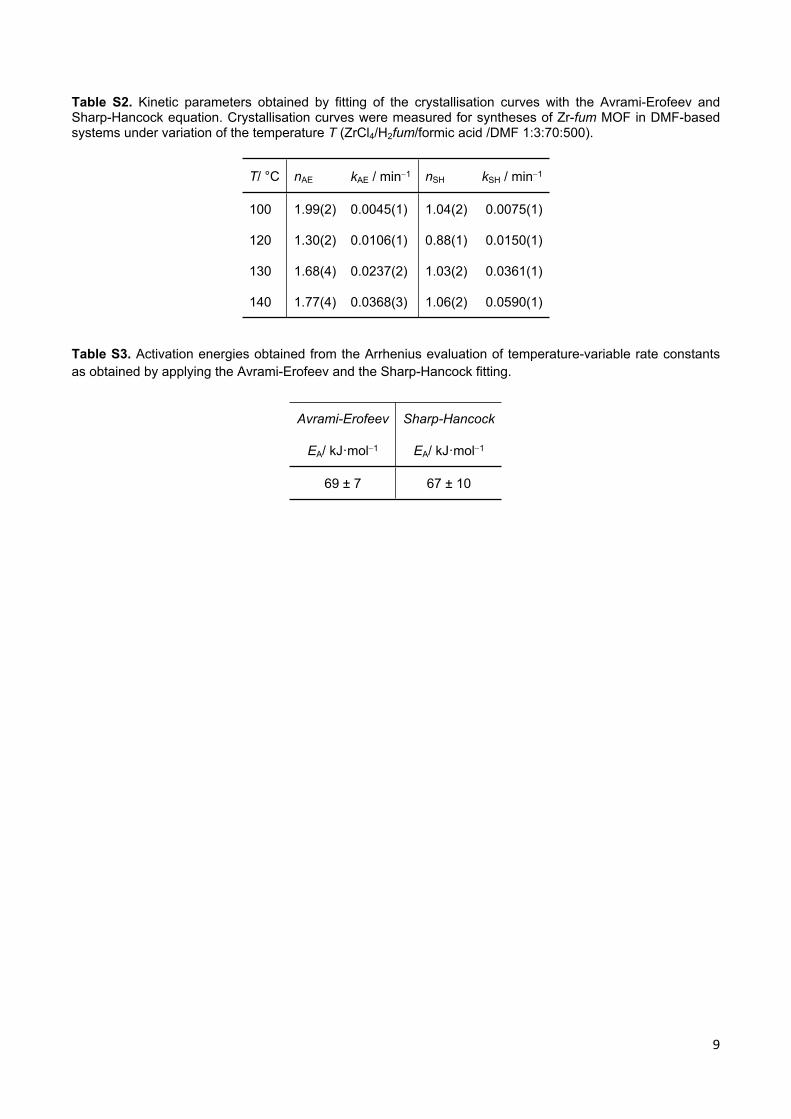
Table S2. Kinetic parameters obtained by fitting of the crystallisation curves with the Avrami-Erofeev and Sharp-Hancock equation. Crystallisation curves were measured for syntheses of Zr-fum MOF in DMF-based systems under variation of the temperature T (ZrCl4/H2fum/formic acid /DMF 1:3:70:500).
T/ °C nAE kAE / min1 nSH kSH / min1
100 1.99(2) 0.0045(1) 1.04(2) 0.0075(1)
120 1.30(2) 0.0106(1) 0.88(1) 0.0150(1)
130 1.68(4) 0.0237(2) 1.03(2) 0.0361(1)
140 1.77(4) 0.0368(3) 1.06(2) 0.0590(1)
Table S3. Activation energies obtained from the Arrhenius evaluation of temperature-variable rate constants as obtained by applying the Avrami-Erofeev and the Sharp-Hancock fitting.
Avrami-Erofeev Sharp-Hancock
EA/ kJ·mol1 EA/ kJ·mol1
69 ± 7 67 ± 10
10
S1.3 Variation of the amount of modulator in the DMF-based synthesis
Figure S7. Extent of crystallisation α plotted against time t (blue circles) and the corresponding Gualtieri fitting (blue curve) as well as the probability for nucleation PN (red curve) for varied amounts of modulator in DMF. The reactions studied here were carried out at 120 °C with molar ratios ZrCl4/H2fum/formic acid/DMF of 1:3:x:500.
11
Figure S8. Extent of crystallisation α plotted against time t (blue circles) and the corresponding Avrami-Erofeev fitting (blue curve) for varied amounts of modulator in DMF. The reactions studied here were carried out at 120 °C with molar ratios ZrCl4/H2fum/formic acid/DMF of 1:3:x:500.
Figure S9. Sharp-Hancock plots for varied amounts of modulator in DMF. The reactions studied here were carried out at 120 °C with molar ratios ZrCl4/H2fum/formic acid/DMF of 1:3:x:500.
12
Table S4. Kinetic parameters obtained by fitting of the crystallisation curves with the Avrami-Erofeev and Sharp-Hancock equation. Crystallisation curves were measured for syntheses of Zr-fum MOF in DMF-based systems under variation of the concentration (x equivalents) of the modulator formic acid (ZrCl4/H2fum/formic acid /DMF 1:3:x:500, 120 °C).
x nAE kAE / min1 nSH kSH / min1
70 1.30(2) 0.0106(1) 0.88(1) 0.0150(1)
100 1.57(4) 0.0161(2) 0.90(2) 0.0259(1)
130 1.90(8) 0.0215(3) 0.93(3) 0.0407(1)
S1.4 Variation of the water content in the DMF-based synthesis
Figure S10. Extent of crystallisation α plotted against time t (blue circles) and the corresponding Gualtieri fitting (blue curve) as well as the probability for nucleation PN (red curve) for varied amounts of water in DMF. The reactions studied here were carried out at 100 °C with molar ratios ZrCl4/H2fum/formic acid/water/DMF of 1:3:70:x:500.
13
Figure S11. Extent of crystallisation α plotted against time t (blue circles) and the corresponding Avrami-Erofeev fitting (blue curve) for varied amounts of water in DMF. The reactions studied here were carried out at 100 °C with molar ratios ZrCl4/H2fum/formic acid/water/DMF of 1:3:70:x:500.
Figure S12. Sharp-Hancock plots for varied amounts of water in DMF. The reactions studied here were carried out at 100 °C with molar ratios ZrCl4/H2fum/formic acid/water/DMF of 1:3:70:x:500.
14
Table S5. Kinetic parameters obtained by fitting of the crystallisation curves with the Avrami-Erofeev and Sharp-Hancock equation. Crystallisation curves were measured for syntheses of Zr-fum MOF in DMF-based systems under variation of the concentration (x equivalents) of water (ZrCl4/H2fum/formic acid/water/DMF 1:3:70:x:500, 100 °C).
x nAE kAE / min1 nSH kSH / min1
0 2.02(2) 0.0036(1) 1.09(1) 0.0060(1)
5 1.57(2) 0.0063(1) 1.01(1) 0.0089(1)
30 1.44(5) 0.0380(6) 0.84(2) 0.0541(1)
70 1.2(1) 0.145(5) 0.68(4) 0.2893(1)
S2 Powder X-ray diffraction (PXRD) patterns
Powder X-ray diffraction (PXRD) patterns were measured on the products after the
reactions using a Stoe StadiP diffractometer working in transmission mode and operated
with Ge(111)-monochromatized CuK1 radiation ( = 1.54060 Å). An exemplary PXRD
pattern of a Zr-fum MOF sample that was collected after the reaction is shown in Figure
S13.
Figure S13. Simulated PXRD pattern for the Zr-fum MOF15 (top) and PXRD pattern of a Zr-fum MOF sample after the reaction during which its formation was studied (bottom, molar ratios ZrCl4/H2fum/formic acid/H2O of 1:3:150:1074 at 43 °C).
15
Literature1 M. Avrami, J. Chem. Phys., 1939, 7, 1103.
2 M. Avrami, J. Chem. Phys., 1940, 8, 212.
3 M. Avrami, J. Chem. Phys., 1941, 9, 177.
4 The original Avrami-Erofeev equation was formulated as , i.e. (𝑡) = 1 ‒ 𝑒 ‒ 𝑘 ∙ 𝑡𝑛
without brackets around the term –k·t. However, in today´s application, the
form given as in equation S1 is preferred. Therefore, for better comparison,
this form of the equation is also used here. The original formulation was given
by Erofeev (B. V. Erofeev, Dokl. Akad. Nauk SSSR, 1946, 52, 511, cited after
ref. 17, supporting information). In addition, Khanna and Taylor found that only
the modified equation provides meaningful data on reaction rates and
activation energies (Y. P. Khanna and T. J. Taylor, Polym. Eng. Sci., 1988, 28,
1042).
5 J. D. Hancock and J.H. Sharp, J. Am. Ceram. Soc., 1972, 55, 74.
6 Ø. B. Vistad, D. E. Akporiaye and K. P. Lillerud, J. Phys. Chem. B, 2001, 105,
12437.
7 R. I. Walton, T. Loiseau, D. O’Hare and G. Férey, Chem. Mater., 1999, 11,
3201.
8 L. Engelke, M. Schaefer, M. Schnur and W. Bensch, Chem. Mater., 2001, 13,
1383.
9 T. Ahnfeldt, J. Moellmer,V. Guillerm, R. Staudt, C. Serre and N. Stock, Chem.
Eur. J., 2011, 17, 6462.
10 J. Cravillon, C. A. Schröder, H. Bux, A. Rothkirch, J. Caro and M. Wiebcke,
CrystEngComm, 2012, 14, 492.
11 F. Millange, M. I. Medina, N. Guillou, G. Férey, K. M. Golden, R. I. Walton and
Angew. Chem. Int. Ed., 2010, 49, 763.
12 H. Reinsch and N. Stock, CrystEngComm, 2013, 15, 544.
13 F. Ragon, P. Horcajada, H. Chevreau, Y. K. Hwang, U. Lee, S. R. Miller, T.
Devic, J. Chang and C. Serre, Inorg. Chem., 2014, 53, 2491.
14 P. Norby and J. C. Hanson, Catal. Today, 1998, 39, 301.
15 G. Wißmann, A. Schaate, S. Lilienthal, I. Bremer, A. M. Schneider and P.